
Evaluation of Roasting Effect on Selected Green Tea Volatile Flavor Compound and Pyrazine Content by HS-SPME GC-MS


1
Department of Pharmacy and Biotechnology, University of Bologna, Via Belmeloro 6, 40126 Bologna, Italy
2
Department of Chemistry “G. Ciamician”, University of Bologna, Via Selmi 2, 40126 Bologna, Italy
*
Author to whom correspondence should be addressed.
Appl. Sci. 2021, 11(17), 8217; https://0-doi-org.brum.beds.ac.uk/10.3390/app11178217
Submission received: 11 August 2021
/
Revised: 30 August 2021
/
Accepted: 1 September 2021
/
Published: 4 September 2021
(This article belongs to the Special Issue Integrative Approaches for Food Sensory and Flavor Analysis)
Abstract
:Featured Application
The characterization of the variation of the volatile flavour compound (VCF) absolute content can be an important contribution in the evaluation of roasted green tea quality, named Hojicha tea, especially with respect to the roasting conditions such as temperature and time. This is a very important aspect in the Hojicha tea trade, to obtain the typical “roasted” aroma and, at the same time, to maintain the widely reported beneficial properties of green tea.
Abstract
The present study aims at the development and validation of a quali-quantitative headspace solid-phase microextraction gas chromatography–mass spectrometry (HS-SPME GC-MS) method for the analysis of odorants in different Chinese and Japanese green teas. A 65 µm PDMS/DVB fiber was used, and GC-MS was performed on a ZB-5 (30 m × 0.25 mm ID, 0.25 μm film) column. The main odorants in green tea samples were identified and the method was fully validated. Linearity (r2 0.981–0.999), sensitivity (LOQ 0.005–0.04 µg/mL), reproducibility (CV% 3.12–10.37), accuracy (recovery% 79.08–99.17) and matrix effect (ME% −9.5 to +4.5) were determined. Quantitation of 2,4-heptadienal, β-damascenone, β-ionone, linalool, indole, 2-ethyl-6-methyl-pyrazine, 2-ethyl-5-methyl-pyrazine, 2-ethyl-3,6-dimethylpirazine, 2-ethyl-3,5-dimethyl-pyrazine and 2-acetyl-pyrazine was carried out in the presence of isotopically labeled compounds as the internal standards. The proposed method was applied to the comparison of the profile of the volatile flavor compounds (VFCs) of green tea subjected to roasting treatment at three different temperatures (160, 180 and 200 °C for 30 min). In particular, the roasting process was monitored by following the quantitative variations of the selected odorant content, considered as the most important contributory components to the Hojicha or black tea (roasted tea) flavor. A temperature of 160 °C was found to be the best roasting temperature.
Keywords:
green tea; hojicha tea; volatile flavor compounds; pyrazines; HS-SPME; GC-MS; roasting process1. Introduction
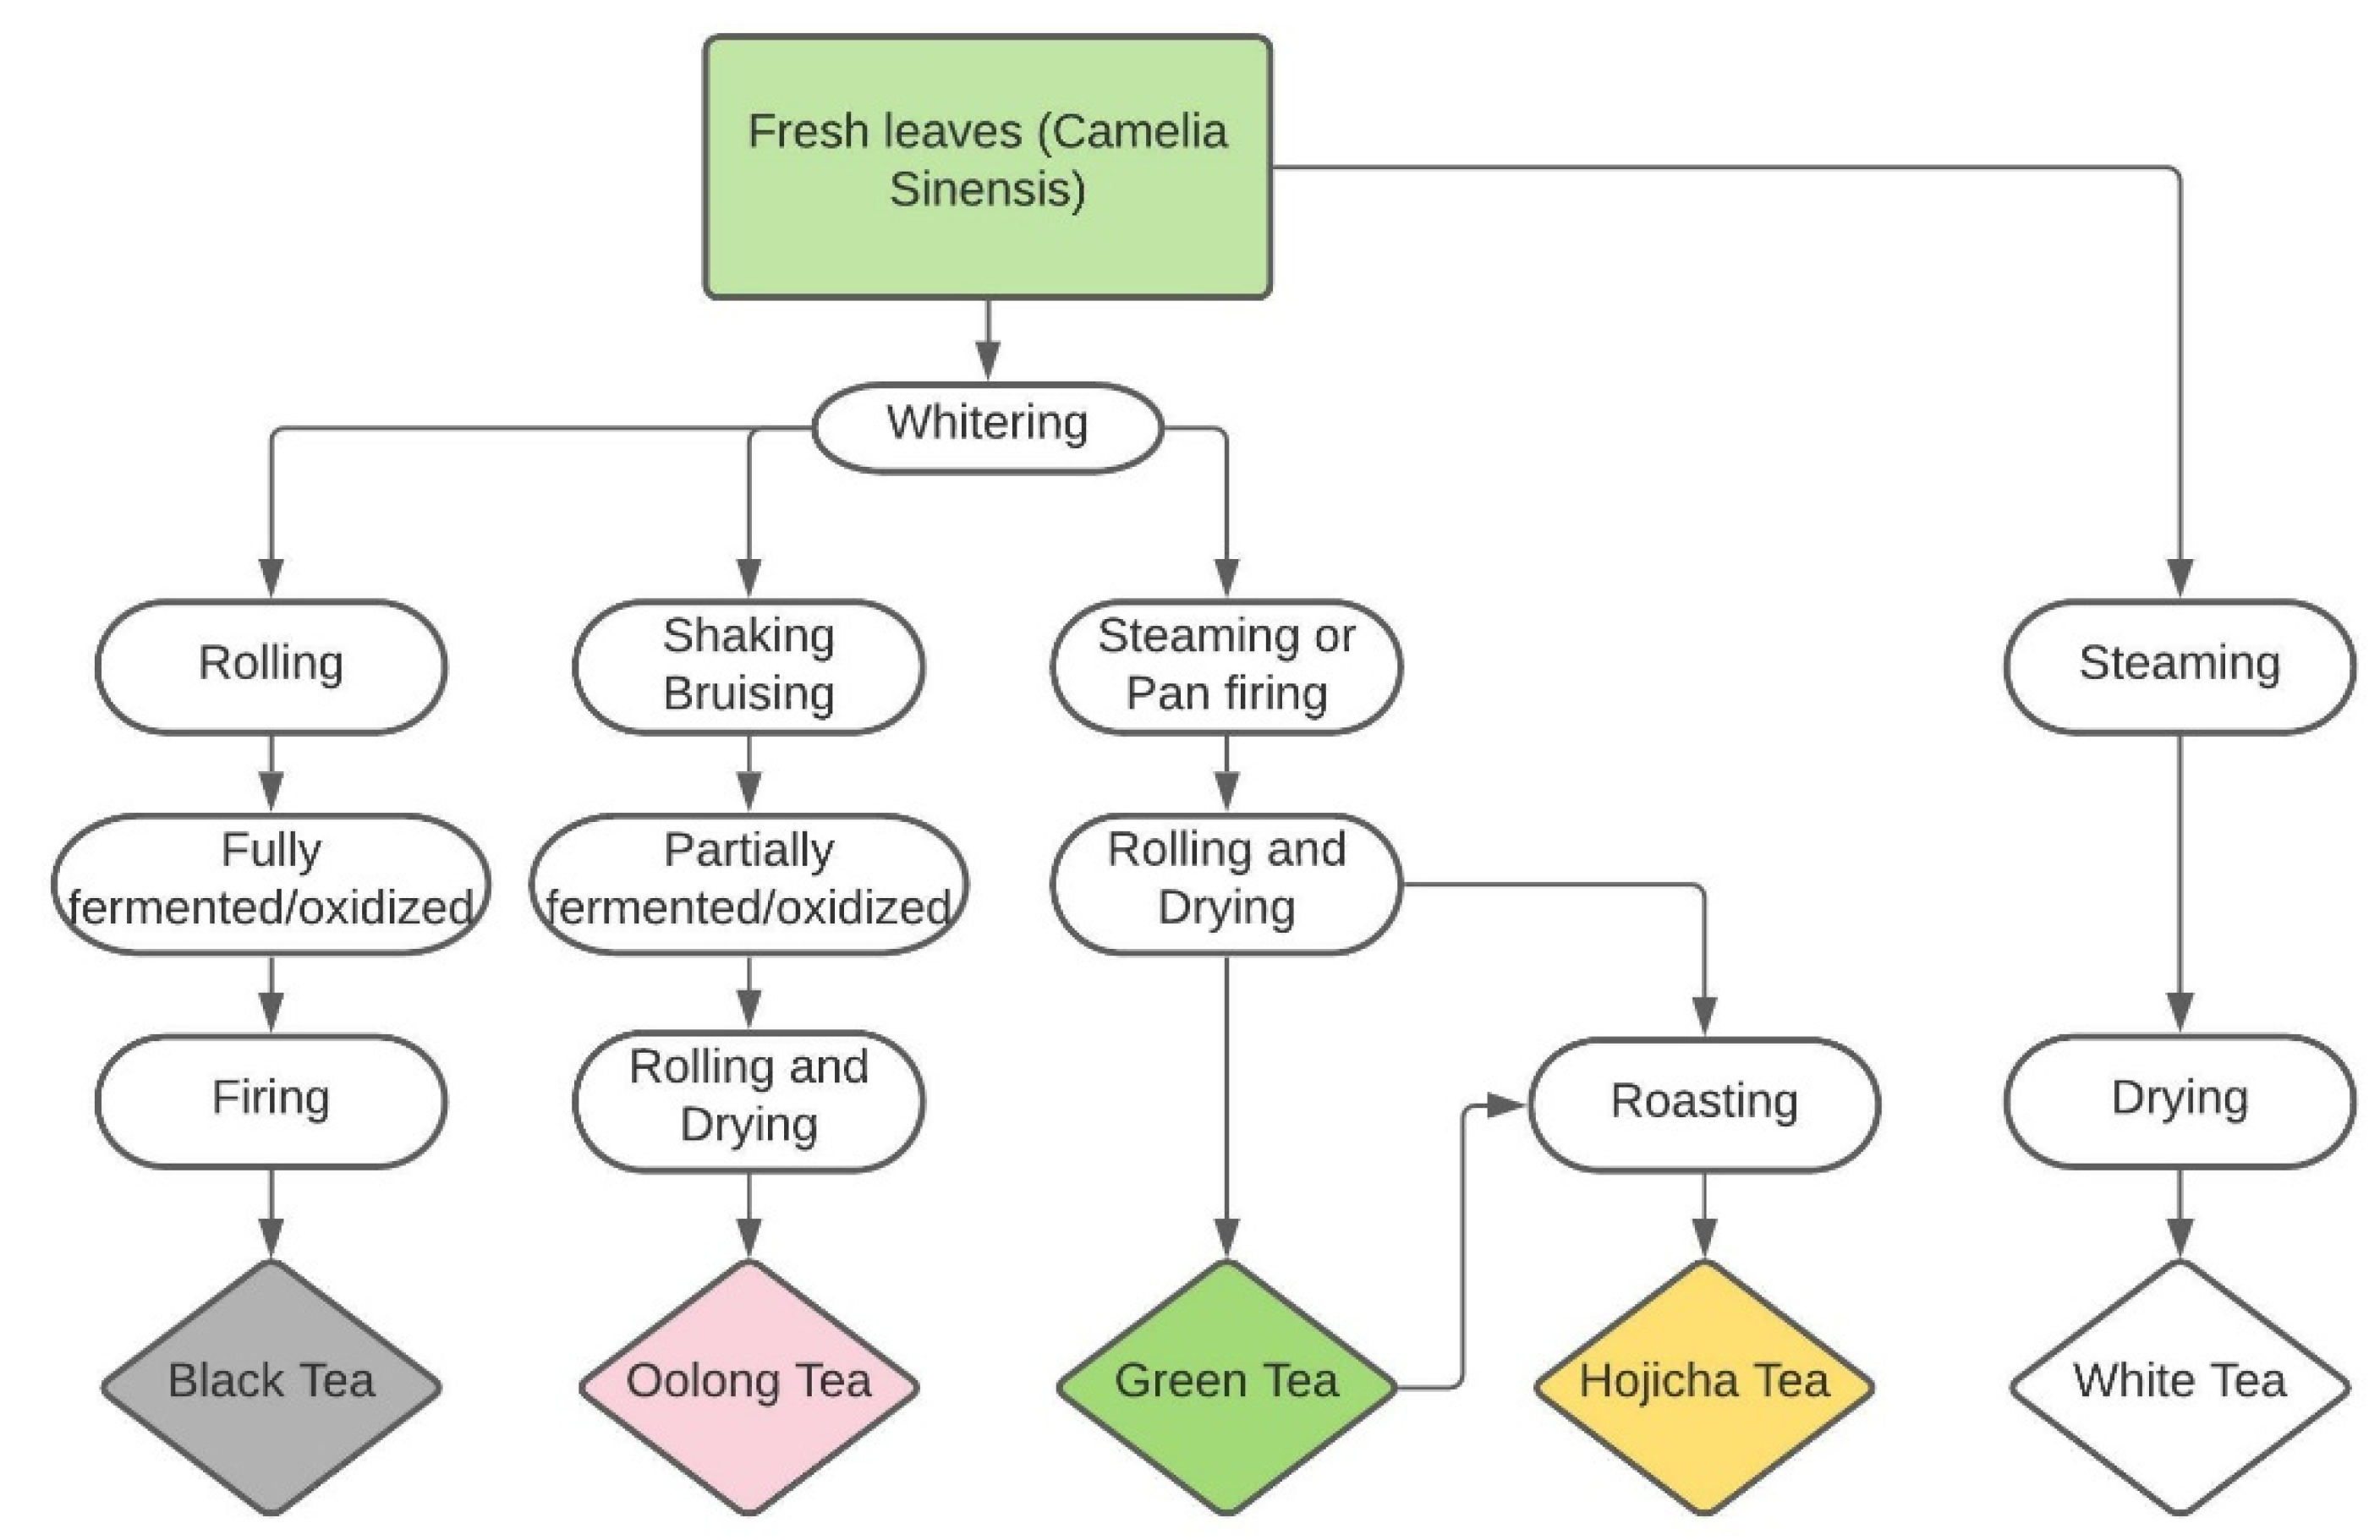
Green tea, the most widely consumed beverage in Asia, has recently become more widespread in the West where black tea is traditionally consumed. Green tea is made solely with the leaves of Camellia Sinensis that have undergone minimal oxidation under processing. The popularity of green tea is due to many factors. Firstly, the biological value related to the high content of catechins with recognized antioxidant properties. Indeed, a number of epidemiological studies have shown that regular tea drinkers have a lower chance of developing cardiovascular disease, degenerative disorders and cancers [1,2,3,4]. The manufacturing process of green tea includes steaming, characteristic of most of the Japanese teas, like Sencha, or pan-firing, typical of most of the Chinese teas, i.e., Bancha. During these processes, the oxidase enzyme, present in tea leaves, is inactivated, thus preserving the green color of the leaves and the catechin composition. Together with the claimed health-promoting effects, another contributory factor to green tea’s popularity is its flavor. The pleasant smell of green tea depends primarily on the composition of the odorants and their transformation due to different treatments, including roasting, steaming, baking, sun-drying or storage conditions (Figure 1) [5,6]. For example, Hojicha is the name given to some green tea varieties that are subjected to a roasting process at a high temperature (from 160 to 200 °C), altering the leaf color from green to reddish-brown and the aroma. Hojicha is often made from Bancha, tea from the last harvest of the season, or from other varieties, including Sencha.
The desirable flavor of Hojicha, mainly defined as “roasty”, is due to the formation of pyrazines [5,7,8], however, the changes in the odorant composition also contribute to the characteristic aroma. Pyrazines and acrylamide are commonly generated via the Maillard reaction during the roasting process, giving roasted green tea a strong odor [9]. On the other hand, the high demand for green tea is also due to the presence of bioactive substances, mainly catechins, hence the Hojicha pan-firing process should be optimized to avoid catechin degradation [10,11] and high levels of acrylamide, which is probably carcinogenic to humans [12], without compromising the quality. Since commercial Hojicha tea contains a non-negligible amount of acrylamide, Mizukami et al. have suggested roasting conditions (160 °C for 30 min, or 180 °C for 15 min) which minimize the formation of acrylamide but at the same time ensure the formation of pyrazines which contribute to the pleasant aroma [8]. In general, comparing the composition of Sencha Ariake tea, considered as a typical reference sample, Bancha Hojicha tea shows lower levels of catechins, the absence of both theanine enantiomers and a relatively high level of the distomer (−)-catechin and of (−)-gallocatechin gallate. This suggested that thermal epimerization of (−)-epicatechin and (−)-epigallocatechin gallate occurs [2].
Herein, an investigation was conducted on the variation in the composition of the main aromas of selected Bancha and Sencha tea and the formation of pyrazines following roasting. The roasting process was carried out at different temperatures (160, 180 and 200 °C) for 30 min in order to assess the impact on the composition of the tea. The roasted conditions were selected according to Mizukami et al. [8].
To this end, qualitative analysis of the composition of 22 green teas (including Bancha and Sencha) and two black teas and quantitative analysis on the main odorants from tea infusion was performed by headspace–solid-phase microextraction gas chromatography (HS-SPME GC-MS) in total ion current (TIC) and in single ion monitoring (SIM) modes.
According to our qualitative results and to previous studies carried out by aroma extract dilution analysis (AEDA) [8,13,14], gas chromatography–olfactometry [15] and headspace–solid-phase gas chromatography–mass spectrometry (HS-SPME-GC-MS) [16,17], some of the most characteristic green tea odorants were selected and quantitatively determined.
To the best of our knowledge, for the first time, an original HS-SPME GC-MS method was fully validated (linearity, sensitivity, accuracy, precision and matrix effect) and applied for the characterization of some of the main green tea odorants, with particular emphasis on the comparison of the aroma contents before and after roasting treatment. The changes in the volatile flavor compound (VFC) profile showed a significant increase in some potent odorants, including pyrazines, the most contributory components of the Hojicha flavor [7,8], and specific variation in characteristic odorants, such as 2,4-heptadienal, β-damascenone, β-ionone, linalool and indole.
2. Materials and Methods
2.1. Materials
The considered green tea and black tea samples (24 commercially available products from Japan and China, see Table S1 in Supplementary Material) were purchased from Grosserbe s.r.l. (Bologna, Italy). The determination of linear retention indices (RI) of the odorants was performed by using a mixture of n-alkanes (n = 8–40) obtained from Sigma-Aldrich, Milan, Italy. The odorants 2,4-heptadienal, β-damascenone, β-ionone, linalool, indole, 2-ethyl-6-methyl-pyrazine, 2-ethyl-5-methyl-pyrazine, 2-ethyl-3,6-dimethylpirazine, 2-ethyl-3,5-dimethyl-pyrazine and 2-acetyl-pyrazine were from Sigma-Aldrich, Milan, Italy. The isotopically labeled internal standards (IL-ISs) linalool-d5 (EPTES, Switzerland) and hexanal-d12 (Sigma-Aldrich, Milan, Italy) were used for calibration.
A manual holder and the commercially available SPME fibers were obtained from Supelco (Bellefonte, PA, USA); in particular, the following fibers were considered: 100 μm polydimethylsiloxane (PDMS), 85 μm polyacrylate (PA), 65 μm polydimethylsiloxane/divinylbenzene (PDMS/DVB), 75 μm CarboxenTM/polydimethylsiloxane (CAR/PDMS).
2.2. Tea Sample Preparation
Infusions were prepared by extracting 5 g of tea leaves with 250 mL of 90 °C water for 5 min. After cooling to room temperature in a closed glass bottle, protected from light, the mixture was centrifuged at 6000 rpm × 10 min and a 1 mL aliquot of the supernatant was placed into screw top vials (4 mL, Supelco, Bellefonte, PA, USA) and analyzed by HS-SPME GC-MS. In quantitative analysis, 50 µL of internal standard solution (0.1 µg/mL linalool-d5, hexanal-d12 in methanol) were added to a 5 mL aliquot of supernatant and 1 mL of this solution was transferred in screw top vials for the subsequent analysis. The preparation of each tea sample was repeated three times.
2.3. Roasting Conditions
Ten grams of selected green tea, Bancha, Sencha Ariake, Sencha Fukujyu and Ceylon, were placed on aluminum foil and roasted at 160, 180 and 200 °C for 30 min at each temperature [8] in a laboratory oven. The roasted leaves were cooled at room temperature and stored in closed vials; 5 g of the obtained samples were analyzed within two days as described in Section 2.2. Both the roasting treatment and tea infusion preparation were performed in triplicate.
2.4. HS-SPME Sampling
Before their first use, SPME fibers were conditioned in a GC injector at 250–320 °C for 0.5–2 h, according to the manufacturer’s recommended procedure. The optimization was performed on a representative green tea infusion (Bancha Hojicha) and on selected compounds with different retention times: 2,4-heptadienal, linalool, β-ionone (RT 11.2, 17.5, 32.8, respectively).
One mL of the tea infusions, prepared as described above, was directly placed into screw top vials for HS-SPME.
The following optimized extraction conditions were applied: after 15 min equilibration time, 65 µm PDMS/DVB fiber was exposed to the HS above the tea sample and stirred with a magnetic bar at 400 rpm on a heated stirring plate at 100 °C (extraction temperature). After 20 min (extraction time), the analytes were thermally desorbed in the GC injector port set at 250 °C for 2 min. Blank injections of fiber were performed every three injections in order to exclude interfering peaks from the chromatogram. HS-SPME GC-MS analysis of each sample was performed in triplicate.
2.5. Gas Chromatograph–Mass Spectrometry Analysis
GC-MS analyses were performed on a TRACE GC2000 Series (ThermoQuest CE Instruments, Austin, TX, USA) gas chromatograph, interfaced with a GCQ Plus (ThermoQuest) mass spectrometer with an ion trap analyzer, operating in EI mode (70 eV). The GC analysis was carried out on a Phenomenex ZB-5 fused silica capillary column (30 m × 0.25 mm ID, 0.25 μm film thickness), consisting of Crossbond (5% diphenyl, 95% dimethyl polysiloxane). Helium (He) was the carrier gas at a flow rate of 1.0 mL/min. The temperature program was: initial 40 °C (hold time: 1 min), then ramped by 3 °C/min to 220 °C (hold time: 10 min). The temperature of the transfer line and ionization source was maintained at 250 and 260 °C, respectively. The GC injection was operated in split mode (split ratio 1:20); the injector base was purged for 2 min and the temperature was set to 250 °C.
The mass chromatograms were recorded in full scan (TIC range 50–650 amu) and in single ion monitoring (SIM) mode on selected qualifier and quantifier ions (Table 1) for qualitative and quantitative purposes, respectively.
2.6. Identification and Normalization of Volatile Components
The identification of VFCs was achieved by comparing Kovats linear retention indices (RIs) and EI mass spectra to those of authentic reference standards, whenever possible, or by using mass spectra databases (NIST library) and by comparing the experimental RI values to those previously reported in the literature [10,14,16]. The RIs were determined by injection of a solution containing the homologous series of normal alkanes (C8–C40). The relative content (%) of the VFCs was investigated with a TIC chromatogram by using the following equation:
Relative content (%) = single component area/total area × 100
The results obtained in green teas and roasted tea (180 °C, considered as an intermediate temperature among those used) were used to select most abundant VFCs whose percentage significantly varied after roasting.
2.7. Quantitative Determination of Selected Odorants: Method Validation
In accordance with preliminary results obtained from the roasting process, some main odorants (including pyrazines) whose relative content significantly varied were selected for a more in-depth quantitative analysis. In particular, quantitation of 2,4-heptadienal, β-damascenone, β-ionone, linalool, indole, 2-ethyl-6-methyl-pyrazine, 2-ethyl-5-methyl-pyrazine, 2-ethyl-3,6-dimethylpirazine, 2-ethyl-3,5-dimethyl-pyrazine and acetyl-pyrazine was performed in SIM mode (selected ions are reported in Table 1), by using the validated method. For the analysis of spiked samples, a representative green tea (Bancha Hojicha) was used.
2.7.1. Linearity, Matrix Effect and Sensitivity
The linearity of the method was investigated by determining the selected VCFs in water and in spiked tea infusions (standard addition method) at five concentration levels (0.02, 0.1, 0.5, 1.0, 2.0 µg/mL), in the presence of the IL-ISs. Calibration graphs were obtained by plotting the ratio of the SIM peak area of the analyte to the internal standard, versus the corresponding analyte concentration using least squares regression analysis.
The matrix effect, from the spiked tea infusion, for all analytes was evaluated as the ratio between the absolute matrix effect and the peak area of standard solutions. The absolute matrix effect was calculated as the difference between the peak area of the spiked sample standard and the peak area of the standard solution. A t-test was also used to compare the calibration curve slopes in water and in spiked samples (p < 0.05).
The limit of detection (LOD = 3xS/N) and limit of quantitation (LOQ = 10xS/N) for each analyte were experimentally determined in water by injecting a step-wise dilution of the standard solution.
2.7.2. Accuracy and Precision
The accuracy of the method was assessed by recovery experiments on spiked tea leaves with the selected odorants at three concentration levels: 0.1 (low), 0.5 (medium) and 2.0 (high) µg/mL. The recovery was calculated by comparing the amounts found in the spiked samples with those determined in aqueous solution. The recovery levels and the coefficient of variation (CV%) were estimated.
The precision of the assay was evaluated by replicate measurements (intra-day: n = 6, inter-day: n = 18 on three different days) of the spiked (0.5 µg/mL) commercial green tea Bancha Hojicha products.
3. Results
The extraction of odorants in tea infusion is conventionally carried out using a procedure consisting of steam distillation under reduced pressure, liquid–liquid extraction with organic solvent and a final concentration prior to the GC analysis using an olfactometric detector [8,13,14]. HS-SPME, applied directly on tea infusions, can be a useful and alternative method to the described time-consuming sample preparation and, in the present investigation, it was used in combination with GC-MS analysis, to evaluate the change in green tea aroma composition after roasting.
3.1. Development of HS-SPME GC-MS Method
3.1.1. HS-SPME
The optimization of the HS-SPME parameters was carried out by following a step-by-step approach for different odorants characterized by different boiling points (Figure S1 in Supplementary Material).
In order to allow for a complete equilibration, an aliquot of 1 mL of the infusion was transferred to a 4 mL sample vial and it was left under stirring (400 rpm) at 100 °C for 20 min. The fibers investigated included PDMS, PDMS/DVB, PA and CAR/PDMS (Figure S1A). HS-SPME was performed at 100 °C for 15 min. According to a previous report, the 65 µm PDMS/DVB fiber was found to be significantly more efficient in the extraction of the six selected odorants (2,4-heptadienal, 2,6-nonadienal, linalool, β-damascone, β-damascenone, indole) [14,17]. The influence of equilibration time, extraction time and temperature (Figure S1B–D) was investigated within 2–50 min, 2–30 min and 40–160 °C, respectively. From these results, a 15 min equilibration and fiber exposure for 20 min at 100 °C was considered to be the optimum. To this regard, it has to be underlined that the reported extraction temperature refers to that of the heating plate, thus, because of the thermal dispersion, the sample experiences an actual temperature lower than that reported (estimated as 80 °C). Under these conditions, concentration changes, which could affect the aroma composition, can be excluded. Desorption parameters, namely temperature of the injector port, time and split ratio, were also optimized (data not shown); the obtained final conditions are reported in detail in the Materials and Methods. According to the manufacturer, the fiber showed excellent stability as assessed by reliably performing more than 100 samplings.
3.1.2. GC-MS Analysis
The GC-MS conditions were developed to allow the separation of the volatile components in the shortest analysis time. Identification of the volatile flavor compounds was achieved by comparing the Kovats linear retention indices and EI mass spectra with those of reference standards (when available), by using a mass spectra database (NIST library), and by comparing the experimental data with those previously reported in the literature [5,10,14,15].
Analysis of the tea samples (24 different types) was performed, the main volatile compound identity and the relative concentrations of a representative green tea (Bancha) and roasted tea products are reported in Table 2.
The same chromatographic method was applied to analyze green tea before and after roasting (TIC chromatograms of a representative tea sample, Bancha, are shown in Figure S2).
From the qualitative analysis, some odorants were selected for their evident variation after roasting and their quantitative analysis was performed as described below.
3.2. Method Validation
In order to perform the quantitation of the VFCs (2,4-heptadienal, β-damascenone, β-ionone, linalool, indole, 2-ethyl-6-methyl-pyrazine, 2-ethyl-5-methyl-pyrazine, 2-ethyl-3,6-dimethylpirazine, 2-ethyl-3,5-dimethyl-pyrazine and acetyl-pyrazine), for the reliable monitoring of their variations before and after roasting, the HS-SMPE-GC-MS method was validated for linearity, sensitivity, accuracy and precision in the presence of isotopically labeled IS, as described in the Materials and Methods.
The linearity of the method was studied on the selected compounds by analyzing aqueous solutions at five levels of concentration within the range 0.02–2.0 µg/mL. Calibration graphs were obtained by plotting the ratio of the SIM peak areas of the analytes to IL-IS, versus the corresponding concentration (µg/mL). A standard addition method was also carried out on green tea (Bancha Hojicha) infusion to simultaneously confirm the linearity and to determine the matrix effect. The resulting calibration curve equations were in the form of Y = a (±sd)X + b(±sd), the obtained results are shown in Table 3.
The correlation coefficient found (r2 range from 0.981 to 0.999) confirmed the linearity of the response over three orders of concentration of the analytes, as well as in the presence of the complex matrix.
The matrix effect percentage (ME%) was evaluated by comparing the calibration curve slopes obtained from standard solutions and samples spiked with standards; values greater and lower than 0% indicated a positive matrix effect (ionic increase) and negative matrix effect (ionic suppression), respectively. Matrix effect values were considered negligible, always in a range of −9.5 to +4.5% for all studied analytes. Indeed, the curve slopes obtained with standard additions did not differ significantly from those in neat solution (p n.s.).
Experimental LOD (3xS/N) values ranged from 0.002 to 0.01 µg/mL and LOQ (10xS/N) from 0.005 to 0.04 µg/mL.
The accuracy of the method was assessed by recovery experiments on spiked tea leaves (commercial representative tea sample Bancha Hojicha). Standard solutions of the selected analytes at three concentration levels (low, medium and high concentration of the calibration curve) in the presence of IL-ISs were added to tea leaves; three independent infusion preparations were analyzed using water solution at the same concentration as external standard. Each of the samples was analyzed twice. The obtained results are summarized in Table 4, the mean recovery (n = 3) was in the range of 82.02–99.17%.
The precision of the assay method was evaluated by replicated analyses (intra-day: n = 6, inter-day: n = 18 on three different days) of a spiked (50.0 µg/mL) representative commercial tea product (Bancha Hojicha). In the precision study, the reproducibility was expressed as the CV% of the odorant amount. The obtained results are reported in Table 4. Inter-day and intra-day precision data suggest acceptable method reproducibility.
3.3. Changes upon Aroma Release after Roasting
Roasted green tea (Hojicha) has a characteristic and appreciated roasty flavor due to the formation of alkylpyrazines, stable products of the Maillard reaction. Nevertheless, the roasting process must avoid high levels of acrylamide formation, catechin degradation and significant changes in the VFC content. To this end, it is necessary to optimize the roasting procedure, as was performed by Mizukami et al. (2008) [8]. These optimal roasting conditions were reported for Hojicha green tea to be 160–170 °C.
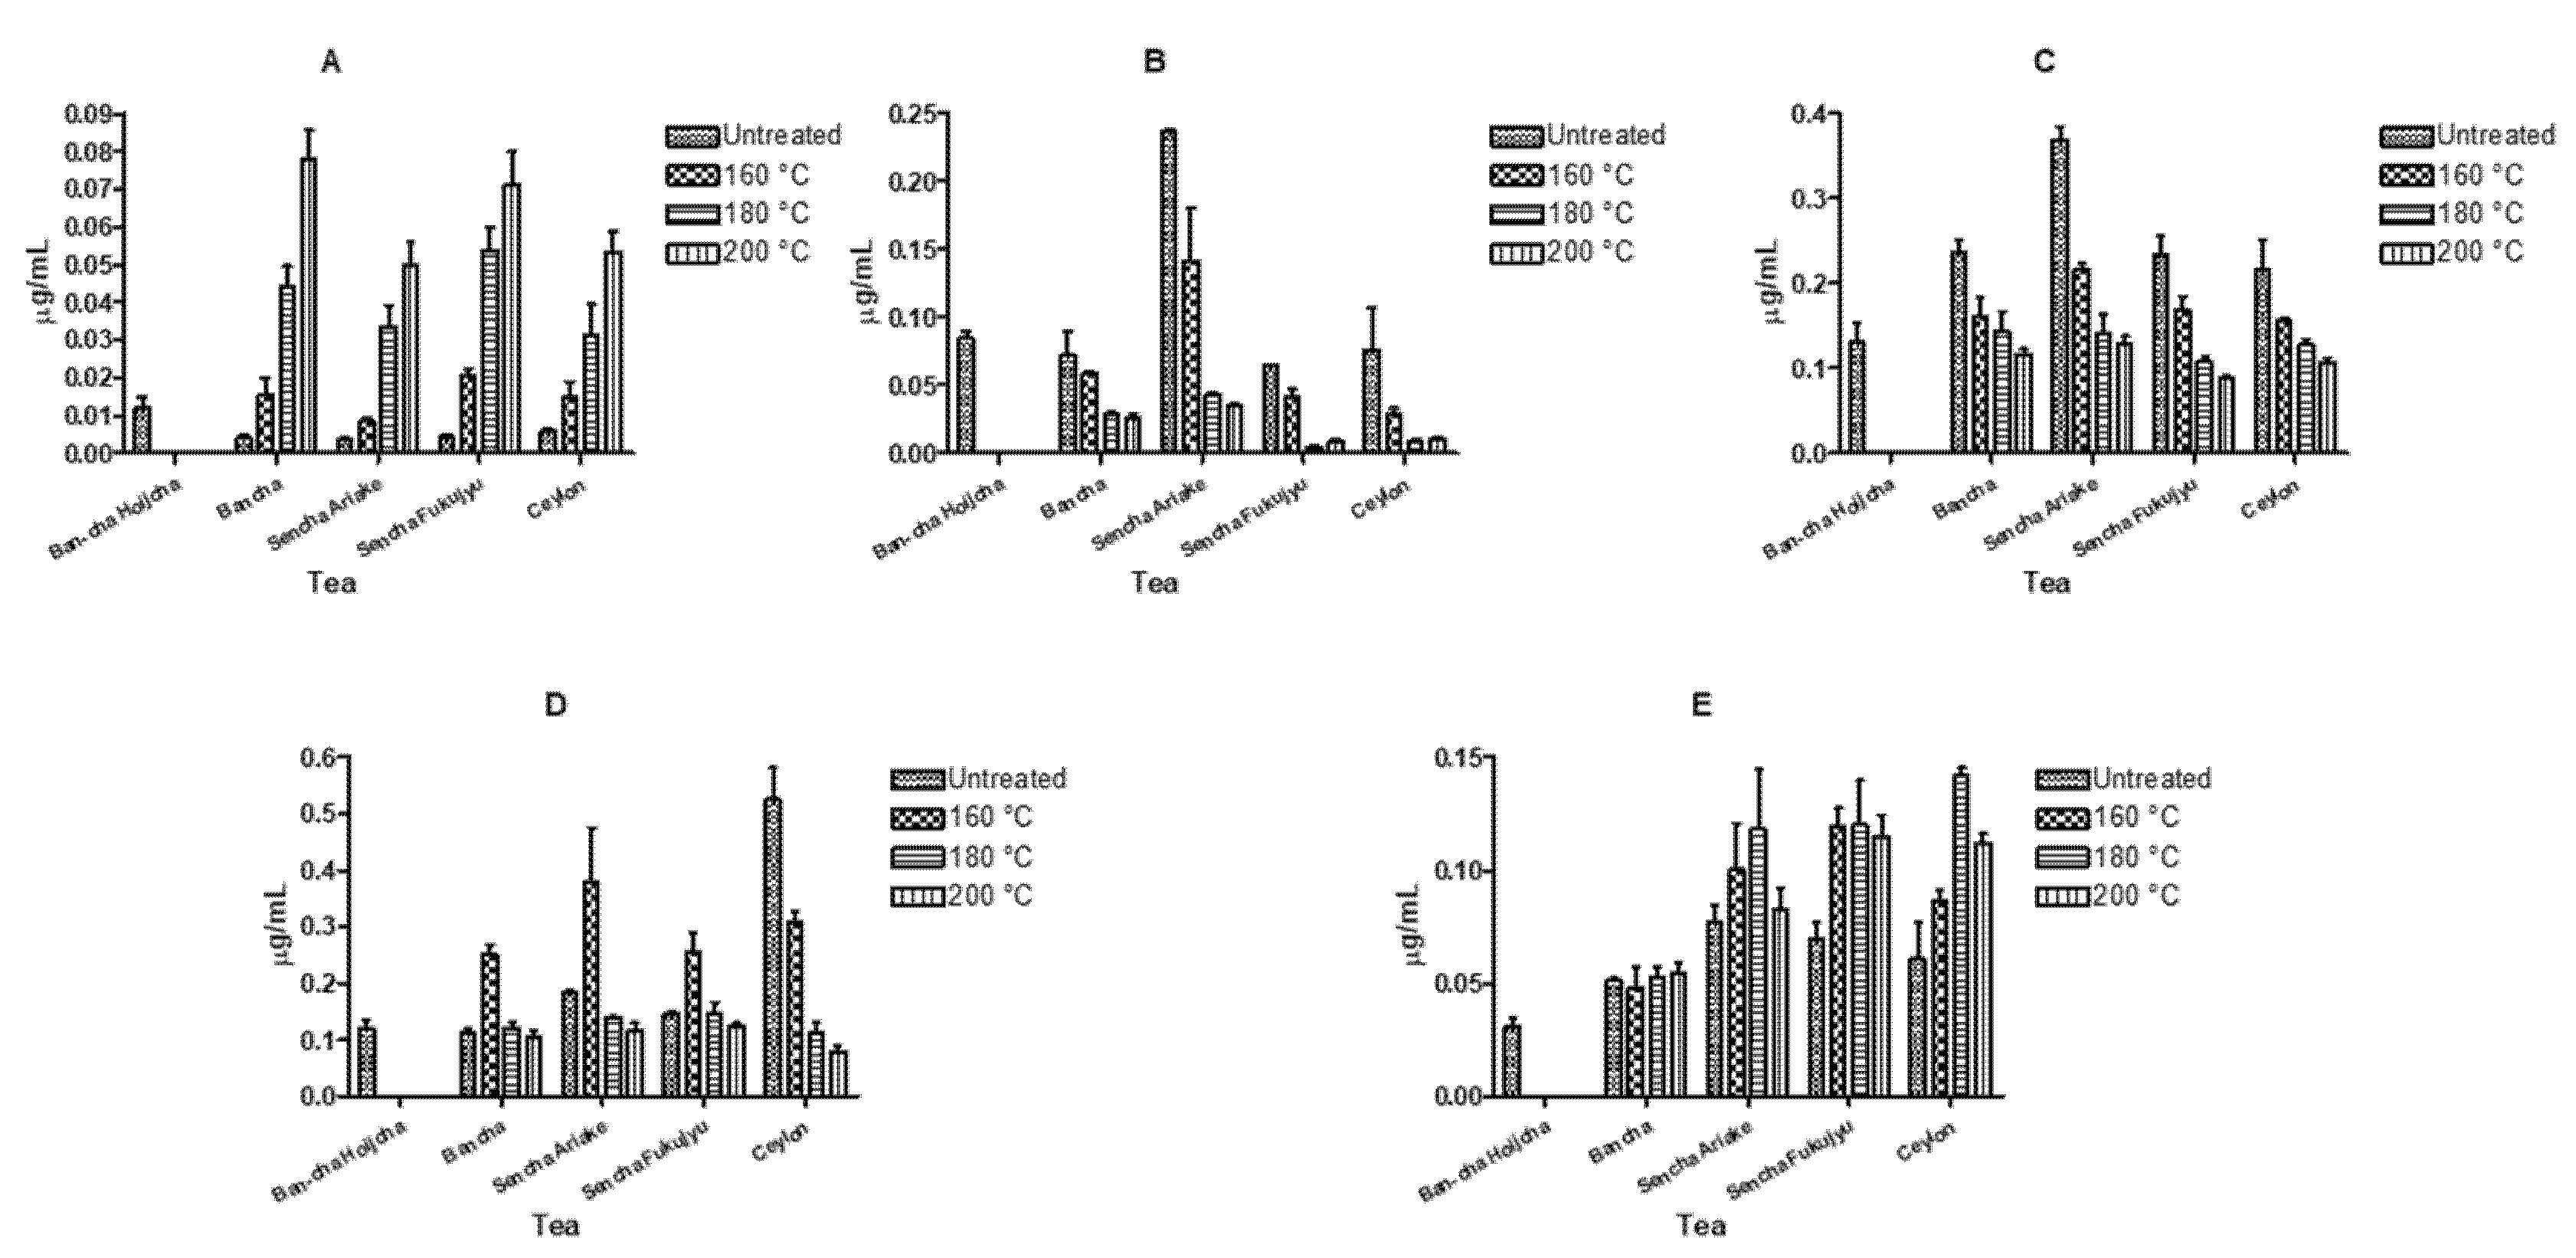
In the present study, we determined the amount (µg/mL) of some odorants, namely 2,4-heptadienal, β-damascenone, β-ionone, linalool, indole, 2-ethyl-6-methyl-pyrazine, 2-ethyl-5-methyl-pyrazine, 2-ethyl-3,6-dimethylpirazine, 2-ethyl-3,5-dimethyl-pyrazine and 2-acetyl-pyrazine, before and after roasting under different conditions (160, 180 and 200 °C for 30 min). The VCFs were selected according to their abundance in green tea and their significant variation in percentage in preliminary roasting experiments (Section 2.6 and Section 2.7, Table 2). HS-SPME GC-MS quantitative analysis was performed on infusions of the following tea samples: Bancha, Sencha Ariake, Sencha Fukujyu and Ceylon, before and after roasting. The reported roasting results were compared to the same selected VFC content in a Bancha Hojicha tea, a commercially available roasted Bancha green tea known for its desirable flavor, and a roasted black tea (Ceylon).
In Figure 2, the selected main odorant concentration trends after roasting are reported. As shown, 2,4-heptadienal and indole content increased after roasting from 160 to 200 °C for almost all the tested teas, conversely, β-damascenone and β-ionone content decreased. Interestingly, we found that linalool content increased after roasting at 160 °C and decreased when the tea was overheated at 180 °C and 200 °C.
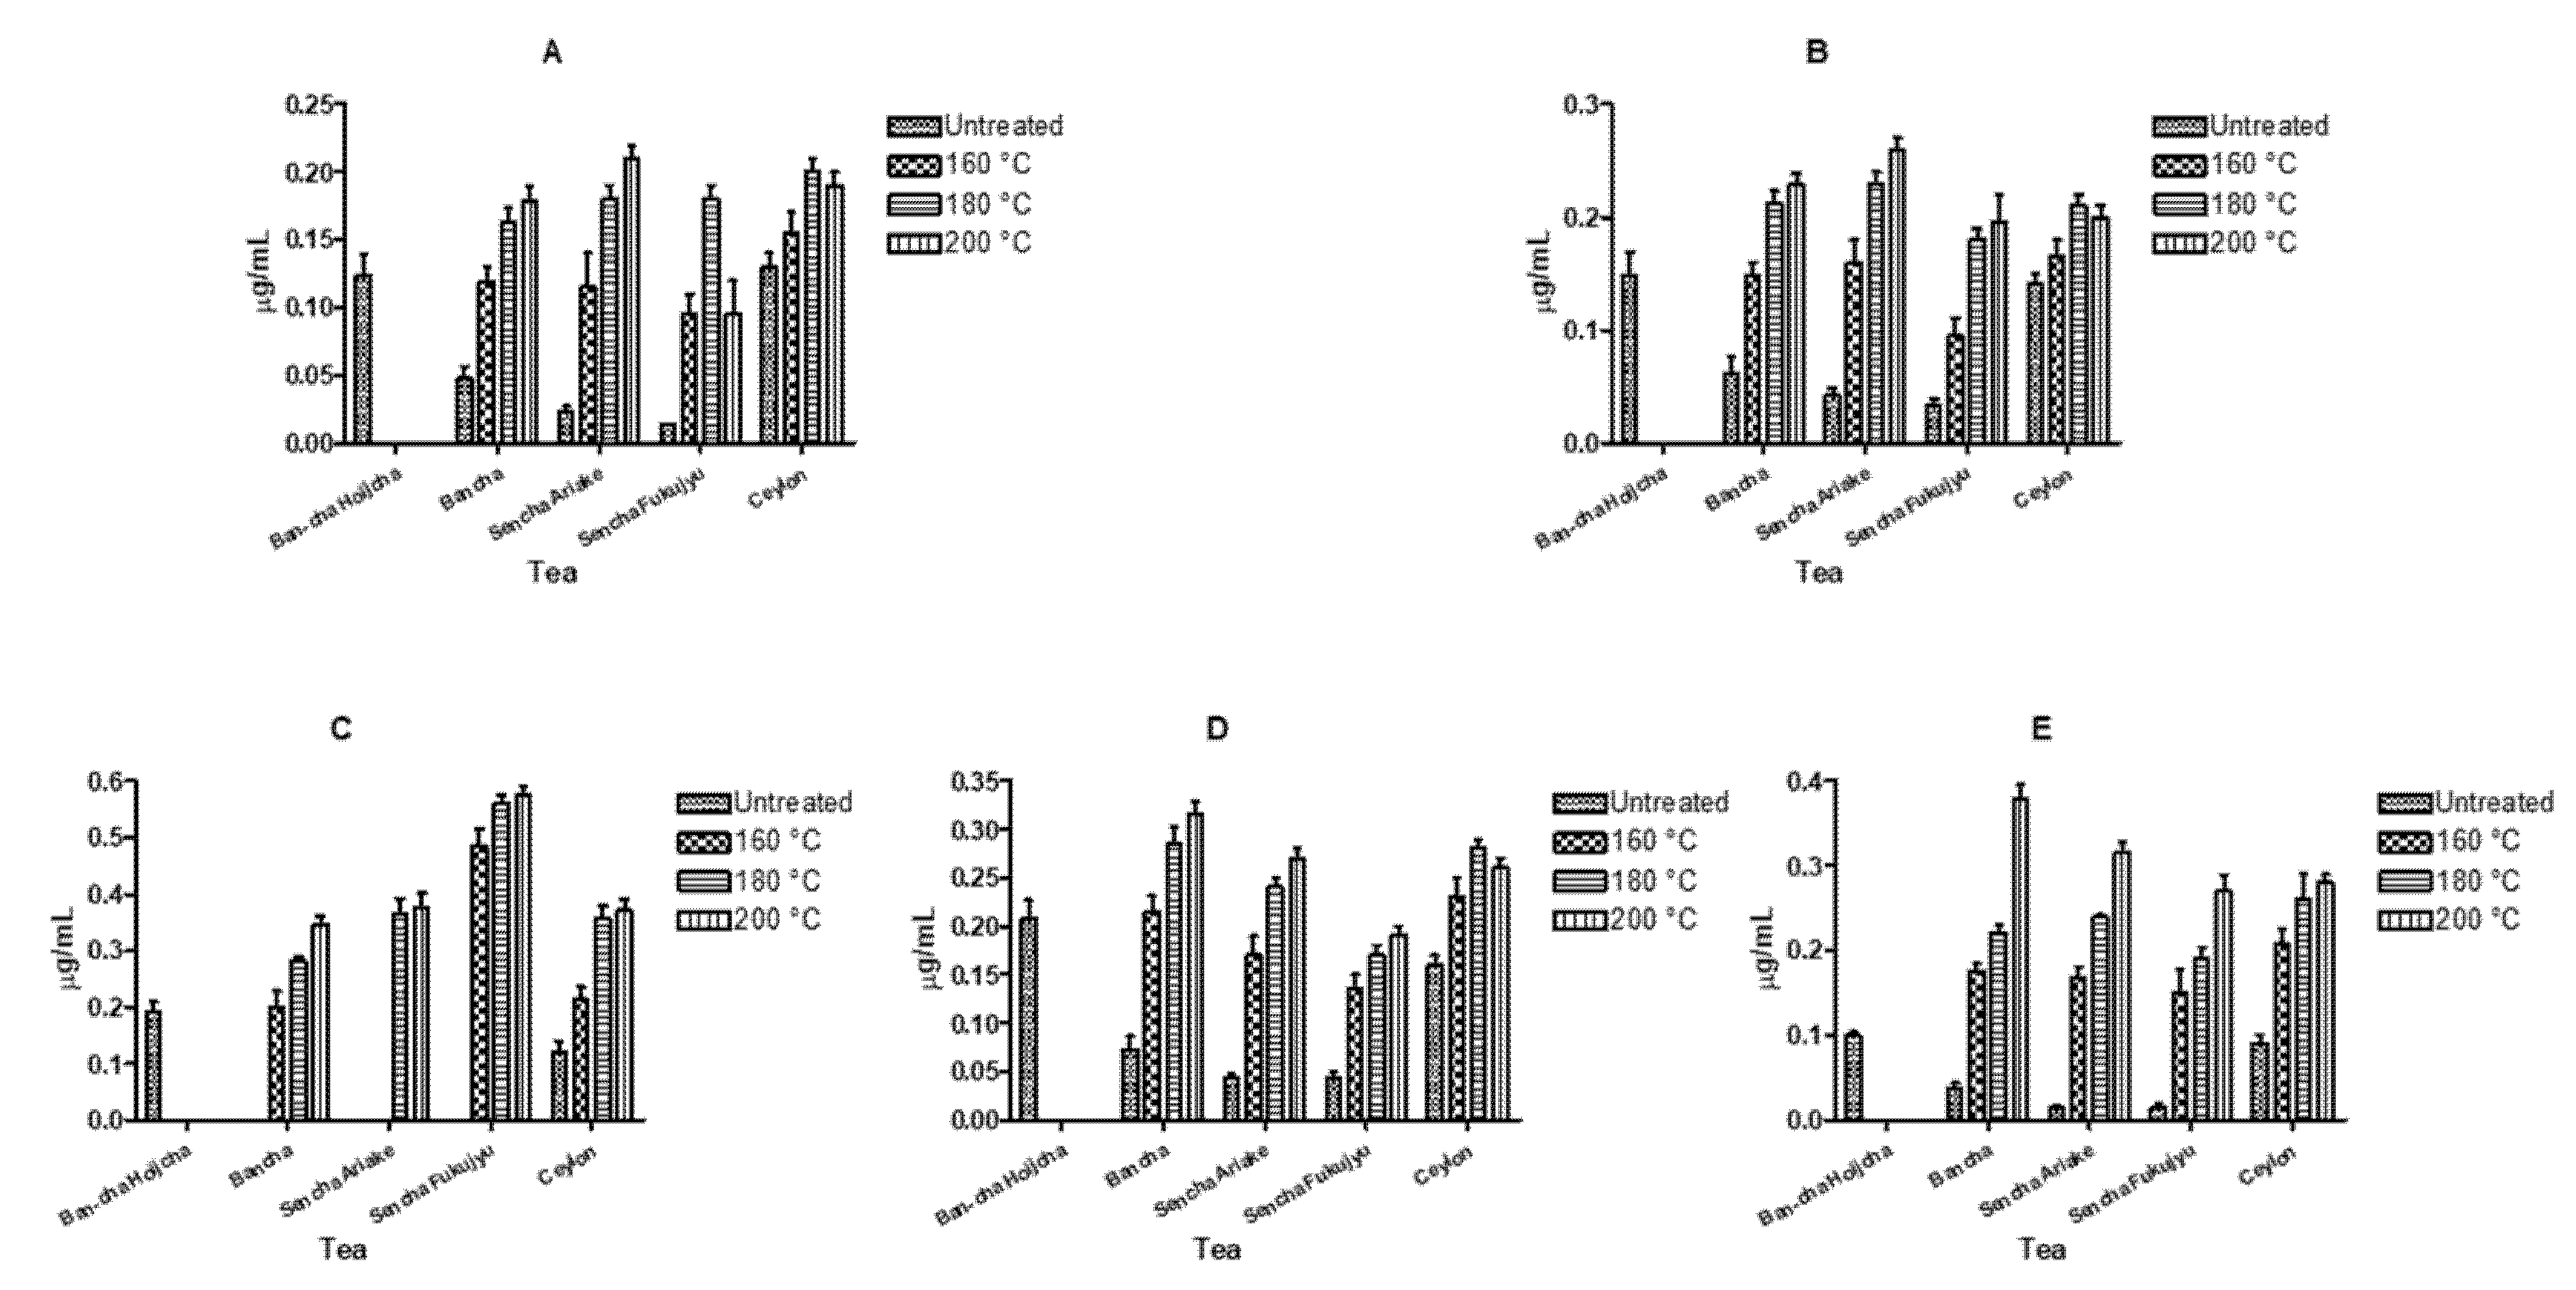
The proposed HS-SPME-GC-MS method was also applied to the determination of selected pyrazines (2-ethyl-6-methyl-pyrazine, 2-ethyl-5-methyl-pyrazine, 2-ethyl-3,6-dimethyl-pirazine, 2-ethyl-3,5-dimethyl-pyrazine and 2-acetyl-pyrazine) in green tea infusions, because these compounds have been considered among the most important odorants giving the desirable Hojicha flavor [7,8]. The concentration in µg/mL of all the identified pyrazines increased from 160 °C to 200 °C (Figure 3). In the analyzed green teas, except for Hojicha, 2-ethyl-3,6-dimethy-lpirazine was absent, hence, its formation and concentration trend after roasting can be used as useful markers of the process.
Generally, the content of the quantitatively analyzed VCFs and pyrazines after roasting at 160 °C for 30 min is similar to that in Hojicha and to that in black tea (Ceylon) when overheated.
4. Discussion
Usually, the flavor extracts of green tea infusions are prepared by steam distillation under reduced pressure followed by liquid–liquid extraction and concentration, or by using a solvent-assisted flavor evaporation (SAFE) device before the injection in the gas chromatographic system [18,19]. Recently, solid-phase microextraction (SPME) has gained acceptance in many fields as an accurate, rapid, sensitive and solvent-free sampling method and its application is reported by many researchers as a useful approach in sample preparation of volatile compounds from tea leaves and tea infusions [7,16,20].
A fully validated, accurate and reproducible quantitative method based on HS-SPME combined with GC-MS for the determination of volatile flavor compounds in green tea was developed and validated. The optimized solvent-free sample extraction was shown to be of practical use and involved a limited number of handling steps with a minute amount of sample. This method is less time-consuming compared to those based on several preparation steps, such as steam distillation followed by liquid–liquid extraction and concentration. The method was successfully applied in quantitative analysis of selected odorants, and to study the effect of roasting procedure on the tea VFC composition. In particular, the changes in typical green tea odorant and pyrazine concentrations (µg/mL) were followed, to confirm that 160 °C for 30 min are the most adequate conditions to obtain the Hojicha flavor and prevent acrylamide formation, catechin degradation [8] and significant changes in the appreciated aroma.
Among pyrazines, 2-ethyl-3,6-dimethylpirazine was proved to be of particular interest because it is absent in the green teas we analyzed and is formed after the roasting process, so it can be considered as a marker of the treatment. A further innovative contribution of this study is the linalool’s concentration trend, as the content increases after roasting at 160 °C but drops at 180 and 200 °C, thus being a useful marker of overheating in quality control, both to verify the process itself and to monitor the roasting degree correlated to temperature and time. These potential markers can be important when considering Hojicha green tea, which should be roasted at 160 °C to maintain the desired aroma characteristics and catechin content [8].
The characterization of the variation of the VCF absolute content can be an important contribution in the evaluation of roasted green tea quality, named Hojicha tea, especially with respect to the roasting conditions such as temperature and time. This is a very important aspect in the Hojicha tea trade, to obtain the typical “roasted” aroma, and, at the same time, to maintain the widely reported beneficial properties of green tea.
Supplementary Materials
The following are available online at https://0-www-mdpi-com.brum.beds.ac.uk/article/10.3390/app11178217/s1. Table S1. List of the commercially available green teas and black teas. Figure S1. HS-SPME optimization. (A) Effects of the fibre extraction efficacy on the peak area of six representative VFCs. HS-SPME Conditions: sample 1 mL of tea infusion, extraction time 20 min, temperature 100 °C, stirring rate 400 rpm. The applied GC-MS conditions are described in the Experimental section. Effects of HS-SPME equilibration time (B), extraction time (C) and temperature (D) on the peak area of three representative VFCs. HS-SPME Conditions: sample 1 mL of tea infusion, variable extraction time and temperature, stirring rate 400 rpm. The applied GC-MS conditions are described in the Experimental section. Figure S2. TIC chromatograms on ZB5 column of a representative tea (Bancha) before (A) and after (B) roasting. Chromatographic conditions: initial 40 °C (hold time: 1 min), then ramped by 3 °C/min to 220 °C (hold time: 10 min), helium gas flow rate 1 mL/min.
Author Contributions
Conceptualization, R.G. and J.F.; methodology, R.G., A.L. and J.F.; validation, J.F.; formal analysis, J.F. and A.L.; writing—original draft preparation, J.F.; writing—review and editing, R.G., A.L. and J.F. All authors have read and agreed to the published version of the manuscript.
Funding
This work was supported by 2019 (RFO) Ricerca Fondamentale Orientata—University of Bologna, Italy.
Institutional Review Board Statement
Not applicable.
Informed Consent Statement
Not applicable.
Conflicts of Interest
The authors declare no conflict of interest.
References
- Da Silva Pinto, M. Tea: A new perspective on health benefits. Food Res. Int. 2013, 53, 558–567. [Google Scholar] [CrossRef]
- Fiori, J.; Pasquini, B.; Caprini, C.; Orlandini, S.; Furlanetto, S.; Gotti, R. Chiral analysis of theanine and catechin in characterization of greentea by cyclodextrin-modified micellar electrokinetic chromatographyand high performance liquid chromatography. J. Chrom. A 2018, 1562, 115–122. [Google Scholar] [CrossRef] [PubMed]
- Deka, A.; Vita, J.A. Tea and Cardiovascular Disease. Pharmacol. Res. 2011, 64, 136–145. [Google Scholar] [CrossRef] [PubMed] [Green Version]
- Yuan, J.M.; Sen, C.; Butler, L.M. Tea and cancer prevention: Epidemiological studies. Pharmacol. Res. 2011, 64, 123–135. [Google Scholar] [CrossRef] [PubMed] [Green Version]
- Ho, C.T.; Zheng, X.; Li, S. Tea aroma formation. Food Sci. Hum. Wellness 2015, 4, 9–27. [Google Scholar] [CrossRef] [Green Version]
- Zheng, X.Q.; Li, Q.S.; Xiang, L.P.; Liang, Y.R. Recent Advances in Volatiles of Teas. Molecules 2016, 21, 338. [Google Scholar] [CrossRef] [PubMed]
- Yang, Y.; Zhang, M.; Hua, J.; Deng, Y.; Jiang, Y.; Li, J.; Wang, J.; Yuan, H.; Dong, C. Quantitation of pyrazines in roasted green tea by infrared-assisted extraction coupled to headspace solid-phase microextraction in combination with GCQqQ-MS/MS. Food Res. Int. 2020, 134, 109167. [Google Scholar] [CrossRef] [PubMed]
- Mizukami, Y.; Sawai, Y.; Yamaguchi, Y. Changes in the Concentrations of Acrylamide, Selected Odorants, and Catechins Caused by Roasting of Green Tea. J. Agric. Food. Chem. 2008, 56, 2154–2159. [Google Scholar] [CrossRef] [PubMed]
- Nunes, L.; Martins, E.; Perrone, I.T.; Fernandes de Carvalho, A. The Maillard Reaction in Powdered Infant Formula. J. Food Nutr. Res. 2019, 7, 33–40. [Google Scholar] [CrossRef] [Green Version]
- Wang, L.F.; Lee, J.Y.; Chung, J.O.; Baik, J.H.; So, S.; Park, S.K. Discrimination of teas with different degrees of fermentation by SPME–GC analysis of the characteristic volatile flavour compounds. Food. Chem. 2008, 109, 196–206. [Google Scholar] [CrossRef] [PubMed]
- Gotti, R.; Furlanetto, S.; Lanteri, S.; Olmo, S.; Ragaini, S.; Cavrini, V. Differentiation of green tea samples by chiral CD-MEKC analysis of catechins content. Electrophoresis 2009, 30, 2922–2930. [Google Scholar] [CrossRef] [PubMed]
- IARC. Monograph on the Evaluation of Carcinogen Risk to Humans: Some Industrial Chemicals; International Agency for Research on Cancer (IARC): Lyon, France, 1994; Volume 60, pp. 389–433. [Google Scholar]
- Kumazawa, K.; Masuda, H. Identification of Potent Odorants in Different Green Tea Varieties Using Flavor Dilution Technique. J. Agric. Food Chem. 2002, 50, 5660–5663. [Google Scholar] [CrossRef] [PubMed]
- Cheng, Y.; Tong, H.B.; Blank, I.; Robert, F. Temporal Changes in Aroma Release of Longjing Tea Infusion: Interaction of Volatile and Nonvolatile Tea Components and Formation of 2-Butyl-2-octenal upon Aging. J. Agric. Food Chem. 2008, 56, 2160–2169. [Google Scholar] [CrossRef] [PubMed]
- Baldermann, S.; Yang, Z.; Katsuno, T.; Tu, V.A.; Mase, N.; Nakamura, Y.; Watanabe, N. Discrimination of Green, Oolong, and Black Teas by GC-MS Analysis of Characteristic Volatile Flavor Compounds. Am. J. Anal. Chem. 2014, 5, 620–632. [Google Scholar] [CrossRef] [Green Version]
- Wu, Y.; Lv, S.; Lian, M.; Wang, C.; Gao, X.; Meng, O. Study of characteristic aroma components of baked Wujiatai green tea by HS-SPME/GC-MS combined with principal component analysis. CYTA J. Food 2016, 14, 423–432. [Google Scholar] [CrossRef] [Green Version]
- Ye, N.; Zhang, L.; Gu, X. Discrimination of Green Teas from Different Geographical Origins by Using HS-SPME/GC–MS and Pattern Recognition Methods. Food Anal. Methods 2012, 5, 856–860. [Google Scholar] [CrossRef]
- Chen, M.; Guo, L.; Zhou, H.; Guo, Y.; Zhang, Y.; Lin, Z.; Sun, M.; Zeng, W.; Wu, H. Absolute Quantitative Volatile Measurement from Fresh Tea Leaves and the Derived Teas Revealed Contributions of Postharvest Synthesis of Endogenous Volatiles for the Aroma Quality of Made Teas. Appl. Sci. 2021, 11, 613. [Google Scholar] [CrossRef]
- Kumazawa, K.; Masuda, H. Identification of Potent Odorants in Japanese Green Tea (Sencha). J. Agric. Food Chem. 1999, 47, 5169–5172. [Google Scholar] [CrossRef] [PubMed]
- Shen, J.X.; Rana, M.M.; Liu, G.F.; Ling, T.J.; Gruber, M.Y.; Wei, S. Differential Contribution of Jasmine Floral Volatiles to the Aroma of Scented Green Tea. J. Food Qual. 2017, 2017, 5849501. [Google Scholar] [CrossRef] [Green Version]
Figure 1.
Different tea production processes.

Figure 2.
Effects of roasting temperature on the content of the odorants 2,4-heptadienal (A), β-damascenone (B), β-ionone (C), linalool (D) and indole (E). The roasting treatment and preparation for tea infusions were repeated three times. Each data value is expressed as mean ± standard deviation (n = 3).

Figure 3.
Effects of roasting temperature on the content of the selected pyrazines 2-ethyl-6-methyl-pyrazine (A), 2-ethyl-5-methyl-pyrazine (B), 2-ethyl-3,6-dimethyl-pirazine (C), 2-ethyl-3,5-dimethyl-pyrazine (D) and 2-acetyl-pyrazine (E). The roasting treatment and preparation for tea infusions were repeated three times. Each data value is expressed as mean ± standard deviation (n = 3).


Table 1.
VFC names, molecular mass and qualifier and quantifier ions selected for quantitative analysis in SIM mode.
Table 1.
VFC names, molecular mass and qualifier and quantifier ions selected for quantitative analysis in SIM mode.
| Compound | Molecular Mass | Selected Ions (Qualifier/Quantifier) |
|---|---|---|
| 2,4-heptadienal | 110.1 | 110.1/81.0 |
| β-damascenone | 192.3 | 192.3/69.2 |
| Linalool | 154.2 | 136.2/71.1 |
| Indole | 117.1 | 117.1/90.0 |
| 2-ethyl-6-methyl-pyrazine | 122.2 | 121.2/94.1 |
| 2-ethyl-5-methyl-pyrazine | 122,2 | 121.2/56.1 |
| 2-ethyl-3,6-dimethyl-pirazine | 136.2 | 135.2/108.1 |
| 2-ethyl-3,5-dimethyl-pyrazine | 136.2 | 135.2/108.1 |
| 2-acetyl-pyrazine | 122.1 | 122.1/43.0 |
| linalool-d5 | 159.23 | 141.3/74.2 |
| hexanal-d12 | 112.2 | 92.2/47.2 |
Table 2.
Linear retention index (RI), odor quality and relative percentage of key odorants in representative green teas: Bancha, Bancha Hojicha and roasted Bancha green tea (180 °C).
Table 2.
Linear retention index (RI), odor quality and relative percentage of key odorants in representative green teas: Bancha, Bancha Hojicha and roasted Bancha green tea (180 °C).
| No. | RI a | Name | Odor Quality | Relative Percentage Content (%) c | ||
|---|---|---|---|---|---|---|
| Bancha | Bancha Hojicha | Bancha 180 °C | ||||
| 1 | 826 | Methylpyrazine | Roasty, sweet | 0.01 | 0.02 | 0.01 |
| 830 | Hexanal | Fruity | 0.08 | 0.10 | 0.11 | |
| 830 | Hexanal-d12 (IL-IS) | |||||
| 2 | 915 | Dimethylpyrazine | Roasty, sweet | 0.00 | 0.05 | 0.09 |
| 3 | 916 | Ethylpyrazine | Roasty, sweet | 0.00 | 0.03 | 0.05 |
| 4 | 965 | 1,5-octadien-3-one | Floral | 0.23 | 0.41 | 0.09 |
| 982 | 2,3-octadione | 0.06 | 0.12 | 0.02 | ||
| 5 | 1005 b | 2-ethyl-6-methylpyrazine | Roasty, sweet | 0.61 | 1.10 | 1.50 |
| 6 | 1007 b | 2-ethyl-5-methylpyrazine | Roasty, sweet | 1.01 | 1.20 | 1.74 |
| 1021 b | Limonene | Lemon, citrus | 2.01 | 0.83 | 1.10 | |
| 7 | 1052 b | 2-ethyl-3,6-dimethylpyrazine | Roasty, sweet | 0.00 | 3.55 | 3.92 |
| 8 | 1055 b | 2-ethyl-3,5-dimethylpyrazine | Roasty, sweet | 0.62 | 1.52 | 2.21 |
| 9 | 1073 b | Linalool oxide | Floral, sweet | 0.85 | 1.28 | 1.07 |
| 10 | 1088 b | 2,4-heptadienal | Fatty | 0.26 | 0.98 | 1.54 |
| 11 | 1097 b | Linalool | Floral sweet | 3.55 | 4.39 | 3.56 |
| 1097 | Linalool-d5 (IL-IS) | |||||
| 1099 | Nonanal | Grassy | 2.31 | 1.25 | 1.03 | |
| 12 | 1101 b | Acetylpyrazine | Nutty | 0.85 | 3.52 | 4.03 |
| 13 | 1125 | 2,6-nonadienal | Fatty, cucumber-like | 0.42 | 0.67 | 4.87 |
| 1256 b | Geraniol | Floral, sweet | 4.70 | 10.03 | 14.65 | |
| 15 | 1355 b | β-damascenone | Floral, honey-like | 1.98 | 1.77 | 0.32 |
| 16 | 1362 b | β-damascone | Sweet, honey-like | 0.45 | 0.22 | 0.20 |
| 1371 | Benzyl alcohol | Sweet | 0.49 | 0.23 | 0.54 | |
| 1397 | cis-jasmone | Floral | 1.70 | 1.23 | 1.02 | |
| 17 | 1431 b | β-ionone | Woody, floral, violet-like | 5.07 | 2.73 | 2.12 |
| 1443 | Dodecanal | Citrus | 1.50 | 3.15 | 3.43 | |
| 18 | 1465 b | Eugenol | Spicy | 0.40 | 0.53 | 0.99 |
| 19 | 1493 b | Indole | Animal-like | 3.85 | 3.56 | 4.87 |
| 1519 | δ-cadinene | Spicy, woody | 0.65 | 1.06 | 0.88 | |
| 1556 | Nerolidol | Floral, fruity | 3.02 | 2.55 | 3.98 | |
| 2063 | Phytol | Floral | 5.99 | 6.78 | 6.03 | |
a RI, retention index as determined on HP-5MS column using a homologous series of n-alkanes (C8–C40). b Determined by injecting reference standard. c The relative percentages represent the average of 3 samples of each type of tea, with an RSD% between 10 and 35.
Table 3.
Linearity data (n = 3). Linear concentration range 0.02–2.0 µg/mL.
| VCF | Water | Green Tea | |||
|---|---|---|---|---|---|
| Slope (±sd) | r2 | LOQ (µg/mL) | Slope (±sd) | r2 | |
| 2,4-heptadienal | 14.2 (±1.6) | 0.986 | 0.005 | 11.4 (±0.9) | 0.986 |
| β-damascenone | 1.0 (±0.2) | 0.987 | 0.008 | 1.1 (±0.5) | 0.981 |
| β-ionone | 7.4 (±0.9) | 0.995 | 0.037 | 7.9 (±1.2) | 0.989 |
| Linalool | 11.1 (±1.9) | 0.999 | 0.031 | 10.1 (±1.5) | 0.996 |
| Indole | 12.7 (±1.5) | 0.998 | 0.009 | 11.6 (±2.0) | 0.994 |
| 2-ethyl-6-methyl-pyrazine | 8.9 (±0.8) | 0.994 | 0.010 | 9.8 (±1.0) | 0.989 |
| 2-ethyl-5-methyl-pyrazine | 9.3 (±1.4) | 0.994 | 0.011 | 11.7 (±1.9) | 0.991 |
| 2-ethyl-3,6-dimethyl-pyrazine | 7.5 (±1.9) | 0.998 | 0.032 | 9.3 (±0.8) | 0.989 |
| 2-ethyl-3,5-dimethylpyrazine | 7.2 (±1.2) | 0.997 | 0.040 | 8.5 (±1.3) | 0.988 |
| acetyl-pyrazine | 8.4 (±1.3) | 0.999 | 0.023 | 9.0 (±0.9) | 0.989 |
Table 4.
Accuracy data from recovery experiments (n = 3) and precision data (intra-day precision, n = 6, inter-day precision, n = 18).
Table 4.
Accuracy data from recovery experiments (n = 3) and precision data (intra-day precision, n = 6, inter-day precision, n = 18).
| VFC | % Recovery (±CV%) | Precision (CV%) | |||
|---|---|---|---|---|---|
| Standard Addition (μg/mL) | |||||
| 1.0 | 5.0 | 20.0 | Intra-day | Inter-day | |
| 2,4-heptadienal | 86.18 (±9.06) | 85.10 (±10.92) | 88.70 (±7.73) | 4.58 | 8.42 |
| β-damascenone | 82.25 (±10.05) | 79.08 (±9.77) | 82.02 (±11.23) | 9.71 | 10.37 |
| β-ionone | 88.45 (±8.15) | 87.65 (±7.85) | 87.98 (±9.05) | 3.12 | 6.98 |
| Linalool | 90.08 (±7.12) | 93.44 (±6.76) | 94.13 (±5.26) | 3.60 | 8.67 |
| Indole | 89.16 (±4.08) | 93.21 (±5.26) | 91.09 (±4.78) | 9.76 | 8.25 |
| 2-ethyl-6-methyl-pyrazine | 95.08 (±7.35) | 94.99 (±6.12) | 95.76 (±6.06) | 4.57 | 5.01 |
| 2-ethyl-5-methyl-pyrazine | 97.05 (±9.10) | 94.55 (±3.47) | 96.43 (±5.12) | 6.14 | 8.04 |
| 2-ethyl-3,6-dimethylpyrazine | 91.21 (±6.35) | 90.35 (±3.30) | 93.00 (±4.58) | 4.01 | 8.53 |
| 2-ethyl-3,5-dimethylpyrazine | 98.75 (±7.21) | 98.54 (±8.01) | 98.31 (±8.65) | 7.15 | 5.98 |
| acetyl-pyrazine | 96.01 (±10.01) | 96.83 (±8.03) | 99.17 (±8.28) | 3.21 | 5.63 |
Publisher’s Note: MDPI stays neutral with regard to jurisdictional claims in published maps and institutional affiliations. |
© 2021 by the authors. Licensee MDPI, Basel, Switzerland. This article is an open access article distributed under the terms and conditions of the Creative Commons Attribution (CC BY) license (https://creativecommons.org/licenses/by/4.0/).
Share and Cite
MDPI and ACS Style
Gotti, R.; Leoni, A.; Fiori, J. Evaluation of Roasting Effect on Selected Green Tea Volatile Flavor Compound and Pyrazine Content by HS-SPME GC-MS. Appl. Sci. 2021, 11, 8217. https://0-doi-org.brum.beds.ac.uk/10.3390/app11178217
AMA Style
Gotti R, Leoni A, Fiori J. Evaluation of Roasting Effect on Selected Green Tea Volatile Flavor Compound and Pyrazine Content by HS-SPME GC-MS. Applied Sciences. 2021; 11(17):8217. https://0-doi-org.brum.beds.ac.uk/10.3390/app11178217
Chicago/Turabian StyleGotti, Roberto, Alberto Leoni, and Jessica Fiori. 2021. "Evaluation of Roasting Effect on Selected Green Tea Volatile Flavor Compound and Pyrazine Content by HS-SPME GC-MS" Applied Sciences 11, no. 17: 8217. https://0-doi-org.brum.beds.ac.uk/10.3390/app11178217
Note that from the first issue of 2016, this journal uses article numbers instead of page numbers. See further details here.