Article

Theoretical Evaluation of Microwave Ablation Applied on Muscle, Fat and Bone: A Numerical Study

1
Department of Internet of Things and Electronic Engineering, School of Computer and Communication Engineering, University of Science and Technology Beijing, Beijing 100083, China
2
Interventional Medicine, China-Japan Friendship Hospital, Beijing 100029, China
3
Department of Thermal Science and Energy Engineering, School of Energy and Environmental Engineering, University of Science and Technology Beijing, Beijing 100083, China
4
Institute of Artificial Intelligence, University of Science and Technology Beijing, Beijing 100083, China
*
Author to whom correspondence should be addressed.
These authors have contributed to this work equally.
Submission received: 9 July 2021 / Revised: 27 August 2021 / Accepted: 1 September 2021 / Published: 6 September 2021
(This article belongs to the Special Issue Nano/Microscale Heat Transfer)

Abstract

:
(1) Background: Microwave ablation (MWA) is a common tumor ablation surgery. Because of the high temperature of the ablation antenna, it is strongly destructive to surrounding vital tissues, resulting in high professional requirements for clinicians. The method used to carry out temperature observation and damage prediction in MWA is significant; (2) Methods: This work employs numerical study to explore temperature distribution of typical tissues in MWA. Firstly, clinical MWA based on isolated biological tissue is implemented. Then, the Pennes models and microwave radiation physics are established based on experimental parameters and existing related research. Initial values and boundary conditions are adjusted to better meet the real clinical materials and experimental conditions. Finally, clinical MWA data test this model. On the premise that the model is matched with clinical MWA, fat and bone are deduced for further heat transfer analysis. (3) Results: Numerical study obtains the temperature distribution of biological tissue in MWA. It observes the heat transfer law of ablation antenna in biological tissue. Additionally, combined with temperature threshold, it generates thermal damage of biological tissues and predicts the possible risks in MWA; (4) Conclusions: This work proposes a numerical study of typical biological tissues. It provides a new theoretical basis for clinically thermal ablation surgery.

1. Introduction

Thermal ablation surgery is an interventional treatment method for tumors [1], commonly including radiofrequency ablation (RFA) [2], and microwave ablation (MWA) [3] et al. They make proteins of tumor cells irreversible through thermal effect, gradually losing cell function until death to achieve the purpose of the treatment [4]. It has become an important minimally invasive technique because of its advantages, such as being minimally invasive, leading to a fast recovery, and having a low cost [5,6]. At present, thermal ablation surgery is mainly based on the operational experience of clinicians [7]. They observe tissue distribution around the tumor using an ultrasound scanner and plan an appropriate ablation antenna path. During the heating process, it is also necessary for operating doctors to continuously detect tissue deformation with the assistance of real-time ultrasound guidance until the lesion is ablated [8]. However, standard scanners cannot immediately observe and predict heat diffusion and conduction around tissues [9]. The ablation antenna has a high local temperature and is strongly destructive to surgical placement areas, which are usually covered with vessels, nerves, and other vital organs [10]. For these reasons, thermal ablation faces the risks of tissue necrosis, vascular rupture, and nerve damage. Therefore, scientific, and effective thermal ablation treatment is a very professional challenge for operating doctors.
A standard method is to obtain temperature data through clinical thermal ablation, and then the temperature change law of biological tissue is analyzed and summarized [11,12]. Many researchers have conducted thermal ablation experiments, such as Lee et al. [13], which concluded radiofrequency ablation (RFA) temperature distribution in patients with malignant biliary strictures. To reduce the related complications, they designed a new RFA with automatic temperature control. Finally, they evaluated practicality in treating patients with malignant biliary strictures through clinical manifestations of 30 patients. Vita et al. [14] performed microwave ablation (MWA) on the bovine femur and tibia to obtain temperature trends during MWA. They designed 40 thermometric points inserted into bone at a specific distance to explore a multi-point temperature study of bone structure. Kadado et al. [15] summarized the relevant research on lumen esophageal temperature measurement in catheter ablation surgery for atrial fibrillation. They compared the incidence of esophageal thermal damage and explored factors that may be associated with increased injury risk. Although clinical experiments can reproduce real surgical scenes and accurately match temperature changes in actual ablation operations, they can only obtain temperature changes in a limited range. Operating doctors rely on ultrasound images to observe tissue deformation. Therefore, it is impossible to establish an intuitive understanding of heat transfer and prediction.
Numerical study has become an important research method in recent years [16,17]. Singh et al. [18] constructed a nonlinear segmented model of blood perfusion to construct a heterogeneous 3D numerical breast model and explore RFA effect on breast tumors with different density levels. They embedded 1.5 cm spherical tumors in different positions to represent early tumors. A proportional integral derivative (PID) controller was used to perform temperature control. Additionally, they combined coupled electric field distribution, Pennes biothermal and the first-order Arrhenius rate equation to perform thermoelectric analysis. Xi et al. [19] established a finite element model using coupled electromagnetic fields and biological heat transfer equations. Compared with conventional microwaves (915 MHz, 2450 MHz), they evaluated the impact of high-frequency microwaves (6 GHz and 18 GHz) on liver cancer treatment. Damage area, temperature rise and characteristics distribution of biological tissue composed of liver and tumor were analyzed, which may represent the reality of cancer treatment. Wang et al. [20] designed a new coaxial multi-slot antenna based on theoretical simulation to solve over-treatment status of existing coaxial slot antennas. They tested ablation process of tumors of different shapes and searched for the best slots number. Pop et al. [21] proposed a computer model for kidney voltage distribution and temperature rise. The model further calculated the size of the RF lesion based on the dynamic process. Its instantaneous temperature and lesion size have been experimentally verified in an isolated porcine kidney model. It can be seen that numerical study is a simulation experiment that works in real scenarios. How to establish a relationship between a simulation experiment and fact, in order to verify model accuracy is a key issue that must be considered regarding numerical study.
To explore the numerical study that was utilized for actual thermal ablation surgery, this work recorded the temperature change at a thermometric point in clinical MWA of biological tissues. Then, a numerical model of tissue with MWA was established based on the existing related researches. Its parameters were corrected in combination with clinical experiment settings and material selection. Finally, the model was verified by comparing it to the temperature distribution from the thermometric point in MWA. Additionally, heat transfer and thermal damage of tissue were further discussed. This work aims to explore heat transfer laws of biological tissues and guide further theoretical and scientific thermal ablation experiments.

2. Materials and Methods

2.1. Matierials

The MWA experiment was completed in the interventional ultrasound department of China–Japan Friendship Hospital. Fresh pork muscle tissue was selected as a thermal ablation object. The MWA ablation equipment was a KY-2000 microwave ablation therapy instrument composed of power supply, microwave emission source, computer control, temperature measurement, radio frequency connection cable, and cooling system. Its frequency was 2450 MHz. The thermometric needle was a thermocouple, KY-CWZ-180 model from Nanjing Kangyou Medical Technology Company Limited (Nanjing, China). The needle of ablation antenna was a KY-2450A-1 model, and its length and radius were 7 ± 2 mm and 1.6 ± 0.2 mm, respectively. The ultrasound scanner used in the auxiliary ablation experiment was ApLio i900 TUS-AI900. Its main parameters were a 12 MHz high-frequency probe, and intelligent dynamic icro Slice imaging technology.

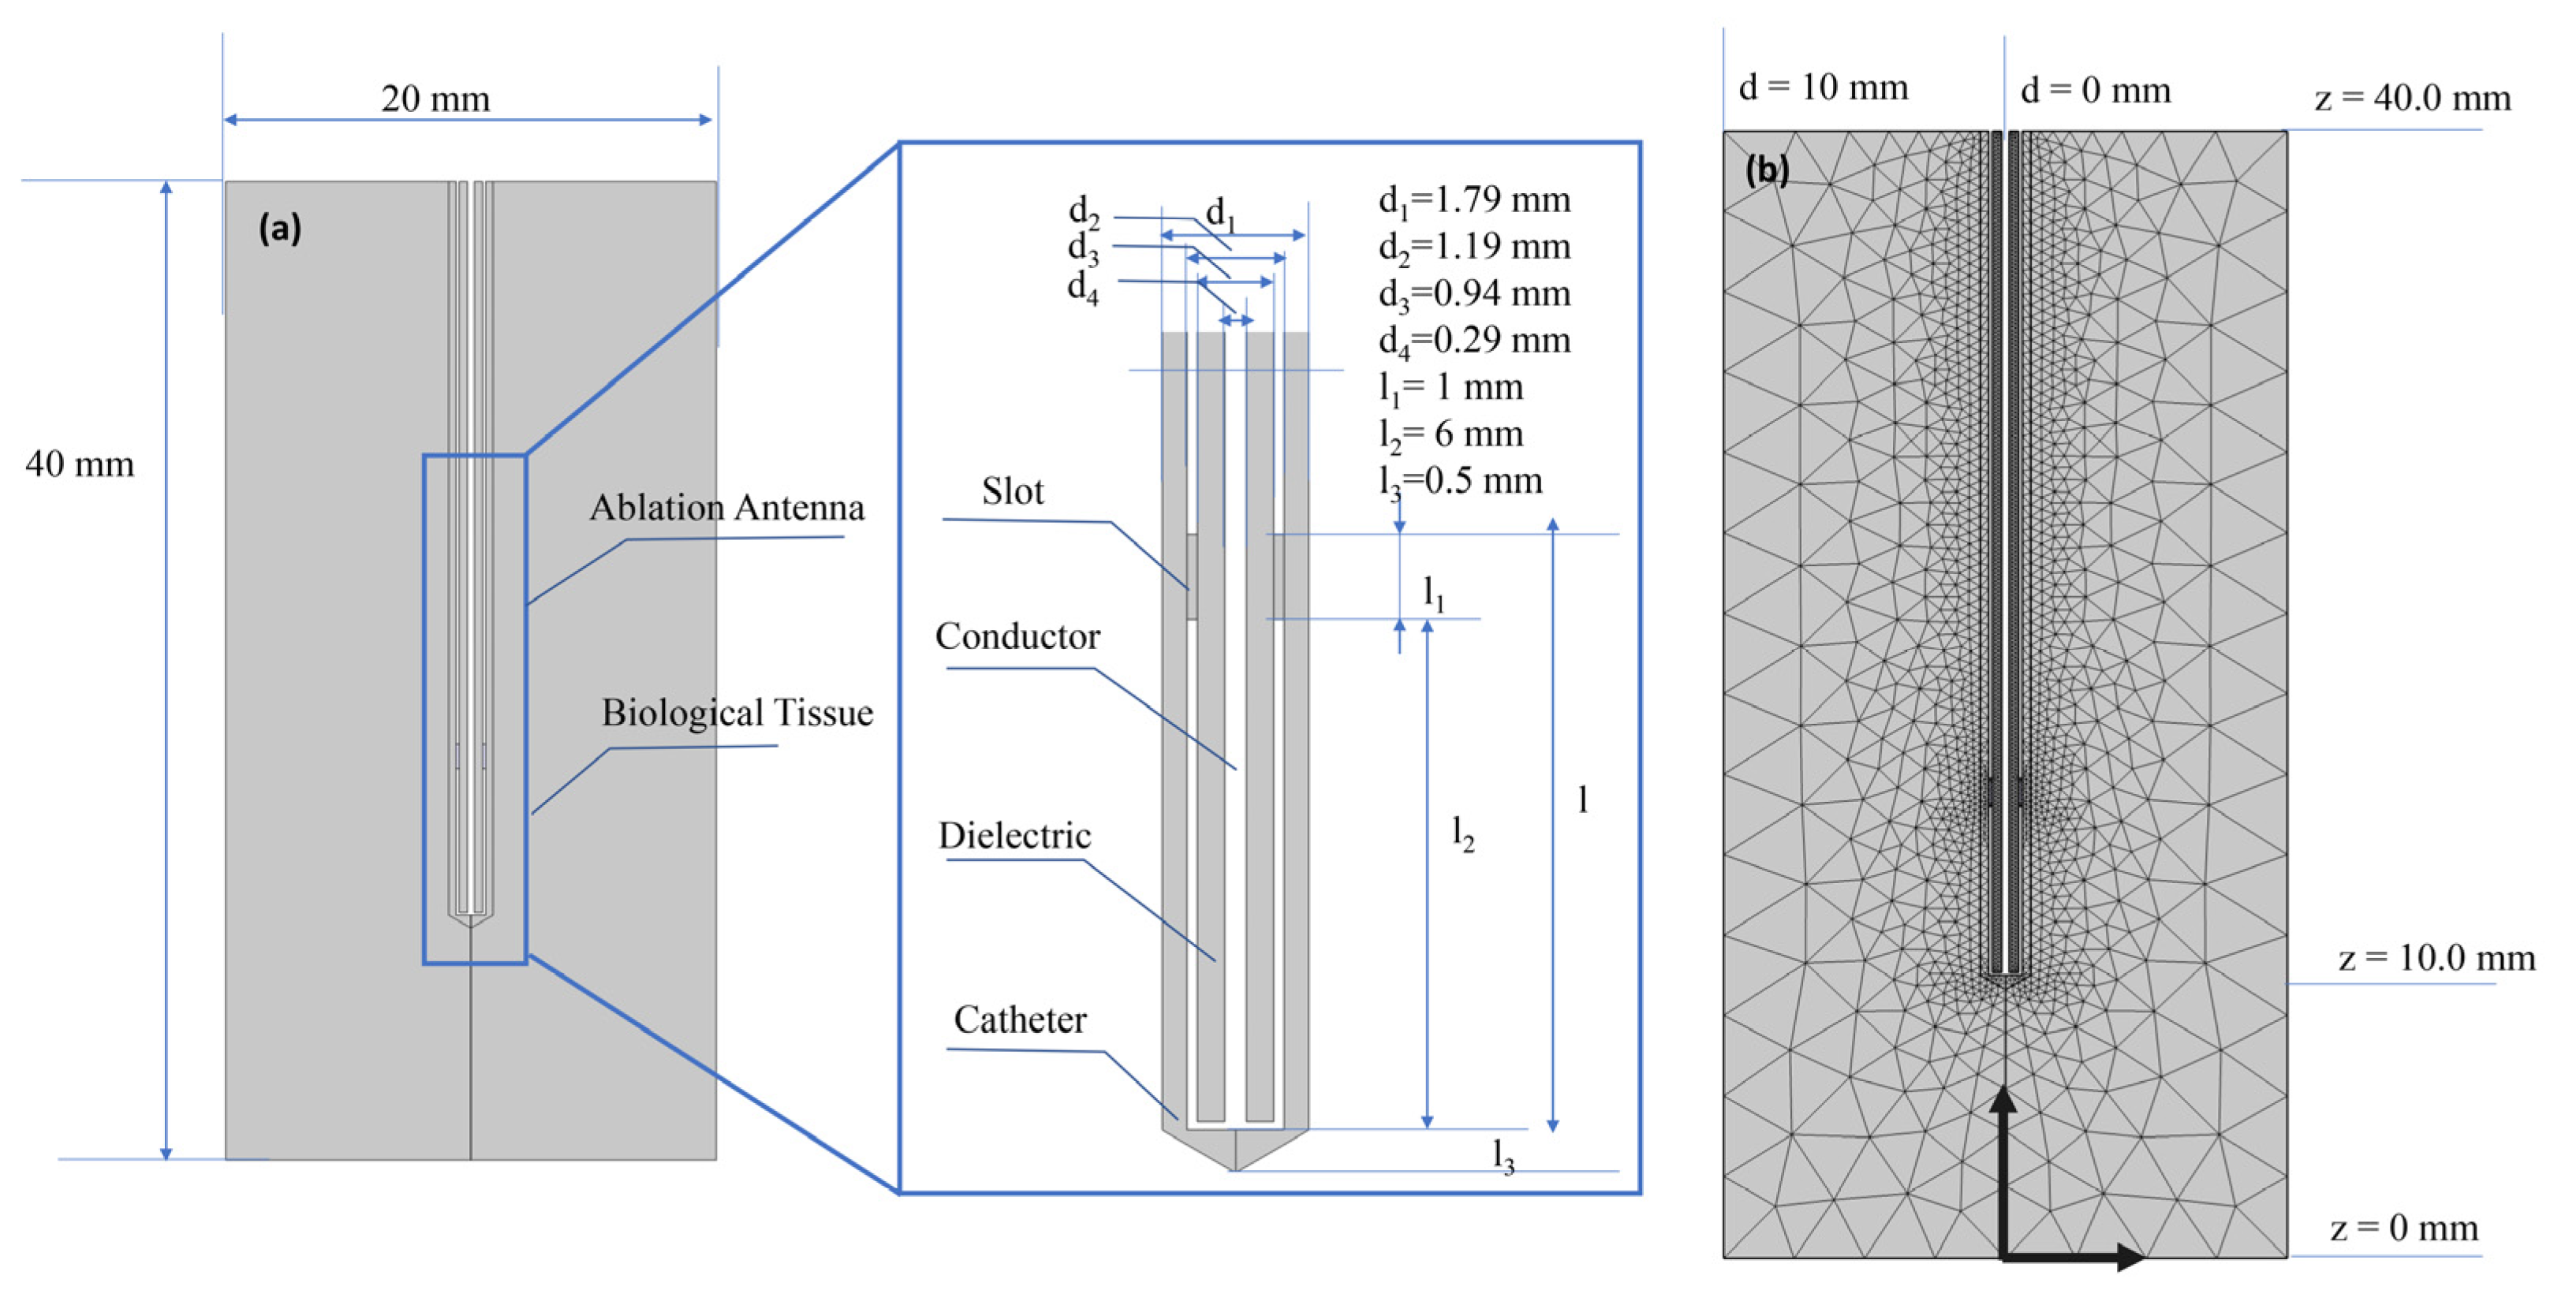
2.2. Numerical Study

MWA involves inserting a slender microwave antenna into tissue and heating. This work’s physical model is composed of a microwave antenna and biological tissue inserted by the antenna (Figure 1). The width and height of biological tissue are 20 mm and 40 mm, respectively. As the distance between the ablation antenna and the thermometric antenna was set as 2 mm, the biological heat transfer focus area was defined as 10 mm from the ablation antenna center. The structure and scale of the ablation antenna are shown in Figure 1a. The antenna’s geometric structure is composed of a slender coaxial cable (slot, conductor, and dielectric) and a conduit with 1.79 mm diameter. The coaxial cable has a slot with 1 mm length at z = 6.5 mm, which is set according to antenna size. Because this model has rotational symmetry, a 2D axisymmetric structure is used to construct geometric shapes to simulate the 3D heat effect. A free triangular grid is used for meshing (Figure 1b), with 3 mm maximum element size, 0.0024 mm minimum element size, 1.3 maximum element growth rate, 0.3 curvature factor, and one narrow area resolution. The established coordinate system is a schematic plan view of cylindrical coordinates, which is used to analyze time-averaged power flow in the next subsection. Due to the larger temperature gradient near the ablation antenna, its grid is denser. As the distance from the antenna became further, the grid gradually became thinner. For ablation antenna, the dielectric part is the key to the transmission of microwave energy. Therefore, a denser grid is used for dielectric, and the maximum unit of the grid was set to 0.15 mm.

2.3. Mathematical Modelling

In coaxial cables, the propagation characteristic of electromagnetic waves is a transverse electromagnetic field (TEM). It is defined that a time-harmonic physical field with complex amplitude contains phase information, so electric and magnetic fields are Equations (1) and (2), respectively.
E = e r C r e j ( ω t k z ) k
H = e φ C r z e j ( ω t k z )
Time-averaged power flow in coaxial cable is Equation (3).
P = r inner r o u t e r Re ( 1 2 E × H * ) 2 π r d r = e Z π C 2 / Z ln ( r o u t e r / r i n n e r )
where r , φ and z are the coordinate variables of the established cylindrical coordinates, and z is also the direction of wave propagation. ω presents the angular frequency, k reveals propagation constant, and Z introduces wave impedance of dielectric. r i n n e r and r o u t e r are the inner radius and outer radius of the dielectric.
In biological tissues, the electric field has a limited axial component, and the magnetic field has an omnidirectional angular direction. In a coaxial cable, the electric field is in the radial direction. While in biological tissues, it is in radial and axial directions. Therefore, an axisymmetric transverse magnetic field (TM) is used to model biological tissues and coaxial cables. Fluctuation direction is scalar H φ . TM is defined in Equation (4).
× ( ( ε r j σ / ω ε 0 ) 1 × H φ ) μ k 0 2 H φ = 0
where H is magnetic field strength, ε and ε 0 are relative permittivity and free space permittivity, and σ reveals electrical conductivity. ω , μ , and k 0 are angular frequency, relative permeability, and space wave number. In this work, ε of the conduit is 2.6, and ε of the dielectric is 2.03.
To eliminate numerical error, the boundary condition of the inner conductor and outer conductor in the coaxial cable is set as an ideal electric conductor, which satisfies n × E = 0 . Boundaries of biological tissues and catheters are considered scattering boundary conditions to eliminate boundary reflections as defined in Equation (5).
n × ( × E ) j k n × ( E × n ) = 0
Central axis (r = 0) of coaxial cable adopts symmetrical boundary conditions:
{ E r = 0 E Z / r = 0
On the top of the dielectric (z = 40 mm, d = 0.135 mm~d = 0.470 mm), the boundary condition is set to the port boundary condition of the microwave power to model the feeding point. Input power is set to be consistent with the clinical experiment, so P i n = 50   W . This method is equivalent to the first-order low-reflection boundary condition using H φ 0 as an input:
n × ε E μ H φ = 2 μ H φ 0
where H φ 0 = P a v Z / π r ln ( r o u t e r / r i n n e r ) / r .
Unlike conventional solid and fluid heat transfer, biological tissues have blood flow, basal metabolism, and flow of body fluids due to vascular network system. Its heterogeneity and anisotropy make the heat transfer model of biological tissue more loaded, so it is also more difficult to simulate than ordinary materials. Some classic heat transfer models are the Weinbaum–Jiji model [22], the Klinger model [23], the Khaled–Vafai model [24], the Pennes model [25], and the Wulff model based on porous media theory [26]. The Pennes model has been widely applied in biological tissue models, and there have been many related studies [27,28,29]. Limitations of Pennes model are:
  • It considers the entire tissue to contain a uniform blood perfusion rate and can not reflect local characteristics;
  • The fact remains that it is challenging to confirm blood perfusion rate of tissue;
  • Numerical simulation of large vessels is affected by blood perfusion rate, so tissue temperature has apparent deviations.
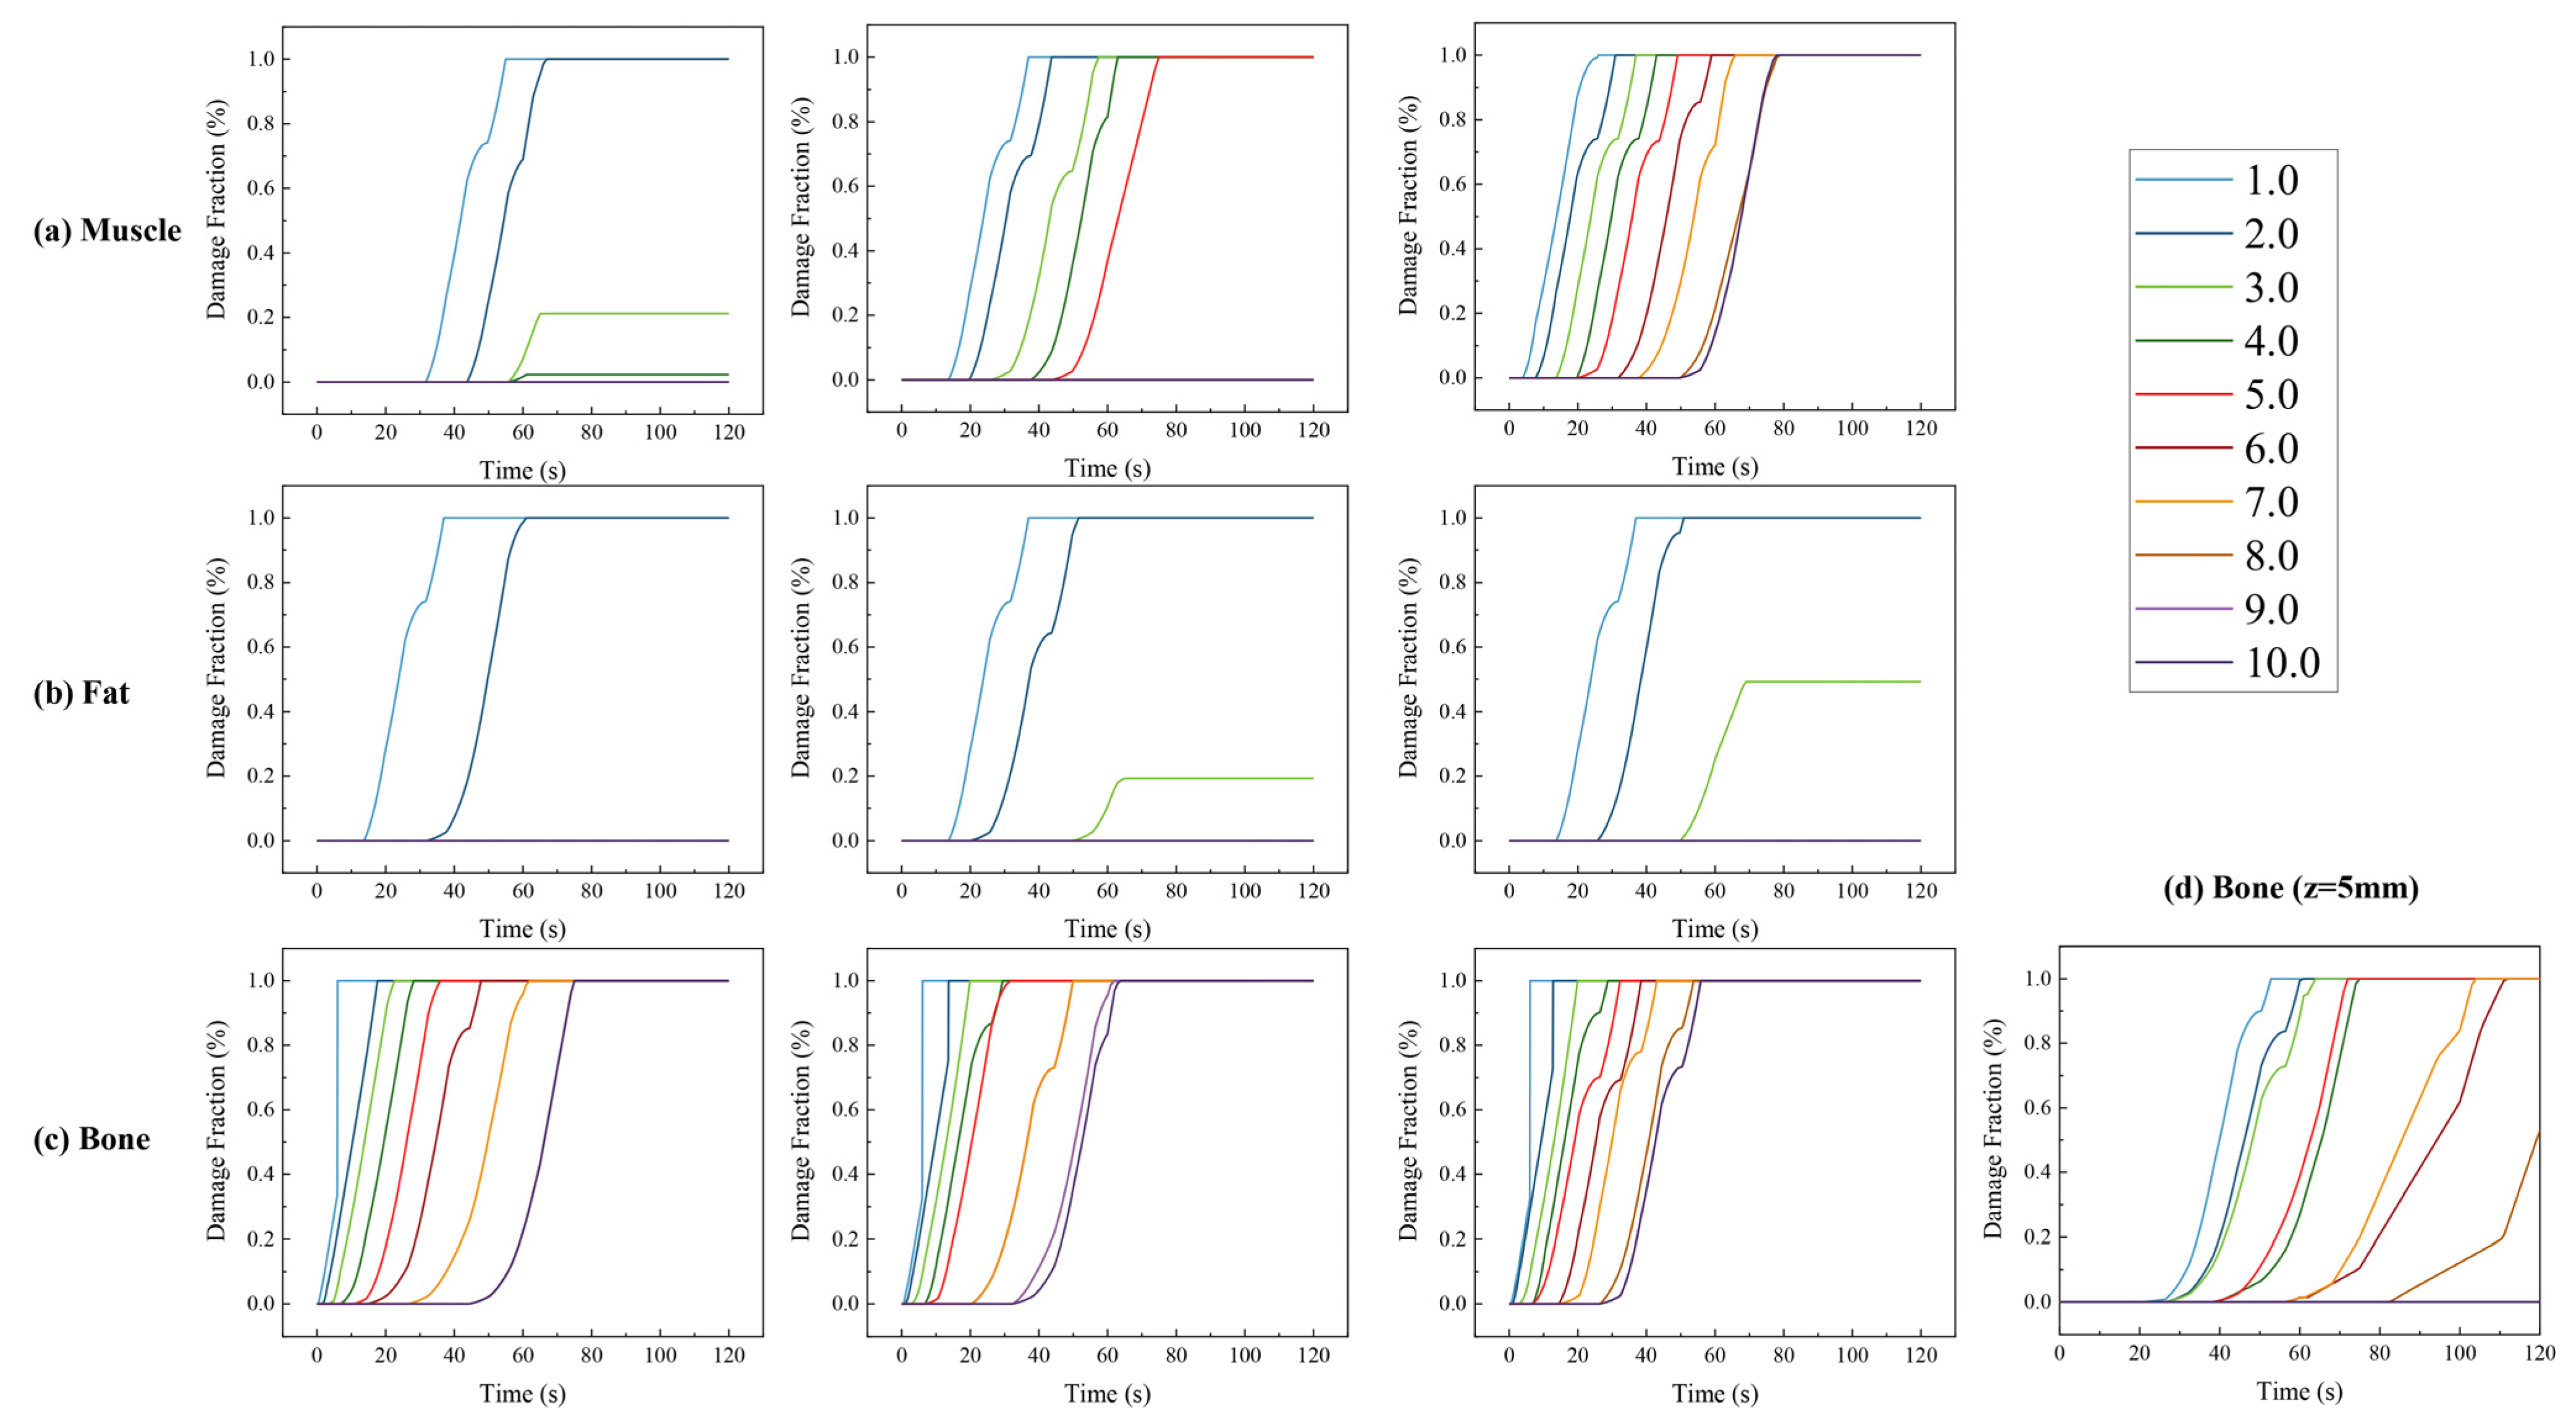
In this work, the model is mainly applied to heat transfer analysis of muscle, fat, and bone. They are all uniform biological tissues and do not contain large vessels. So, a single blood perfusion rate can meet simulation requirements. Additionally, there are enough experiments to measure the blood perfusion rate of three types of tissues. Therefore, the Pennes model is appropriate for this work. Biological tissue properties are shown in Table 1. Theoretically, parameters such as thermal conductivity and electrical conductivity change with the increase of temperature, but there is no consensus on the changes in muscle, fat, and bone parameters. Therefore, fixed parameters are used for simulation in this work. To explore the law of parameter change, we used the trend of liver thermal conductivity with temperature to simulate the temperature and thermal damage distribution during muscle ablation. For related content, please see the supplementary material (Figures S1–S3).
Compared with the standard transient heat transfer equation, the Pennes model adds metabolic heat source, blood perfusion, and microwave heating, which are defined in Equation (8).
ρ C p d T d t = ( k T ) + Q m w + Q m e t + ρ b C p , b ω b ( T b T )
where, ρ is the density of biological tissue, and C p is heat capacity, and therefore, ρ C p presents volume-specific heat of tissue. k is tissue thermal conductivity, and Q m e t and Q m w are tissue metabolism heat production and external microwave heat source. So, ρ b C p , b ω b ( T b T ) is convective cooling of blood perfusion. ρ b C p , b is the volume-specific heat of blood. ω b reveals the blood perfusion rate, and T b is blood temperature entering tissue. The external microwave heat source is the impedance heat generated by the electromagnetic field:
Q m w = 1 2 Re ( ( σ j ω ε ) E × E * )
Biological tissue at r = 0 is set as an axisymmetric boundary, satisfying n × ( K e f f , t T t ) = 0 and n × ( K e f f , b T b ( ρ C p ) b u T b ) = 0 . The contact surface of biological tissue, ablation antenna, and the outer surface of biological tissue are thermally insulated boundaries, which satisfy n × q = 0 .

2.4. Heat Damage

During the heating process, cells in a tissue are exposed to high temperatures. When too much heat energy is absorbed, or critical high temperature is exceeded, the internal liquid will boil and destroy tissue cells, which may cause irreversible damage to the living tissue. This work uses the temperature threshold method [33] to calculate tissue damage fraction based on damage temperature and time.
Tissue damage and necrosis are as follows:
  • Once tissue temperature exceeds the specific damage temperature T d , the tissue will be damaged;
  • When tissue reaches T d temperature and damage time exceeds t d , or tissue temperature exceeds the necrosis temperature T n , tissue is necrotic.
So, fraction of heat damage θ is calculated as follows:
As temperature T satisfies T d < T < T n , damaged tissue indicator α per unit time is equal to the partial derivative of α with time.
α t = 1 t d
So, α is obtained by integrating time on both sides of the equals sign:
α ( t ) = 1 t d 0 t φ d t
where, t d and T are damage time and tissue temperature. φ is defined as Equation (12).
φ = { 1       i f       T > T d 0       e l s e
So, the fraction of heat damage θ = min ( α , 1 ) .
Moreover, if temperature T satisfies T > T n , α = 1 . Therefore, θ = α = 1 . In summary, fraction of heat damage θ is as follows Equation (13).
θ = { 1                                       T > T n min ( α , 1 )       T d < T < T n
Based on [34,35,36] and clinical experience, the damage temperature T d is set to 50 °C, and necrosis temperature T n is set to 80 °C. It is assumed that damage occurs when the tissue is exposed to this temperature for 15 s.

3. Results

Three clinicians completed the MWA clinical experiment. One of the doctors completed a puncture and adjustment of biological tissues using the observation from an ultrasound scanner. Another doctor operated an ultrasound scanner to measure the distance between the ablation antenna and thermometric antenna, and assisted the first doctor in completing the ablation antenna and thermometric antenna. The last doctor operated on MWA ablation equipment. He set the selected power and timing, and implemented heating of the ablation antenna. Before the experiment, biological tissue was placed flat on the operating table, and an ultrasound probe was used to move vertically downward on the tissue surface for observation. Then, the ablation antenna and thermometric antenna were pierced in parallel from the horizontal plane of tissue, respectively. The distance between two antennas was observed and measured using an ultrasound scanner. To attain a useful temperature and to protect thermometric antenna, two antennas were kept at a 2 mm distance. Finally, 50 W power and 60 s heating time were set. After heating was over, another 60 s was recorded as a cooling period.
To test the reliability of the numerical model, it was compared with thermal law obtained from MWA clinical experiment. In the numerical model, starting from the central axis of the ablation antenna, a series of thermometric points were established at a 2 mm distance (z = 10 mm~z = 22 mm). All thermometric points were consistent with the clinical operation method. They were first heated at 50 W microwave power for the 60 s and kept a 60 s cooling period. Figure 2 records the temperature changes in all thermometric points in 120 s. The red dotted line represents MWA temperature. It can be seen that the maximum temperature obtained by MWA is almost the same as the maximum temperature obtained by the numerical model at 8 mm and 10 mm. So, it can be judged that the actual thermometric position of the thermometric antenna is approximately within this interval. During the heating process, the surface water evaporation process of the isolated tissue will be strengthened, causing the boundary conditions to change, which may result in the highest temperature of MWA to be reduced within a small range. From these conclusions, the temperature distribution of the numerical model has similarities with the MWA experiment. A numerical model has reliability under ideal conditions.

4. Discussion

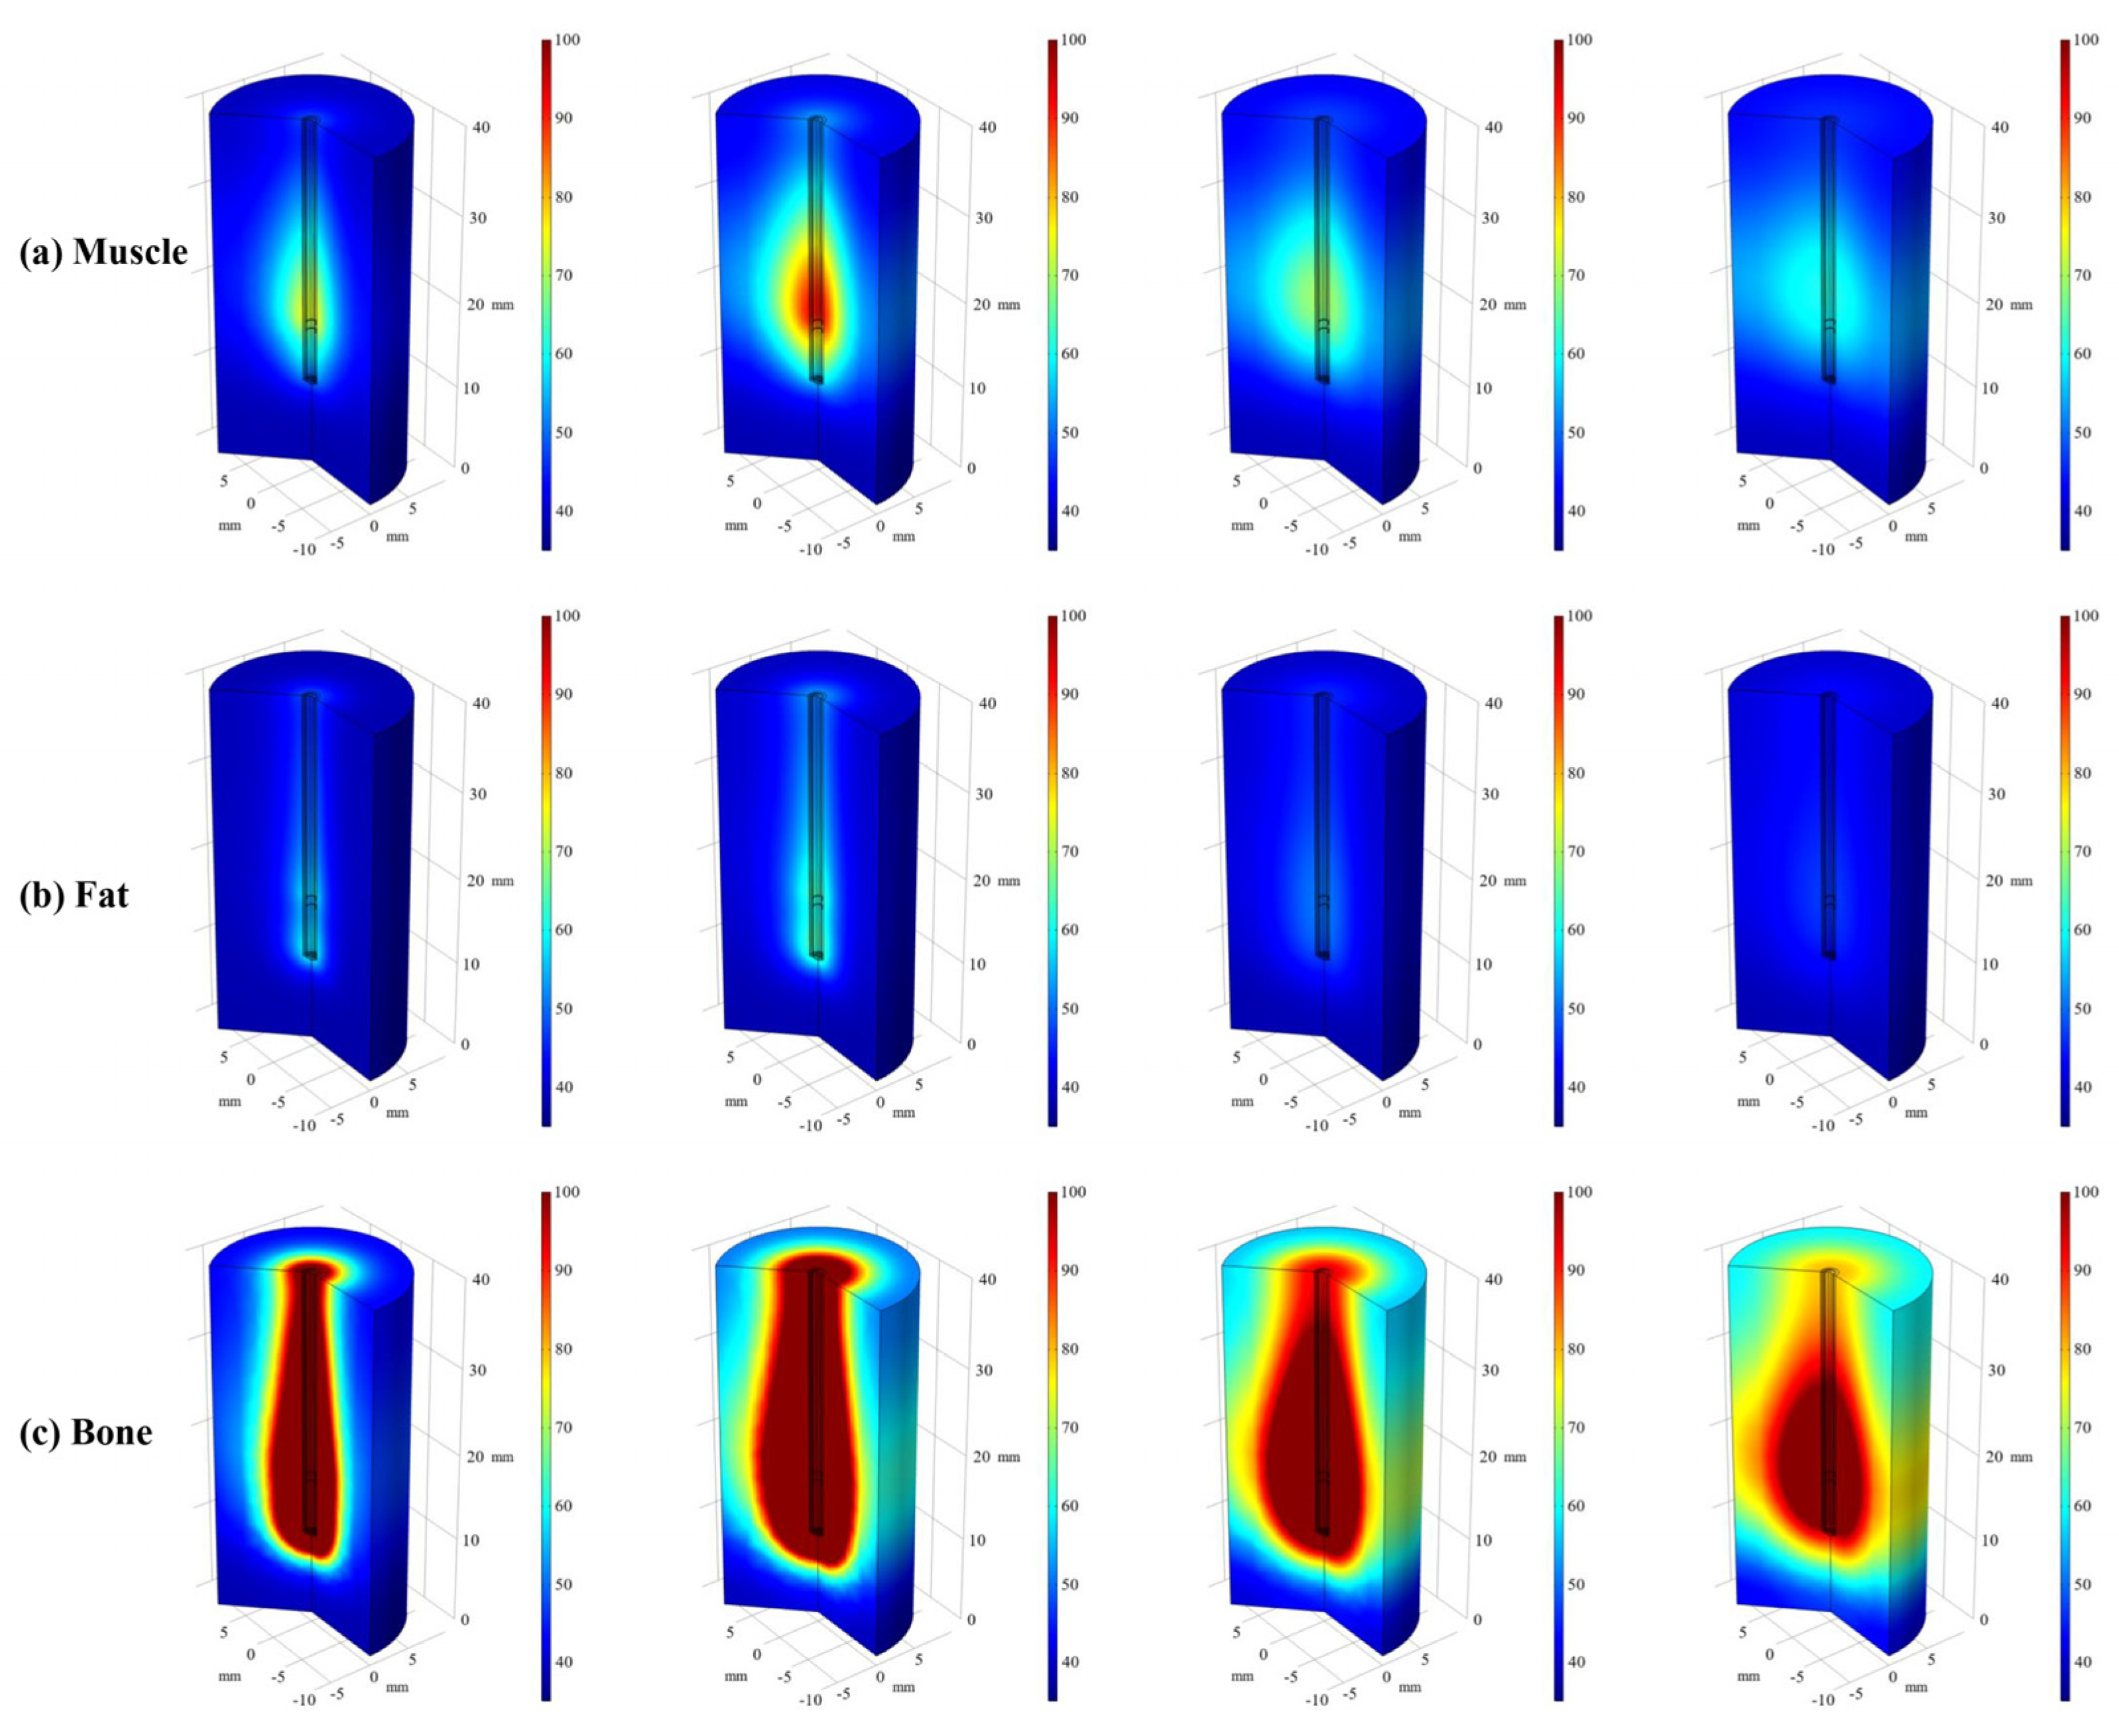
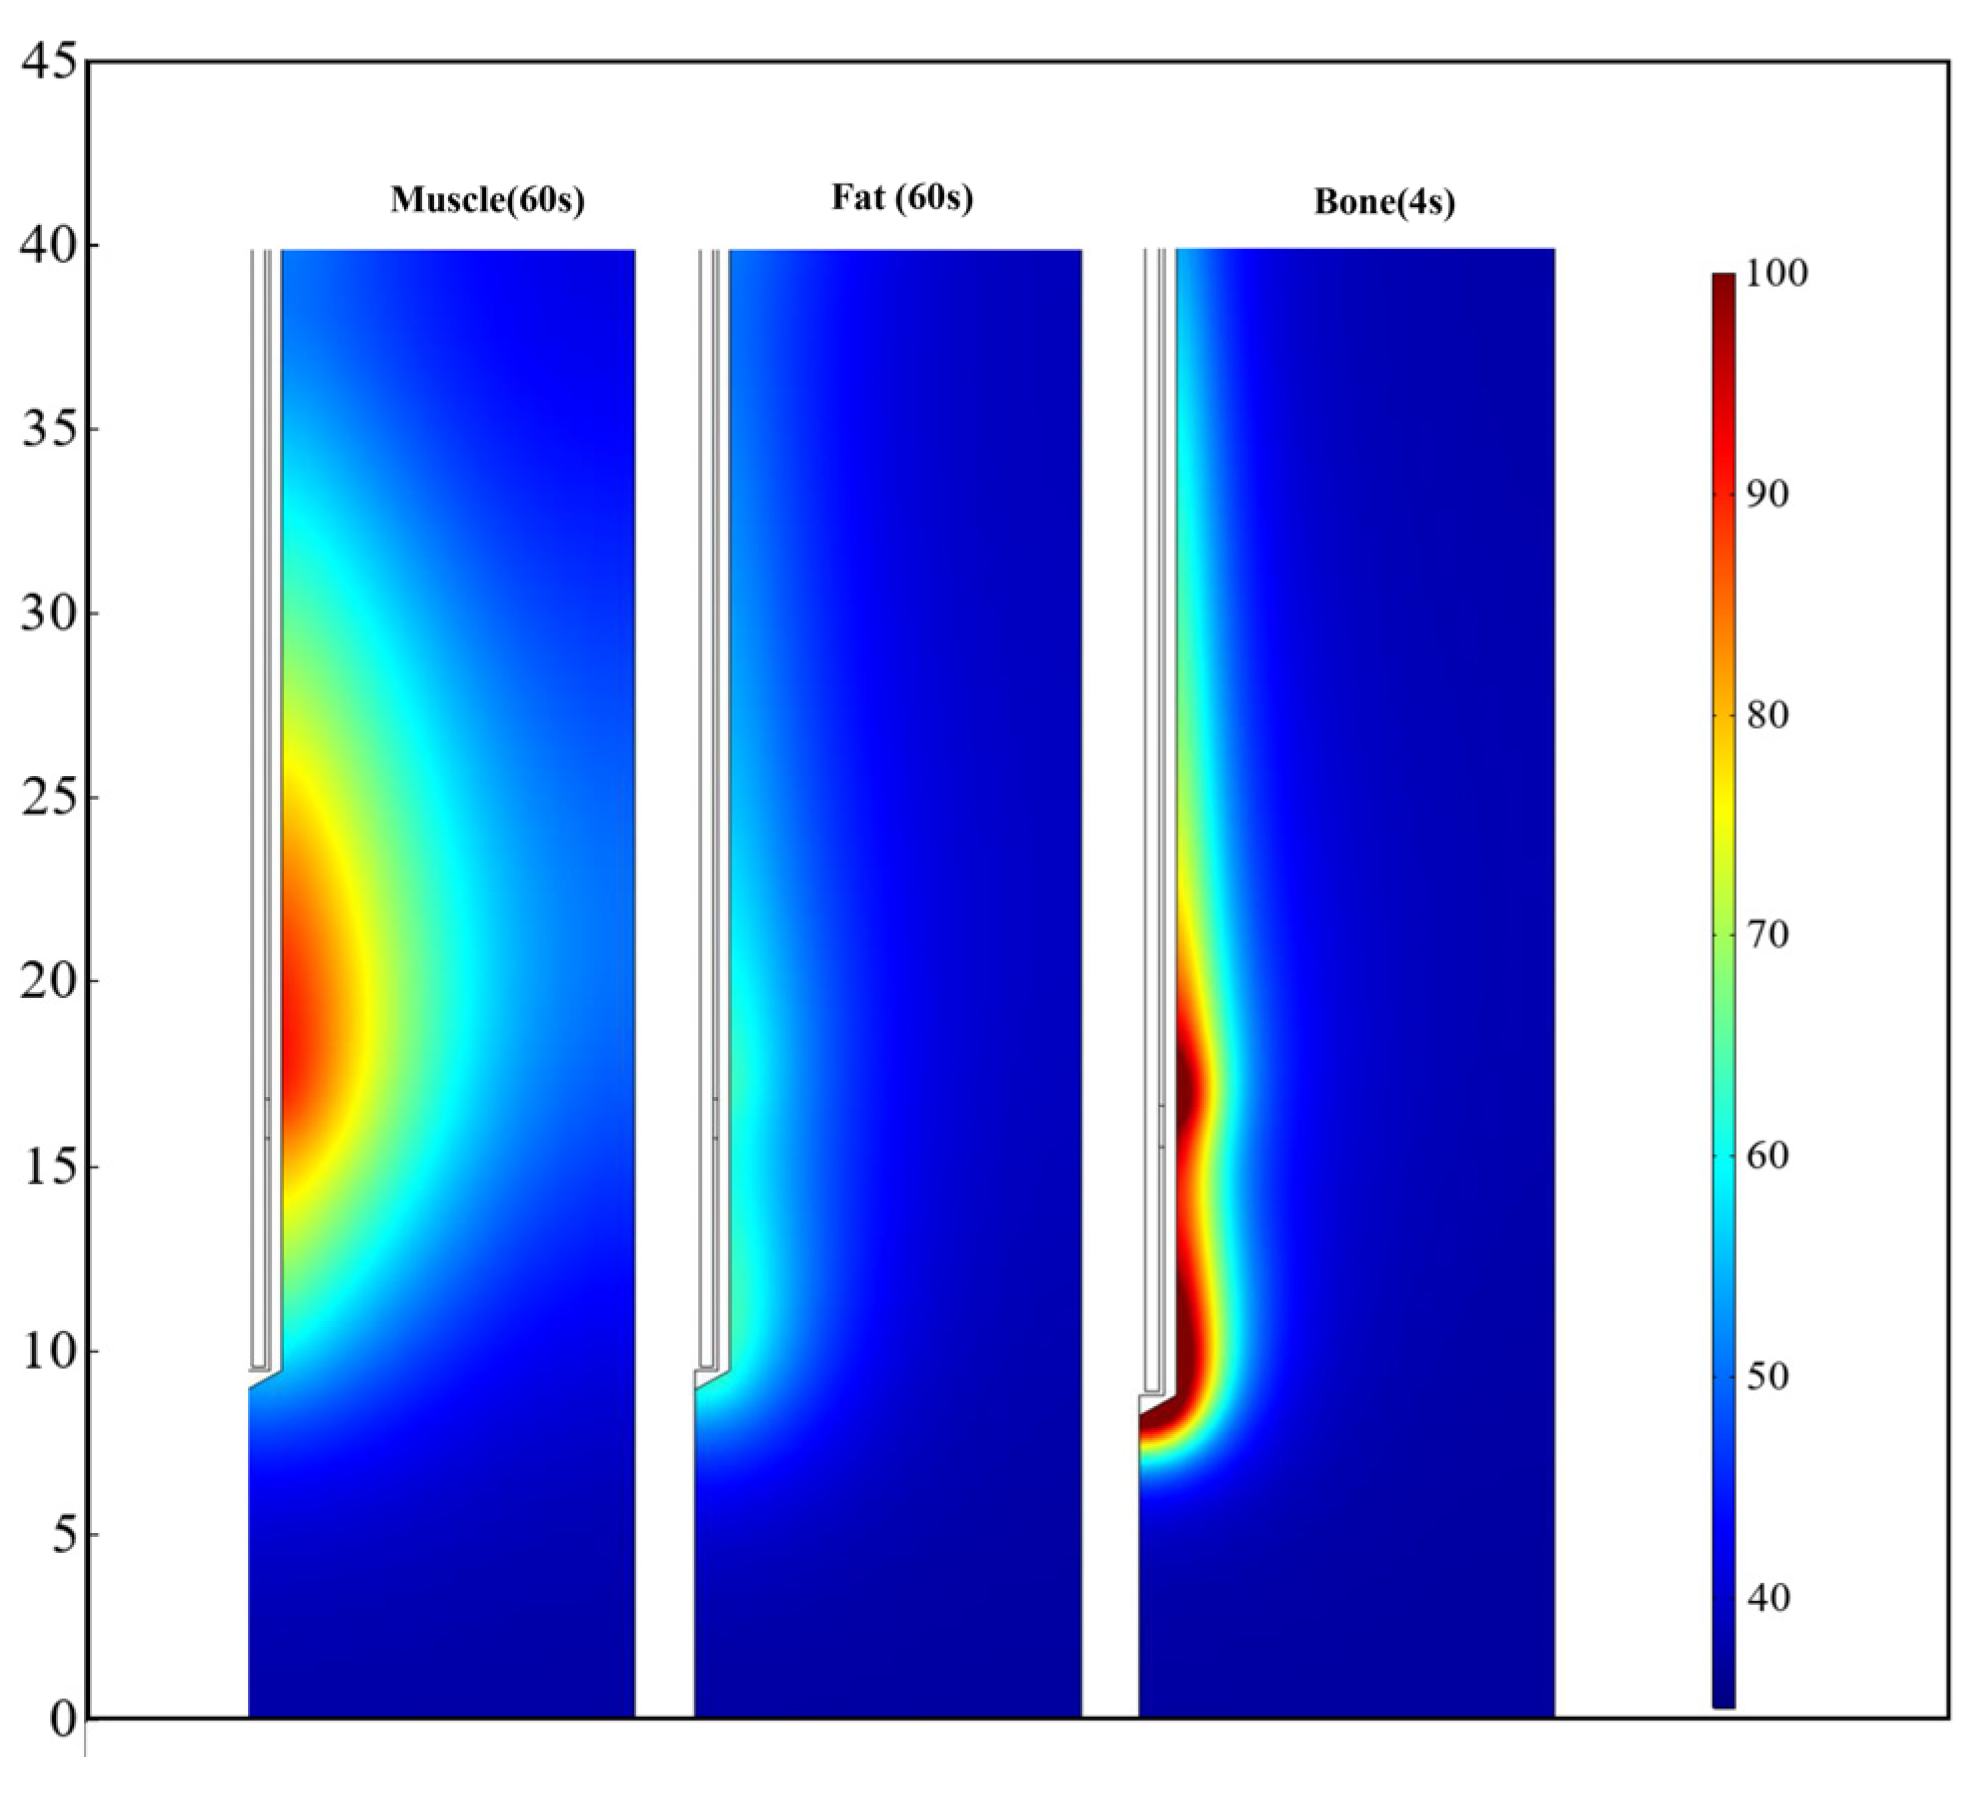
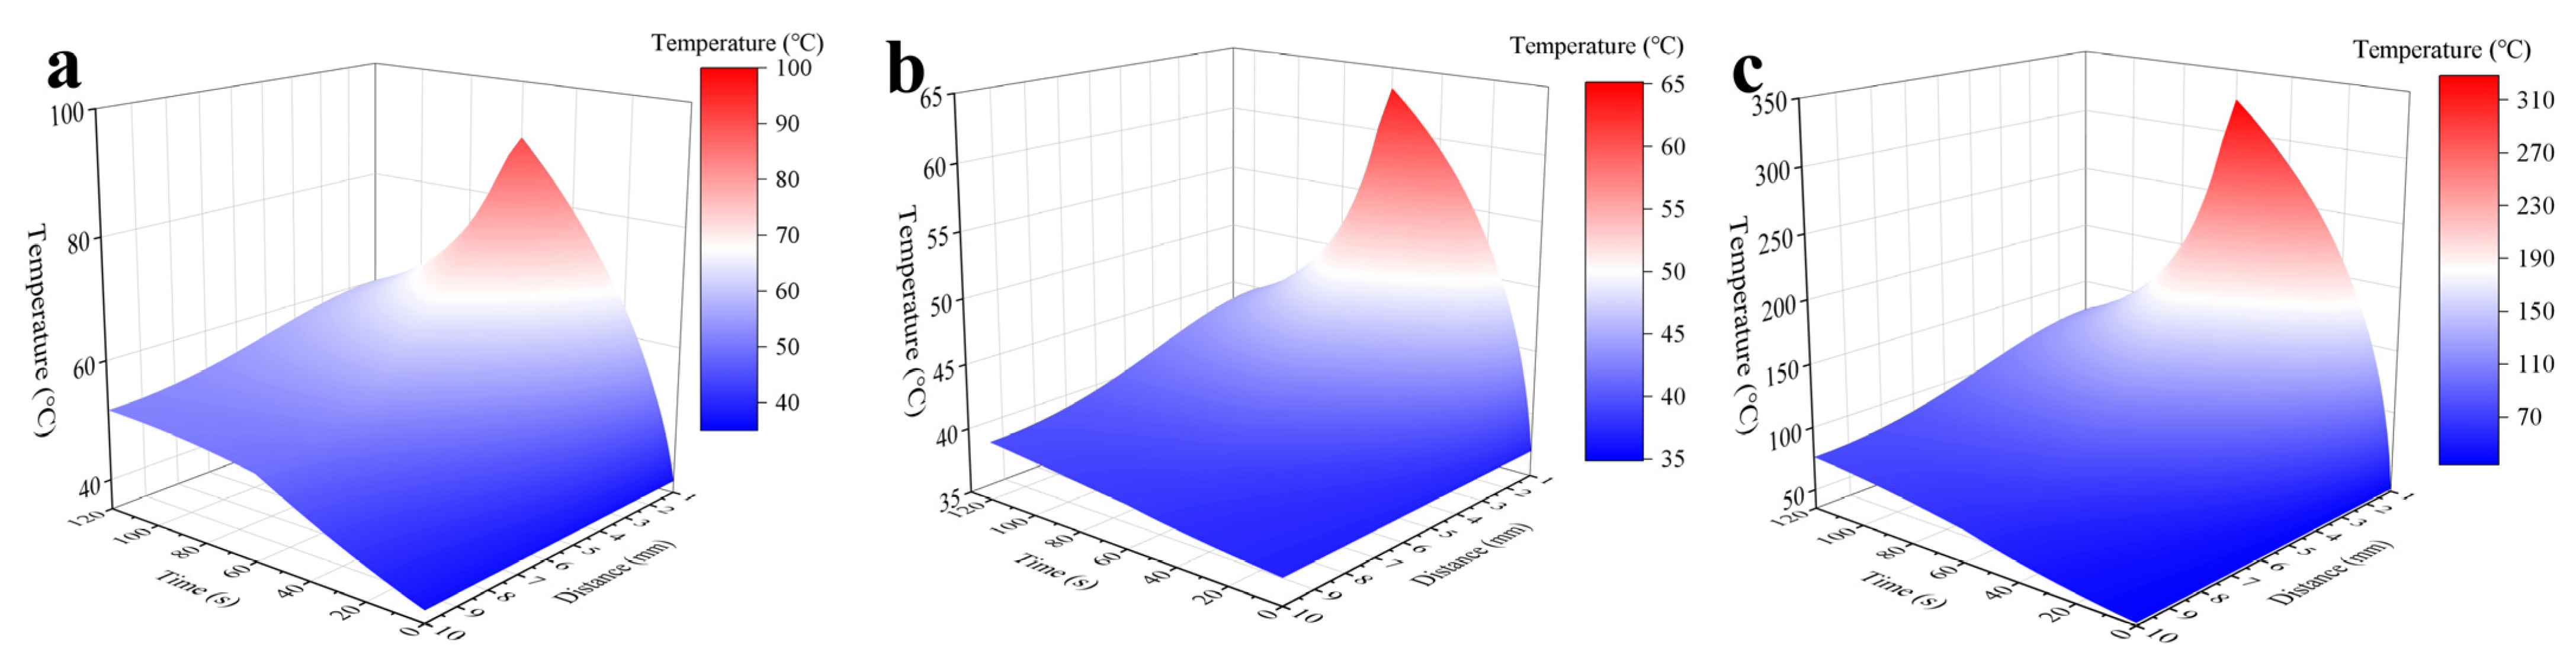
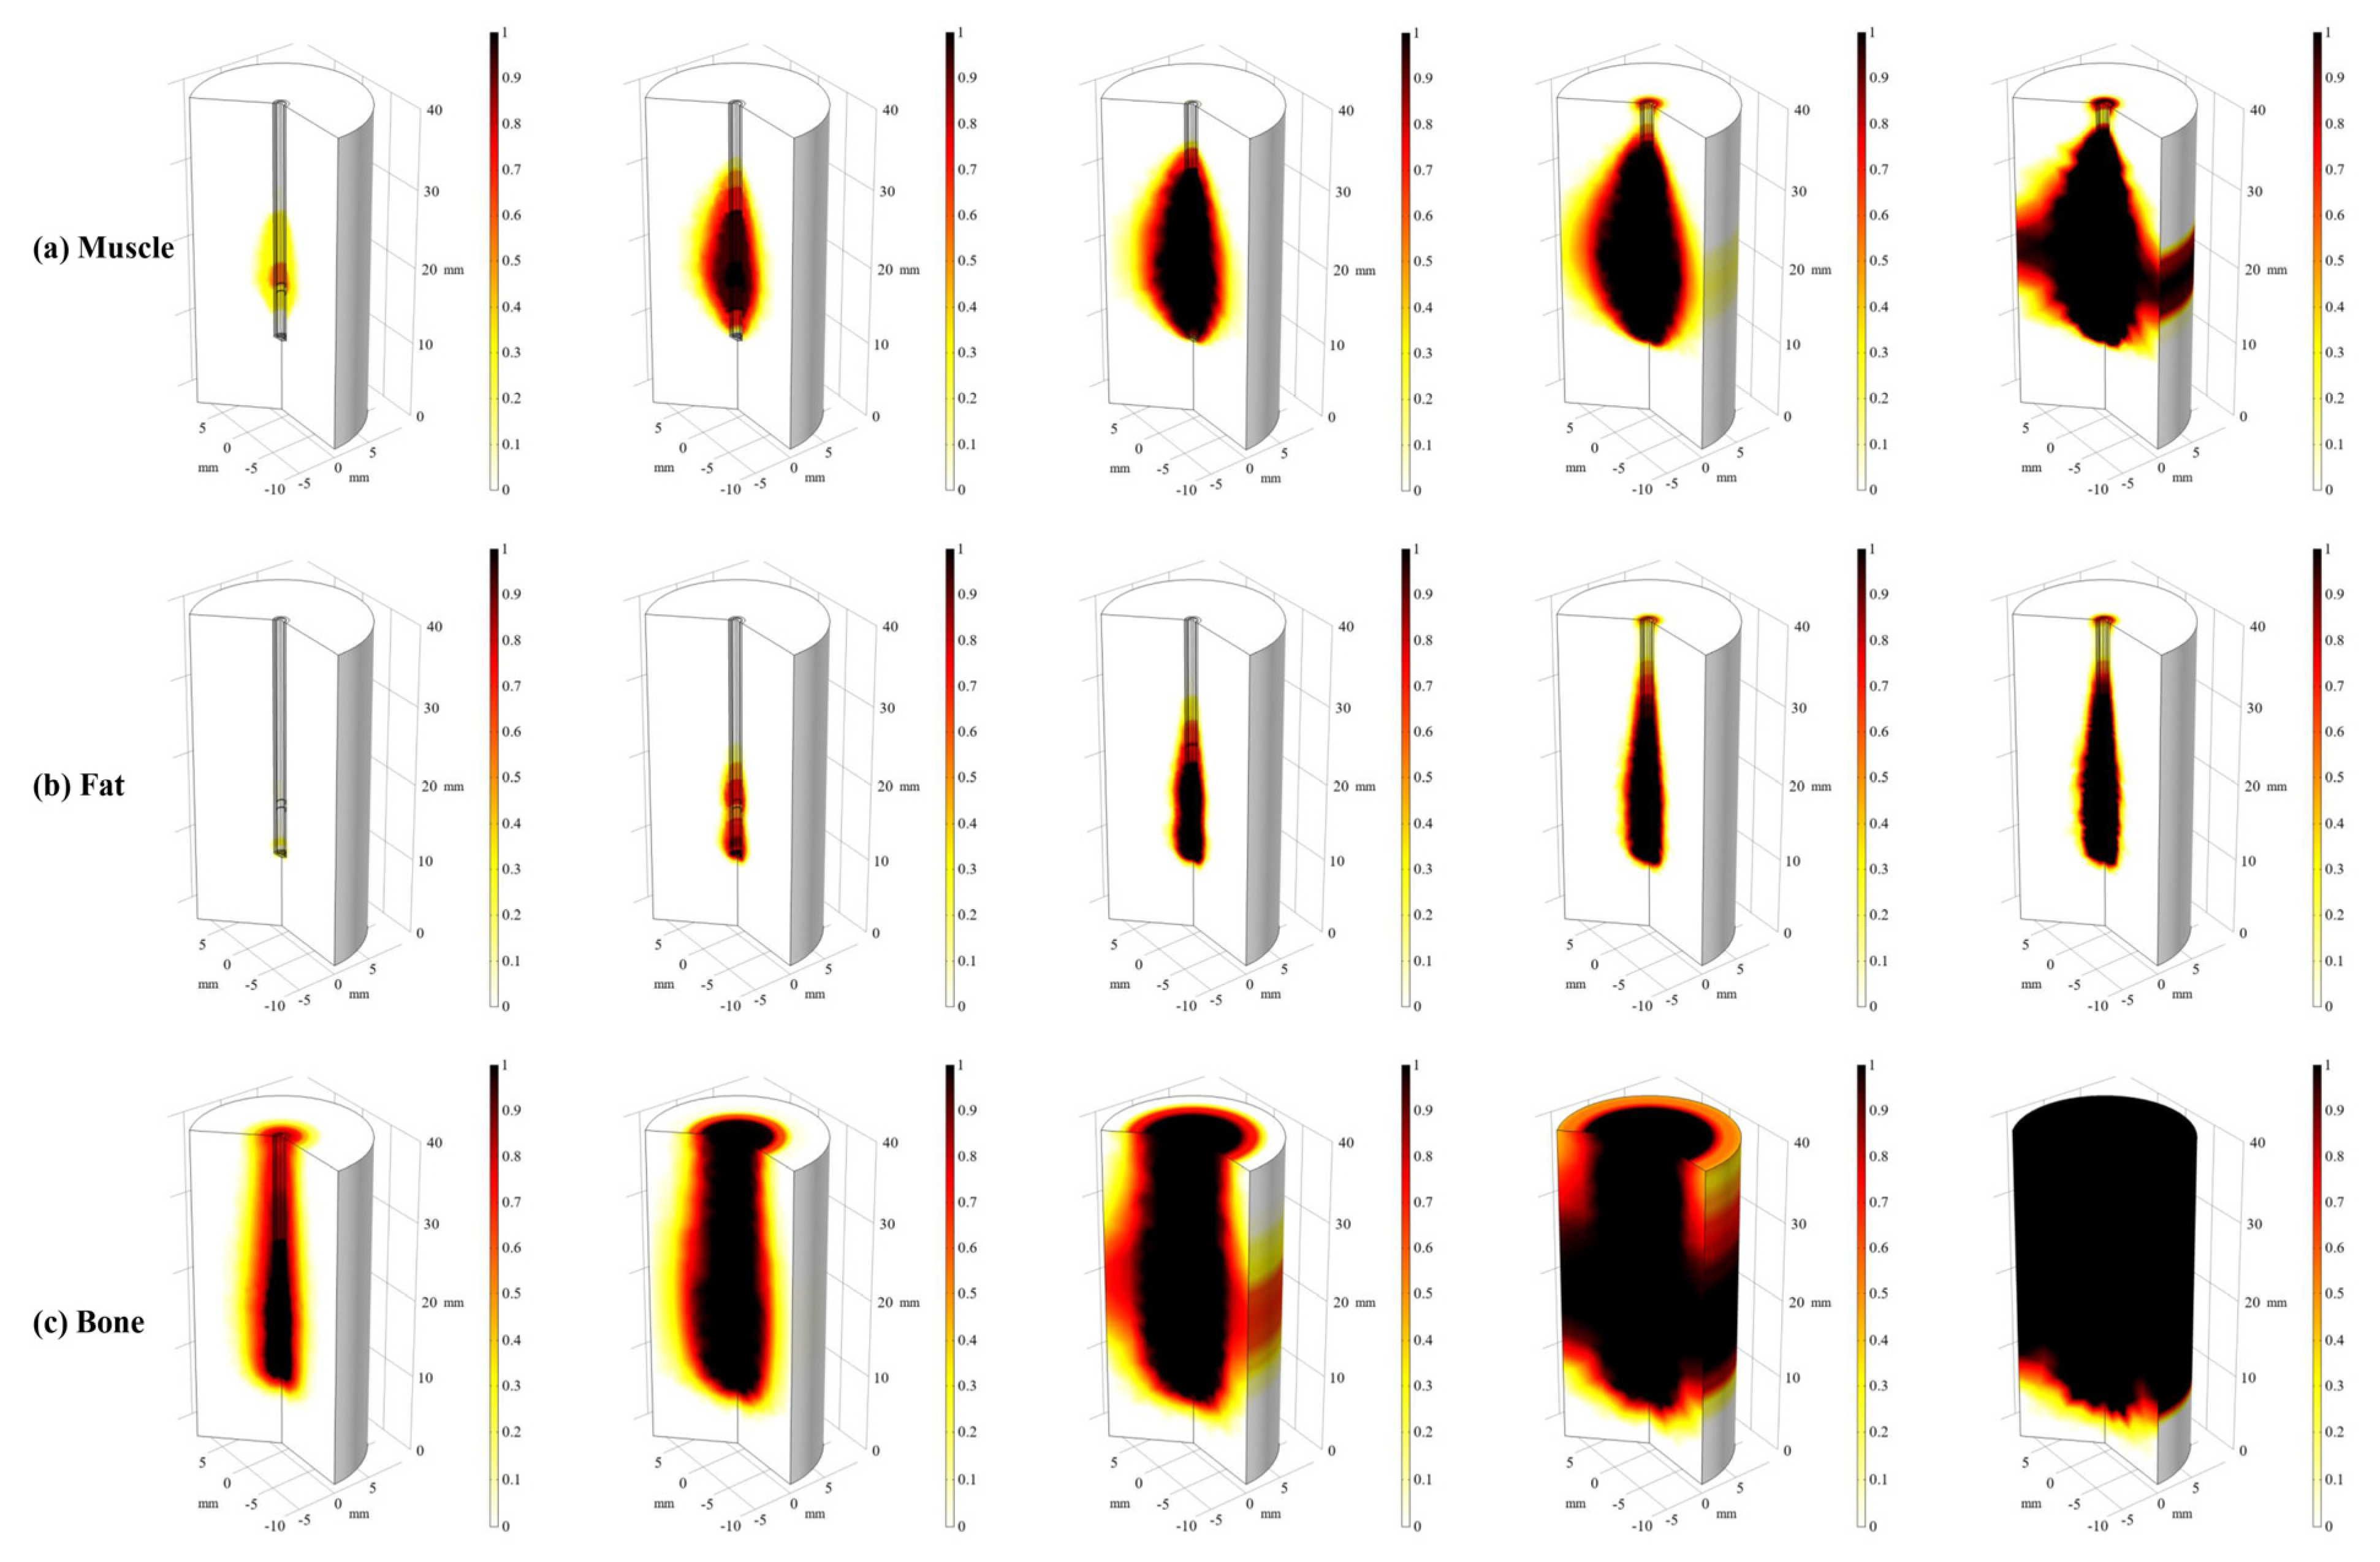
4.1. Visualization of Heat Transfer

After verifying and comparing the muscle numerical study and MWA data, the validity of the proposed model has been proved. Therefore, heat transfer of other similar biological tissues based on the physical field established by this model has a specific reference. Considering the complexity of fat and bone MWA experiments, which are single-component biological tissues, numerical models of fat and bone are established to discuss temperature distribution. Figure 3 records the temperature cloud map of muscle, fat, and bone at the 30 s, 60 s, 90 s, and 120 s, respectively. Although they are all 50 W/2.45 GHz microwave heating power during the heating process, the heat received by them differs due to the different biological characteristics of muscle, fat, and bone. It can be seen from the map at the 60 s that the high-temperature area of muscle is above the annular groove. Its heat spreads out from this position as the center, and the temperature distribution is in a droplet shape. For fat, the high-temperature area is much tinier than for muscle and bone, and its temperature distribution is similar to a vase shape. Compared with the muscle temperature cloud map, the overall form of the fat temperature cloud map is slenderer. Its temperature distribution shifts downward. The microwave heating effect of bones is very significant. Its temperature exceeding 100 °C can be seen obviously.
When heated to the 60 s, the high-temperature area continues to expand. The map shape also becomes more expansive. Except for some parts at the bottom, most areas experience a temperature increase. After the 60 s, no heating is allowed, so the temperature starts to drop gradually. The muscle temperature cloud map begins to contract; significantly the top retracts inward. The red high-temperature area disappears at 90 s. At 120 s, the map further retracts to a spherical shape, and the temperature domain position is close to the place during heating (the 30 s). At 60 s, the temperature of fat is not high, and its fall is also rapid. Temperature is already low at 90 s. The temperature domain center is near the slot at this time. At 120 s, the temperature has completely cooled down. After bone stops heating at 60 s, the high-temperature area in the original center begins to spread outward. A clear yellow edge can be seen to expand at 90 s. At this time, the shape of the high-temperature area above 100 °C begins to resemble the shape of the muscle temperature cloud map at the 60 s. After continuing to cool down, the top of the high-temperature area above 100 °C retracts, and outer edge temperature further diffuses. Even if heating is stopped for a while, there is still a high-temperature area inside the bone. The heating zone at the top of the bone shrinks inwardly after heating is stopped. Its influence on the adjacent temperature zone is significantly reduced, while the slot gradually becomes the center of the entire high-temperature area. Therefore, the shape of the temperature cloud map at the bone cooling period and muscle heating period is similar.
Using a 2D view, a temperature cloud map of appropriate time was derived from observing the difference in the heating domain of three biological tissues. Figure 4 shows muscles (at 60 s), fat (at 60 s), and bone (at 4 s). It can be seen that fat and bone have two warming regions near the annular slot and needle. High-temperature area of fat occurs near the ablation antenna needle. A high-temperature area near the needle of the bone is relatively large. Its high-temperature area occurs in the annular groove. So, the two heating domains of fat and bone make a vase-shaped temperature cloud map appear. High-temperature area is about z = 18 mm for muscle, z = 12 mm and z = 17.5 mm for fat, and z = 10 mm and z = 17 mm for bone. Therefore, if there are two heating zones in the heating process, they are near the slot and ablation antenna needle. If there is only one heating zone, it is near the annular groove.

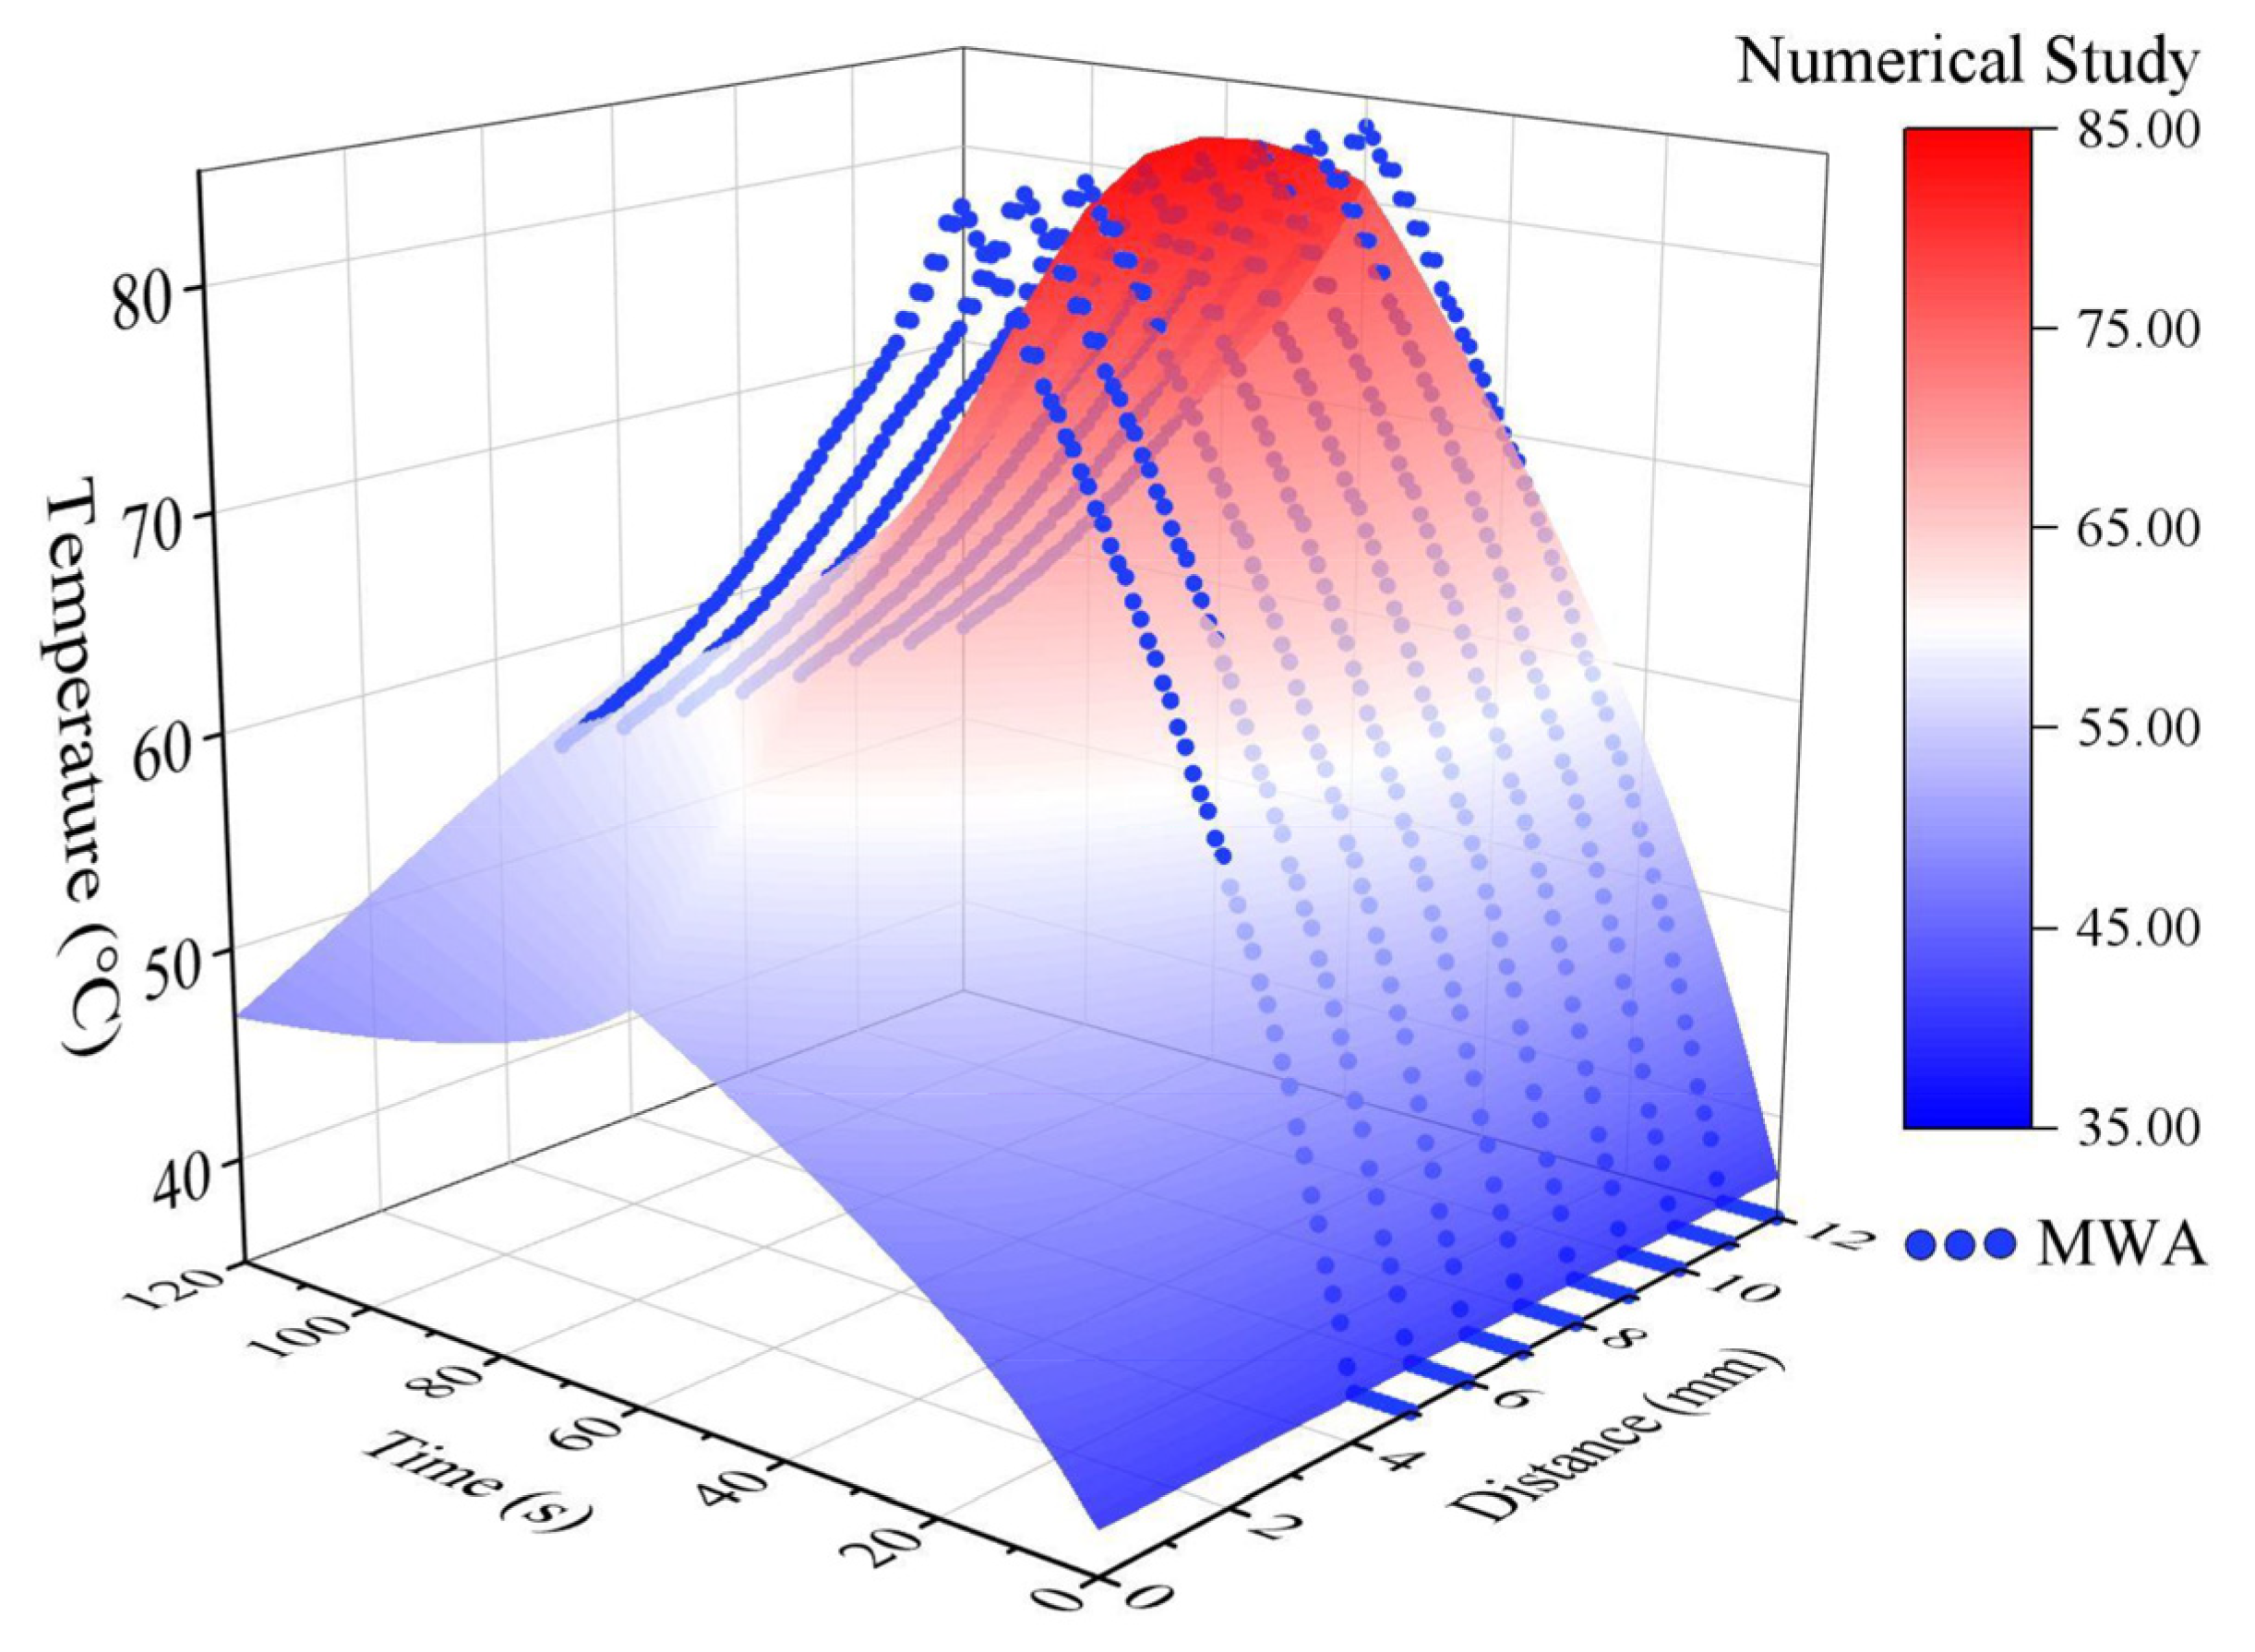
4.2. Quantitative Analysis of Heat Transfer

The high-temperature area can reflect the maximum thermal invasion of the ablation antenna in the tissue. To explore the location and temperature of the high-temperature region in biological tissue near the ablation antenna, multiple thermometric points were obtained at d = 1.2 mm parallel to ablation antenna. So, the highest temperature of the ablation antenna is found. Then, at the thermometric point of the highest temperature, new multiple thermometric points were taken from the center to the boundary of biological tissue. Temperature gradient changes were analyzed (Figure 5). The specific operation is to take the selected highest temperature point position along the radius of ablation antenna (d = 1.2 mm) from z = 10.0 mm to z = 20.0 mm. They are separated by a 0.5 mm interval, and the recording time is from 0 s to 120 s. When heated for 0~60 s, the muscle temperature spreads faster. The curve of 10 mm has a significant increase, while fat is relatively flat and thermal diffusion performance is poor.
After 60 s, the heating is stopped. The closer muscle is to the ablation antenna, the more significant the cooling. Positions far away from ablation antenna (d ≥ 7.0 mm) can still receive transferred heat and heat up. The highest temperature of fat is much lower than that of muscle. After the heating is stopped, thermometric points larger than d = 4.0 mm have a noticeable temperature drop hysteresis. Bone is special; the same heating method for fat and muscle produces a high-temperature area higher than 300 °C in bone. To observe the heat transfer of bone, a temperature cloud map is extracted during heating for 4 s, and the highest temperature has reached 100 °C. Due to the high temperature and fast heating, MWA in bone requires more caution. When recording is stopped, the lowest temperature in all positions is above 75 °C. After the temperature exceeds 50 °C, irreversible damage may occur to the bone, and some areas that have not reached necrotic temperature will be further heated after heating is stopped. Therefore, large areas of bone necrosis will still occur after heating is stopped.

4.3. Damage Volume Comparison

To clarify damage to muscle, fat, and bone during the thermal ablation process, the damage fraction based on the temperature threshold method was calculated, and a damage cloud map is drawn in Figure 6. The shape of muscle damage could map similar to that of the temperature cloud map. After the heating is stopped, due to temperature hysteresis away from the position of the ablation antenna, thermal damage further expands. The map is convex at the place adjacent to the high-temperature area of the ablation antenna. After the heating is stopped, thermal damage in the high-temperature area is more serious. Because the temperature of fat is low, the contour of the damage cloud map is very close to its temperature cloud map at 60 s. Even during the cooling period, the overall shape does not change much. Similar to muscle, the location of the high-temperature area will still bulge and cause some additional damage. All fat damage is 100% irreversible damage. For bone, the correlation with the temperature cloud map can only be seen in the 15 s damage cloud map. After further heating, the fraction with 100% irreversible damage is close to a cylindrical shape. Although the influence range and temperature of two high-temperature areas in bone are pretty different, their damage effects are more closely related. Damage is the most serious in the area of about z = 10 mm~z = 20 mm. After heating is stopped, the top section of the bone quickly becomes completely necrotic. The lower section is different, and there are still some fractions with no damage.
For more accurate analysis, damage cloud map is quantified (Figure 7). For muscle, fat, and bone, three sequence points (z = 10 mm, z = 12 mm, and z = 18 mm) are taken, and damage fraction of all points from 0 to 120 s is plotted. Also, bone damage fraction is additionally calculated at z = 5 mm. Although damage is very different, muscle, fat, and bone still have obvious things in common: damage is mainly concentrated from ablation antenna needle to top of axis, and the lower part of axis is not easily damaged. Even if damage to the upper part of bone spreads in a large area, the lower part can still maintain a good cell survival rate. For muscles, from ablation antenna needle to 18mm, position is getting closer to its high-temperature region. So, the increase rate of damage fraction and complete damage gradually increased. Two high-temperature regions of fat are at z = 12.0 mm and z = 17.5 mm respectively, resulting in a faster growth rate of damage fraction to 100% near z = 12.0 mm. z = 18.0 mm is very close to another high-temperature region. Its damage rate is relatively slow, but it is higher at a location far from ablation antenna. For bones, position close to ablation antenna is almost completely damaged by heating. As for locations near high-temperature region, higher temperature makes it have stronger thermal diffusion ability, which has some impact on distant locations. It is obvious that growth of complete damage of all positions is very fast at z = 18.0 mm. It can be seen that temperature and damage have obvious boundaries at ablation antenna needle. In addition, high-temperature region at ablation antenna needle is limited compared to other locations. Although high-temperature region near ablation antenna needle is larger than that near groove, temperature and thermal damage of two high-temperature region of bone and fat are significantly different. Temperature and heat damage near slot are higher than those near needle.

4.4. Potential Extension and Outlook

This research has the potential to extend to include further complexity. In the simulation, the tumor is generally considered as a structure in tissues with unique parameters for biological tissues containing tumors. Relying on the basic biological model provided in this work and the tumor model, the simulation of cancerous tissue could work. Parameters of tumor and tissues are selected according to existing public research [18,37], such as electrical conductivity, thermal conductivity, dielectric constant, and perfusion rate. The difference is that the metabolic heat generation of the tumor itself is high. The metabolic heat generation is calculated according to the size and structure of the tumor, and it is put into the biological heat transfer model as a heat source item.
Regarding the consideration of large vessels, the general biological tissue simulation describes the blood flow through blood perfusion, which is very vague for the analysis of vessels. Most models consider large vessels only as a heat transfer term in the heat transfer study, ignoring some key factors, including the distribution of large vessels and their essential branches, the direction and velocity of blood flow, and the relative positions of large vessels and tissues. Therefore, we suggest establishing the geometric structure of large vessels inside the tissue. Since vessels mainly transfer heat through blood flow, a physical field of fluid heat transfer is given to the large vessels to simulate the heat transfer. In addition, the small vessels in the tissue follow the traditional method, and the specific blood perfusion rate given to the tissue simulates the heat transfer of the small vessels. So, there is some potential to deal with more complex models, and that is the subject of a subsequent work.
It is noted that the parameters selected are from some published research studies. The aim is to observe the difference in heat transfer between three universal biological tissues. However, the parameters are limited by the insufficiency of current research, only some representatives of which are considered. Thus, the details have not been fully considered. For example, the variation in thermo-physical parameters and electrical conductivity as a function of temperature, and the electrical characteristics change with the microwave frequency. There are also differences in boundary conditions, microwave antennas, etc. Therefore, the results of this work can only be used as a reference under specific conditions.

5. Conclusions

This work explores temperature changes in biological tissues during MWA. Firstly, clinical MWA of biological muscle tissue was completed. Secondly, biological tissue and ablation antenna models were established according to experimental conditions and related research. The physical field under MWA was constructed based on TM and the Pennes model. Then, combining biomaterial parameters and existing related research, model boundary conditions and initial values were adjusted, so that the model can better match the actual clinical materials and experimental conditions. Finally, the fat model and bone model were expanded. The temperature distribution and thermal damage of three models were analyzed separately to explore the heat transfer of biological tissues in MWA.
Because data from clinical MWA were used as a verification, the proposed model can truly reflect the actual MWA scene. Parameter discussion and model changes can provide a theoretical basis for thermal law exploration of other biological tissues. Therefore, the numerical study can visualize temperature transmission in MWA. It predicts possible biological thermal damage, which provides a new theoretical basis for clinically thermal ablation surgery.

Supplementary Materials

The following are available online at https://0-www-mdpi-com.brum.beds.ac.uk/article/10.3390/app11178271/s1, Figure S1. Temperature and damage fraction cloud map using varying thermal conductivity, Figure S2. Temperature distribution at the horizontal thermometric sequence of the highest temperature point near ablation antenna. (a) Thermal conductivity changes with temperature; (b) Constant thermal conductivity, Figure S3. Damage fraction at z = 18 mm during 0–60 s. (a) Thermal conductivity changes with temperature; (b) Constant thermal conductivity.

Author Contributions

Conceptualization, C.C. and M.-A.Y.; methodology, C.C.; validation, L.Q. and H.-Y.C.; investigation, Z.-L.Z.; resources, J.W. and L.-L.P.; writing—original draft preparation, C.C.; writing—review and editing, R.-X.X.; visualization, C.C.; supervision, M.-A.Y.; project administration, R.-X.X.; funding acquisition, Z.-L.W. All authors have read and agreed to the published version of the manuscript.

Funding

This research was funded by National Natural Science Foundation of China (62176268), Non-profit Central Research Institute Fund of Chinese Academy of Medical Sciences (2020-JKCS-008), Beijing Nova Program (Z201100006820065), Beijing Municipal Science & Technology Commission (Z181100001718135), Beijing University of Chemical Technology-China-Japan Friendship Hospital Biomedical Transformation Joint Fund Project (PYBZ1804), Capital health research and development project (2018-1-1112), Fundamental Research Funds for the Central Universities (FRF-DF-20-05) and the Beijing Top Discipline for Artificial Intelligent Science and Engineering, University of Science and Technology Beijing.

Institutional Review Board Statement

Not applicable.

Informed Consent Statement

Not applicable.

Data Availability Statement

The datasets generated during this study are available from the corresponding author on reasonable request.

Conflicts of Interest

The authors declare no conflict of interest.

References

  1. Philip, A.; Gupta, S.; Ahrar, K.; Tam, A.L. A Spectrum of Nerve Injury after Thermal Ablation: A Report of Four Cases and Review of the Literature. Cardiovasc. Interv. Radiol. 2013, 36, 1427–1435. [Google Scholar] [CrossRef] [PubMed]
  2. Chou, C.K. Therapeutic Heating Applications of Radio Frequency Energy. In Biological and Medical Aspects of Electromagnetic Fields, 3rd ed.; Barnes, F.S., Greenebaum, B., Eds.; CRC Press: Boca Raton, FL, USA, 2018; pp. 414–425. [Google Scholar]
  3. Lopresto, V.; Pinto, R.; Farina, L.; Cavagnaro, M. Treatment planning in microwave thermal ablation: Clinical gaps and recent research advances. Int. J. Hyperth. 2017, 33, 83–100. [Google Scholar] [CrossRef] [PubMed] [Green Version]
  4. Vroomen, L.G.P.H.; Petre, E.N.; Cornelis, F.H.; Solomon, S.B.; Srimathveeravalli, G. Irreversible electroporation and thermal ablation of tumors in the liver, lung, kidney and bone: What are the differences? Diagn. Interv. Imaging 2017, 98, 609–617. [Google Scholar] [CrossRef]
  5. De Fouw, M.; Oosting, R.M.; Eijkel, B.I.M.; van Altena, P.F.J.; Peters, A.A.W.; Dankelman, J.; Beltman, J.J. Comparison of the tissue interaction between thermal ablation and cryotherapy as treatment for cervical precancerous lesions in an ex-vivo model. Health Technol. 2020, 10, 1275–1281. [Google Scholar] [CrossRef]
  6. Monfardini, L.; Varano, G.M.; Foà, R.; Della Vigna, P.; Bonomo, G.; Orsi, F. Local Recurrence of Renal Cancer After Surgery: Prime Time for Percutaneous Thermal Ablation? Cardiovasc. Interv. Radiol. 2015, 38, 1542–1547. [Google Scholar] [CrossRef]
  7. Mauri, G.; Sconfienza, L.M. Is operators’ experience more important than the ablation technique in image-guided thermal ablations? Int. J. Hyperth. 2017, 33, 955–956. [Google Scholar] [CrossRef] [Green Version]
  8. Hakime, A.; Yevich, S.; Tselikas, L.; Deschamps, F.; Petrover, D.; De Baere, T. Percutaneous Thermal Ablation with Ultrasound Guidance. Fusion Imaging Guidance to Improve Conspicuity of Liver Metastasis. Cardiovasc. Interv. Radiol. 2017, 40, 721–727. [Google Scholar] [CrossRef]
  9. Abbass, M.A.; Killin, J.K.; Mahalingam, N.; Hooi, F.M.; Barthe, P.G.; Mast, T.D. Real-Time Spatiotemporal Control of High-Intensity Focused Ultrasound Thermal Ablation Using Echo Decorrelation Imaging in ex Vivo Bovine Liver. Ultrasound Med. Biol. 2018, 44, 199–213. [Google Scholar] [CrossRef] [PubMed]
  10. Chinnaratha, M.A.; Sathananthan, D.; Pateria, P.; Tse, E.; MacQuillan, G.; Mosel, L.; Pathi, R.; Madigan, D.; Wigg, A.J. High local recurrence of early-stage hepatocellular carcinoma after percutaneous thermal ablation in routine clinical practice. Eur. J. Gastroenterol. Hepatol. 2015, 27, 349–354. [Google Scholar] [CrossRef]
  11. Feng, B.; Liang, P. Local thermal ablation of renal cell carcinoma. Eur. J. Radiol. 2012, 81, 437–440. [Google Scholar] [CrossRef]
  12. Lopresto, V.; Argentieri, A.; Pinto, R.; Cavagnaro, M. Temperature dependence of thermal properties of ex vivo liver tissue up to ablative temperatures. Phys. Med. Cine Biol. 2019, 64, 105016. [Google Scholar] [CrossRef] [PubMed]
  13. Lee, Y.N.; Jeong, S.; Choi, H.J.; Cho, J.H.; Cheon, Y.K.; Park, S.W.; Kim, Y.S.; Lee, D.H.; Moon, J.H. The safety of newly developed automatic temperature-controlled endobiliary radiofrequency ablation system for malignant biliary strictures: A prospective multicenter study. J. Gastroenterol. Hepatol. 2019, 34, 1454–1459. [Google Scholar] [CrossRef]
  14. De Vita, E.; Zaltieri, M.; De Tommasi, F.; Massaroni, C.; Faiella, E.; Zobel, B.B.; Iadicicco, A.; Schena, E.; Grasso, R.F.; Campopiano, S. Multipoint Temperature Monitoring of Microwave Thermal Ablation in Bones through Fiber Bragg Grating Sensor Arrays. Sensors 2020, 20, 3200. [Google Scholar] [CrossRef] [PubMed]
  15. Kadado, A.J.; Akar, J.G.; Hummel, J.R. Luminal esophageal temperature monitoring to reduce esophageal thermal injury during catheter ablation for atrial fibrillation: A review. Trends Cardiovasc. Med. 2019, 29, 264–271. [Google Scholar] [CrossRef] [PubMed]
  16. Feng, Y.H.; Zou, H.Y.; Qiu, L.; Zhang, X.X. Size effect on the thermal conductivity of octadecanoic acid: A molecular dynamics study. Comput. Mater. Sci. 2019, 158, 14–19. [Google Scholar] [CrossRef]
  17. Zou, H.Y.; Feng, Y.H.; Qiu, L.; Zhang, X.X. Effect of the loading amount and arrangement of iodine chains on the interfacial thermal transport of carbon nanotubes: A molecular dynamics study. RSC Adv. 2020, 10, 44196–44204. [Google Scholar] [CrossRef]
  18. Singh, S.; Repaka, R. Effect of different breast density compositions on thermal damage of breast tumor during radiofrequency ablation. Appl. Therm. Eng. 2017, 125, 443–451. [Google Scholar] [CrossRef]
  19. Wu, X.; Liu, B.L.; Xu, B.K. Theoretical evaluation of high frequency microwave ablation applied in cancer therapy. Appl. Therm. Eng. 2016, 107, 501–507. [Google Scholar] [CrossRef]
  20. Wang, T.; Zhao, G.; Qiu, B.S. Theoretical evaluation of the treatment effectiveness of a novel coaxial multi-slot antenna for conformal microwave ablation of tumors. Int. J. Heat Mass Transf. 2015, 90, 81–91. [Google Scholar] [CrossRef]
  21. Pop, M.; Davidson, S.R.H.; Gertner, M.; Jewett, M.A.S.; Sherar, M.D.; Kolios, M.C. A Theoretical Model for RF Ablation of Kidney Tissue and Its Experimental Validation. In Proceedings of the Biomedical Simulation, Berlin/Heidelberg, Germany, 23–24 January 2010; pp. 119–129. [Google Scholar]
  22. Weinbaum, S.; Jiji, L.M. A new simplified bioheat equation for the effect of blood flow on local average tissue temperature. J. Biomech. Eng. 1985, 107, 131–139. [Google Scholar] [CrossRef] [PubMed]
  23. Klinger, H.G. Heat transfer in perfused biological tissue—I: General theory. Bull. Math. Biol. 1974, 36, 403–415. [Google Scholar] [CrossRef] [PubMed]
  24. Khaled, A.R.A.; Vafai, K. The role of porous media in modeling flow and heat transfer in biological tissues. Int. J. Heat Mass Transf. 2003, 46, 4989–5003. [Google Scholar] [CrossRef]
  25. Pennes, H.H. Analysis of tissue and arterial blood temperatures in the resting human forearm. J. Appl. Physiol. 1948, 1, 93–122. [Google Scholar] [CrossRef] [PubMed]
  26. Wulff, W. The Energy Conservation Equation for Living Tissue. IEEE Transa. Biomed. Eng. 1974, BME-21, 494–495. [Google Scholar] [CrossRef]
  27. Solovchuk, M.A.; Thiriet, M.; Sheu, T.W.H. Computational study of acoustic streaming and heating during acoustic hemostasis. Appl. Therm. Eng. 2017, 124, 1112–1122. [Google Scholar] [CrossRef]
  28. Askarizadeh, H.; Ahmadikia, H. Analytical study on the transient heating of a two-dimensional skin tissue using parabolic and hyperbolic bioheat transfer equations. Appl. Math. Model. 2015, 39, 3704–3720. [Google Scholar] [CrossRef]
  29. Huang, H.-W.; Lin, W.-L.; Moros, E.G. A robust power deposition scheme for tumors with large counter-current blood vessels during hyperthermia treatment. Appl. Therm. Eng. 2015, 89, 897–907. [Google Scholar] [CrossRef]
  30. Abd Wahab, A.; Salim, M.I.M.; Ahamat, M.A.; Abd Manaf, N.; Yunus, J.; Lai, K.W. Thermal distribution analysis of three-dimensional tumor-embedded breast models with different breast density compositions. Med. Biol. Eng. Comput. 2016, 54, 1363–1373. [Google Scholar] [CrossRef]
  31. Mayrovitz, H.N.; Grammenos, A.; Corbitt, K.; Bartos, S. Age-related changes in male forearm skin-to-fat tissue dielectric constant at 300 MHz. Clin. Physiol. Funct. Imaging 2017, 37, 198–204. [Google Scholar] [CrossRef]
  32. Brace, C.L. Radiofrequency and microwave ablation of the liver, lung, kidney, and bone: What are the differences? Curr. Probl. Diagn. Radiol. 2009, 38, 135–143. [Google Scholar] [CrossRef] [Green Version]
  33. Lim, D.; Namgung, B.; Woo, D.G.; Choi, J.S.; Kim, H.S.; Tack, G.R. Effect of Input Waveform Pattern and Large Blood Vessel Existence on Destruction of Liver Tumor Using Radiofrequency Ablation: Finite Element Analysis. J. Biomech. Eng. 2010, 132, 061003. [Google Scholar] [CrossRef]
  34. Yarmolenko, P.S.; Moon, E.J.; Landon, C.; Manzoor, A.; Hochman, D.W.; Viglianti, B.L.; Dewhirst, M.W. Thresholds for thermal damage to normal tissues: An update. Int. J. Hyperth. 2011, 27, 320–343. [Google Scholar] [CrossRef]
  35. Douplik, A.; Saiko, G.; Schelkanova, I.; Tuchin, V.V. 3—The response of tissue to laser light. In Lasers for Medical Applications; Jelínková, H., Ed.; Woodhead Publishing: Cambridge, UK, 2013; pp. 47–109. [Google Scholar]
  36. Nagarajan, V.K.; Ward, J.M.; Yu, B. Association of Liver Tissue Optical Properties and Thermal Damage. Lasers Surg. Med. 2020, 52, 779–787. [Google Scholar] [CrossRef]
  37. Sarkar, D.; Haji-Sheikh, A.; Jain, A. Temperature distribution in multi-layer skin tissue in presence of a tumor. Int. J. Heat Mass Transf. 2015, 91, 602–610. [Google Scholar] [CrossRef]
Figure 1. Schematic diagram of biological tissue model. (a) Geometric structure and parameters of biological tissue model. (b) A free triangular grid in biological tissue model. Its cylindrical coordinate mainly analyzes d and z directions.
Applsci 11 08271 g001
Figure 2. Temperature distribution at thermometric sequence near ablation antenna and MWA.
Applsci 11 08271 g002
Figure 3. Temperature cloud map at 30 s, 60 s, 90 s, and 120 s. The 30 s and 60 s belong to the heating period, and 90 s and 120 s belong to the cooling period. (a) Temperature cloud map of muscle; (b) Temperature cloud map of fat; (c) Temperature cloud map of bone.
Applsci 11 08271 g003
Figure 4. Temperature cloud map near ablation antenna.
Applsci 11 08271 g004
Figure 5. Temperature distribution at the horizontal thermometric sequence of the highest temperature point near ablation antenna. (a) Temperature distribution from muscle; (b) Temperature distribution from fat; (c) Temperature distribution from the bone.
Applsci 11 08271 g005
Figure 6. Damage fraction cloud map at 15 s, 30 s, 45 s, 60 s, 75 s. Damage fraction is calculated by temperature threshold. Its damage temperature T d is set to 50 °C, and necrosis temperature T n is set to 80 °C. Damage time is set to 15 s. (a) Damage fraction cloud map of muscle; (b) Damage fraction cloud map of fat; (c) Damage fraction cloud map of bone.
Applsci 11 08271 g006
Figure 7. Damage fraction of three sequence points (z = 10 mm, z = 12 mm and z = 18 mm). All points recorded from 0 to 120 s are plotted. Bone damage fraction is additionally calculated at z = 5 mm. (a) Damage fraction from muscle; (b) Damage fraction from fat; (c) Damage fraction from bone.
Applsci 11 08271 g007
Table 1. Electrical and thermo-physical properties of different biomedical tissue in MWA modeling.
MaterialsUnitMuscleFatBone
ConductivityS/m0.4390.02540.394
Dielectric constant 60.012.011.4
Thermal conductivityW/mK0.490.210.32
Constant pressure heat capacityJ/kgK342123481313
Densitykg/m310909111908
Metabolic thermogenesisW/m37004000
Blood perfusion rate1/s0.00080.00020.000833
Reference [18,30][18,31][32]
Publisher’s Note: MDPI stays neutral with regard to jurisdictional claims in published maps and institutional affiliations.

