
Numerical Analysis of Additional Stresses in Railway Track Elements Due to Subgrade Settlement Using FEM Simulation


Abstract
:1. Introduction
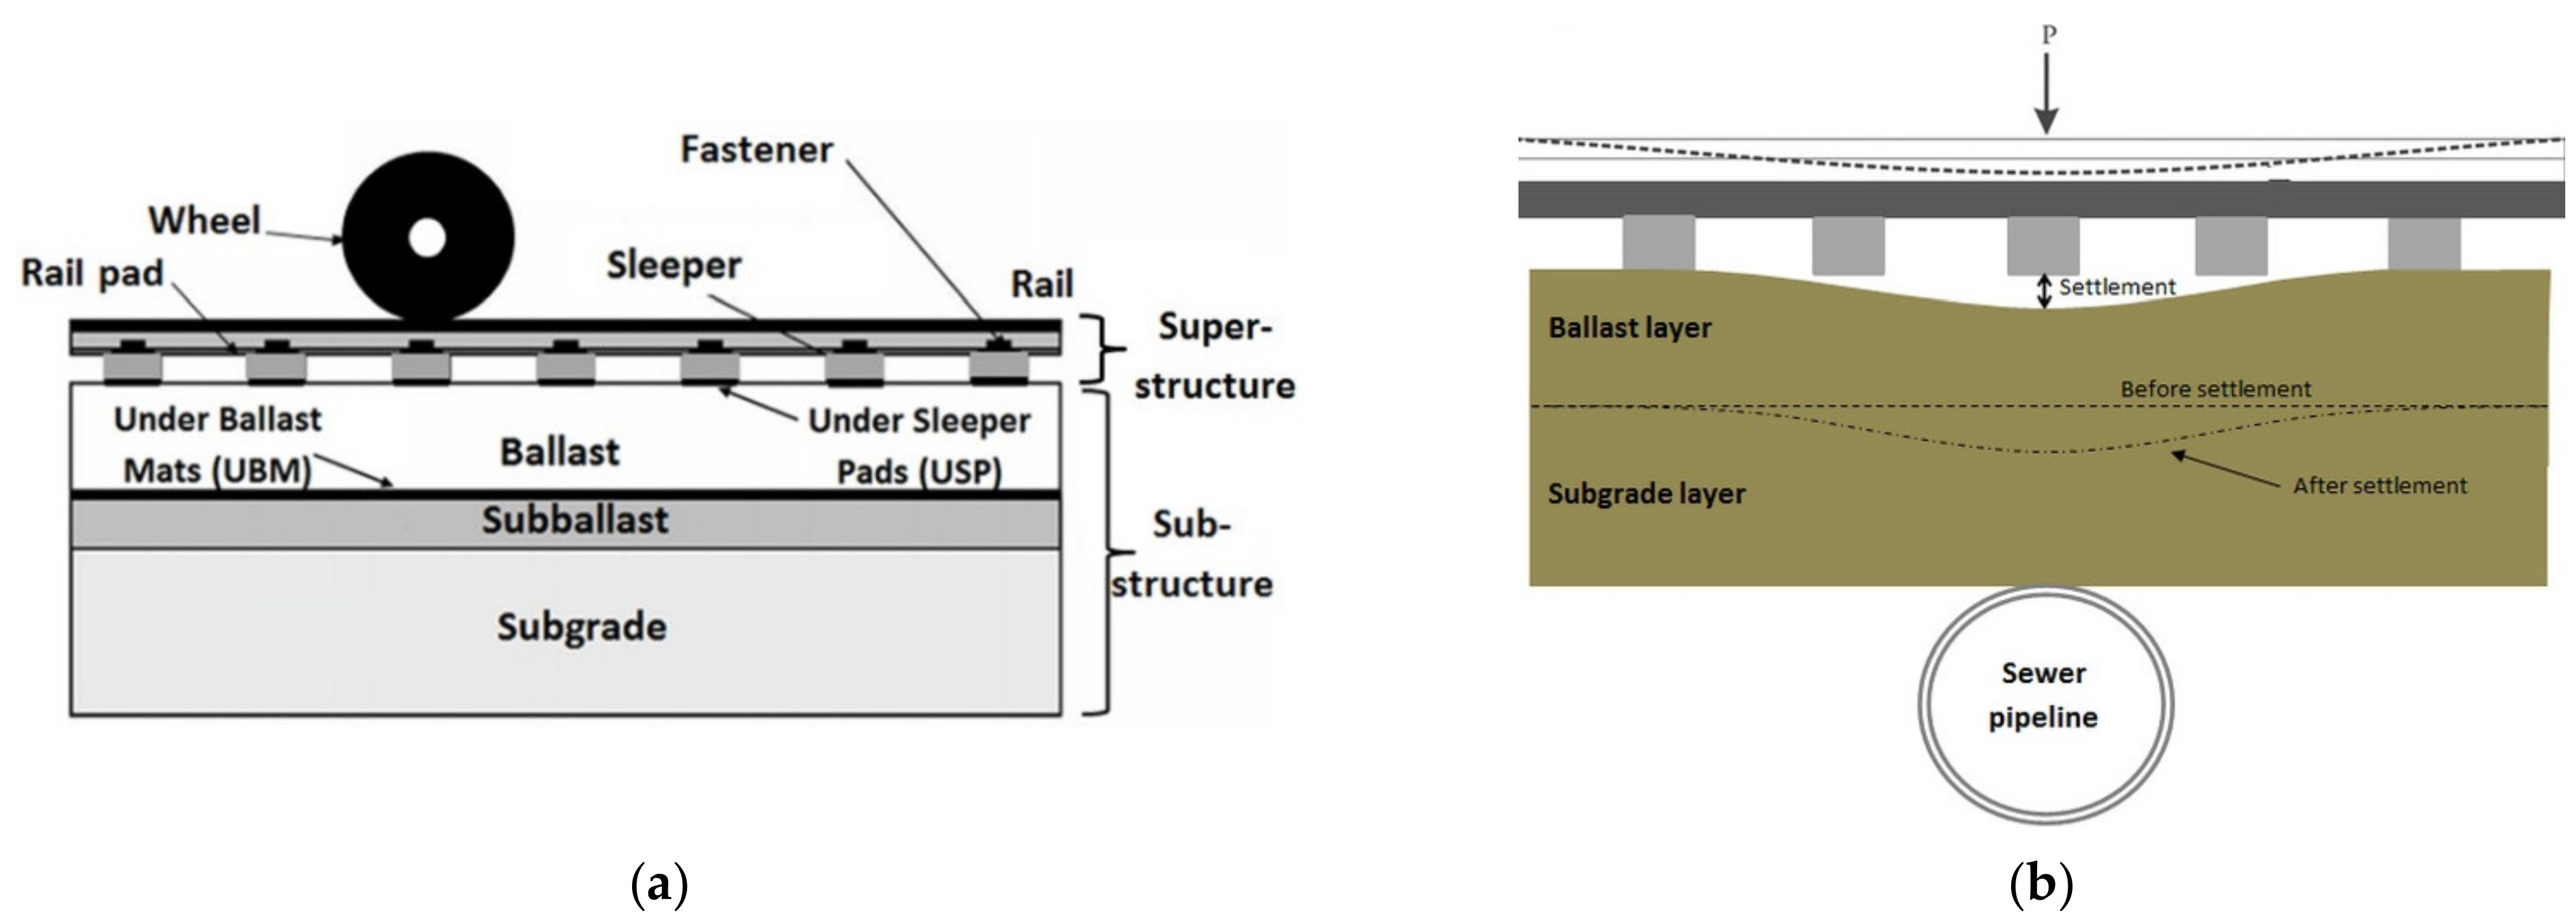
2. Track Modeling
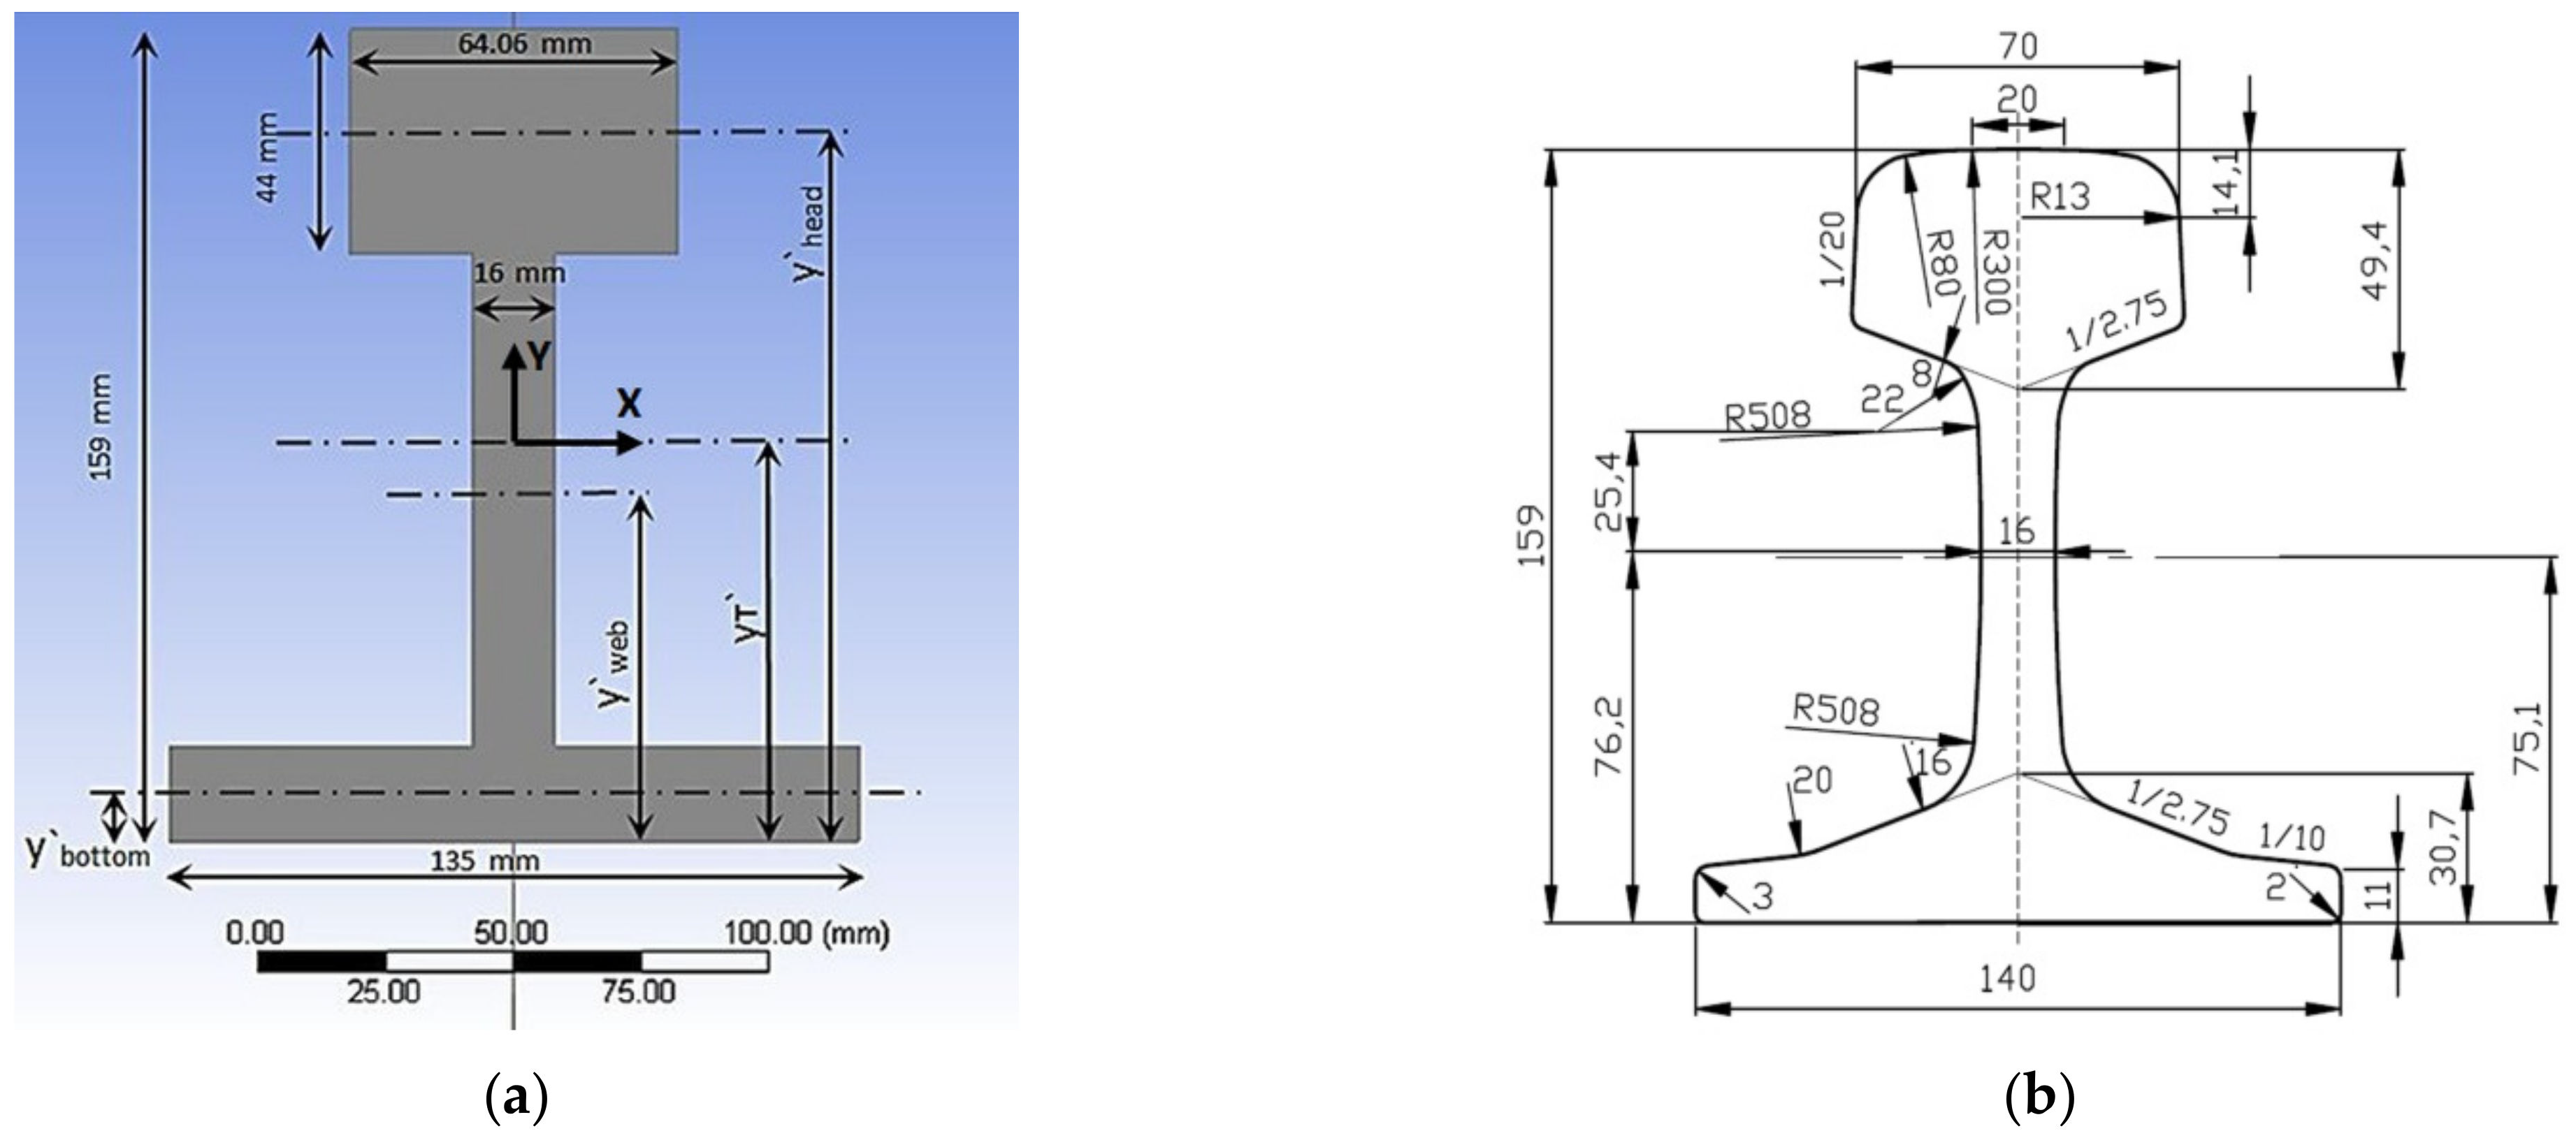
2.1. Model Preparation
2.2. Material Features
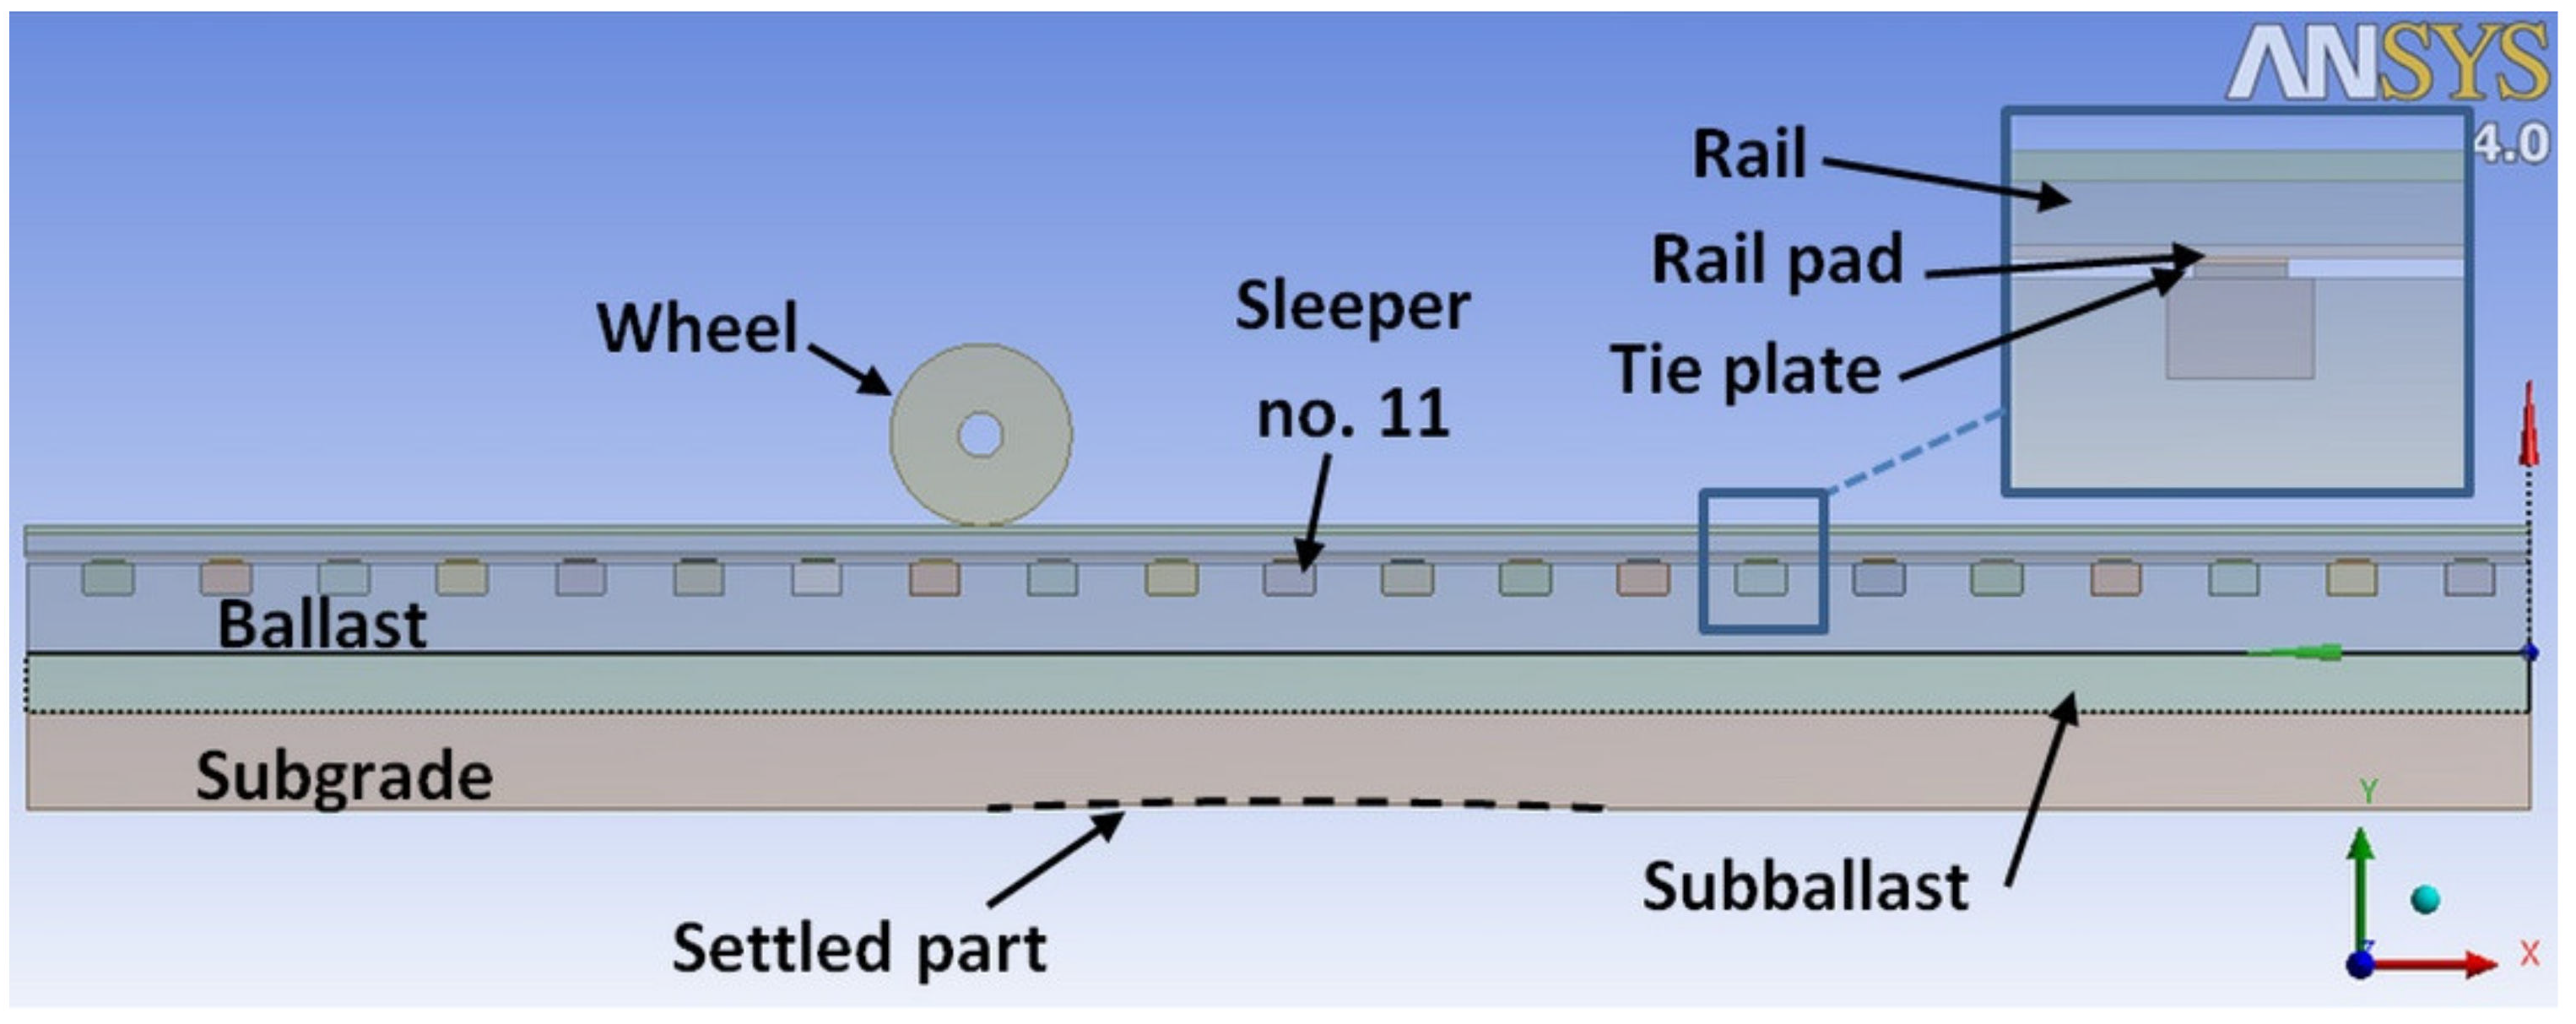
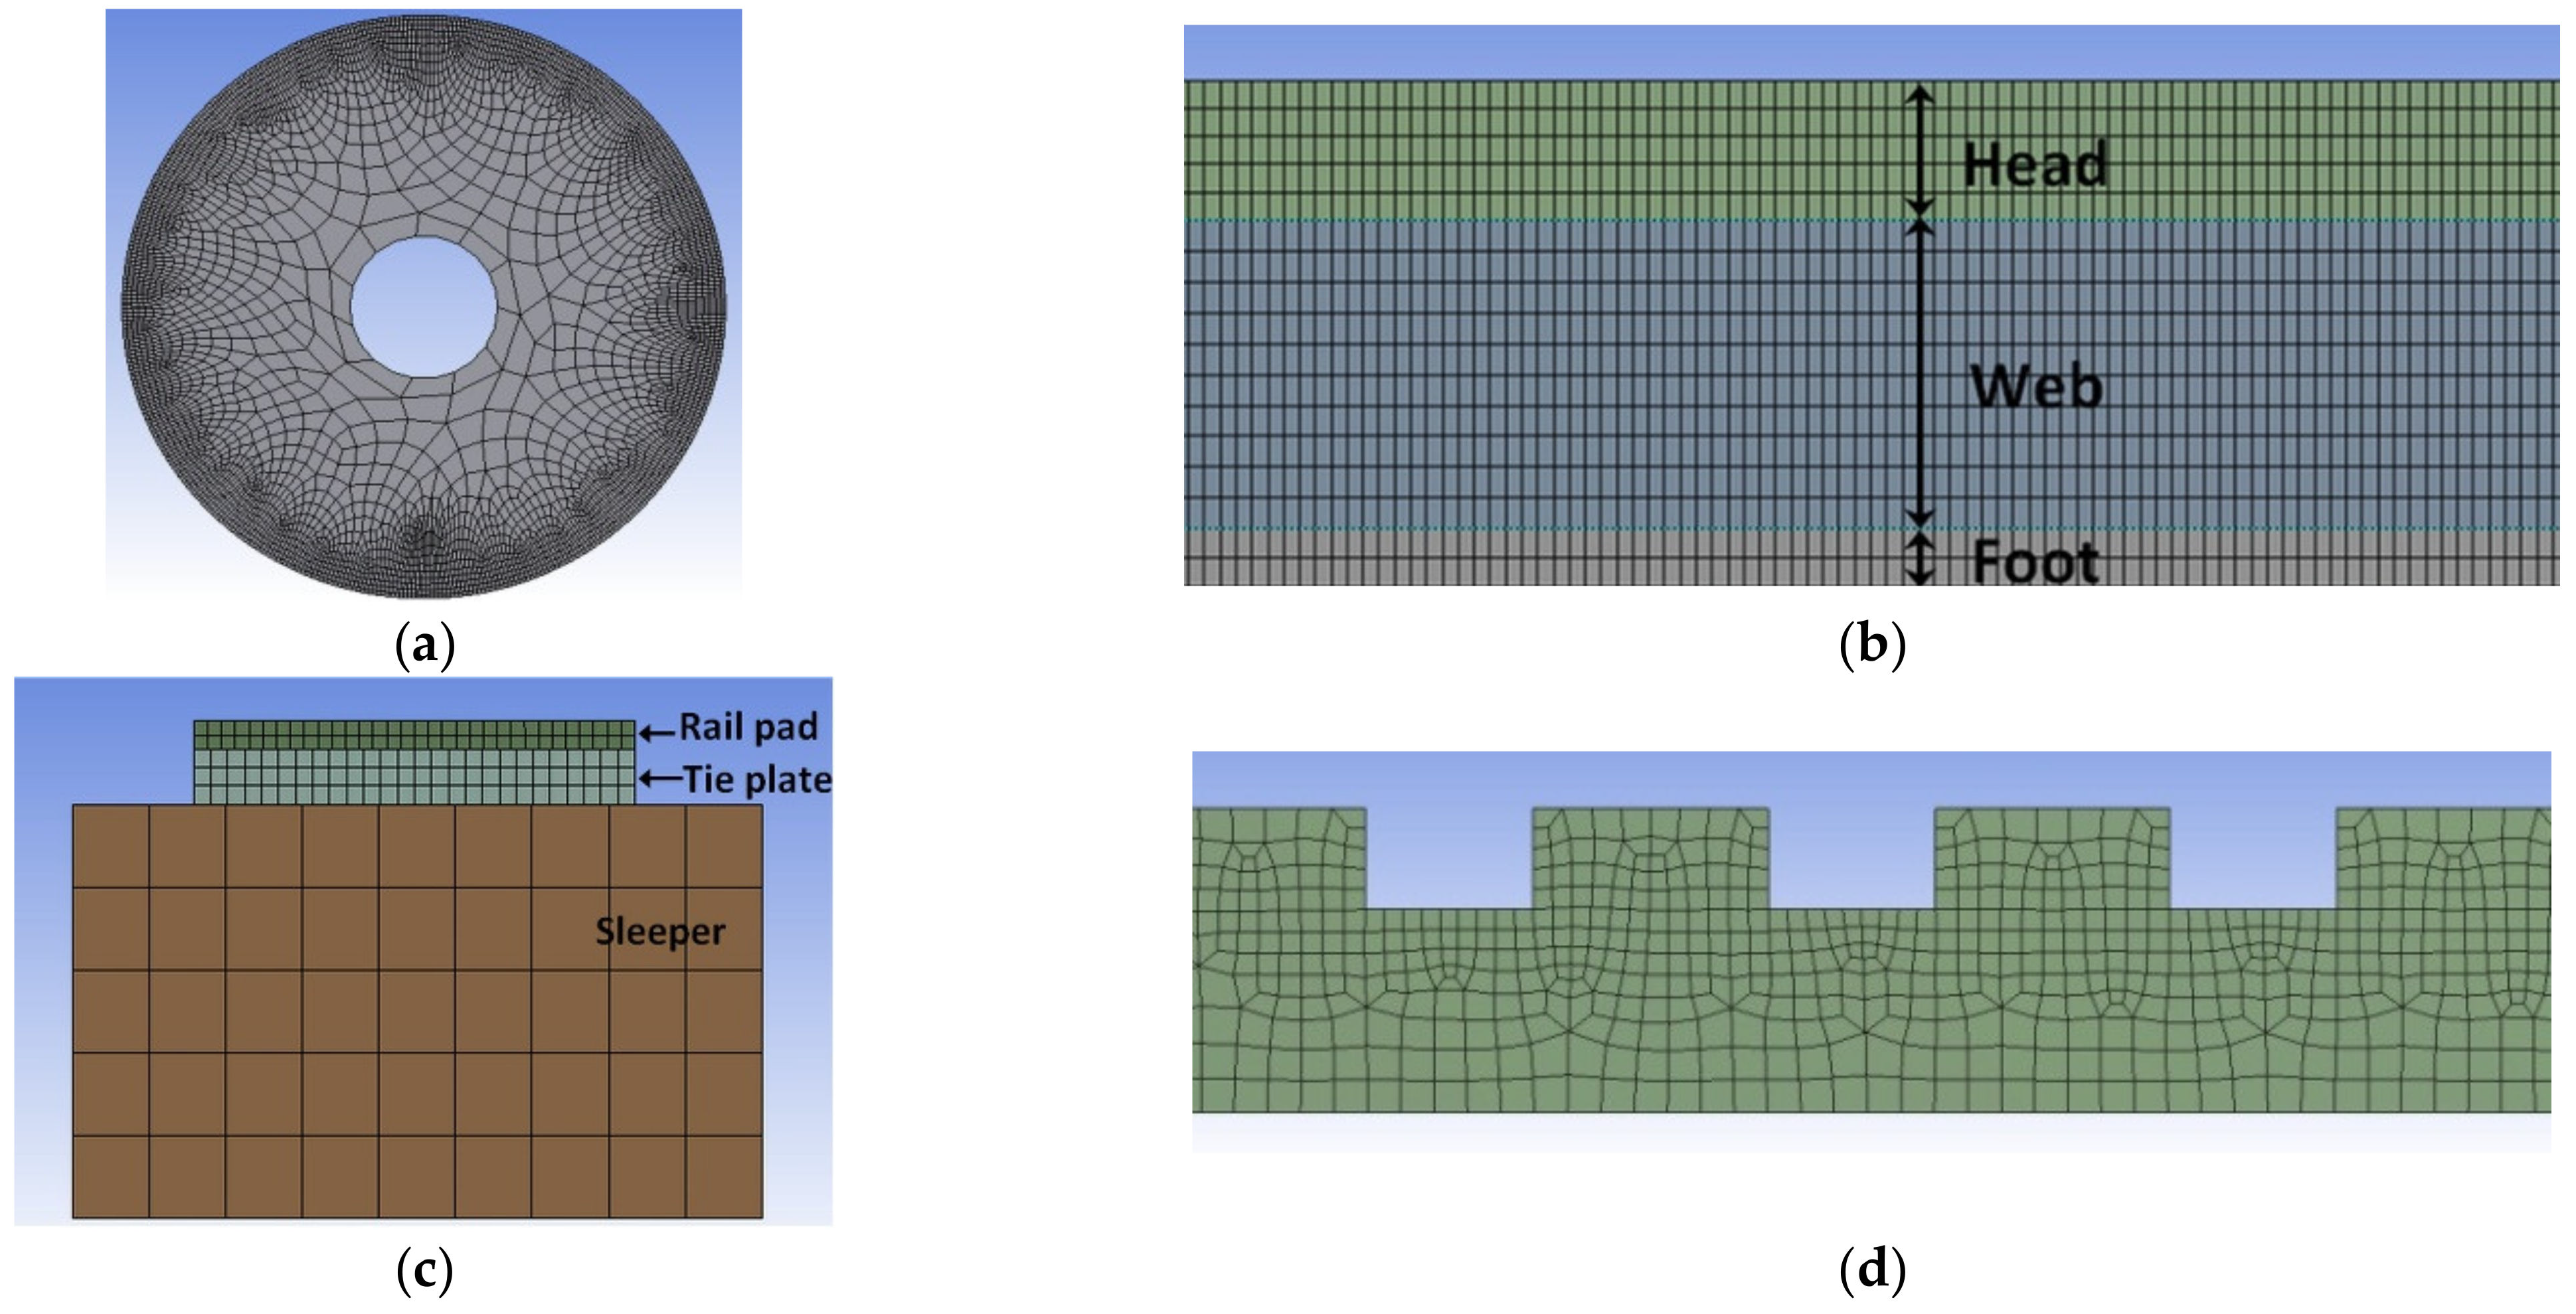
2.3. Model Components and Mesh
- Wheel with a diameter equaling 920 mm.
- Modified Rail 54E1 (UIC54).
- A total of 21 timber sleepers, where the width equals 250 mm and the thickness equals 150 mm, with 600 mm spacing between each other.
- A total of 21 rail pads and tie plates.
- The thickness of the ballast, subballast, and subgrade layers are 300 mm, 300 mm, and 500 mm, respectively.
2.4. Boundary Conditions
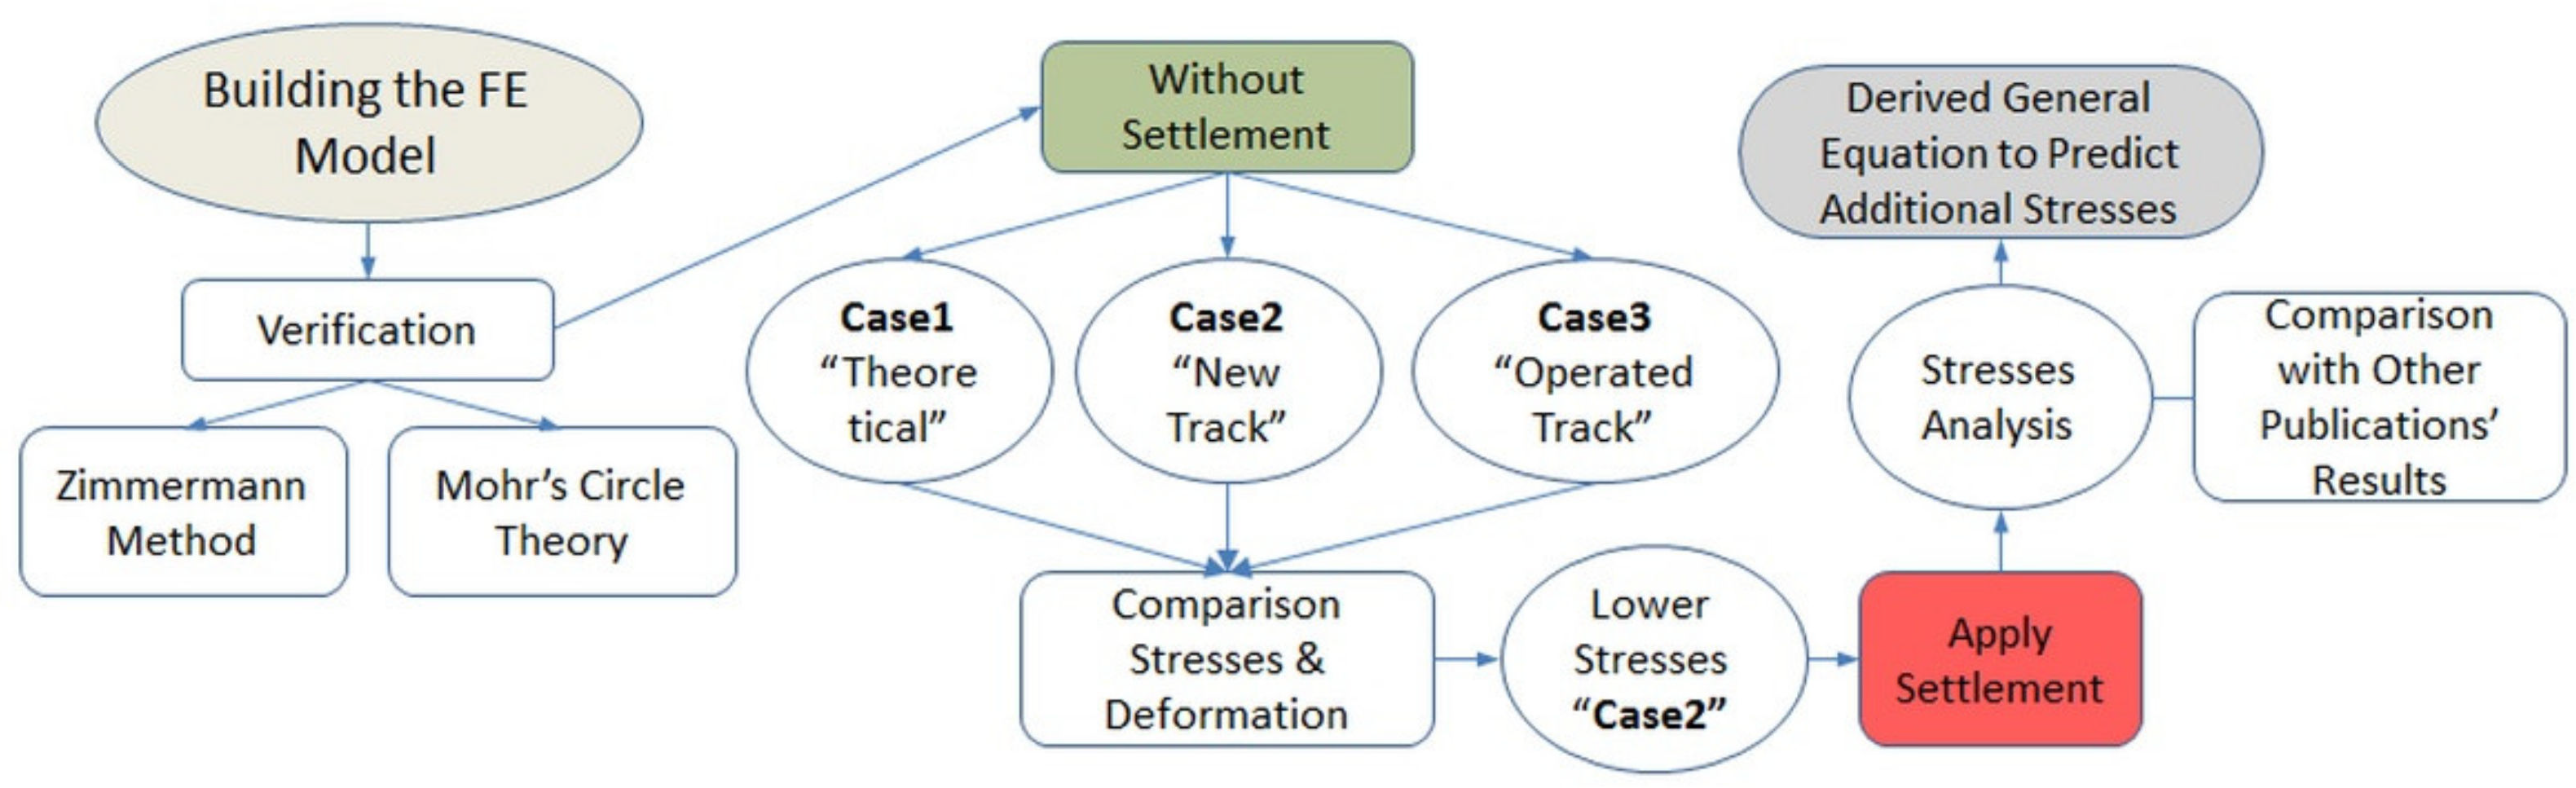
3. Verification of the Implemented Model
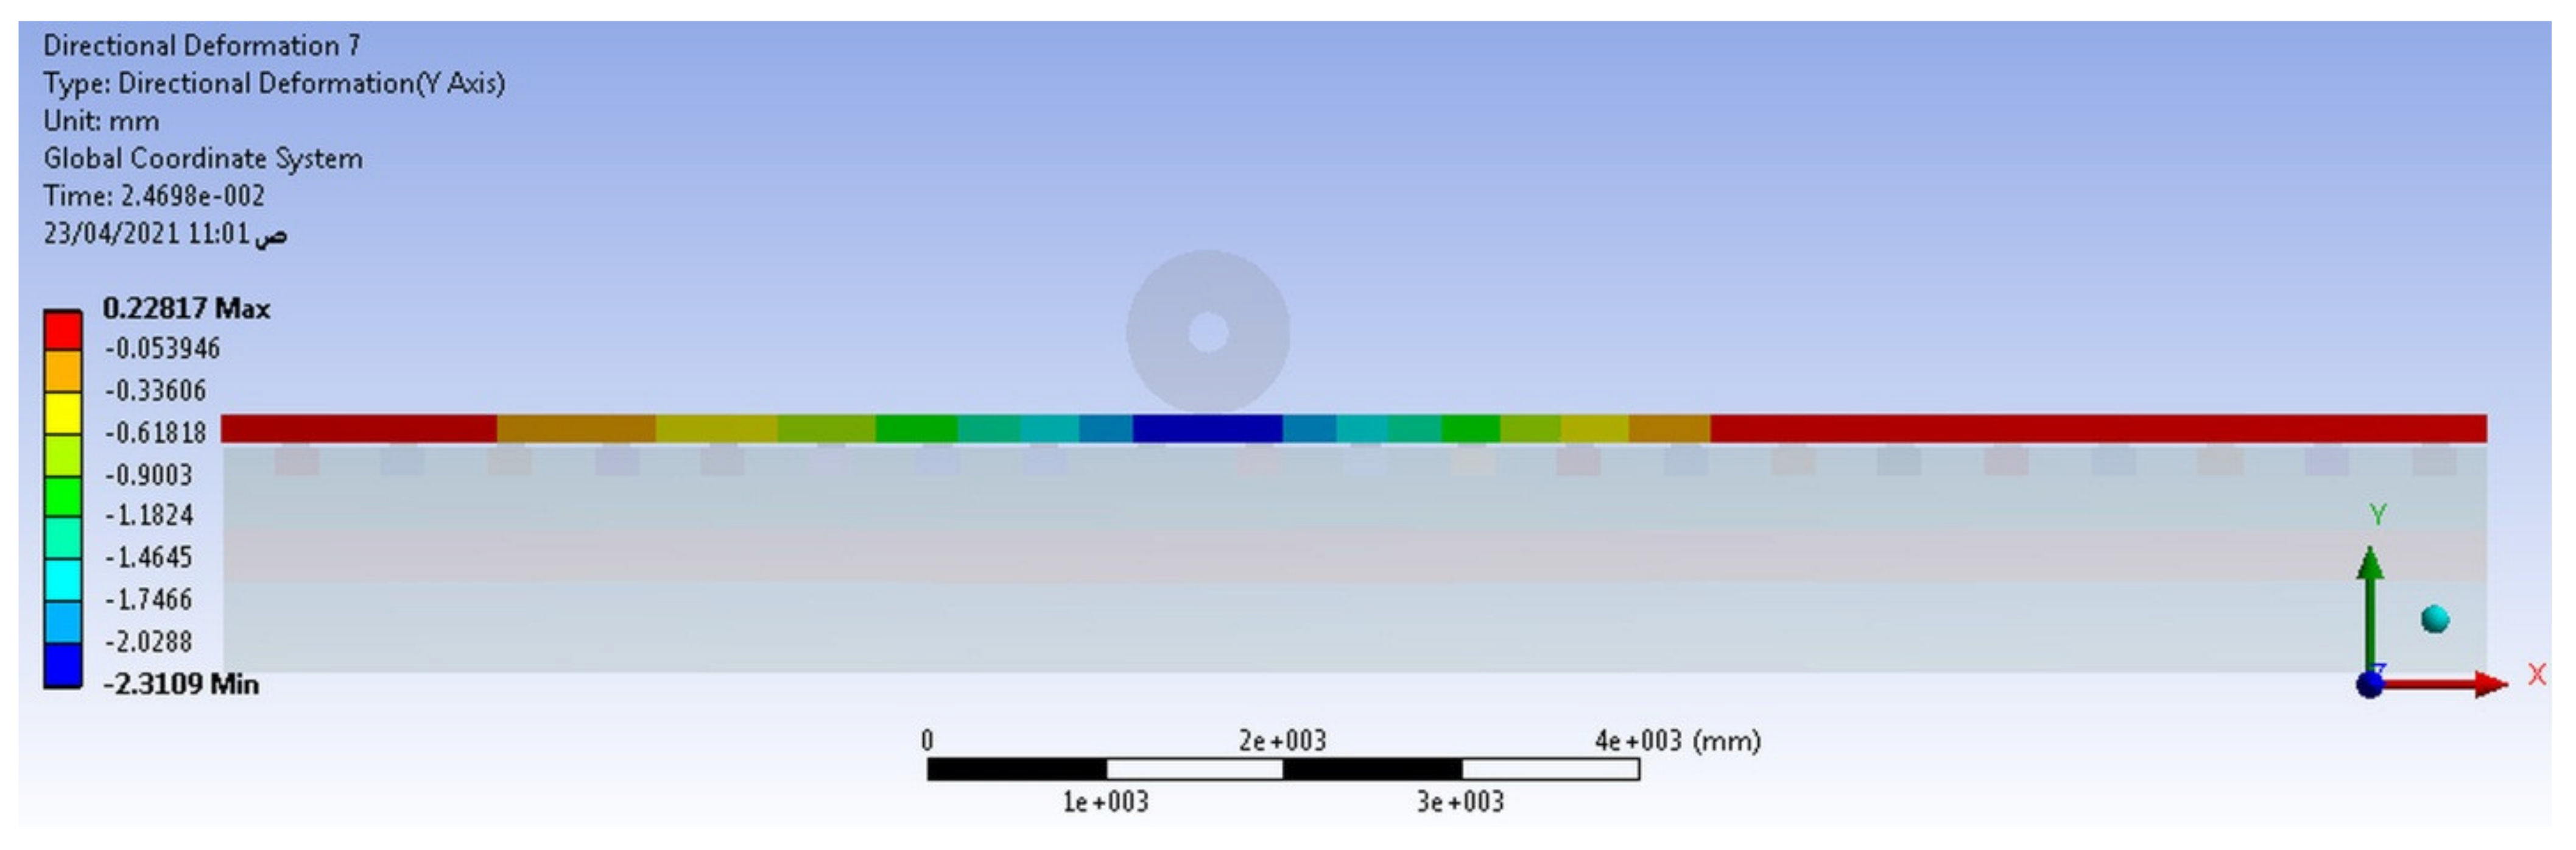
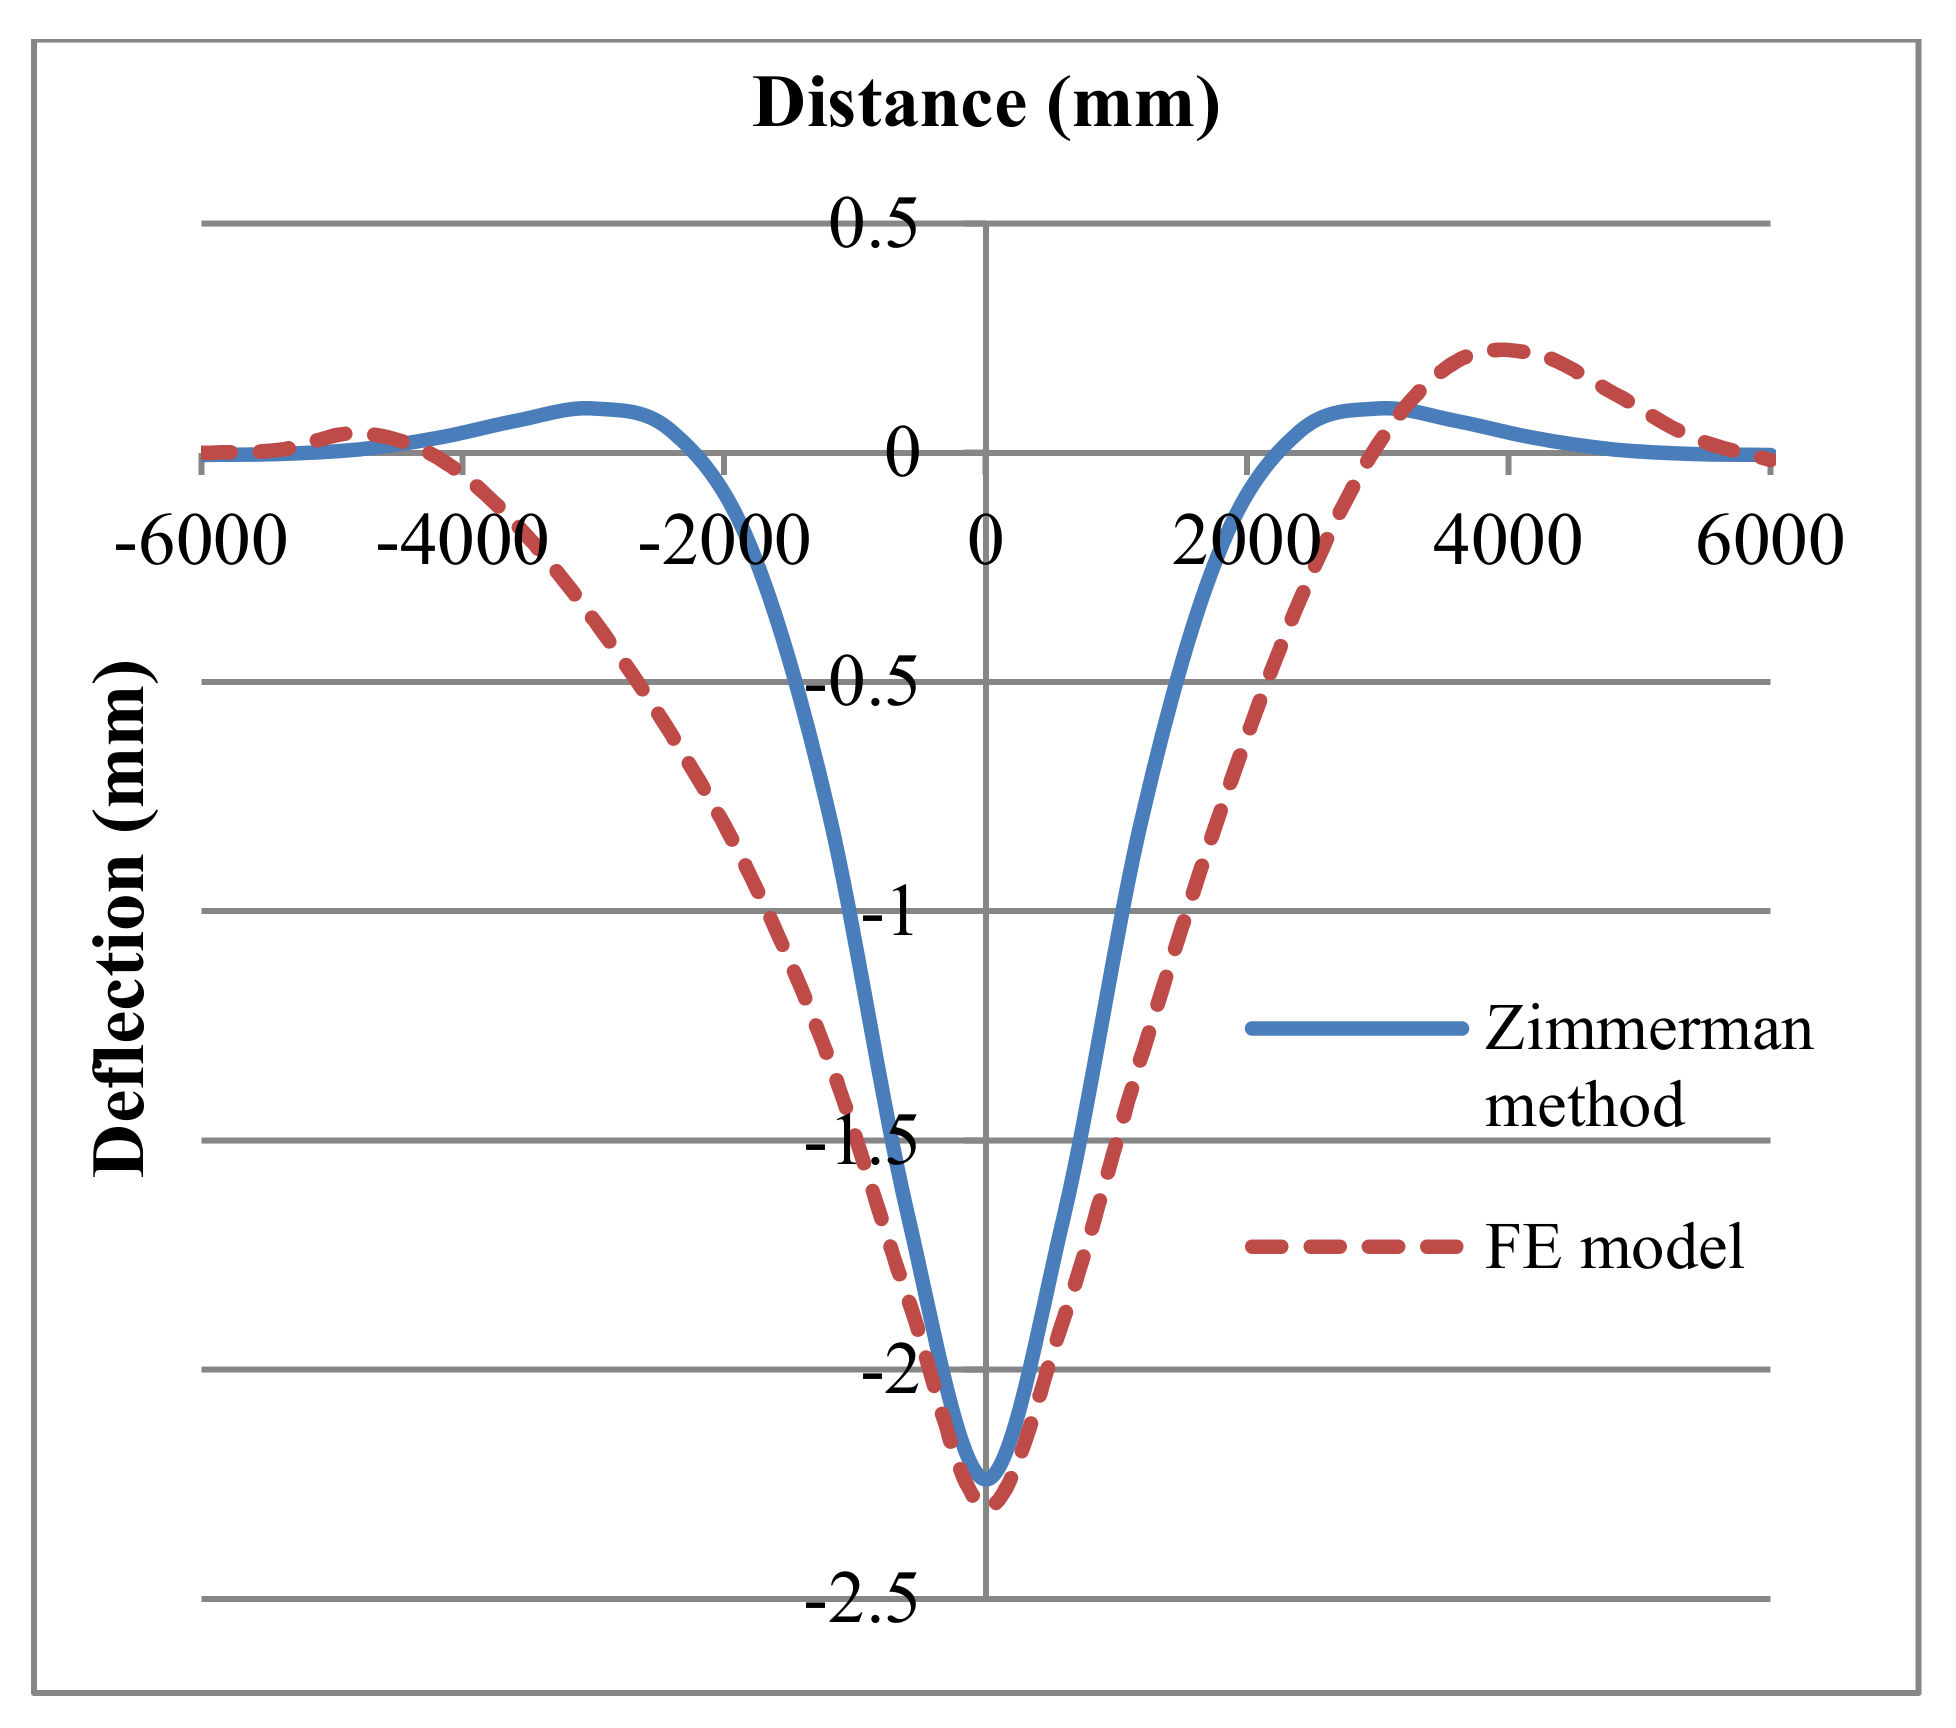
3.1. Zimmermann Method Verification
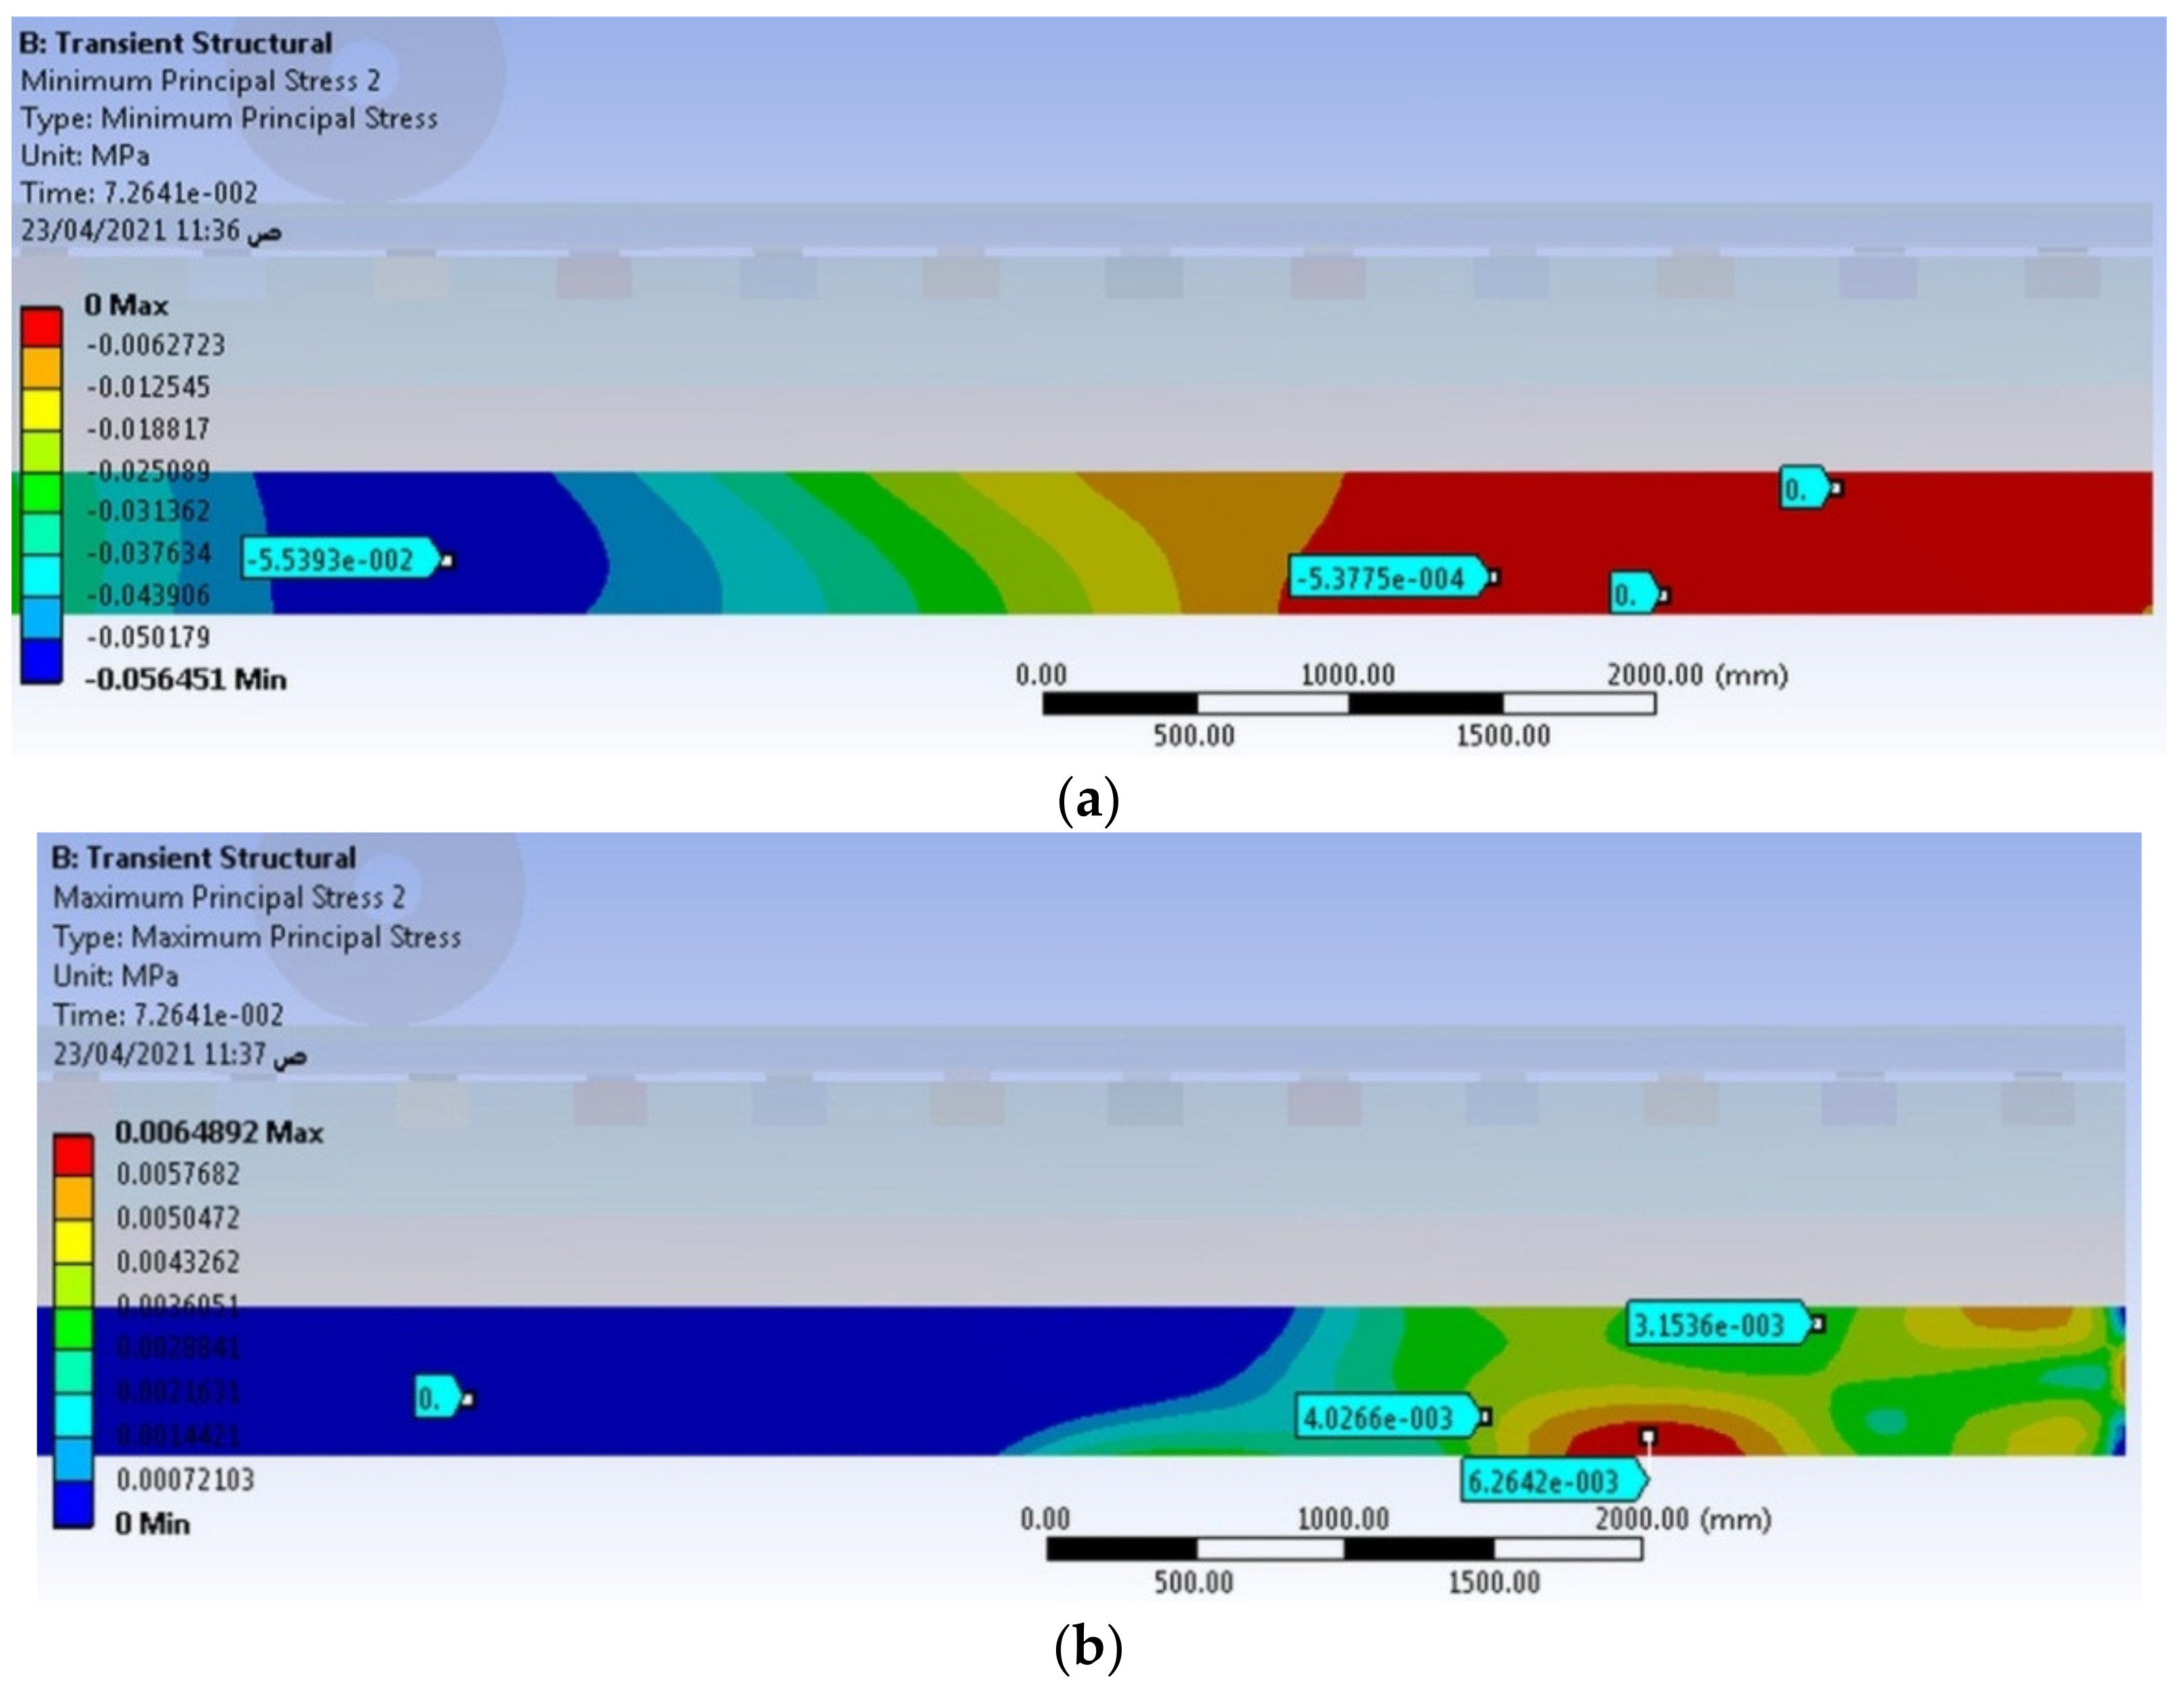
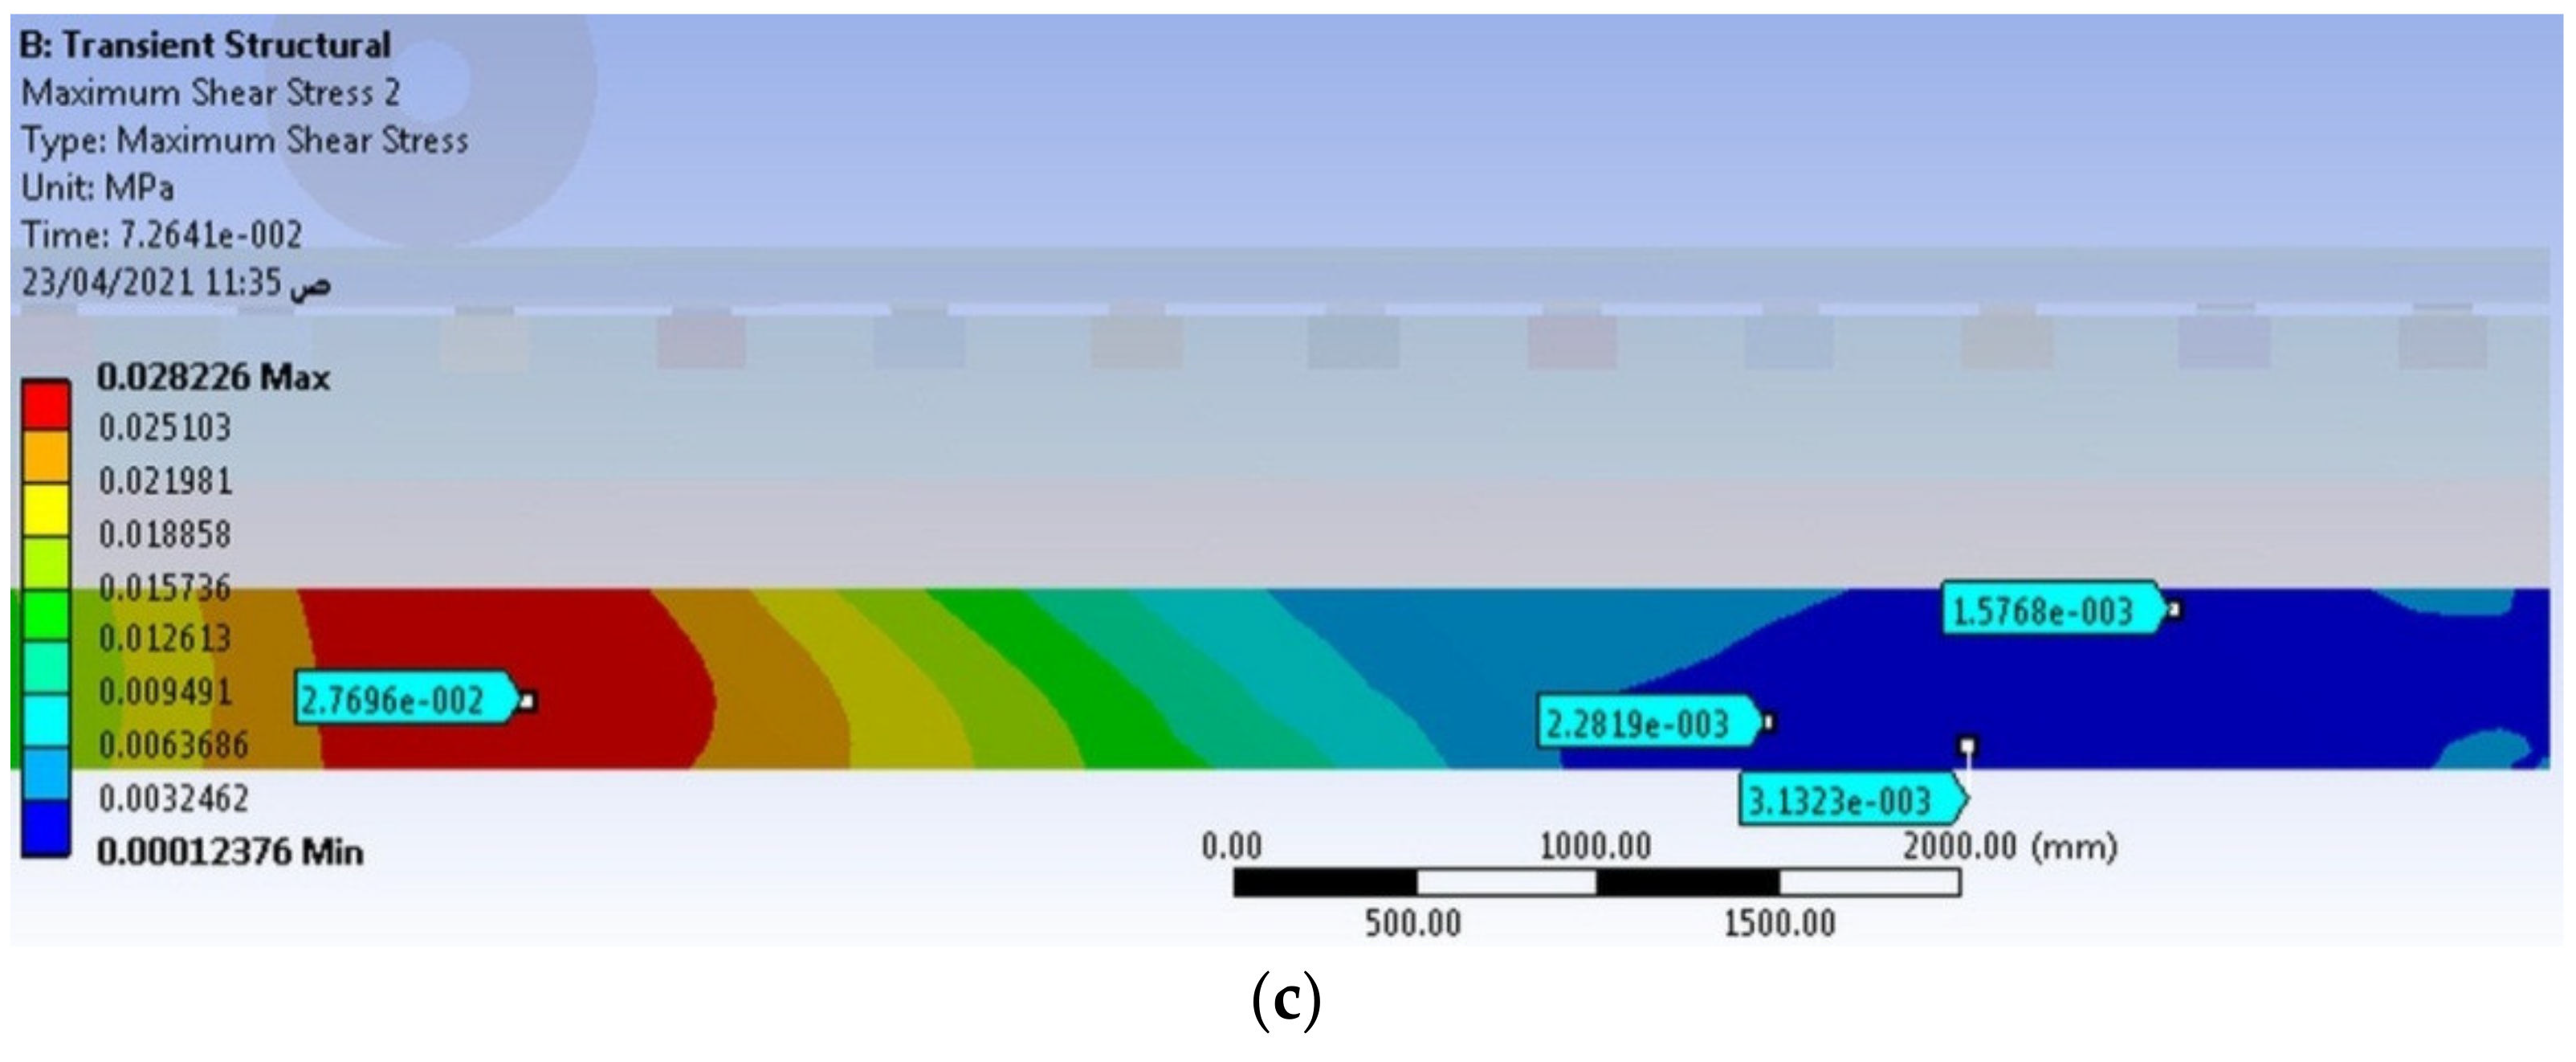
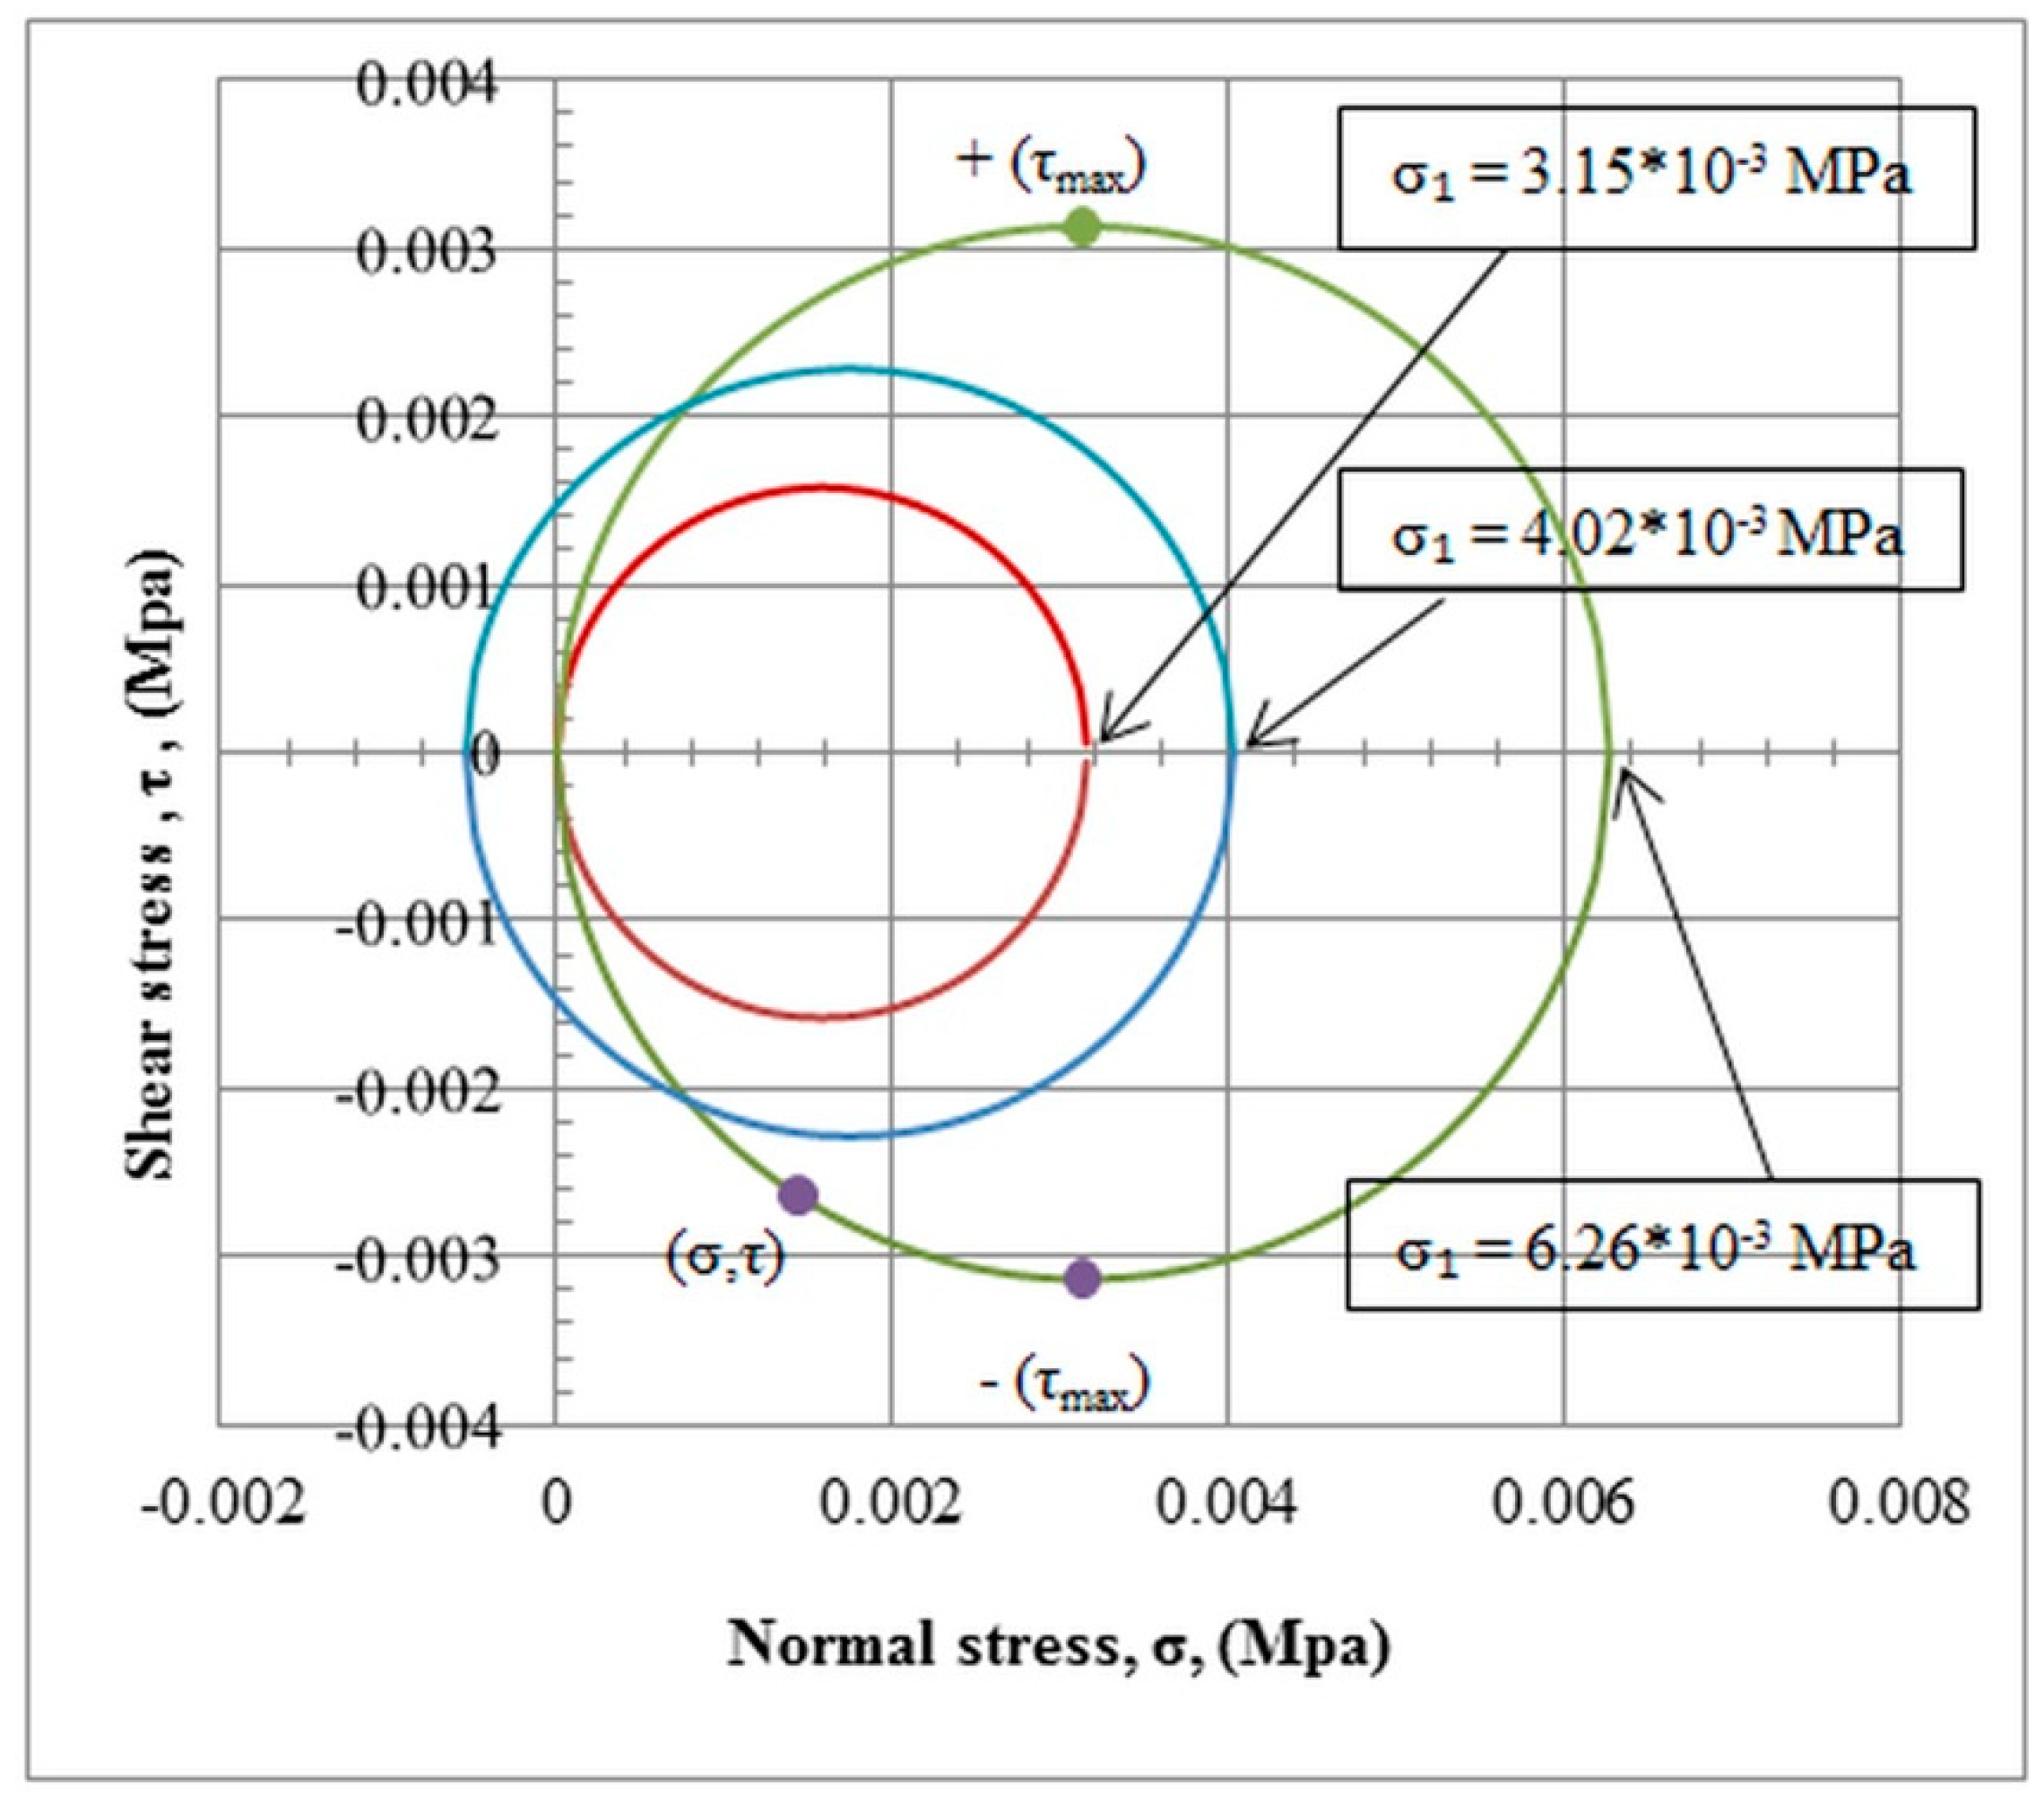
3.2. Mohr’s Circle Verification
4. Modeling and Results with Discussion
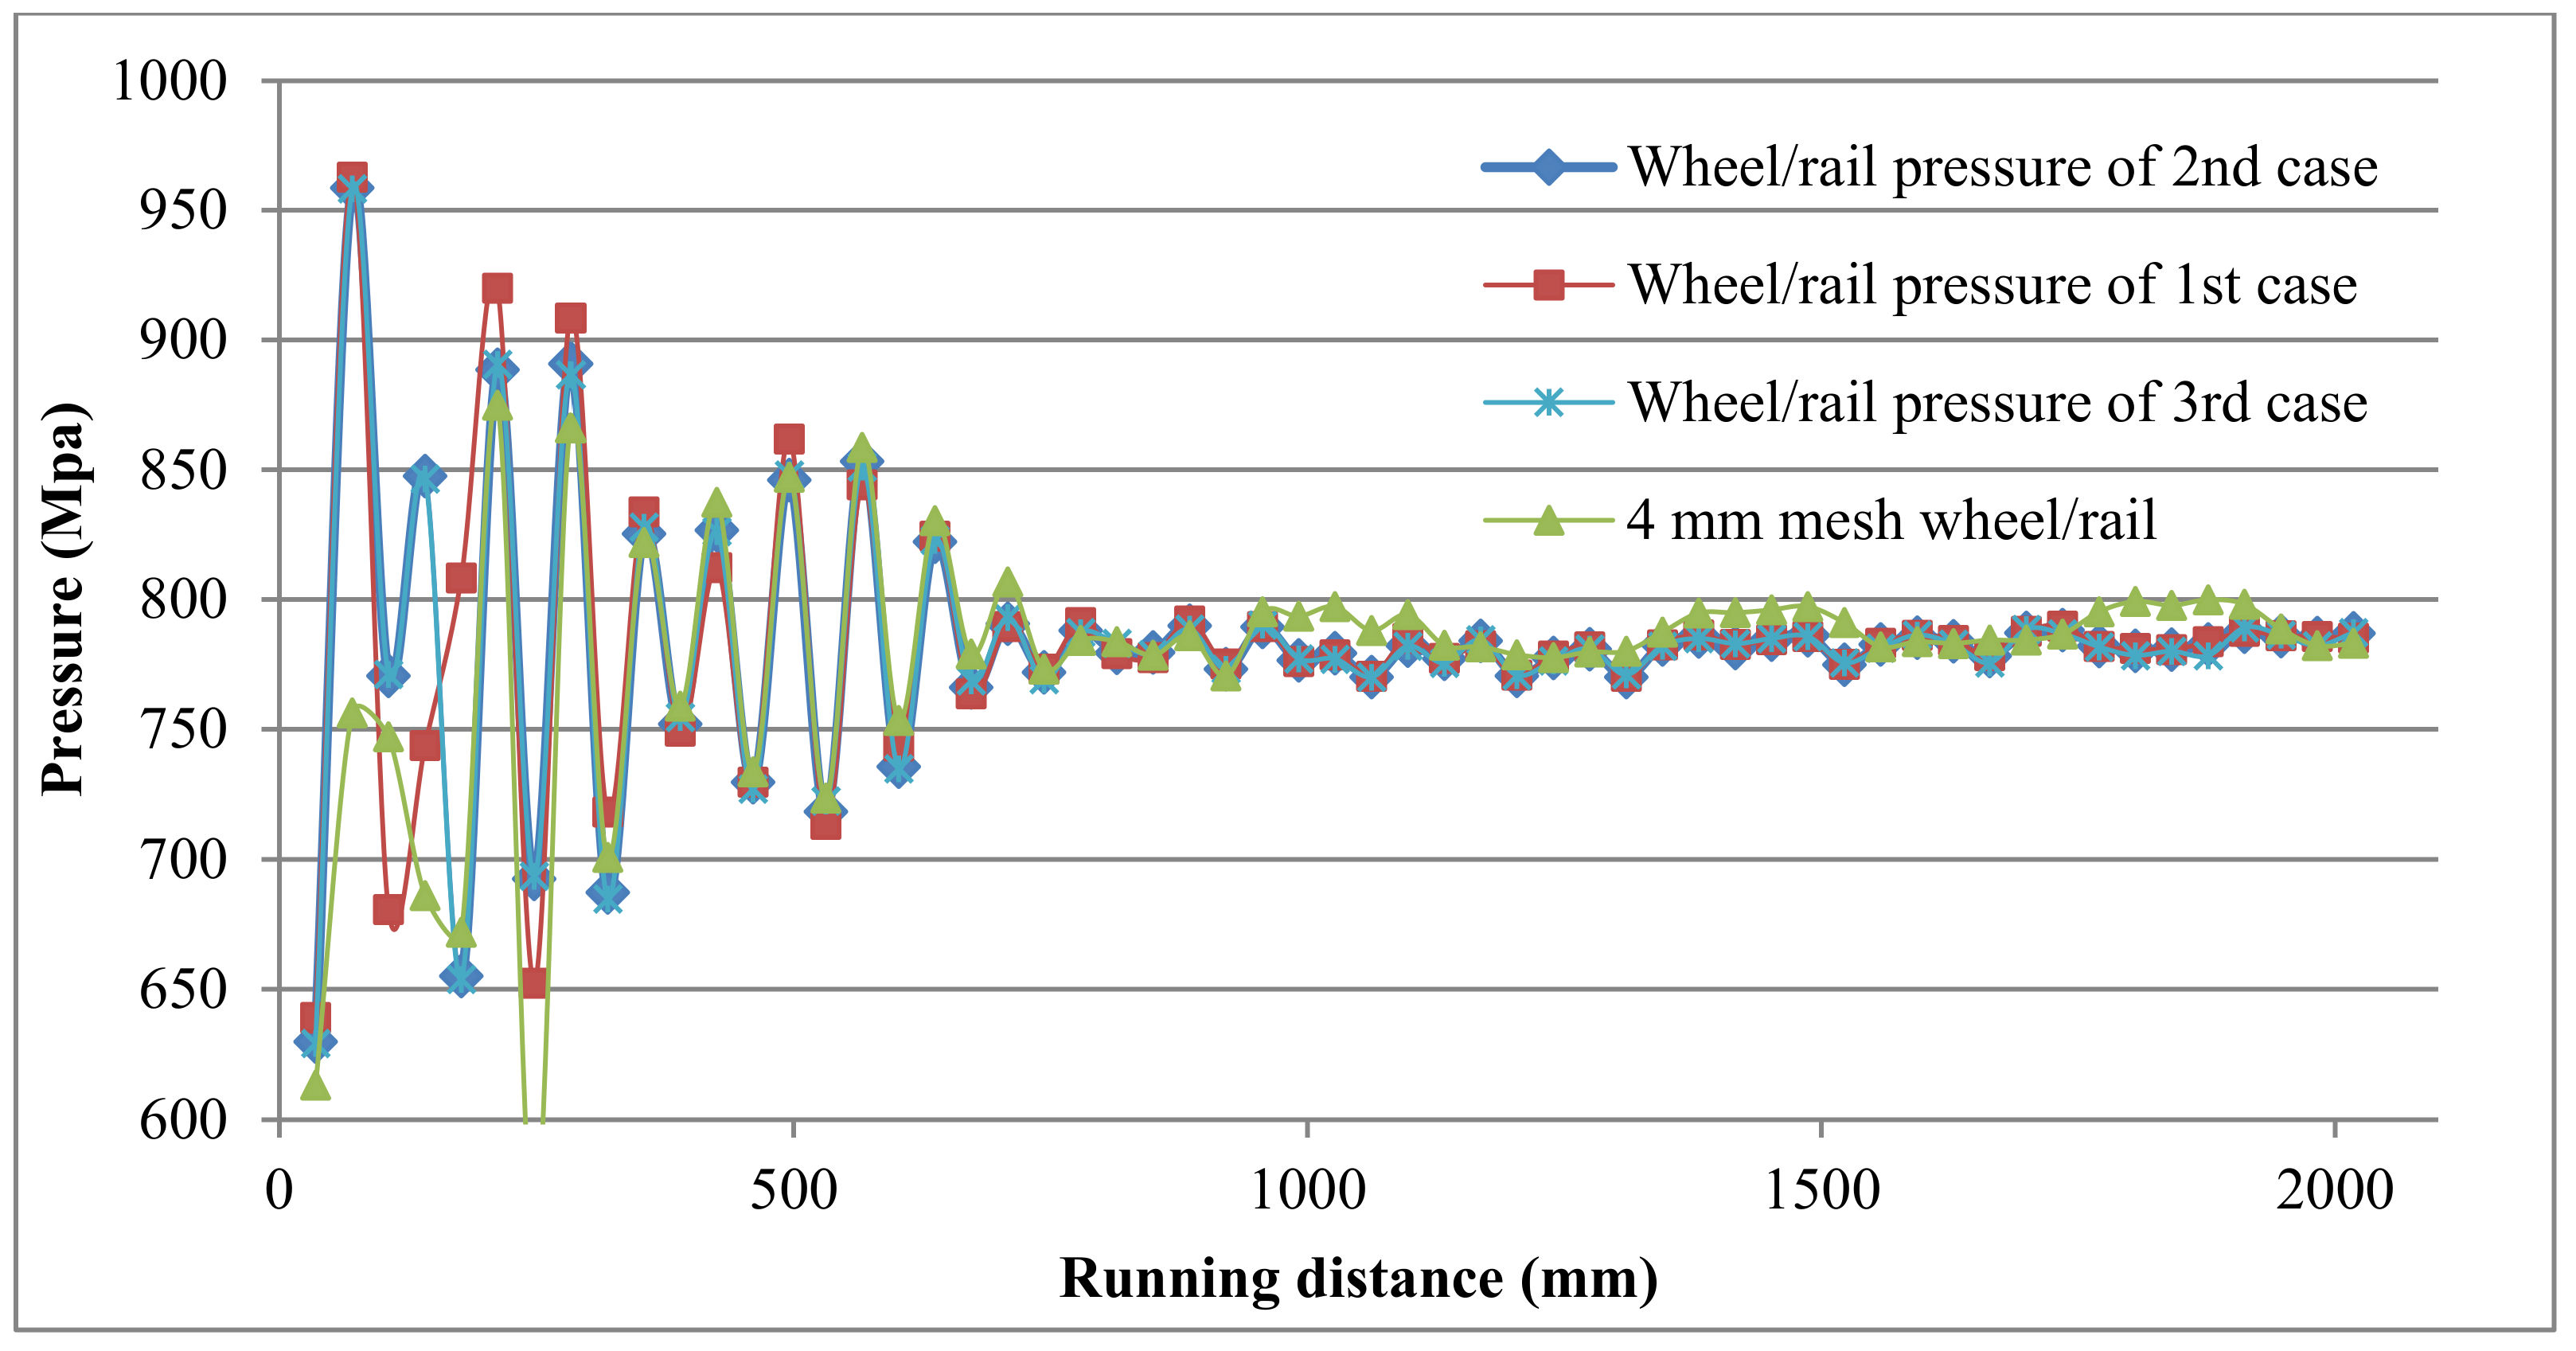
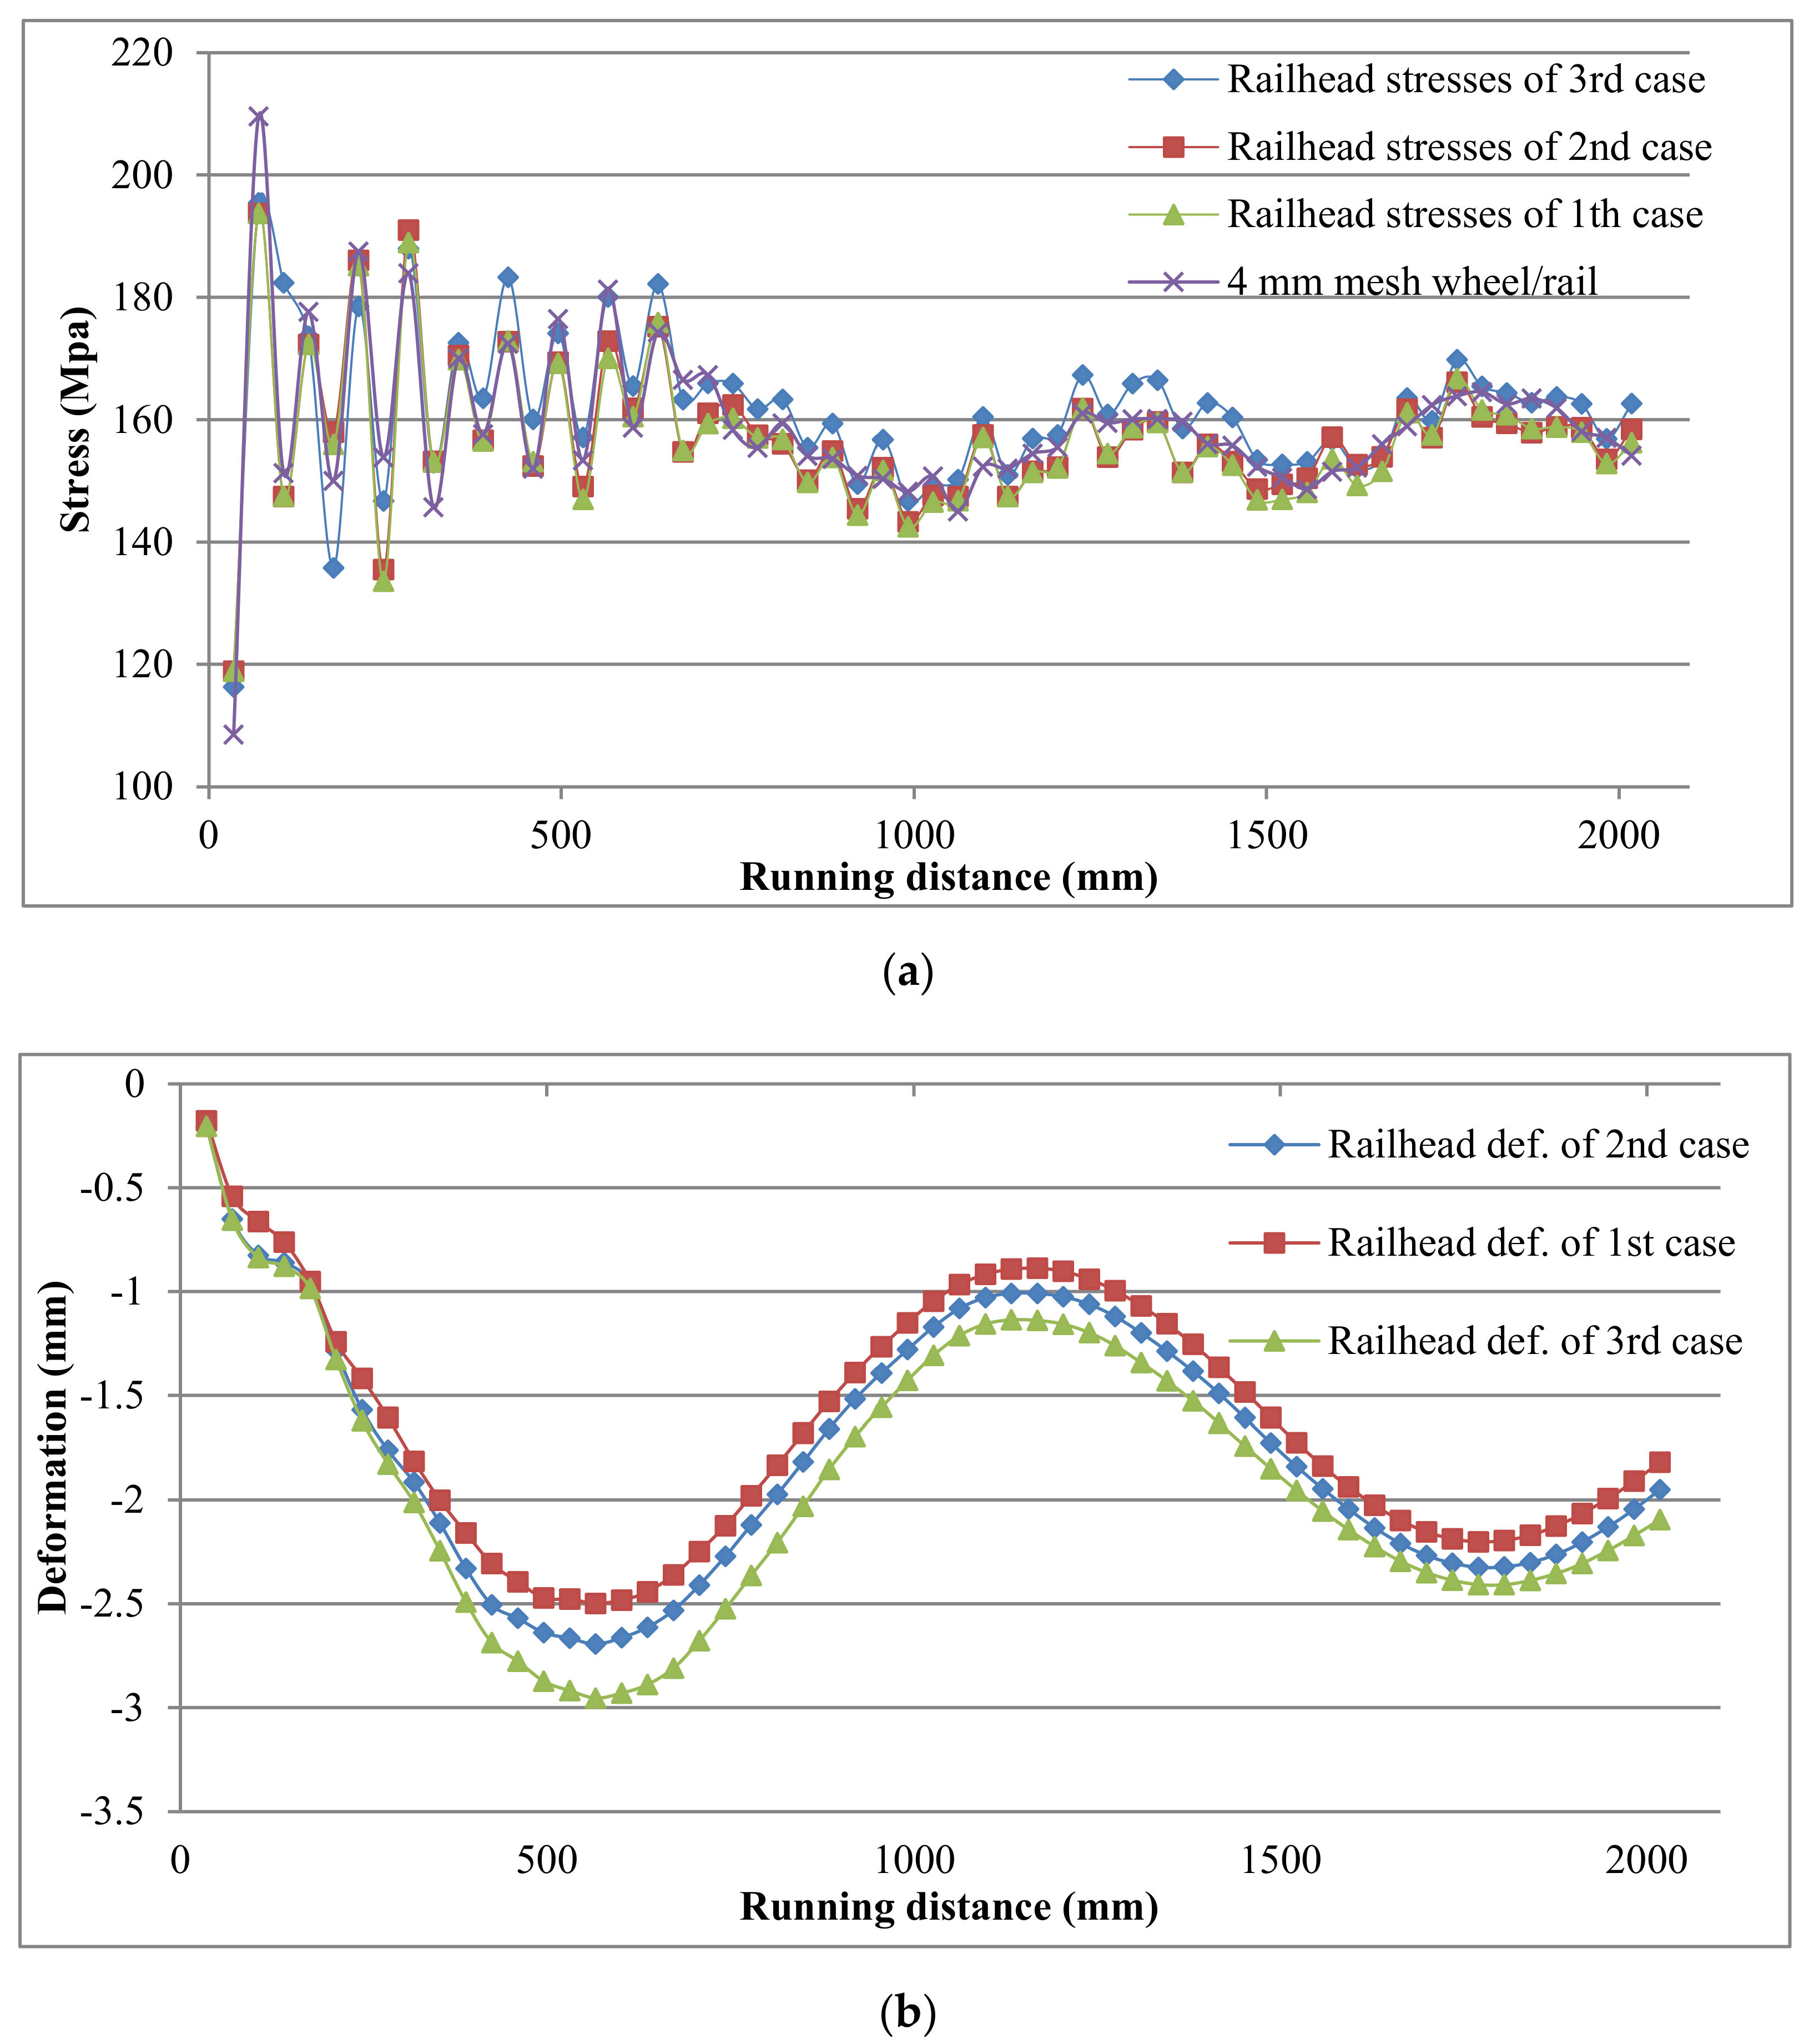
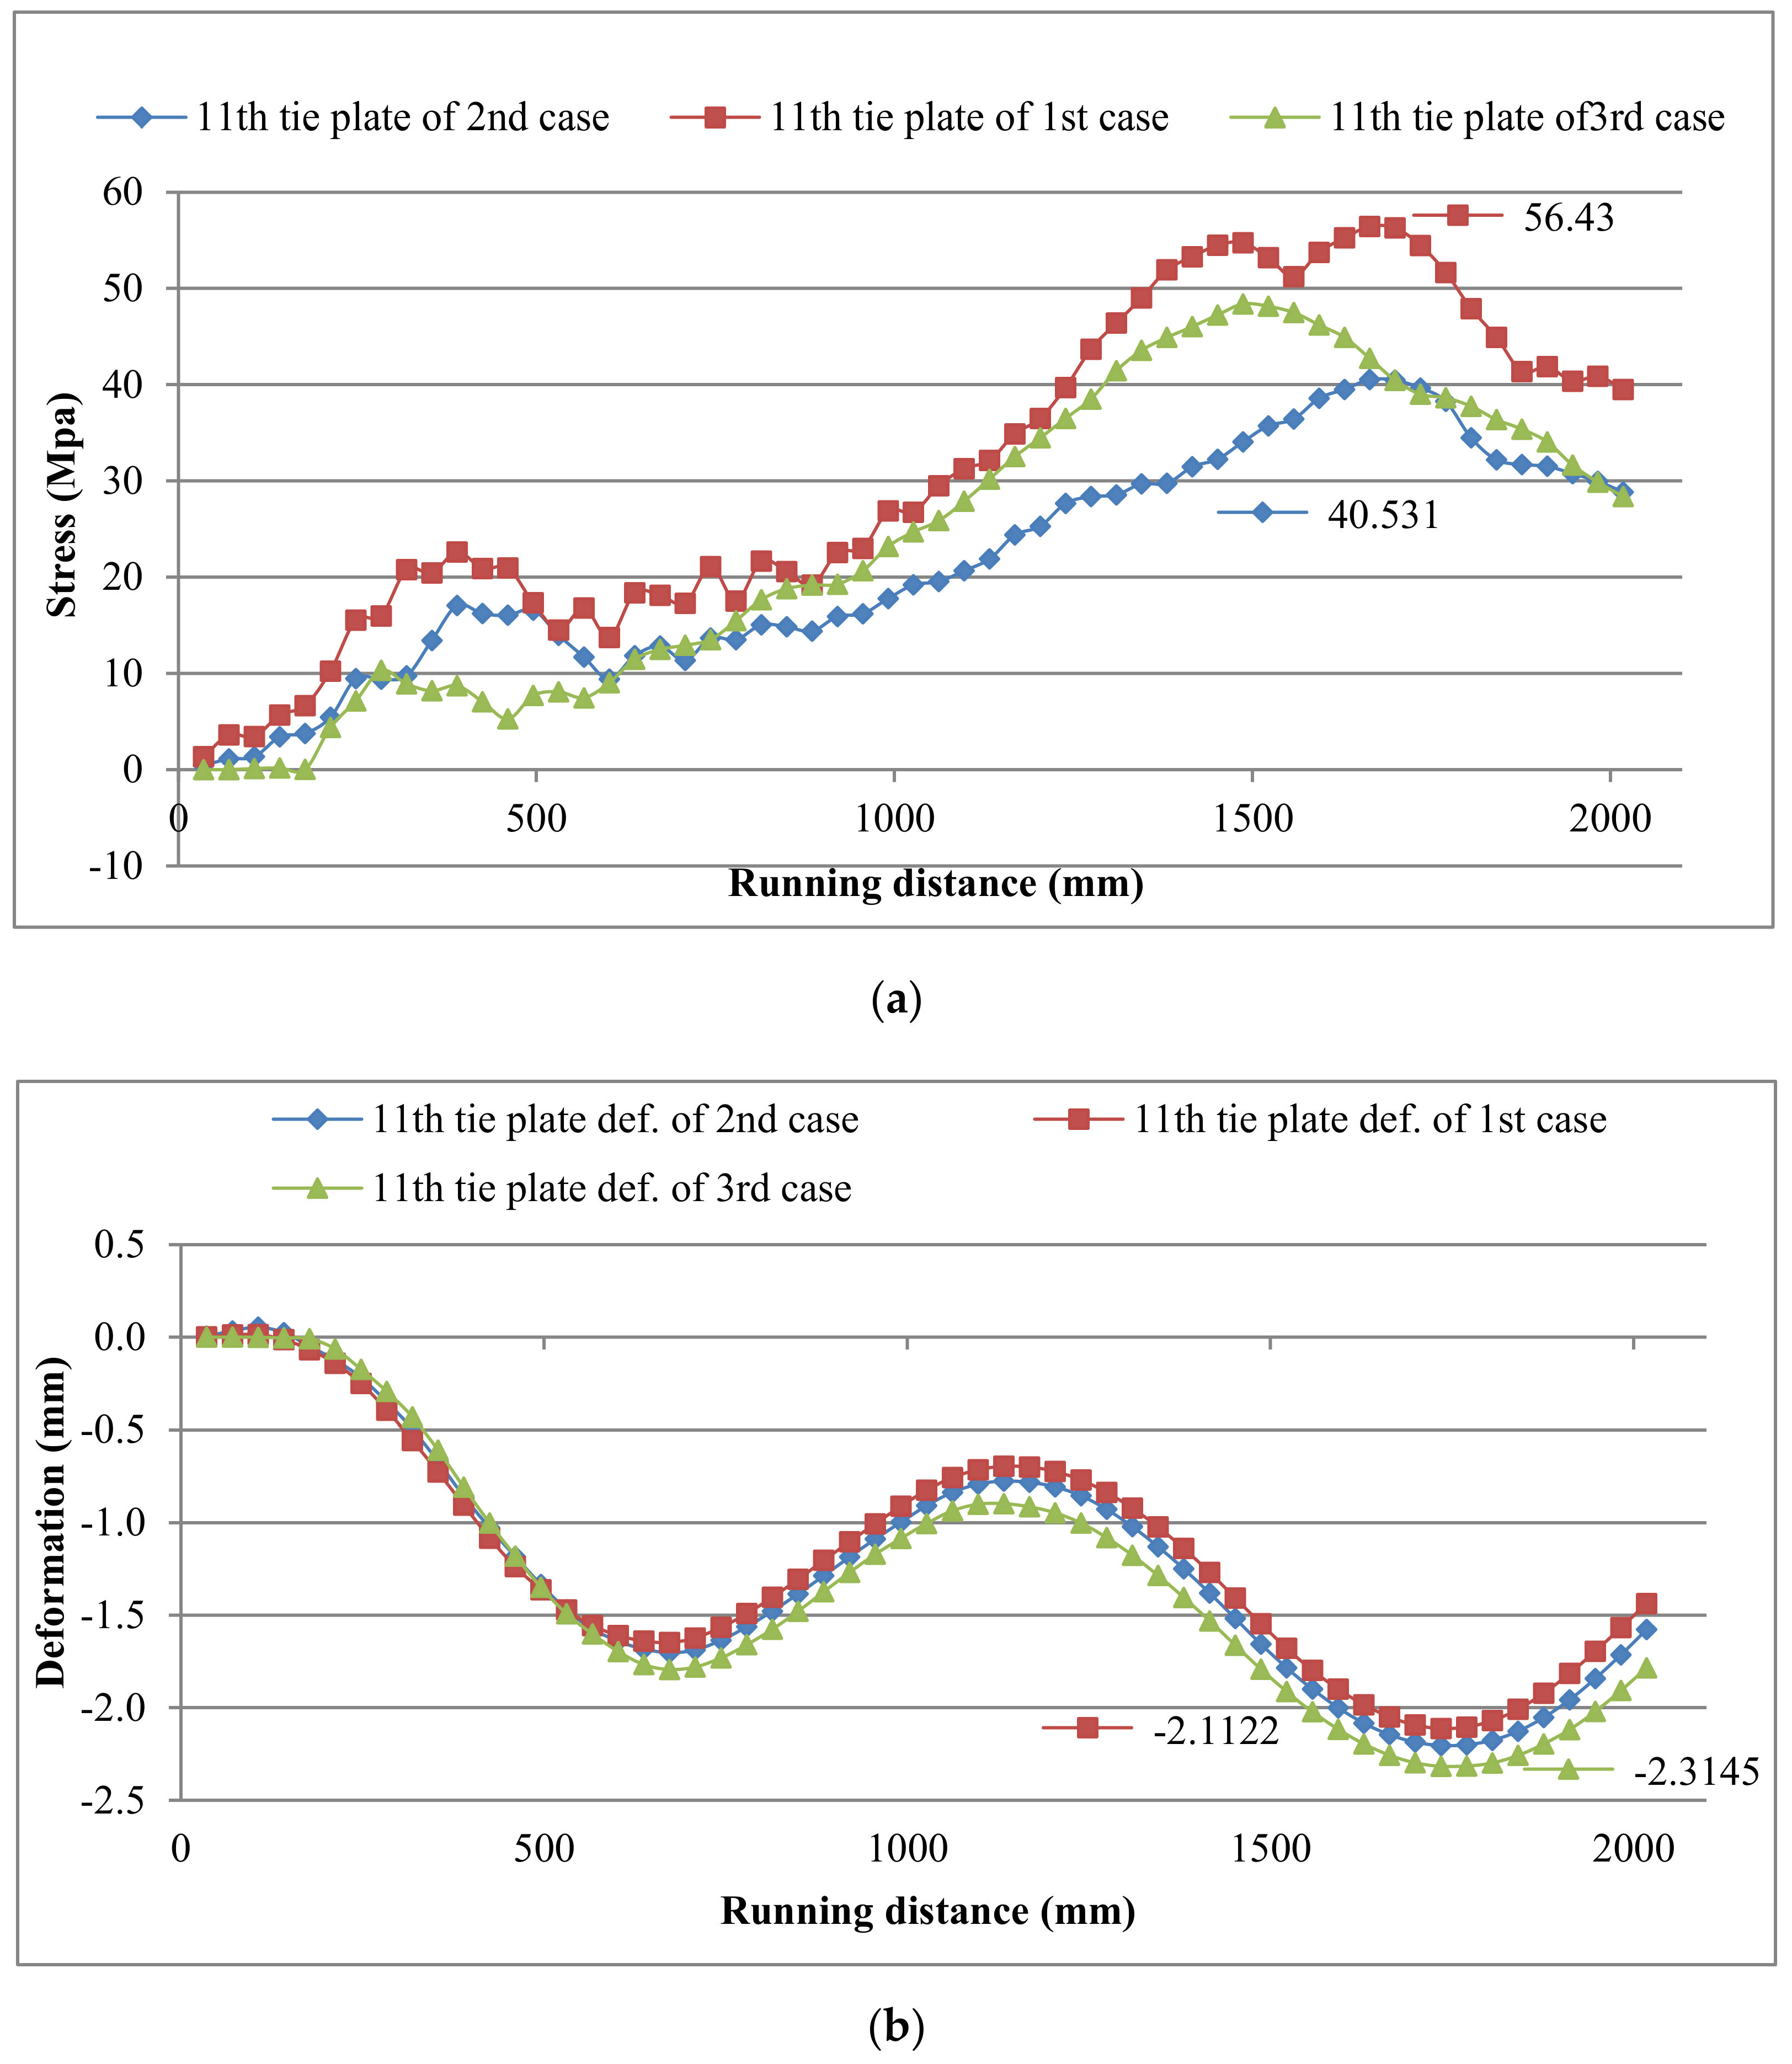
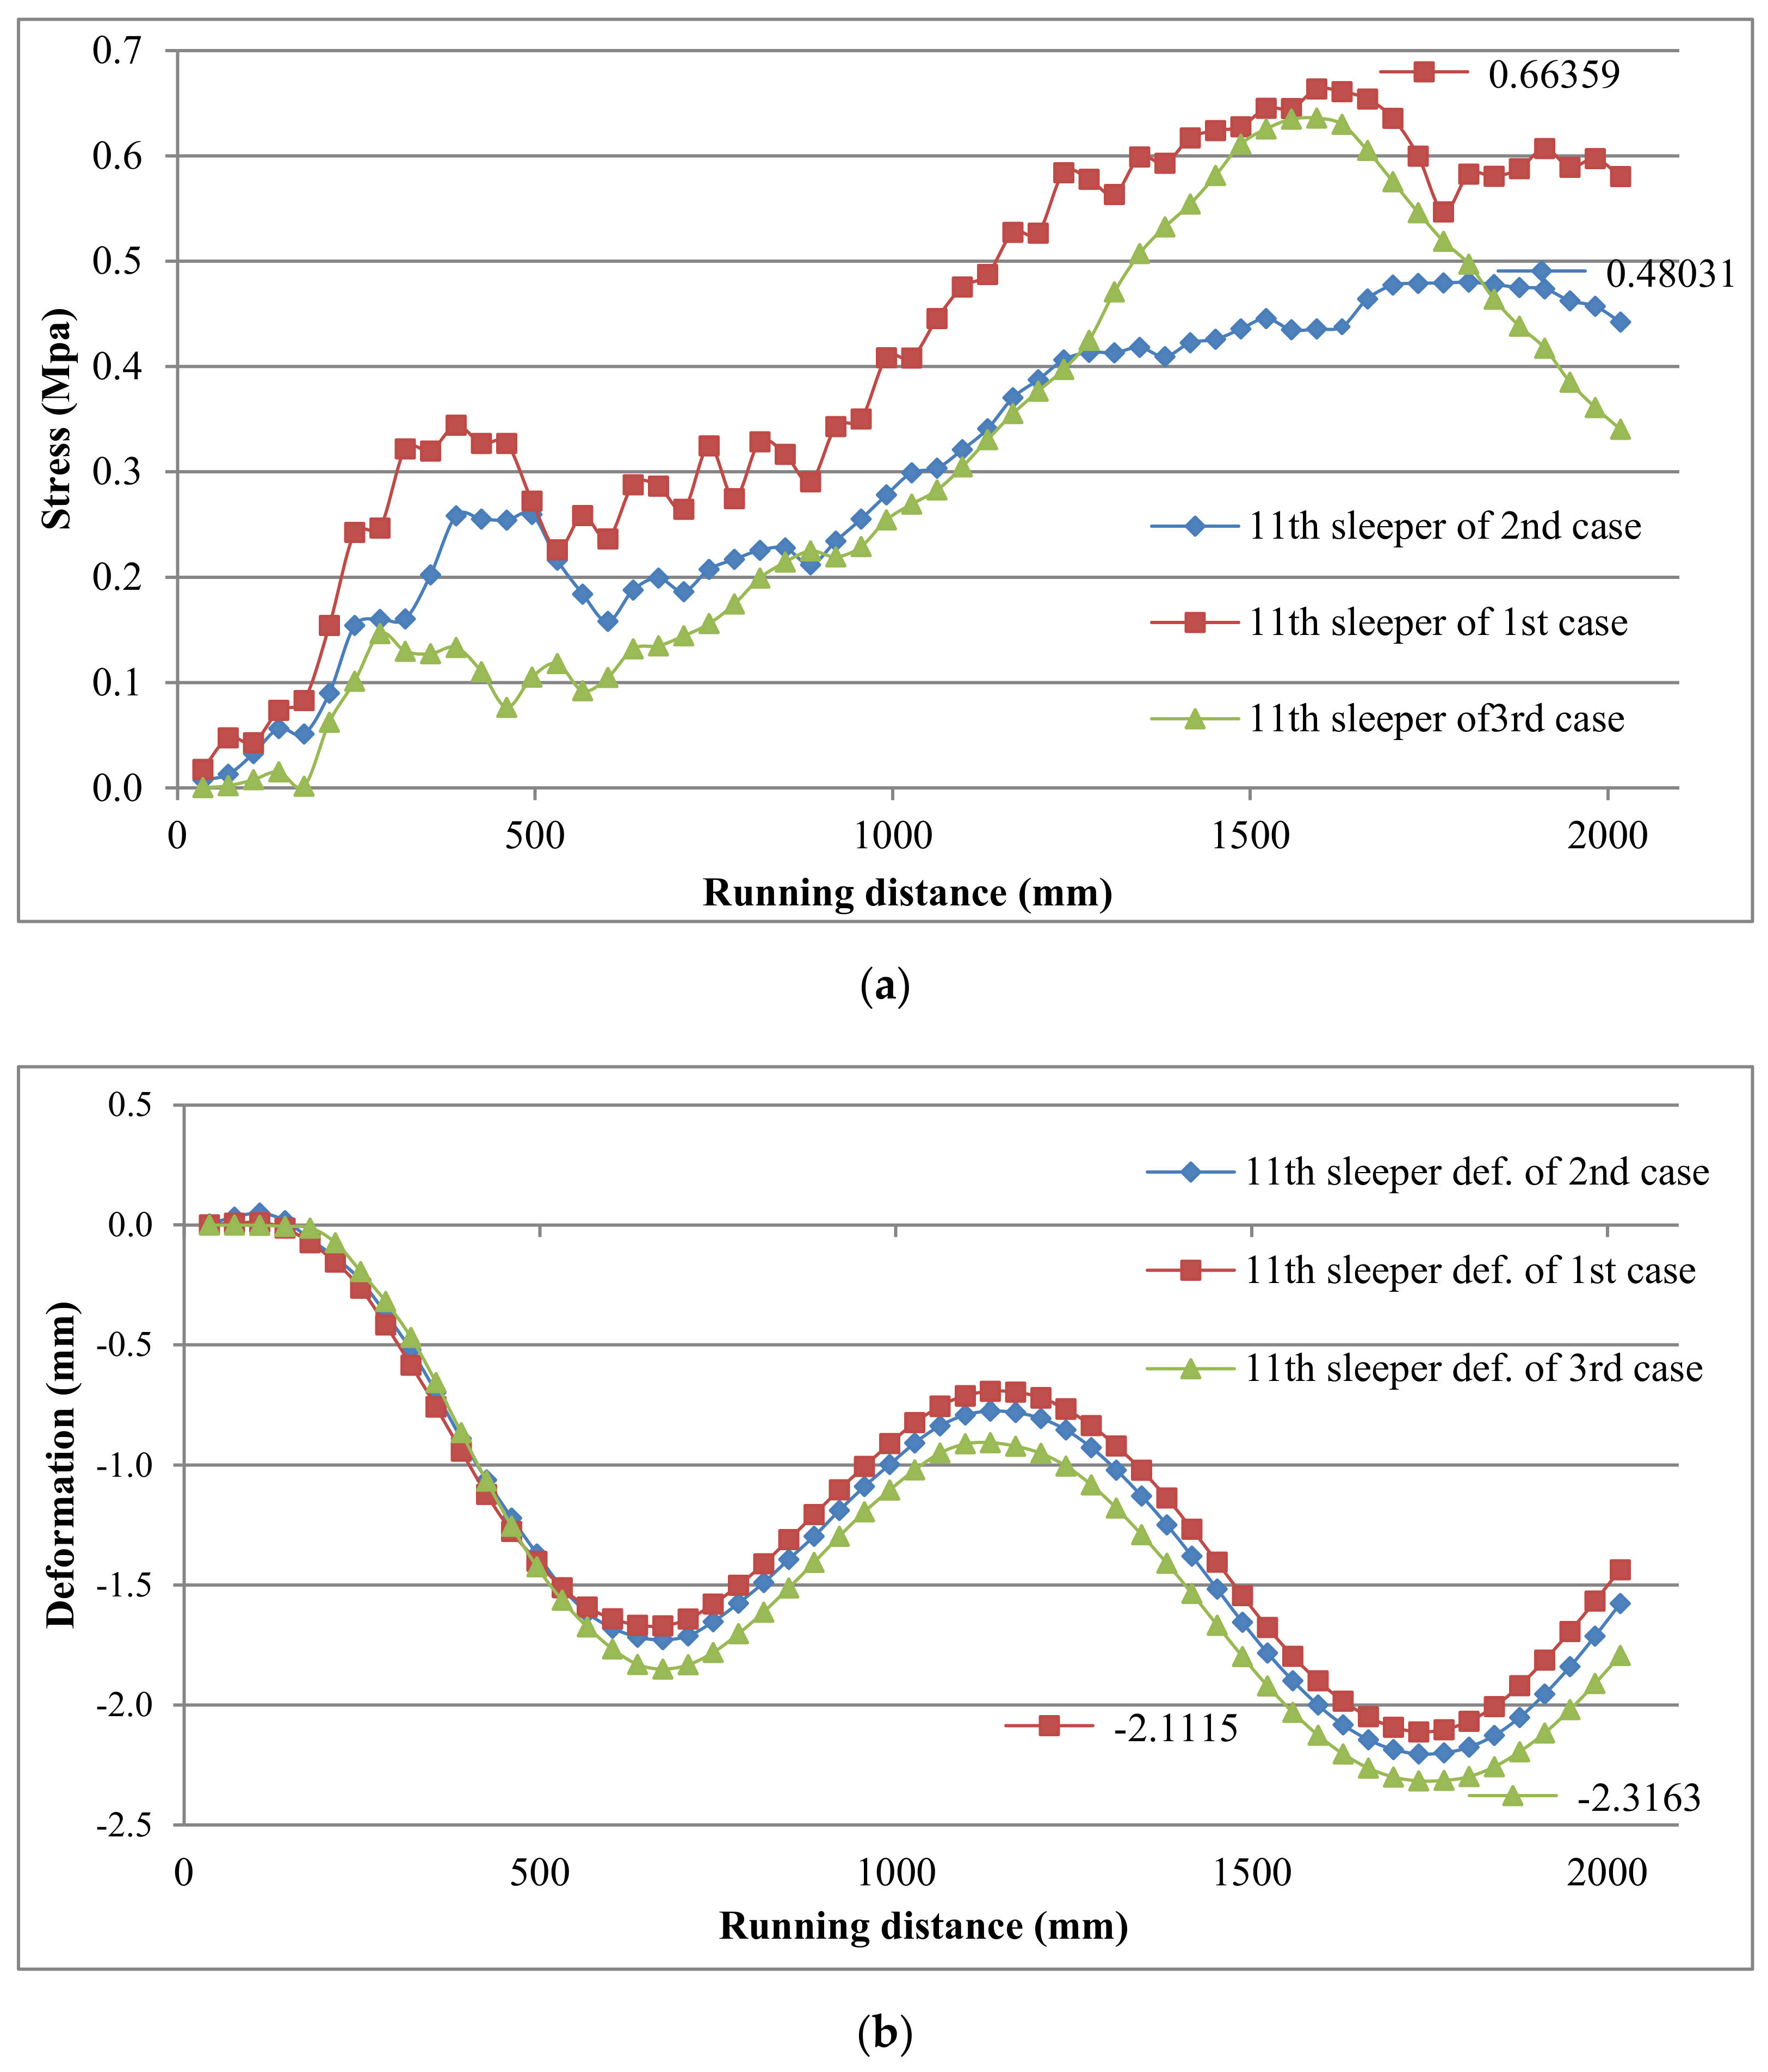
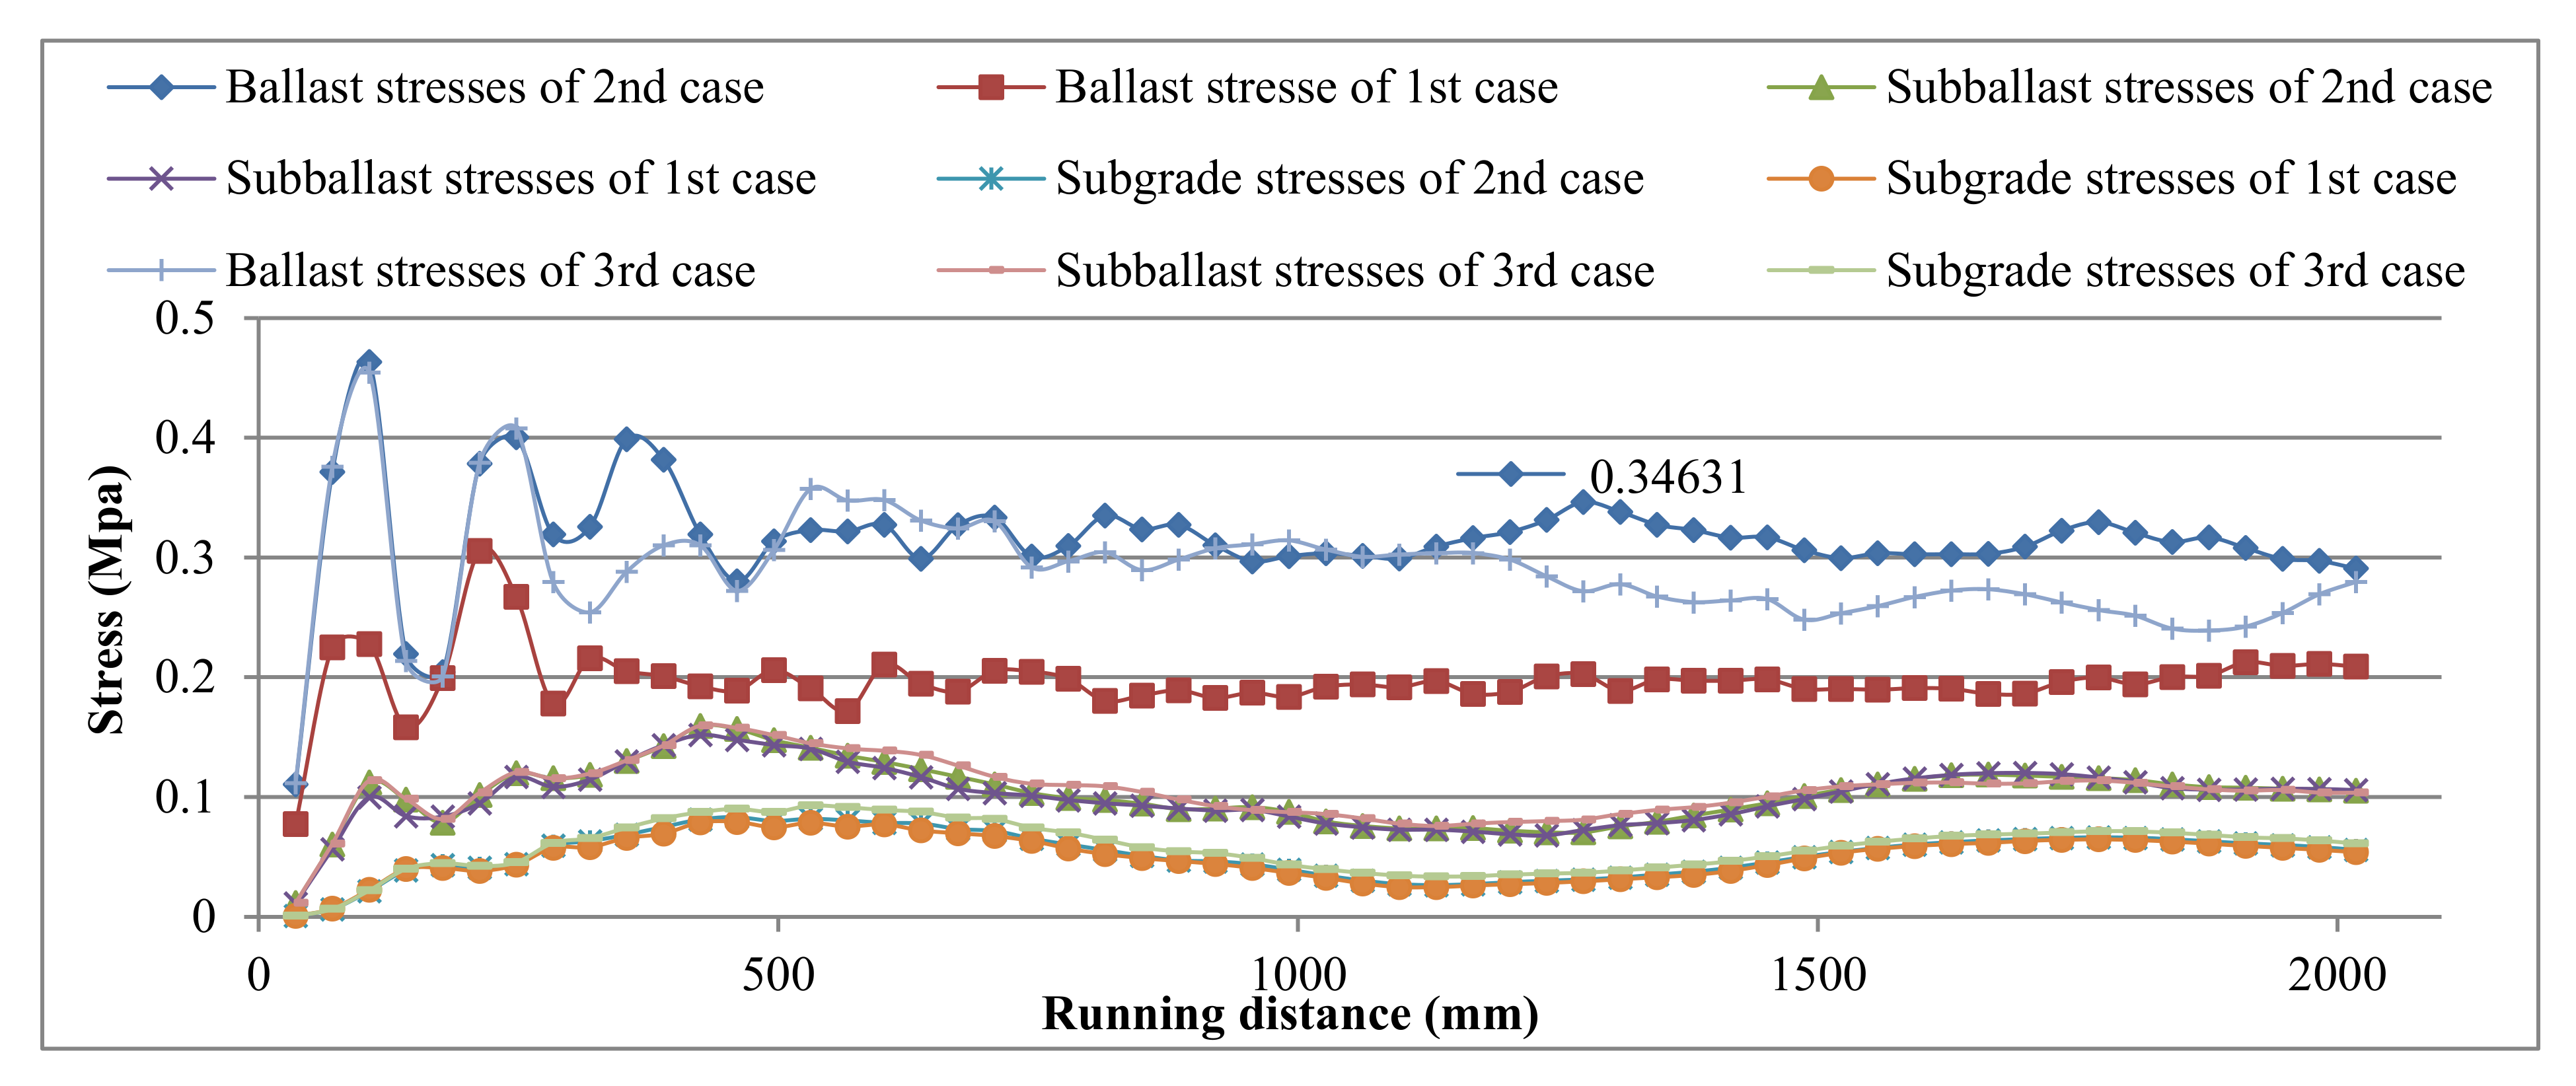
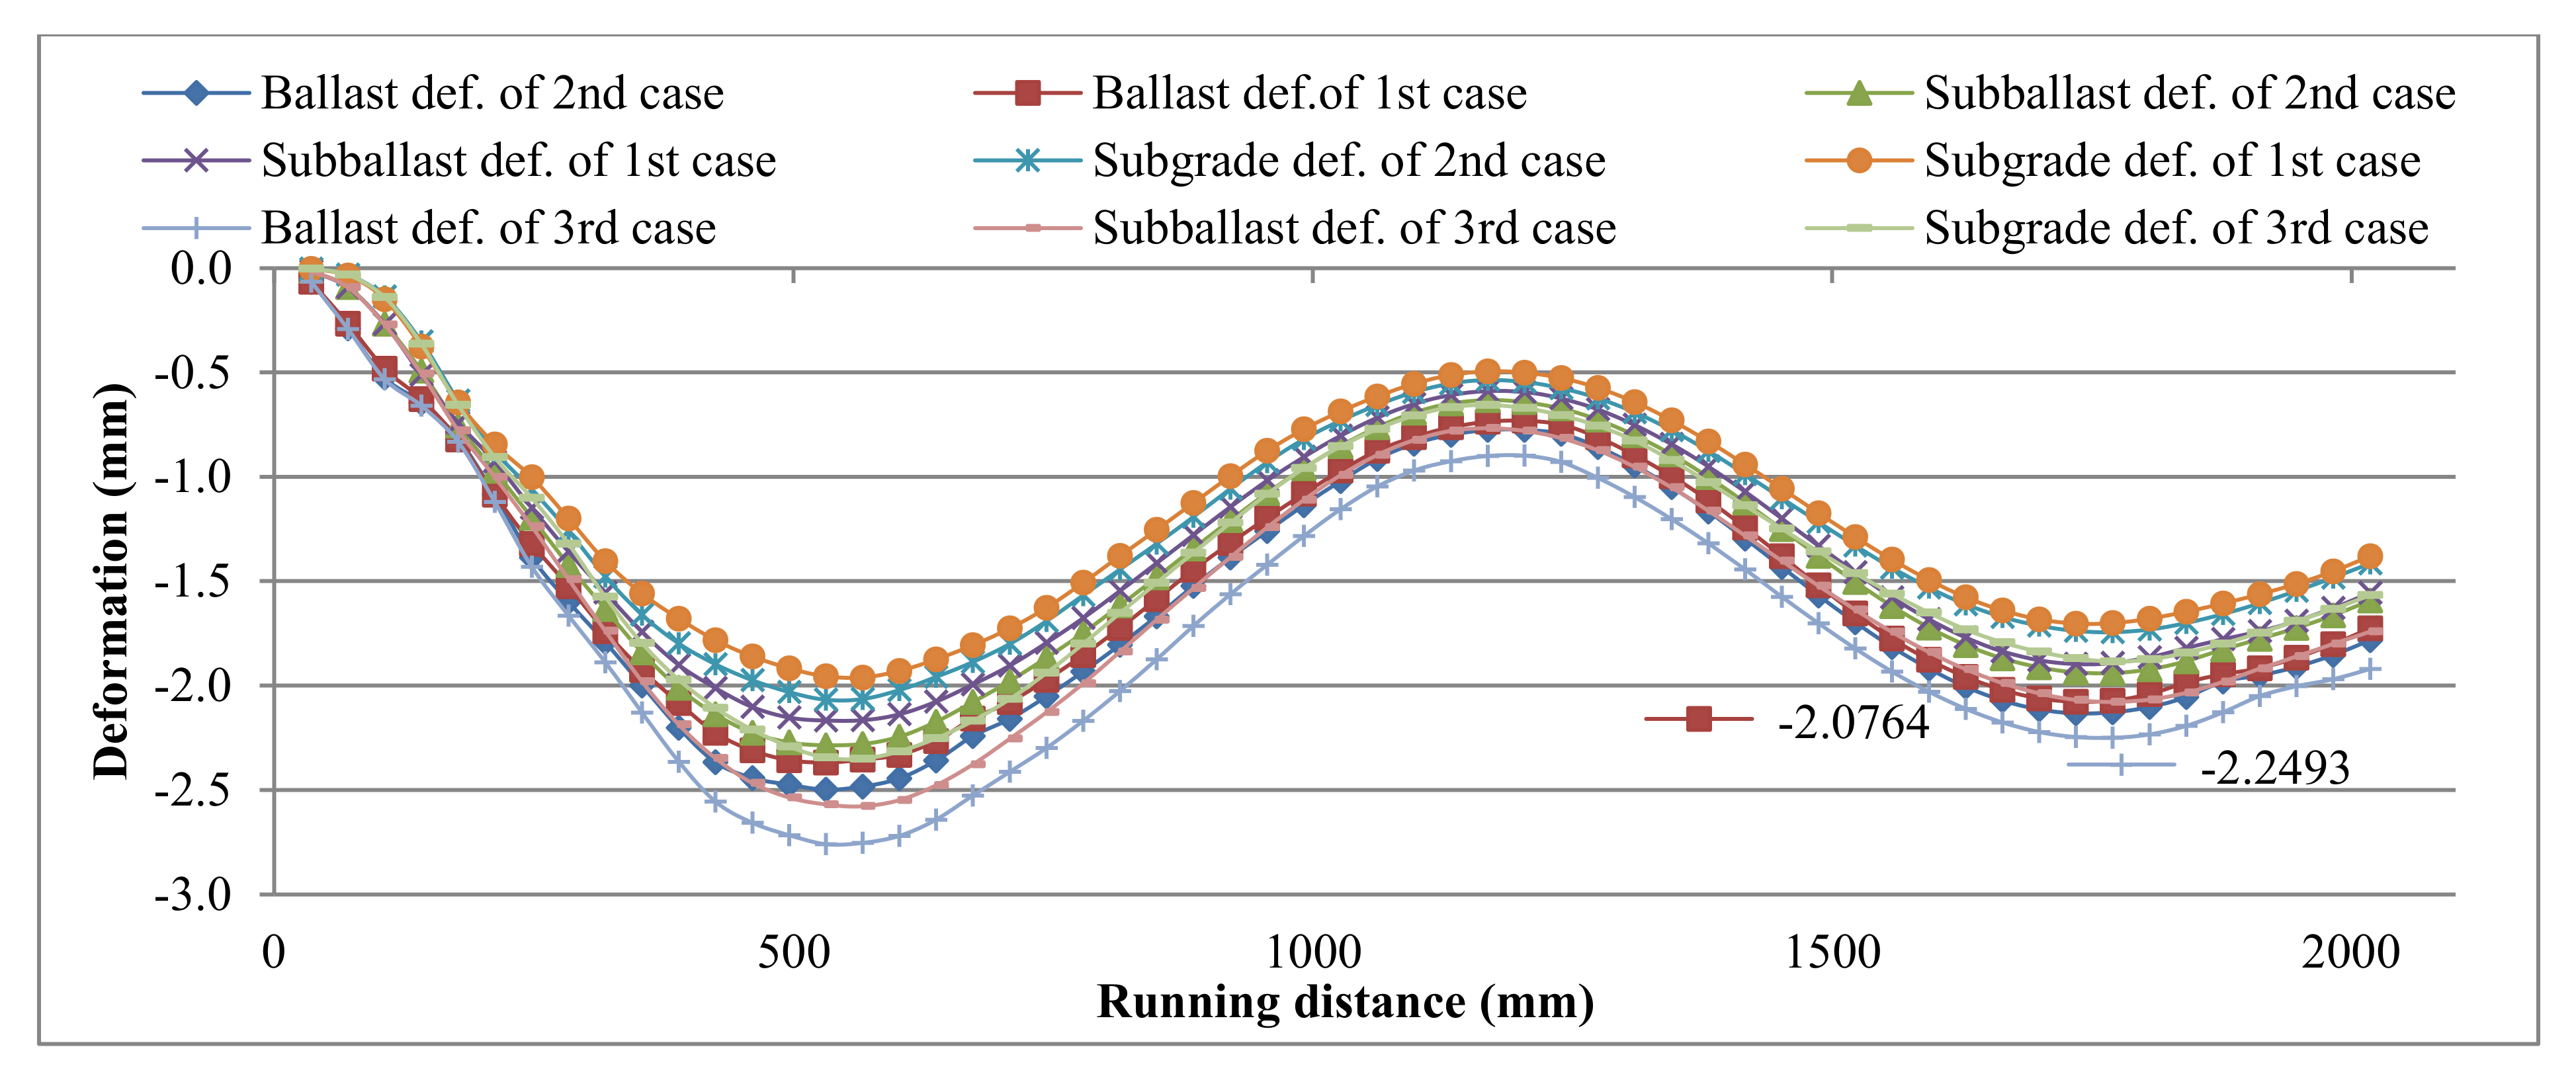
4.1. States without Settlement of the Three Cases
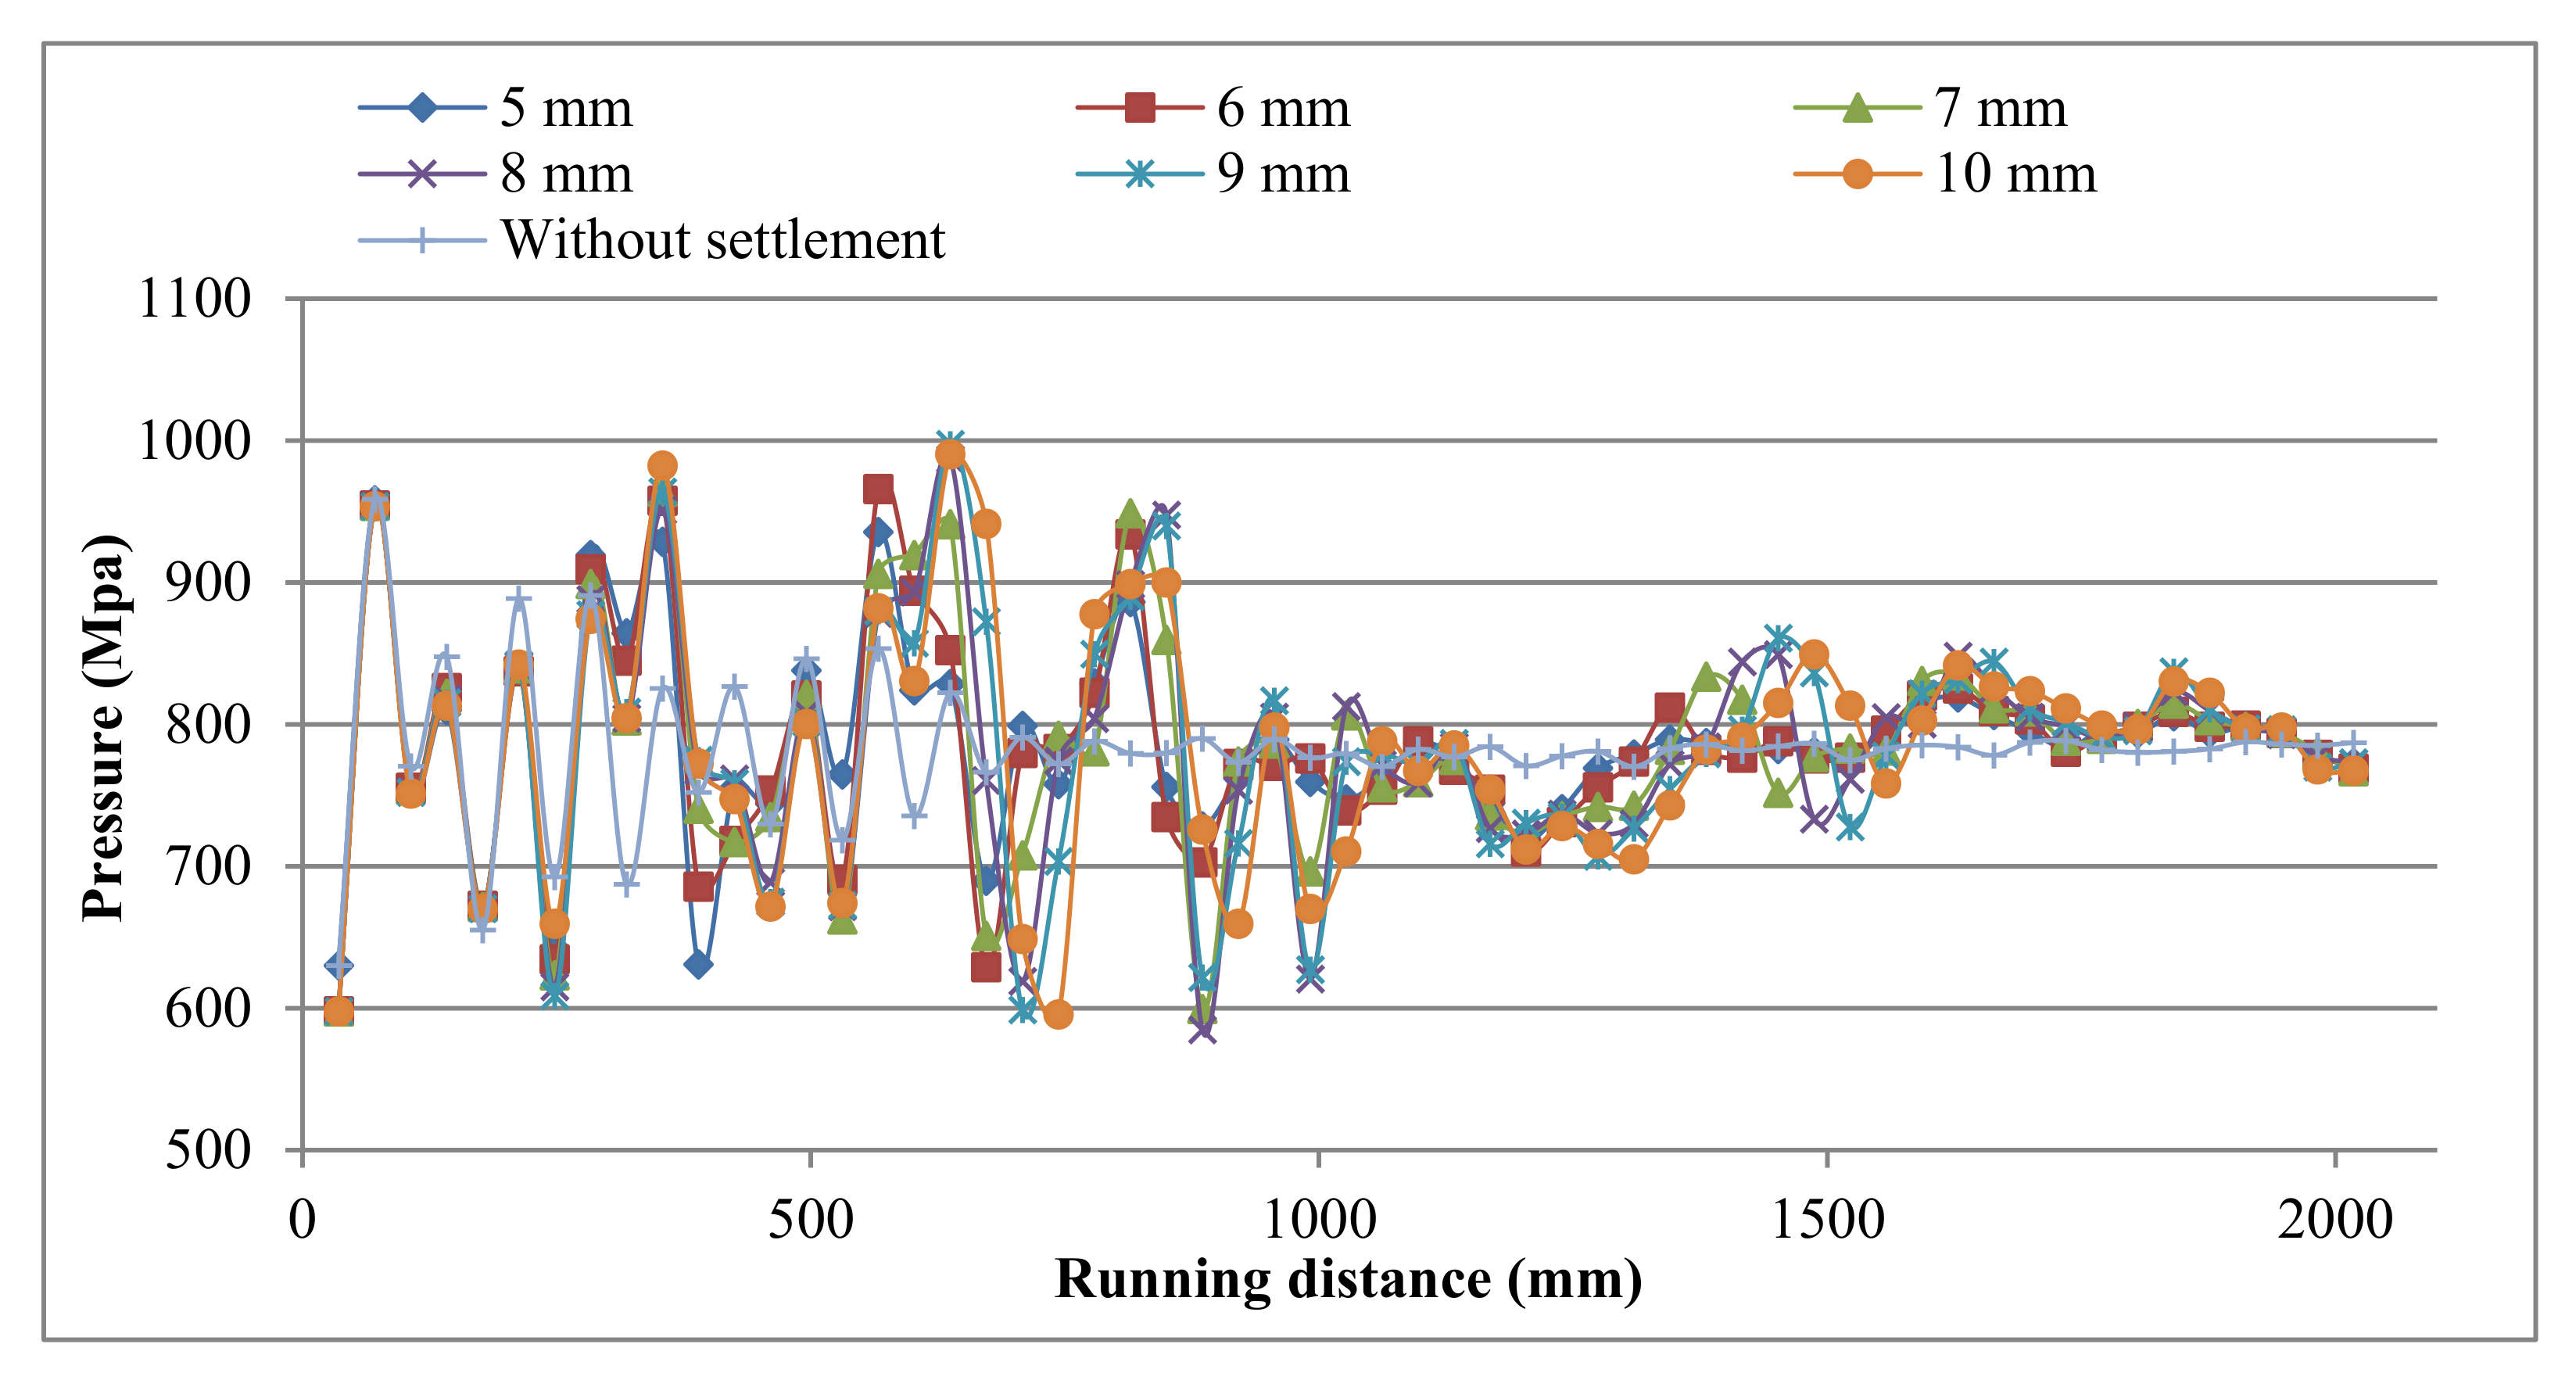
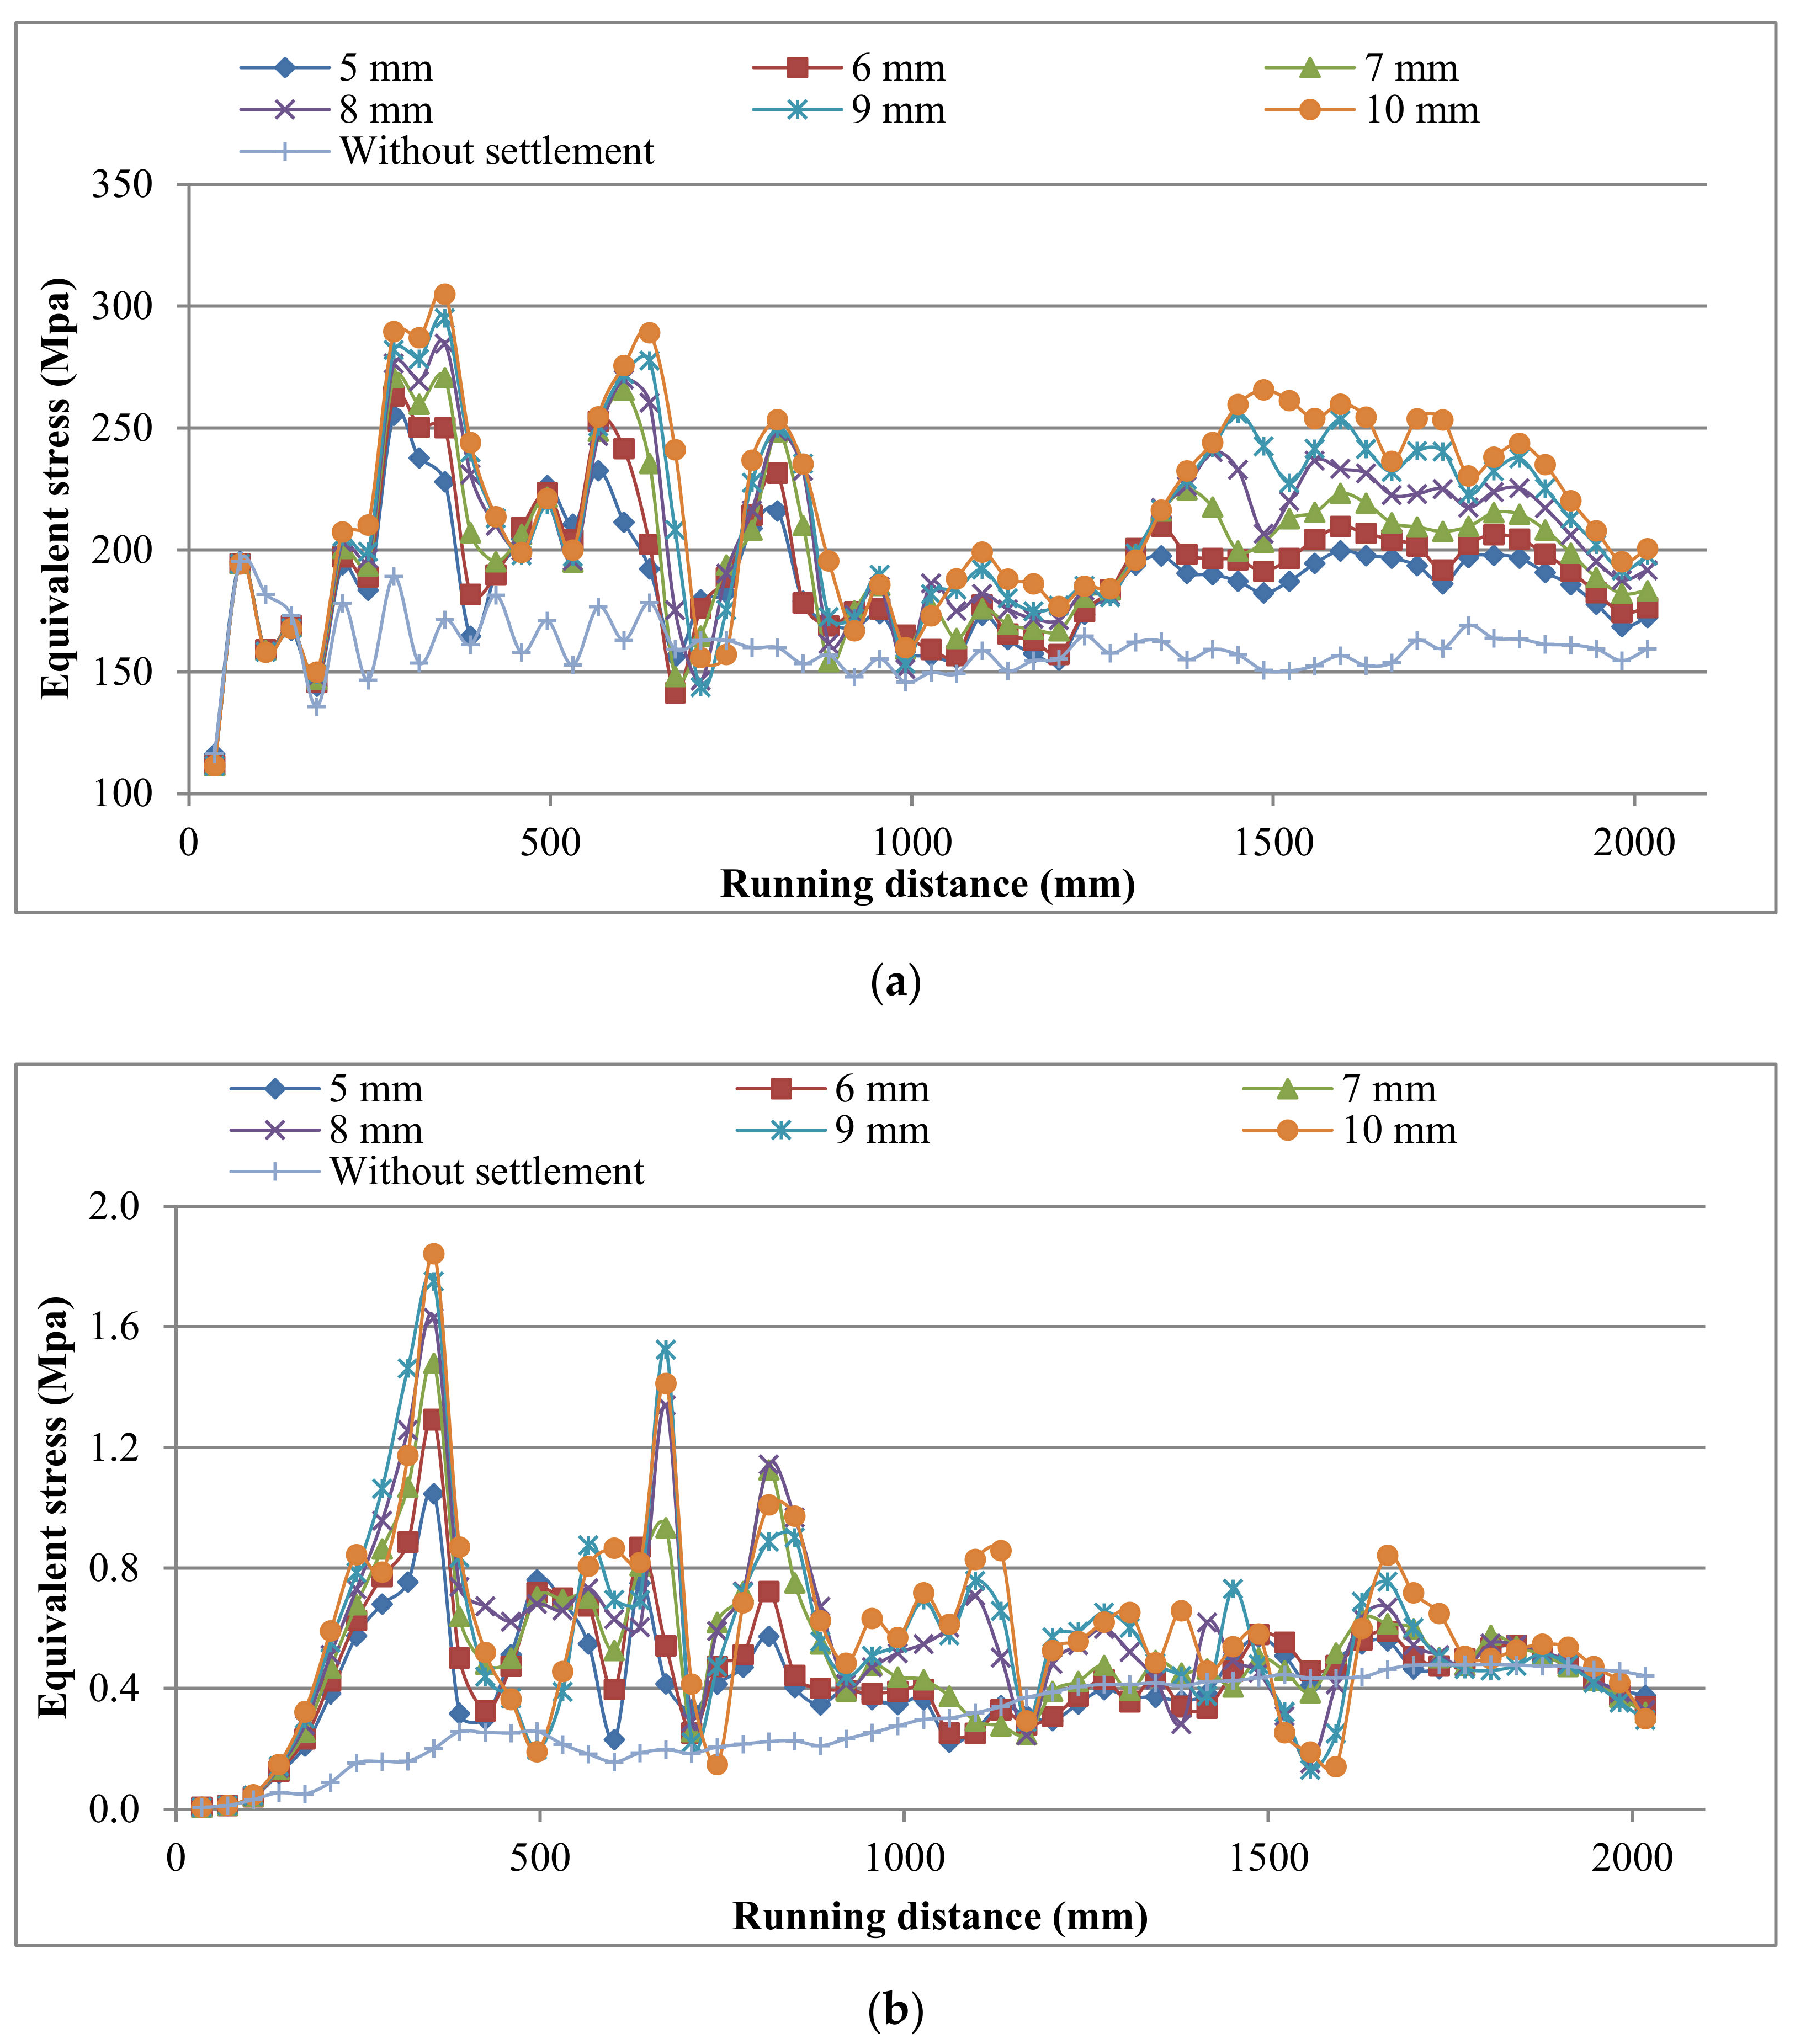
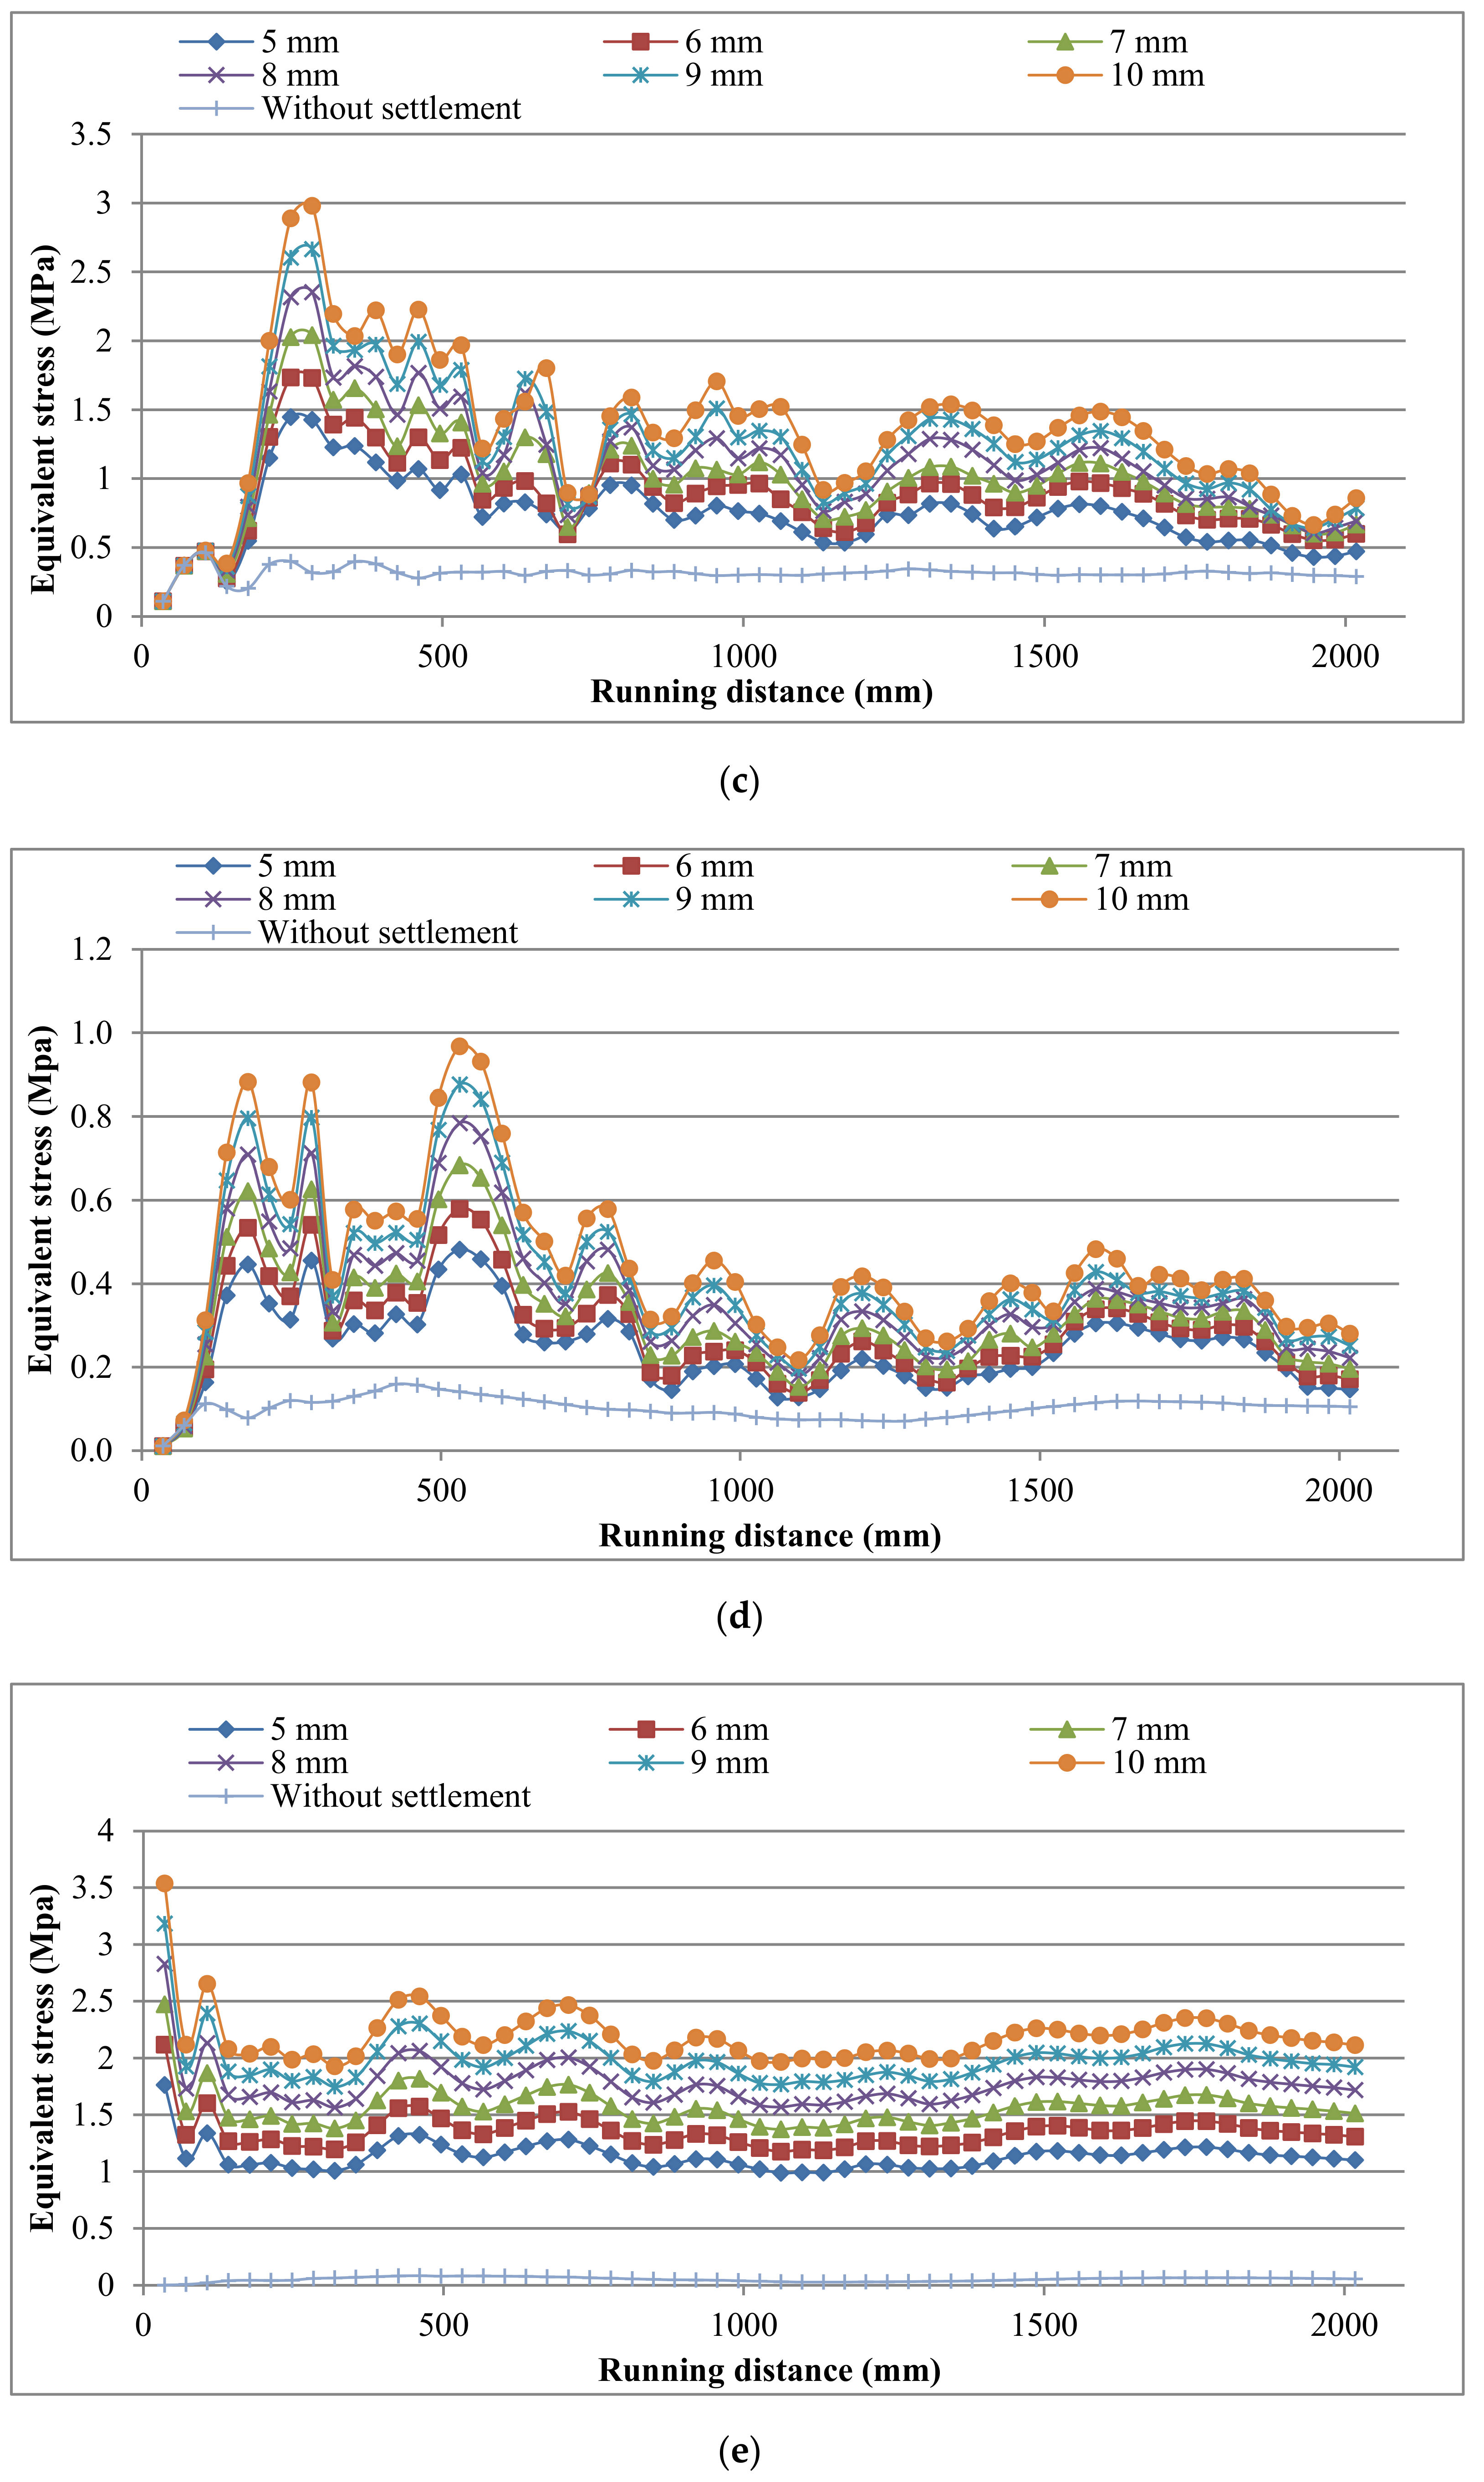
4.2. Comparison between States with and without Settlement of the Second Case (Frictional Contact between Sleepers and Ballast)
5. Conclusions
- The model has about 97.3% of agreement with the Zimmermann method.
- The second case has lower stresses in most of the track elements as compared with other cases, and the contact types in the second case could also be applicable to the first case. Consequently, the second case was selected as a case study according to these characteristics for studying the effect of subgrade settlement on track elements. Moreover, it could help to decrease the maintenance costs and increase the service lifetime of the ballasted track.
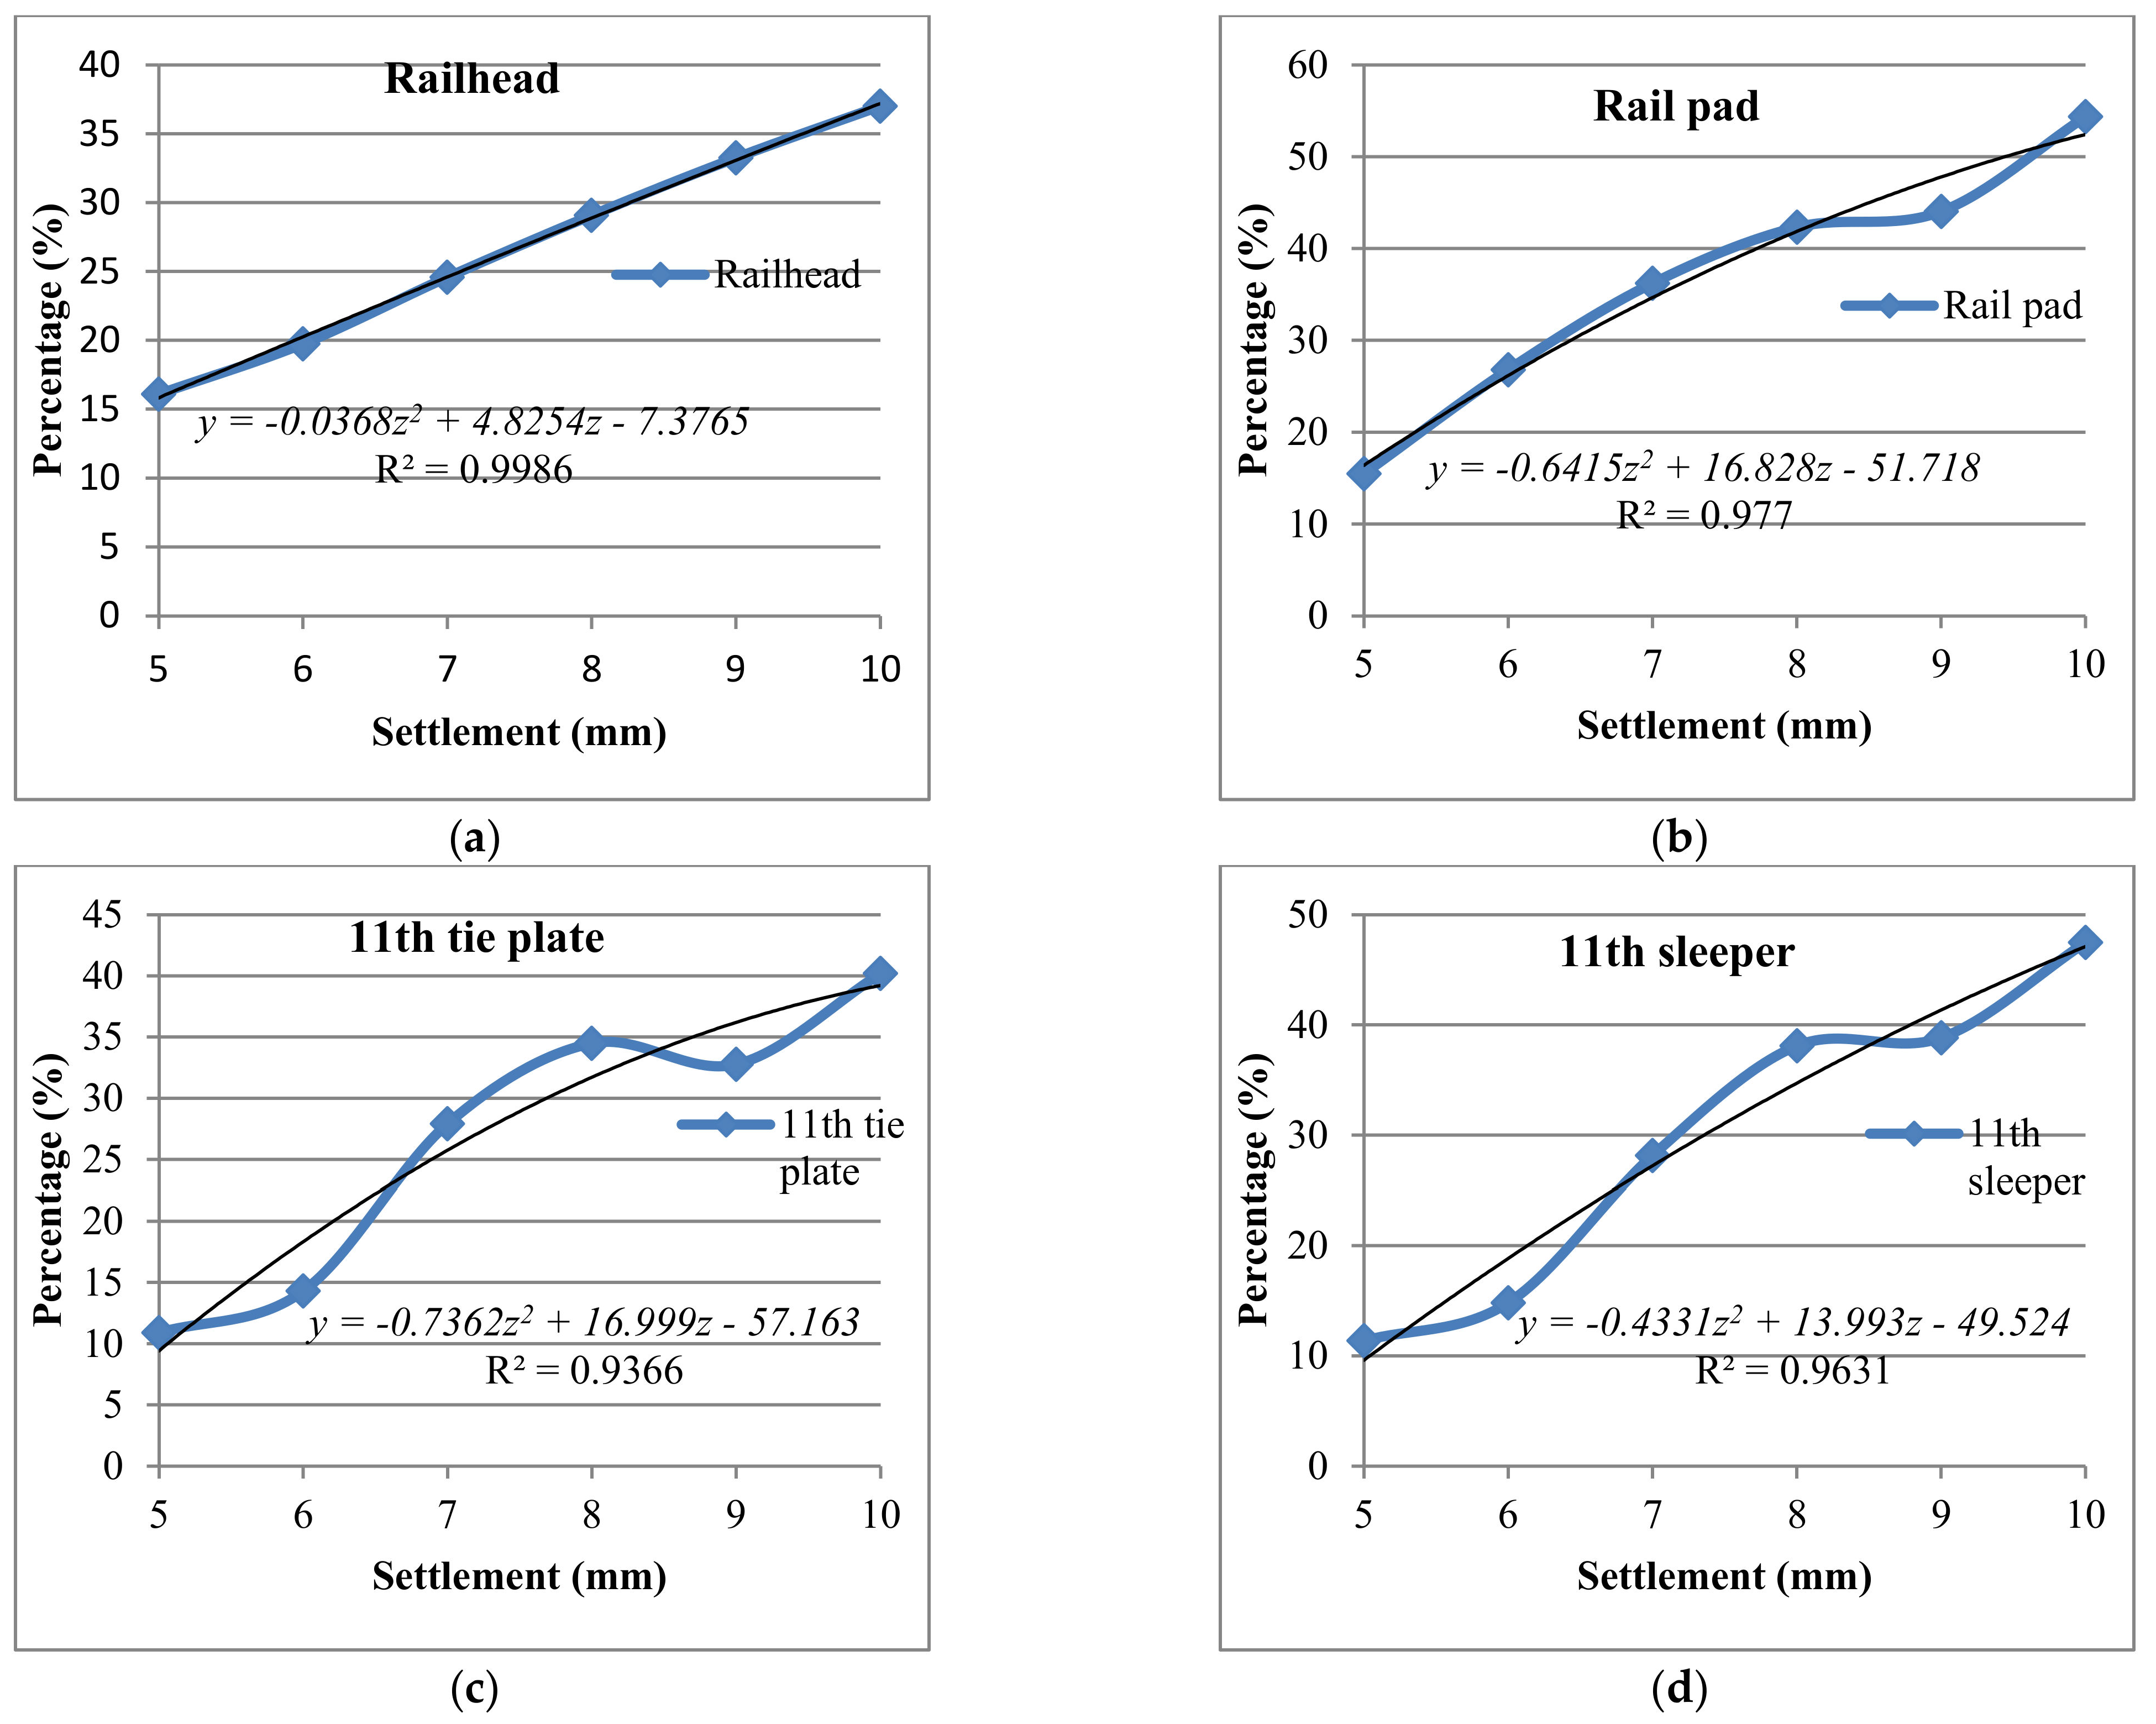
- The average percentages of the increased stresses due to a 1 mm increase of the settlement in the railhead, tie plate, and sleeper are 4.18%, 5.85%, and 7.21%, respectively. Moreover, the average percentages of the increased stresses at the beginning and end of the settled area due to a 1 mm increase of the settlement in ballast, subballast, and subgrade layers are 35.5%, 32.6%, and 419%, respectively.
- A second-degree polynomial equation was derived to predict the possible percentage of increased stresses in each element because of subgrade deformation. This study aims to extract a simple equation that can be easily used for predicting the additional stresses (Equation (3)).
Author Contributions
Funding
Institutional Review Board Statement
Informed Consent Statement
Data Availability Statement
Conflicts of Interest
Abbreviations
| y′ | Distance between the centroid axis of the part of the body to the bottom edge of the body |
| yT′ | Distance between the centroid axis of the body and the bottom edge of the body |
| Ix | Moment of inertia of the modeled rail |
| d | Distance between y′ and yT′ |
| v | Poisson’s ratio |
| E | Young modulus |
| ρ | Mass density |
| β | Damping factor |
| φ | Friction angle |
| ψ | Dilation angle |
| c | Cohesion |
| w | Deflection of the rail |
| Wheel load | |
| L | Length of the transverse sleeper |
| Elastic modulus of the rail | |
| x | Distance from the point of wheel/rail contact |
| Influence factor of deflection | |
| Maximum normal stress | |
| Minimum normal stress | |
| Maximum shear stress applied to the element | |
| Radius of Mohr’s circle | |
| R2 | Coefficient of determination |
| Increasing percentage of stresses in the specified element | |
| Settlement amount | |
| , and | Constant parameters |
References
- Jing, G.; Qie, L.; Markine, V.; Jia, W. Polyurethane reinforced ballasted track: Review, innovation and challenge. Constr. Build. Mater. 2019, 208, 734–748. [Google Scholar] [CrossRef]
- Shi, C.; Zhao, C.; Zhang, X.; Guo, Y. Coupled discrete-continuum approach for railway ballast track and subgrade macro-meso analysis. Int. J. Pavement Eng. 2020, 7, 1–16. [Google Scholar] [CrossRef]
- Kaewunruen, S.; Remennikov, A.M. Effect of a large asymmetrical wheel burden on flexural response and failure of railway concrete sleepers in track systems. Eng. Fail. Anal. 2008, 15, 1065–1075. [Google Scholar] [CrossRef]
- Krishnamoorthy, R.R.; Saleheen, Z.; Effendy, A.; Alisibramulisi, A.; Awaludin, A. The Effect of Rubber Pads on the Stress Distribution for Concrete Railway Sleepers. In Proceedings of the Conference: 14th International Conference on Concrete Engineering and Technology, Kuala Lumpur, Malaysia, 8–9 August 2018; p. 112007. [Google Scholar] [CrossRef]
- Zbiciak, A.; Kraśkiewicz, C.; Sabouni-Zawadzka, A.A.; Pełczyński, J.; Dudziak, S. A novel approach to the analysis of under sleeper pads (USP) applied in the ballasted track structures. Materials 2020, 13, 2438. [Google Scholar] [CrossRef] [PubMed]
- Navaratnarajah, S.K.; Indraratna, B. Use of rubber mats to improve the deformation and degradation behavior of rail ballast under cyclic loading. J. Geotech Geoenviron. Eng. 2017, 143, 4017015. [Google Scholar] [CrossRef] [Green Version]
- Kraśkiewicz, C.; Zbiciak, A.; Wasilewski, K.; Sabouni-Zawadzka, A. Laboratory Tests and Analyses of the Level of Vibration Suppression of Prototype under Ballast Mats (UBM) in the Ballasted Track Systems. Materials 2021, 14, 313. [Google Scholar] [CrossRef]
- Blanco-Lorenzo, J.; Santamaria, J.; Vadillo, E.G.; Oyarzabal, O. Dynamic comparison of different types of slab track and ballasted track using a flexible track model. Proc. Inst. Mech. Eng. Part F J. Rail Rapid Transit. 2011, 225, 574–592. [Google Scholar] [CrossRef]
- Burrow, M.P.N.; Bowness, D.; Ghataora, G.S. A comparison of railway track foundation design methods. Proc. Inst. Mech. Eng. Part F J. Rail Rapid Transit. 2007, 221, 1–12. [Google Scholar] [CrossRef]
- Dahlberg, T. Railway Track Settlements—A Literature Review. Report for the EU Project SUPERTRACK. Available online: http://www-classes.usc.edu/engr/ce/599/Thesis/RTRSETTL.pdf (accessed on 13 January 2004).
- Stark, T.D.; Wilk, S.T. Root cause of differential movement at bridge transition zones. Proc. Inst. Mech. Eng. Part F J. Rail Rapid Transit. 2016, 230, 1257–1269. [Google Scholar] [CrossRef]
- Zhang, X.; Zhao, C.; Zhai, W.; Shi, C.; Feng, Y. Investigation of track settlement and ballast degradation in the high-speed railway using a full-scale laboratory test. Proc. Inst. Mech. Eng. Part F J. Rail Rapid Transit. 2019, 233, 869–881. [Google Scholar] [CrossRef]
- Wang, H.; Markine, V.L.; Shevtsov, I.Y.; Dollevoet, R. Analysis of the dynamic behaviour of a railway track in transition zones with differential settlement. In Proceedings of the Conference of ASME/IEEE Joint Rail Conference, San Jose, CA, USA, 23–26 March 2015. [Google Scholar] [CrossRef]
- Han, X.; Selig, E.T. Effects of fouling on ballast settlement. In Proceedings of the 6th International Heavy Haul Railway Conference, Cape Town, South Africa, 6–10 April 1997; pp. 6–10. [Google Scholar]
- Hasnayn, M.M.; McCarter, W.J.; Woodward, P.K.; Connolly, D.P.; Starrs, G. Railway subgrade performance during flooding and the post-flooding (recovery) period. Transp. Geotech. 2017, 11, 57–68. [Google Scholar] [CrossRef]
- Bian, X.; Jiang, H.; Chen, Y. Preliminary testing on high-speed railway substructure due to water level changes. Procedia Eng. 2016, 143, 769–781. [Google Scholar] [CrossRef] [Green Version]
- Jiang, H.; Bian, X.; Jiang, J.; Chen, Y. Dynamic performance of high-speed railway formation with the rise of water table. Eng. Geol. 2016, 206, 18–32. [Google Scholar] [CrossRef]
- Malawska, M.; Wilkomirski, B. Accumulation rate of polychlorinated biphenyls(PCBs) in dandelion(Taraxacum officinale) in the conditions of soil contamination with oil derivatives. Rocz. Panstw. Zakl. Hig. 2001, 52, 295–311. [Google Scholar]
- Malawska, M.; Wiłkomirski, B. Soil and plant contamination with heavy metals in the area of the old railway junction Tarnowskie Góry and near two main railway routes. Rocz. Panstw. Zakl. Hig. 2000, 51, 259–267. [Google Scholar] [PubMed]
- Malawska, M.; Wilkomirski, B. An analysis of polychlorinated biphenyls (PCBs) content in soil and plant leaves (Taraxacum officinale) in the area of the railway junction Iława Główna. Toxicol. Environ. Chem. 1999, 70, 509–515. [Google Scholar] [CrossRef]
- Malawska, M.; Wiołkomirski, B. An analysis of soil and plant (Taraxacum officinale) contamination with heavy metals and polycyclic aromatic hydrocarbons (PAHs) in the area of the railway junction Iława Główna, Poland. Water. Air. Soil Pollut. 2001, 127, 339–349. [Google Scholar] [CrossRef]
- Rail Accident Investigation Branch. Derailment of a Freight Train at Stoke Lane Level Crossing, near Nottingham 27 August 2013. Available online: https://assets.publishing.service.gov.uk/media/551cf3e940f0b614040004da/R022015_150402_Stoke_Lane.pdf (accessed on 2 April 2015).
- Jiang, H.; Li, X.; Xin, G.; Yao, Z.; Zhang, J.; Liang, M. Geometry mapping and additional stresses of ballastless track structure caused by subgrade differential settlement under self-weight loads in high-speed railways. Transp. Geotech. 2019, 18, 103–110. [Google Scholar] [CrossRef]
- Fang, H. Influence of pier settlement on structural stress of longitudinal connected track in high-speed railways. Adv. Civ. Eng. 2020, 2020, 8102637. [Google Scholar] [CrossRef]
- Alabbasi, Y.; Hussein, M. Geomechanical modelling of railroad ballast: A review. Arch. Comput. Methods Eng. 2019, 19, 1–25. [Google Scholar] [CrossRef] [Green Version]
- Puzavac, L.; Popović, Z.; Lazarević, L. Influence of track stiffness on track behaviour under vertical load. Promet Zagreb 2012, 24, 405–412. [Google Scholar] [CrossRef]
- Prakoso, P.B. Analysis and Evaluation of Railway Track Systems on Soft Soil: Trackbed Thickness Design and Dynamic Track-Soil Interaction. Ph.D Thesis, Technische Universität München, München, Germany, 23 February 2017. [Google Scholar]
- González, I.J. Numerical modeling of railway ballast using the discrete element method. Master’s Thesis, Universitat Politècnica de Catalunya, Barcelona, Spain, 2015. [Google Scholar]
- Ismaiel, H.A.H. Geotechnical Investigations and Assessment of Earthquakes Factors at Hurghada City, Red Sea, Egypt. World Environ. 2018, 8, 63–70. [Google Scholar] [CrossRef]
- Zhu, T.Y. Some Useful Numbers on the Engineering Properties of Materials (Geologic and Otherwise); GEOL 615; Department of Geophysics, Stanford University: Stanford, CA, USA, 2012. [Google Scholar]
- Aikawa, A. Vertical Natural Vibration Modes of Ballasted Railway Track. In New Trends in Structural Engineering; Yalciner, H., Farsangi, E.N., Eds.; IntechOpen: London, UK, 2018. [Google Scholar] [CrossRef] [Green Version]
- Prakoso, P.B. The basic concepts of modelling railway track systems using conventional and finite element methods. Info Tek. 2012, 13, 57–65. [Google Scholar]
- Indraratna, B.; Nimbalkar, S. Stress-strain degradation response of railway ballast stabilized with geosynthetics. J. Geotech. Geoenviron. Eng. 2013, 139, 684–700. [Google Scholar] [CrossRef] [Green Version]
- Wang, H.; Markine, V. Corrective countermeasure for track transition zones in railways: Adjustable fastener. Eng. Struct. 2018, 169, 1–14. [Google Scholar] [CrossRef]
- Xu, F.; Yang, Q.; Liu, W.; Leng, W.; Nie, R.; Mei, H. Dynamic stress of subgrade bed layers subjected to train vehicles with large axle loads. Shock Vib. 2018, 2018, 8102637. [Google Scholar] [CrossRef]
- Esveld, C. Modern railway track, 2nd ed.; MRT-Productions: Zaltbommel, The Netherlands, 2001; pp. 71–76. [Google Scholar]
- Ma, Y.; Markine, V.L.; Mashal, A.A.; Ren, M. Effect of wheel–rail interface parameters on contact stability in explicit finite element analysis. Proc. Inst. Mech. Eng. Part F J. Rail Rapid Transit 2018, 232, 1879–1894. [Google Scholar] [CrossRef]
- El-sayed, H.M.; Lotfy, M.; Zohny, H.E.D.; Riad, H.S. Prediction of fatigue crack initiation life in railheads using finite element analysis. Ain Shams Eng. J. 2018, 9, 2329–2342. [Google Scholar] [CrossRef]
- Boussalia, L.; Bellaouar, A. Modélisation par la Méthode des Eléments Finis du Comportement Dynamique du Couple Roue-Rail. Ph.D Thesis, Université Frères Mentouri-Constantine 1, Constantine, Algeria, 12 November 2018. (In French). [Google Scholar]
- Ramadan, A.N.; Zohny, H.N.; Riad, H.S. Prediction of Excessive Stresses in Railway Track Elements Due to Soil Defects. Int. J. Sci. Eng. Res. 2018, 9, 1710–1716. [Google Scholar]
- Sadeghi, J.; Hasheminezhad, A. Sensitivity analysis of ballasted railway track design criteria. In Proceedings of the 3rd International Conference on Recent Advances in Railway Engineering (ICRARE-2013), Iran University of Science and Technology, Tehran, Iran, 30 April–1 May 2013. [Google Scholar]
- Indraratna, B.; Nimbalkar, S.; Christie, D.; Rujikiatkamjorn, C.; Vinod, J. Field assessment of the performance of a ballasted rail track with and without geosynthetics. J. Geotech. Geoenviron. Eng. 2010, 136, 907–917. [Google Scholar] [CrossRef]


| Element | Width (mm) | Thickness (mm) | Inertia (mm4) | Area (mm2) | y′ (mm) | Area × y′ | yT′ (mm) | d (mm) | |
|---|---|---|---|---|---|---|---|---|---|
| Foot | 135 | 18.496 | 71,184.5 | 2496.96 | 9.248 | 23,091.8 | 74.6 | 65.439689 | 10,764,048.7 |
| Web | 16 | 96.503 | 119,828 | 1544.048 | 66.747 | 103,061.3 | 7.94018985 | 1,295,634.91 | |
| Head | 64.06 | 44.003 | 454,862 | 2819.008 | 137.00 | 386,205.5 | 62.312810 | 11,400,750.3 | |
| Total | 159.002 | 1,724,335 | 6860.0162 | 512,358.7 | 23,460,433.9 |
| Element | Poisson’s Ratio, v | Young Modulus, E (Mpa) | Mass Density, ρ (Kg/m3) | Damping Factor, β | Friction Angle, φ (°) | Dilation Angle, ψ (°) | Cohesion, c (Mpa) |
|---|---|---|---|---|---|---|---|
| Rail, wheel and tie plate | 0.3 | 2 × 10⁵ | 7850 | ||||
| Rail pad | 0.45 | 850 | 950 | ||||
| Sleeper | 0.4 | 1000 | 1084 | ||||
| Ballasted layer | 0.37 | 200 | 2000 | 0.01 | |||
| Subballast layer | 0.37 | 138 | 1920 | 0.01 | |||
| Subgrade soil | 0.3 | 19 | 1800 | 0.01 | 35 | 5 | 0 |
| Er (N/mm2) | L (mm) | Q (N) | x (mm) | Cos () | Ix (mm4) | w(x) (mm) | |||
|---|---|---|---|---|---|---|---|---|---|
| 200,000 | 944 | 1 × 10⁵ | 0 | 1 | 1 | 0 | 1 | 23,460,433.99 | −2.2410934 |
| 200,000 | 944 | 1 × 10⁵ | 600 | 0.52962 | 0.80471967 | 0.59365499 | 0.74060888 | 23,460,433.99 | −1.6597737 |
| 200,000 | 944 | 1 × 10⁵ | 1200 | 0.280499 | 0.295147494 | 0.955451703 | 0.350791361 | 23,460,433.99 | −0.7861562 |
| 200,000 | 944 | 1 × 10⁵ | 1800 | 0.148558 | −0.32969768 | 0.944086563 | 0.091272398 | 23,460,433.99 | −0.20455 |
| 200,000 | 944 | 1 × 10⁵ | 2400 | 0.078679 | −0.82577591 | 0.563998352 | −0.02059652 | 23,460,433.99 | 0.04615873 |
| 200,000 | 944 | 1 × 10⁵ | 3000 | 0.04167 | −0.99933855 | −0.03636542 | −0.04315811 | 23,460,433.99 | 0.09672138 |
| 200,000 | 944 | 1 × 10⁵ | 3600 | 0.022069 | −0.78259887 | −0.62252630 | −0.03101039 | 23,460,433.99 | 0.06949718 |
| 200,000 | 944 | 1 × 10⁵ | 4200 | 0.011688 | −0.26020686 | −0.96555289 | −0.01432725 | 23,460,433.99 | 0.03210871 |
| 200,000 | 944 | 1 × 10⁵ | 4800 | 0.00619 | 0.363811718 | −0.93147250 | −0.00351408 | 23,460,433.99 | 0.00787539 |
| 200,000 | 944 | 1 × 10⁵ | 5400 | 0.003279 | 0.845739753 | −0.53359560 | 0.001023396 | 23,460,433.99 | −0.0022935 |
| 200,000 | 944 | 1 × 10⁵ | 6000 | 0.001736 | 0.997355111 | 0.072682749 | 0.001858031 | 2.99 | −0.004164 |
| Element No. | Minimum Normal Stress (Mpa) | Maximum Normal Stress (Mpa) | Maximum Shear Stress (Mpa) |
|---|---|---|---|
| The 1st element | −5.539 × 10⁻² | 0 | 2.769 × 10⁻² |
| The 2nd element | −5.377 × 10⁻² | 4.026 × 10⁻³ | 2.281 × 10⁻³ |
| The 3rd element | 0 | 6.264 × 10⁻³ | 3.132 × 10⁻³ |
| The 4th element | 0 | 3.153 × 10⁻³ | 1.576 × 10⁻³ |
| Element | without Settlement | 5 mm | 6 mm | 7 mm | 8 mm | 9 mm | 10 mm |
|---|---|---|---|---|---|---|---|
| Wheel/rail pressure | 781.76 | 782.38 | 782.47 | 780.75 | 778.03 | 776.46 | 775.72 |
| Railhead | 157.19 | 182.51 | 188.25 | 195.83 | 202.90 | 209.48 | 215.37 |
| The 11th rail pad | 3.2912 | 3.8004 | 4.1735 | 4.4837 | 4.6842 | 4.7404 | 5.0802 |
| The 11th tie plate | 27.216 | 30.184 | 31.112 | 34.816 | 36.603 | 36.138 | 38.158 |
| The 11th sleeper | 0.3772 | 0.4202 | 0.4332 | 0.4834 | 0.5210 | 0.5238 | 0.5564 |
| Ballast layer | 0.3535 | 0.6781 | 0.8173 | 0.9182 | 1.0124 | 1.1172 | 1.2353 |
| Subballast layer | 0.0963 | 0.2140 | 0.2446 | 0.2757 | 0.3085 | 0.3379 | 0.3712 |
| Subgrade layer | 0.0497 | 1.1113 | 1.3228 | 1.5338 | 1.7423 | 1.9481 | 2.1523 |
| Element | |||
|---|---|---|---|
| Railhead | −0.03 | 4.82 | −7.37 |
| Rail pad | −0.64 | 16.82 | −51.71 |
| Tie plate | −0.73 | 16.99 | −57.16 |
| sleeper | −0.43 | 13.99 | −49.52 |
| Ballast layer | −0.51 | 42.15 | −78.55 |
| Subballast layer | 0.12 | 30.68 | −34.55 |
| Subgrade layer | −2.05 | 450.2 | −62.56 |
Publisher’s Note: MDPI stays neutral with regard to jurisdictional claims in published maps and institutional affiliations. |
© 2021 by the authors. Licensee MDPI, Basel, Switzerland. This article is an open access article distributed under the terms and conditions of the Creative Commons Attribution (CC BY) license (https://creativecommons.org/licenses/by/4.0/).
Share and Cite
Ramadan, A.N.; Jing, P.; Zhang, J.; Zohny, H.N.E.-D. Numerical Analysis of Additional Stresses in Railway Track Elements Due to Subgrade Settlement Using FEM Simulation. Appl. Sci. 2021, 11, 8501. https://0-doi-org.brum.beds.ac.uk/10.3390/app11188501
Ramadan AN, Jing P, Zhang J, Zohny HNE-D. Numerical Analysis of Additional Stresses in Railway Track Elements Due to Subgrade Settlement Using FEM Simulation. Applied Sciences. 2021; 11(18):8501. https://0-doi-org.brum.beds.ac.uk/10.3390/app11188501
Chicago/Turabian StyleRamadan, Ahmed Nabil, Peng Jing, Jinxi Zhang, and Haytham Nour EL-Din Zohny. 2021. "Numerical Analysis of Additional Stresses in Railway Track Elements Due to Subgrade Settlement Using FEM Simulation" Applied Sciences 11, no. 18: 8501. https://0-doi-org.brum.beds.ac.uk/10.3390/app11188501