Article

Detecting Ankle Fractures in Plain Radiographs Using Deep Learning with Accurately Labeled Datasets Aided by Computed Tomography: A Retrospective Observational Study

1
Department of Emergency Medicine, Hallym University Sacred Heart Hospital, Hallym University College of Medicine, Chuncheon 24252, Korea
2
Department of Mathematics, Sungkyunkwan University, Suwon 16419, Korea
3
Department of Orthopedic Surgery, Uijeongbu Eulji Medical Center, Eulji University, Daejeon 34824, Korea
4
Department of Emergency Medicine, Wonju College of Medicine, Yonsei University, Wonju 26426, Korea
5
Bigdata Platform Business Group, Wonju Yonsei Medical Center, Yonsei University, Wonju 26426, Korea
6
Department of Orthopaedic Surgery, Wonju College of Medicine, Yonsei University, Wonju 26426, Korea
*
Author to whom correspondence should be addressed.
Submission received: 12 July 2021 / Revised: 14 September 2021 / Accepted: 17 September 2021 / Published: 22 September 2021

Abstract

:

Featured Application

Using Deep Learning to Detect Ankle Fractures.

Abstract

Ankle fractures are common and, compared to other injuries, tend to be overlooked in the emergency department. We aim to develop a deep learning algorithm that can detect not only definite fractures but also obscure fractures. We collected the data of 1226 patients with suspected ankle fractures and performed both X-rays and CT scans. With anteroposterior (AP) and lateral ankle X-rays of 1040 patients with fractures and 186 normal patients, we developed a deep learning model. The training, validation, and test datasets were split in a 3/1/1 ratio. Data augmentation and under-sampling techniques were administered as part of the preprocessing. The Inception V3 model was utilized for the image classification. Performance of the model was validated using a confusion matrix and the area under the receiver operating characteristic curve (AUC-ROC). For the AP and lateral trials, the best accuracy and AUC values were 83%/0.91 in AP and 90%/0.95 in lateral. Additionally, the mean accuracy and AUC values were 83%/0.89 for the AP trials and 83%/0.9 for the lateral trials. The reliable dataset resulted in the CNN model providing higher accuracy than in past studies.

1. Introduction

Orthopedic radiography is one of the most common imaging methods to diagnose fractures. However, fractures particularly in the foot and ankle, tend to be easily overlooked or misdiagnosed when radiographs are interpreted especially in the emergency department (ED) [1].
Ankle injuries are a common cause for outpatient visits; hence, it is important that their diagnosis be accurate for further evaluation and treatment. The ankle consists of 3 bones (the tibia, fibula, and talus), 2 joints (ankle and syndesmosis), and 3 sets of ligaments (medial, lateral, and syndesmotic). Owing to the complex structure of the ankle, fractures associated with it are often difficult to identify, raising the rate of misdiagnosis to nearly 4.2% in the ED [2,3].
Artificial intelligence (AI) can potentially provide a solution to this challenge; several studies are presently being undertaken to detect fractures using deep learning technologies [4]. Deep learning is a subdomain of AI wherein a system is trained to imitate the human brain. Convolutional neural networks (CNN) is a widely used deep learning algorithm for data processing, especially for 2D images [5].
Previous studies have successfully applied CNN to detect fractures via radiographs [6,7,8]. Yu et al. [9], designed a CNN algorithm using pelvic radiographs that could detect a femoral neck fracture with 97% accuracy; the algorithm represented other types of fractures with decreasing accuracy thereby rendering itself inadequate for the purpose of our study.
To the best of our knowledge, there are two studies on ankle fractures using deep learning. Santos et al. [10] used data from structured reports of X-ray images of ankle fractures. The dataset included 157 patients, of which 129 revealed fractures and 28 without, and the model exhibited an accuracy of 77% with the area under curve (AUC) being 0.85. Kitamura et al. [11] performed an extensive study on a larger dataset of 596 images (ankle with and without fractures equally apportioned) with five different CNN architectures; the accuracy peaked at 81%.
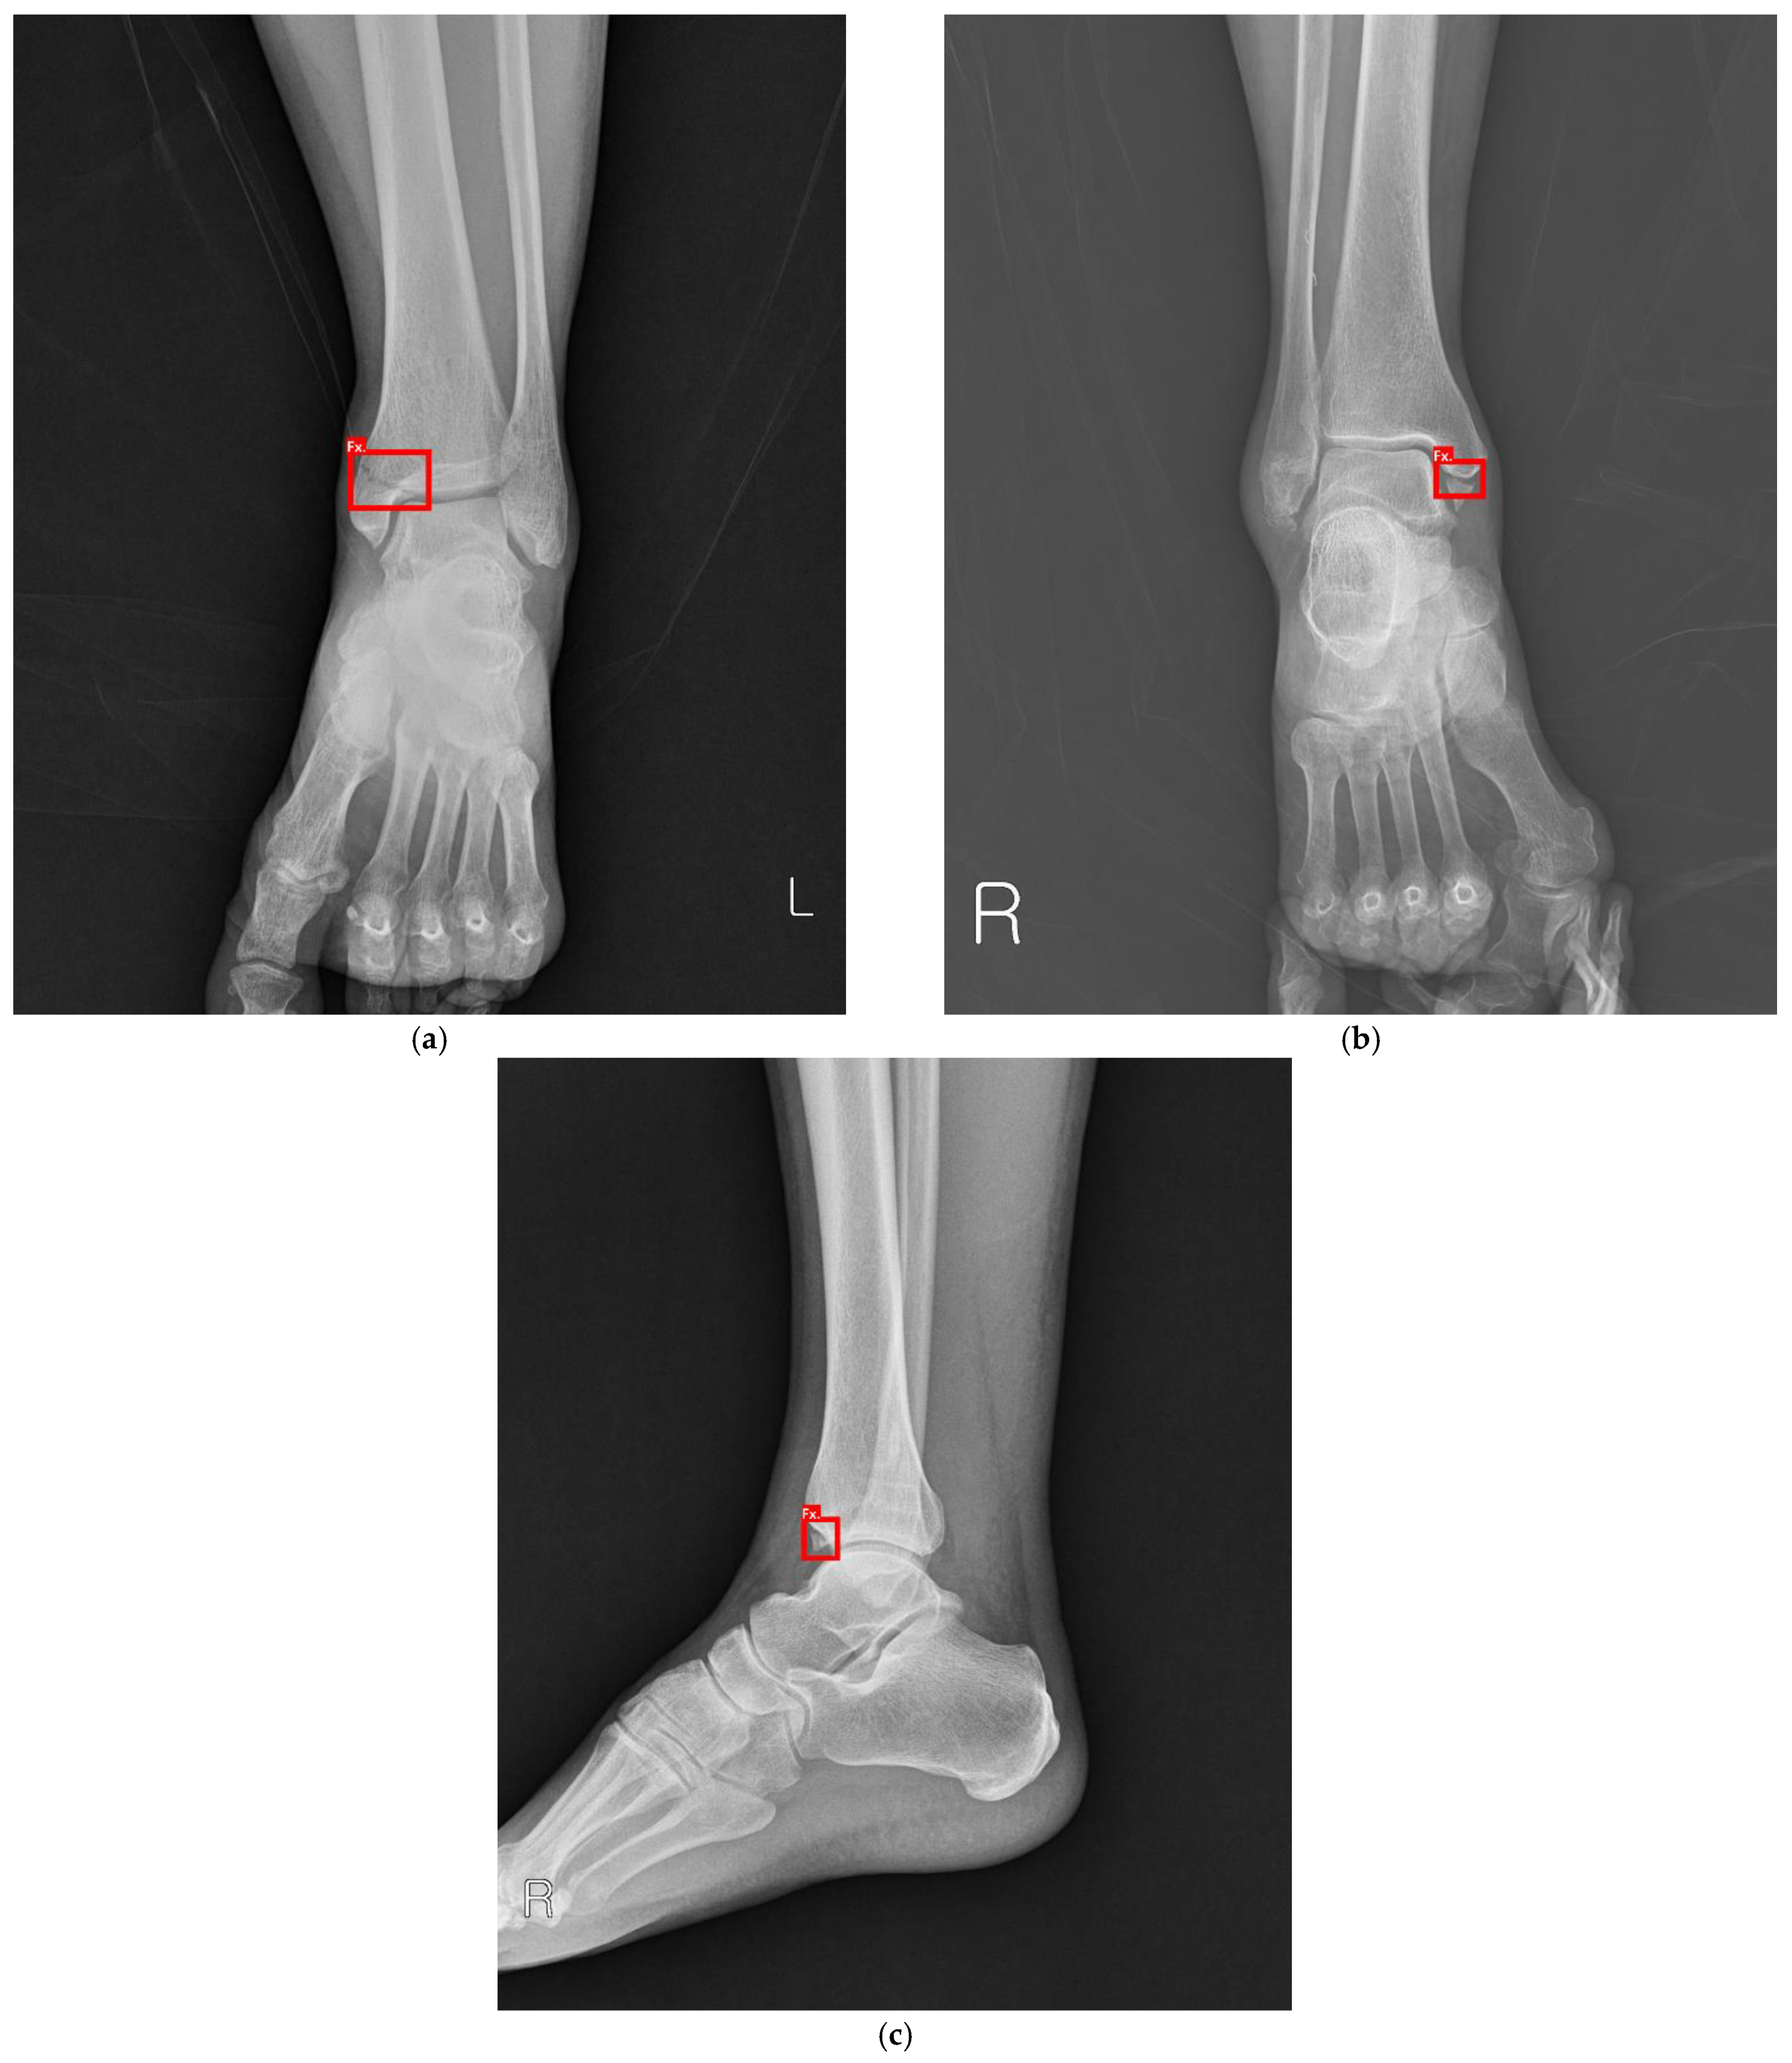
Both studies are proof of concept research; hence, we considered conducting a more practical study. Large or definite fractures can be easily diagnosed even by a beginner; minor fractures wherein the fracture line is obscured or overlapping are more difficult to detect in the ED as well as the outpatient department as shown in Figure 1 and 
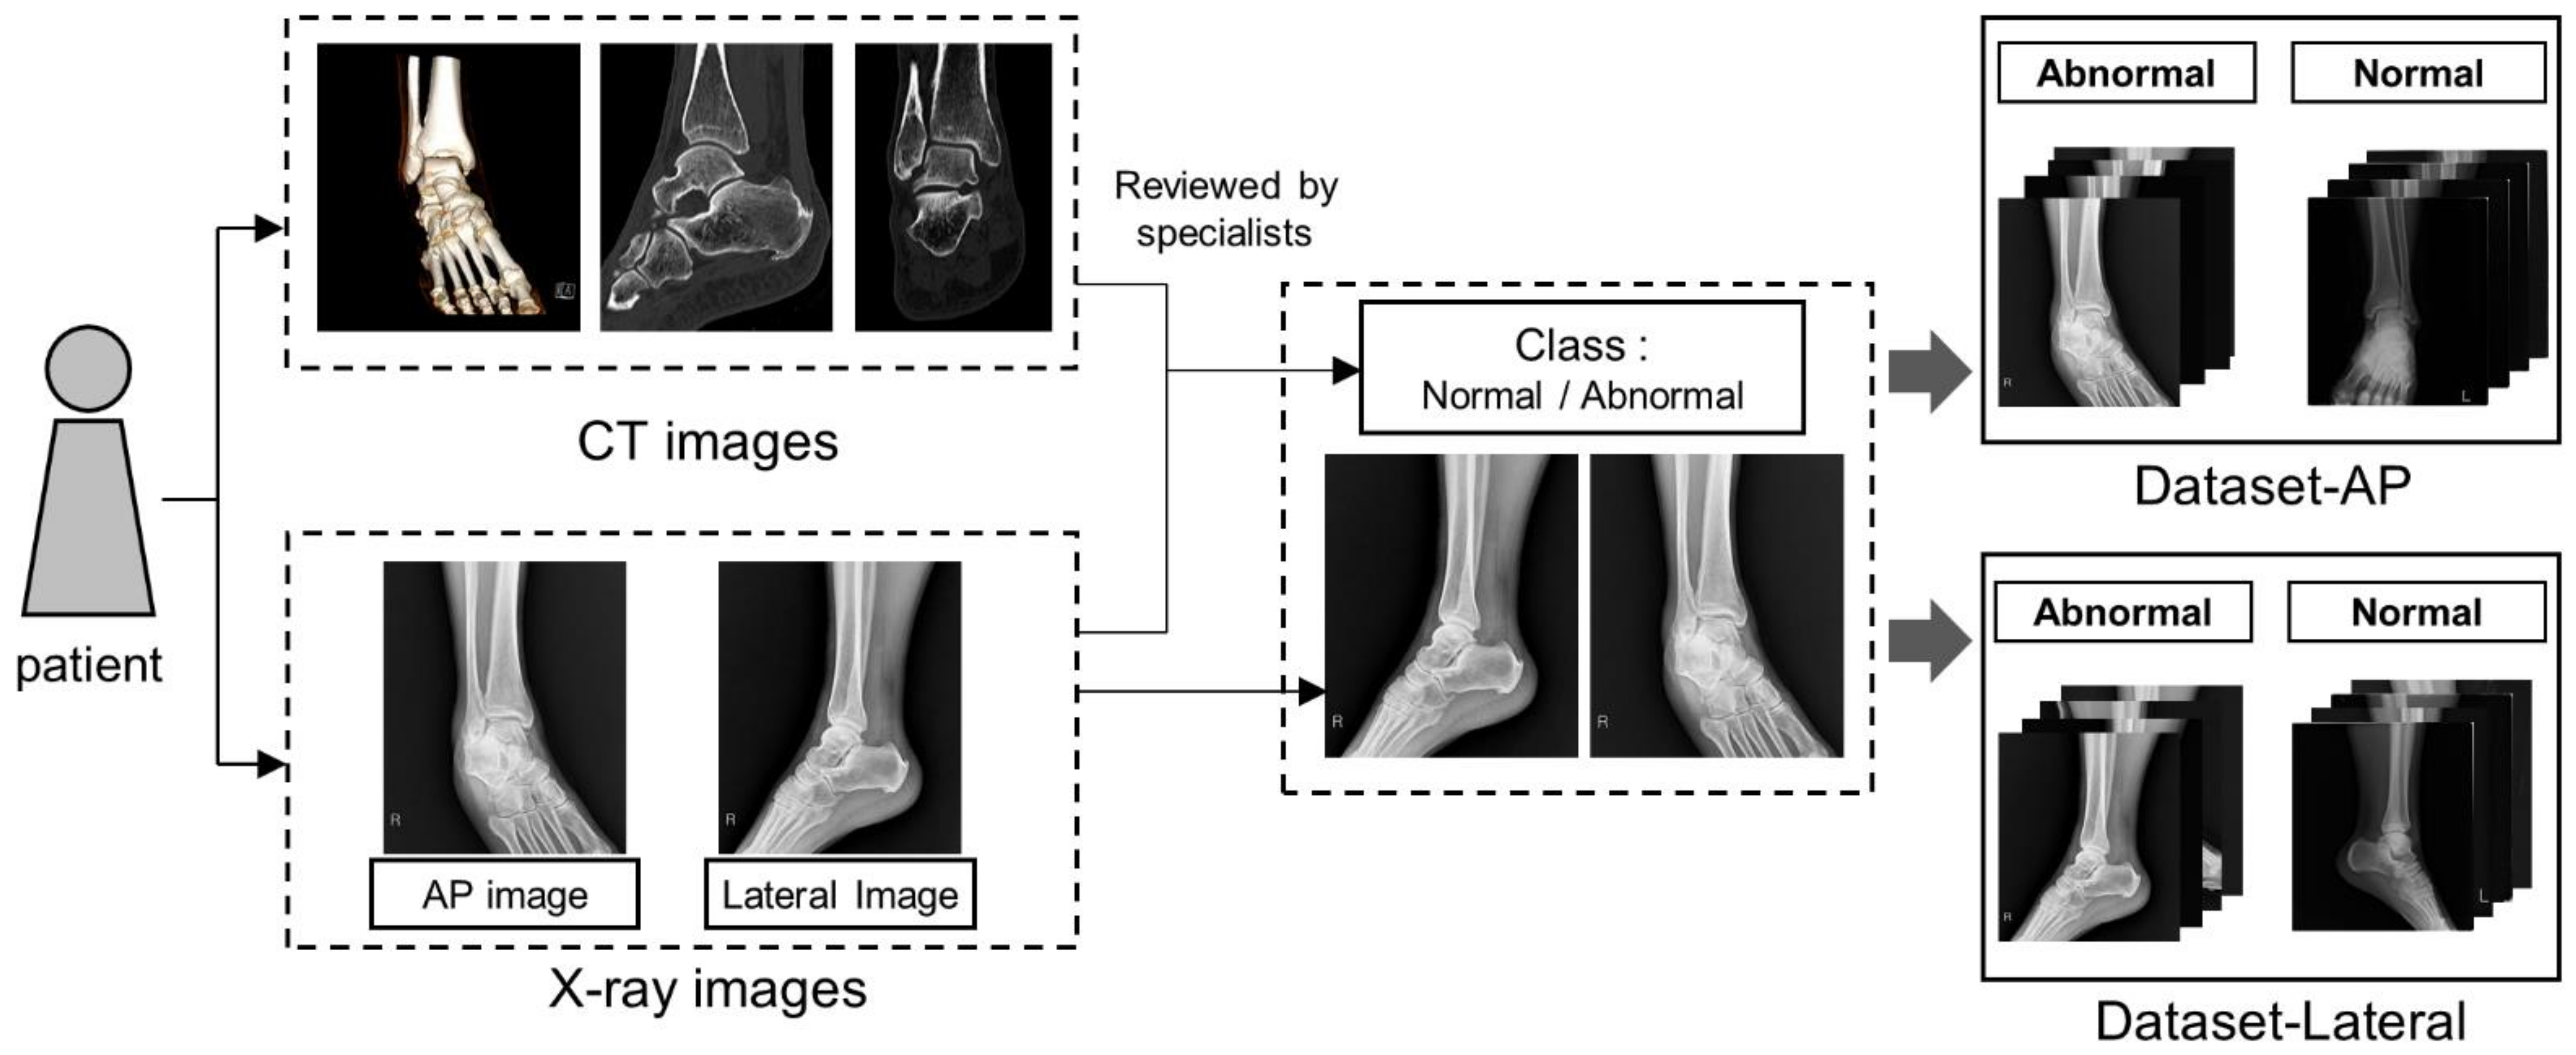
Figure 2. Hence, the aim of our study is not only to distinguish definite fracture but also not to overlook vague minor fractures in the radiography. To this effect, we tried to involve the patient data of minor fractures as well as definite fracture where possible. For accurate labeling, we reviewed both X-rays and computed tomography (CT) scans of all the fractures. Additionally, a machine learning expert (Mo, Y.-C.) was consulted to achieve higher performance and accuracy of the proposed model. Our study is the first of its kind in that we labeled the data almost perfectly by means of images of X-rays and CT scans.

2. Materials and Methods

2.1. Datasets

2.1.1. Dataset Preparation

The Ethics Committee of Hallym University approved the use of data for the purpose of this study and the Institutional Review Board exempted the requirement of submitting written informed consent (2020-04-032-001). We reviewed the patients over 18 years of age with diagnosed ankle sprain or fracture and selected those who had undergone both X-rays and CT scans in the lower extremity. Exams were reviewed by three senior medical specialists, an orthopedist specializing in the foot and ankle (J.Lee), a radiologist with expertise in the musculoskeletal framework, and an emergency physician (J.Kim). We then manually labeled them, and the results are as follows: 1040 instances of patients were diagnosed with fractures, i.e., “abnormal” and 186 instances of those were without fractures, i.e., “normal”. Subsequently, their anteroposterior (AP) and lateral ankle X-rays were extracted. Figure 3 shows the data collection and preparation process. The exclusion criteria included open fractures and those with operation history because those cases need thorough examination. No additional patient information, such age, sex, and medical history, was retained.

2.1.2. Dataset Distribution

The format of all the X-ray images were .jpg and resized to 500 × 600 pixels. To resolve the imbalanced data distribution of normal and abnormal images, we divided the 1040 abnormal images into 5 sets of 208 images each. In each experiment, we used 186 normal images and 208 abnormal images. We split the 186 normal images to training, validation, and the test datasets in the ratio of 6:2:2. For the abnormal images, the number of training dataset and validation dataset was equal to normal group and the rest of the images were used to test dataset. Figure 4 visualizes the data distribution in the study. The final datasets are summarized in Table 1.
We conducted a total of five experiments for the AP and lateral datasets respectively. Each experiment was conducted with same normal data and different abnormal data of 5 sets. (https://github.com/pepperfield/Detecting-Ankle-Fractures-in-Plain-Radiographs-Using-Deep-2-Learning-with-Accurately-Labeled-Dataset (accessed on 3 September 2021).)

2.1.3. Dataset Augmentation

Dataset augmentation helps to enhance the accuracy of a classification task by introducing data diversity to the training dataset without adding further images [12]. As depicted in Figure 5, the following transformations were applied to images at random in each epoch: (1) rotation: from –10° to +10°; (2) height/width shift of ±10%; (3) brightness variation of ±10%; (4) zoom in/out by ±10%; (5) horizontal flip with a 50% probability.
Model training Inception V3 is a popular 3D image classifier based on CNN that has shown a high success rate in classifying medical images [13,14]. Here, we trained the Inception V3 model to classify images as “normal” and “abnormal”; we then drew the receiver operating curve and observed area under the curve (ROC-AUC). Figure 6 shows the overall process.
The hyper-parameter setting is as follows. The optimizer is ADAM and the learning rate is set to 3 × 10⁻⁵. We set the batch size to 8 and the max epoch to 200. We adopted the model which achieved the highest validation accuracy during the training, for testing the model performance. Experiments were conducted on a Windows PC with a Intel© i7-core @3.2 GHz processor and 32 GB RAM, NVIDIA GeForce RTX 2080 Ti, and Tensorflow 2.1.0.

2.1.4. Model Estimation Index

A confusion matrix, as shown in Table 2, is used to not only estimate but also explain the model performance in case of imbalanced classes [15]. It is to be noted that metrics like precision, recall, and F1 score are as important as accuracy and AUC in validating the performance of the model. Precision is also known as a positive predictive value, recall is the same as sensitivity and the F1 score, ranging from 0 to 1, and is a harmonic mean of the two. A higher F1 score indicates better accuracy and overall performance. Here, we applied all the aforementioned parameters to the results of the experiments.
The accuracy, precision, recall, and F1 score are given by the following equations:
Accuracy = TP + TN TP + FP + TN + FN
Precision = TP TP + FP
Recall   = TP TP + FN
F 1   Score   = 2 × Precision × Recall Precision + Recall

3. Results

In the AP trials, AP2 and AP4 achieved the best accuracy of 86%, whereas AP4 achieved the highest AUC of 0.92. In the lateral trials, Lat3 achieved the highest accuracy of 90% and Lat1 achieved the highest AUC of 0.95, respectively. Because of the class imbalance of our data, AUC is a more meaningful index than accuracy. Hence, AP4 and Lat1 are the best trained models. In addition, the overall performance of the AP trial was better than that of the lateral trial. The results of the experiments are summarized in Table 3, Table 4, Table 5 and Table 6 and Figure 7.

4. Discussion

Clinicians, especially in the ED, tend to overlook minor fractures of ankle due to the busy environment in the emergency room; this happens until they have had sufficient experience. Thus, we tried to determine whether machine learning algorithms could help diagnose these fractures. The primary intent of our study was to analyze the feasibility of using AI techniques for identifying ankle fractures. This was achieved using the following criteria: (1) The model should be able to correctly detect minor fractures as well as major fractures; (2) the performance of the model should either equal or surpass human diagnosis. We concluded that the study, in its present capacity, fell short on both aspects. Other studies on pelvic, wrist, and other fractures showed over 90% classification accuracy and an AUC of 0.95 [16,17,18]. Compared with the previous two studies on ankle fractures using deep learning, our study showed improved accuracy (i.e., 83% > 76%) [10,11]. Therefore, we conducted further analysis on the results obtained from our study.
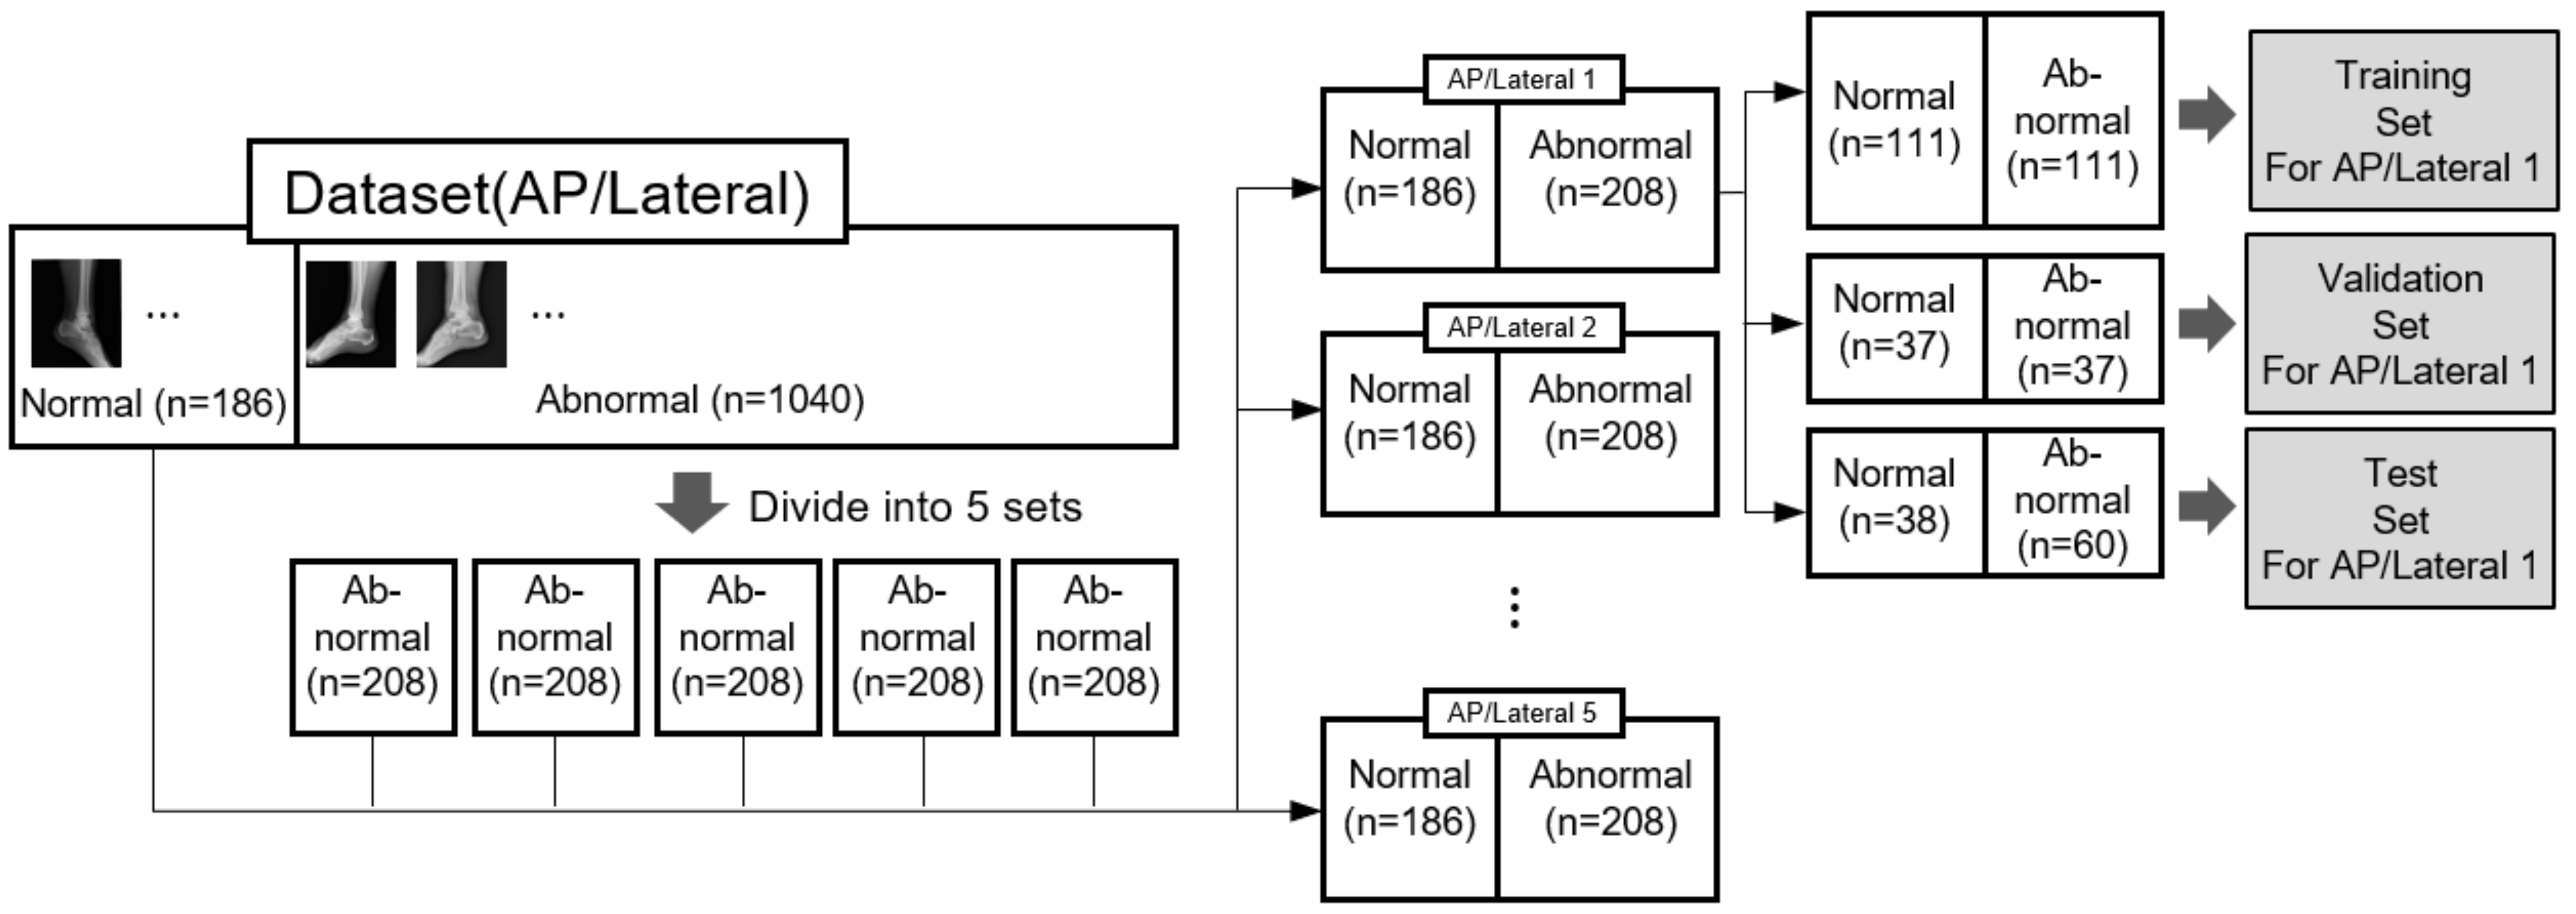
First, this study is the first ever to use both X-rays and images of CT scans of ankle fractures for a labeling process; previous studies have utilized only X-rays. Moreover, the images were reviewed by three medical professionals and hence we can confirm that our datasets are reliable. However, they are also quite imbalanced in that there were relatively less normal images per abnormal ones, as patients who underwent CT scans were primarily concerned with ankle fractures. Even though we used an under-sampling technique, it is a major limitation of our study.
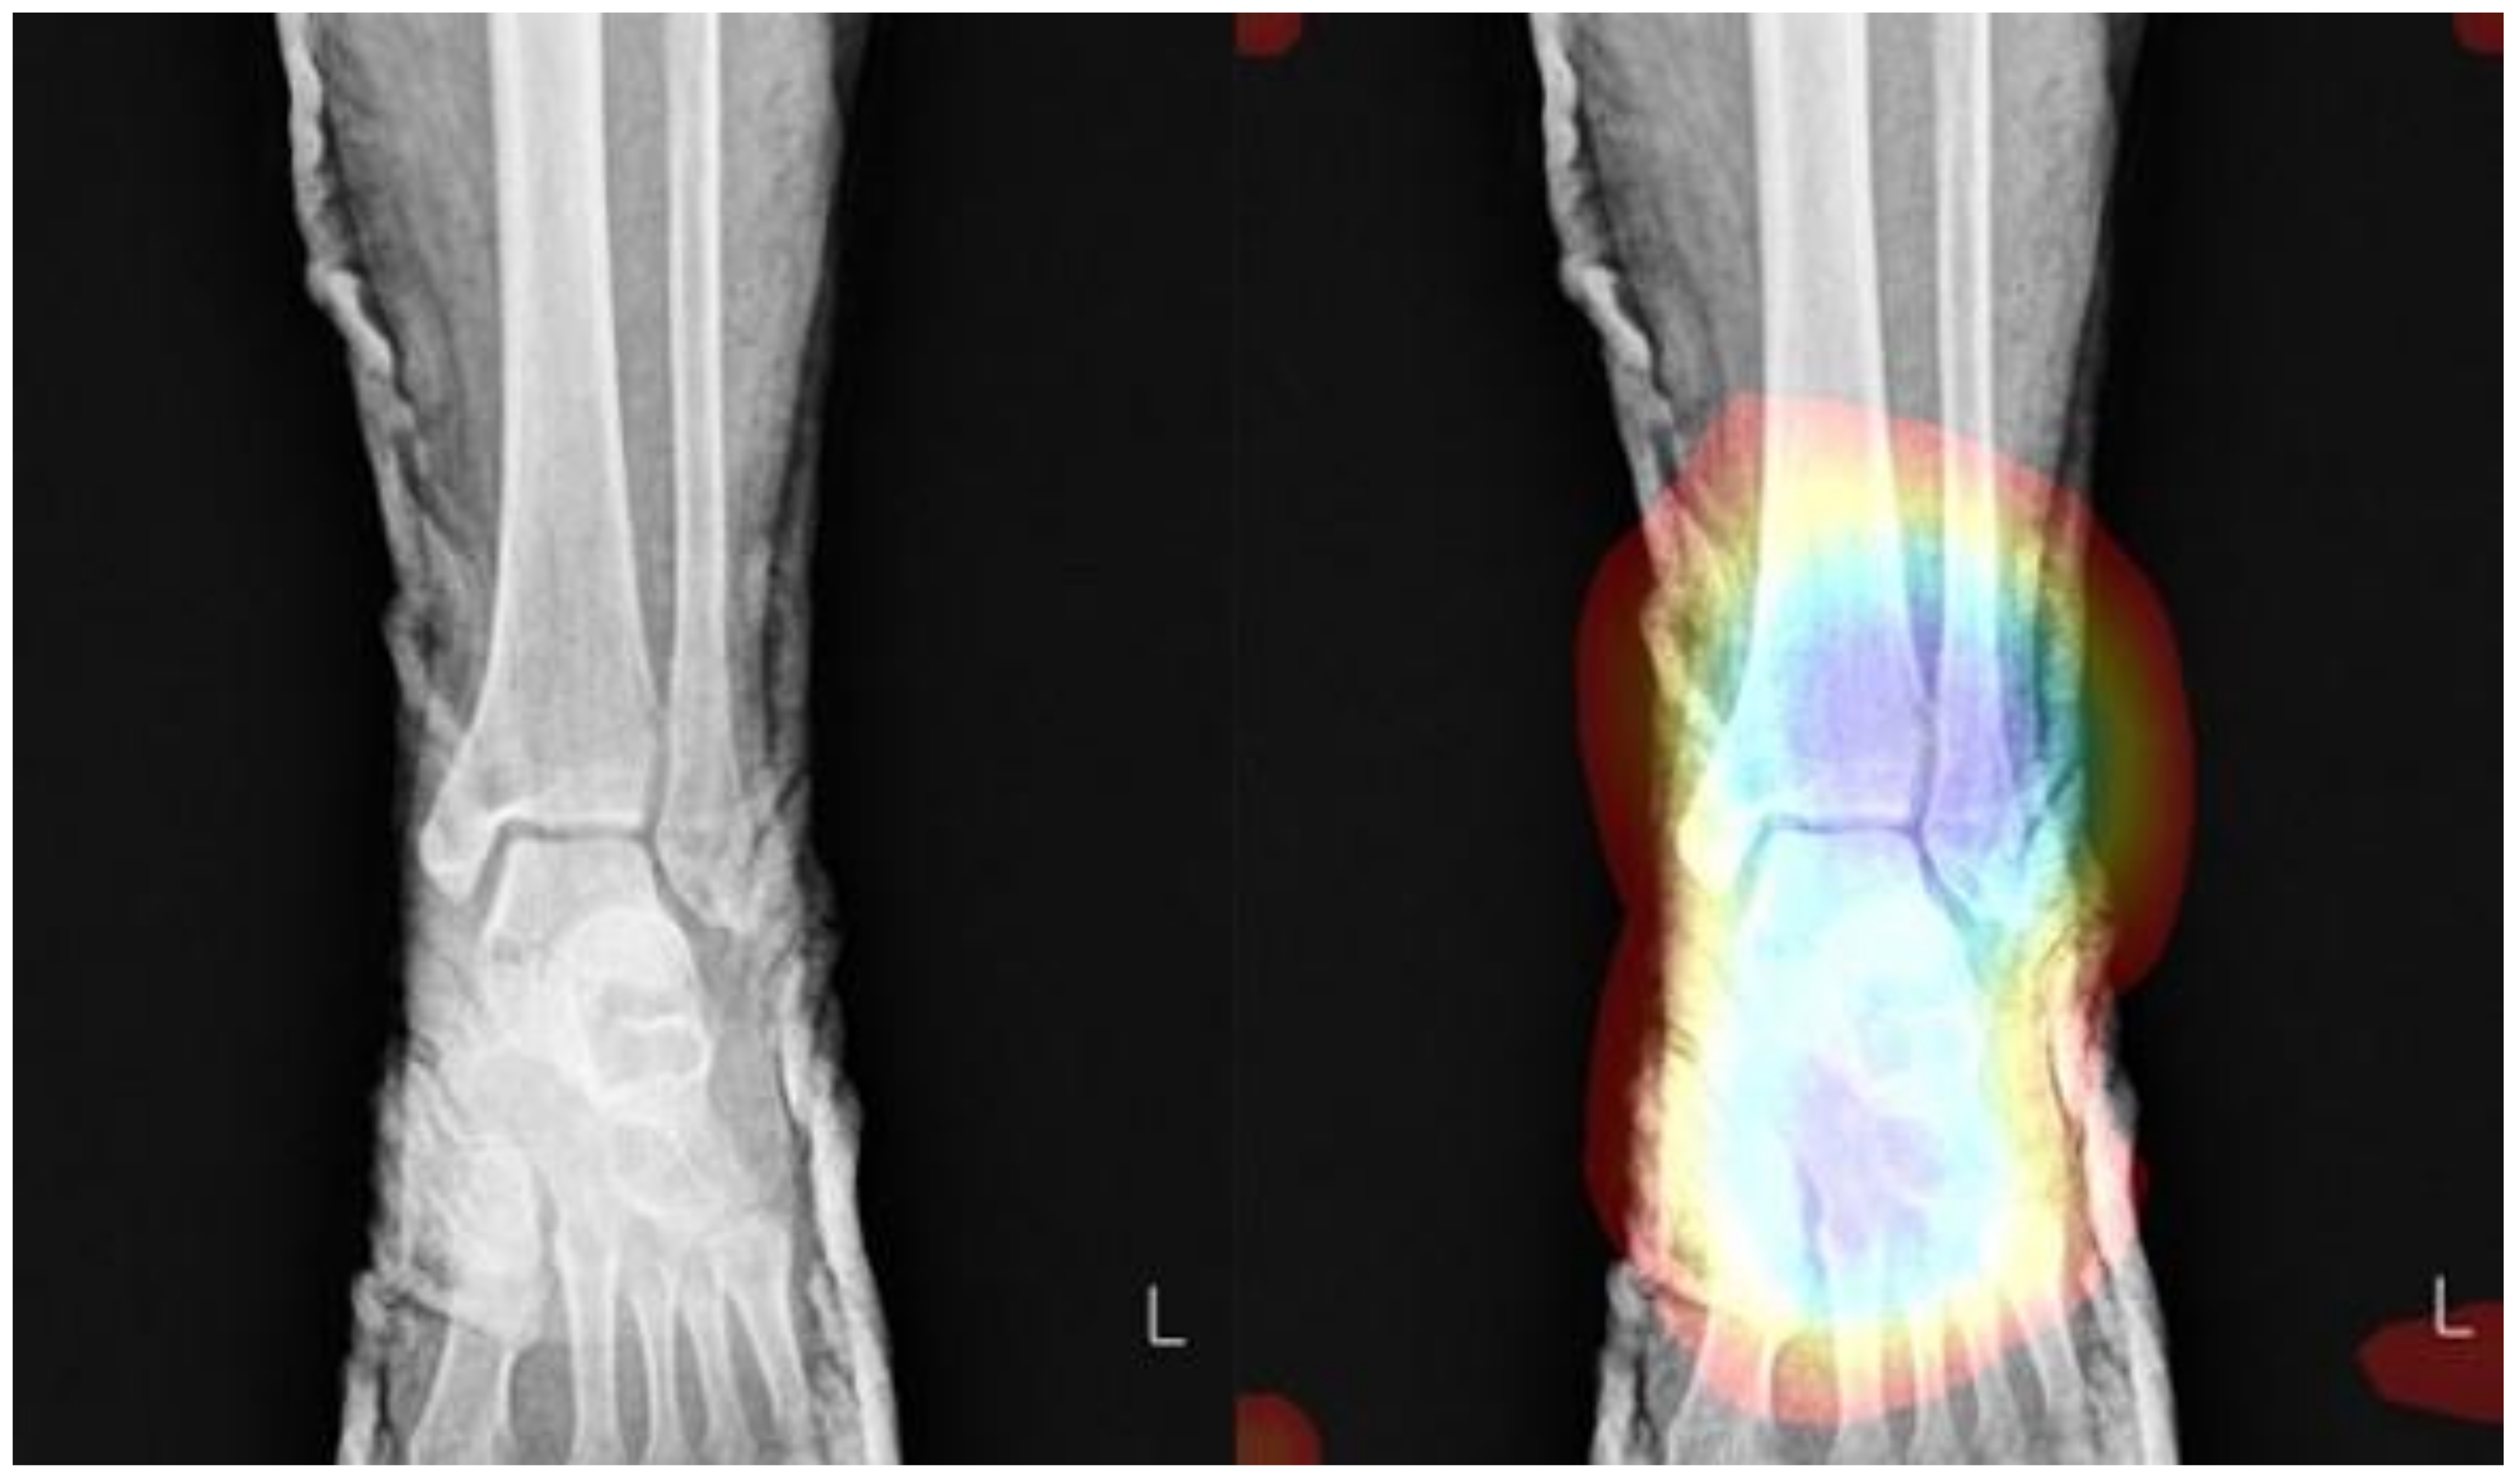
Second, apart from class imbalance, we encountered one other major issue during the experiments that was associated with artifacts, especially splint. Among the X-rays that had splint, the majority featured fractures, but the model, nonetheless, classified all images with splint as fracture (i.e., Figure 8). Because there is no study published in this regard, this issue needs to be studied further as splint is used to treat a wide range of injuries. It is still unclear how to train a model to classify X-rays with splint.
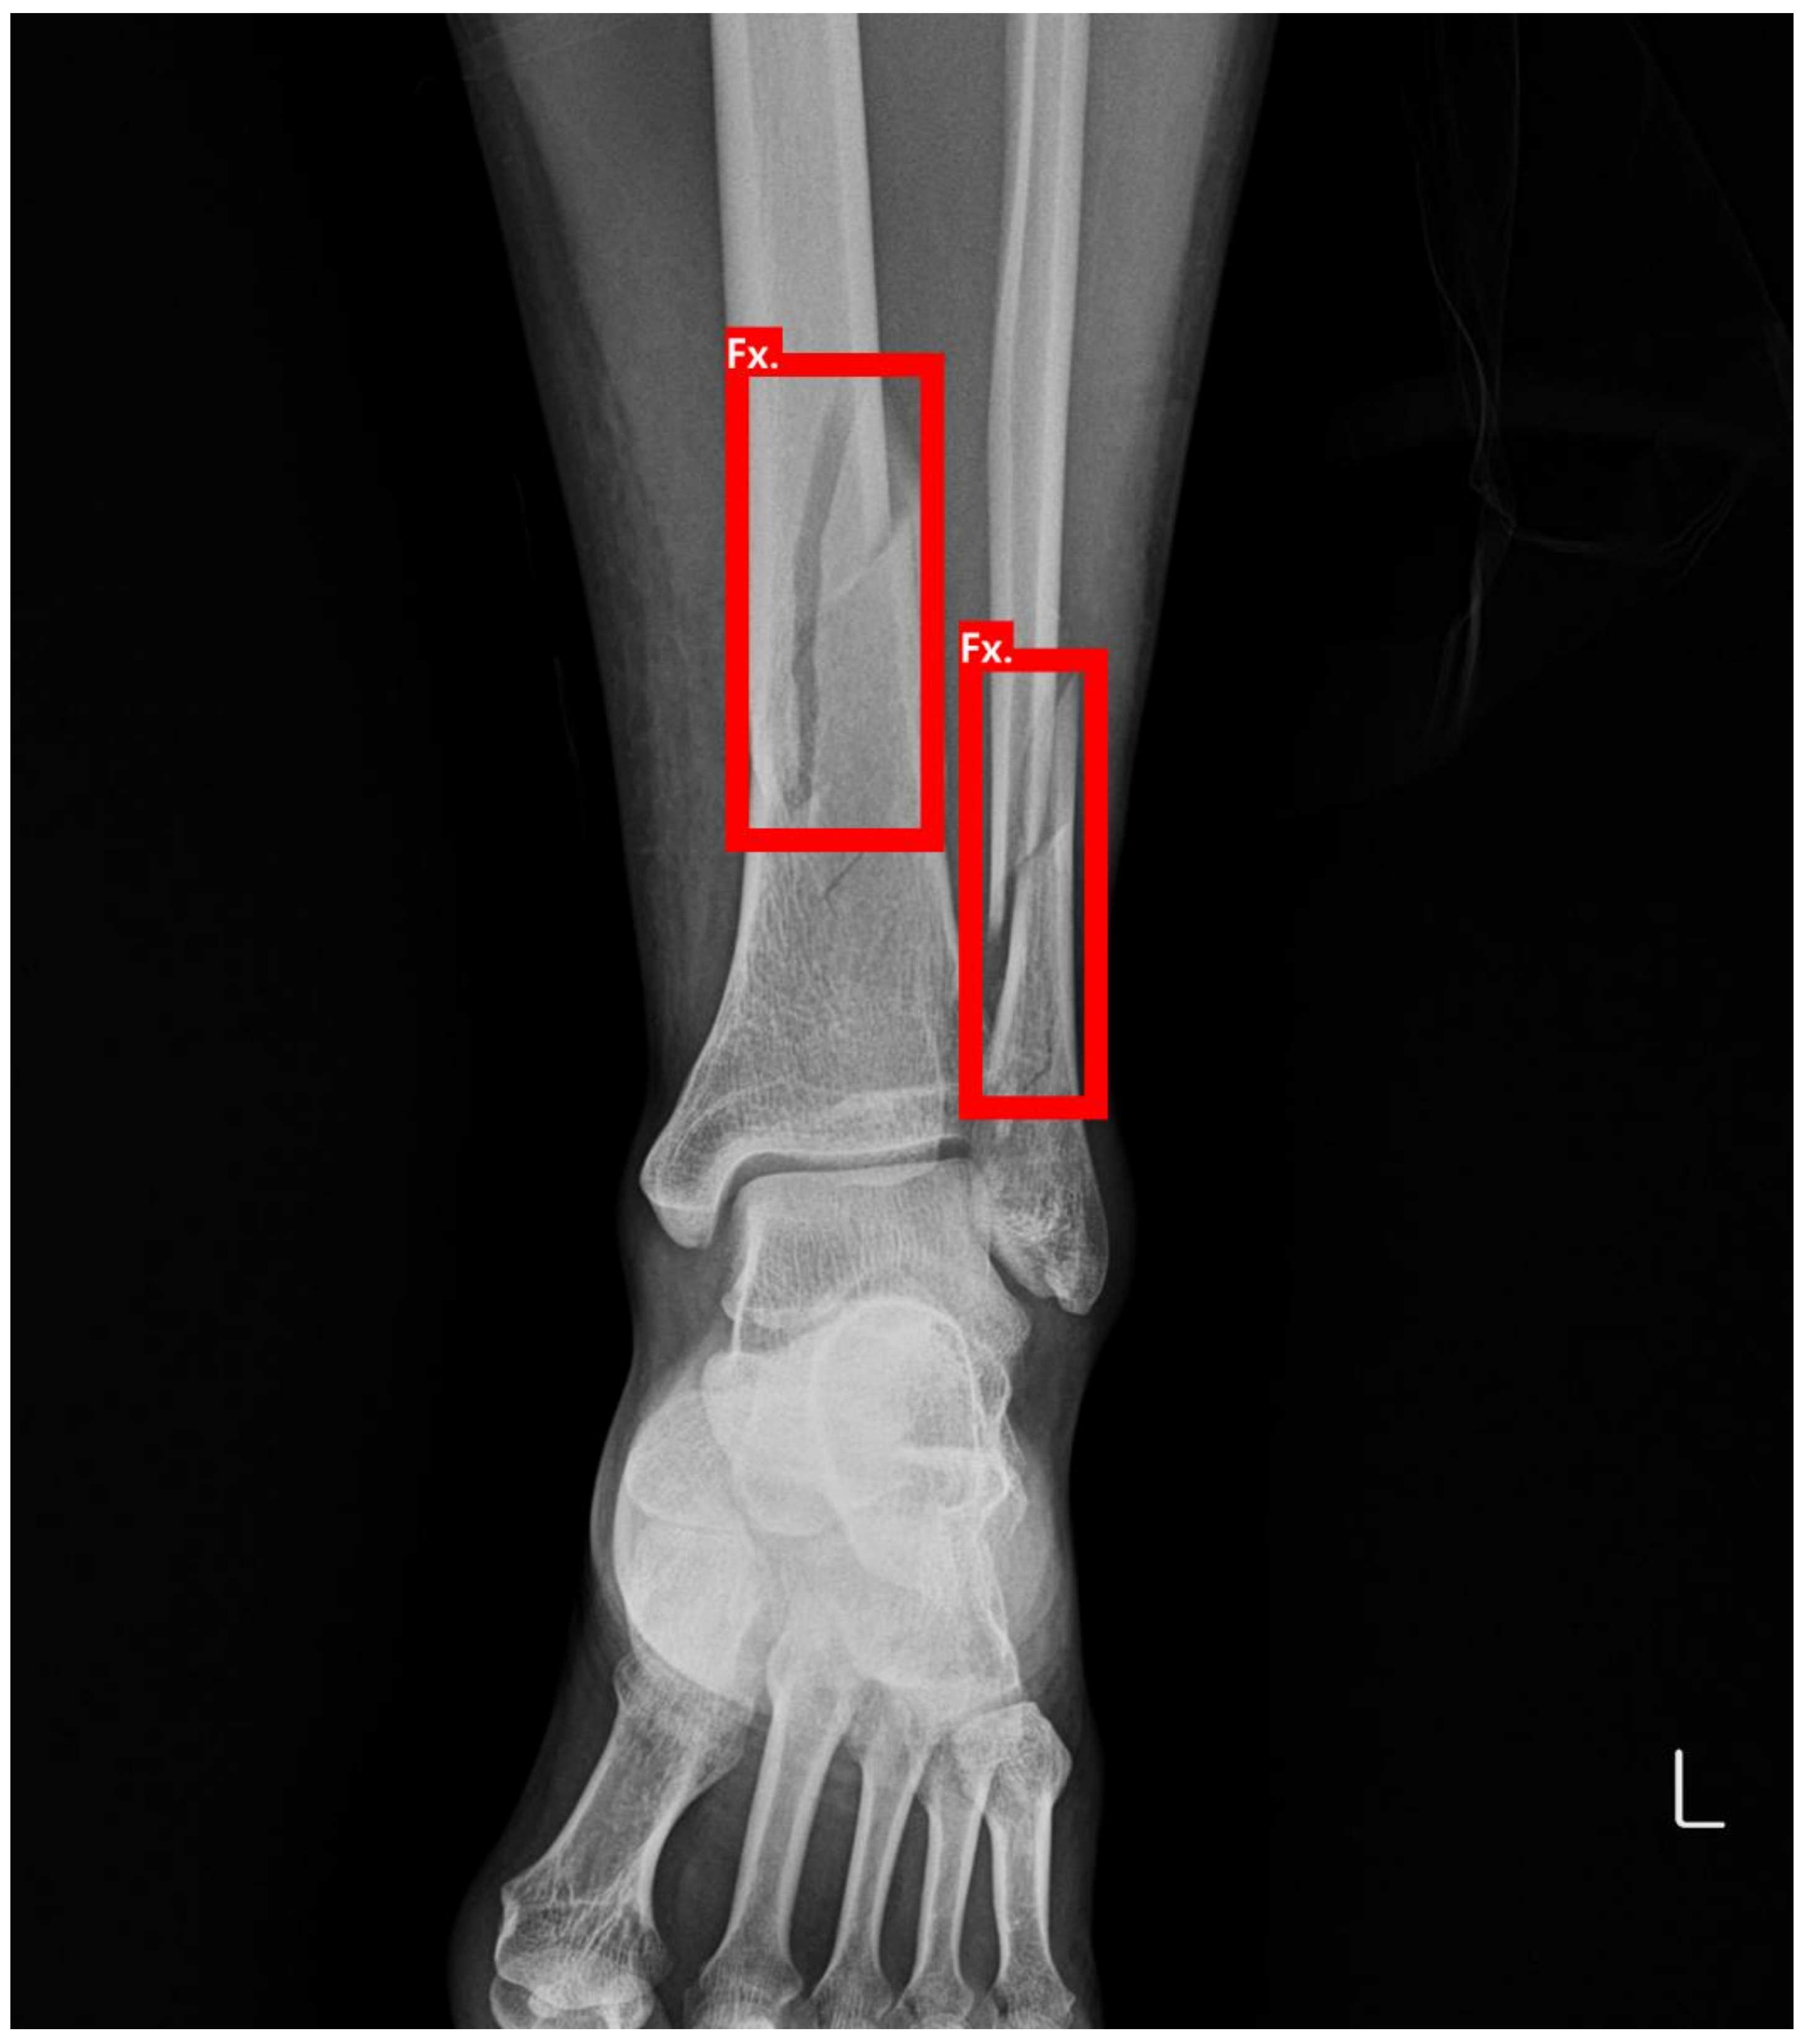
Third, minor fractures were occasionally accompanied by large fractures; such multiple fractures may cause the model to misunderstand the only large fracture as “abnormal” while attempting to categorize the minor fracture as “normal”. To resolve this problem, we plan to apply an object detection algorithm in our future study, as shown in Figure 9. The object detection model can not only classify but also localize where the lesion is in images with a bounding box (red line on Figure 9) in the dataset.
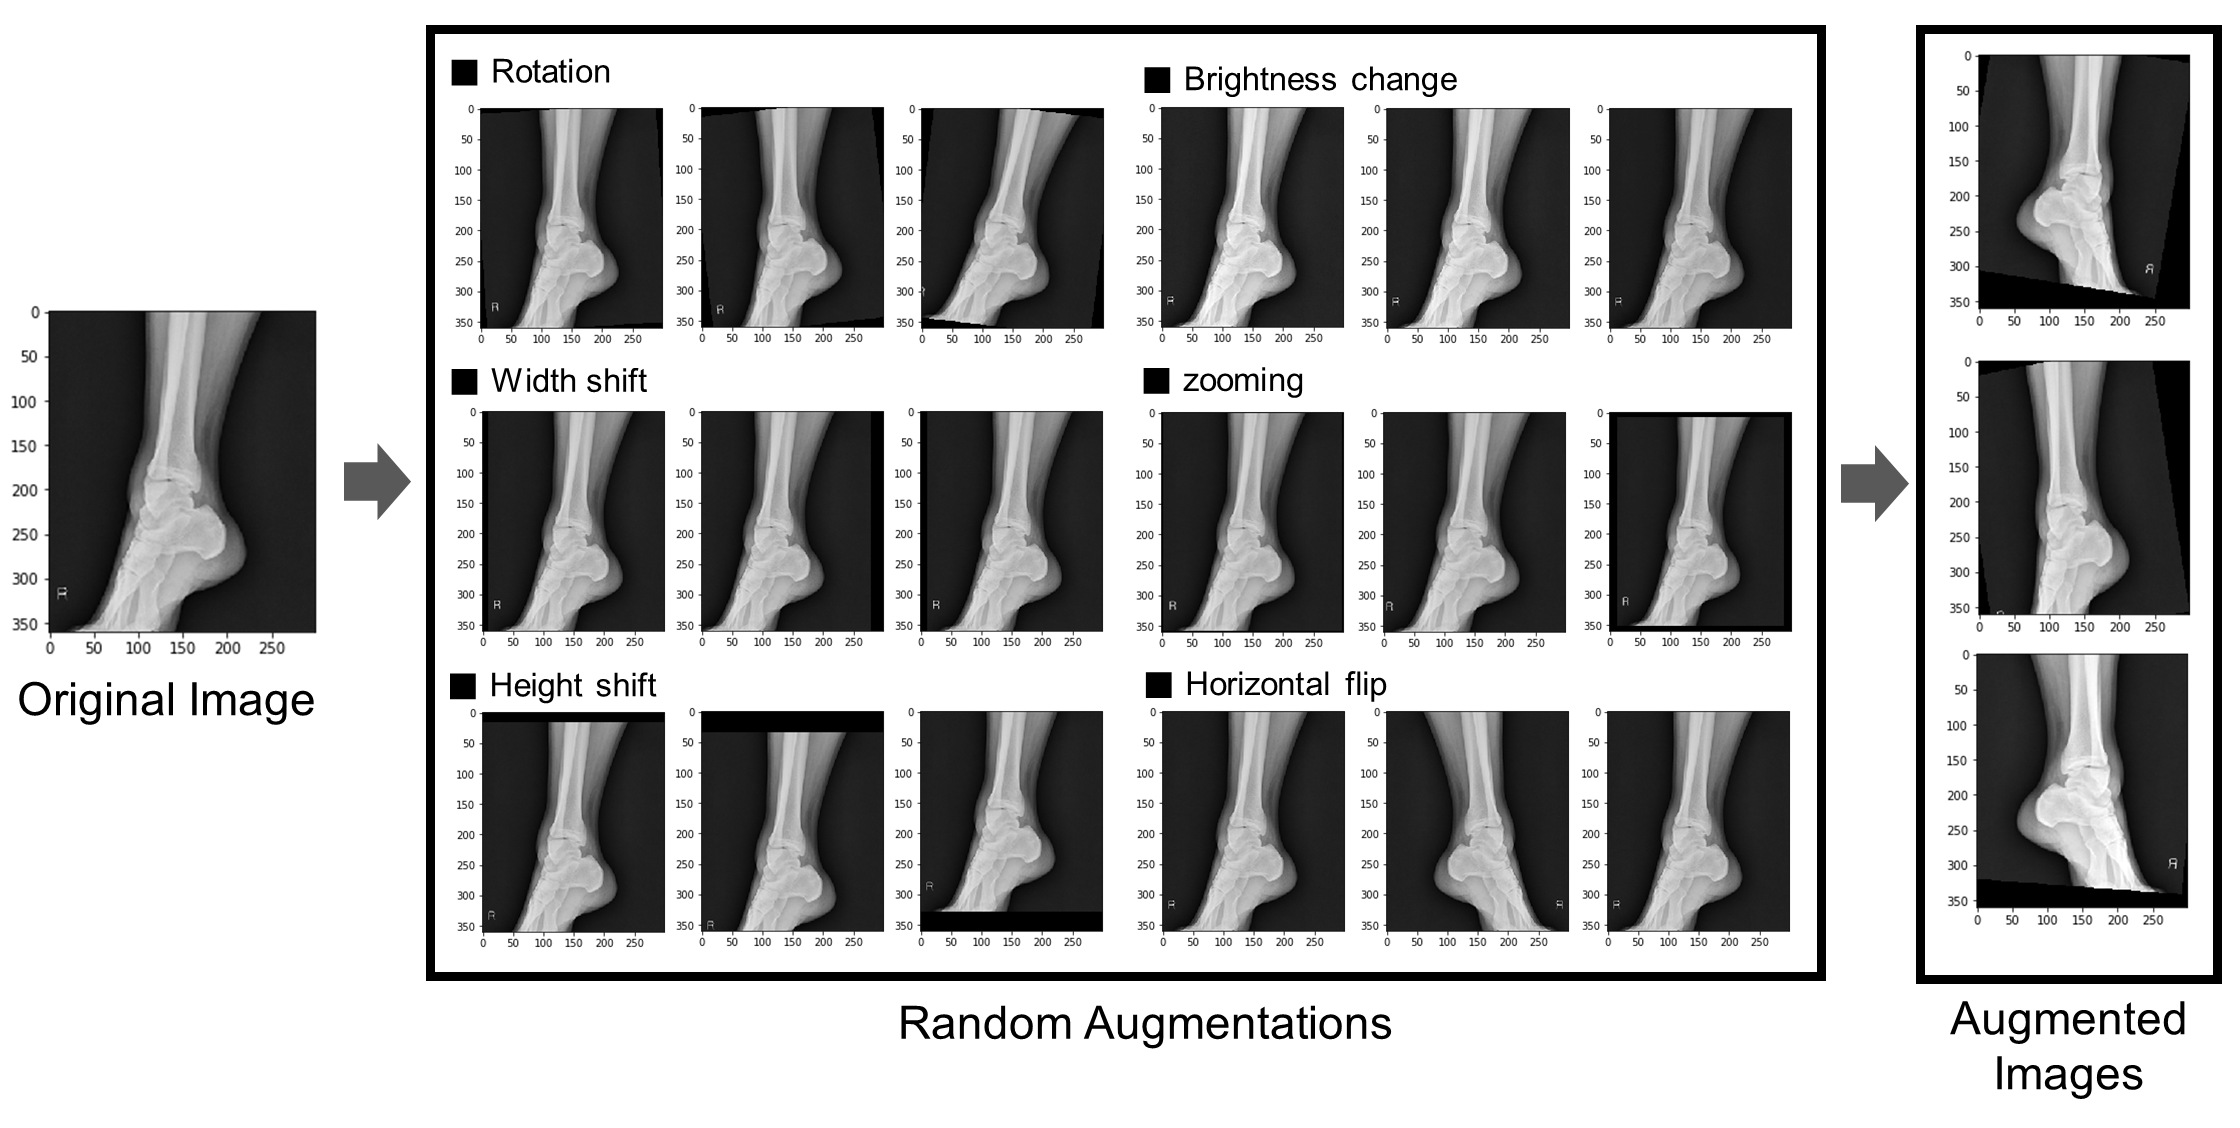
Lastly, owing to insufficient normal images in the datasets, the hyper-parameter could not be efficiently fine-tuned despite employing under-sampling and data augmentation techniques.
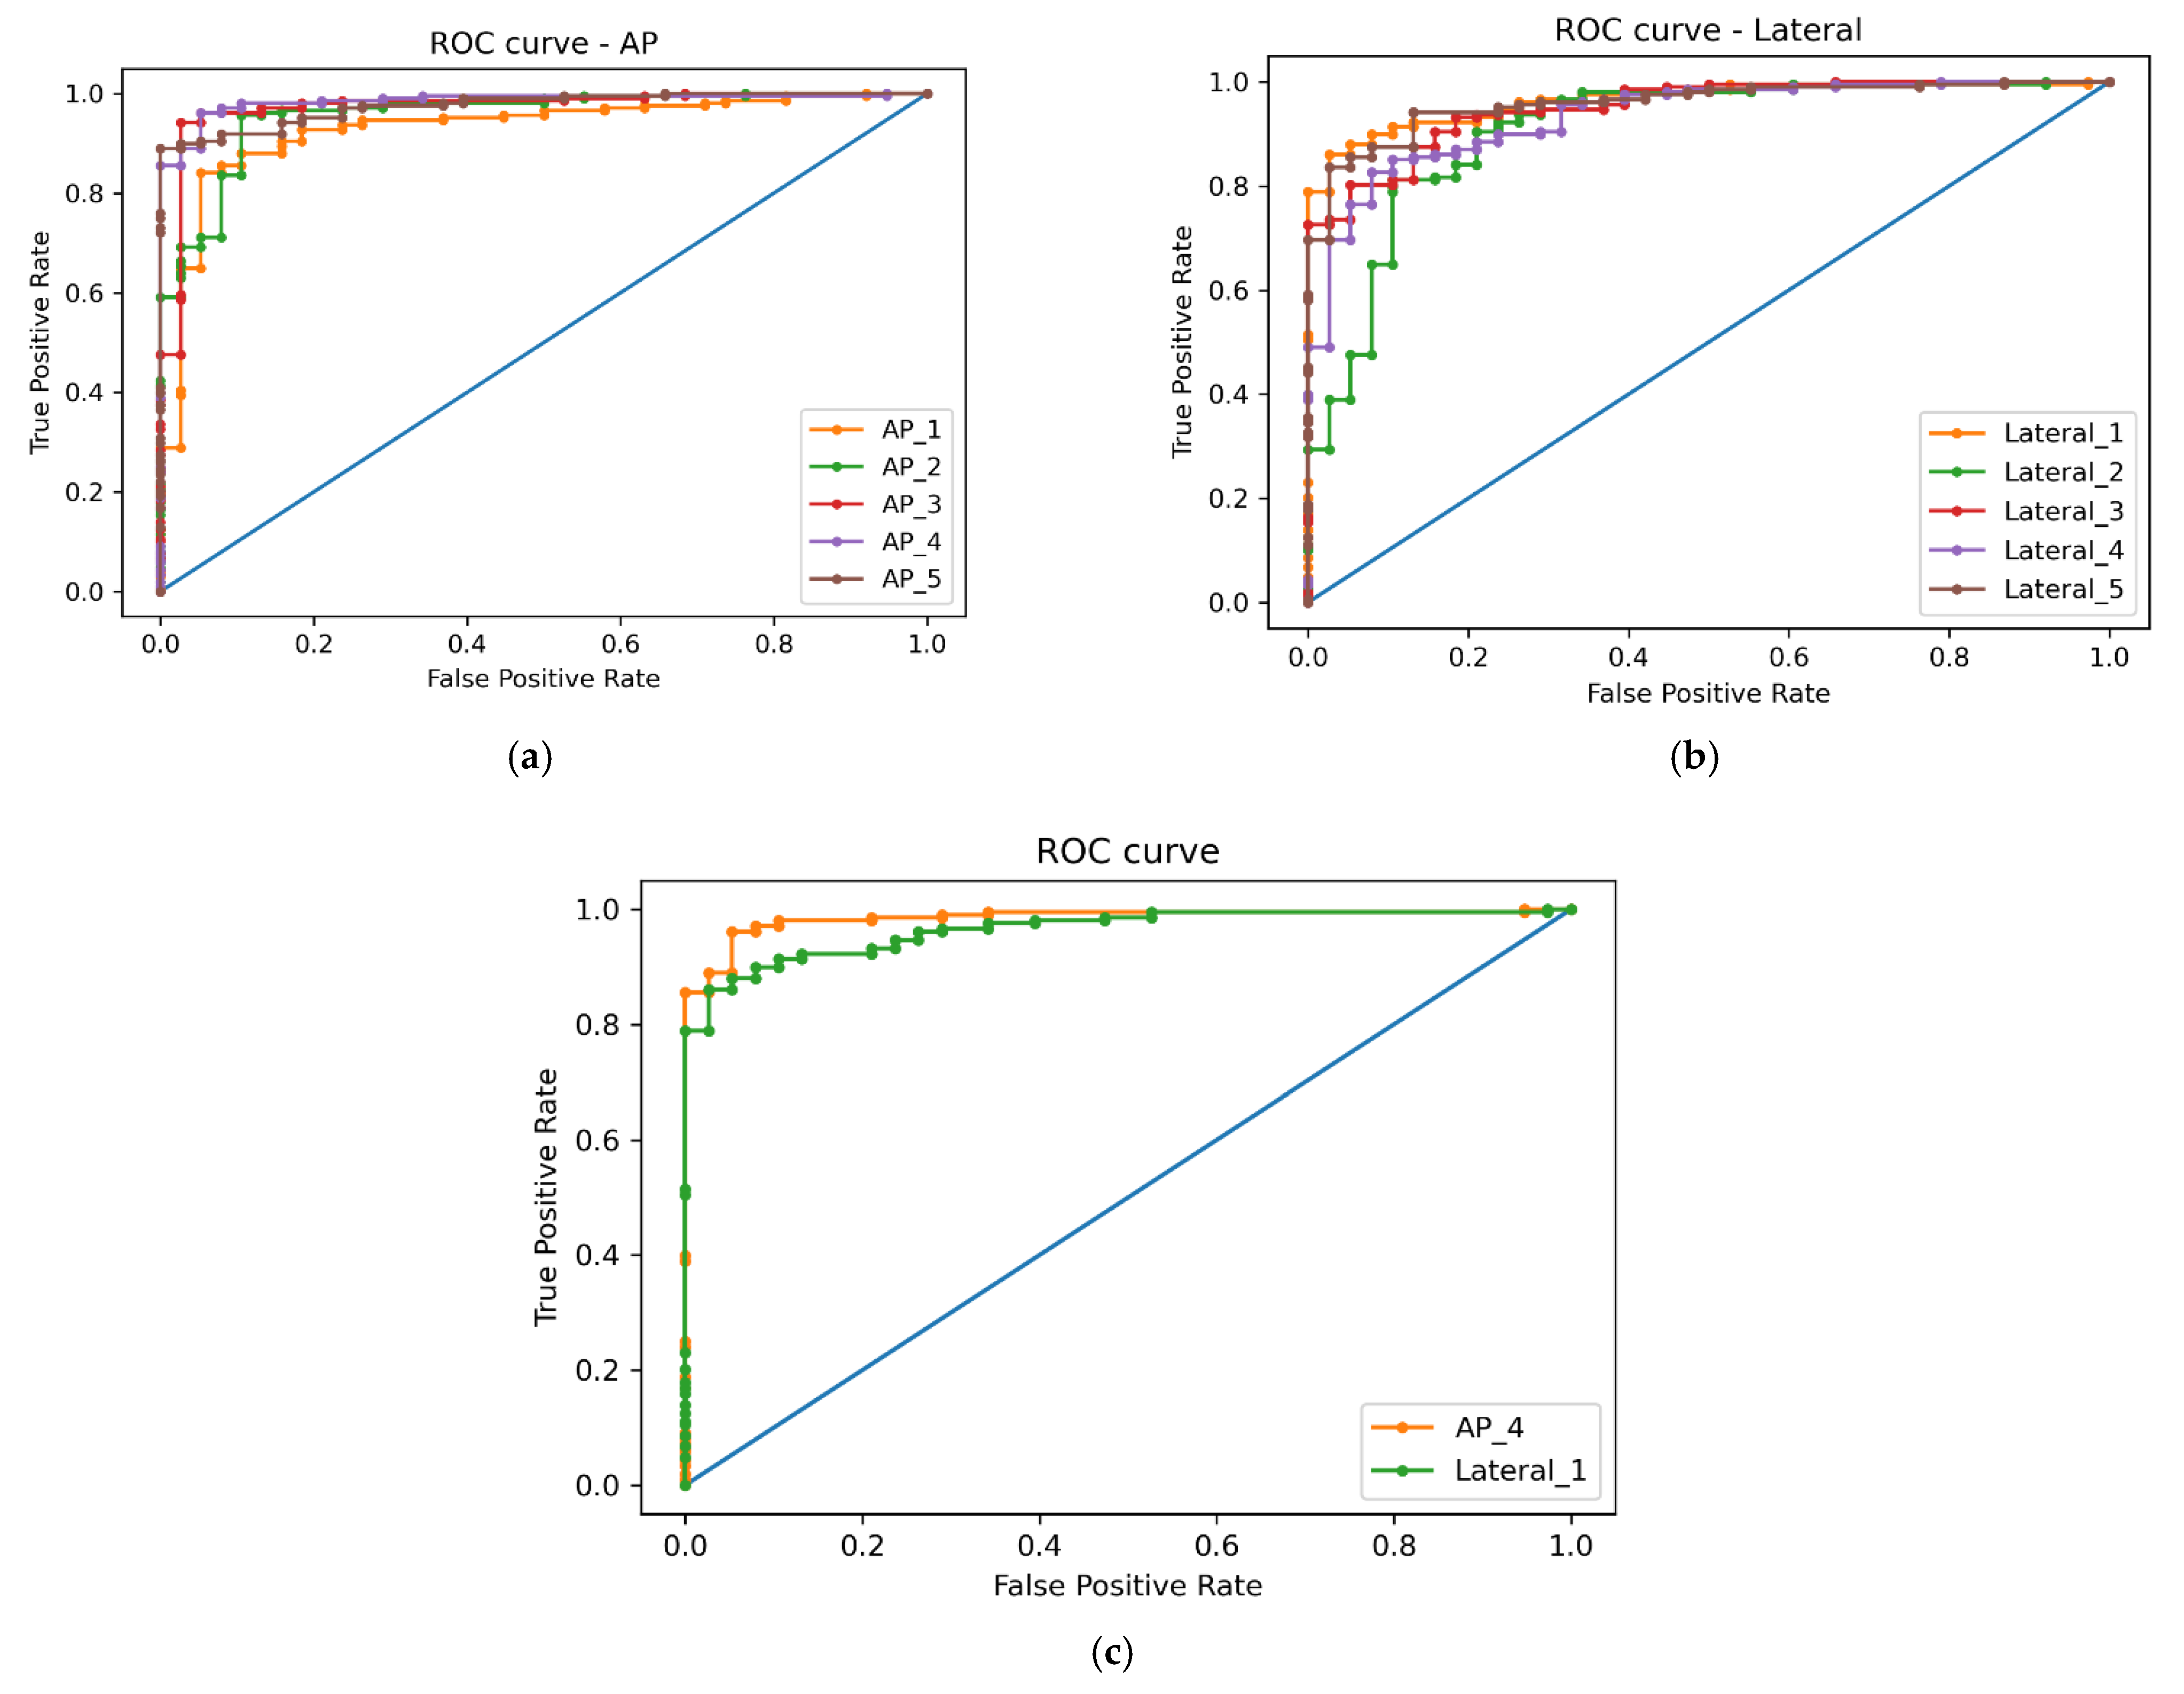
Given the various challenges we encountered in the machine learning tasks, it is difficult to determine precisely why the AP trial demonstrated higher accuracy as compared to the lateral trial, considering that images of the lateral type have more overlapping parts. It seems to be resolved by applying “Explainable AI”, which is a promising field and shows decision-making processes using various algorithms [19,20]. Using this, we aim to train models to make smarter decisions and more accurate predictions in our next study.
In summary, our ultimate objective is developing a robust AI framework that can help to detect fractures and convey supporting information with an accuracy of over 90%. We intend for the application to be scaled to accommodate CT, MRI, and pediatric patients as well as to not only reduce medical accidents but also assist medical professionals and doctors in their evaluations and treatment plans.

5. Conclusions

Even with the rapid developments in AI, the application of AI in the medical domain has a long way to go. We aimed to develop a deep learning model that can detect ankle fractures of various sizes on X-ray. Even though we did not achieve high performance, we showed better results compared to previous studies. We reviewed the limitations of the study and proposed theoretical solutions that constitute our next work. In the future, we will investigate the feasibility of explainable AI.

Supplementary Materials

Author Contributions

Conceptualization, J.-H.K. and J.W.L.; methodology, J.-H.K. and Y.-C.M.; software, Y.-C.M.; validation, J.-H.K. and Y.-C.M.; formal analysis, J.-H.K. and Y.-C.M.; investigation, J.-H.K. and Y.-C.M.; resources, J.-H.K., Y.-C.M. and J.W.L.; data curation, J.-H.K. and J.W.L.; writing—original draft preparation, J.-H.K.; writing—review and editing, J.-H.K., Y.-C.M., S.-M.C., Y.H. and J.W.L.; visualization, J.-H.K. and Y.-C.M.; supervision, J.-H.K. and J.W.L.; project administration, J.W.L.; funding acquisition, J.W.L. All authors have read and agreed to the published version of the manuscript.

Funding

This research was funded by National IT Industry Promotion Agency (NIPA) of Korea.

Institutional Review Board Statement

The study was conducted according to the guidelines of the Declaration of Helsinki, and approved by the Institutional Review Board of Hallym University (protocol code 2020-04-032-001, 1 April 2020).

Informed Consent Statement

Patient consent was waived due to its retrospective nature.

Data Availability Statement

All relevant data are within the manuscript and its Supporting Information files.

Conflicts of Interest

The authors declare no conflict of interest.

References

  1. Hallas, P.; Ellingsen, T. Errors in fracture diagnoses in the emergency department–characteristics of patients and diurnal variation. BMC Emerg. Med. 2006, 6, 4. [Google Scholar] [CrossRef] [PubMed] [Green Version]
  2. Brandser, E.A.; Braksiek, R.J.; El-Khoury, G.Y.; Saltzman, C.L.; Marsh, J.; Clark, W.A.; Prokuski, L.J. Missed fractures on emergency room ankle radiographs: An analysis of 433 patients. Emerg. Radiol. 1997, 4, 295–302. [Google Scholar] [CrossRef]
  3. Young, K.-W.; Park, Y.-U.; Kim, J.-S.; Cho, H.-K.; Choo, H.-S.; Park, J.-H. Misdiagnosis of talar body or neck fractures as ankle sprains in low energy traumas. Clin. Orthop. Surg. 2016, 8, 303–309. [Google Scholar] [CrossRef] [PubMed] [Green Version]
  4. Olczak, J.; Fahlberg, N.; Maki, A.; Razavian, A.S.; Jilert, A.; Stark, A.; Sköldenberg, O.; Gordon, M. Artificial intelligence for analyzing orthopedic trauma radiographs: Deep learning algorithms—Are they on par with humans for diagnosing fractures? Acta Orthop. 2017, 88, 581–586. [Google Scholar] [CrossRef] [PubMed] [Green Version]
  5. Indolia, S.; Goswami, A.K.; Mishra, S.; Asopa, P. Conceptual understanding of convolutional neural network-a deep learning approach. Procedia Comput. Sci. 2018, 132, 679–688. [Google Scholar] [CrossRef]
  6. Chung, S.W.; Han, S.S.; Lee, J.W.; Oh, K.-S.; Kim, N.R.; Yoon, J.P.; Kim, J.Y.; Moon, S.H.; Kwon, J.; Lee, H.-J. Automated detection and classification of the proximal humerus fracture by using deep learning algorithm. Acta Orthop. 2018, 89, 468–473. [Google Scholar] [CrossRef] [PubMed] [Green Version]
  7. Gan, K.; Xu, D.; Lin, Y.; Shen, Y.; Zhang, T.; Hu, K.; Zhou, K.; Bi, M.; Pan, L.; Wu, W. Artificial intelligence detection of distal radius fractures: A comparison between the convolutional neural network and professional assessments. Acta Orthop. 2019, 90, 394–400. [Google Scholar] [CrossRef] [PubMed] [Green Version]
  8. Lindsey, R.; Daluiski, A.; Chopra, S.; Lachapelle, A.; Mozer, M.; Sicular, S.; Hanel, D.; Gardner, M.; Gupta, A.; Hotchkiss, R. Deep neural network improves fracture detection by clinicians. Proc. Natl. Acad. Sci. USA 2018, 115, 11591–11596. [Google Scholar] [CrossRef] [PubMed] [Green Version]
  9. Yu, J.; Yu, S.; Erdal, B.; Demirer, M.; Gupta, V.; Bigelow, M.; Salvador, A.; Rink, T.; Lenobel, S.; Prevedello, L. Detection and localisation of hip fractures on anteroposterior radiographs with artificial intelligence: Proof of concept. Clin. Radiol. 2020, 75, 237.e1–237.e9. [Google Scholar] [CrossRef] [PubMed]
  10. Dos Santos, D.P.; Brodehl, S.; Baeßler, B.; Arnhold, G.; Dratsch, T.; Chon, S.-H.; Mildenberger, P.; Jungmann, F. Structured report data can be used to develop deep learning algorithms: A proof of concept in ankle radiographs. Insights Imaging 2019, 10, 93. [Google Scholar] [CrossRef] [PubMed]
  11. Kitamura, G.; Chung, C.Y.; Moore, B.E. Ankle fracture detection utilizing a convolutional neural network ensemble implemented with a small sample, de novo training, and multiview incorporation. J. Digit. Imaging 2019, 32, 672–677. [Google Scholar] [CrossRef] [PubMed] [Green Version]
  12. Perez, L.; Wang, J. The effectiveness of data augmentation in image classification using deep learning. arXiv 2017, arXiv:1712.04621. [Google Scholar]
  13. Mednikov, Y.; Nehemia, S.; Zheng, B.; Benzaquen, O.; Lederman, D. Transfer representation learning using Inception-V3 for the detection of masses in mammography. In Proceedings of the 2018 40th Annual International Conference of the IEEE Engineering in Medicine and Biology Society (EMBC), Honolulu, HI, USA, 17–21 July 2018; pp. 2587–2590. [Google Scholar]
  14. Ridell, P.; Spett, H. Training Set Size for Skin Cancer Classification Using Google’s Inception v3. Bachelor’s Thesis, KTH Royal Institute of Technology School of Computer Science and Communication, Stockholm, Sweden, 2017. [Google Scholar]
  15. Luque, A.; Carrasco, A.; Martín, A.; de las Heras, A. The impact of class imbalance in classification performance metrics based on the binary confusion matrix. Pattern Recognit. 2019, 91, 216–231. [Google Scholar] [CrossRef]
  16. Cheng, C.-T.; Ho, T.-Y.; Lee, T.-Y.; Chang, C.-C.; Chou, C.-C.; Chen, C.-C.; Chung, I.-F.; Liao, C.-H. Application of a deep learning algorithm for detection and visualization of hip fractures on plain pelvic radiographs. Eur. Radiol. 2019, 29, 5469–5477. [Google Scholar] [CrossRef] [PubMed] [Green Version]
  17. Liu, F.; Kijowski, R. Deep learning in musculoskeletal imaging. Adv. Clin. Radiol. 2019, 1, 83–94. [Google Scholar] [CrossRef]
  18. Thian, Y.L.; Li, Y.; Jagmohan, P.; Sia, D.; Chan, V.E.Y.; Tan, R.T. Convolutional neural networks for automated fracture detection and localization on wrist radiographs. Radiol. Artif. Intell. 2019, 1, e180001. [Google Scholar] [CrossRef] [PubMed]
  19. Holzinger, A.; Biemann, C.; Pattichis, C.S.; Kell, D.B. What do we need to build explainable AI systems for the medical domain? arXiv 2017, arXiv:1712.09923. [Google Scholar]
  20. Holzinger, A.; Malle, B.; Kieseberg, P.; Roth, P.M.; Müller, H.; Reihs, R.; Zatloukal, K. Towards the augmented pathologist: Challenges of explainable-ai in digital pathology. arXiv 2017, arXiv:1712.06657. [Google Scholar]
Figure 1. Large or definite fracture. Tibia shaft fracture. It can be easily identified, even by a novice.
Applsci 11 08791 g001
Figure 2. (a) Minor fracture. Oblique fracture on medial malleolus. (b) Minor fracture. Avulsion fracture on medial malleolus. (c) Minor fracture. Tip fracture on distal tibia.
Applsci 11 08791 g002
Figure 3. Dataset preparation. Both AP and lateral X-rays and images of CT scan were reviewed simultaneously by three specialists and labeled normal or abnormal. The used X-rays were extracted to make up the dataset. We prepared two datasets for experiments.
Applsci 11 08791 g003
Figure 4. Dataset distribution. Two datasets were prepared. One is AP X-rays of normal (n = 186) and abnormal (n = 1040) and the other is same number of lateral X-rays.
Applsci 11 08791 g004
Figure 5. Dataset augmentation. Six techniques were used to augment data. The augmented data were used in the experiments.
Applsci 11 08791 g005
Figure 6. Model training Inception V3 is a convolutional neural network with 48 deep layers. It is a pre-trained model using more than a million images from the ImageNet. The network can classify images into 1000 object categories.
Applsci 11 08791 g006
Figure 7. (a) ROC curve—AP trial. (b) ROC curve—lateral trial. (c) ROC curve—best trained models.
Applsci 11 08791 g007
Figure 8. Non-fracture X-ray with splint. Even though it is normal, in the test session, the deep learning model interpreted X-ray with splint as fractured group. The colored area was precepted by fractured part.
Applsci 11 08791 g008
Figure 9. Object detection. The object detection algorithm can classify and localize the lesion. But it requires a labelled dataset with bounding box.
Applsci 11 08791 g009
Table 1. Dataset distribution for each trial.
AnteroposteriorLateral
NormalAbnormalNormalAbnormal
Training set111111111111
Validation set37373737
Test set38603860
Table 2. Confusion matrix.
Predicted PositivePredicted Negative
Actually PositiveTrue Positive (TP)False Negative (FN)
Actually NegativeFalse Positive (FP)True Negative (TN)
Table 3. Results of AP (anteroposterior) dataset training.
Predicted AbnormalPredicted Normal
AP1True Abnormal4713
True Normal533
AP2True Abnormal546
True Normal830
AP3True Abnormal4416
True Normal335
AP4True Abnormal546
True Normal830
AP5True Abnormal4515
True Normal335
Table 4. Results of lateral dataset training.
Predicted AbnormalPredicted Normal
Lateral 1True Abnormal537
True Normal533
Lateral 2True Abnormal3822
True Normal434
Lateral 3True Abnormal546
True Normal434
Lateral 4True Abnormal4515
True Normal335
Lateral 5True Abnormal4416
True Normal335
Table 5. Evaluation of the model performance—AP trial.
AP1AP2AP3AP4AP5Average
Accuracy (%)828681868283
AUC0.910.880.860.920.880.89
Precision0.90.870.940.870.940.9
Recall0.780.90.730.90.750.81
F1-score0.840.890.820.890.830.85
Table 6. Evaluation of the model performance—lateral trial.
Lateral1Lateral2Lateral3Lateral4Lateral5Average
Accuracy (%)887390828183
AUC0.950.850.920.870.90.9
Precision0.910.90.930.940.940.92
Recall0.880.630.90.750.730.78
F1-score0.90.750.920.830.820.84
Publisher’s Note: MDPI stays neutral with regard to jurisdictional claims in published maps and institutional affiliations.

