
A Cross-Machine Comparison of Shear-Wave Speed Measurements Using 2D Shear-Wave Elastography in the Normal Female Breast


Abstract
:1. Introduction
2. Materials and Methods
2.1. Machines and Machine Settings
2.2. In Vitro Measurements
2.3. In Vivo Imaging
2.4. Shear-Wave Speed Estimates
2.5. Data Analysis
3. Results
3.1. Difference in cs Estimates between Machines In Vitro
3.2. Difference in cs Estimates between Machines In Vivo
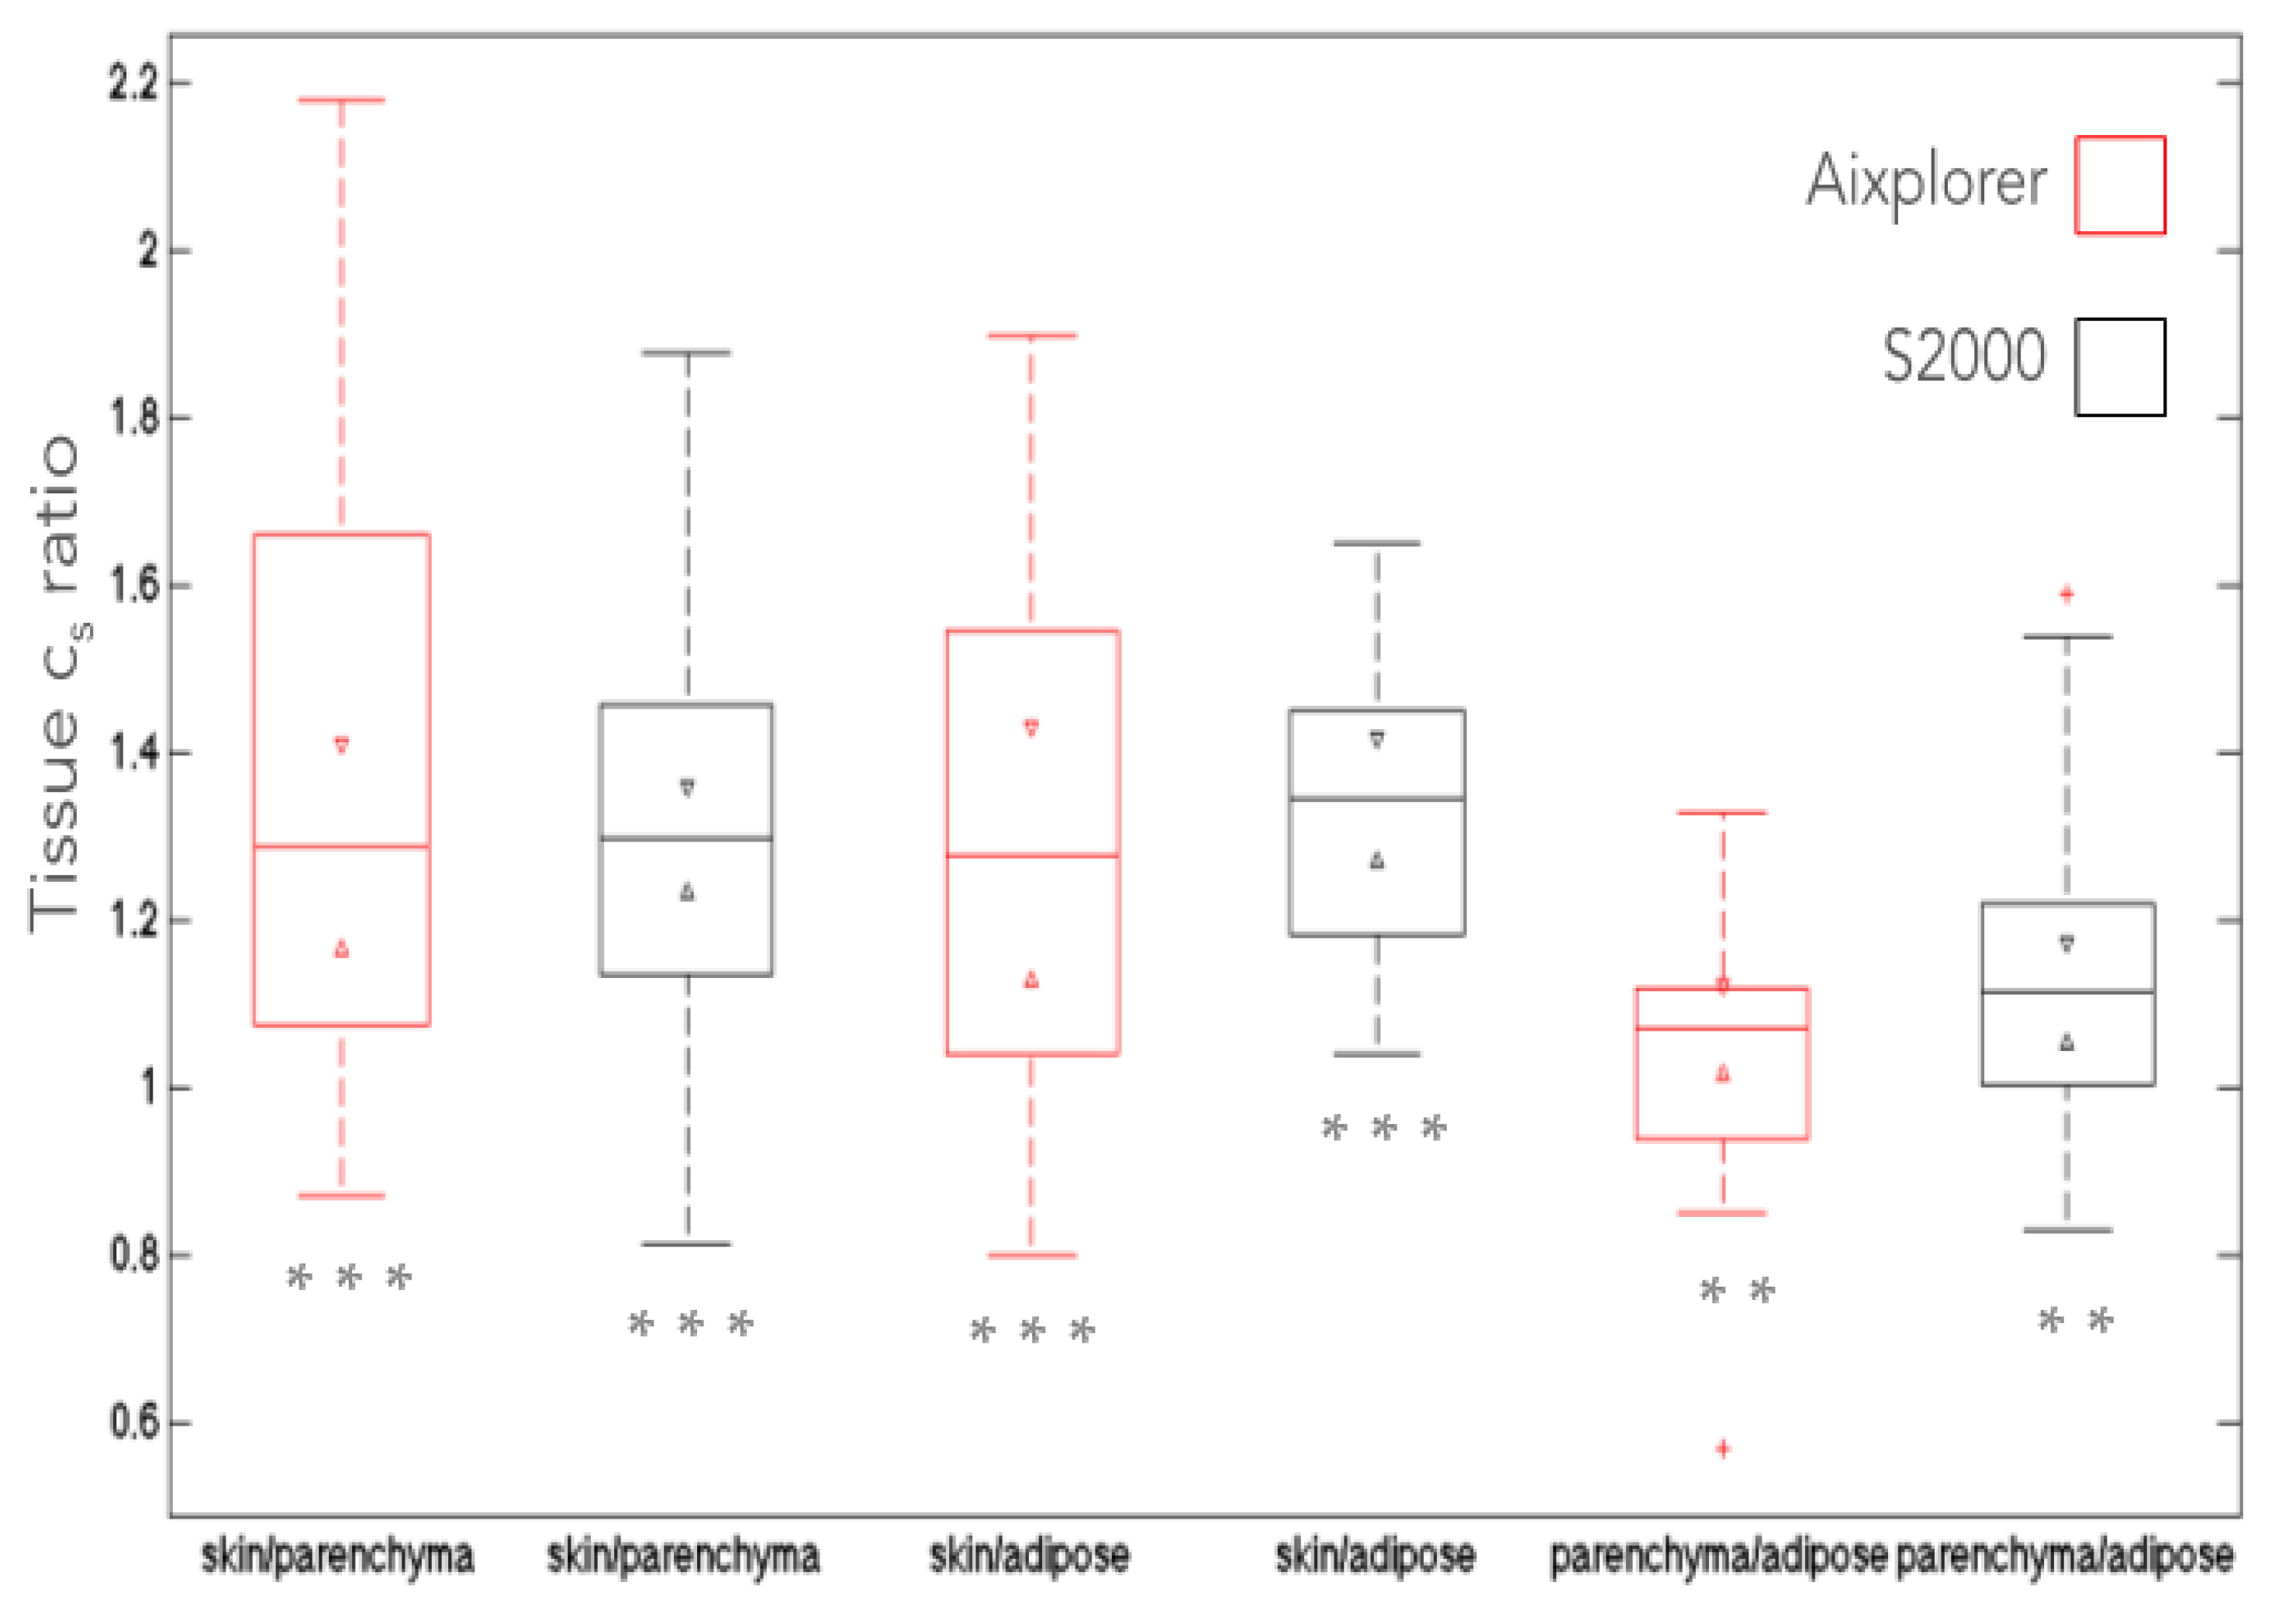
3.3. Comparison of Tissue cs Ratios between Machines
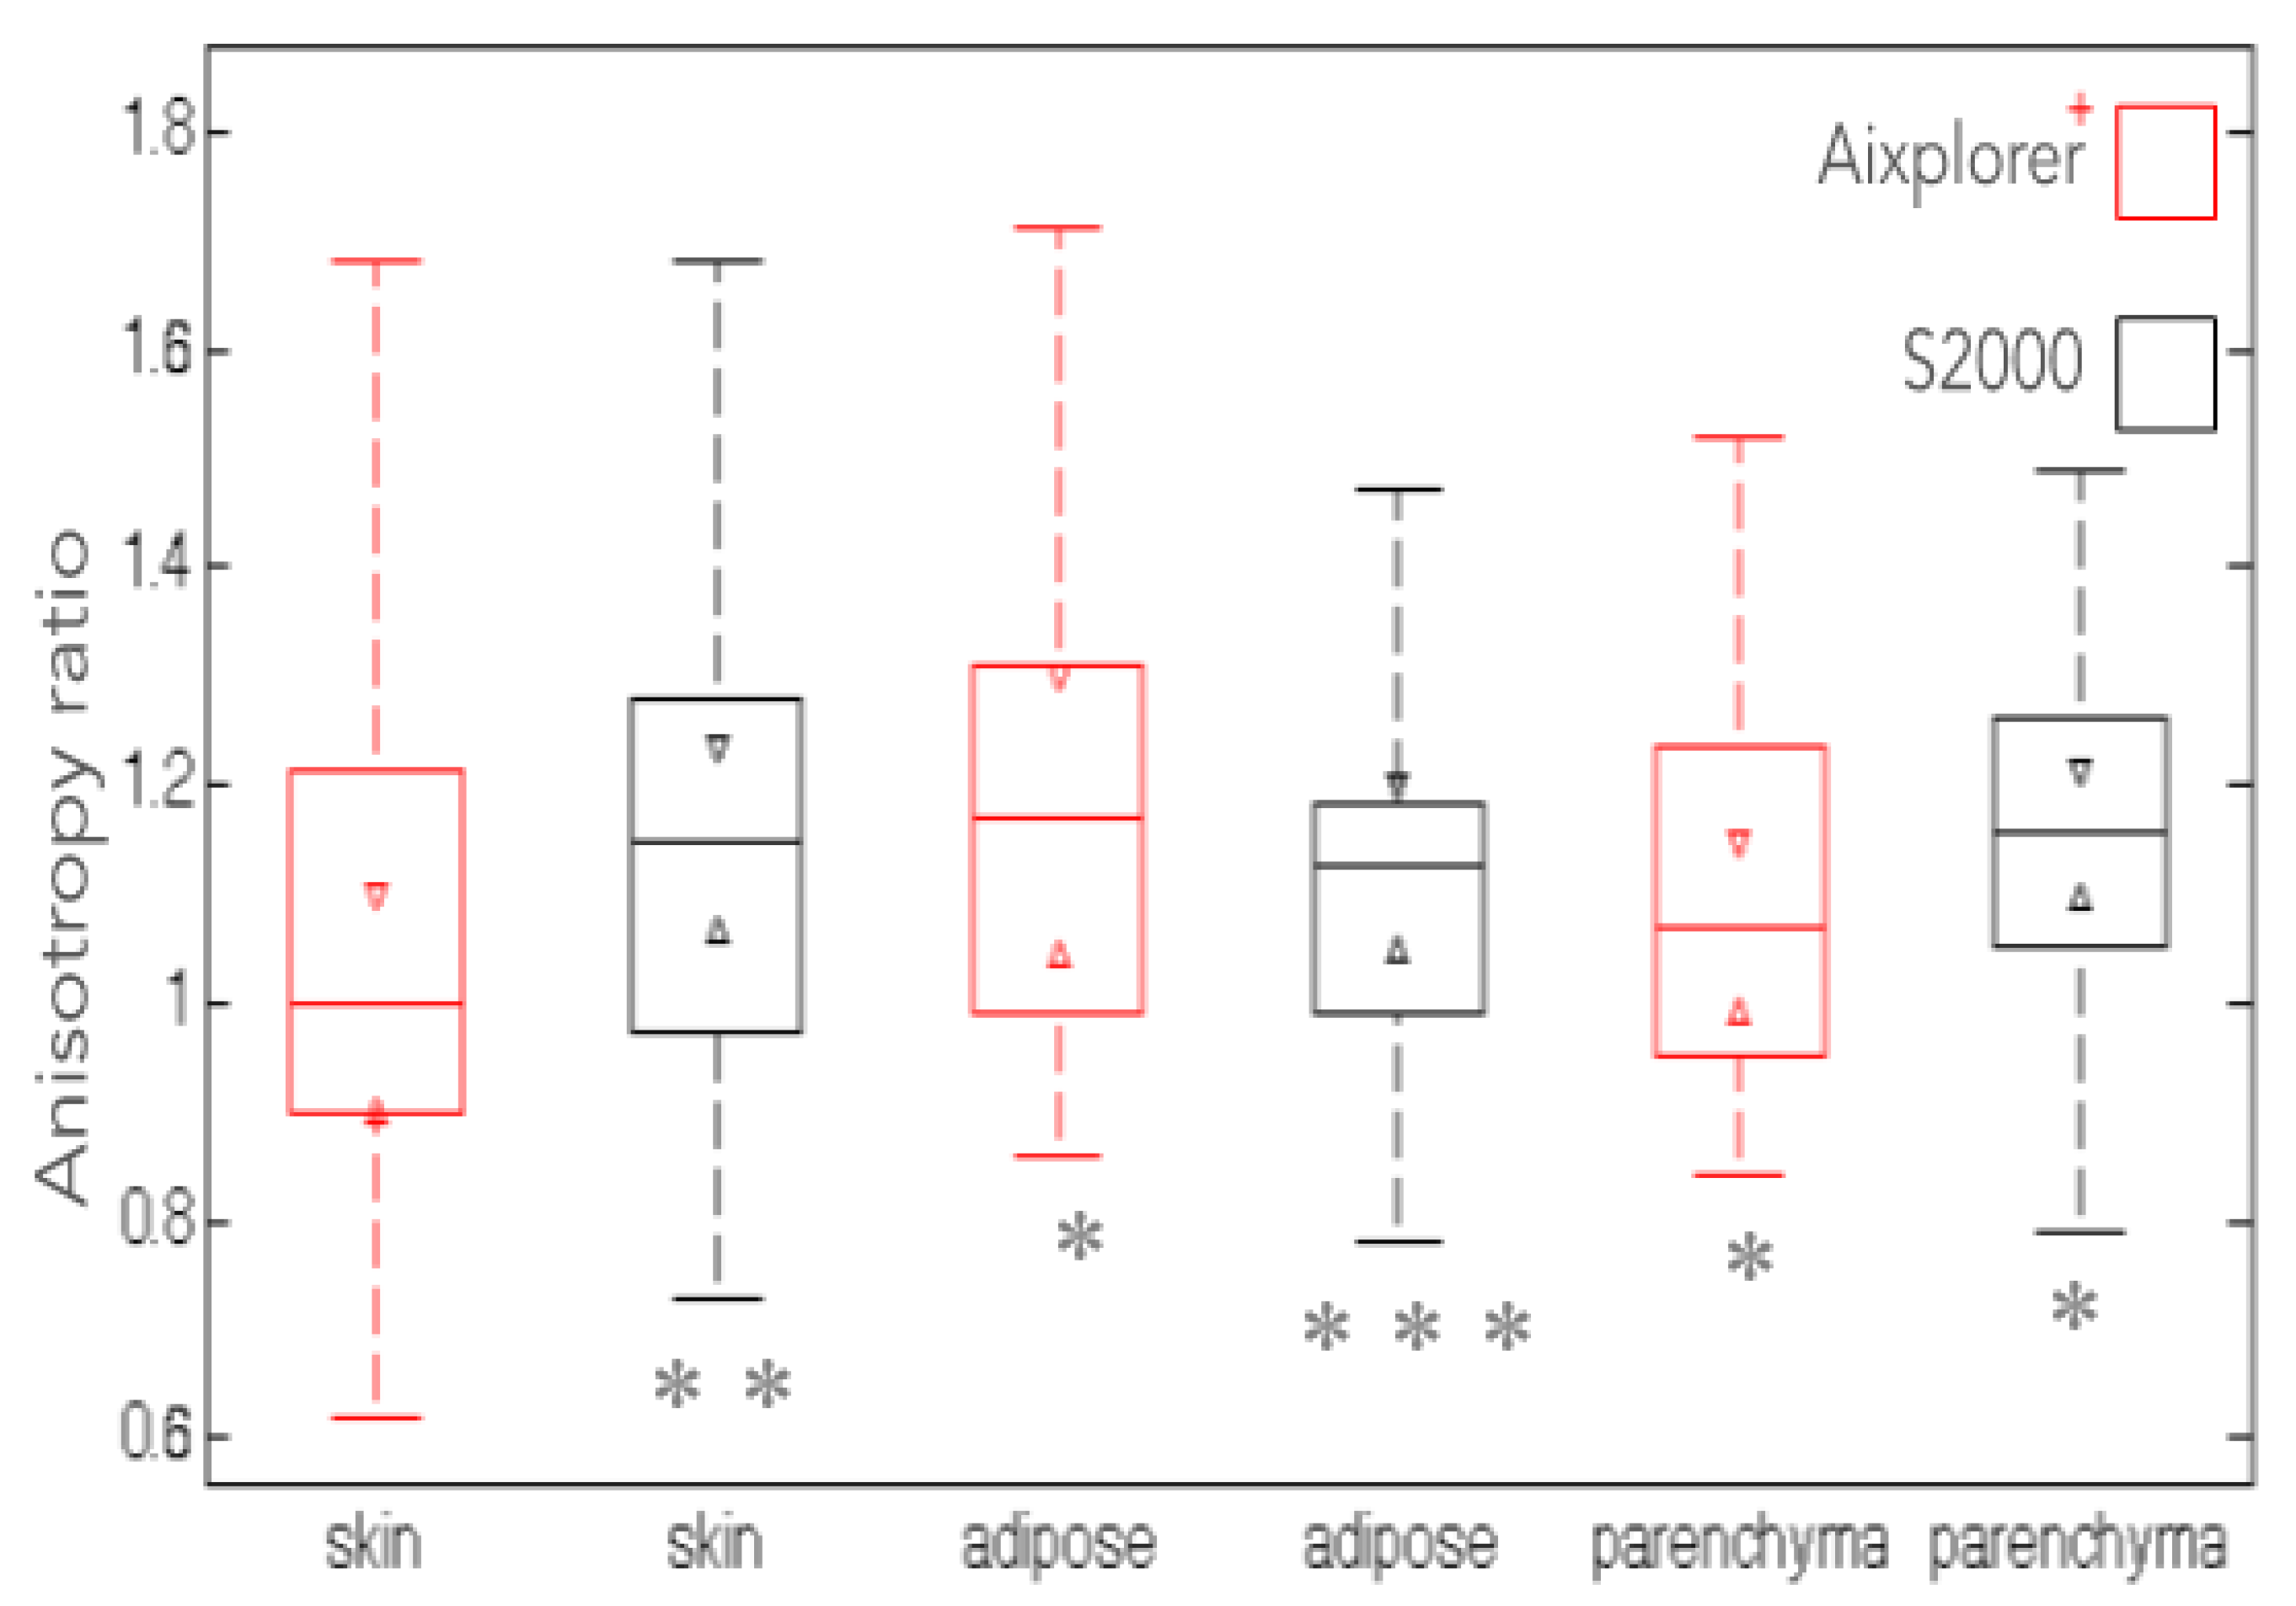
3.4. Comparison of Anisotropy Ratios between Machines
4. Discussion
4.1. Difference in cs Estimates between Machines In Vitro
4.2. Rationale for the Exclusion of Artefacts from Aixplorer Elastogram Analysis
4.3. Difference in cs Estimates between Machines In Vivo
4.4. Comparison of Tissue cs Ratios and Anisotropy Ratios between Machines
4.5. Limitations of This Study
5. Conclusions
Author Contributions
Funding
Institutional Review Board Statement
Informed Consent Statement
Data Availability Statement
Acknowledgments
Conflicts of Interest
References
- Haviland, J.S.; Owen, J.R.; Dewar, J.A.; Agrawal, R.K.; Barrett, J.; Barrett-Lee, P.J.; Dobbs, H.J.; Hopwood, P.; Lawton, P.A.; Magee, B.J.; et al. The uk standardisation of breast radiotherapy (start) trials of radiotherapy hypofractionation for treatment of early breast cancer: 10-year follow-up results of two randomised controlled trials. Lancet Oncol. 2013, 14, 1086–1094. [Google Scholar] [CrossRef]
- Al-Ghazal, S.K.; Fallowfield, L.; Blamey, R.W. Does cosmetic outcome from treatment of primary breast cancer influence psychosocial morbidity? Eur. J. Surg. Oncol. 1999, 25, 571–573. [Google Scholar] [CrossRef]
- Hoeller, U.; Tribius, S.; Kuhlmey, A.; Grader, K.; Fehlauer, F.; Alberti, W. Increasing the rate of late toxicity by changing the score? A comparison of rtog/eortc and lent/soma scores. Int. J. Radiat. Oncol. Biol. Phys. 2003, 55, 1013–1018. [Google Scholar] [CrossRef]
- Taira, N.; Shimozuma, K.; Shiroiwa, T.; Ohsumi, S.; Kuroi, K.; Saji, S.; Saito, M.; Iha, S.; Watanabe, T.; Katsumata, N. Associations among baseline variables, treatment-related factors and health-related quality of life 2 years after breast cancer surgery. Breast Cancer Res. Treat. 2011, 128, 735–747. [Google Scholar] [CrossRef] [Green Version]
- Mukesh, M.B.; Harris, E.; Collette, S.; Coles, C.E.; Bartelink, H.; Wilkinson, J.; Evans, P.M.; Graham, P.; Haviland, J.; Poortmans, P.; et al. Normal tissue complication probability (ntcp) parameters for breast fibrosis: Pooled results from two randomised trials. Radiother. Oncol. 2013, 108, 293–298. [Google Scholar] [CrossRef] [Green Version]
- Andreassen, C.N.; Rosenstein, B.S.; Kerns, S.L.; Ostrer, H.; De Ruysscher, D.; Cesaretti, J.A.; Barnett, G.C.; Dunning, A.M.; Dorling, L.; West, C.M.L.; et al. Individual patient data meta-analysis shows a significant association between the atm rs1801516 snp and toxicity after radiotherapy in 5456 breast and prostate cancer patients. Radiother. Oncol. 2016, 121, 431–439. [Google Scholar] [CrossRef] [Green Version]
- Barr, R.G.; Nakashima, K.; Amy, D.; Cosgrove, D.; Farrokh, A.; Schafer, F.; Bamber, J.C.; Castera, L.; Choi, B.I.; Chou, Y.H.; et al. Wfumb guidelines and recommendations for clinical use of ultrasound elastography: Part 2: Breast. Ultrasound Med. Biol. 2015, 41, 1148–1160. [Google Scholar] [CrossRef] [PubMed] [Green Version]
- Evans, A.; Whelehan, P.; Thomson, K.; McLean, D.; Brauer, K.; Purdie, C.; Jordan, L.; Baker, L.; Thompson, A. Quantitative shear wave ultrasound elastography: Initial experience in solid breast masses. Breast Cancer Res. 2010, 12, R104. [Google Scholar] [CrossRef] [PubMed] [Green Version]
- Shiina, T.; Nightingale, K.R.; Palmeri, M.L.; Hall, T.J.; Bamber, J.C.; Barr, R.G.; Castera, L.; Choi, B.I.; Chou, Y.H.; Cosgrove, D.; et al. Wfumb guidelines and recommendations for clinical use of ultrasound elastography: Part 1: Basic principles and terminology. Ultrasound Med. Biol. 2015, 41, 1126–1147. [Google Scholar] [CrossRef] [PubMed] [Green Version]
- Rus, G.; Faris, I.H.; Torres, J.; Callejas, A.; Melchor, J. Why Are Viscosity and Nonlinearity Bound to Make an Impact in Clinical Elastographic Diagnosis? Sensors 2020, 20, 2379. [Google Scholar] [CrossRef]
- Baues, M.; Dasgupta, A.; Ehling, J.; Prakash, J.; Boor, P.; Tacke, F.; Kiessling, F.; Lammers, T. Fibrosis imaging: Current concepts and future directions. Adv. Drug Deliv. Rev. 2017, 121, 9–26. [Google Scholar] [CrossRef] [PubMed]
- Ajmera, V.; Loomba, R. Imaging biomarkers of NAFLD, NASH, and fibrosis. Mol. Metab. 2021, 50, 101167. [Google Scholar] [CrossRef] [PubMed]
- Bamber, J.; Cosgrove, D.; Dietrich, C.F.; Fromageau, J.; Bojunga, J.; Calliada, F.; Cantisani, V.; Correas, J.M.; D’Onofrio, M.; Drakonaki, E.E.; et al. Efsumb guidelines and recommendations on the clinical use of ultrasound elastography. Part 1: Basic principles and technology. Ultraschall Med. 2013, 34, 169–184. [Google Scholar] [CrossRef] [PubMed] [Green Version]
- Hall, T.J.; Milkowski, A.; Garra, B.; Carson, P.; Palmeri, M.; Nightingale, K.; Lynch, T.; Alturki, A.; Andre, M.; Audiere, S.; et al. Rsna/qiba: Shear wave speed as a biomarker for liver fibrosis staging. IEEE Int. Ultrason Symp. IUS 2013, 397–400. [Google Scholar]
- Shin, H.J.; Kim, M.J.; Kim, H.Y.; Roh, Y.H.; Lee, M.J. Comparison of shear wave velocities on ultrasound elastography between different machines, transducers, and acquisition depths: A phantom study. Eur. Radiol. 2016, 26, 3361–3367. [Google Scholar] [CrossRef] [PubMed]
- Zhao, H.; Song, P.; Urban, M.W.; Kinnick, R.R.; Yin, M.; Greenleaf, J.F.; Chen, S. Bias observed in time-of-flight shear wave speed measurements using radiation force of a focused ultrasound beam. Ultrasound Med. Biol. 2011, 37, 1884–1892. [Google Scholar] [CrossRef] [PubMed] [Green Version]
- Chang, S.; Kim, M.J.; Kim, J.; Lee, M.J. Variability of shear wave velocity using different frequencies in acoustic radiation force impulse (arfi) elastography: A phantom and normal liver study. Ultraschall Med. 2013, 34, 260–265. [Google Scholar] [CrossRef]
- Dillman, J.R.; Chen, S.; Davenport, M.S.; Zhao, H.; Urban, M.W.; Song, P.; Watcharotone, K.; Carson, P.L. Superficial ultrasound shear wave speed measurements in soft and hard elasticity phantoms: Repeatability and reproducibility using two ultrasound systems. Pediatr. Radiol. 2015, 45, 376–385. [Google Scholar] [CrossRef] [Green Version]
- Mulabecirovic, A.; Mjelle, A.B.; Gilja, O.H.; Vesterhus, M.; Havre, R.F. Repeatability of shear wave elastography in liver fibrosis phantoms-evaluation of five different systems. PLoS ONE 2018, 13, e0189671. [Google Scholar] [CrossRef] [Green Version]
- Ferraioli, G.; De Silvestri, A.; Lissandrin, R.; Maiocchi, L.; Tinelli, C.; Filice, C.; Barr, R.G. Evaluation of inter-system variability in liver stiffness measurements. Ultraschall Med. 2019, 40, 64–75. [Google Scholar] [CrossRef] [Green Version]
- Woo, H.; Lee, J.Y.; Yoon, J.H.; Kim, W.; Cho, B.; Choi, B.I. Comparison of the reliability of acoustic radiation force impulse imaging and supersonic shear imaging in measurement of liver stiffness. Radiology 2015, 277, 881–886. [Google Scholar] [CrossRef]
- Huang, Y.P.; Zheng, Y.P.; Leung, S.F.; Choi, A.P. High frequency ultrasound assessment of skin fibrosis: Clinical results. Ultrasound Med. Biol. 2007, 33, 1191–1198. [Google Scholar] [CrossRef] [Green Version]
- Liu, T.; Zhou, J.; Osterman, K.S.; Zhang, P.; Woodhouse, S.A.; Schiff, P.B.; Kutcher, G.J. Measurements of radiation-induced skin changes in breast-cancer radiation therapy using ultrasonic imaging. Annu. Int. Conf. IEEE Eng. Med. Biol. Soc. 2008, 2, 718–722. [Google Scholar]
- Barnett, G.C.; Wilkinson, J.S.; Moody, A.M.; Wilson, C.B.; Twyman, N.; Wishart, G.C.; Burnet, N.G.; Coles, C.E. The cambridge breast intensity-modulated radiotherapy trial: Patient- and treatment-related factors that influence late toxicity. Clin. Oncol. 2011, 23, 662–673. [Google Scholar] [CrossRef] [PubMed]
- Brierley, J.D.; Paterson, I.C.; Lallemand, R.C.; Rostom, A.Y. The influence of breast size on late radiation reaction following excision and radiotherapy for early breast cancer. Clin. Oncol. 1991, 3, 6–9. [Google Scholar] [CrossRef]
- Golatta, M.; Schweitzer-Martin, M.; Harcos, A.; Schott, S.; Junkermann, H.; Rauch, G.; Sohn, C.; Heil, J. Normal breast tissue stiffness measured by a new ultrasound technique: Virtual touch tissue imaging quantification (vtiq). Eur. J. Radiol. 2013, 82, e676–e679. [Google Scholar] [CrossRef]
- Wojcinski, S.; Brandhorst, K.; Sadigh, G.; Hillemanns, P.; Degenhardt, F. Acoustic radiation force impulse imaging with virtual touch tissue quantification: Mean shear wave velocity of malignant and benign breast masses. Int. J. Womens Health 2013, 5, 619–627. [Google Scholar] [CrossRef] [Green Version]
- Zhou, J.; Yang, Z.; Zhan, W.; Dong, Y.; Zhou, C. Anisotropic properties of breast tissue measured by acoustic radiation force impulse quantification. Ultrasound Med. Biol. 2016, 42, 2372–2382. [Google Scholar] [CrossRef]
- Friedrich-Rust, M.; Romenski, O.; Meyer, G.; Dauth, N.; Holzer, K.; Grünwald, F.; Kriener, S.; Herrmann, E.; Zeuzem, S.; Bojunga, J. Acoustic Radiation Force Impulse-Imaging for the evaluation of the thyroid gland: A limited patient feasibility study. Ultrasonics 2012, 52, 69–74. [Google Scholar] [CrossRef]
- Tanter, M.; Bercoff, J.; Athanasiou, A.; Deffieux, T.; Gennisson, J.L.; Montaldo, G.; Muller, M.; Tardivon, A.; Fink, M. Quantitative assessment of breast lesion viscoelasticity: Initial clinical results using supersonic shear imaging. Ultrasound Med. Biol. 2008, 34, 1373–1386. [Google Scholar] [CrossRef] [PubMed]
- Barr, R.G.; Zhang, Z. Effects of precompression on elasticity imaging of the breast: Development of a clinically useful semiquantitative method of precompression assessment. J. Ultrasound Med. 2012, 31, 895–902. [Google Scholar] [CrossRef]
- Cole, T.J.; Altman, D.G. Statistics notes: What is a percentage difference? BMJ 2017, 358, j3663. [Google Scholar] [CrossRef] [Green Version]
- Athanasiou, A.; Tardivon, A.; Tanter, M.; Sigal-Zafrani, B.; Bercoff, J.; Deffieux, T.; Gennisson, J.L.; Fink, M.; Neuenschwander, S. Breast lesions: Quantitative elastography with supersonic shear imaging--preliminary results. Radiology 2010, 256, 297–303. [Google Scholar] [CrossRef]
- Berg, W.A.; Cosgrove, D.O.; Dore, C.J.; Schafer, F.K.; Svensson, W.E.; Hooley, R.J.; Ohlinger, R.; Mendelson, E.B.; Balu-Maestro, C.; Locatelli, M.; et al. Shear-wave elastography improves the specificity of breast us: The be1 multinational study of 939 masses. Radiology 2012, 262, 435–449. [Google Scholar] [CrossRef]
- Fang, C.; Konstantatou, E.; Romanos, O.; Yusuf, G.T.; Quinlan, D.J.; Sidhu, P.S. Reproducibility of 2-dimensional shear wave elastography assessment of the liver: A direct comparison with point shear wave elastography in healthy volunteers. J. Ultrasound Med. 2017, 36, 1563–1569. [Google Scholar] [CrossRef] [Green Version]
- Mulazzani, L.; Salvatore, V.; Ravaioli, F.; Allegretti, G.; Matassoni, F.; Granata, R.; Ferrarini, A.; Stefanescu, H.; Piscaglia, F. Point shear wave ultrasound elastography with esaote compared to real-time 2d shear wave elastography with supersonic imagine for the quantification of liver stiffness. J. Ultrasound 2017, 20, 213–225. [Google Scholar] [CrossRef]
- Sigrist, R.M.S.; El Kaffas, A.; Jeffrey, R.B.; Rosenberg, J.; Willmann, J.K. Intra-individual comparison between 2-d shear wave elastography (ge system) and virtual touch tissue quantification (siemens system) in grading liver fibrosis. Ultrasound Med. Biol. 2017, 43, 2774–2782. [Google Scholar] [CrossRef] [PubMed]
- Dietrich, C.F.; Bamber, J.; Berzigotti, A.; Bota, S.; Cantisani, V.; Castera, L.; Cosgrove, D.; Ferraioli, G.; Friedrich-Rust, M.; Gilja, O.H.; et al. Efsumb guidelines and recommendations on the clinical use of liver ultrasound elastography, update 2017 (long version). Ultraschall Med. 2017, 38, e16–e47. [Google Scholar] [PubMed] [Green Version]
- Kruse, S.A.; Smith, J.A.; Lawrence, A.J.; Dresner, M.A.; Manduca, A.; Greenleaf, J.F.; Ehman, R.L. Tissue characterization using magnetic resonance elastography: Preliminary results. Phys. Med. Biol. 2000, 45, 1579–1590. [Google Scholar] [CrossRef] [PubMed]
- Gennisson, J.L.; Deffieux, T.; Mace, E.; Montaldo, G.; Fink, M.; Tanter, M. Viscoelastic and anisotropic mechanical properties of in vivo muscle tissue assessed by supersonic shear imaging. Ultrasound Med. Biol. 2010, 36, 789–801. [Google Scholar] [CrossRef] [PubMed]
- Coutts, L.V.; Bamber, J.; Miller, N.R.; Mortimer, P.S. Ultrasound elastography of the skin and subcutis under surface extensive loading. Ultrasound 2006, 14, 161–166. [Google Scholar] [CrossRef]
- Coutts, L.V.; Miller, N.R.; Mortimer, P.S.; Bamber, J.C. Investigation of in vivo skin stiffness anisotropy in breast cancer related lymphoedema. J. Biomech 2016, 49, 94–99. [Google Scholar] [CrossRef] [PubMed] [Green Version]
- Bush, N.L.; Bamber, J.C.; Barbone, P.; Yarnold, J.R. Semi-Quantitative Freehand Elastography for Assessing Radiation-Induced Breast Fibrosis. In Proceedings of the British Medical Ultrasound Society 37th Annual Scientific Meeting, Manchester, UK, 13–15 December 2005; Volume 13, p. 261. [Google Scholar]
- Nguyen, T.M.; Couade, M.; Bercoff, J.; Tanter, M. Assessment of viscous and elastic properties of sub-wavelength layered soft tissues using shear wave spectroscopy: Theoretical framework and in vitro experimental validation. IEEE Trans Ultrason Ferroelectr. Freq. Control. 2011, 58, 2305–2315. [Google Scholar] [CrossRef]
- Lee, S.Y.; Cardones, A.R.; Doherty, J.; Nightingale, K.; Palmeri, M. Preliminary results on the feasibility of using arfi/swei to assess cutaneous sclerotic diseases. Ultrasound Med. Biol. 2015, 41, 2806–2819. [Google Scholar] [CrossRef] [PubMed] [Green Version]
- Wang, L.; Yan, F.; Yang, Y.; Xiang, X.; Qiu, L. Quantitative assessment of skin stiffness in localized scleroderma using ultrasound shear-wave elastography. Ultrasound Med. Biol. 2017, 43, 1339–1347. [Google Scholar] [CrossRef]
- Yang, Y.; Qiu, L.; Wang, L.; Xiang, X.; Tang, Y.; Li, H.; Yan, F. Quantitative assessment of skin stiffness using ultrasound shear wave elastography in systemic sclerosis. Ultrasound Med. Biol. 2019, 45, 902–912. [Google Scholar] [CrossRef]
- Touboul, D.; Gennisson, J.L.; Nguyen, T.M.; Robinet, A.; Roberts, C.J.; Tanter, M.; Grenier, N. Supersonic shear wave elastography for the in vivo evaluation of transepithelial corneal collagen cross-linking. Investig. Ophthalmol. Vis. Sci. 2014, 55, 1976–1984. [Google Scholar] [CrossRef] [PubMed] [Green Version]


| Background | Inclusion 1 | Inclusion 2 | Inclusion 3 | Inclusion 4 | Mean (SD) | |
|---|---|---|---|---|---|---|
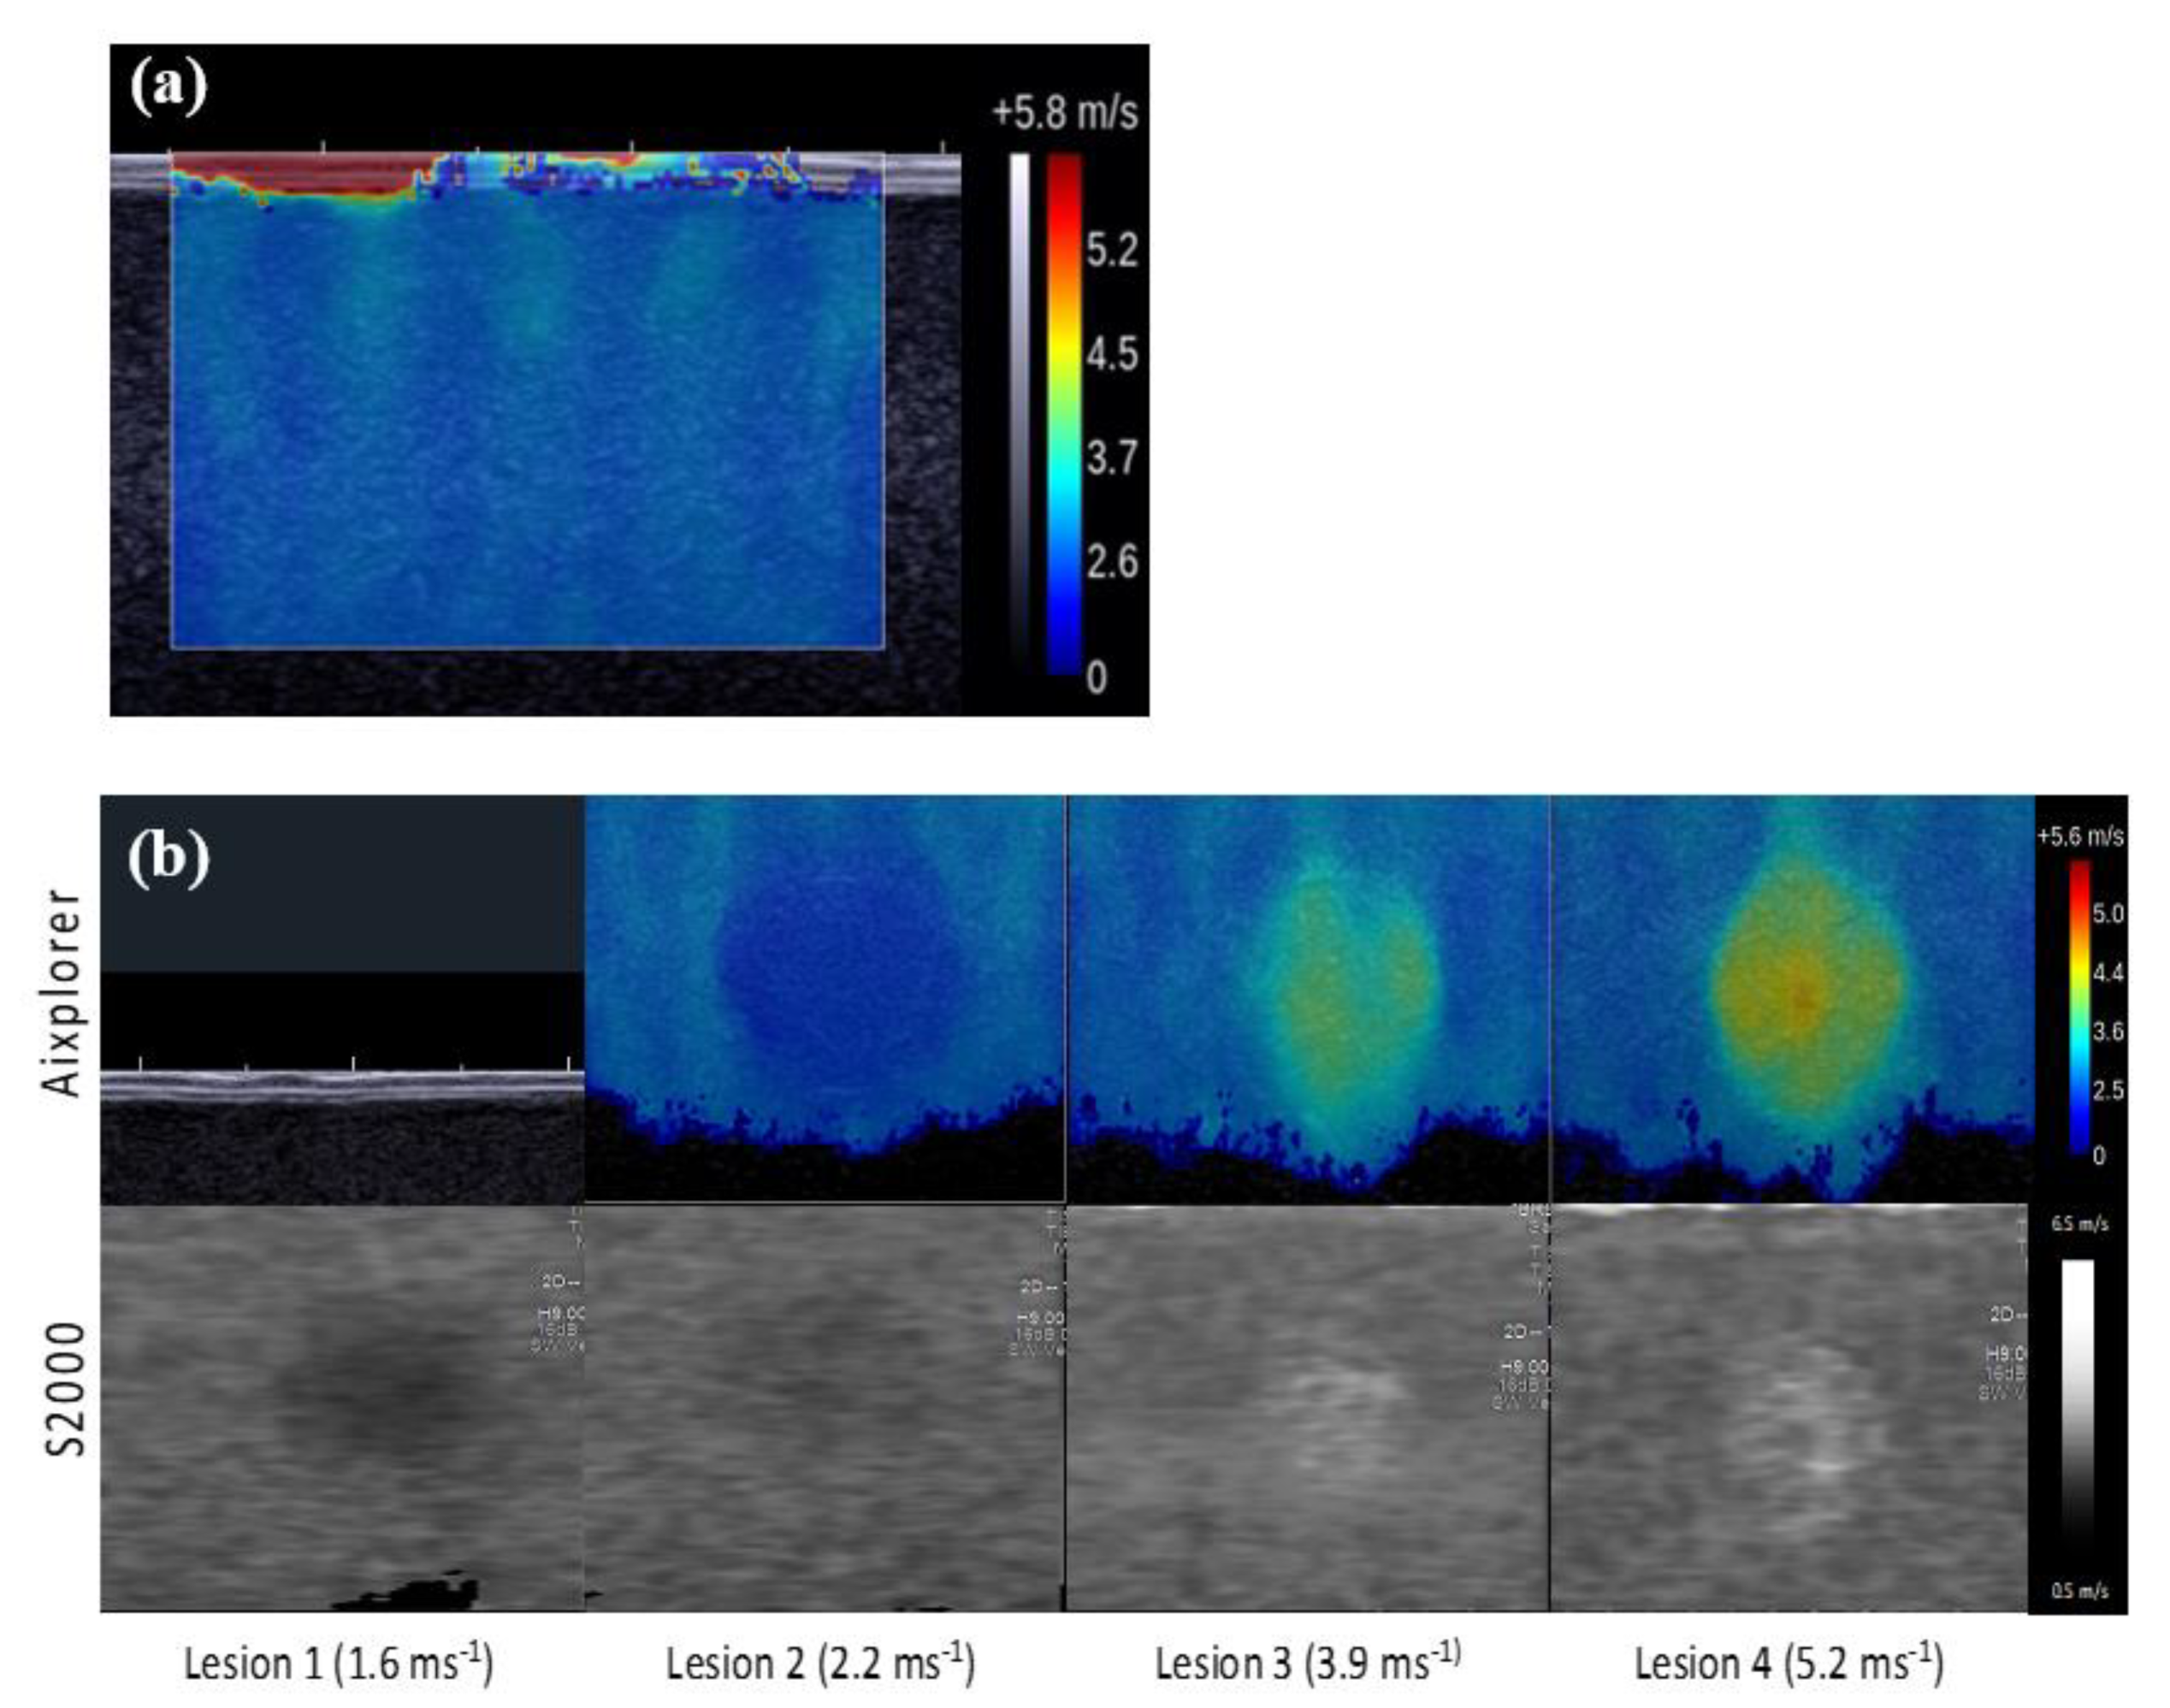
| Nominal cs | 2.90 | 1.60 | 2.20 | 3.90 | 5.20 | |
| Aixplorer: cs estimates (ms−1) | ||||||
| Observer 1 | 2.50 | 2.00 | 2.60 | 3.80 | 4.10 | |
| Observer 2 | 2.60 | 1.90 | 2.50 | 3.70 | 4.30 | |
| Observer 3 | 2.50 | 1.80 | 2.50 | 3.60 | 4.10 | |
| Mean | 2.53 | 1.90 | 2.53 | 3.70 | 4.17 | |
| CV | 0.02 | 0.05 | 0.02 | 0.03 | 0.03 | |
| S2000: cs estimates (ms−1) | ||||||
| Observer 1 | 2.55 | 1.78 | 2.50 | 3.51 | 4.17 | |
| Observer 2 | 2.47 | 1.89 | 2.40 | 3.40 | 4.11 | |
| Observer 3 | 2.55 | 1.90 | 2.49 | 3.53 | 4.11 | |
| Mean | 2.50 | 1.90 | 2.50 | 3.50 | 4.10 | |
| CV | 0.02 | 0.04 | 0.02 | 0.02 | 0.01 | |
| Symmetric percentage differences in cs estimates (%) | ||||||
| Observer 1 | −0.99 | 5.82 | 1.96 | 3.97 | −0.85 | 1.98 (2.98) |
| Observer 2 | 2.56 | 0.26 | 2.04 | 4.23 | 2.26 | 2.27 (1.41) |
| Observer 3 | −0.99 | −2.70 | 0.20 | 0.98 | −0.12 | −0.53 (1.41) |
| Mean | 0.20 | 1.15 | 1.40 | 3.06 | 0.44 | 1.25 (1.12) |
| Mean cs Estimate Per Elastogram (ms−1) | |||||||||
|---|---|---|---|---|---|---|---|---|---|
| Aixplorer | Aixplorer (with Artefacts) | S2000 | |||||||
| S | A | P | S | A | P | S | A | P | |
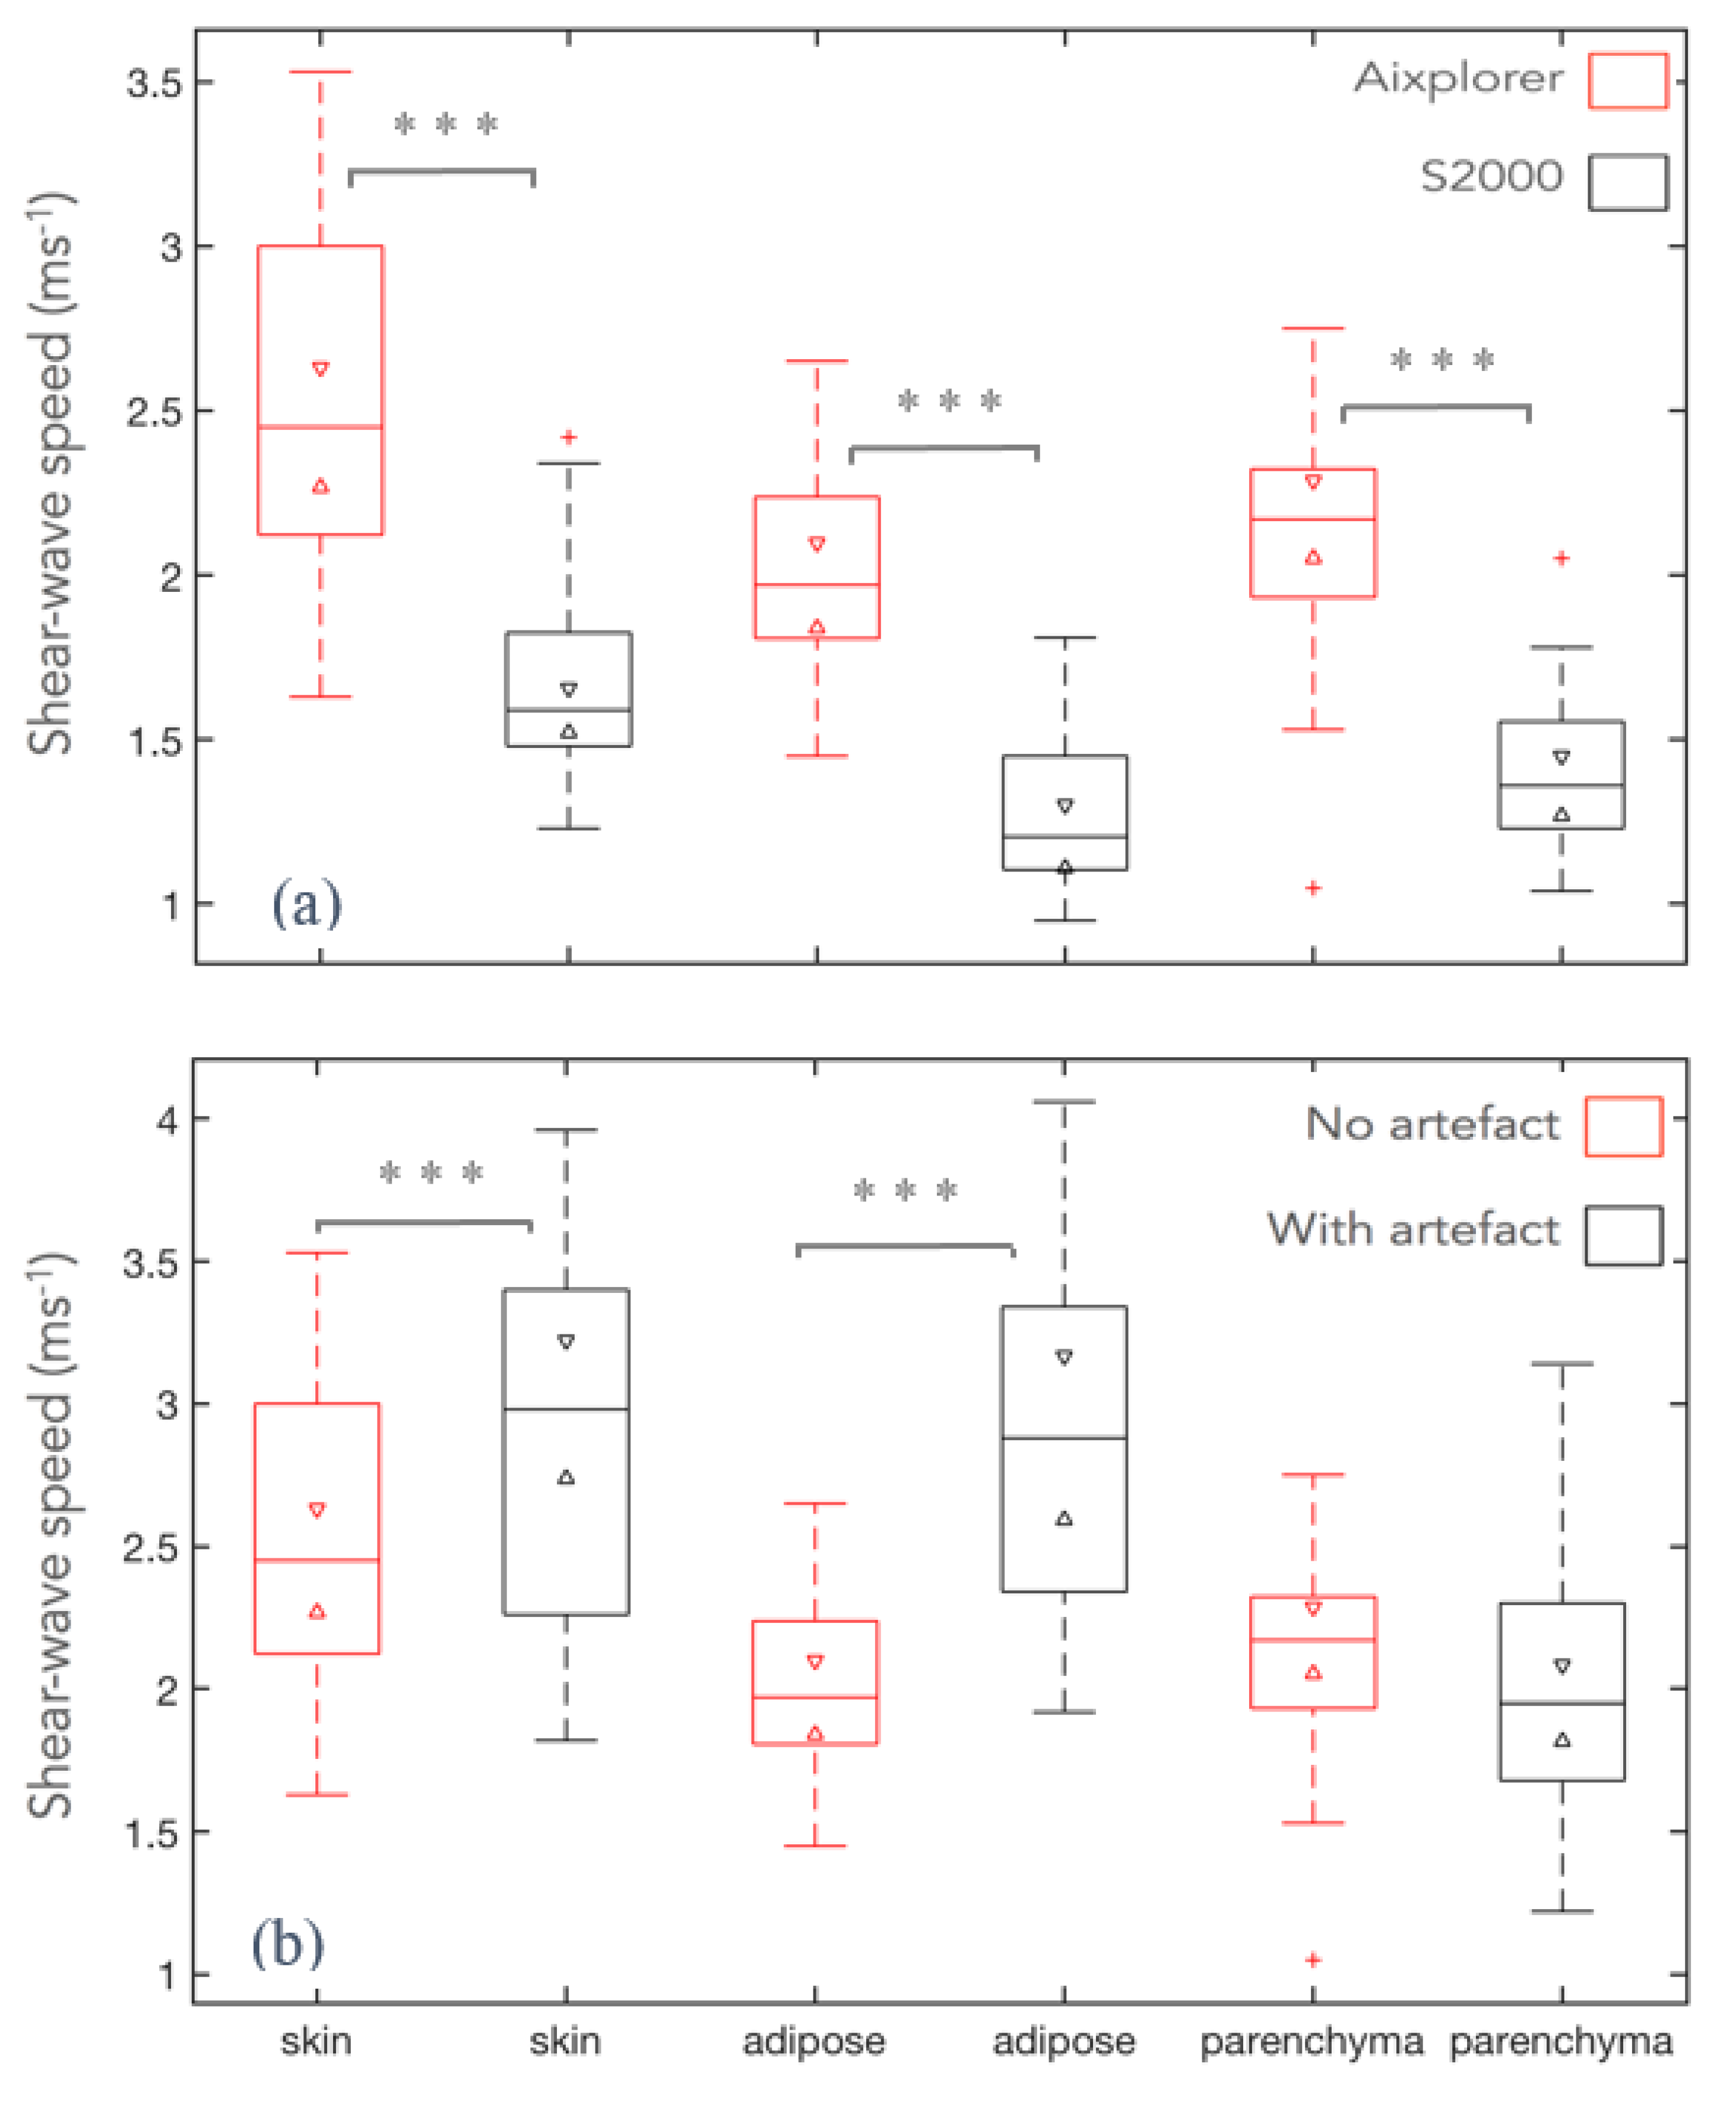
| Median | 2.4 | 2.0 | 2.2 | 3.0 | 2.9 | 3.0 | 1.6 | 1.2 | 1.3 |
| IQR | 0.9 | 0.4 | 0.6 | 0.9 | 0.4 | 0.6 | 0.3 | 0.3 | 0.3 |
| Max | 3.5 | 2.7 | 2.8 | 4.0 | 4.1 | 3.2 | 2.4 | 1.8 | 2.1 |
| Min | 1.6 | 1.5 | 1.2 | 1.8 | 1.9 | 1.2 | 1.2 | 1.0 | 1.0 |
Publisher’s Note: MDPI stays neutral with regard to jurisdictional claims in published maps and institutional affiliations. |
© 2021 by the authors. Licensee MDPI, Basel, Switzerland. This article is an open access article distributed under the terms and conditions of the Creative Commons Attribution (CC BY) license (https://creativecommons.org/licenses/by/4.0/).
Share and Cite
Harris, E.; Sinnatamby, R.; O’Flynn, E.; Kirby, A.M.; Bamber, J.C. A Cross-Machine Comparison of Shear-Wave Speed Measurements Using 2D Shear-Wave Elastography in the Normal Female Breast. Appl. Sci. 2021, 11, 9391. https://0-doi-org.brum.beds.ac.uk/10.3390/app11209391
Harris E, Sinnatamby R, O’Flynn E, Kirby AM, Bamber JC. A Cross-Machine Comparison of Shear-Wave Speed Measurements Using 2D Shear-Wave Elastography in the Normal Female Breast. Applied Sciences. 2021; 11(20):9391. https://0-doi-org.brum.beds.ac.uk/10.3390/app11209391
Chicago/Turabian StyleHarris, Emma, Ruchi Sinnatamby, Elizabeth O’Flynn, Anna M. Kirby, and Jeffrey C. Bamber. 2021. "A Cross-Machine Comparison of Shear-Wave Speed Measurements Using 2D Shear-Wave Elastography in the Normal Female Breast" Applied Sciences 11, no. 20: 9391. https://0-doi-org.brum.beds.ac.uk/10.3390/app11209391