
Simulation and Experimental Analysis of Pressure Pulsation Characteristics of Pump Source Fluid


1
School of Mechanical Engineering & Automation, Northeastern University, Shenyang 110819, China
2
Key Laboratory of Vibration and Control of Aero-Propulsion System Ministry of Education, Northeastern University, Shenyang 110819, China
*
Author to whom correspondence should be addressed.
Appl. Sci. 2021, 11(20), 9559; https://0-doi-org.brum.beds.ac.uk/10.3390/app11209559
Submission received: 16 September 2021
/
Revised: 11 October 2021
/
Accepted: 11 October 2021
/
Published: 14 October 2021
(This article belongs to the Special Issue Vibration Control and Applications)
Abstract
:The output flow pulsation characteristics of the hydraulic pump due to the structural characteristics may cause pump source fluid pressure pulsation and even cause the equipment to vibrate, which will affect the life and working reliability of the equipment. Scholars have done a lot of theoretical and simulation analysis on the characteristics of fluid flow and pressure pulsation caused by the specific structure and structure of the plunger pump, but there are few comparisons and analyses of the simplified model of the plunger pump and the pressure pulsation characteristics with experiments. In this paper, AMESim software is utilized to establish a simplified model of one seven-plunger hydraulic pump, and simulate and analyze the pump source fluid pressure pulsation characteristics of different system load pressures at a constant speed. An experimental platform for testing pump fluid pressure pulsation was designed and built, and the actual measurement and simulation results of pump fluid pressure pulsation were compared and analyzed. The results show that the system simulation data is in good agreement with the measured data, which verifies the correctness of the simplified model of the plunger pump. At the same time, it is found that the fluid pressure pulsation of the pump source exhibits broadband and multi-harmonic characteristics. At a constant speed, as the load pressure of the hydraulic system increases, the pump source fluid pressure pulsation amplitude increases, the pressure pulsation rate decreases, and the impact on the fundamental frequency amplitude is the most significant. The research results can provide a theoretical basis for suppressing the pressure pulsation of the pump source fluid and reducing the vibration response of a hydraulic pipeline under the action of the pulsating harmonic excitation.
1. Introduction
The periodic change of the working volume of the hydraulic pump makes its instantaneous flow pulsate [1]. The flow pulsation output by the pump source is converted into pressure pulsation via pipeline impedance, and the pressure pulsation acts on the pipe wall of the solid pipeline in the form of pulsating stress [2]. When the natural frequency and pressure pulsation frequency of the hydraulic pipeline are equal to or close to each other, resonance will occur, which will lead to loosening of the pipe clamp and vibration damage of the pipeline system, which will directly affect the safety of the hydraulic system. For this reason, studying the pressure pulsation characteristics of the pump source is of great significance to improve the working reliability of hydraulic systems.
Scholars at home and abroad have done a lot of research on vibration. Armentani E, et al. [3,4,5] studied the vibration of gasoline engines, turbocharged diesel engines, and noise, and analyzed the vibration behavior through the finite element method and AVL/EXCITE software to achieve design improvements to reduce noise and vibration. Giannella V, et al. [6] proposed a new optimization framework based on a multidisciplinary optimization (MDO) program, which is applied to the vibroacoustic finite element method (FEM) model of an aircraft fuselage model. Through ground experiment testing on aircraft components, it was found that the blade channel frequency is a key parameter for the acoustic and vibration generated by the rotating engine rotor. A large number of theoretical and simulation analyses have also been carried out for the modeling of the flow and pressure pulsation of the hydraulic pump. Casoli et al. [7] of Italy established a plunger pump calculation model that considers damping tank oil inertia and cavitation. The flow pulsation of a single plunger was calculated by calculation, and then the overall outlet flow pulsation of the plunger pump was calculated, and it was verified through experiments. Kojima E et al. [8] considered the fluid pulsation caused by the pumping mechanism and fluid compressibility and established a mathematical model of the flow pulsation of the plunger pump. Through experimental verification, it was obtained that the flow pulsation of the plunger pump was mainly due to the fluid compressibility caused by the higher load pressure, and the influence of the pumping mechanism on the flow pulsation is almost negligible. Liu M M et al. [9] established the theoretical mathematical model of the plunger pump, analyzed its mathematical model using MATLAB software, and obtained the change curve of plunger pressure and flow pulsation. The results showed that as the engine speed and throttle lever angle increase, the flow rate and pressure pulsation amplitude of the plunger pump increase. When the throttle lever angle continues to increase, the average fuel supply of the plunger pump decreases. Li Xiaoning et al. [10] mathematically modeled the instantaneous pressure change process of the plunger cavity and deduced the low-noise valve plate orifice and triangular groove calculation formula, but because the inertia factor was not considered in the modeling process, there is a certain error. Lu Juxian [11] carried out modeling and simulation for the flow pulsation of a plunger pump of an aircraft, and the results showed that high-precision pump source pulsation was obtained by calculating the oil passage area of the plunger pump. Guo Weidong and Wang Zhanlin of Beijing University of Aeronautics and Astronautics [12] established a theoretical model of the actual flow of the plunger pump, which not only considered the compressibility and leakage of the oil in the plunger cavity, but also involved the problem of oil backflow through the triangular groove. The actual flow pulsation quality of the pumps with the odd and even plunger numbers of adjacent values calculated through the example simulation calculation is almost the same. Johnston [13] used the secondary source method to measure and analyze the flow pulsation generated by the plunger pump and verified it through numerical simulation and experimental measurement. Manring [14,15] established an ideal pump model that ignores oil compressibility and leakage and the actual pump model that considered compressibility and leakage. The pressure pulsation generated by the actual pump model was compared. In the pump model, the pulsation of the odd-numbered cylinder plunger pump was significantly smaller than that of the even-numbered type, but the difference in pulsation between the two in the actual pump model was not so obvious. Yan Zheng et al. [16] studied the pressure pulsation characteristics of the plunger pump through variable speed and variable displacement adjustment under the same load pressure condition, and the conclusions obtained were basically consistent with the simulation. On this basis, according to the test and simulation data, under the same load and different loads, the pressure pulsation characteristics of the pump under the combination of speed and displacement adjustment were compared and analyzed. The results showed that as the pump speed or displacement becomes larger, the pump pressure pulsation amplitude increases.
Advanced special software is used to analyze the pulsation characteristics of the hydraulic pump, which makes the modeling process simple and clear. It has the characteristics of fast and convenient parameter setting and can quickly obtain the dynamic characteristics of the fluid pressure of the hydraulic pump, so it is widely used. Deeken et al. [17,18] used DSHplus and ADAMS to build a model of the entire axial plunger pump and analyzed the influence of plunger movement and fluid properties on the flow pulsation of the plunger pump. Roccatello et al. [19] used AMESim and ADAMS to study the pulsation characteristics of the outlet flow field of the axial piston pump and the dynamic characteristics of the piston pump components. The co-simulation of the two software can be used to calculate the complex working conditions of the piston pump. Shuo-Xun LI et al. [20] used AMESIM to establish the overall model of the plunger pump based on the pressure pulsation and flow characteristics of the swash plate axial plunger pump. Through repeated debugging and system simulation, the engine speed, inclination angle, and pump outlet were obtained. Related parameters, such as the influence of volume and load, on the swash plate axial piston pump were also examined. Zhang Ran et al. [21] used the simulation software AMESim to establish the theoretical model of the plunger pump system, and obtained the flow pulsation coefficient and pressure pulsation coefficient of the plunger pump with different plunger numbers under different working conditions through simulation calculations. Yan Yuqing et al. [22] modeled and simulated the axial piston pump in the AMESim, and concluded that the structure of the piston pump and its leakage parameters have an important influence on the flow pulsation. Wang Yu et al. [23] established a plunger pump model through AMESim, simulated the outlet flow characteristics of the hydraulic oil under the rated load pressure of the plunger pump, obtained the fluid pressure pulsation function expression, and the influence of fluid pressure pulsation at the outlet of the aircraft engine pump on pipeline structure vibration was analyzed. Qian Wenxin et al. [24] established a simulation model based on the AMESim, and obtained flow pulsation curves under different plunger numbers, rotation speeds, and swash plate inclination angles. The research results showed that the flow pulsation of the axial piston pump decreases with the increase of the number of plungers, the increase of the speed, and the increase of the inclination of the swash plate. Duan Feijiao et al. [25,26] established a mathematical model of a constant pressure plunger pump, and performed AMESim dynamic simulation analysis, and analyzed the flow change, internal wear, and pressure flow of the plunger cavity when the accumulator was built in the pump. The changes provide a certain reference for the suppression of hydraulic pulsation. Yang Jun et al. [27] took the A11VO190 axial piston pump as the object and built its overall mathematical model. On this basis, they used AMESim to build the overall model of the pump pressure control and flow-pressure control system, and carried out dynamic simulation focusing on the impact of key parameters on pump pulsation and response. Chi Yurong [28] used AMESim to establish an overall model of the axial piston pump under constant conditions, considering leakage, flow distribution, and oil compressibility based on the theoretical model. The research results showed that with the increase of the swash plate inclination angle and the prime mover, the pump output flow increases, and the flow pulsation rate also increases, but the plunger diameter had almost no effect on the flow pulsation.
In summary, scholars have done a lot of theoretical and simulation analysis on the characteristics of fluid flow and pressure pulsation caused by the specific structure of the plunger pump, but there are few comparisons and analyses of the simplified model of the plunger pump and the pressure pulsation characteristics with experiments. This paper takes the commonly used seven-plunger pump as an example, uses AMESim software to establish a simplified model of the plunger pump system, and simulates and analyzes the pump source fluid pressure pulsation characteristics of different system load pressures at a constant speed. An experimental platform for testing the pressure pulsation of the pump fluid was designed and built, and the actual measurement and simulation results of the pressure pulsation of the pump fluid were analyzed and researched to verify the correctness of the simplified modeling method of the plunger pump and the pressure pulsation simulation analysis.
2. Theoretical Analysis of Fluid Pressure Pulsation of the Plunger Pump
2.1. Analysis of Plunger Kinematics
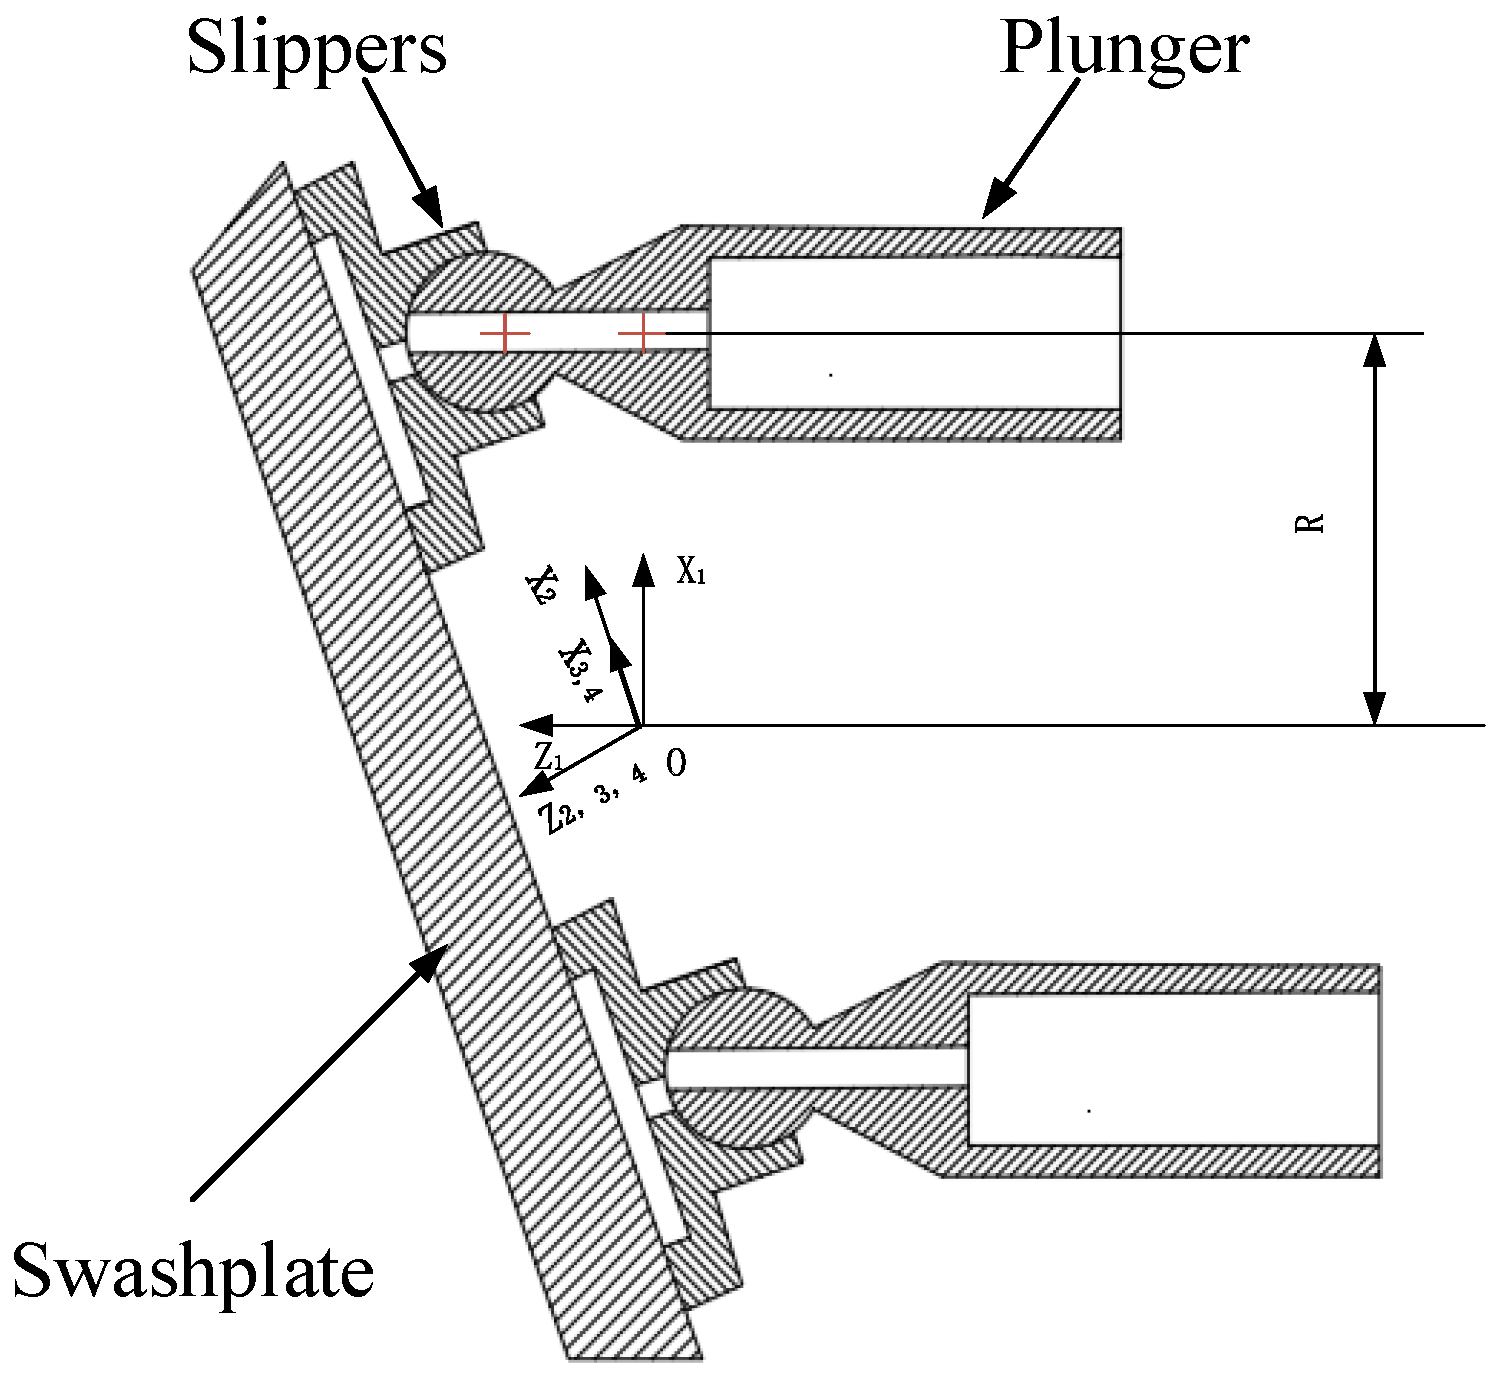
The relative position of the plunger swash plate is shown in Figure 1. The OX1Y1Z1 coordinate system is a fixed coordinate system located at the center of the plunger pump. At the intersection of the axis of the plunger pump shaft, the X1 axis is perpendicular to the axis of the shaft and points to the top dead center of the plunger movement, and the Z1 axis coincides with the axis of the plunger pump shaft. When the inclination angle of the swash plate rotates along the Y1 axis by angle , the OX1Y1Z1 coordinate system rotates along the Y1 axis by angle to obtain the OX2Y2Z2 coordinate system. Since the plunger rotates with the swash plate, the trajectory of the center of the ball head will change from a circle to an ellipse, that is, it will stretch in the X2 axis direction and remain unchanged in the Y2 axis direction. Therefore, the OX3Y3Z3 coordinate system is obtained by stretching the OX2Y2Z2 coordinate system along the X2 axis. The OX4Y4Z4 coordinate system rotates with the cylinder, which is obtained by rotating OX3Y3Z3 by an angle equal to the cylinder rotation angle. When the plunger pump is at the original position, that is, the swash plate inclination angle is zero and the pump is not rotating, the OX4Y4Z4 coordinate system completely coincides with the OX1Y1Z1 coordinate system.
From the basic theoretical knowledge of coordinate transformation, the transformation relationship can be obtained as follows:
By organizing Equations (1)–(3), the coordinate transformation matrix from coordinate system OX4Y4Z4 to coordinate system OX1Y1Z1 can be obtained as:
When analyzing the movement of the plunger in the OX4Y4Z4 coordinate system, the coordinates of the center of the plunger ball head are:
From Equations (4) and (5), the displacement of the center of the plunger ball head along the Z1 axis at any rotation angle can be obtained as:
A derivative of the above equations, the speed of the center of the plunger ball head in the direction of the Z1 axis is:
2.2. Analysis of Fluid Pressure Pulsation of the Plunger Pump
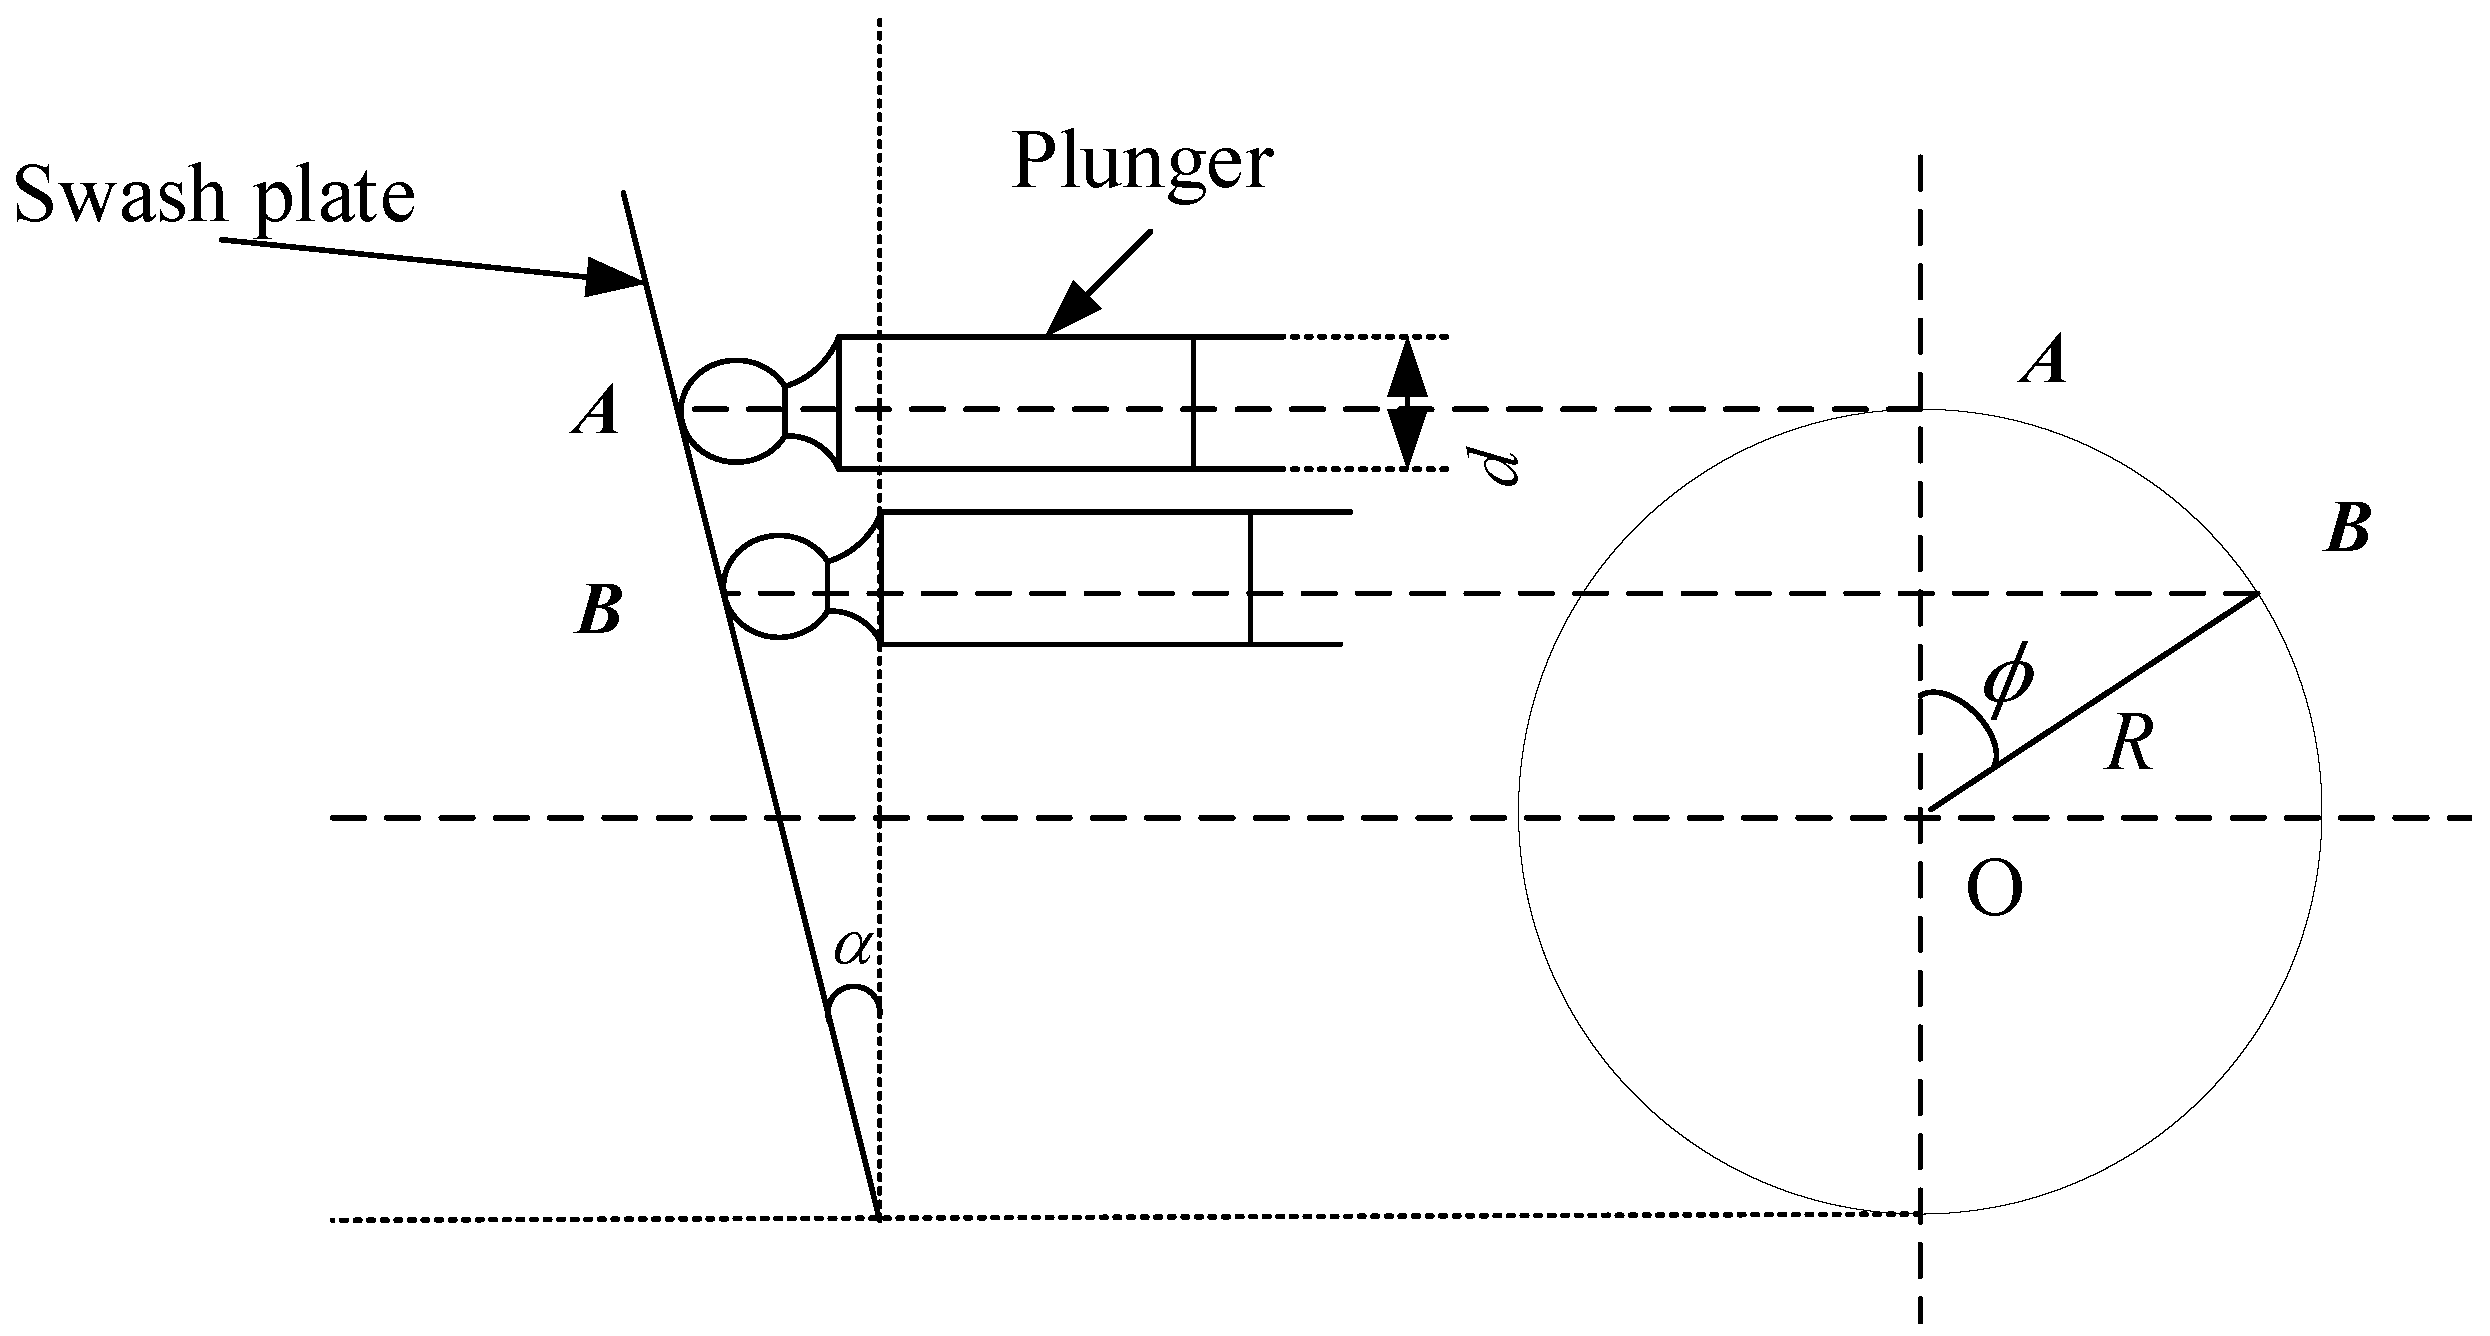
The fluid pressure pulsation at the outlet of the plunger pump is closely related to the movement of the single plunger structure. The rotating speed of the cylinder, the inclination angle of the swash plate, the diameter of the single plunger, and the radius of the distribution circle of the plunger hole will affect the fluid pressure pulsation characteristics of the plunger pump. The movement diagram of the single plunger structure is shown in Figure 2.
The theoretical instantaneous flow of the single-plunger structure from position A to position B is:
where:
is the angular velocity of cylinder rotation (rad/s);
is the volumetric efficiency of the plunger pump;
is the plunger diameter (mm);
is the diameter of the plunger axis distribution circle (mm);
is the inclination of the swash plate (°); and
is the cylinder angular displacement (rad).
The angle between each plunger is , where Z is the number of plungers. The total output flow of the plunger pump is the sum of the flow of each single plunger, and the total output flow of the plunger pump is:
When the single-plunger structure moves in the plunger hole of the cylinder, the volume of the enclosed plunger chamber changes with time, which causes the pressure of the fluid to fluctuate. According to the basic principles of fluid mechanics, as the flow rate of the closed cavity between the plunger and the cylinder changes, it will inevitably cause a change in pressure [26], and the instantaneous pressure can be obtained as:
where:
is the fluid modulus of elasticity (MPa); and
is the volume of the plunger cavity (m3).
From Equations (9) and (10), it can be taken:
where .
3. Establishment of an AMESim Simplified Model of the Plunger Pump
AMESim is used to build a simplified system model of the plunger pump in this paper, which considers the leakage plunger movement and flow distribution process. The modeling process includes establishing the single plunger models, the dynamic models, the load models, and the simplified system models, etc. It is mainly applied to the mechanical library, signal library, hydraulic library, and HCD library in the AMESim.
3.1. Establishment of the Single-Plunger Model
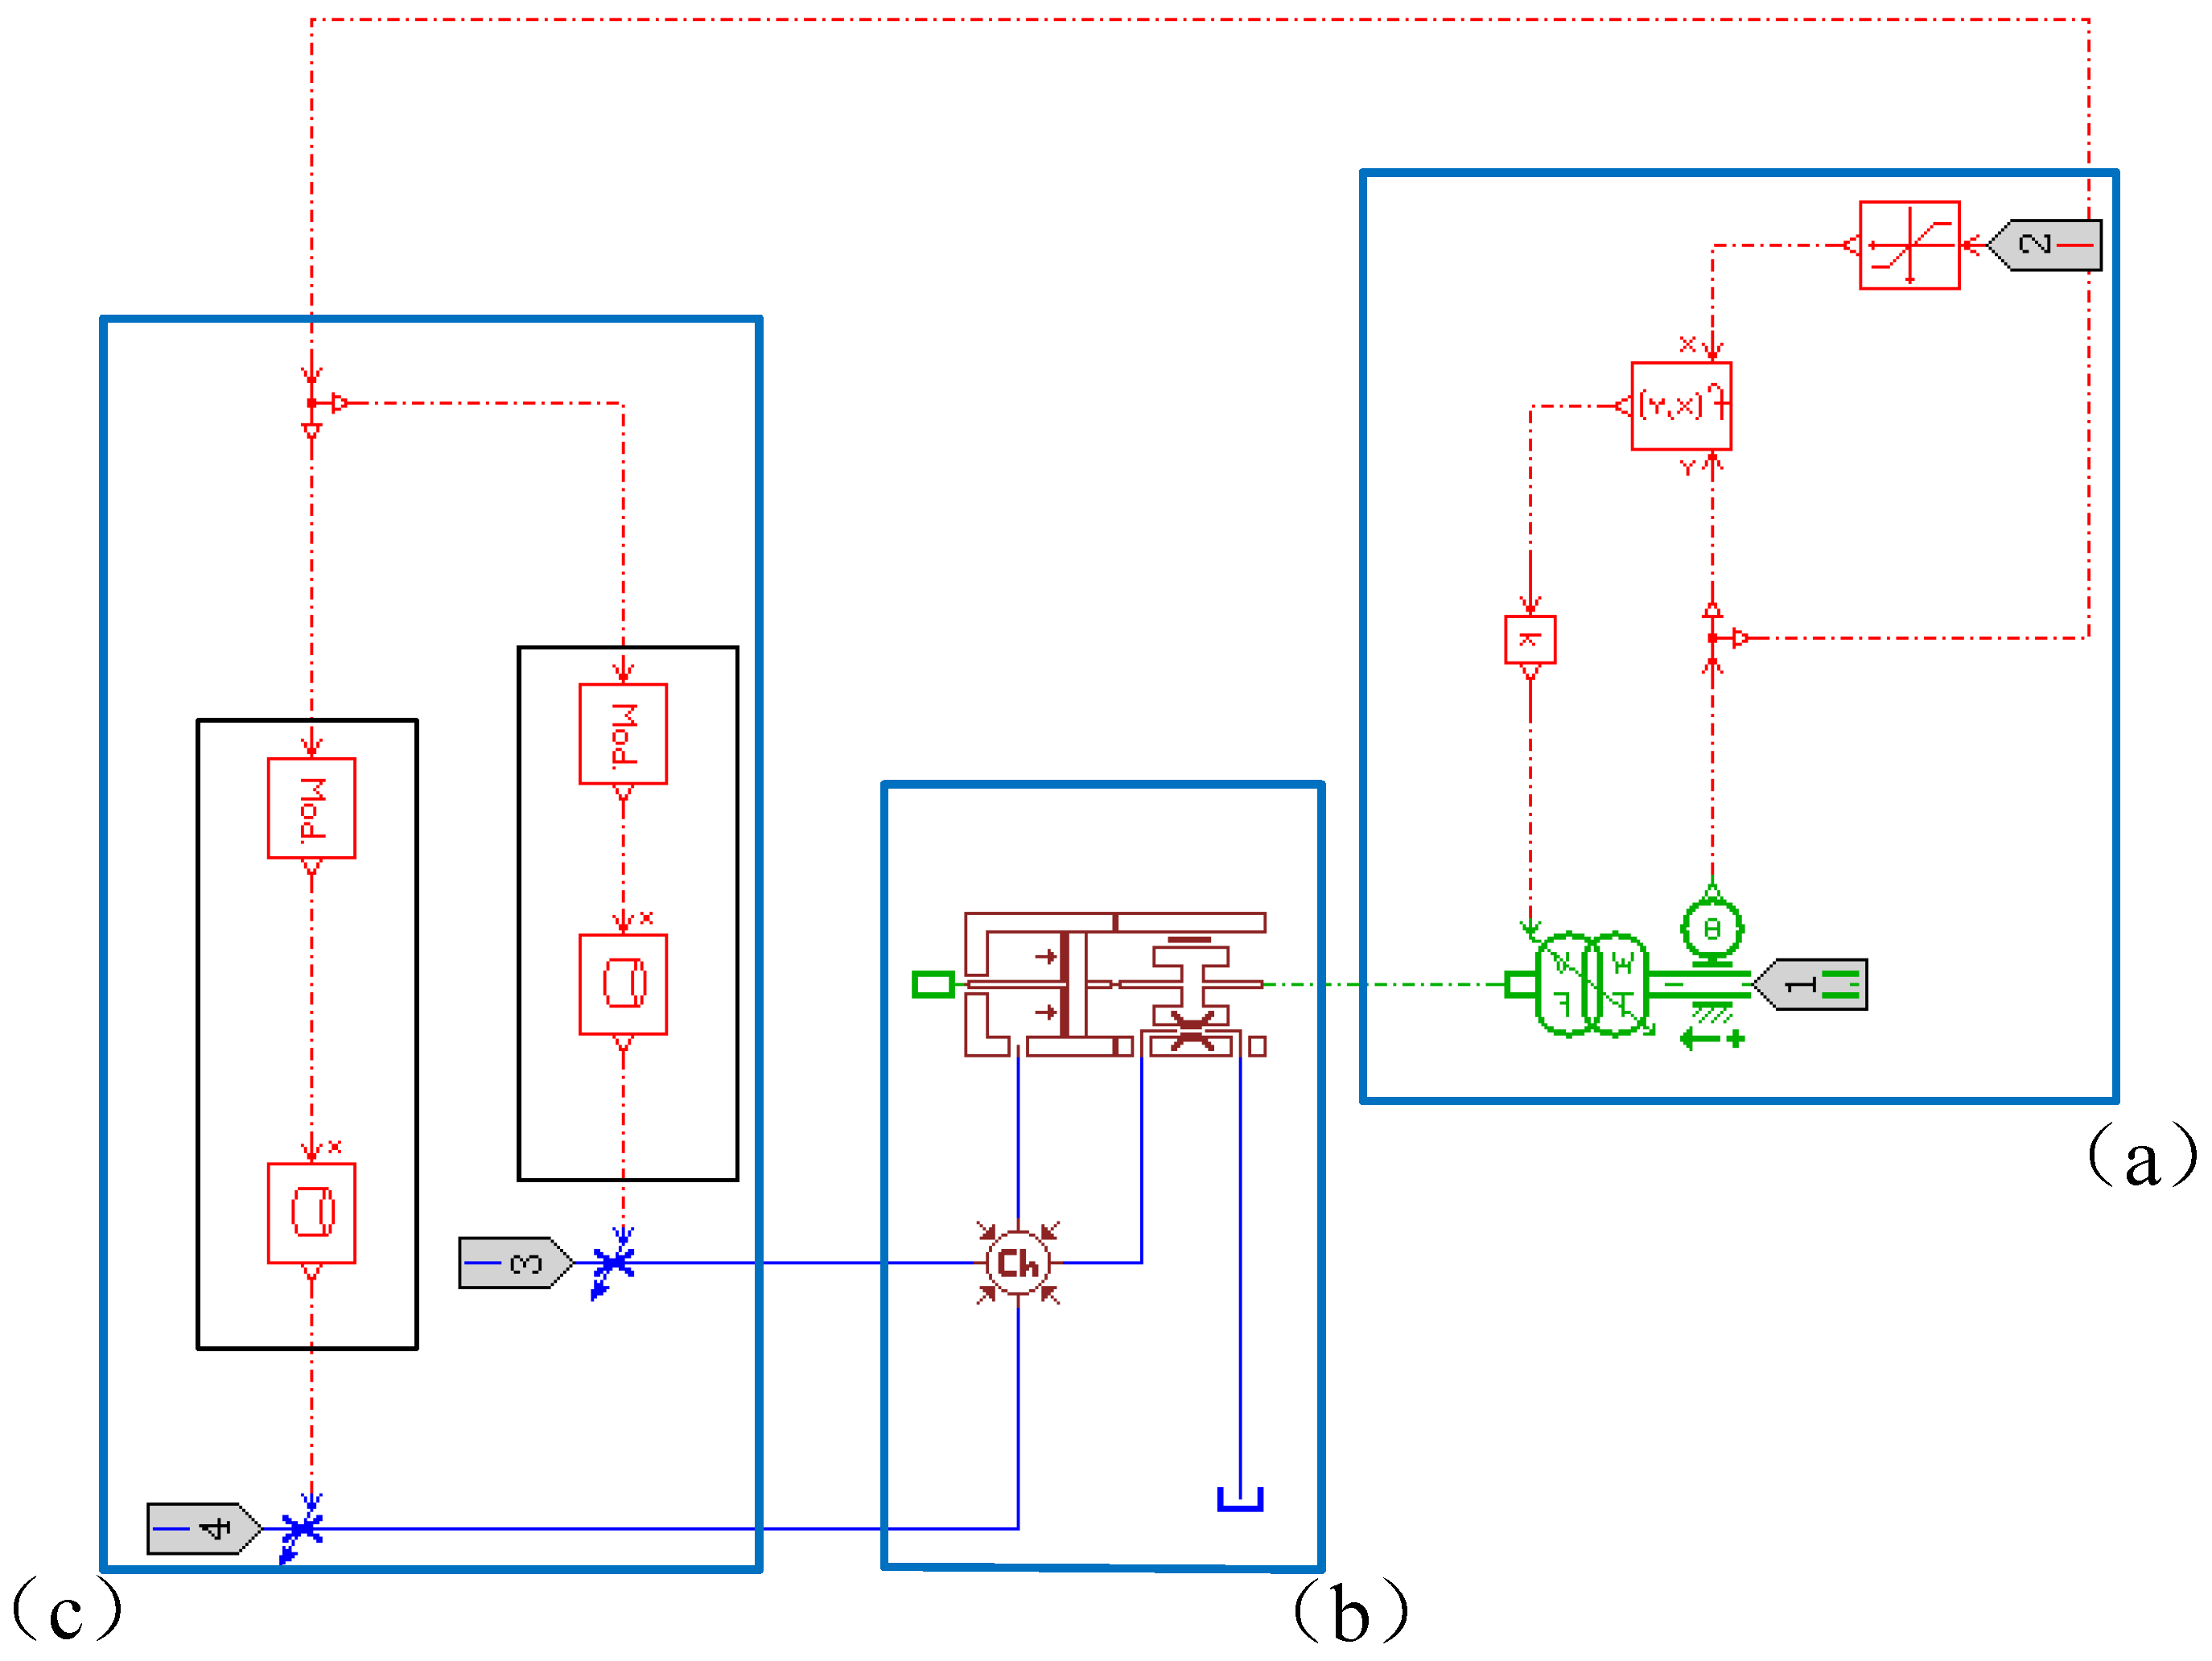
The establishment of the single-plunger model is shown in Figure 3. There are three main components in the single plunger model, which are (a) the movement law of the single plunger, (b) the plunger and (c) the flow distribution process. The functions of these three parts are:
- (1)
- Use mathematical expressions to simulate the movement law of the plunger and convert the rotary motion of the motor into the reciprocating linear motion of the plunger.
- (2)
- Simulate the movement of the plunger.
- (3)
- Simulate the actual flow distribution process.
The single-plunger model has four ports: port 1 is connected to the motor that provides torque, port 2 is connected to the swash plate that provides the inclination of the swash plate, port 3 is connected to the oil suction port, and port 4 is connected to the oil discharge port.
3.2. Establishment of Power and Load Model
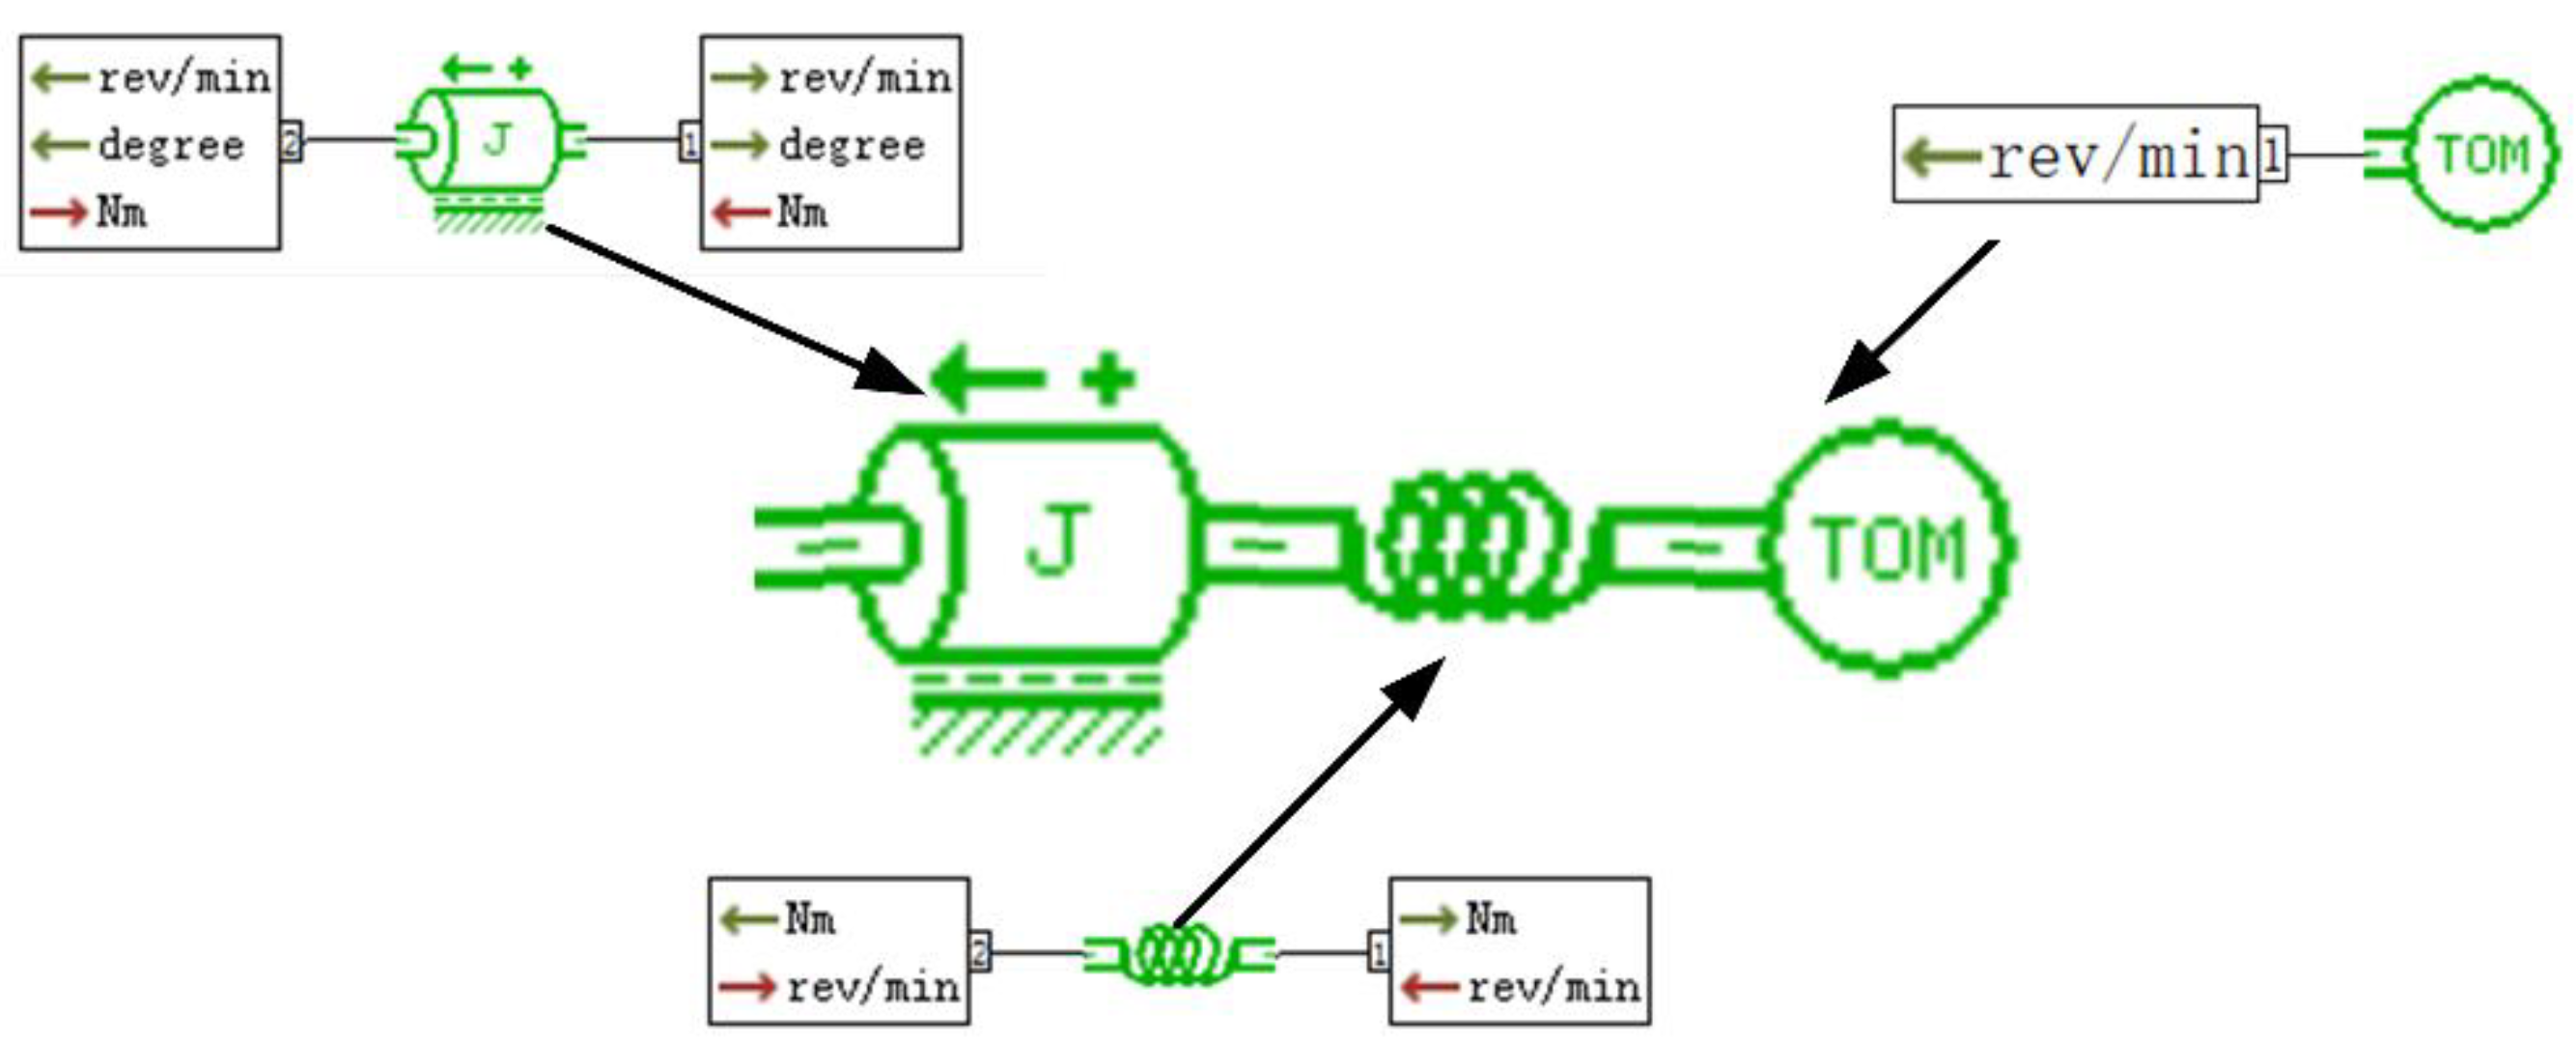
The dynamic model mainly includes the prime mover, dampers, and the moment of inertia of the cylinder. Regardless of the starting characteristics of the motor and other factors, the PM000 sub-model in the mechanical library is used to simulate the constant prime mover. After the prime mover, the damper element is connected, which is the spring shock absorber of the rotating shaft. The moment of inertia element of the cylinder block is connected behind the damper element to receive the torque provided by the prime mover element. The dynamic model is shown in Figure 4.
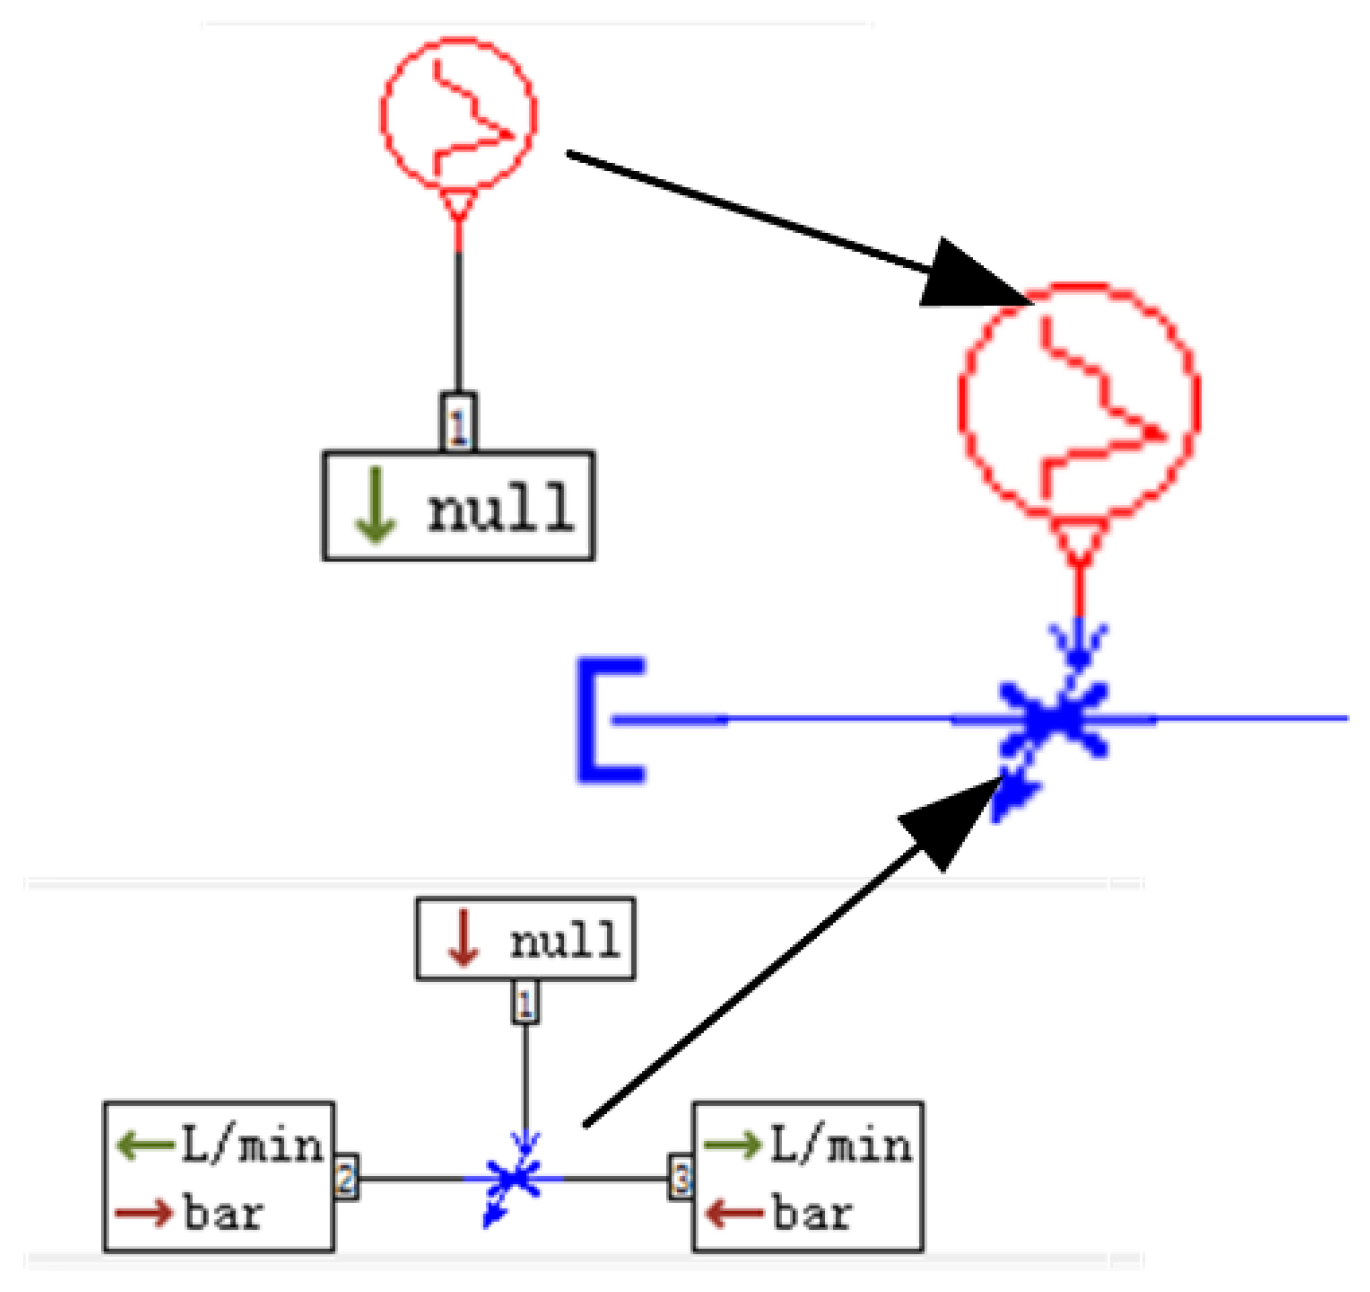
The load model uses the signal to control the opening size of the variable orifice to characterize the change in load demand. The load orifice is set to simulate the load pressure. The smaller the load orifice is set, the greater the simulated load pressure. The load model can reflect the pressure coupling of each plunger, as shown in Figure 5.
3.3. Establishment of the Simplified System Model of the Plunger Pump
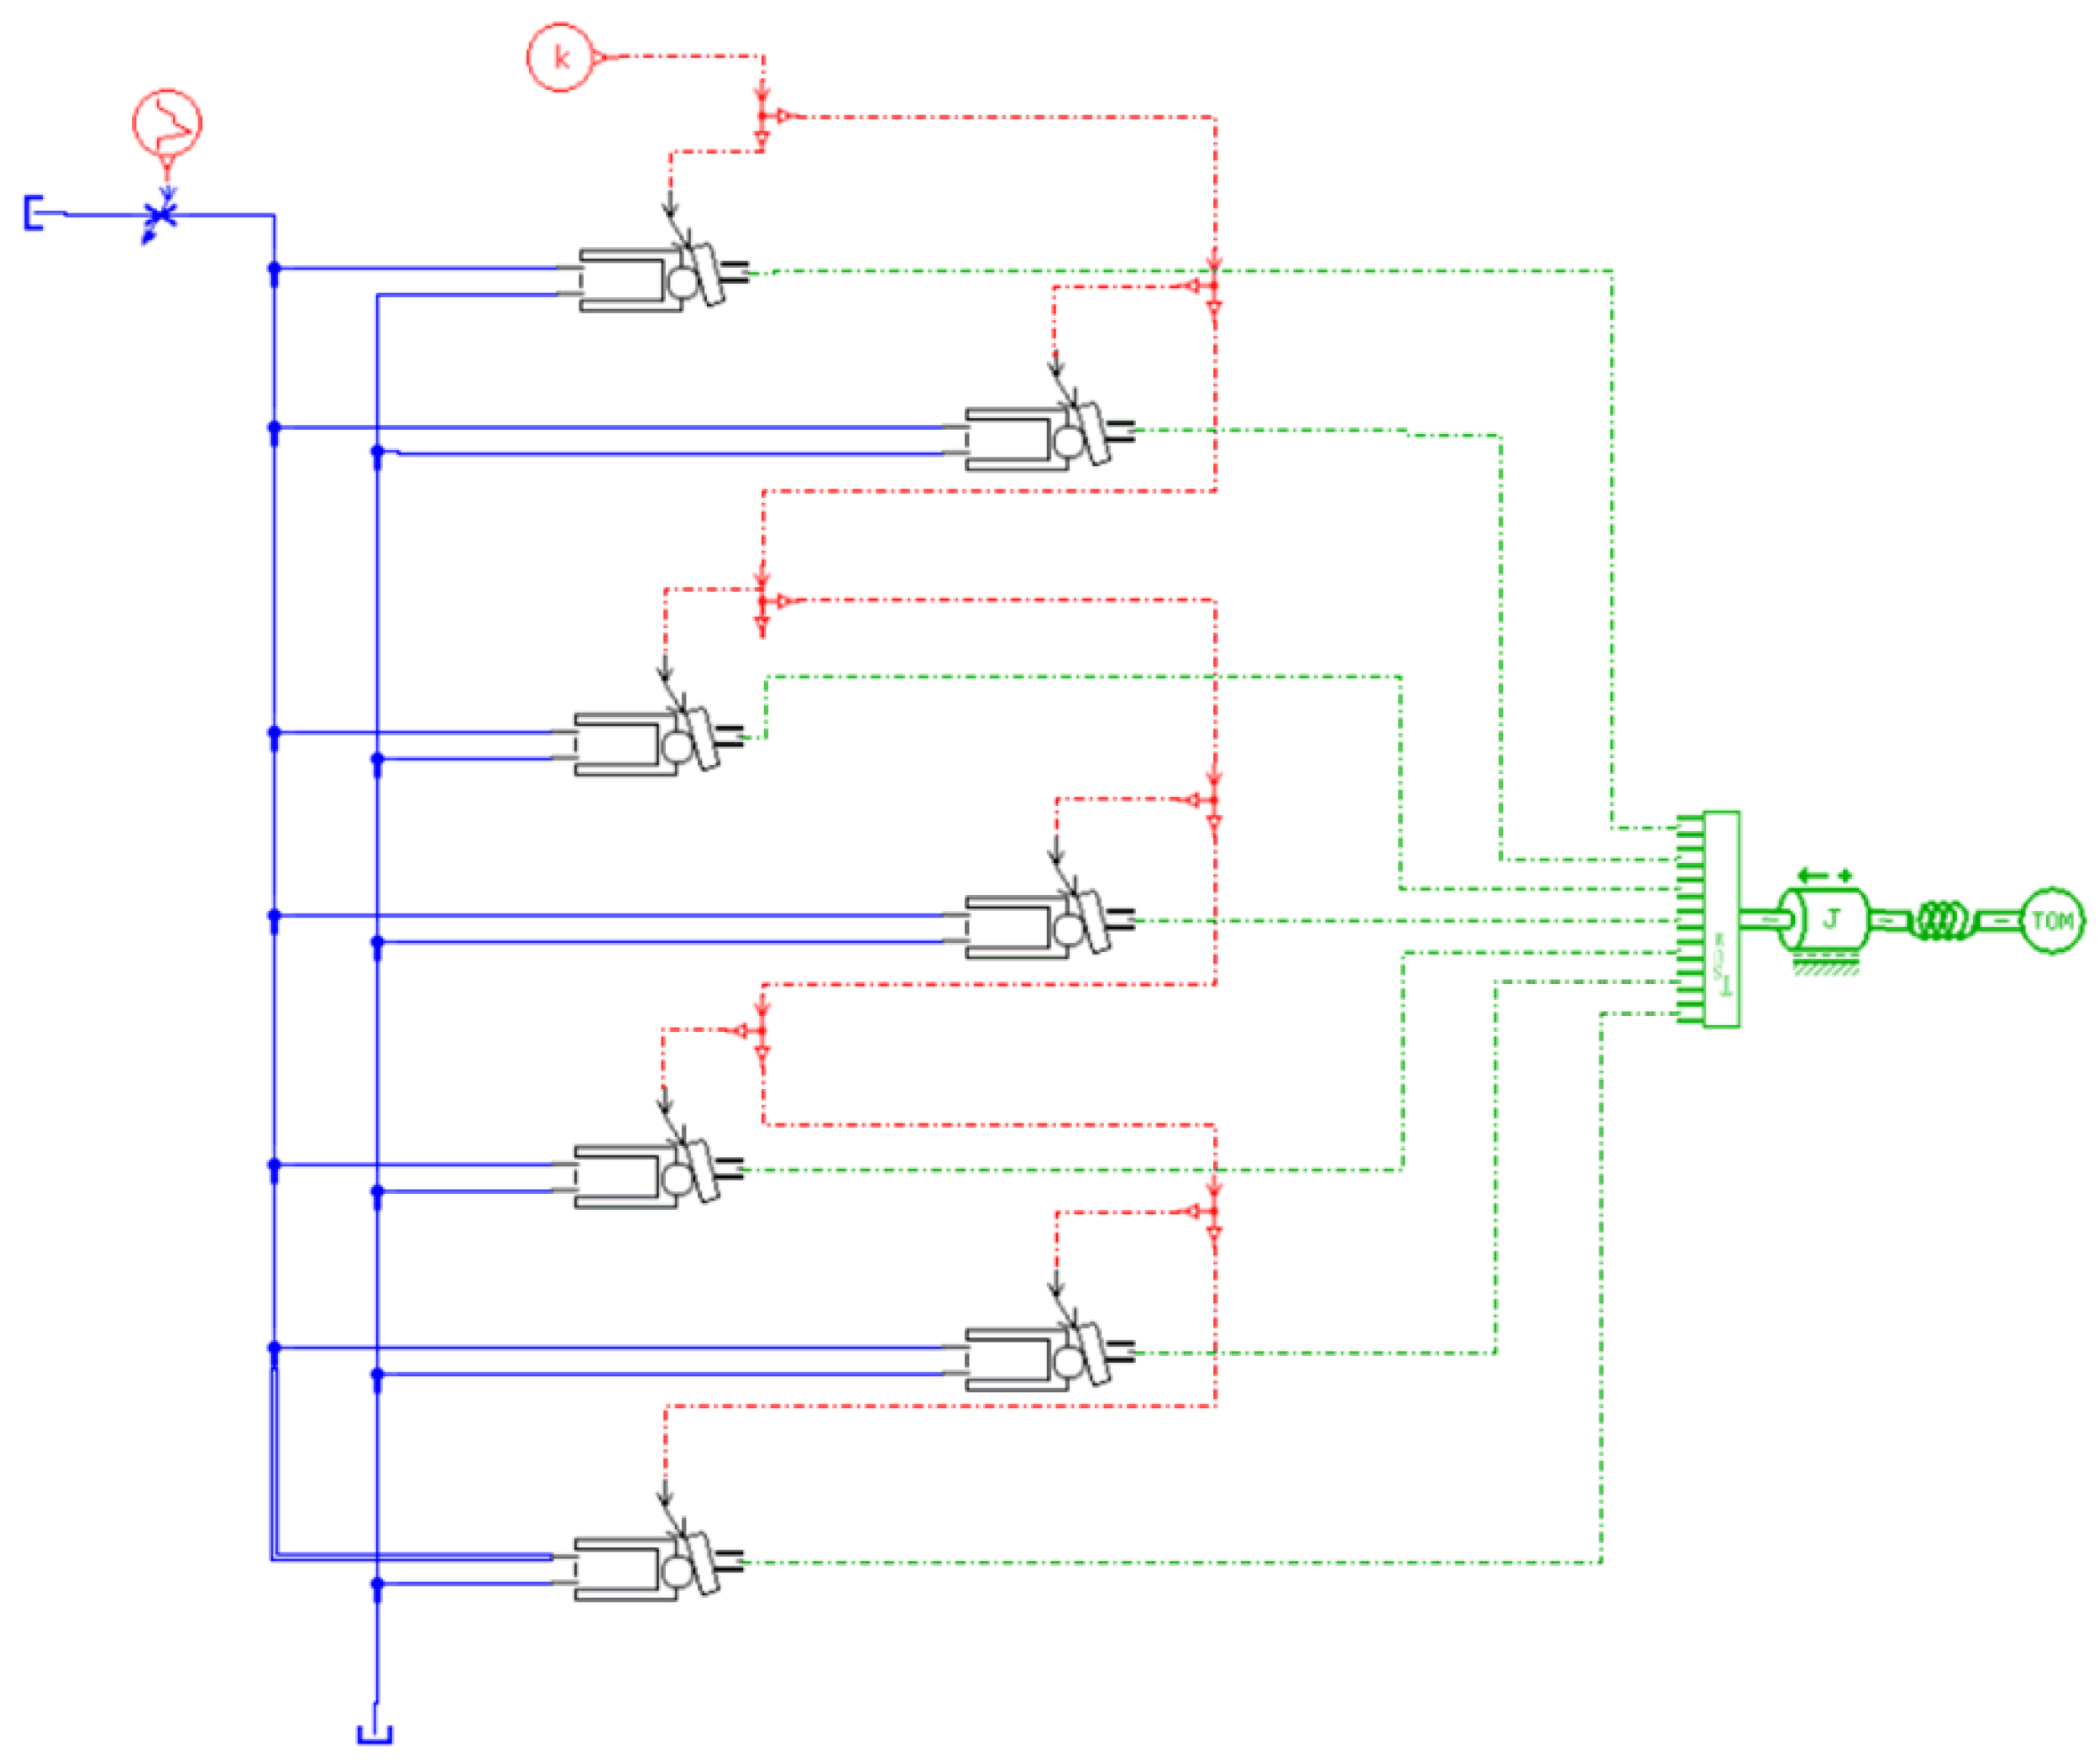
This article takes the seven-plunger pump structure as an example. First, the single-plunger model is packaged into a super element, and seven single-plunger super elements are connected in parallel to form a parallel model. Then, the parallel model, dynamic model, and load model are connected together to establish the AMESim simplified system model of the plunger pump, as shown in Figure 6.
According to the structural characteristics of the plunger pump, the adjacent angle of every single plunger is 360°/7. When setting the initial position and angle of the plunger, according to the working characteristics of the plunger pump, the first plunger is set to the minimum extension position, the angle offset of the signal switch in the oil absorption period is set to 0°, the second plunger is set to 1 × 360°/7, the third plunger is set to 2 × 360°/7, and so on. Within 0°–180°, it is the oil absorption process. The switch angle of the oil discharge cycle signal lags behind 180°, which is the process of oil discharge.
4. Simulation Analysis of Fluid Pressure Fluctuation Characteristics
The plunger pump AMESim simplifies the parameter set of the system model, as shown in Table 1.
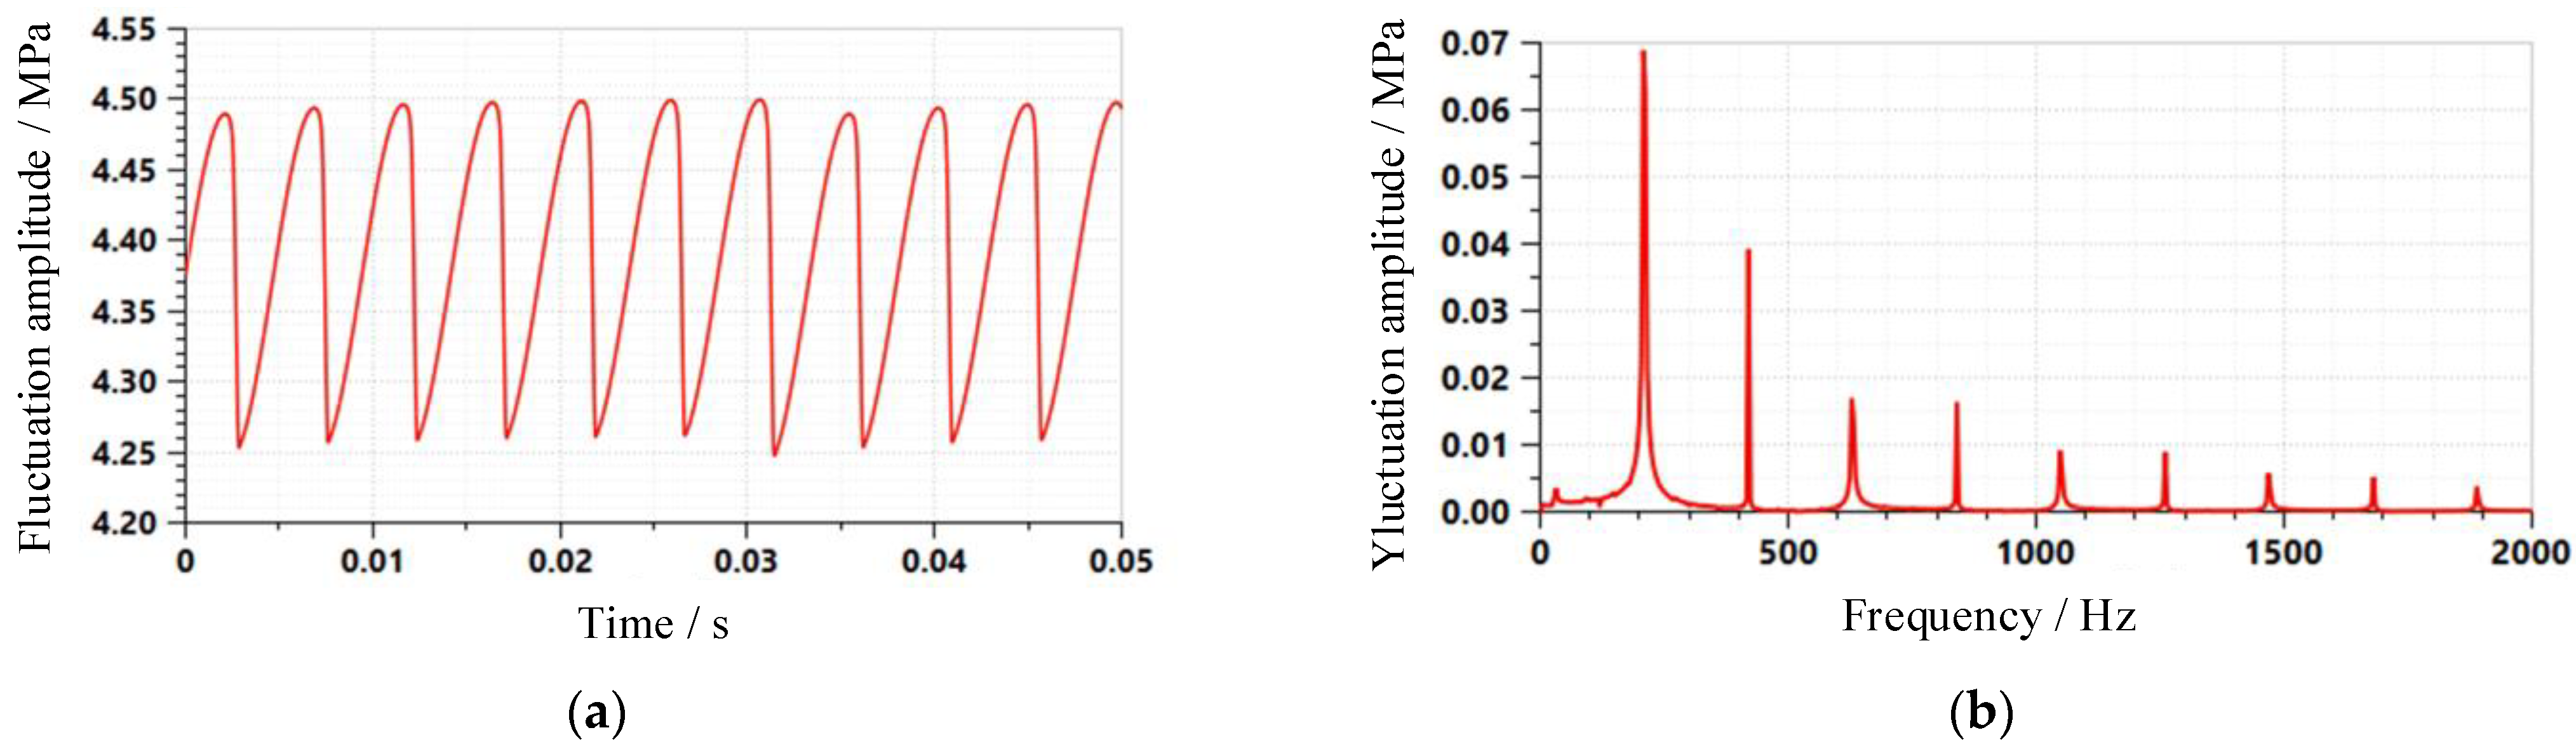
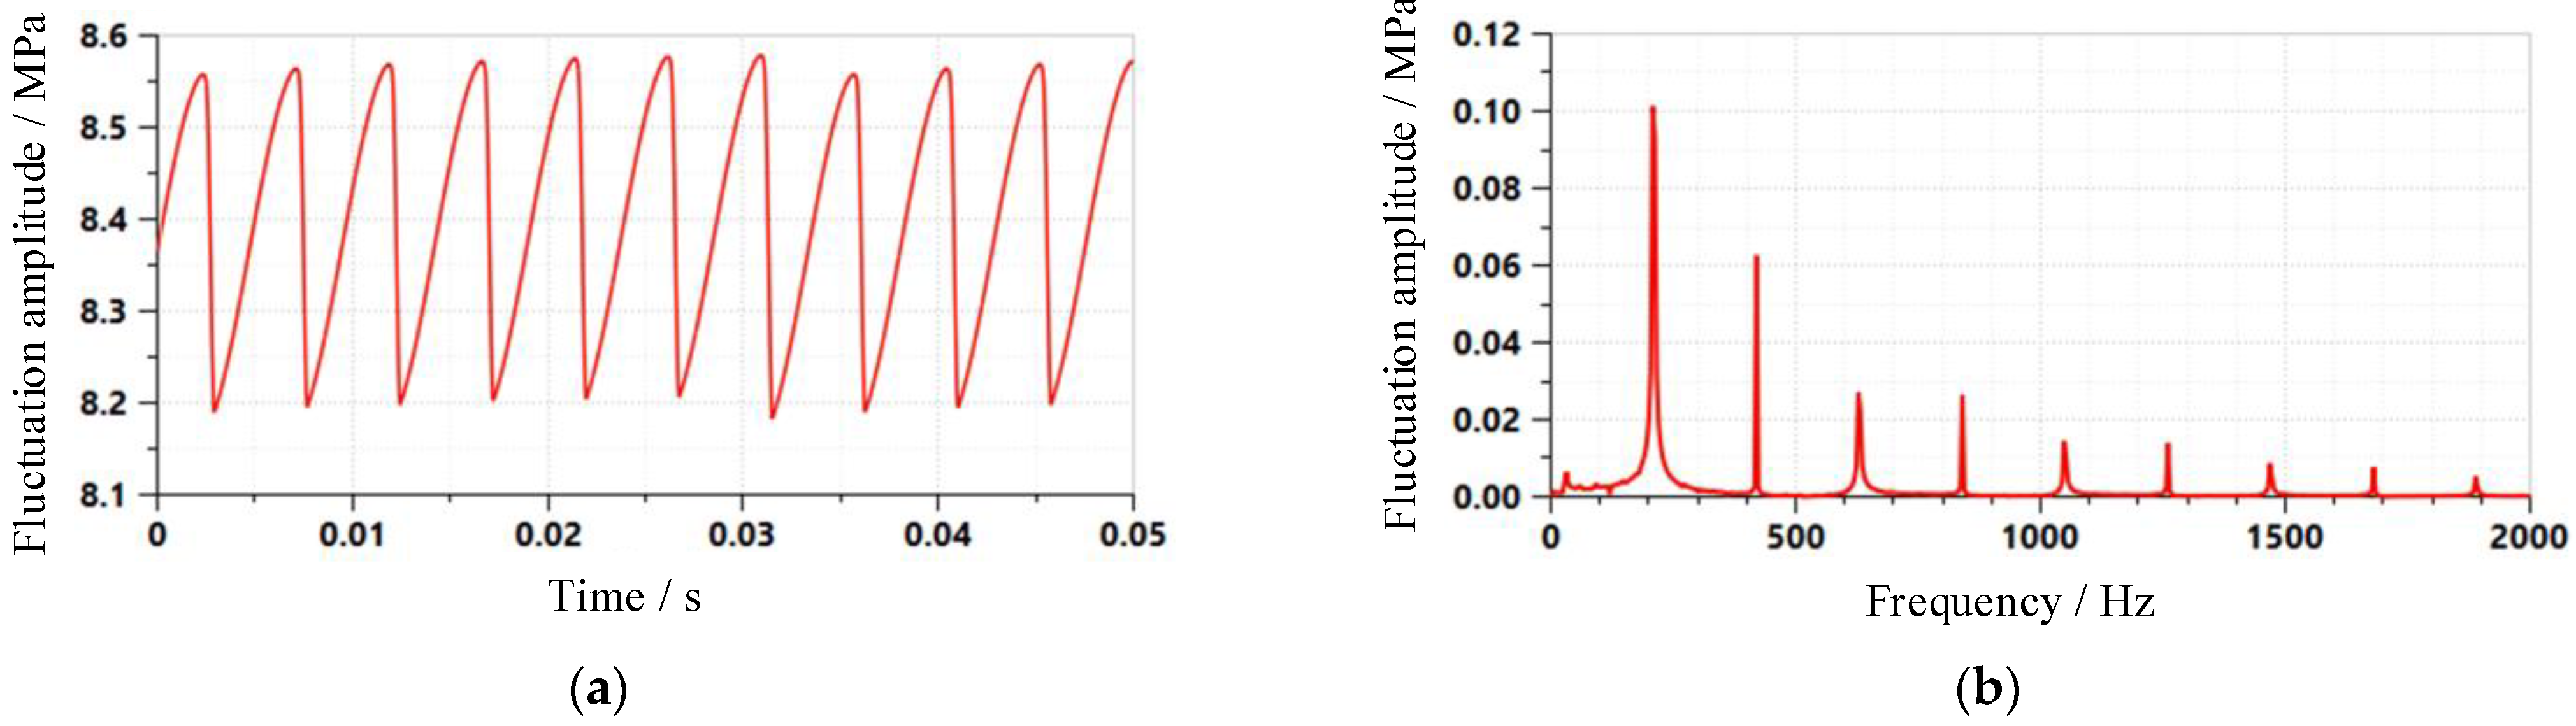
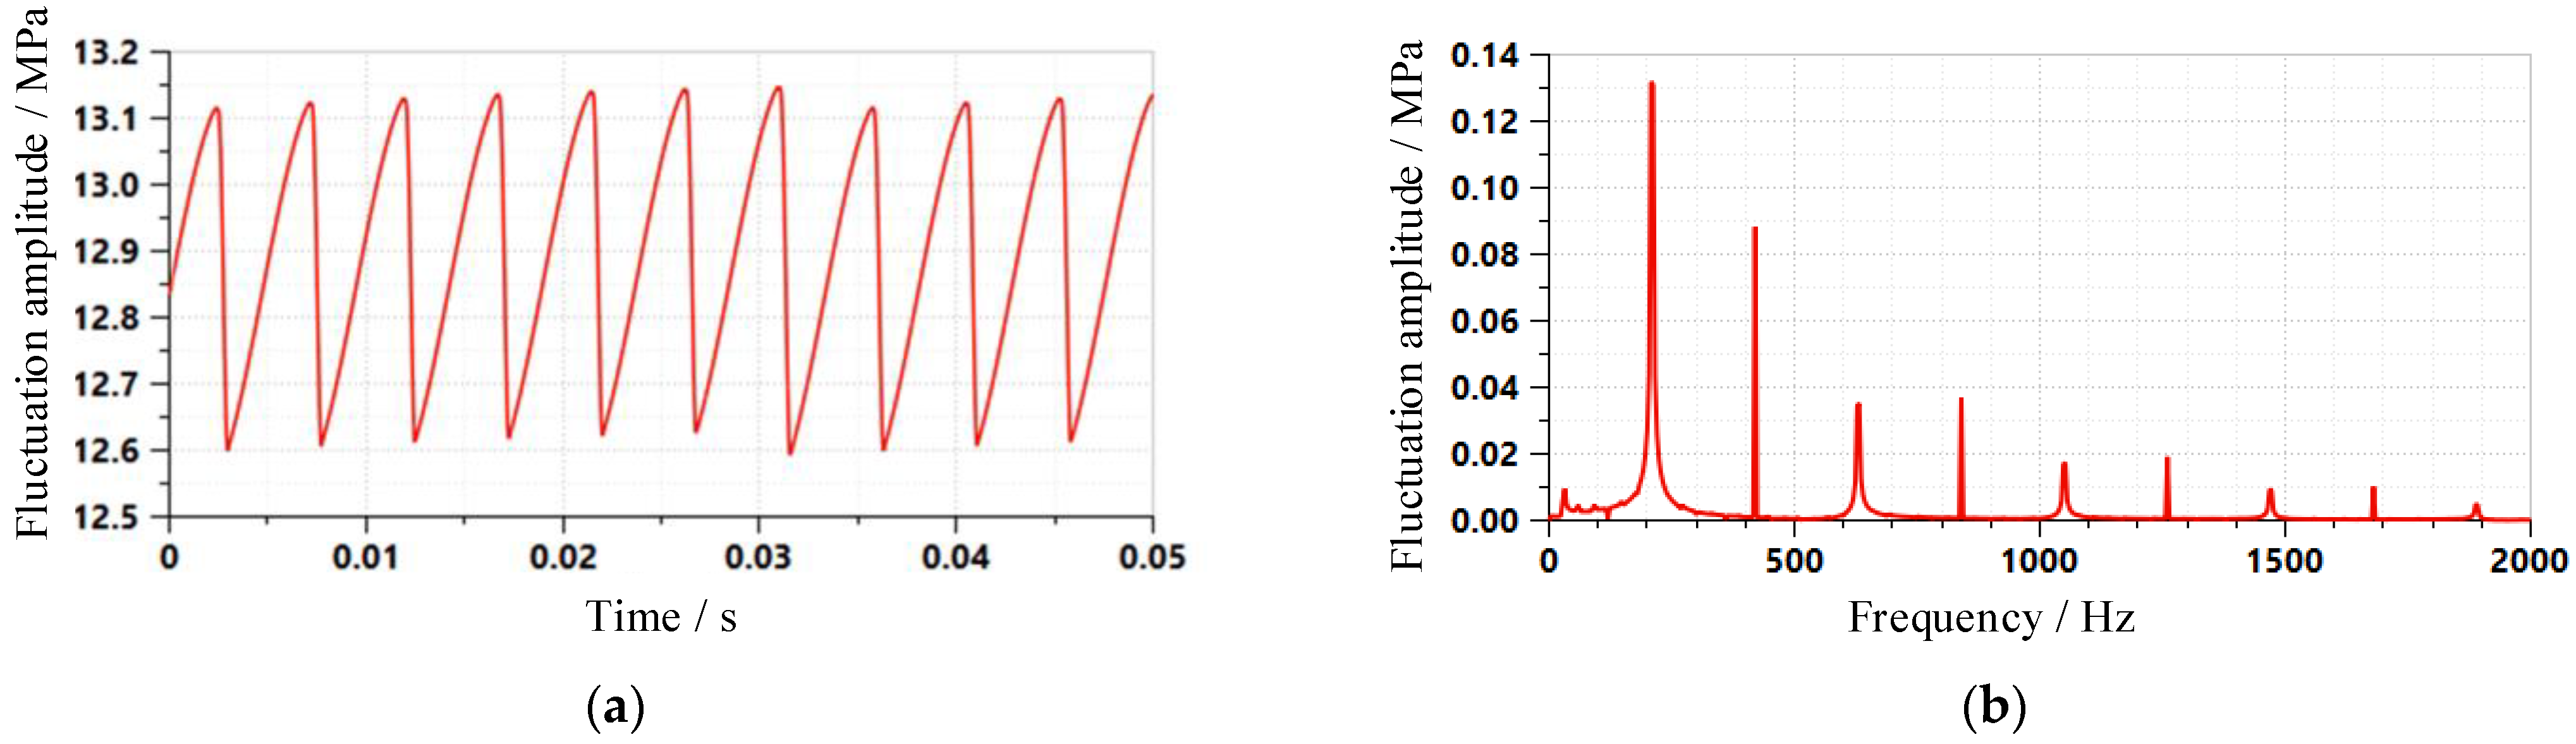
When the speed was n = 1800 r/min, the load pressure was p1 = 4.375 MPa, p2 = 8.38 MPa, and p3 = 12.87 MPa, respectively, and the frequency domain waveform diagram of fluid pressure pulsation was obtained by simulation, as shown in Figure 7, Figure 8 and Figure 9.
At the same speed, the fluid pressure pulsation value and pressure pulsation rate under different load pressures are shown in Table 2.
Under different load pressures, the first three frequency amplitudes were extracted as shown in Table 3.
The above simulation results show that at a certain speed, as the load pressure of the hydraulic system increased, the time-domain waveform curve of the fluid pressure pulsation of the pump source changed, the pressure pulsation amplitude increased, and the pressure pulsation rate decreased. From the frequency domain waveform curve, the fluid pressure pulsation contained multiple harmonic components in the wide frequency domain. Moreover, the fundamental frequency of the fluid pressure pulsation increased obviously with the increase of the load pressure, while the amplitude of other frequency doublings did not change significantly.
5. The Construction of an Experimental Platform for Pump Source Fluid Pressure Pulsation Testing
5.1. Principle of the Pressure Pulsation Test
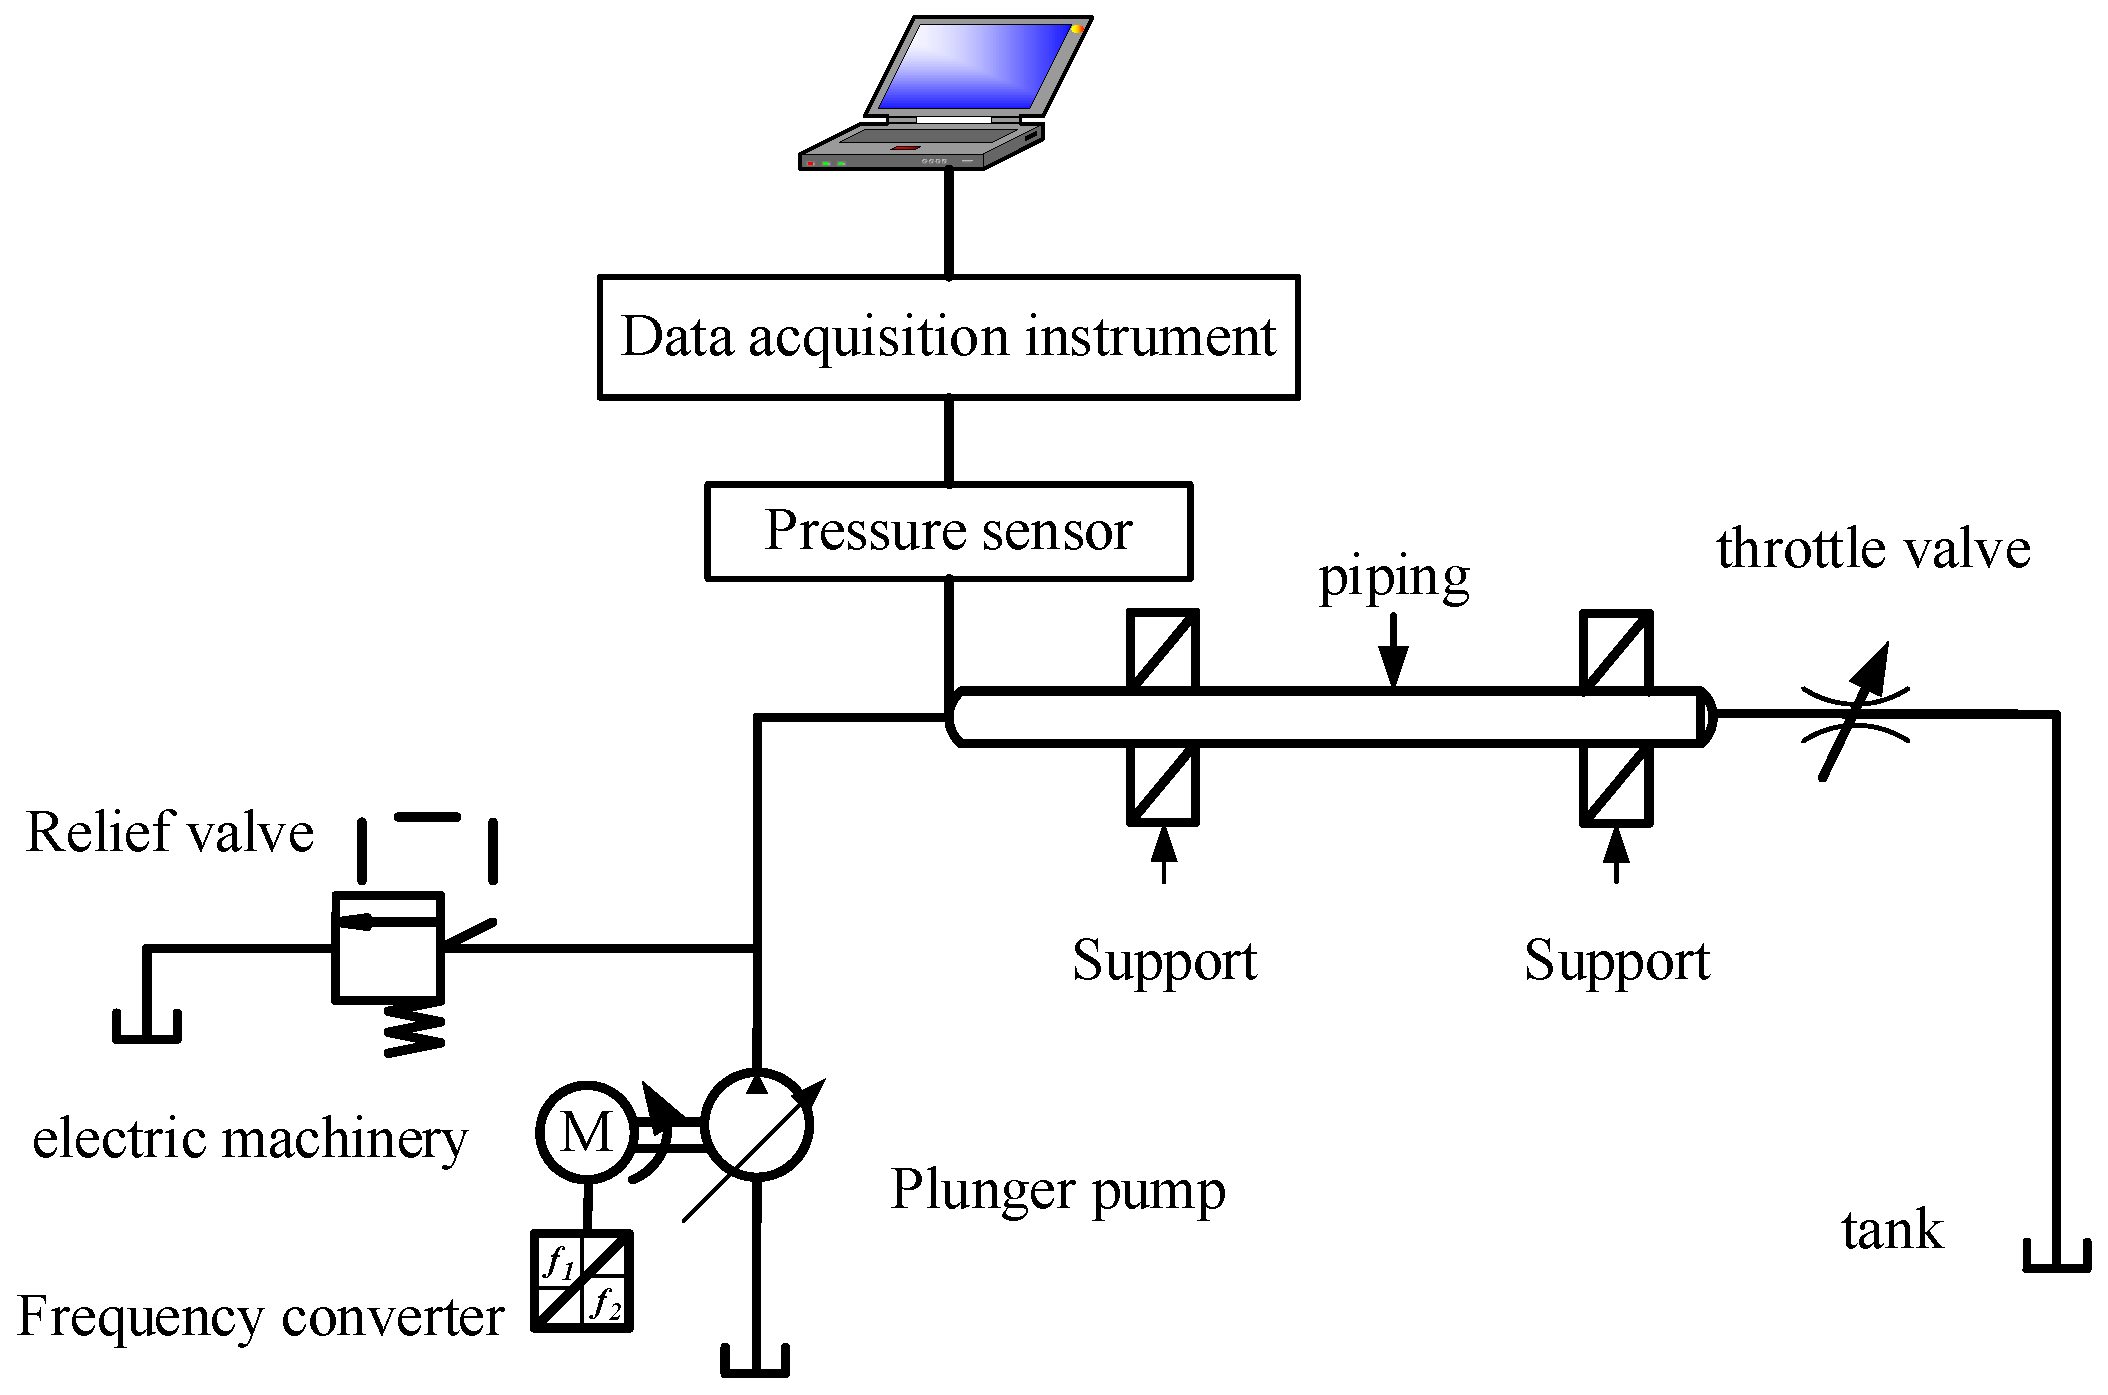
In the experiment, a pressure sensor is installed at the inlet of the pipeline directly connected to the outlet of the pump source of the plunger pump to obtain the fluid pressure pulsation signal at the outlet of the pump source. The fluid pressure pulsation signal is recorded and stored by a data acquisition instrument, and then the pressure pulsation waveform curve is obtained by time-frequency analysis of the fluid pressure pulsation signal. The principle of the fluid pressure pulsation test is shown in Figure 10.
5.2. Experimental Platform Construction
The experimental platform was composed of a hydraulic system, a test system, and a pipeline system. The hydraulic system included motors, frequency converters, pumping station devices, etc. The frequency converter controlled the speed of the motor and adjusted the throttle valve in the pumping station device to simulate the load pressure of the system. The test system was used to collect the dynamic measurement of pressure parameters, mainly including piezoelectric pressure sensors, impedance converters, and data acquisition instruments, etc. The pipeline system was mainly composed of pipelines and pipeline connectors, which were used for the connection between the oil outlet of the pump source and the oil return port of the hydraulic system, and a pressure sensor was installed at the inlet of the pipeline to collect pressure pulsation signals. The main component models and performance parameters of the experimental platform are shown in Table 4.
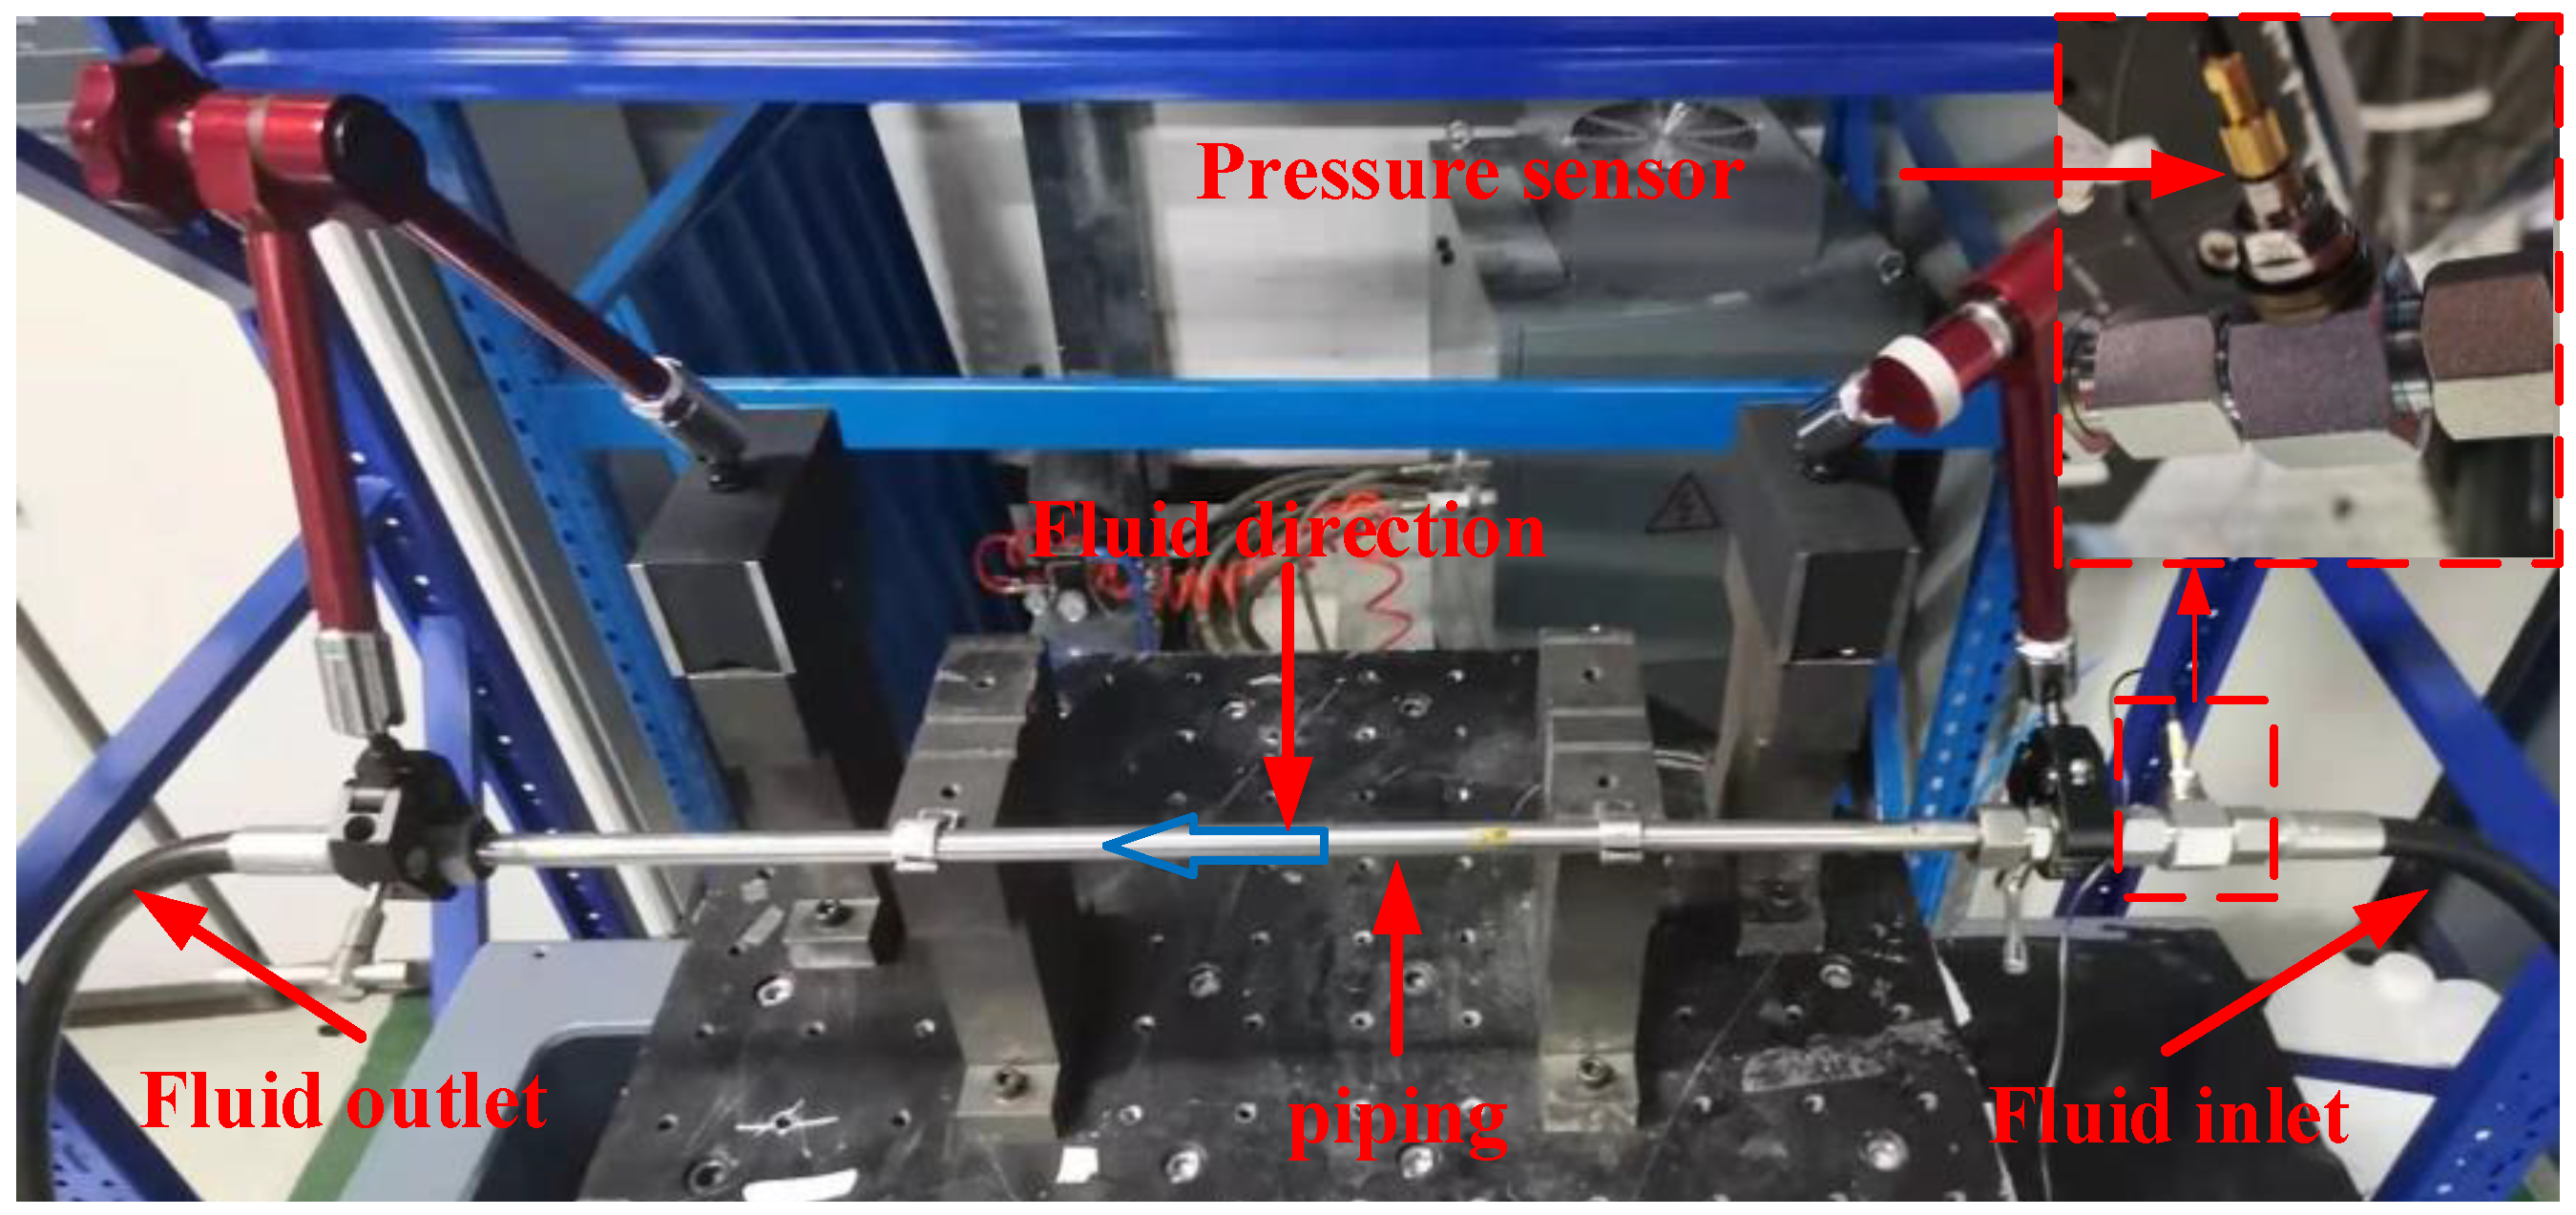
The installation and layout of the pipeline inlet pressure sensor are shown in Figure 11. The fluid flowed in from the right side of the pipeline and flowed out from the left side. A pressure sensor was installed at the inlet of the hydraulic pipeline to measure the pressure pulsation curve of the pump source fluid.
6. Simulation and Experimental Analysis
6.1. Analysis of the Test Results of the Fluid Pressure Pulsation Experiment
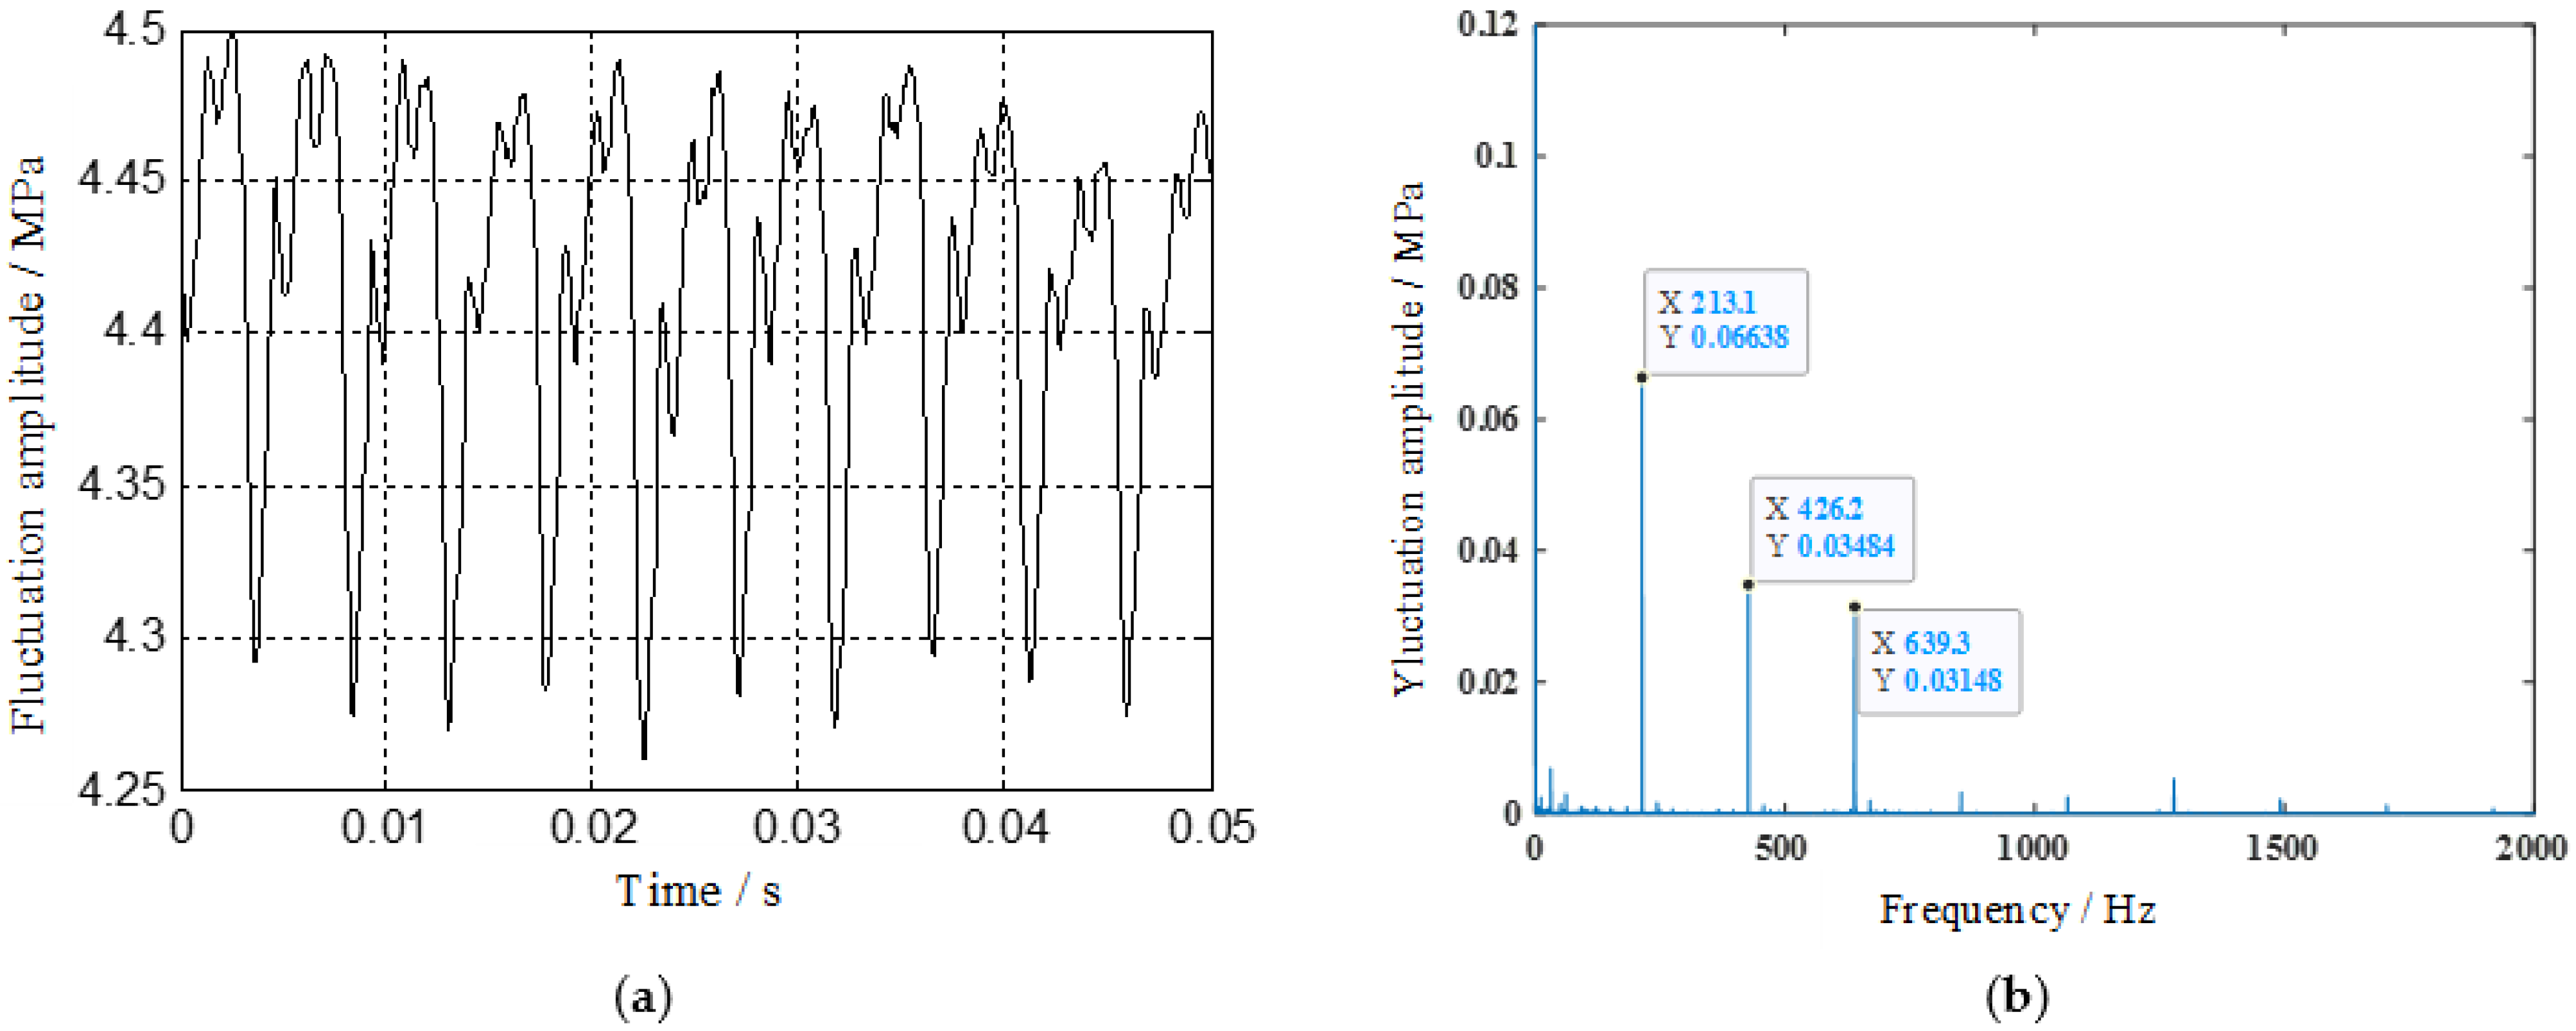
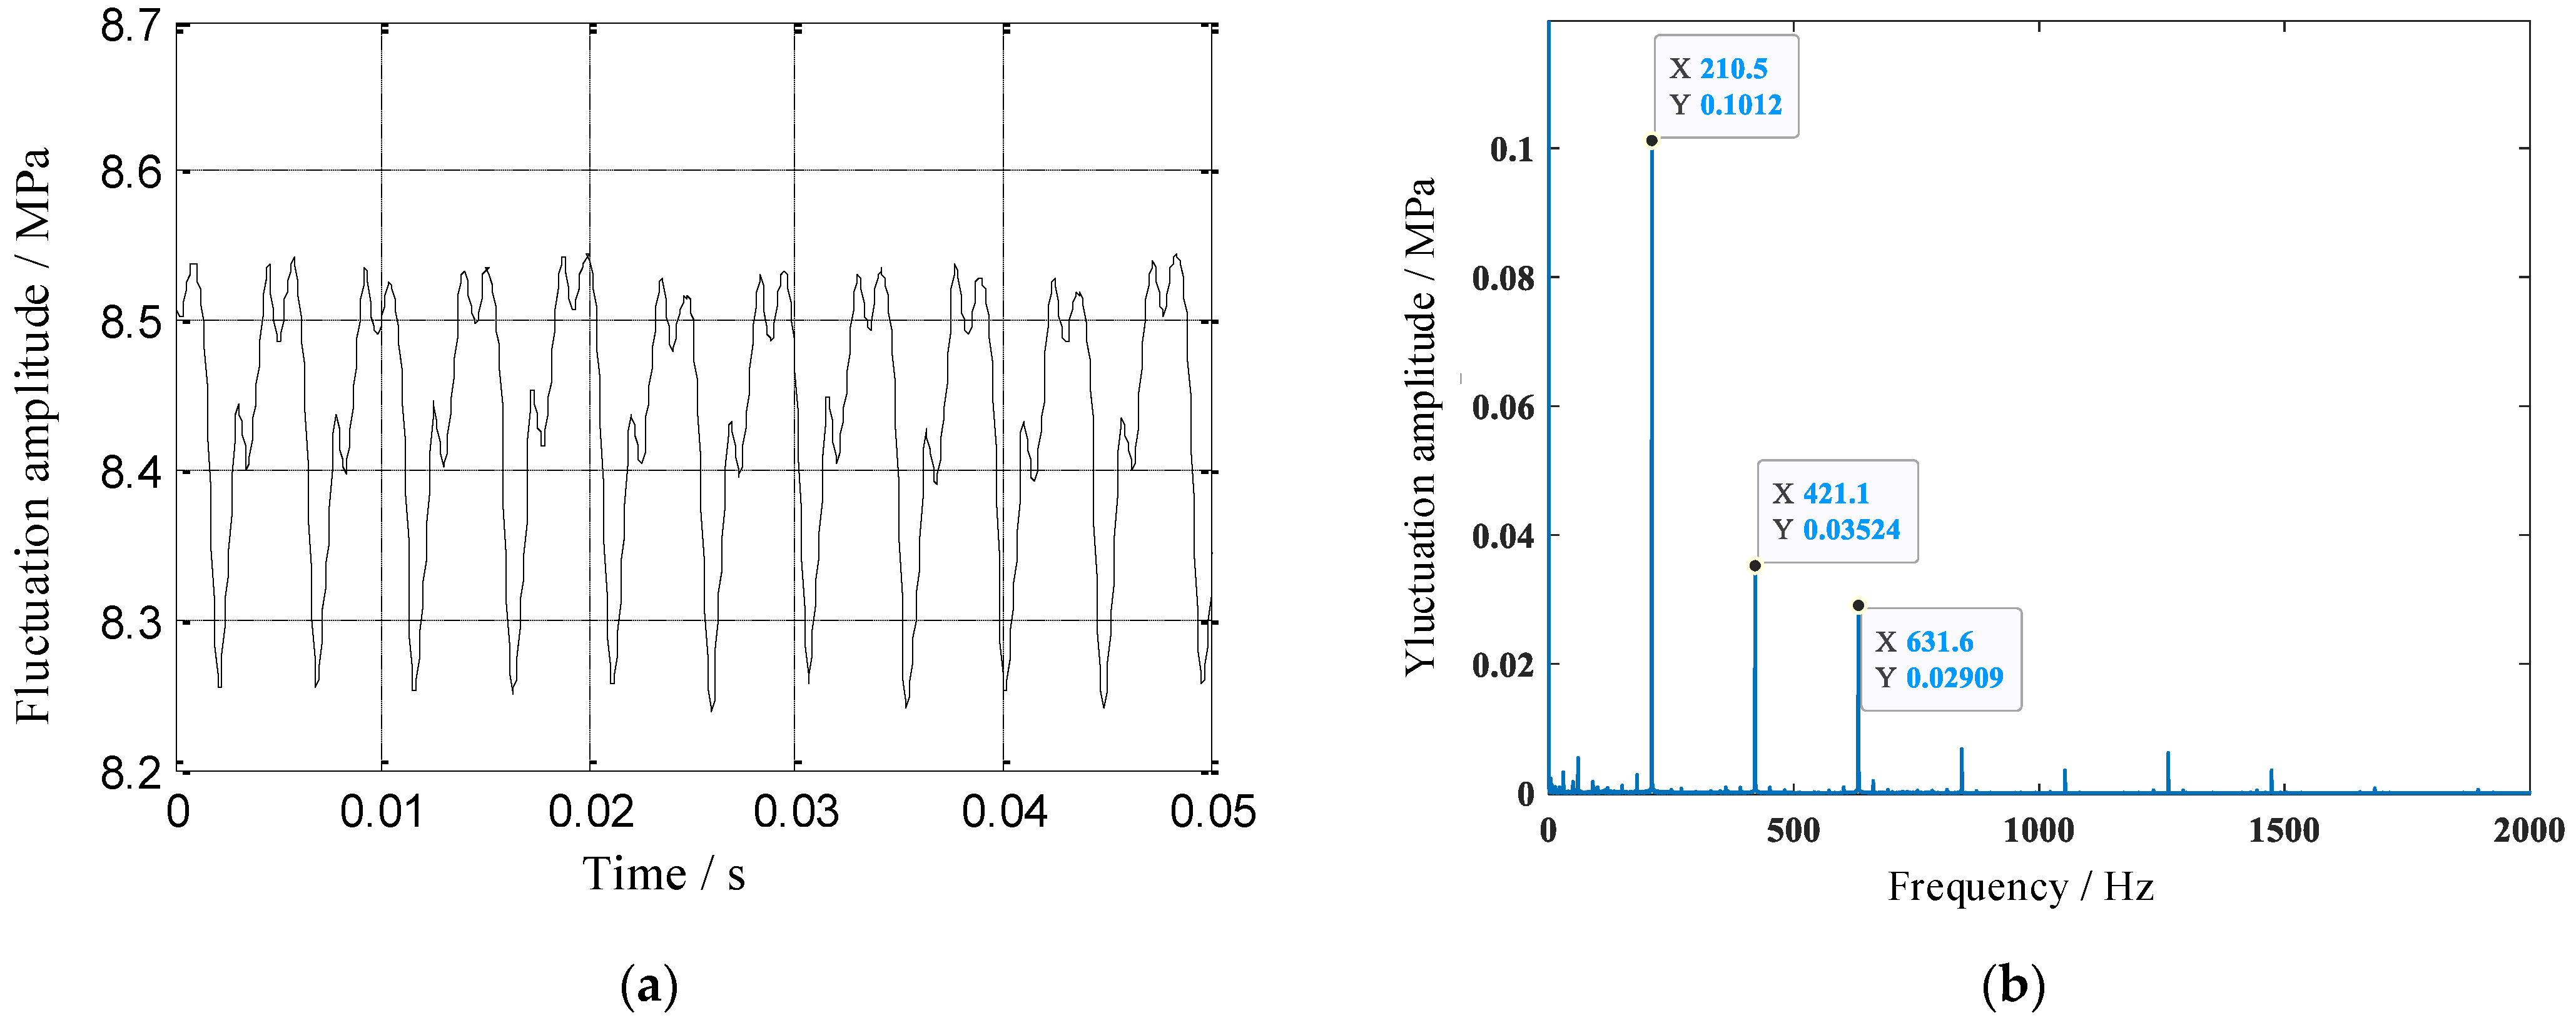
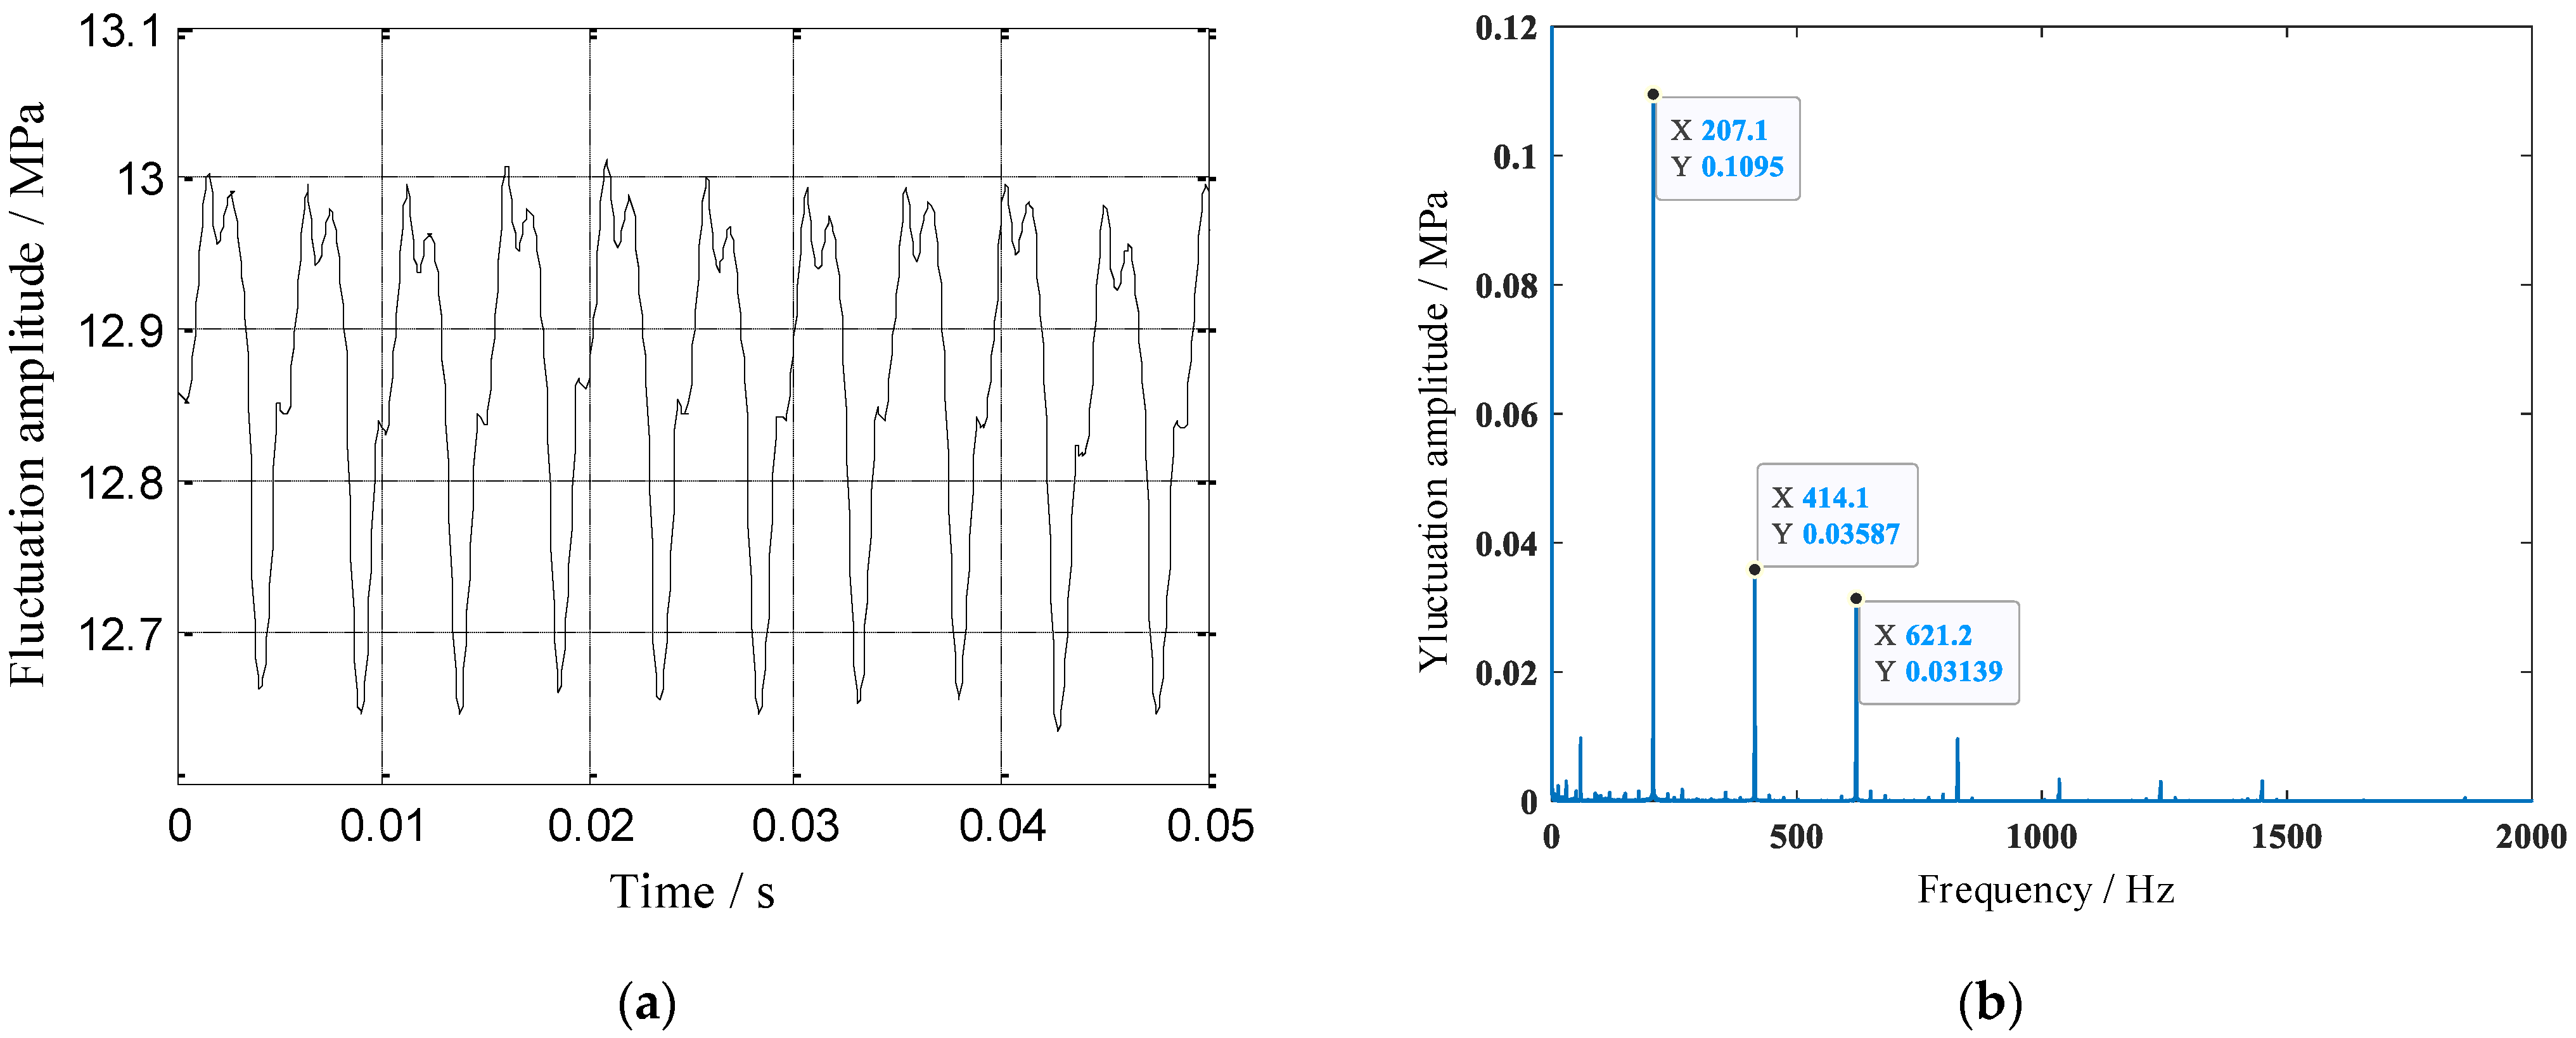
The motor speed was set to n = 1800 r/min and the size of the throttle valve was adjusted to make the load pressure of the hydraulic system p1 = 4.375 MPa, p2 = 8.38 MPa, and p3 = 12.87 MPa, respectively. The SC-XS12-A data acquisition instrument was used to collect dynamic fluid pressure pulsation signals and obtain the time-frequency domain waveform diagrams of fluid pressure pulsations under different pressures, as shown in Figure 12, Figure 13 and Figure 14.
It can be seen that the fluid pressure pulsation curve measured at the outlet of the pump showed periodic changes during a constant motor speed. The fluid pressure pulsation curve contained multiple harmonic components in a wide frequency range, and as the load pressure of the hydraulic system increased, the amplitude of the fluid pressure pulsation at the outlet of the pump source increased, which had the most significant impact on the amplitude of the fundamental frequency. The conclusions drawn from the experiment were basically consistent with the simulation results.
6.2. Comparative Analysis of the Fluid Pressure Pulsation Experiment and Simulation
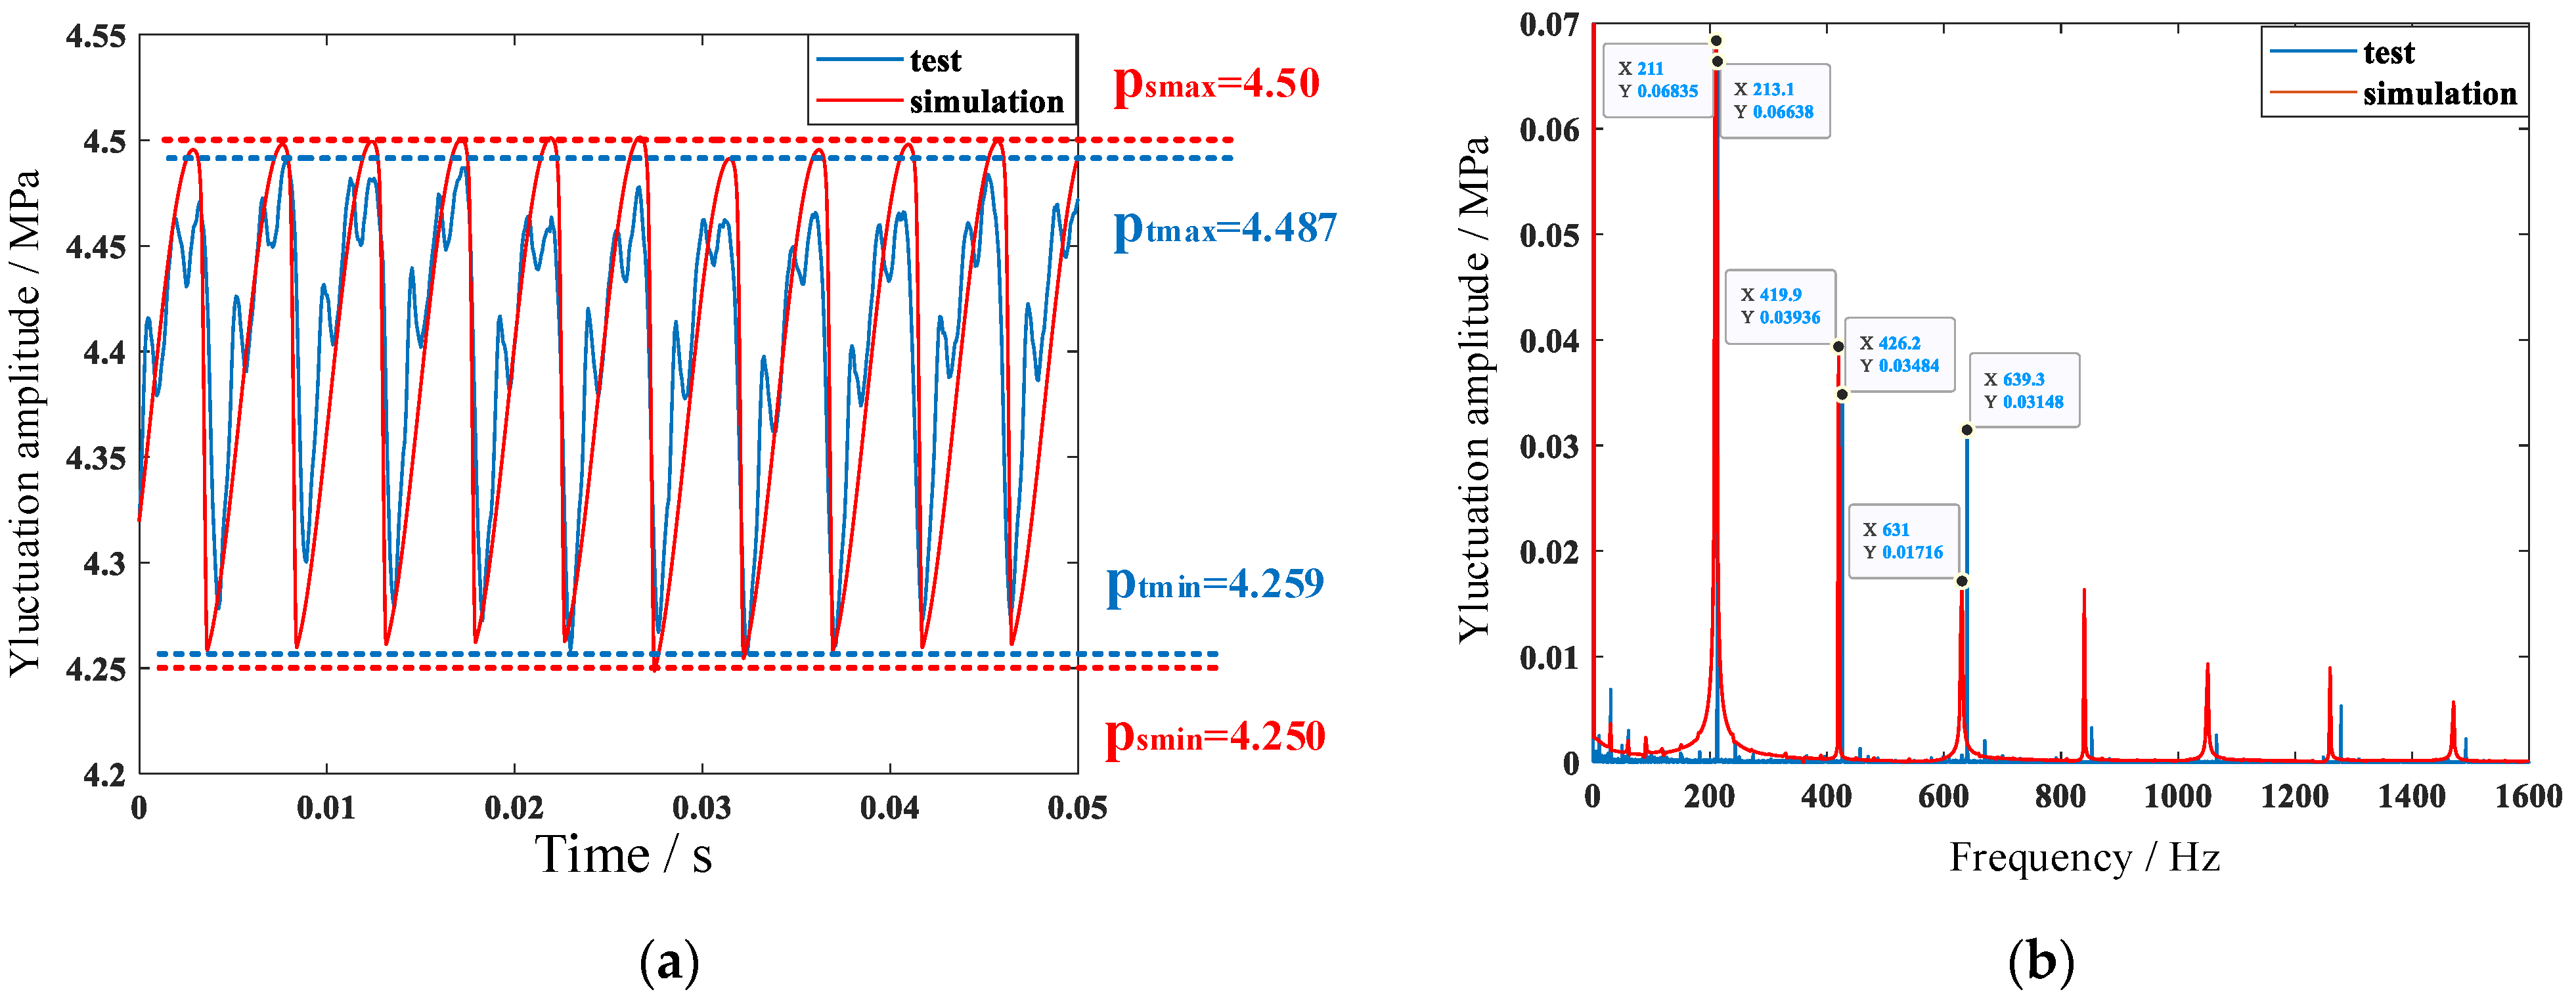
Under the same load pressure level p1 = 4.375 MPa, the pump source fluid pressure pulsation was simulated and experimentally tested, and the fluid pressure pulsation waveform curves were compared and analyzed, as shown in Figure 15.
Through Figure 15a, the simulated and measured pump fluid pressure pulsation value and pressure pulsation rate were obtained, as shown in Table 5.
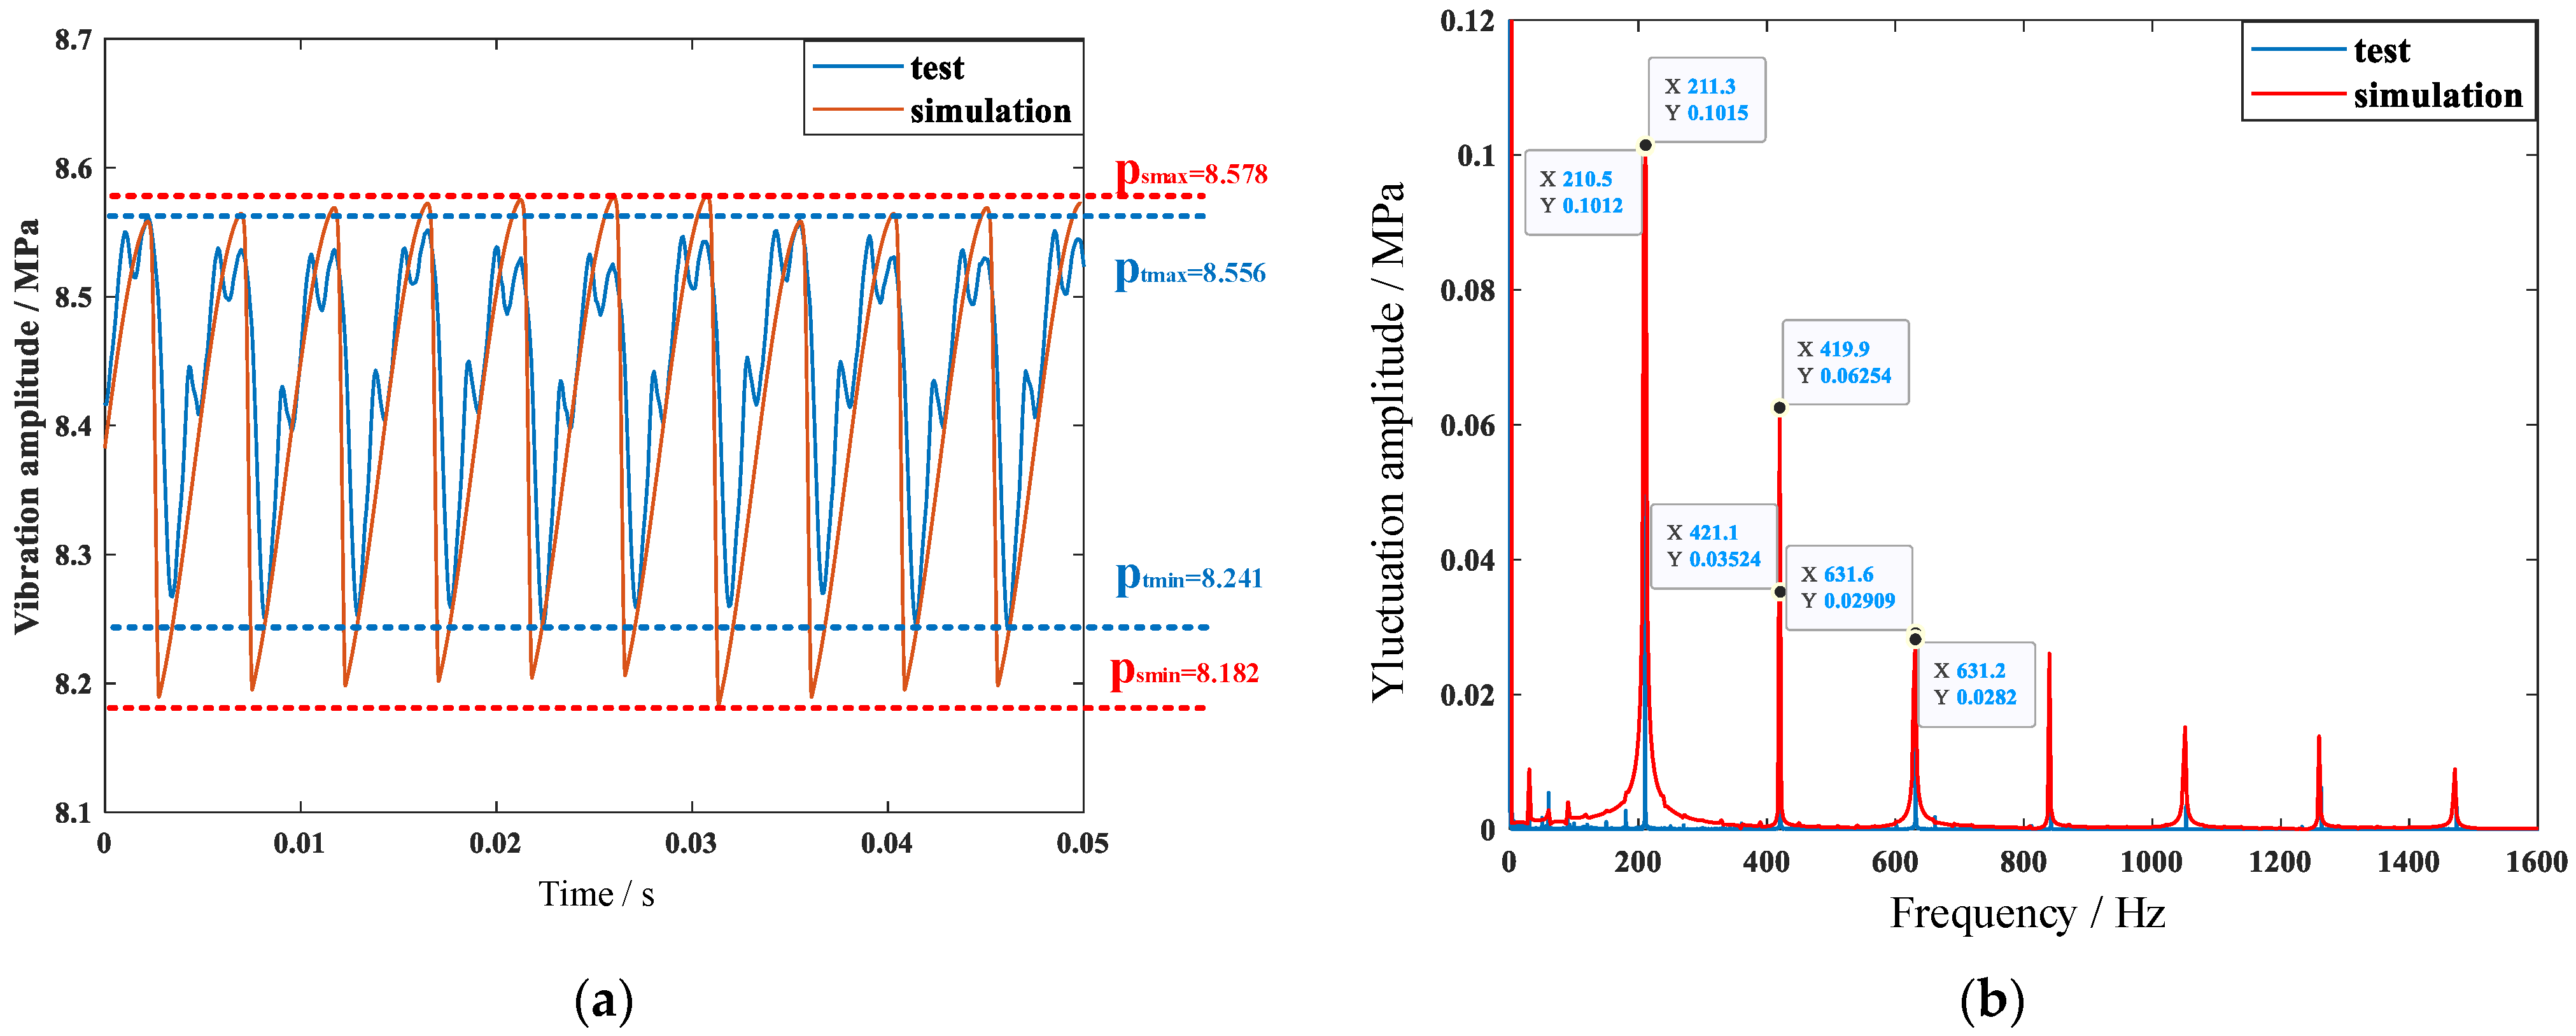
Under the same load pressure level p2 = 8.38 MPa, the pump source fluid pressure pulsation was simulated and experimentally tested, and the fluid pressure pulsation waveform curves were compared and analyzed, as shown in Figure 16.
Through Figure 16a, the simulated and measured pump fluid pressure pulsation value and pressure pulsation rate were obtained, as shown in Table 7.
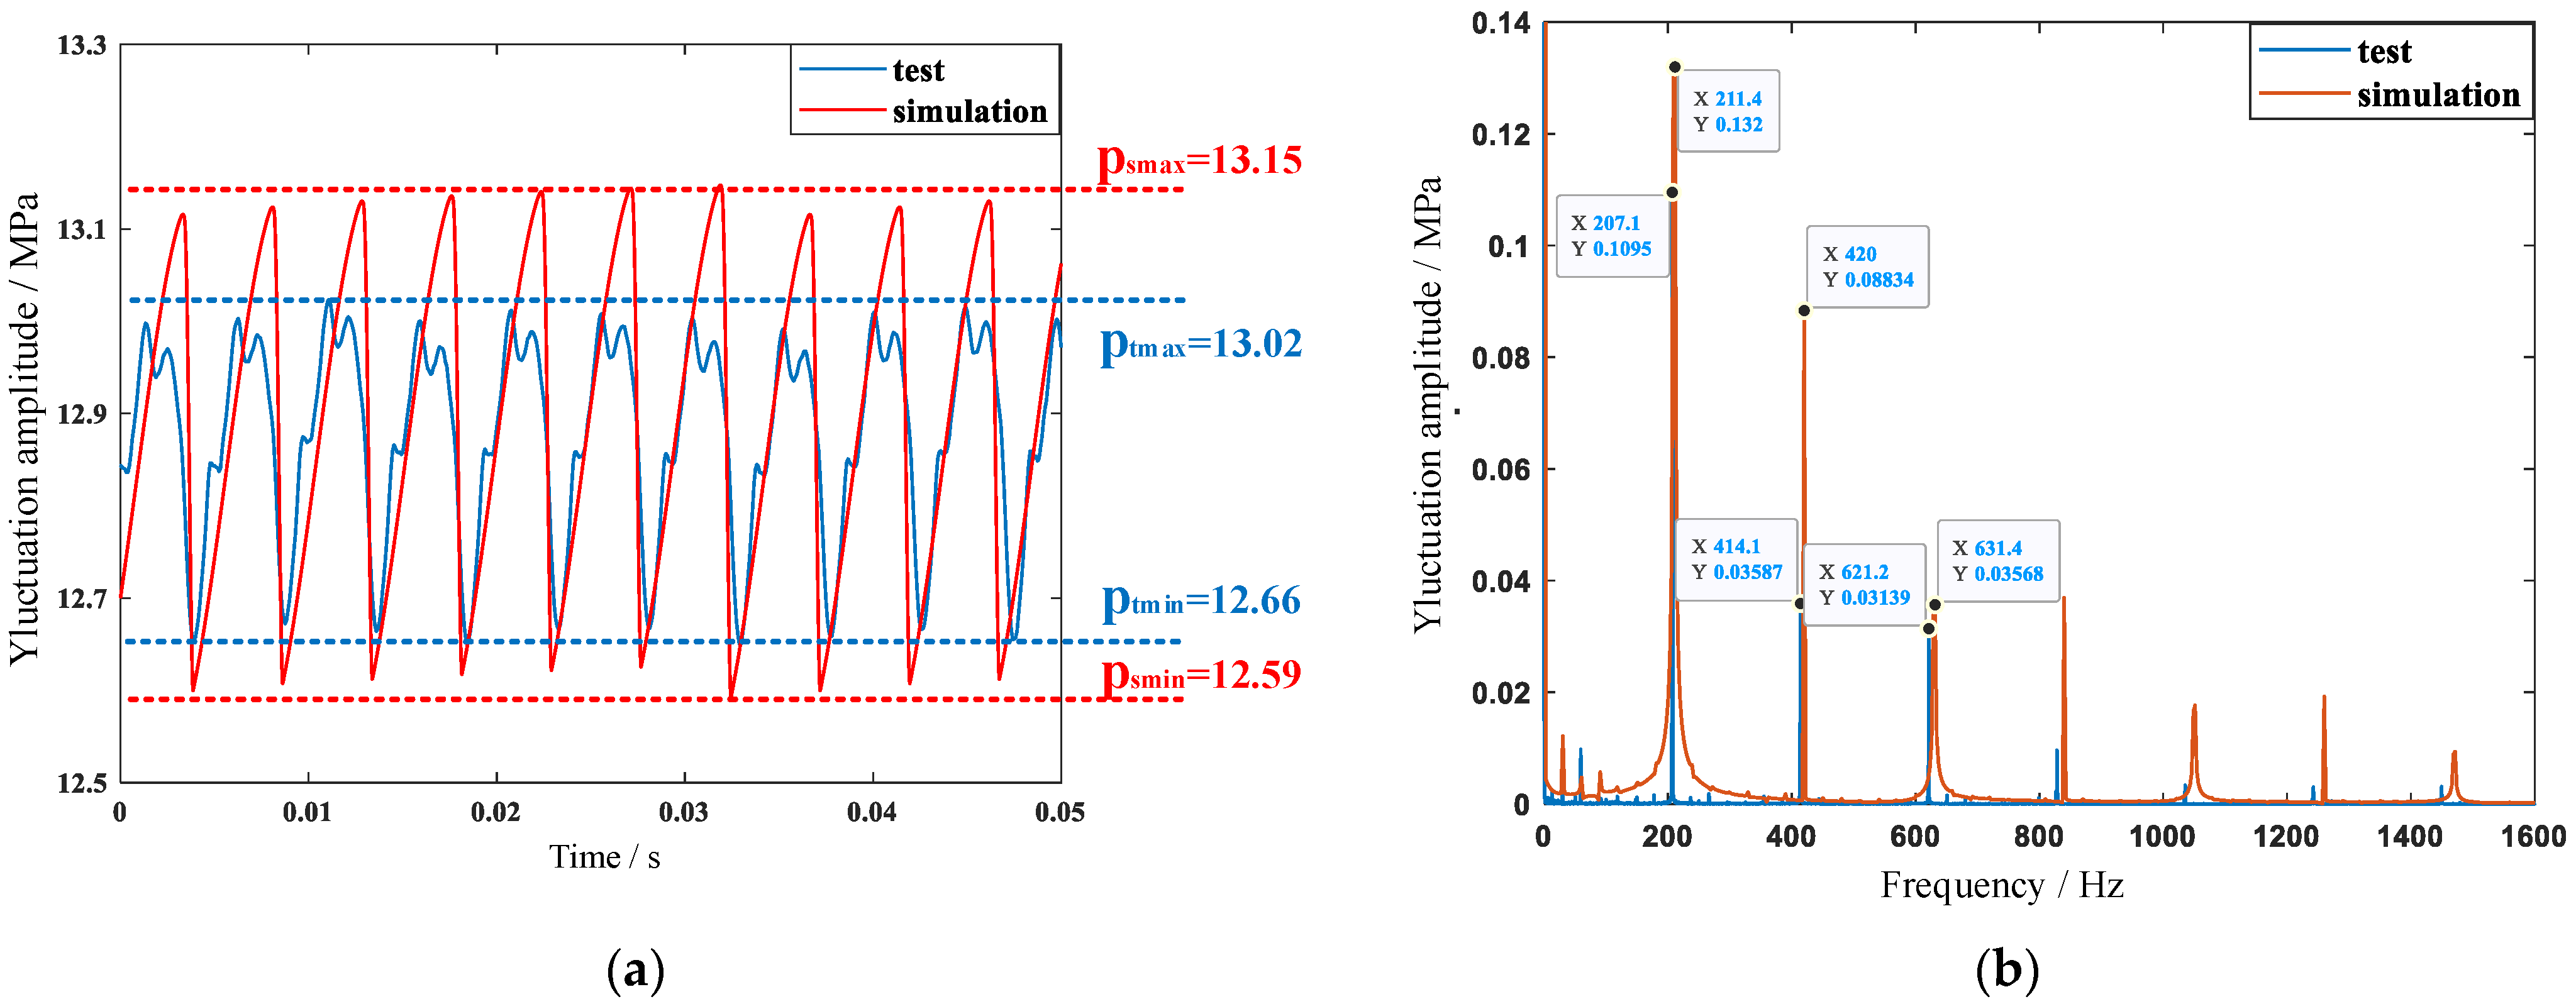
Under the same load pressure level p3 = 12.87 MPa, the pump source fluid pressure pulsation was simulated and experimentally tested, and the fluid pressure pulsation waveform curves were compared and analyzed, as shown in Figure 17.
Through Figure 17a, the simulated and measured pump fluid pressure pulsation value and pressure pulsation rate were obtained, as shown in Table 9.
Through the comparative analysis of the experiment and simulation, it can be concluded that the simulation results were very consistent with the experimental measurement results. When the engine speed was 1800 rpm, which is 30 Hz, considering 7 plungers, it can be easily calculated that there are 7 × 30 = 210 pressure pulses per second, so 210 Hz is the first natural frequency that one would expect. Consequently, further higher-order frequencies happen to be positioned at 2, 3, … times 210 Hz. Similar aspects occur in the design of aircraft propellers, where the so-called “Blade Passage Frequency” is a key parameter for the study of acoustics and vibrations produced by rotating engine rotors [6]. Under the load pressures of p1 = 4.375 MPa, p2 = 8.38 MPa, and p3 = 12.87 MPa, the third-order frequency errors before simulation and experiment were about 1.3%, 0.3%, and 1.5%, respectively. The main reason for the small deviation between the two is that in the AMESim simulation process, the outlet of the plunger pump and the throttle valve are directly connected with a wire, which is equivalent to no pipeline, and the damping effect of the pipeline was not considered. In addition, the plunger pump and hydraulic valve leakage were not considered in the AMESim simulation process. Additionally, there were other environmental factors and manual operation factors during the experiment. In summary, the frequency error of the pump fluid pressure pulsation frequency of the simulation analysis and experiment test was about 1%, which proved the correctness of the simplified system model.
7. Conclusions
In this paper, the simplified system model of a seven-plunger pump was established by AMESim software, and the pressure pulsation characteristics of pump source fluid under different system load pressures at constant speed were simulated and analyzed. The pump source fluid pressure pulsation test experimental platform was built to measure the fluid pressure pulsation at the outlet of the pump, and the experimental test results and simulation results were compared and analyzed, and the following conclusions were obtained: The frequency error of the fluid pressure pulsation frequency measured by simulation analysis and experiment was about 1%, and the data were in good agreement, which verified the correctness of the simplified system model of the plunger pump. The general model of the plunger pump simplified system based on AMESim can facilitate parameter setting and reduce the workload of simulation modeling. The experimental test found that under a certain speed and pressure, the fluid pressure pulsation curve at the outlet of the pump had a wide frequency domain and multi-harmonic characteristics, and similar conclusions can be obtained from the simulation results. With the increase of the load pressure, the amplitude of the pump fluid pressure pulsation showed an increasing trend, and the pressure pulsation rate showed a decreasing trend. It can be seen from the frequency spectrum of the fluid pressure pulsation that the fundamental frequency amplitude of the fluid pressure pulsation increased significantly with the increase of the load pressure, and the other frequency doubling amplitudes did not change significantly.
Author Contributions
Conceptualization, J.L.; Formal analysis, H.M.; Methodology, S.Z.; Project administration, Q.H.; Software, Y.W.; Writing—original draft, W.W. All authors have read and agreed to the published version of the manuscript.
Funding
(1) the Basic Research Fund of Central University: N2003008; (2) National Science and Technology Professional Projects: J2019-I-0008-0008.
Institutional Review Board Statement
Not applicable.
Informed Consent Statement
Not applicable.
Conflicts of Interest
The authors declare no conflict of interest.
References
- Chen, X. Research on methods to reduce pressure pulsation of hydraulic system. Coal Mine Mach. 2006, 27, 957–988. [Google Scholar]
- Wang, Z. Aircraft High Pressure Hydraulic Energy System; Beijing University of Aeronautics and Astronautics: Beijing, China, 2004; pp. 213–229. [Google Scholar]
- Armentani, E.; Giannella, V.; Citarella, R.; Parente, A.; Pirelli, M. Substructuring of a Petrol Engine: Dynamic Characterization and Experimental Validation. Appl. Sci. 2019, 9, 4969. [Google Scholar] [CrossRef] [Green Version]
- Armentani, E.; Caputo, F.; Esposito, L.; Giannella, V.; Citarella, R. Multibody Simulation for the Vibration Analysis of a Turbocharged Diesel Engine. Appl. Sci. 2018, 8, 1192. [Google Scholar] [CrossRef] [Green Version]
- Armentani, E.; Giannella, V.; Parente, A.; Pirelli, M. Design for NVH: Topology optimization of an engine bracket support. Procedia Struct. Integr. 2020, 26, 211–218. [Google Scholar] [CrossRef]
- Giannella, V.; Lombardi, R.; Pisani, M.M.; Federico, L.; Barbarino, M.; Citarella, R. A Novel Optimization Framework to Replicate the Vibro-Acoustics Response of an Aircraft Fuselage. Appl. Sci. 2020, 10, 2473. [Google Scholar] [CrossRef] [Green Version]
- Casoli, P.; Vacca, A.; Franzoni, G.; Berta, G.L. Modelling of fluid properties in hydraulic positive displacement machines. Simul. Model. Pract. Theory 2006, 14, 1059–1072. [Google Scholar] [CrossRef]
- Kojima, E.; Nagakura, H. Characteristics of Fluidborne Noise generated by Fluid Power Pumps: 1st Report, Mechanism of Generation of Pressure Pulsation in Axial Piston Pump. JSME Int. J. 2008, 25, 46–53. [Google Scholar] [CrossRef] [Green Version]
- Liu, M.M.; Liu, H.H.; Zhang, S.; Jiang, W.X.; Le-Pu, D.U. Character study on the pressure and flow pulsation of the aero-motor fuel pump. J. Qingdao Technol. Univ. 2014, 35, 119–123. [Google Scholar]
- Xiaoning, L. Theoretical and Experimental Research on Reducing the Noise of Swash Plate Type Axial Piston Pump; Harbin Institute of Technology: Harbin, China, 1984. [Google Scholar]
- Lu, J.; Zhou, R.; Jiao, Z. Modeling and simulation of pulsation of aviation plunger pump. Fluid Power Transm. Control. 2006, 3, 7–9. [Google Scholar]
- Guo, W.; Wang, Z. Analysis and research on actual flow rate of swash plate axial piston pump. J. Beijing Univ. Aeronaut. Astronaut. 1996, 4, 223–227. [Google Scholar]
- Johnston, D.N.; Drew, J.E. Measurement of positive displacement pump flow ripple and impedance. Proc. Inst. Mech. Eng. J. Syst. Control Eng. 1996, 210, 65–74. [Google Scholar] [CrossRef]
- Manring, N.D.; Zhang, Y. The Improved Volumetric-Efficiency of Axial-Piston Pump Utilizing a Trapped-Volume. J. Dyn. Syst. Meas. Control Trans. ASME 2001, 123, 479–487. [Google Scholar] [CrossRef]
- Manring, N.D. Tipping the Cylinder Block of an Axial-Piston Swash-Plate Type Hydrostatic Machine. J. Dyn. Syst. Meas. Control Trans. ASME 2001, 122, 479–487. [Google Scholar] [CrossRef]
- Zheng, Y.; Long, Q.; Jiahai, H. Research on pulsation characteristics and noise of variable speed and variable displacement dual-control axial piston pumps. Chin. J. Mech. Eng. 2016, 52, 176–184. [Google Scholar]
- Deeken, M. Simulation of fluid power components using DSHplus and ADAMS. In Proceedings of the ASME International Mechanical Engineering Congress and Exposition (IMECE 2001), New York, NY, USA, 11–16 November 2001. [Google Scholar]
- Deeken, M. Simulation of the reversing effect of axial piston pumps using conventional CAE tools. Olhydraulik Pneum. 2002, 6, 315–322. [Google Scholar]
- Roccatello, A.; Manco, S.; Nervegna, N. Modellin a variable displacement axial piston pump in amultibody simulation environment. J. Dyn. Syst. Meas. Control 2007, 129, 456–468. [Google Scholar] [CrossRef]
- Shuo-Xun, L.I.; Zhao, T.S.; Zheng, W.; Dang, B. Study on pressure pulsation parameters of AMESIM based swash plate axial piston pump. Heavy Mach. 2018, 23–26. [Google Scholar] [CrossRef]
- Zhang, R.; Liu, H. Analysis of pulsation characteristics of swash plate axial piston pump based on AMESim. Mach. Tool Hydraul. 2012, 40, 118–120. [Google Scholar]
- Yan, Y.; Shi, Z.; Zheng, L. Analysis of factors affecting flow pulsation of axial piston pump based on AMESim. Hydraul. Pneum. 2014, 2, 104–108. [Google Scholar]
- Wang, Y.; Huang, Y.; Li, S. Vibration analysis and optimization of the outlet pipeline of the aircraft engine drive pump. Hydraul. Pneum. 2020, 115–121. [Google Scholar]
- Qian, W.; Gao, Q.; Li, X.; Zhang, Y. Simulation study on flow pulsation characteristics of axial piston pump based on AMESim. Hydraul. Pneum. 2018, 46, 114–117. [Google Scholar]
- Duan, F.; Cao, K.; Li, Y.; Hu, L. Dynamic characteristics simulation of constant pressure axial piston pump based on AMESim. Mach. Tool Hydraul. 2008, 36, 160–162. [Google Scholar]
- Zhang, D.; Su, M.; Yan, J.; Yu, L. Digital modeling and flow pulsation analysis of hydraulic plunger pump based on AMESim. Coal Mine Mach. 2010, 31, 100–102. [Google Scholar]
- Yang, J. Research on the Dynamic Characteristics of A11VO Axial Piston Pump; Lanzhou University of Technology: Lanzhou, China, 2012. [Google Scholar]
- Chi, Y. Research on Output Flow Pulsation and Dynamic Characteristics of Axial Piston Pump; Shandong University of Science and Technology: Shandong, China, 2017. [Google Scholar]
Figure 1.
Relation coordinate diagram of the plunger swash plate.

Figure 2.
Movement diagram of the single plunger structure.

Figure 3.
Single-plunger model. (a) Single plunger movement law; (b) Plunger; (c) Distribution.

Figure 4.
Dynamic model.

Figure 5.
Load model.

Figure 6.
Overall model of the plunger pump.

Figure 7.
Load pressure (p1 = 4.375 MPa) waveform. (a) Time domain diagram; (b) frequency domain map.
Figure 7.
Load pressure (p1 = 4.375 MPa) waveform. (a) Time domain diagram; (b) frequency domain map.

Figure 8.
Load pressure (p2 = 8.38 MPa) waveform. (a) Time domain diagram; (b) frequency domain map.
Figure 8.
Load pressure (p2 = 8.38 MPa) waveform. (a) Time domain diagram; (b) frequency domain map.

Figure 9.
Load pressure (p3 = 12.87 MPa) waveform. (a) Time domain diagram; (b) frequency domain map.
Figure 9.
Load pressure (p3 = 12.87 MPa) waveform. (a) Time domain diagram; (b) frequency domain map.

Figure 10.
Schematic diagram of the pump source fluid pressure fluctuation test.

Figure 11.
Installation and layout of the fluid pressure sensor at the inlet of the measured pipeline.
Figure 11.
Installation and layout of the fluid pressure sensor at the inlet of the measured pipeline.

Figure 12.
Load pressure (p1 = 4.375 MPa) waveform. (a) Time domain diagram; (b) frequency domain map.
Figure 12.
Load pressure (p1 = 4.375 MPa) waveform. (a) Time domain diagram; (b) frequency domain map.

Figure 13.
Load pressure (p2 = 8.38 MPa) waveform. (a) Time domain diagram; (b) frequency domain map.
Figure 13.
Load pressure (p2 = 8.38 MPa) waveform. (a) Time domain diagram; (b) frequency domain map.

Figure 14.
Load pressure (p3 = 12.87 MPa) waveform. (a) Time domain diagram; (b) frequency domain map.
Figure 14.
Load pressure (p3 = 12.87 MPa) waveform. (a) Time domain diagram; (b) frequency domain map.

Figure 15.
Comparison of the simulation and experiment results. (a) Time domain comparative analysis chart; (b) frequency domain comparative analysis chart.
Figure 15.
Comparison of the simulation and experiment results. (a) Time domain comparative analysis chart; (b) frequency domain comparative analysis chart.

Figure 16.
Comparison of simulation and experiment results. (a) Time domain comparative analysis chart; (b) frequency domain comparative analysis chart.
Figure 16.
Comparison of simulation and experiment results. (a) Time domain comparative analysis chart; (b) frequency domain comparative analysis chart.

Figure 17.
Comparison of simulation and experiment results. (a) Time domain comparative analysis chart; (b) frequency domain comparative analysis chart.
Figure 17.
Comparison of simulation and experiment results. (a) Time domain comparative analysis chart; (b) frequency domain comparative analysis chart.


Table 1.
Parameter setting of the plunger pump model.
| Parameter | Numerical Value | Parameter | Numerical Value |
|---|---|---|---|
| Plunger radius (m) | 0.05 | Cylinder inertia | 0.005 |
| Swash plate inclination (°) | 17 | Motor speed (r/min) | 1800 |
| Number of plungers | 7 | Plunger diameter clearance (mm) | 0.001 |
Table 2.
Numerical simulation of fluid pressure fluctuation and pressure fluctuation rate under different load pressures.
Table 2.
Numerical simulation of fluid pressure fluctuation and pressure fluctuation rate under different load pressures.
| Rotating Speed (r/min) | Load Pressure (MPa) | Greatest Pressure (MPa) | Minimum Pressure (MPa) | Pressure Pulsation Rate (%) |
|---|---|---|---|---|
| 1800 | 4.375 | 4.50 | 4.25 | 5.71 |
| 8.38 | 8.578 | 8.182 | 4.73 | |
| 12.87 | 13.15 | 12.59 | 4.35 |
Table 3.
Frequency doubling amplitude under different load pressures.
| Load Pressure (MPa) | Triple Frequency Amplitude (MPa) | Double Frequency Amplitude (MPa) | Triple Frequency Amplitude (MPa) |
|---|---|---|---|
| 4.375 | 0.068 | 0.039 | 0.017 |
| 8.38 | 0.101 | 0.063 | 0.027 |
| 12.87 | 0.132 | 0.088 | 0.035 |
Table 4.
Main components of the pump source fluid pressure fluctuation test platform.
| System | Name | Model | Performance |
|---|---|---|---|
| Hydraulic system | Electric motor | YX3-180M | rated power 18.5 kW |
| Plunger pump | MCY14-1B | maximum pressure 31.5 MPa, nominal displacement 25 mL/r | |
| Frequency converter | SD100-4T-18.5 | adapt to 18.5 kW motor | |
| Throttle valve | DVP16-1-10B | maximum pressure 35 MPa, maximum flow 100 L/min | |
| Relief valve | ZDB10VP-1-40B | maximum pressure 31.5 MPa, maximum 60 L/min | |
| Test system | Pressure Sensor | CY-YD-205 | reference sensitivity 12.09 Pc/105Pa, pressure measurement range 0–30 MPa |
| Impedance converter | YE5857A-1 | sensitivity coefficient 0.990, output range 5 Vpp | |
| Data collector | SC-XS12-A | 8 channels, the sampling frequency of a single channel can reach 50 kHz | |
| Piping system | Straight | 12 × 2.0 | the outer diameter is 12 mm, the inner diameter is 10 mm, the length is 530 mm, and the weight is 163.7 g |
| Clamp | S10.9.3816/S10.9.3817 | inner diameter 12 mm, crotch distance 21 mm, bolt hole diameter 6 mm | |
| Hose | 5-10FDLX | greatest pressure 21 MPa | |
| Sensor tee | 10MDL-10FM-10MDL | Thread M10 × 1 |
Table 5.
Comparative analysis of the fluid pressure fluctuation value and pressure fluctuation rate.
Table 5.
Comparative analysis of the fluid pressure fluctuation value and pressure fluctuation rate.
| Greatest Pressure (MPa) | Minimum Pressure (MPa) | Pressure Pulsation Rate (%) | |
|---|---|---|---|
| experiment | 4.487 | 4.259 | 5.1 |
| simulation | 4.50 | 4.250 | 5.7 |
Table 6.
Frequency comparison analysis.
| Frequency Multiplication | Experiment Frequency (Hz) | Simulation Frequency (Hz) | Error (%) |
|---|---|---|---|
| 1 | 213.3 | 211 | 1.1 |
| 2 | 426.2 | 419.9 | 1.5 |
| 3 | 639.3 | 631 | 1.3 |
Table 7.
Comparative analysis of the fluid pressure fluctuation value and pressure fluctuation rate.
Table 7.
Comparative analysis of the fluid pressure fluctuation value and pressure fluctuation rate.
| Greatest Pressure (MPa) | Minimum Pressure (MPa) | Pressure Pulsation Rate (%) | |
|---|---|---|---|
| experiment | 8.556 | 8.241 | 3.8 |
| simulation | 8.578 | 8.182 | 4.7 |
Table 8.
Frequency comparison analysis.
| Frequency Multiplication | Experiment Frequency (Hz) | Simulation Frequency (Hz) | Error (%) |
|---|---|---|---|
| 1 | 210.5 | 211.3 | 0.4 |
| 2 | 421.1 | 419.9 | 0.3 |
| 3 | 631.5 | 631.2 | 0.05 |
Table 9.
Comparative analysis of the fluid pressure fluctuation value and pressure fluctuation rate.
Table 9.
Comparative analysis of the fluid pressure fluctuation value and pressure fluctuation rate.
| Greatest Pressure (MPa) | Minimum Pressure (MPa) | Pressure Pulsation Rate (%) | |
|---|---|---|---|
| experiment | 13.02 | 12.66 | 3 |
| simulation | 13.15 | 12.59 | 4.4 |
Table 10.
Frequency comparison analysis.
| Frequency Multiplication | Experiment Frequency (Hz) | Simulation Frequency (Hz) | Error (%) |
|---|---|---|---|
| 1 | 207.1 | 211.4 | 2 |
| 2 | 414.1 | 420 | 1.3 |
| 3 | 621.2 | 631.4 | 1.6 |
Publisher’s Note: MDPI stays neutral with regard to jurisdictional claims in published maps and institutional affiliations. |
© 2021 by the authors. Licensee MDPI, Basel, Switzerland. This article is an open access article distributed under the terms and conditions of the Creative Commons Attribution (CC BY) license (https://creativecommons.org/licenses/by/4.0/).
Share and Cite
MDPI and ACS Style
Lin, J.; Wang, Y.; Zhou, S.; Wu, W.; Ma, H.; Han, Q. Simulation and Experimental Analysis of Pressure Pulsation Characteristics of Pump Source Fluid. Appl. Sci. 2021, 11, 9559. https://0-doi-org.brum.beds.ac.uk/10.3390/app11209559
AMA Style
Lin J, Wang Y, Zhou S, Wu W, Ma H, Han Q. Simulation and Experimental Analysis of Pressure Pulsation Characteristics of Pump Source Fluid. Applied Sciences. 2021; 11(20):9559. https://0-doi-org.brum.beds.ac.uk/10.3390/app11209559
Chicago/Turabian StyleLin, Junzhe, Yuanyuan Wang, Shenghao Zhou, Wenjie Wu, Hui Ma, and Qingkai Han. 2021. "Simulation and Experimental Analysis of Pressure Pulsation Characteristics of Pump Source Fluid" Applied Sciences 11, no. 20: 9559. https://0-doi-org.brum.beds.ac.uk/10.3390/app11209559
Note that from the first issue of 2016, this journal uses article numbers instead of page numbers. See further details here.