
Development of Multi-Item Air Quality Monitoring System Based on Real-Time Data


1
Korea Environmental Technology Co., Ltd., 12, Oncheoncheon-ro 319st, Dongnae-gu, Busan 47887, Korea
2
International Environmental Technology Co., Ltd., 56, Daejeojungang-ro 394, Beonga-gil, Gangseo-gu, Busan 46702, Korea
*
Author to whom correspondence should be addressed.
Appl. Sci. 2021, 11(20), 9747; https://0-doi-org.brum.beds.ac.uk/10.3390/app11209747
Submission received: 17 September 2021
/
Revised: 8 October 2021
/
Accepted: 8 October 2021
/
Published: 19 October 2021
(This article belongs to the Special Issue Advances in Gaseous and Particulate Air Pollutants Measurement)
Abstract
:Many air pollutants are inhaled by human breathing, increasing the prevalence of respiratory disease and even mortality. With the recent COVID-19 issue, the number of air pollutants affecting humans is demands further investigation. However, there are not many adequate air measuring devices that can cover a variety of air pollutants. In this study, the developed air measurement system is able to measure sixteen air pollutants (PM10, PM2.5, PM4.0, PM1.0, CO2, CH4, temperature, humidity, VOCs, O2, H2S, NH3, SO2, CO, O3, NO2) in real time. The developed ‘multi-item air quality monitoring system’ can measure sixteen air pollutants in real time and transmit them to the server and the smartphone application at the same time. It was developed to reduce air pollutant damage to humans by emergency alerts using the smartphone application. The development system is composed of hardware development (measurement device) and software development (smartphone application, server). To verify the reliability of the developed equipment, a comparative test, temperature–humidity accuracy test, and operating temperature test were conducted. In the comparative test, difference ratios of ±5% for PM10, ±6% for PM2.5, ±4% for O3, ±5% for NO2, ±7% for CO, and ±7% for SO2 were found compared to the professional measuring devices. The temperature and humidity accuracy test result showed high reliability at ±1% and humidity ± 2%. The result of the operating temperature test showed that there was no problem in normal operation, However, further tests including the long-term comparative test and the closed chamber test will be carried out for all sensors. Additional work including a long-term test for more clear reliability of the device and closed chamber accuracy test for all 16-item sensors, data acquisition rate, and data transmit rate are in progress for commercializing the device.
1. Introduction
The risks posed by air pollution lead to side effects such as poor public health and increased mortality [1]. According to the World Health Organization (WHO), 4.2 million people die each year from outdoor air pollution and 3.8 million people die from indoor air pollution [2]. The premature mortality rate from air pollution is expected to double by 2050, which is recognized as the world’s most serious environmental and health threat [3]. Particles smaller than 2.5 μm are called ultra-particulate matter, which float in the air and can be easily inhaled by humans. They affect premature death and may travel intercontinentally, affecting air quality and public health [4]. Bourdrel et al. (2021) reported that air pollution affects chronic disease and may be associated with increased mortality associated with COVID-19, and that exposure to air pollution reduces immune responses, promoting virus penetration and replication [5].
The size of the dust particles varies from a few nanometers to several tens of micrometers; however, generally, in the literature, the first particles are less than 2.5 μm, the second particles are between 2.5 μm to 10 μm, and the third particles are up to 100 μm [6]. Kelly et al. (2012) reported the toxicity of particulate matter (PM), as they penetrate the alveoli and bronchi and are deposited mainly in the bronchi and are filtered by the pharynx [7]. Stanaway et al. (2018) reported that the exposure to particulate matter less than 2.5 μm in diameter decreased the world average life span in 2016 by more than 1 year [8]. Particles less than 1.0 μm in diameter negatively affect the air–blood barrier near the lungs and cause illnesses such as stroke, lung cancer, chronic obstructive pulmonary disease, and respiratory infections [9]. Rizzato et al. (2020) concluded that particulate matter can have a devastating effect on vulnerable groups, including the elderly, pregnant women, and children, and it appears that it is closely related to mortality [9].
Combustion gases such as gaseous carbon monoxide, carbon dioxide, NOx, SO2, and volatile organic compounds negatively affect the air quality and the human living environment [10]. Carbon monoxide is a product of the incomplete combustion of fossil fuels and causes poisoning [11]. Carbon dioxide exists in a relatively high concentration in the air and is used for the human body such as in carbonated drinks and fire extinguishers, but it is also a product of fossil fuel combustion and is a substance that absorbs infrared rays and causes a greenhouse effect [12]. Nitrogen oxides are generated by the combustion of fossil fuels in engines and industrial processes, and NO2 is toxic and may cause lung-related health deterioration [13]. Sulfur dioxide mainly occurs in industrial activities and not only irritates the airways but also affects acid rain [1]. As hazardous chemicals such as volatile organic compounds, propanol, and toluene, they exhibit high vapor pressure at room temperature and can be dispersed in certain concentrations in the air, causing air pollution [14]. Methane is colorless, odorless, and non-toxic, but at high concentrations, it causes the risk of asphyxiation and explosion due to oxygen depletion [9].
For this reason, real-time measurement and monitoring is very important to identify air quality problems. Suganya et al. (2021) developed an IOT-based air monitoring device that can measure O3, SO2, and CO [15]. Kim et al. (2014) developed a measuring instrument that can measure CO2, VOCs, SO2, NOx, CO, PM, and ozone to check indoor air quality in real time and developed factors that change indoor air quality (wind, location, airflow, density, and size) were investigated [16]. Sung and Hsiao (2021) developed an IOT smart air control system that is transmitted in real time through Wi-Fi using PM, CO, and CO2 sensors [17]. Recently, many commercial air quality measuring devices have been released for real time air quality measurement [18,19]. Particle counters that measure particulate matter are developed in various ways from low-cost products to high-priced products [18,19]. Recently, not only particulate matter but also various types of air quality measuring devices such as particulate matter (PM), volatile organic compounds (VOCs), CO2, temperature, and humidity have been released [20,21,22,23,24,25,26,27]. The low-cost multi-item device can measure PM, temperature, humidity, carbon dioxide, and total organic compounds and provides measured data to consumers through the IOT linkage function [20,21,22,23]. However, low-cost air quality measurements are not used for professional environmental measuring services due to issues with the accuracy and reliability of sensors. On the other hand, professional environmental measurements with high-precision sensors are rarely applied to IOT linkage, so they cannot provide real-time data to users [24,26]. Gas detectors widely used in the field rarely have IOT functions [26,27]. Professional environmental measuring equipment with good accuracy has many inconvenient factors such as a small number of items, lack of IOT function, and the inconvenience of measurement, size, and weight. To overcome these disadvantages, this study was developed with the three goals of expanding the measurement items, improving the accuracy of the measurement device, and increasing the convenience through a smartphone application and a server. To expand the measurement items, we developed a technology that can install a sensor capable of measuring 16 items with high precision in a small space. To improve the accuracy of the measuring device, a high-precision sensor was used, automatic and manual calibration of the sensor was enabled, and a constant current was developed to reduce the error of the sensor and achieve the optimal air flow. To increase convenience, a smartphone application was developed, and a server program was developed so that users could control and monitor from their smartphones and computers.
The developed device in this study consists of 16 air pollutant items including PM(PM10, PM4.0, PM2.5, PM1.0), carbon dioxide (CO2), methane (CH4), temperature, humidity, volatile organic compounds (VOCs), oxygen (O2), hydrogen sulfide (H2S), ammonia (NH3), sulfur dioxide (SO2), carbon monoxide (CO), ozone (O3), and nitrogen dioxide (NO2) can be measured in real time. The data of 16 measured items are transmitted to the server and the smartphone application through Bluetooth and Wi-Fi. Based on the transmitted data, it was developed to identify the concentration of air pollution. When the air pollution concentration is high, it is developed to warn of a risk to the user using an emergency alert.
2. Materials and Methods
2.1. Process of Multi-Item Air Quality Monitoring System
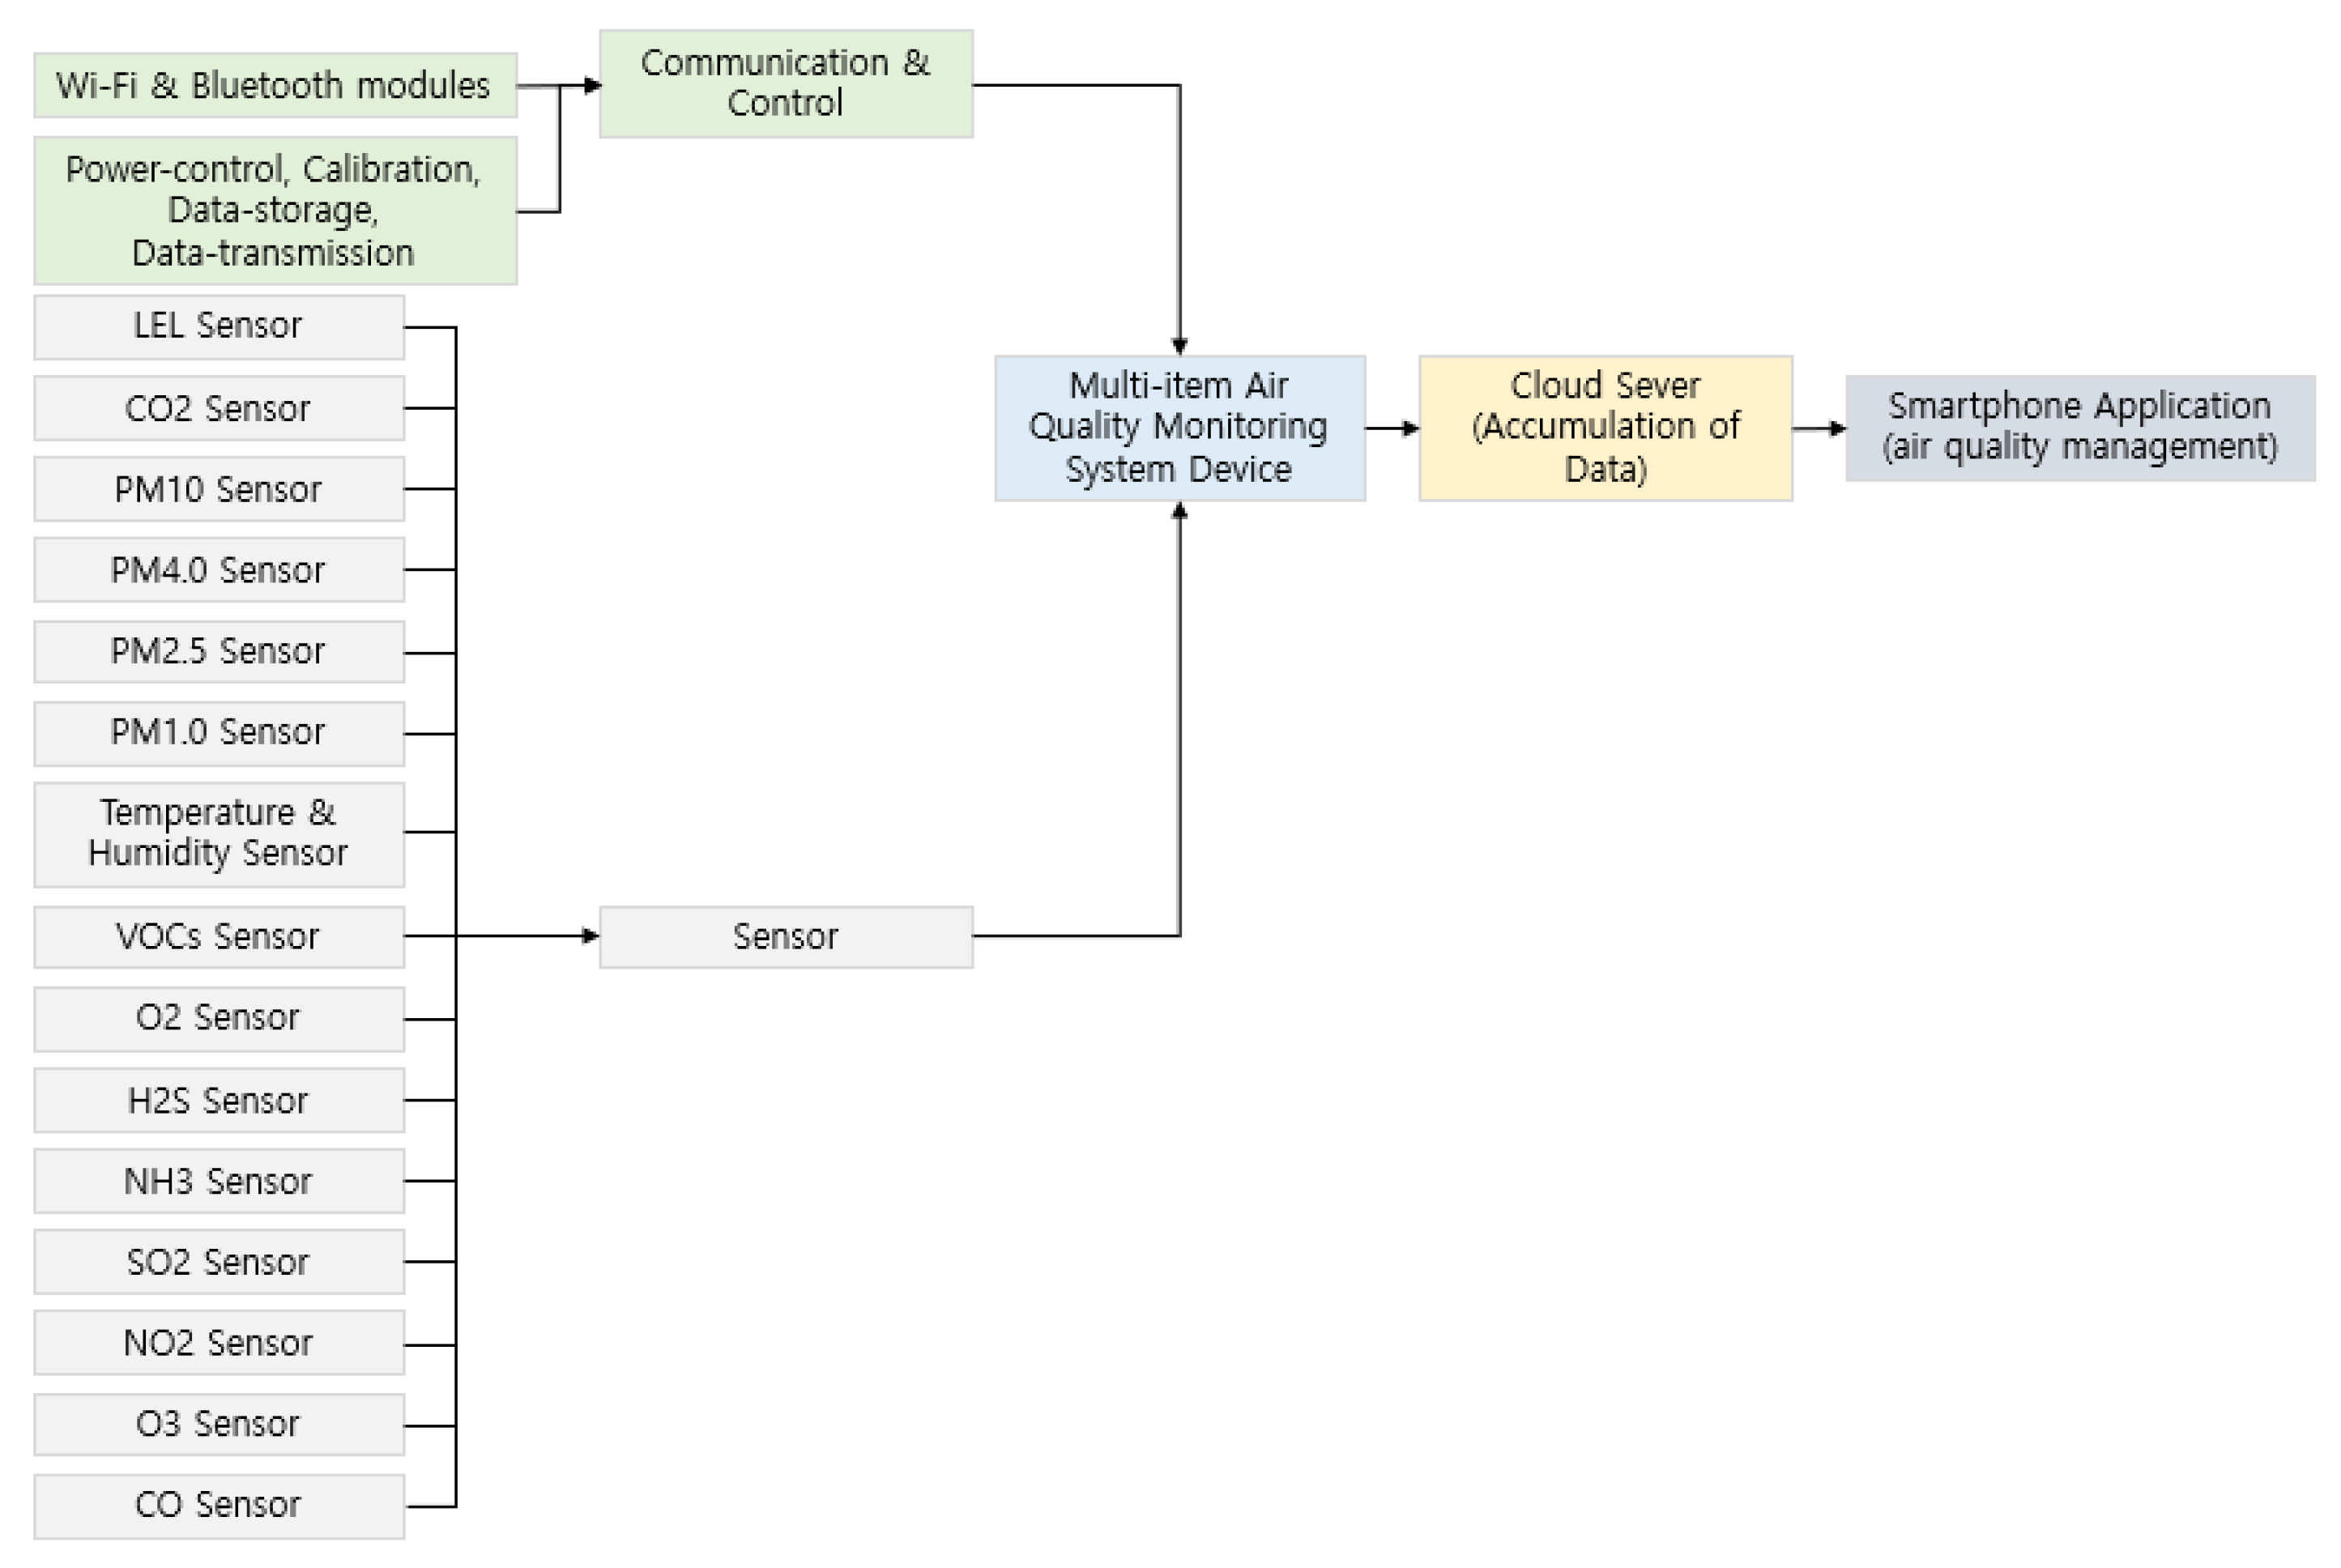
A multi-item air quality monitoring system component consists of a hardware part and a software part. The hardware part consists of a sensor unit and a communication control unit. The sensor unit consists of a total of 16 items: PM10, PM2.5, PM4.0, PM1.0, CO2, CH4, temperature, humidity, VOCs, O2, H2S, NH3, SO2, NO2, O3, and CO. The total number of installed sensors are eleven. The communication unit consists of a Wi-Fi module and a Bluetooth module. The software part consists of a web program and a smartphone application. The measurement process is that the sensor unit of the hardware part measures 16 air pollution items, the measured data are transmitted to the cloud server through the communication unit, and the cloud service is transmitted to the smartphone application and the web program.
Measured data can be saved in USB memory and a server at the same time during air quality measurement. In the smartphone application and web program, real-time measurement data can be checked daily and monthly, and an emergency alert can be transmitted to the user when the air pollution level is high. These monitoring and alerting systems have been studied by many researchers. Feenstra et al. (2020) developed an open-source R package to meet data science needs of community air sensor networks [28]. The program allows users to access historical data, add spatial meta data, and create maps and plots for viewing community monitoring data [28]. Larkin et al. (2015) developed a smartphone software package for predicting air pollutant concentrations at mobile locations. They observed PM10 and PM2.5 [29]. Sung et al. (2019) developed a smart air quality monitoring system that measures the PM10, PM2.5, PM1.0, CO, CO2, VOCs, temperature, and humidity. They connected the developed monitoring system to the smartphone application [30]. A schematic diagram of the developed multi-item air quality monitoring system is shown in Figure 1.
2.2. Hardware Process of Multi-Item Air Quality Monitoring System
The hardware part of the multi-item air quality monitoring system is divided into a sensor part and a communication part. The sensor unit includes nine sensors including a PM sensor, a temperature and humidity sensor, a VOC sensor, an oxygen sensor, a hydrogen sulfide sensor, an ammonia sensor, a sulfur dioxide sensor, a nitrogen dioxide sensor, an ozone sensor, and a carbon monoxide sensor. The carbon dioxide and methane sensors are attached to the separated probe rod and used in connection with the main device. Detailed sensor specifications can be found in Table 1. The PM sensor can measure the PM1.0, PM2.5, PM4.0, PM10 from 0 to 1000 μg/m3 in real time by a light scattering method. The carbon dioxide and methane sensor use the non-dispersive infrared absorption (NDIR) method, and the measurement range is 400 ppm to 10,000 ppm for carbon dioxide and 0 ppm to 50,000 ppm for methane. The oxygen sensor measures 0 to 25% oxygen electrochemically. The hydrogen sulfide sensor uses an electrochemical method, and the measurement range is 0 to 100 ppm. The ammonia sensor uses an electrochemical method, and the measurement range is 0 to 100 ppm. The sulfur dioxide sensor based on the electrochemical method can measure 0 to 20 ppm. Ozone can be measured from 0 to 20 ppm electrochemically. CO based on the electrochemical method can measure from 0 to 100%. The volatile organic compound sensor can measure 0 to 60,000 ppb in the electrochemical method. The temperature and humidity sensor measures the temperature from −40 °C to 125 °C and the humidity from 0% to 100%. The communication control unit is equipped with Bluetooth and Wi-Fi modules for short- and medium-range communication and a USB memory storage module for data storage. The Wi-Fi module has a communication distance of about 500 m or more in low power. For the Bluetooth module, Bluetooth 4.2 NRF52832 Module, which has been verified for commercialization, is used.
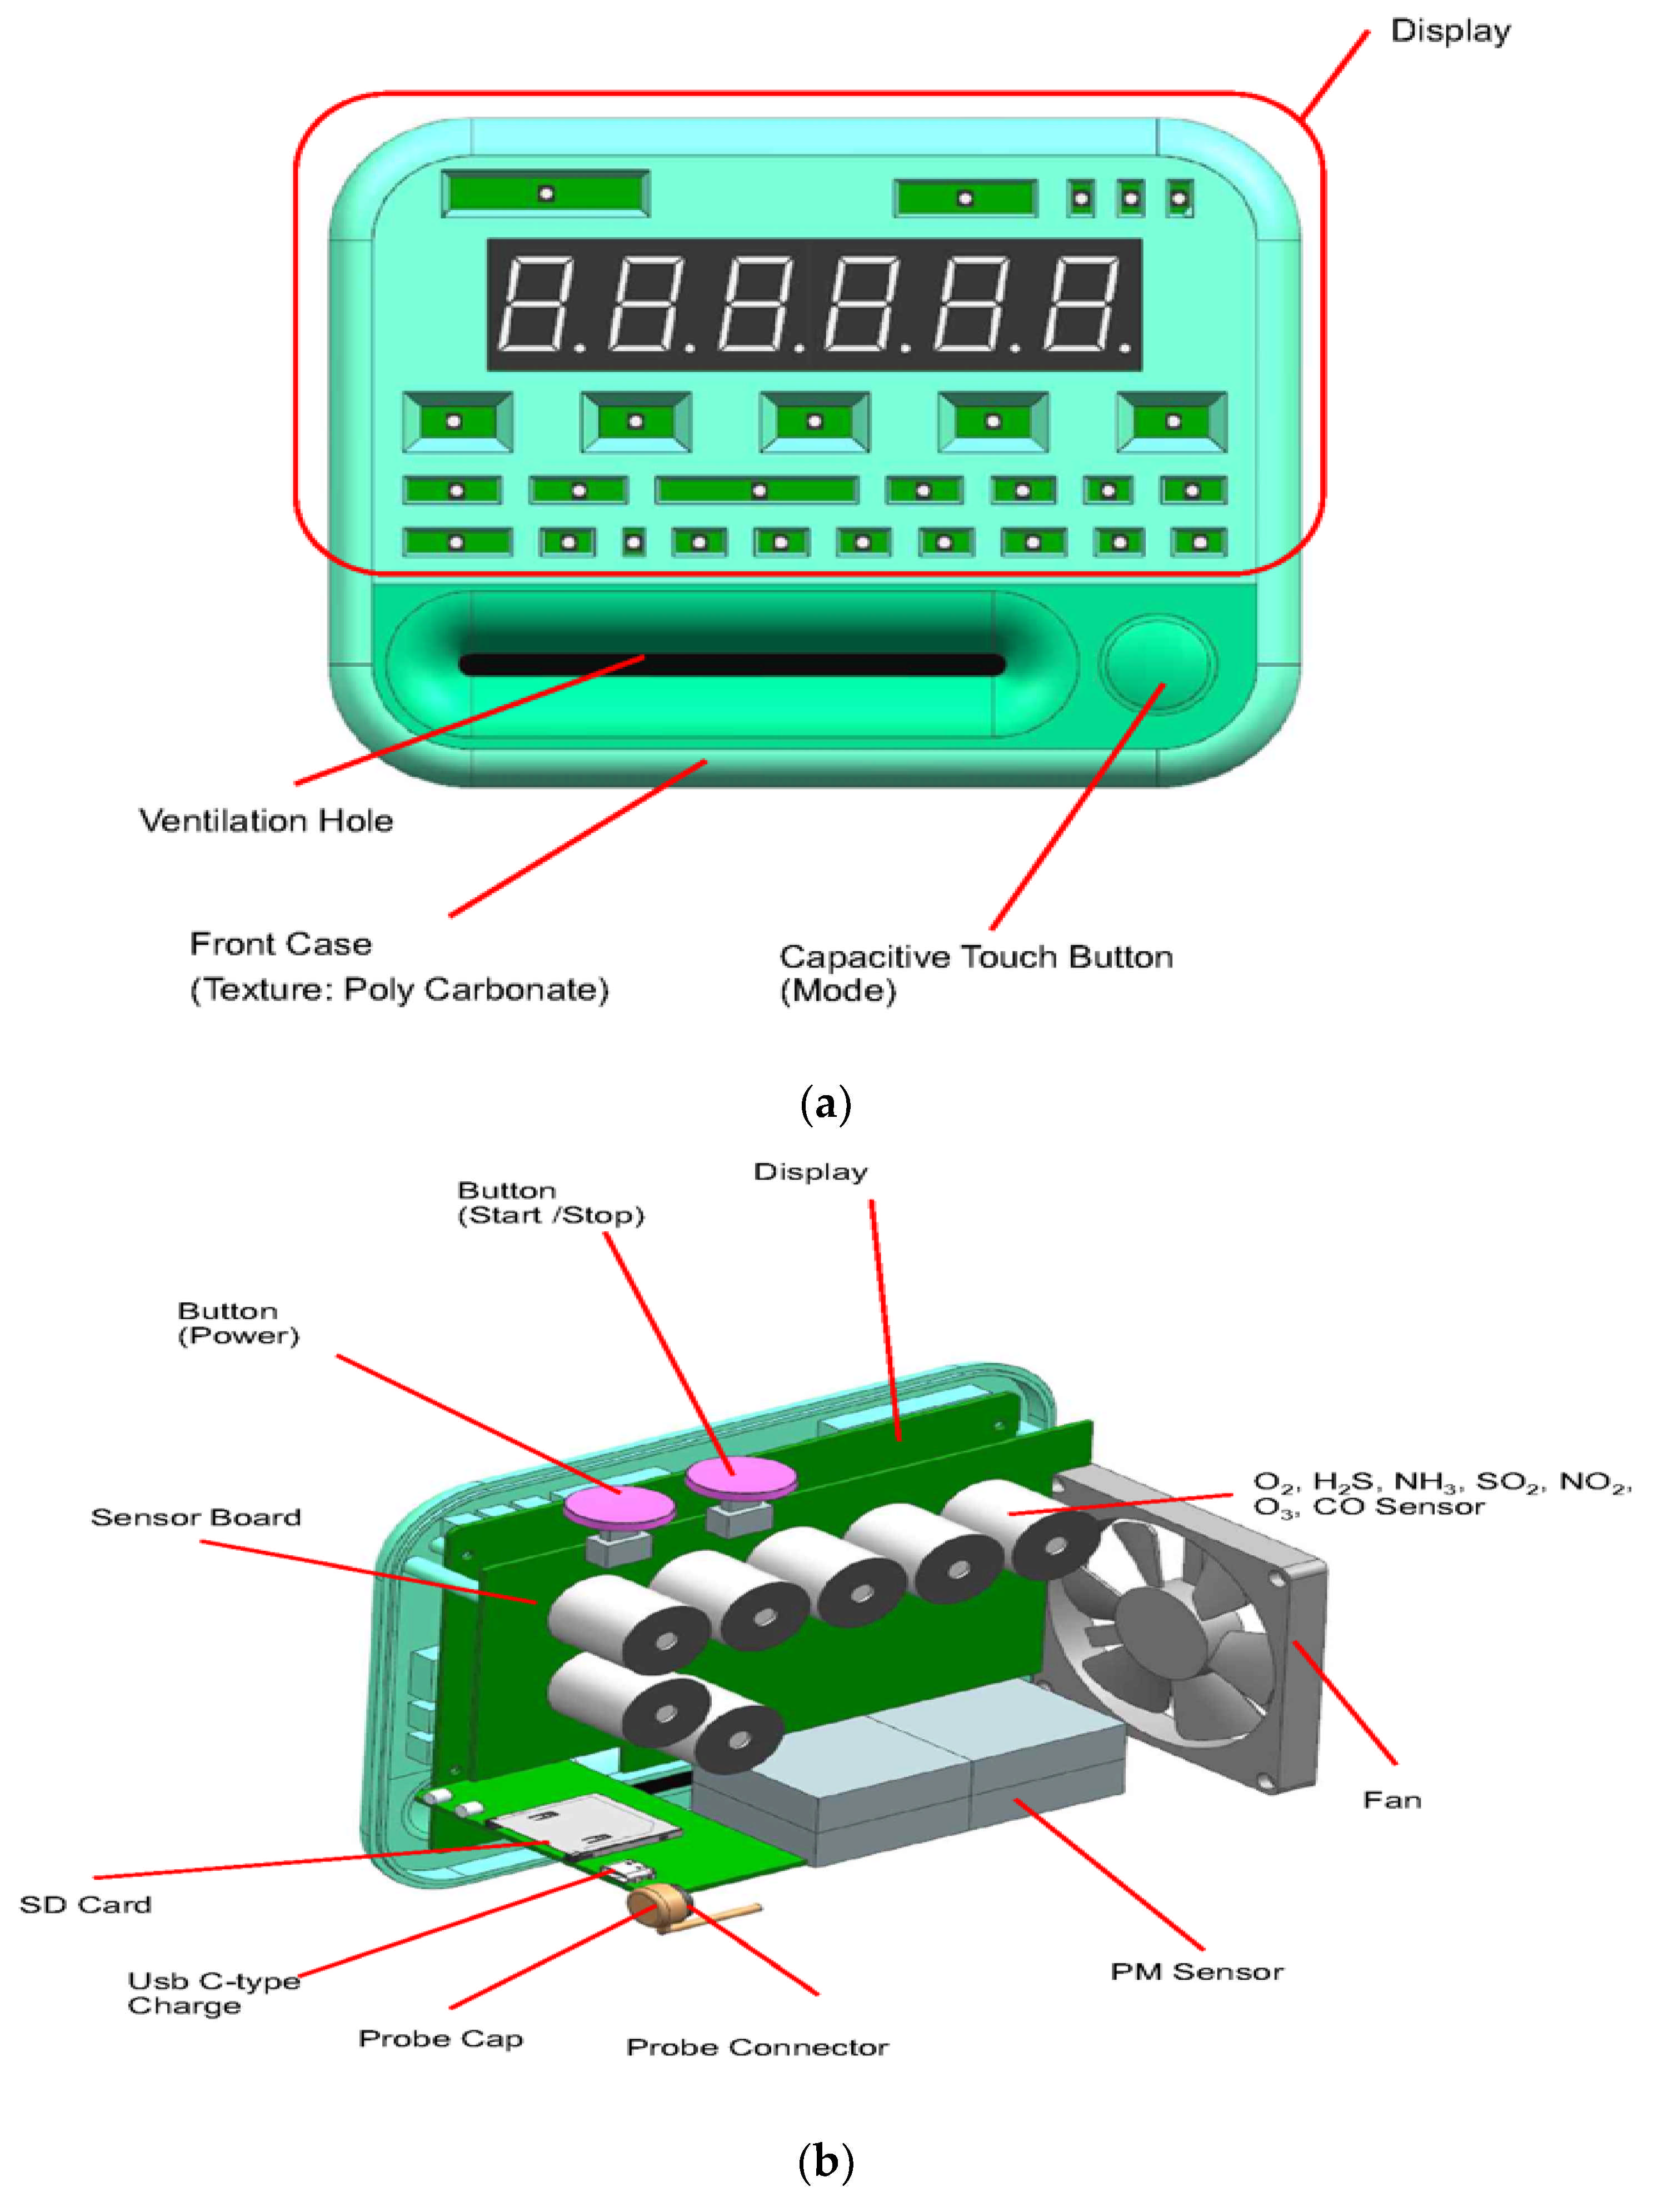
Figure 2 shows the external and internal design of the developed monitoring system. The exterior design is shown in Figure 2a. The material of the front case is made of hard polycarbonate. The display shows the measurement value, measurement item, time, operation status, and logo. The ventilation hole was installed to inhale PM and not interfere with other sensors. A capacitive touch button allows the measurement items displayed on the LED display to be changed by touching the button. The interior design is shown in Figure 2b. The main board is designed to make it easy to attach and replace sensors, to attach many sensors to a minimum area, and to avoid interference. The button part was installed by dividing it into a power button and an operation button. It is designed with an interval of 20 mm so that there is no interference between the display board and the main board. For adequate measurement, a fan was introduced to control the air flow. For the power supply, C-type was introduced to make it compatible with existing portable electronic products. The SD card slot was designed to store data on the SD card.
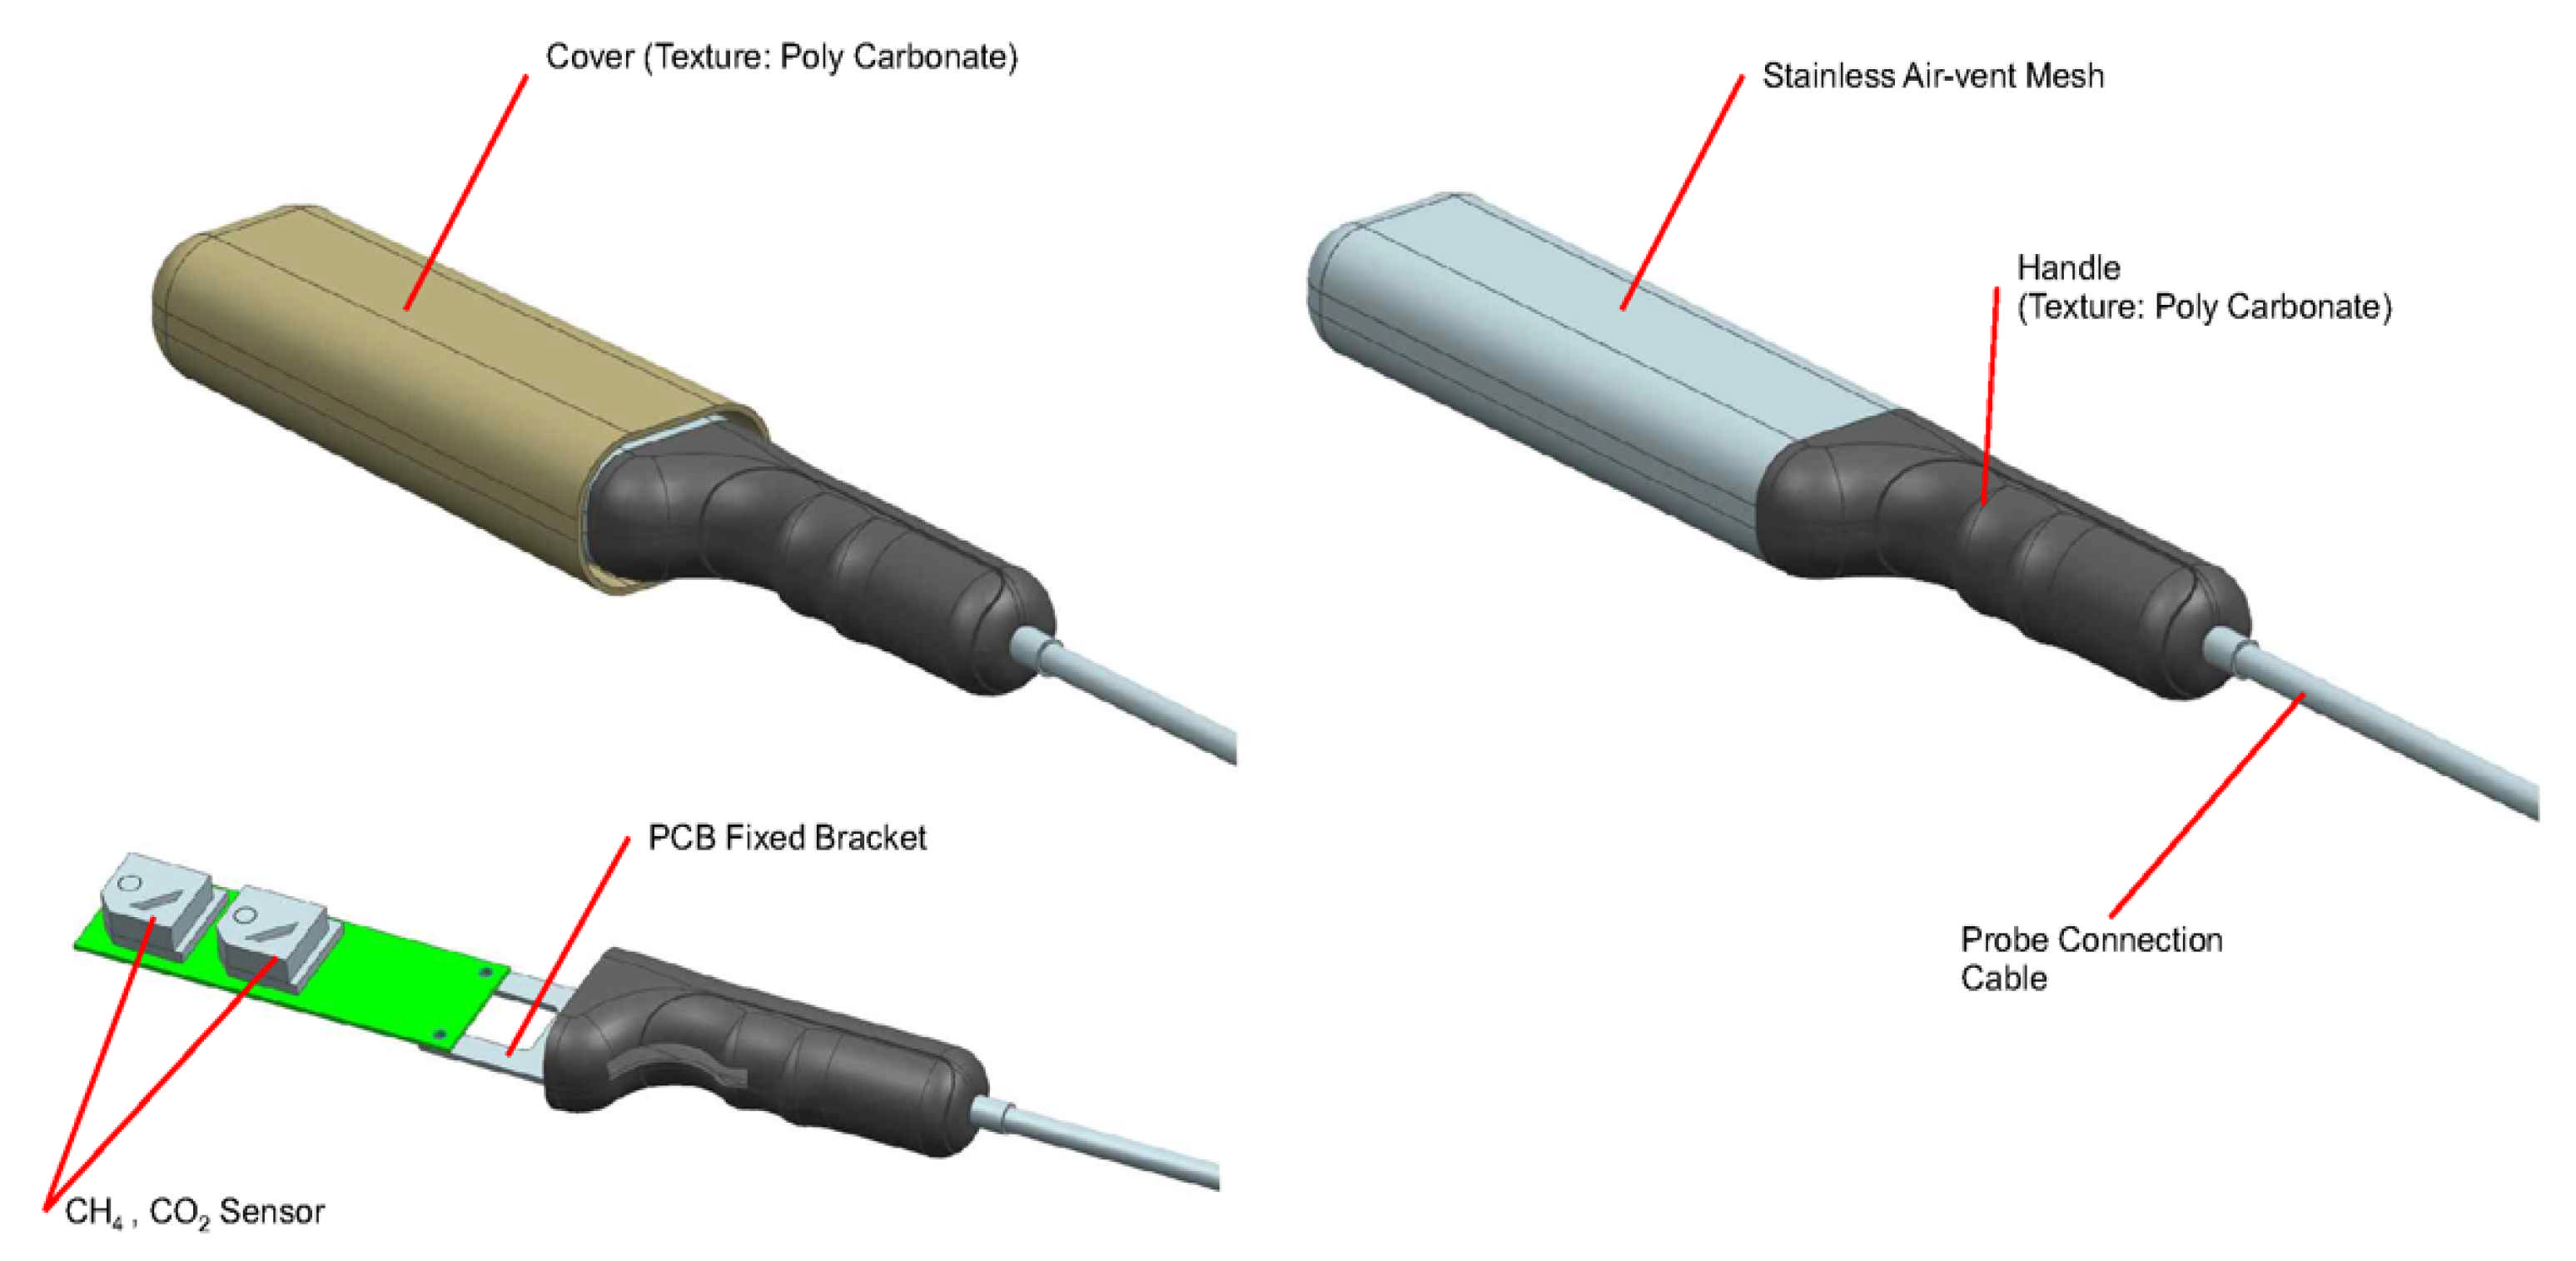
The methane sensor and carbon dioxide sensor were separately manufactured in the form of a probe rod so that they could be connected to the main device for measurement. A detailed picture is shown in Figure 3. The plastic used in the production was made of polycarbonate, which is a heat-resistant plastic. The measuring part is made of stainless steel and has a ventilation hole so that there is no problem in measurement, even in high heat.
The biggest advantage of the developed measuring device is that it can measure many items at once, and the number of measurement items can be adjusted according to the user’s needs through easy attachment and detachment of the sensor.
2.3. Software Process of Multi-Item Air Quality Monitoring System
In the software part, the data measured by the multi-item air quality monitoring system is stored in the server, and the stored data is transmitted to the user in real time through a smartphone application.
The structural diagram of the smartphone application is shown in Figure 4. The application diagram can be divided into three main parts: the main home part, the main measurement part, and the management part. To use the main home, the user needs to register as a member and can find out where the device is installed through the map function. After setting the location, the user can register their device to activate the main home. During this process, the wireless communication of the device is activated, and the measurement data is set up to be transmitted to the server. In the main measurement, the user can see the graph according to the measurement items, and the data can be viewed by month and day separately. The management page provides features that correspond to preferences and customer support.
Depending on the degree of pollution, the smartphone application can provide an alert notification for each pollutant source. The warning notification is delivered to the user according to the pollution level for each item in Table 2. The pollution level was applied with reference to the WHO Indoor Air Quality Guidelines [27]. The degree of contamination for the measurement items was expressed in three levels: normal, bad, and very bad. When each item changes to a bad level, a push notification pops up to inform the users about the current air quality. This function is developed to minimize damages to users due to polluted air environments. Jo et al. (2020) developed indoor air quality information by the device measuring the aerosols, VOC, CO, CO2, temperature, and humidity through web servers and applications. In addition, a quick alert system was introduced to minimize damage to the indoor air quality [31]. Peladarinos et al. (2021) developed an early warning system for COVID-19 infection using an air quality measurement system [32].
The developed server operates a web program to manage the air quality measurement devices and measurement data of sixteen air quality items. The web program supports management, data collection, device operation status, and user support services.
3. Results and Discussion
According to the purpose of the multi-item air quality monitoring system, this section was produced by dividing the results into the hardware production result, the software production, and the reliability tests.
3.1. Hardware Fabrication of Multi-Item Air Quality Monitoring System
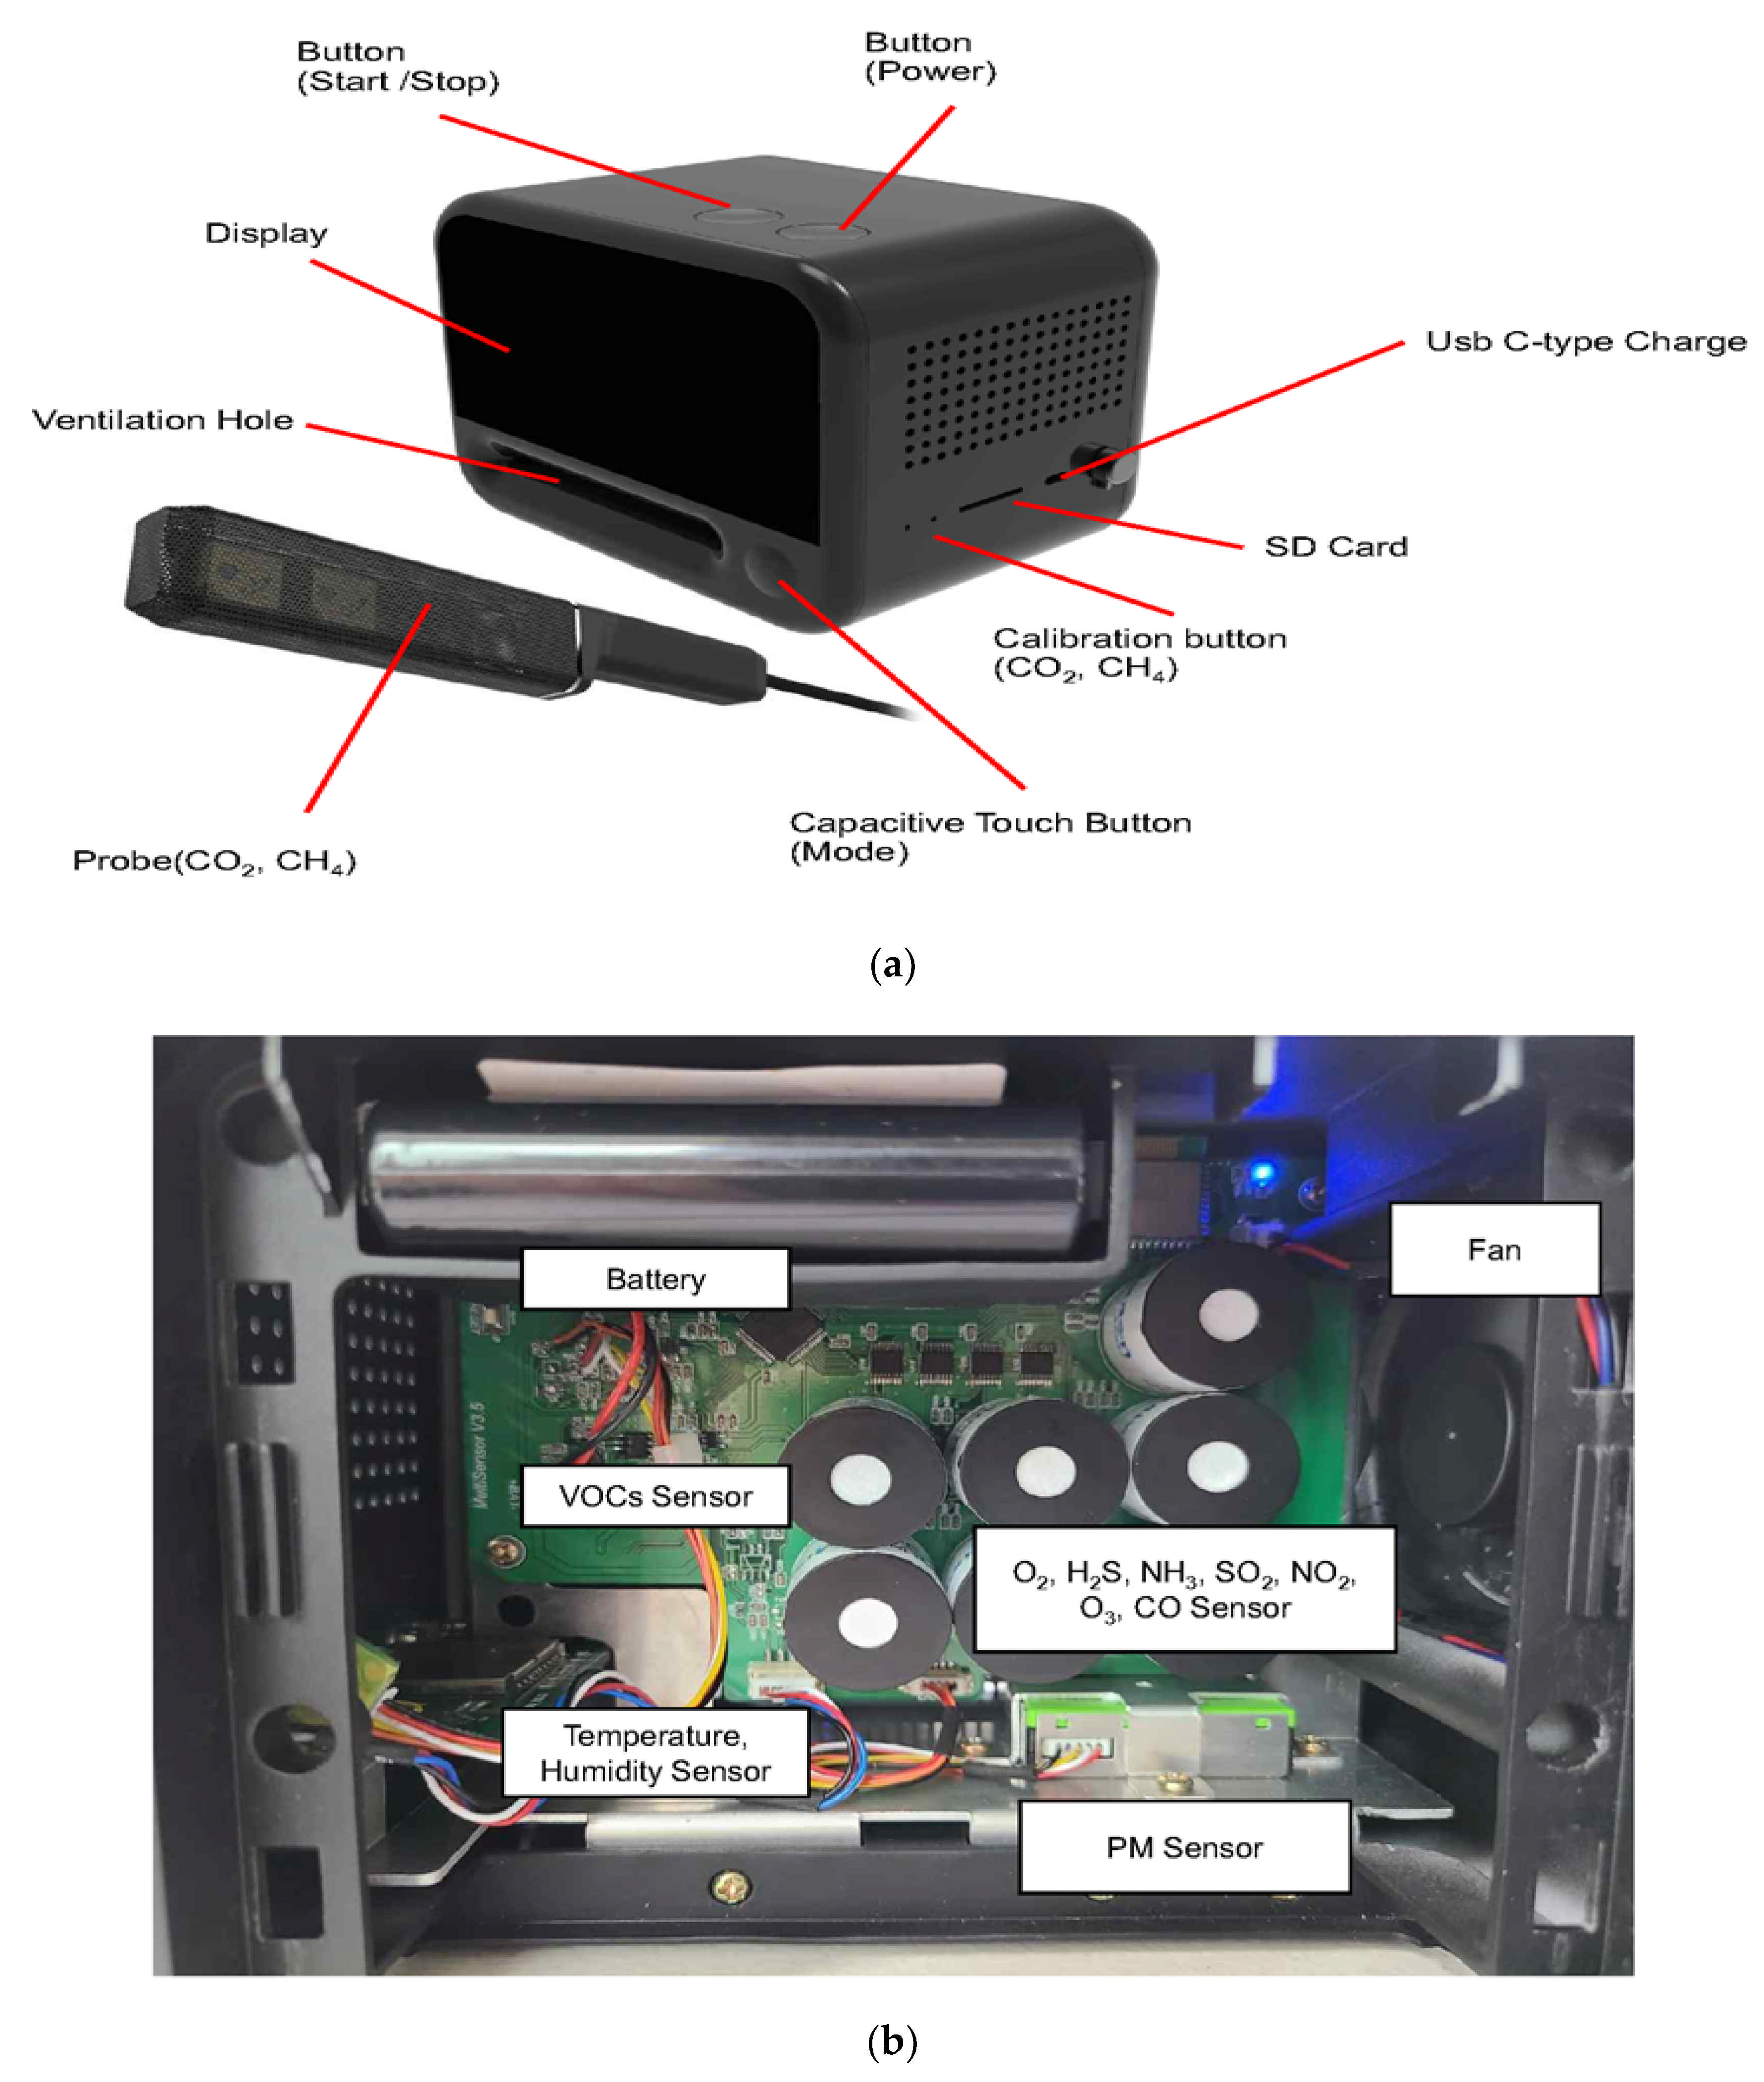
According to the hardware design of 2.2, a multi-atmospheric measuring device was manufactured, and the details are shown in Figure 5. O2, H2S, NH3, SO2, NO2, O3, and CO sensors are manufactured to fit into one board using the minimum area. The VOC sensor generates heat, so it was installed in a little gap. The temperature and humidity sensor were located next to the vent to avoid interference from the inside generated heat. The particle matter sensor was installed separately below to avoid interference with other sensors. CO2 and CH4 sensors were installed on the separate probe rod so that it could be connected to the main device. The fan is designed to maintain proper airflow. The battery, PWS1S2P-7.0A, with a capacity of 7000 Am, was installed inside of the main device. The battery help measuring a device for 24 h without power. The operation step is to press the on/off button to turn on the device; the device then starts measuring all items and transmits the measured data to the server. When the start/stop button is pressed, the measured information is automatically saved to the server and SD card once per minute. The front MODE button is a touch button, and each time it is touch, the value of the currently measured item can be checked sequentially on the front LED display. The sixteen items to be measured are automatically calibrated, but a manual calibration function is installed in the smartphone application to make it more accurate. The calibration function has a very important effect on the accuracy or precision of the measuring instrument [33]. Manual calibration was made with an arithmetic algorithm to obtain a zero-value using standard gas. The communication unit averages the measured data using Bluetooth and Wi-Fi at 1 min intervals and stores the data in the server and SD card. Figure 5 shows the exterior and interior of the manufactured measuring device.
3.2. Software Fabrication of Multi-Item Air Quality Monitoring System
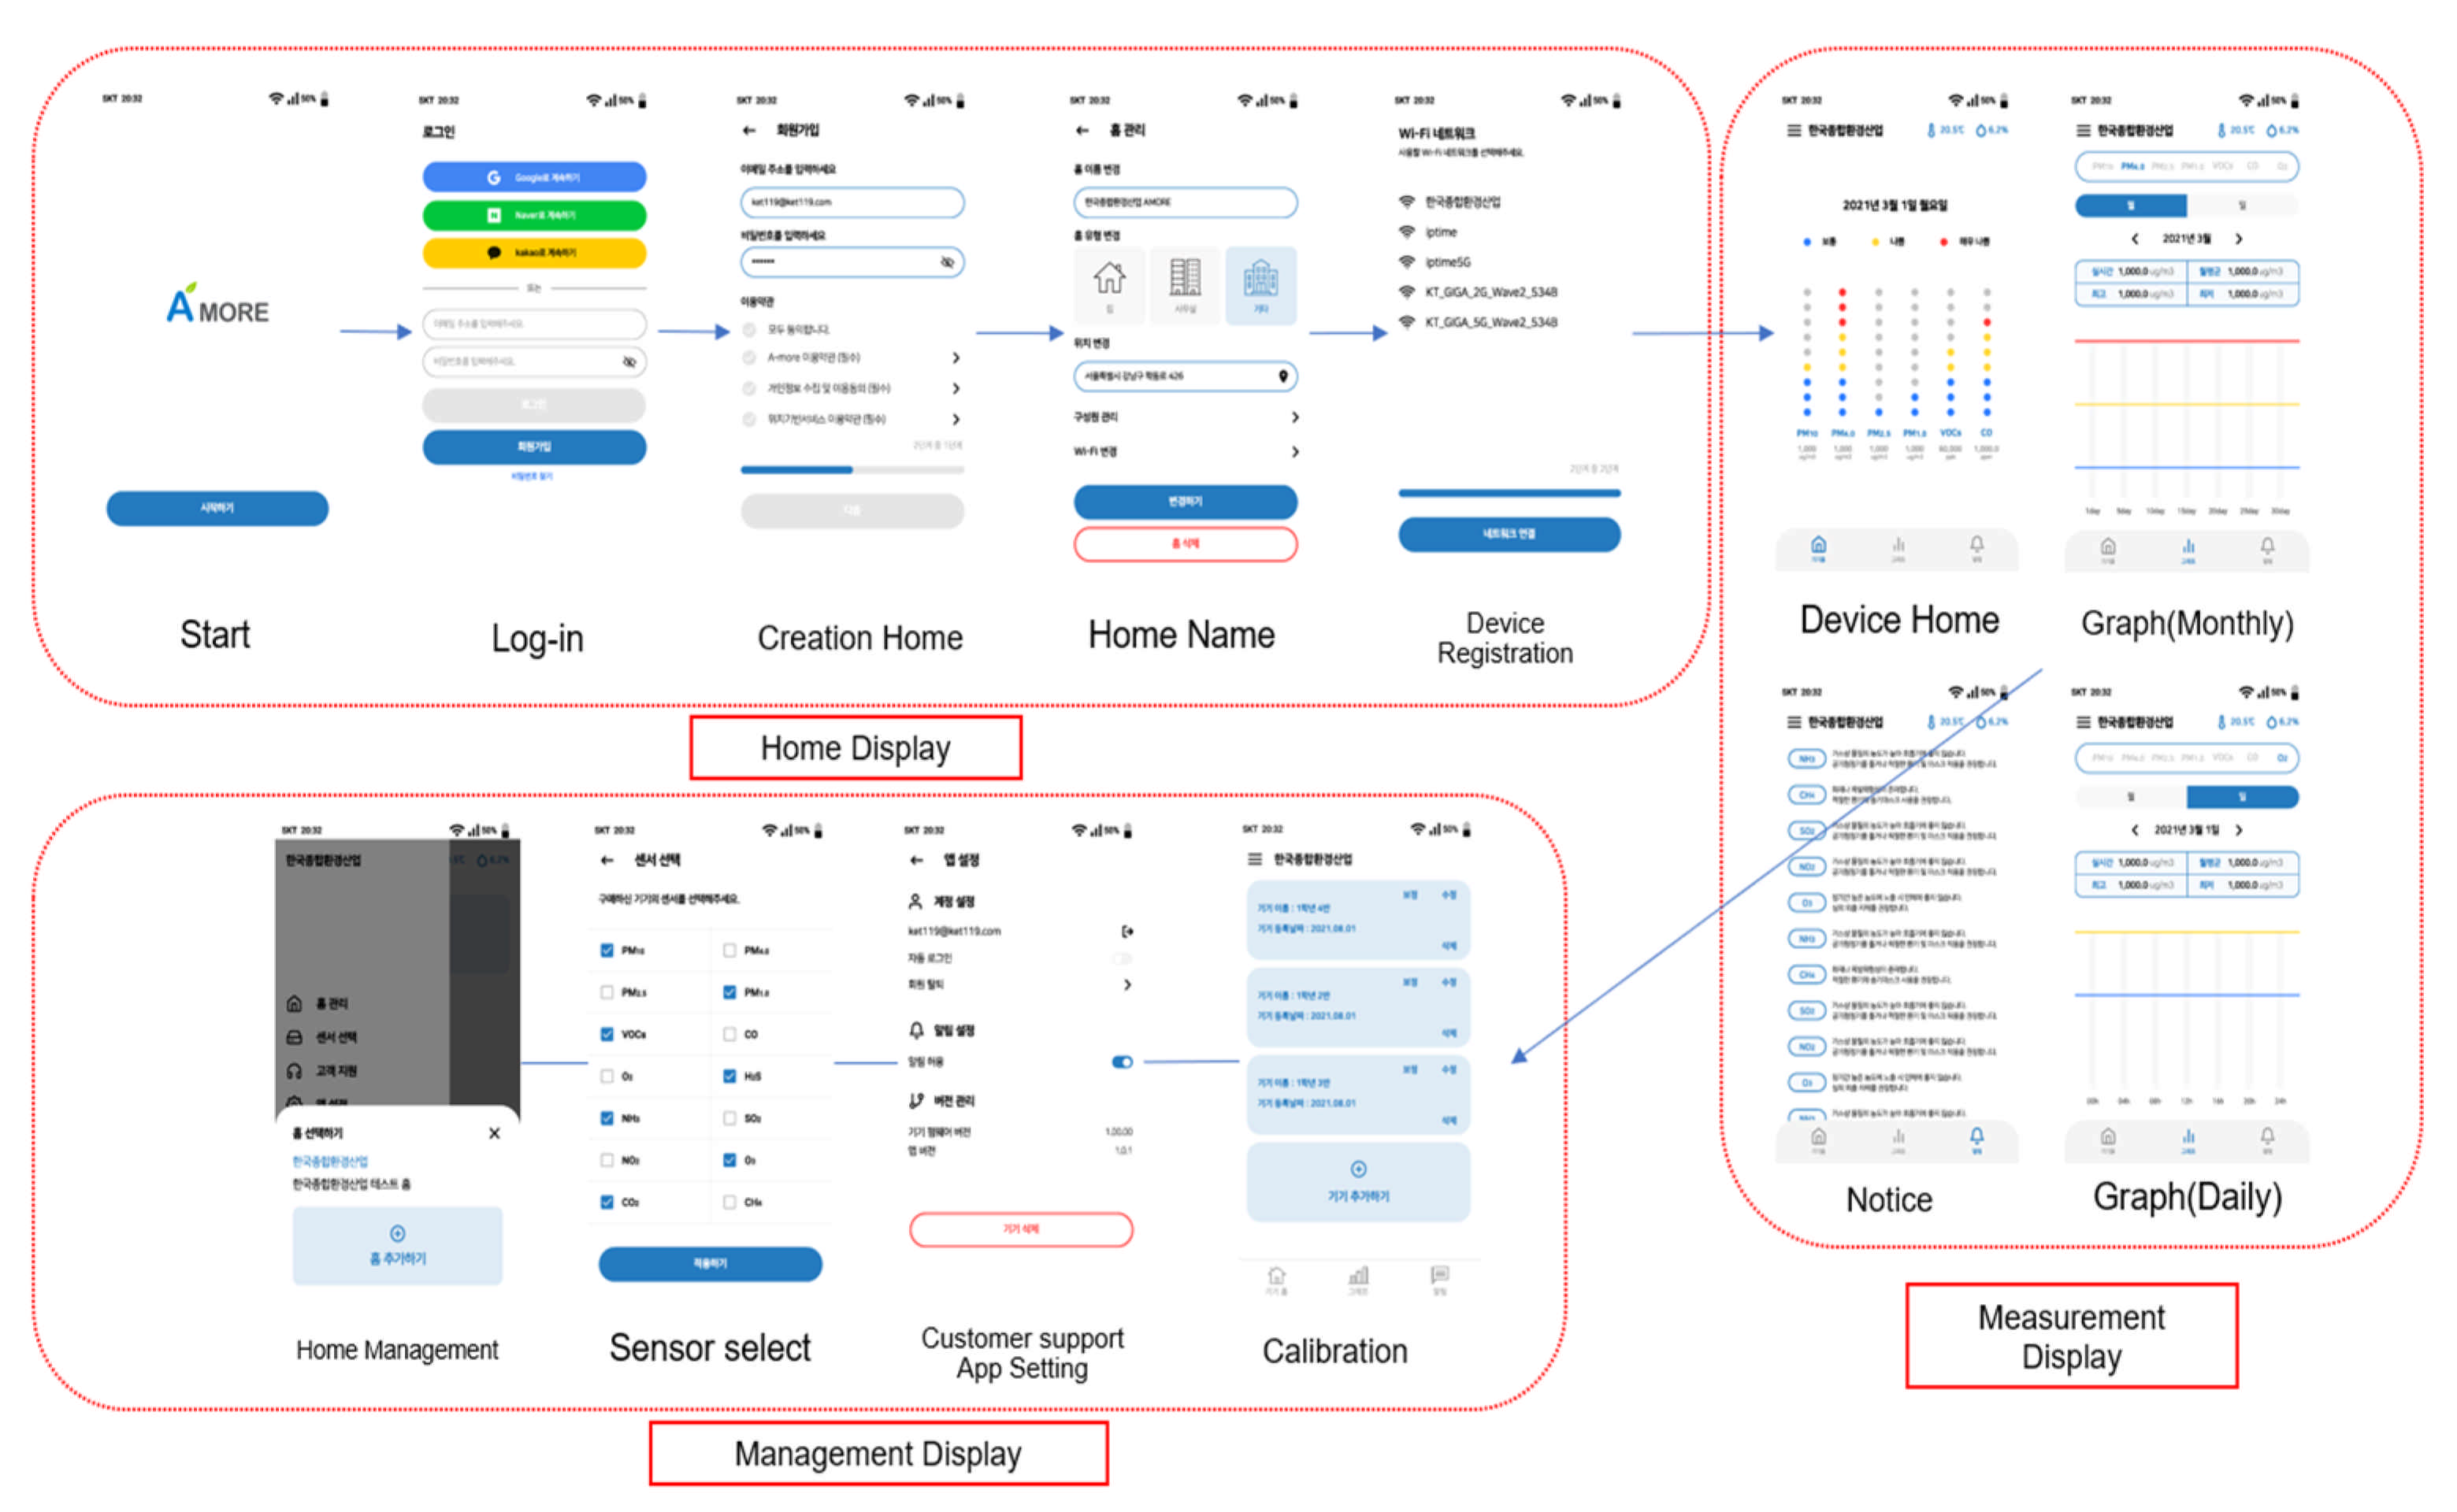
As shown in Figure 6, the software is divided into a home screen, measurement screen, and management screen. The home screen consists of start, login, home creation, home name, and device registration screens. When the smartphone application is activated, a start and login screen is created and can be logged into by registering as a member or linking with Google, Naver, or KakaoTalk. After logging in, the home creation screen appears, and the home name is registered, the hardware device is turned on, and the device is registered by interworking with the device’s Wi-Fi. After registering the device, the measured values can be check on the device’s home screen. For daily and monthly data, the data of the day and month can be checked by moving to the graph screen and touching the day and month for each item. In the Notice screen, the contents of the emergency alert are confirmed so far, and the alert time of contamination can be confirmed. On the management screen, it is possible to add and remove home and sensors can be selected in the device. Plus, the user environmental setting and the manual calibration can be accessed on the management screen.
In order to confirm the clear operation of the software, it was tested for 24 h by interworking between the machine and the software, and the alert that was pushed when the measured items were contaminated. In the future, it will be tested over two months for data transmission errors, data transmission speed, and graphing errors.
3.3. Verification of Multi-Item Air Quality Monitoring System
In order to test the reliability of the developed device, a comparative test with other specialized environmental devices, an accuracy test, and an operating temperature test were conducted. Comparative test items were PM10, PM2.5, O3, NO2, CO, and SO2. The accuracy test items were temperature and humidity. The operating temperature test range was −20 °C to 60 °C. Eight out of the sixteen items were tested; the other items are scheduled to be conducted through a closed chamber test through an accredited testing laboratory.
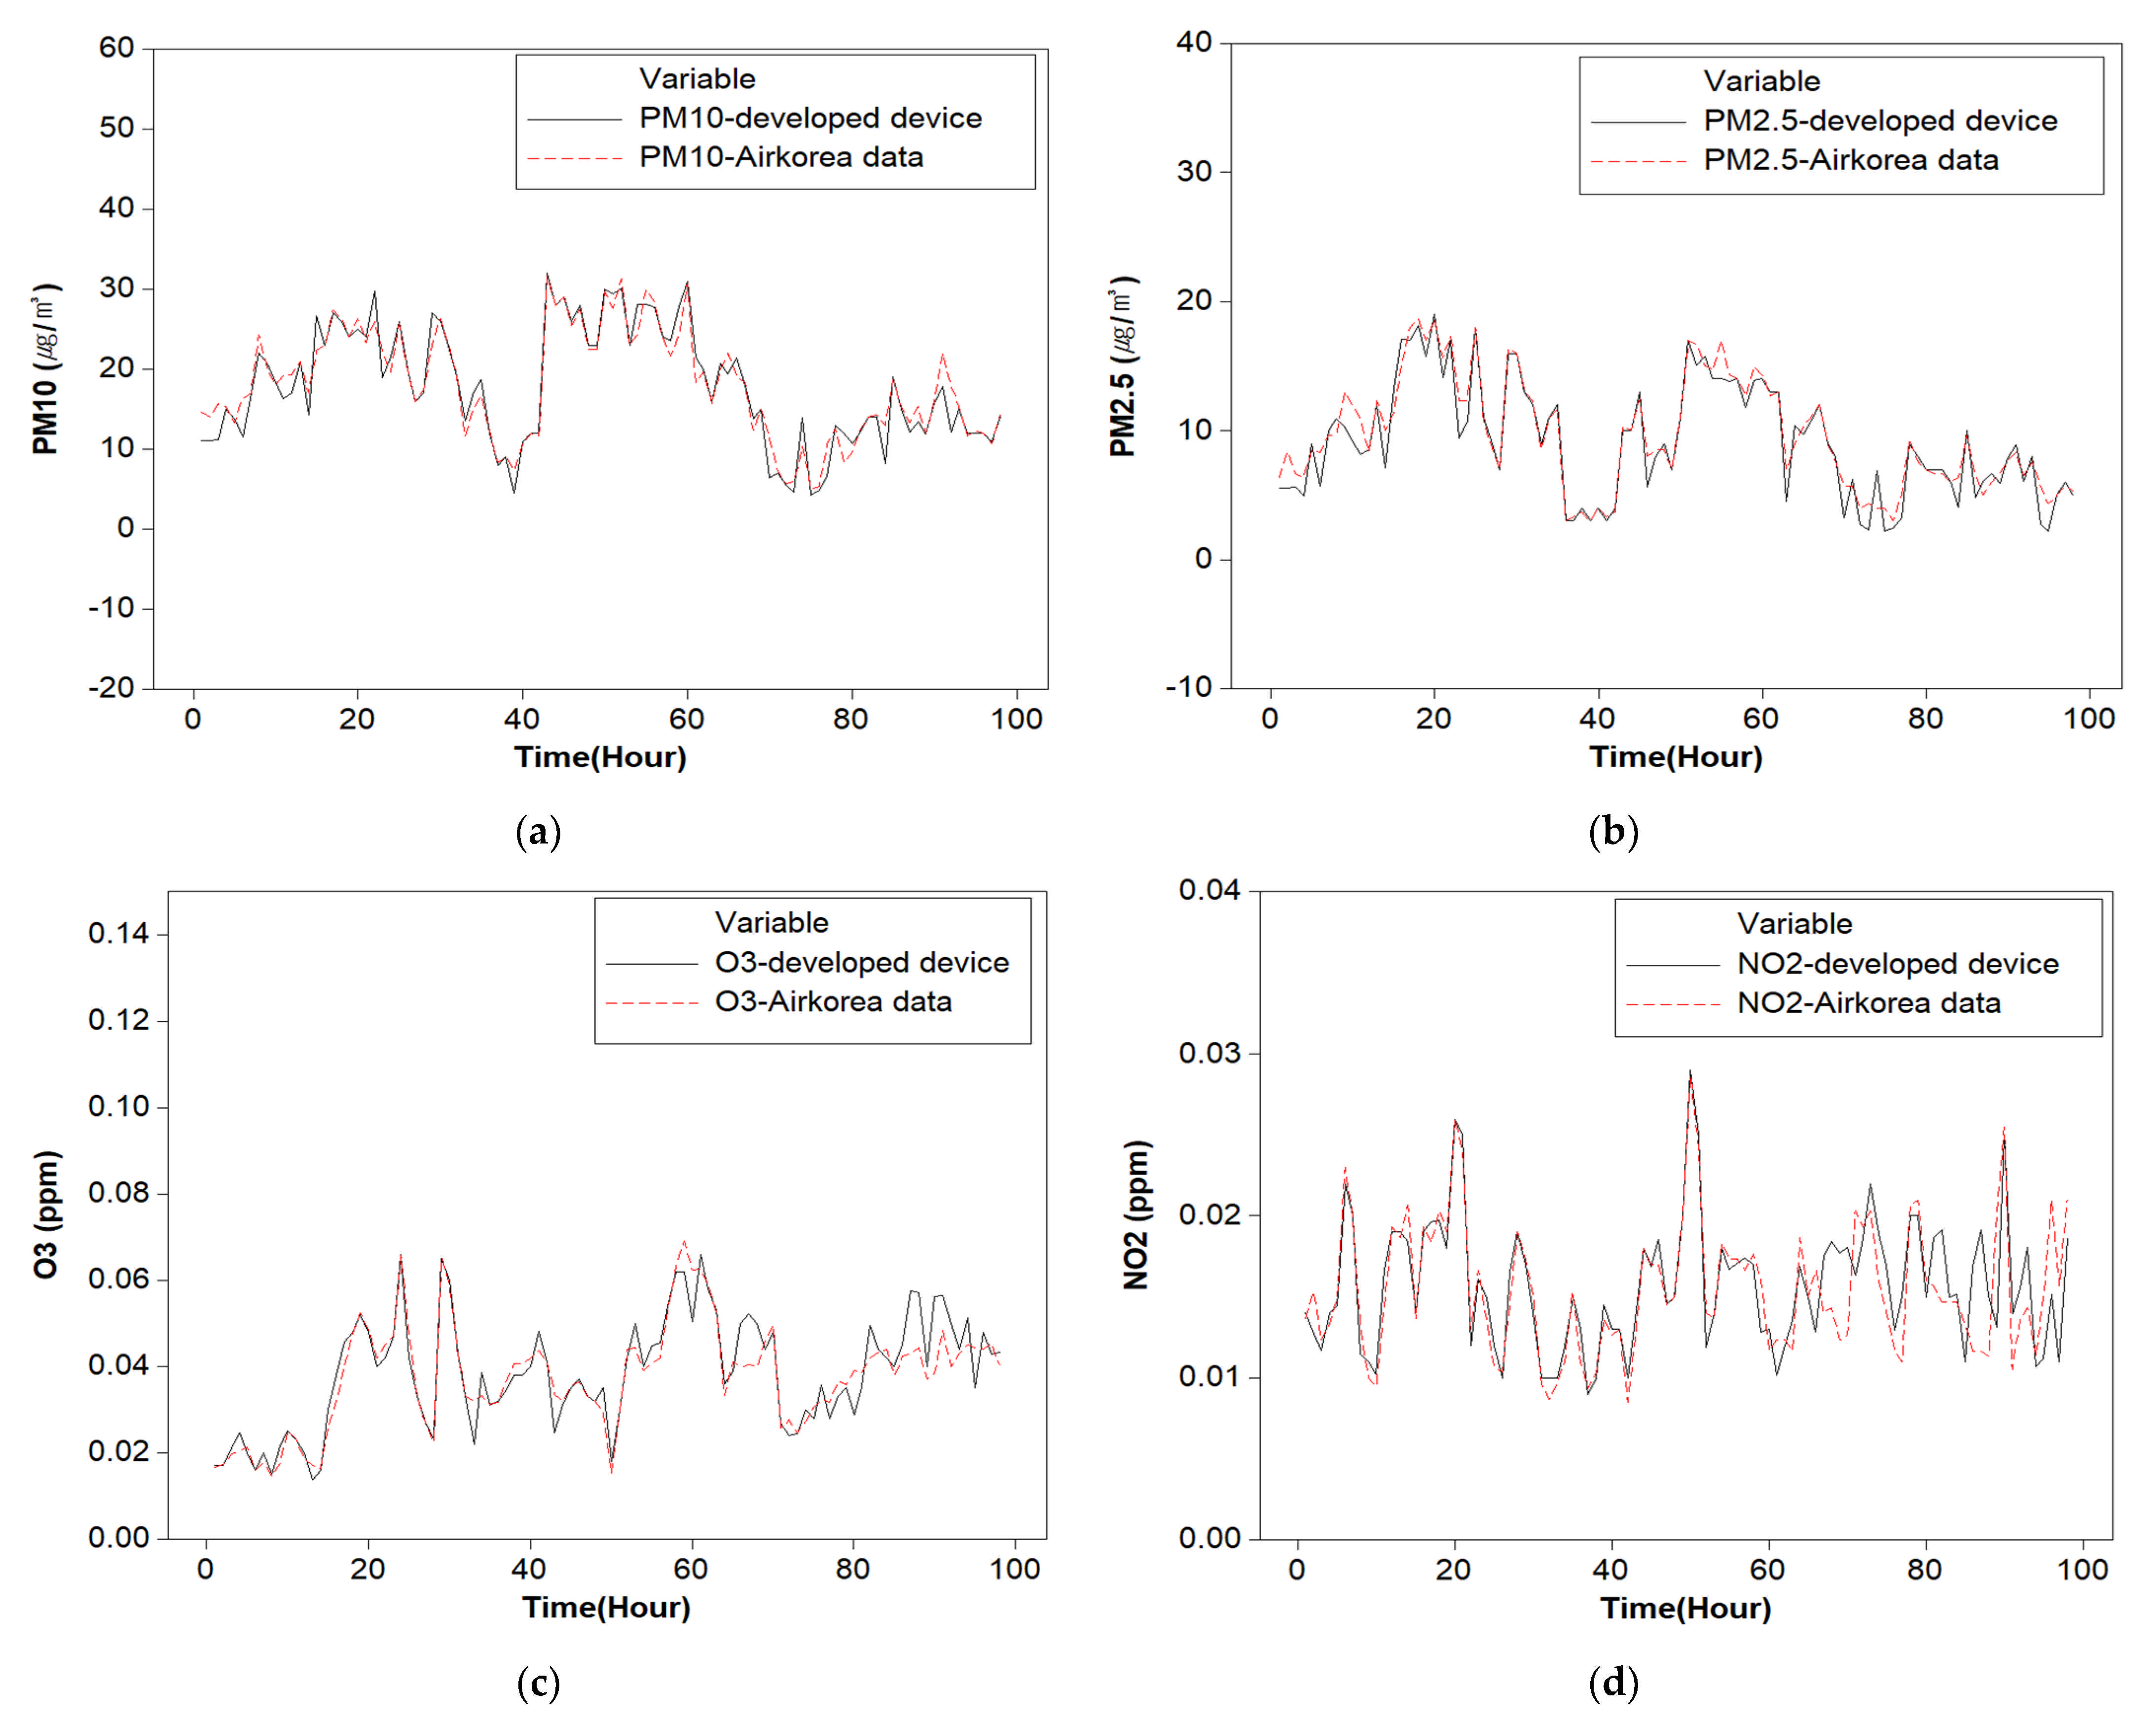
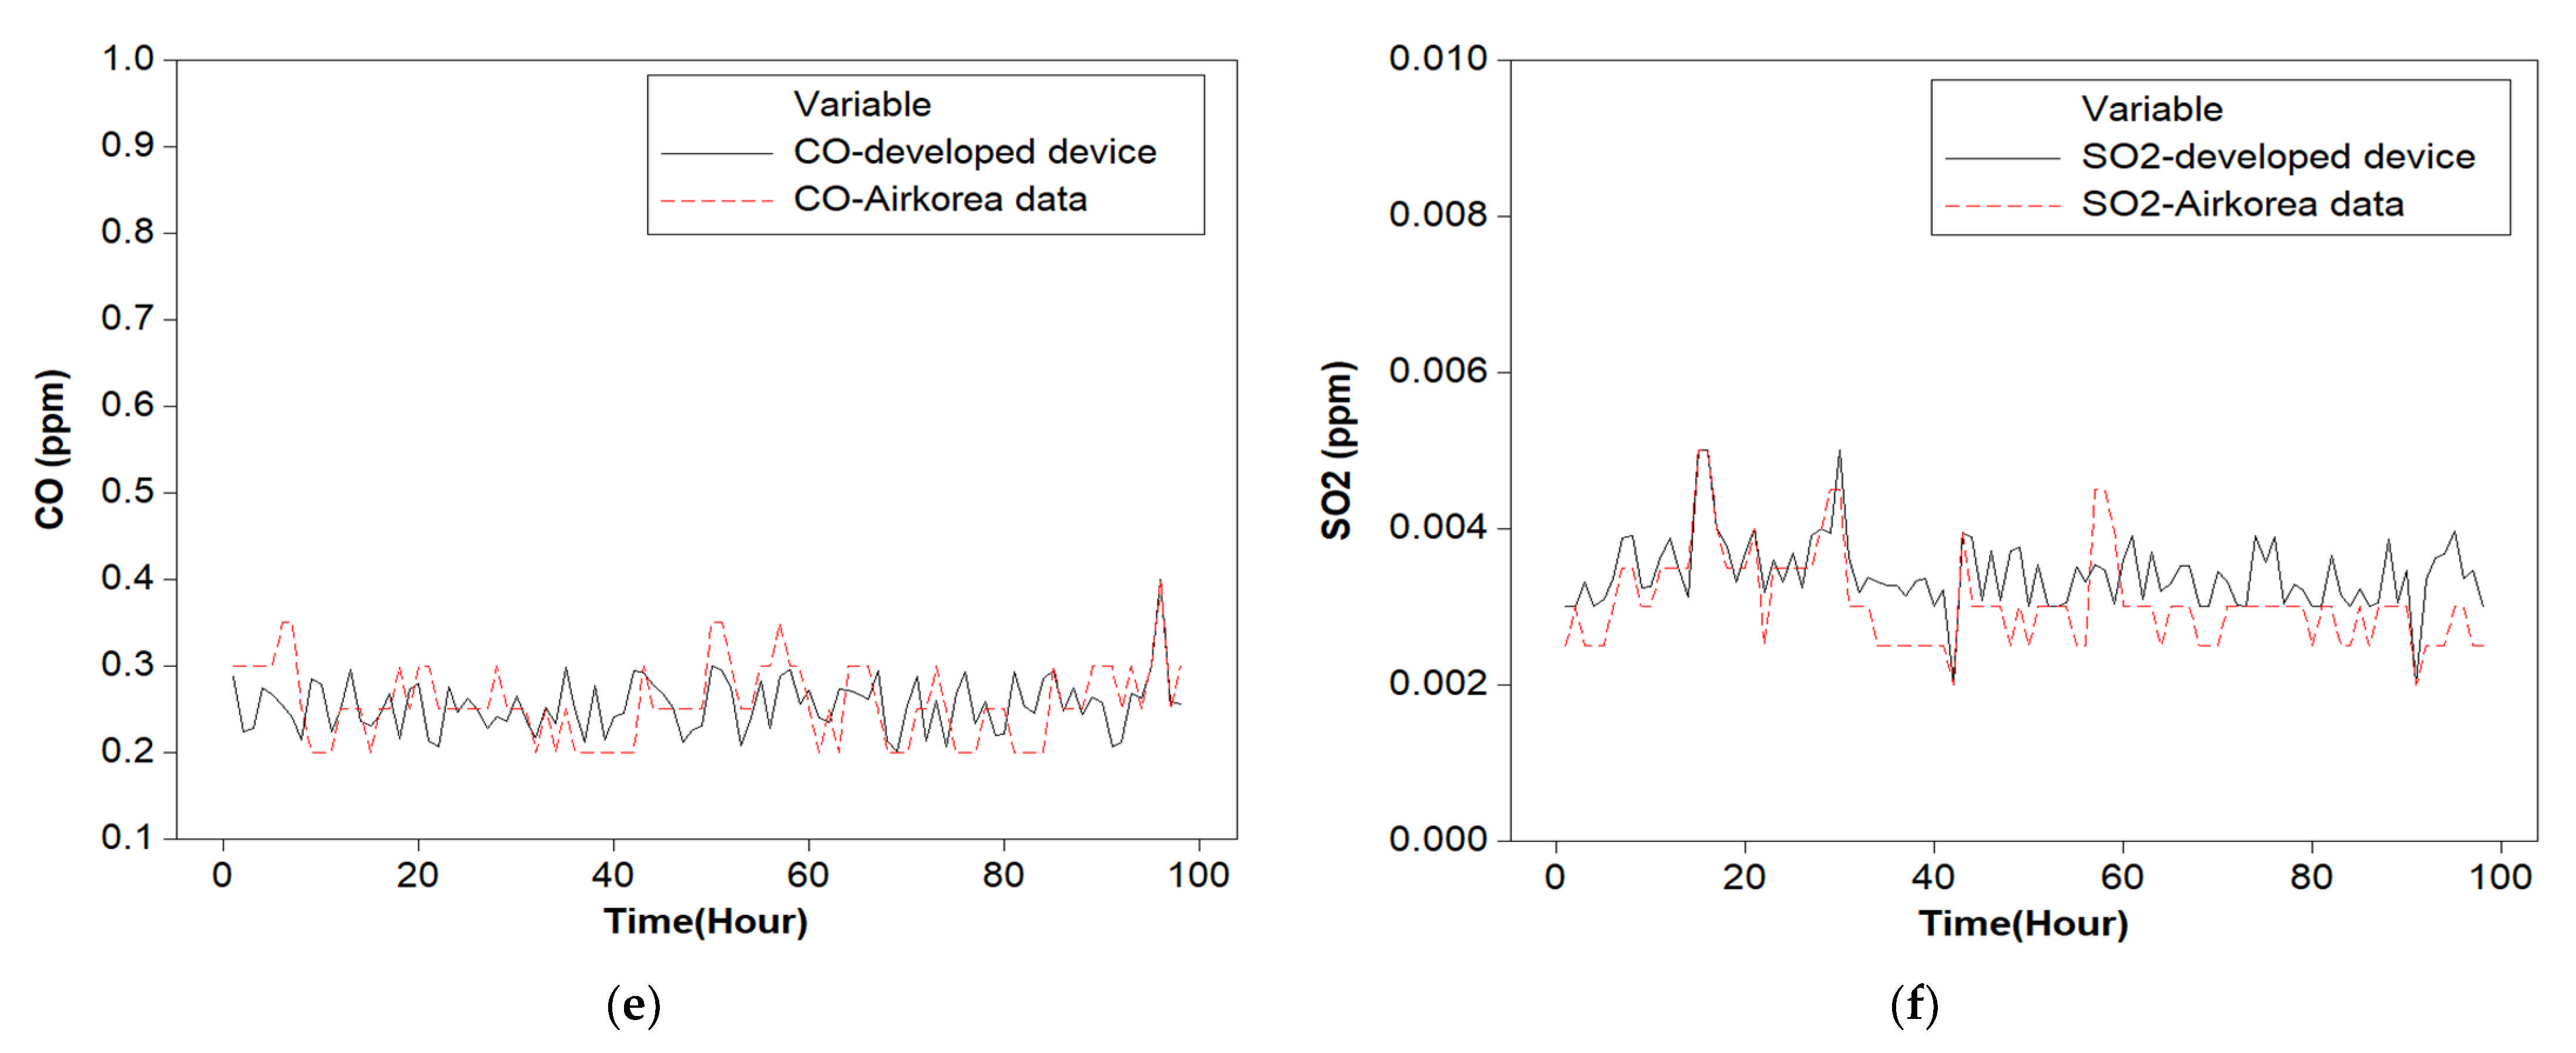
First, in the comparative test, the values were compared by installing the developed device at the measurement point and the same point of AirKorea (Korea government official atmospheric information site). The environmental measuring instruments used in AirKorea are PM10 for Spirant BAM by Ecotech (Hyderabad, India), PM2.5 for BAM 1020 by Met one Instrument, O3 for Serinus 10 by Ecotech (Hyderabad, India), NO2 for Serinus 40 by Ecotech (Hyderabad, India), CO for Serinus 30 by Ecotech (Hyderabad, India), SO2 for Serinus 50 by Ecotech (Hyderabad, India). They are all environment-specialized measuring devices. They were all tested for a quality device using a professional purpose by the Korea Ministry of Environment. Figure 7 shows the difference between the developed device and AirKorea measuring device for six items (PM10, PM2.5, O3, NO2, CO, SO2). The total test duration was 14 days, and 100 h of data were compared. The difference in values is ±5% for PM10, ±6% for PM2.5, ±4% for O3, ±5% for NO2, ±7% for CO, and ±7% for SO2. PM10 and PM2.5 showed a difference of 5–6%, and it was confirmed that the difference was not much considering that the measurement method was a beta-ray method and a light scattering method. O3, NO2, CO, and SO2 showed a difference of 4–7%. Although there are some differences between these values, it was confirmed that there was no significant difference under the assumption that the measurement and collection methods were different. The result is only a simple comparison test with a specialized measurement device; a clear accuracy test will be confirmed again through a closed chamber test. Through this test, it was confirmed that the measurement trend of the developed device is not significantly different from the existing specialized environmental measurement device.
The temperature and humidity test in Figure 8 was processed in a closed chamber at the nationally accredited testing institution. For the test, a closed chamber was set to a temperature of 40 °C and a humidity of 80%. The test was run for 1200 s and showed an accuracy of 99% for temperature and 98% for humidity. Currently, accuracy tests are being conducted at temperatures of 0 °C, 20 °C, 40 °C, and 60 °C and humidity of 20%, 40%, 60%, and 80%.
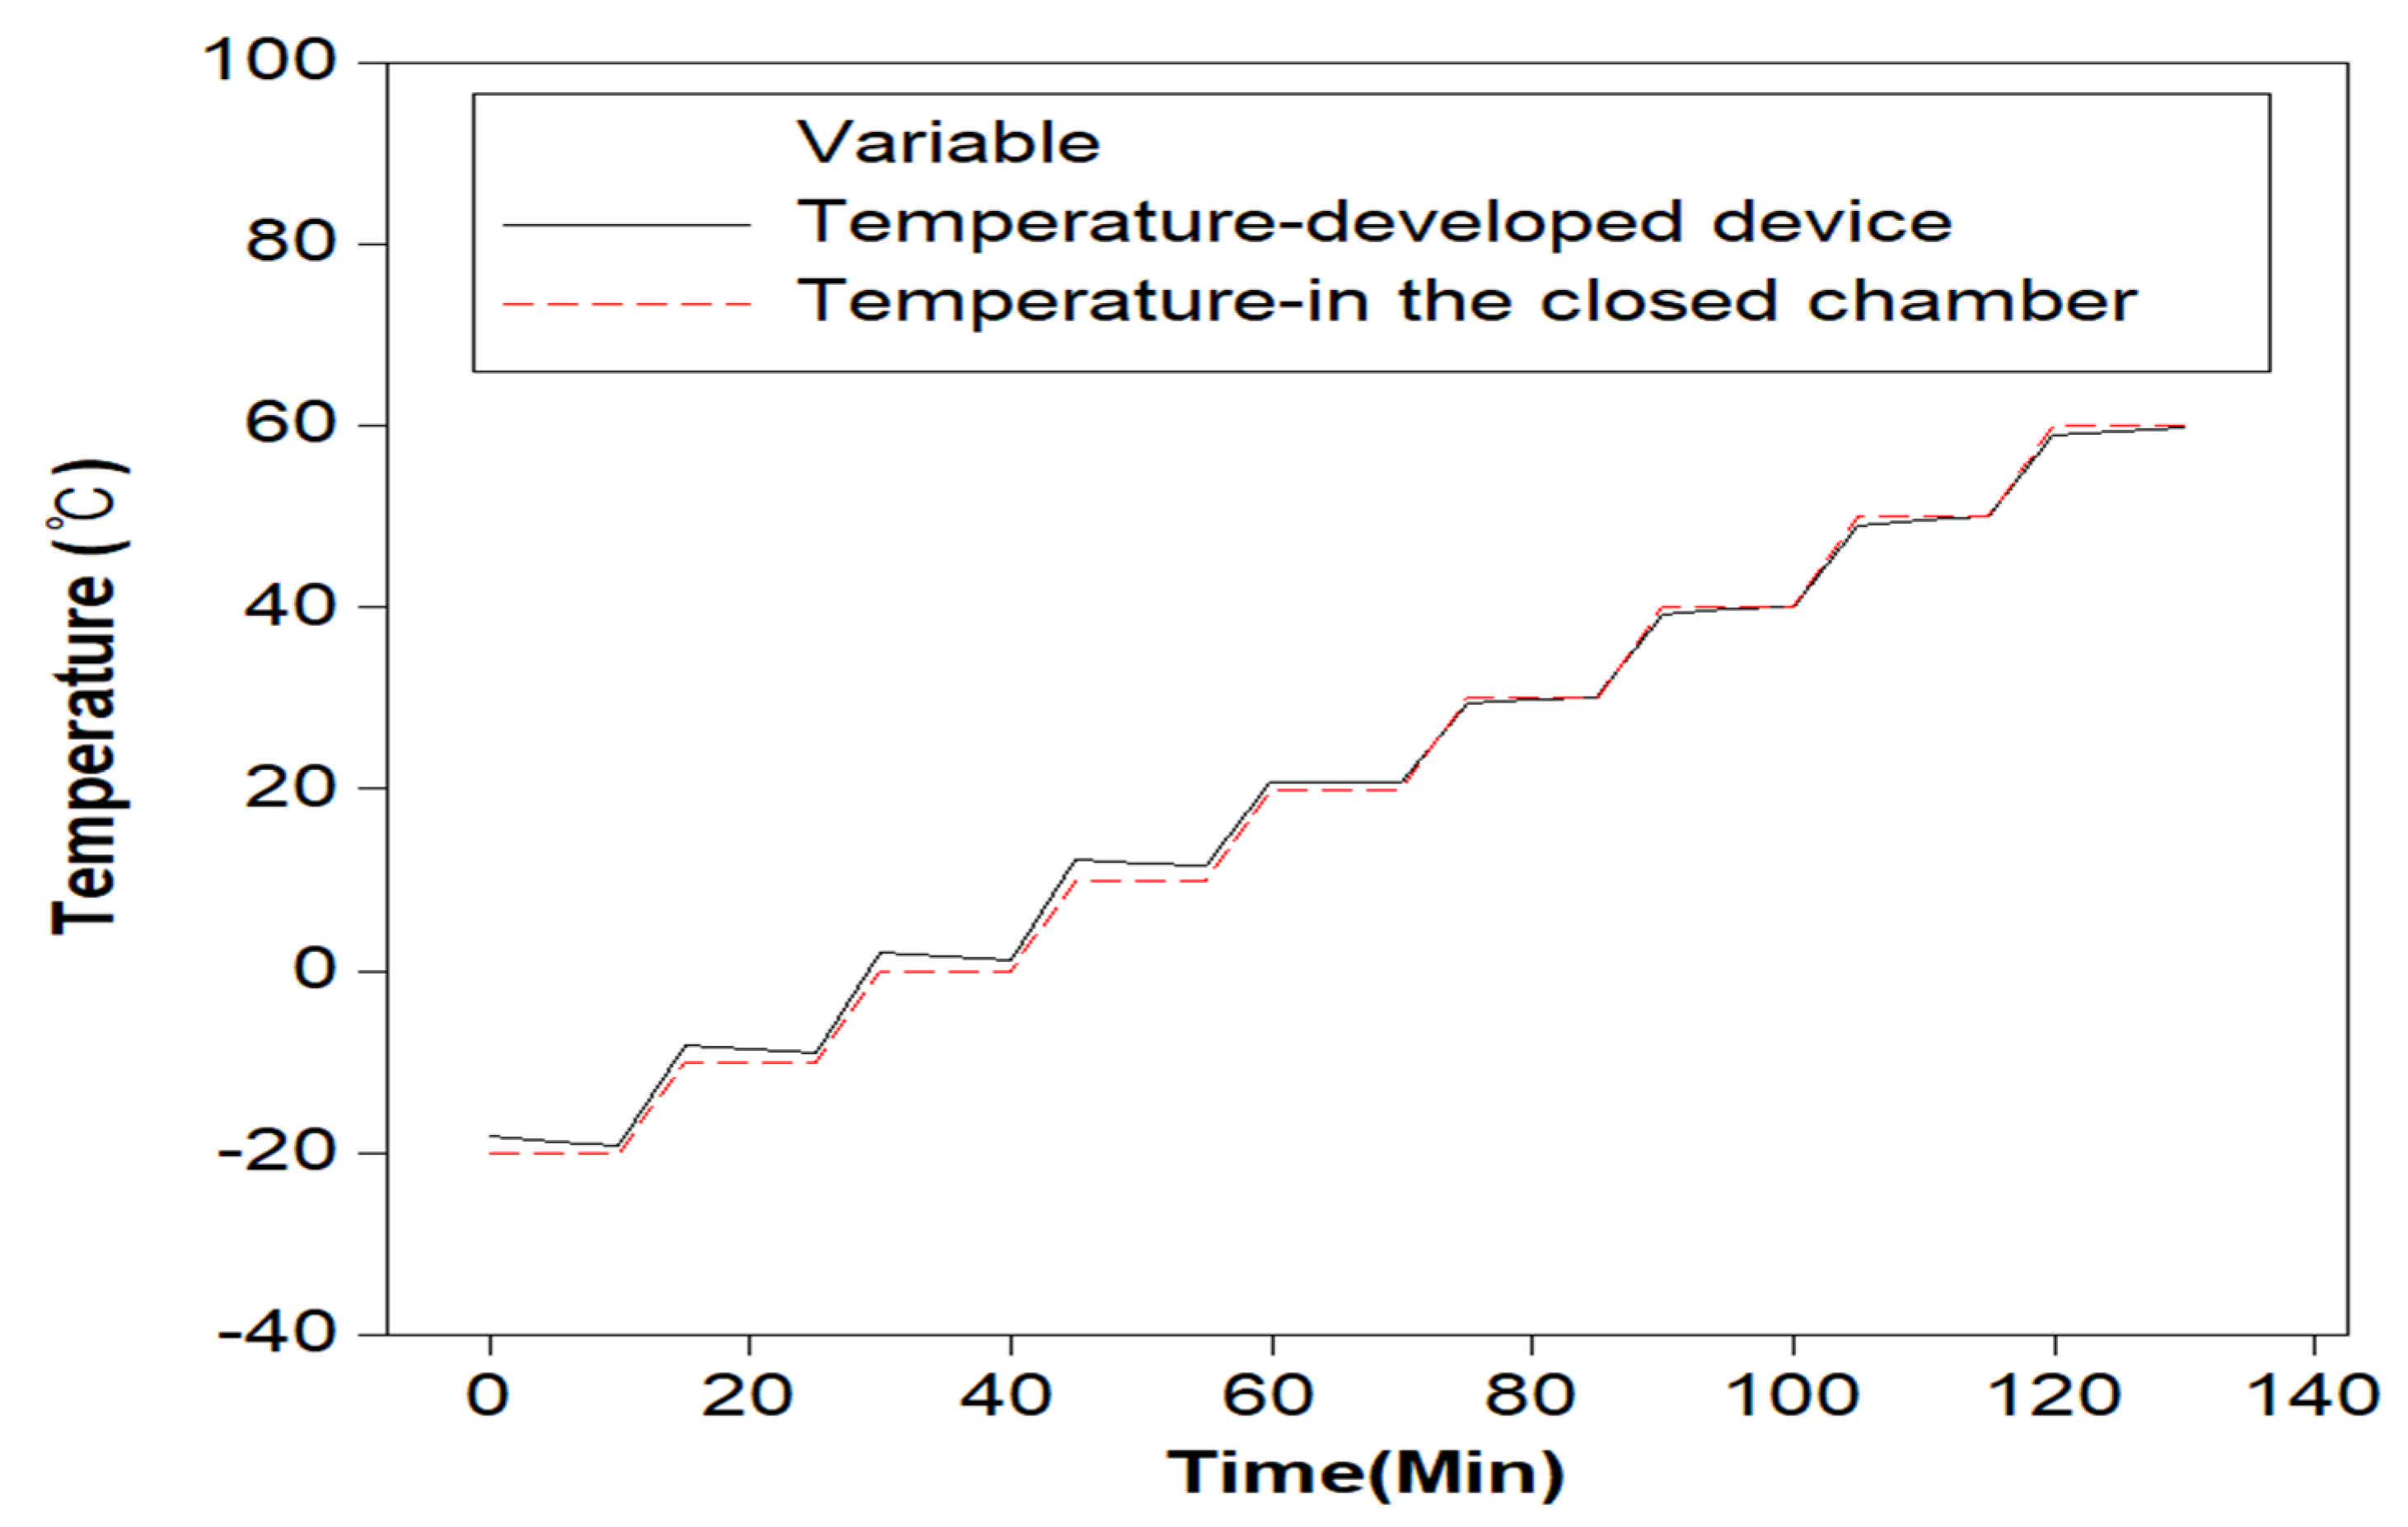
The operating temperature test was confirmed through a closed chamber system of a nationally accredited testing institute. The temperature was divided into nine stages from 20 °C to 60 °C, and the normal operation of the device was checked. The test time was 130 min, and the result is shown in Figure 9. It was confirmed that the device works well without any problems between −20 °C and 60 °C.
Therefore, the result shows that the developed system has a positive use for a specialized air quality measurement device. However, it is not enough to prove the reliability of the developed device considering that the tests conducted are only the comparative test and the simple temperature test. When all installed sensors are tested in a closed chamber and the time and number of tests are sufficient, the device will have a full guarantee for a professional environmental measuring device. Other tests—all sensors in the closed chamber and a comparative test with increased time—are in progress.
4. Conclusions
The developed multi-item air quality monitoring system based on real time consists of 16 items (PM10, PM4.0, PM2.5, PM1.0, CO2, CH4, temperature, humidity, VOCs, O2, H2S, NH3, SO2, NO2, O3, and CO). This system was developed by dividing it into hardware (measuring device) and software (smartphone application). To measure sixteen items in the measuring device, ten sensors in the main device and two sensors in the probe rod are installed. All sensors were installed in consideration of the minimum area in the main device. A smartphone application was developed with a home screen, measurement screen, and management screen in consideration of the user’s ease of use and clear information delivery. Bluetooth and Wi-Fi are installed for efficient communication between the two devices. Comparative test, temperature–humidity accuracy test, and operating temperature test were conducted to test the availability and reliability of the developed device. It was found to be PM10 ± 5%, PM2.5 ± 6%, O3 ± 4%, NO2 ± 5%, CO ± 7%, and SO2 ± 7%. The temperature and humidity accuracy test result showed high reliability at ±1% and humidity ± 2%. The result of the operating temperature test showed that there was no problem in normal operation. However, the test conducted was a comparative test, all installed sensors were not tested, the test time and frequency were not sufficient, and the closed chamber test was not performed. It is not enough to prove the reliability of the developed device. Additional work including a long-term test for more clear reliability of the device and closed chamber accuracy test for all sixteen item sensors, data acquisition rate, and data transmit rate are necessary for commercializing the device.
This development device will enable real-time environmental monitoring in the near future, and the developed device will be used as a device to help create a better environment for humans.
Author Contributions
Conceptualization, B.P. and H.P.; methodology, B.P. and S.K.; investigation B.P. and M.K.; software B.P. and S.P.; validation B.P. and T.Y.K.; writing—review and editing, B.P. and H.P.; supervision, H.P. All authors have read and agreed to the published version of the manuscript.
Funding
This research was funded by Korea Environmental Industry & Technology Institute in South Korea, grant number L120-00005-0001-0.
Institutional Review Board Statement
Not applicable.
Informed Consent Statement
Not applicable.
Data Availability Statement
Not applicable.
Conflicts of Interest
All authors declare no conflict of interest.
References
- Manisalidis, I.; Stavropoulou, E.; Stavropoulos, A.; Bezirtzoglou, E. Environmental and Health Impacts of Air Pollution: A Review. Front. Public Health 2020, 8, 14. [Google Scholar] [CrossRef] [PubMed] [Green Version]
- Hassan Bhat, T.; Jiawen, G.; Farzaneh, H. Air Pollution Health Risk Assessment (AP-HRA), Principles and Applications. Int. J. Environ. Res. Public Health 2021, 18, 1935. [Google Scholar] [CrossRef] [PubMed]
- Pope, C.; Burnett, R.; Turner, M.; Cohen, A.; Krewski, D.; Jerrett, M.; Gapstur, S.; Thun, M. Lung Cancer and Cardiovascular Disease Mortality Associated with Ambient Air Pollution and Cigarette Smoke: Shape of the Exposure–Response Relationships. Environ. Health Perspect. 2011, 119, 1616–1621. [Google Scholar] [CrossRef] [Green Version]
- Anenberg, S.; West, J.; Yu, H.; Chin, M.; Schulz, M.; Bergmann, D.; Bey, I.; Bian, H.; Diehl, T.; Fiore, A.; et al. Impacts of intercontinental transport of anthropogenic fine particulate matter on human mortality. Air Qual. Atmos. Health 2014, 7, 369–379. [Google Scholar] [CrossRef]
- Bourdrel, B.; Alahmad, B.; Maesano, C.; Bind, M. The impact of outdoor air pollution on COVID-19: A review of evidence from in vitro, animal, and human studies. Eur. Respir. Rev. 2021, 30, 200242. [Google Scholar] [CrossRef] [PubMed]
- Solomon, P.A. An Overview of Ultrafine, EM: Air and Waste Management Association’s Magazine for Environmental Managers May 2012. Available online: https://www.researchgate.net/publication/286021488_An_overview_of_ultrafine_particles_in_ambient_air (accessed on 13 September 2021).
- Kelly, F.J.; Fussell, J.C. Size, source and chemical composition as determinants of toxicity attributable to ambient particulate matter. Atmos. Environ. 2012, 60, 504–526. [Google Scholar] [CrossRef]
- Stanaway, G.; Afshin, A.; Gakidou, E.; Lim, S.; Abate, K.; Cristiana, A.; Abbasi, N.; Abbastabar, H.; Abd-Allah, F.; Abdela, J.; et al. Global, regional, and national comparative risk assessment of 84 behavioural, environmental and occupational, and metabolic risks or clusters of risks for 195 countries and territories, 1990–2017: A systematic analysis for the Global Burden of Disease Study 2017. Lancet 2018, 392, 1345–1422. [Google Scholar] [CrossRef] [Green Version]
- Rizzato, S.; Leo, A.; Monteduro, A.G.; Chiriacò, M.; Primiceri, E.; Sirsi, F.; Milone, A.; Maruccio, G. Advances in the Development of Innovative Sensor Platforms for Field Analysis. Micromachines 2020, 11, 491. [Google Scholar] [CrossRef]
- Gaba, A.; Felicia, S.I. Reduction of Air Pollution by Combustion Processes. In The Impact of Air Pollution on Health, Economy, Environment and Agricultural Sources; Khallaf, M.K., Ed.; IntechOpen: London, UK, 2011. [Google Scholar] [CrossRef] [Green Version]
- Jo, S.S.; Lee, S.H.; Leem, Y. Temporal Changes in Air Quality According to Land-Use Using Real Time Big Data from Smart Sensors in Korea. Sensors 2020, 20, 6374. [Google Scholar] [CrossRef]
- Wetchakun, K.; Samerjai, T.; Tamaekong, N.; Liewhiran, C.; Siriwong, C.; Kruefu, V.; Wisitsoraat, A.; Tuantranont, A.; Phanichphant, S. Semiconducting metal oxides as sensors for environmentally hazardous gases. Sens. Actuators B Chem. 2011, 160, 580–591. [Google Scholar] [CrossRef]
- César, A.C.G.; Carvalho, J.A., Jr.; Nascimento, L.F.C. Association between NOx exposure and deaths caused by respiratory diseases in a medium-sized Brazilian city. Braz. J. Med. Biol. Res. 2015, 48, 12. [Google Scholar] [CrossRef] [Green Version]
- Kozicki, M.; Piasecki, M.; Goljan, A.; Deptula, H.; Niesłochowski, A. Emission of Volatile Organic Compounds (VOCs) from Dispersion and Cementitious Waterproofing Products. Sustainability 2018, 10, 2178. [Google Scholar] [CrossRef] [Green Version]
- Suganya, R.; Guhan, R.; Gowreesan, N.C. Mubariz Air Quality Monitoring System with Emergency Alerts Using IOT. J. Phys. Conf. Ser. 2021, 1916, 012050. [Google Scholar] [CrossRef]
- Kim, J.Y.; Chu, C.H.; Shin, S.M. ISSAQ: An integrated sensing systems for real-time indoor air quality monitoring. IEEE Sens. J. 2014, 14, 4230–4244. [Google Scholar] [CrossRef]
- Sung, W.-T.; Hsiao, S.-J. Building an indoor air quality monitoring system based on the architecture of the Internet of Things. EURASIP J. Wirel. Commun. Netw. 2021, 2021, 153. [Google Scholar] [CrossRef]
- TROTEC. Particle Counter PC220. Available online: https://uk.trotec.com/products-services/measuring-devices/air-quality/particle-counter/pc220-particle-counter/ (accessed on 13 September 2021).
- HTI. HT 9600 PM2.5 Detector. Available online: https://hti-instrument.com/products/ht-9600-pm2-5detector (accessed on 13 September 2021).
- Airvom. Airvom T1. Available online: https://airvom.com/airvom-t1/ (accessed on 13 September 2021).
- Humai. Huma-i Smart(HI-300). Available online: http://humatech.co.kr/bbs/content.php?co_id=e_cont_020203 (accessed on 13 September 2021).
- AWAIR. Awair Element. Available online: https://www.getawair.com/home (accessed on 13 September 2021).
- Temtop. Temtop P1000 Air Quality Meter. Available online: https://temtopus.com/collections/temtop-co2-monitor/products/temtop-p1000-air-quality-detector-professional-co2-pm2-5-pm10-temperature-humidity-monitor-air-quality-meter (accessed on 13 September 2021).
- 3M. EVM-4. Available online: https://www.3m.com/3M/en_US/country-monitoring-instr-us/products/~/3M-Indoor-Air-Quality-Monitor-Kit-with-CO-Sensor-1-kit-cs/?N=8715292+3292720494&rt=rud (accessed on 13 September 2021).
- FLUKE. Fluke 975 AirMeter™. Available online: https://www.fluke.com/en-us/product/building-infrastructure/indoor-air-quality-testing/fluke-975 (accessed on 13 September 2021).
- Honeywell. Honeywell BW™ Ultra. Available online: https://www.honeywellanalytics.com/ko-kr/products/BW-Ultra (accessed on 13 September 2021).
- New Cosmos Electric. XP-3110. Available online: https://www.new-cosmos.co.jp/kr/portable.html (accessed on 13 September 2021).
- Feenstra, B.; Collier-Oxandale, A.; Papapostolou, V.; Cocker, D.; Polidori, A. The AirSensor open-source R-package and DataViewer web application for interpreting community data collected by low-cost sensor networks. Environ. Model. Softw. 2020, 134, 104832. [Google Scholar] [CrossRef]
- Larkin, A.; Williams, D.E.; Kile, M.L.; Baird, W.M. Developing a smartphone software package for predicting atmospheric pollutant concentrations at mobile locations. Comput. J. 2015, 58, 1431–1442. [Google Scholar] [CrossRef] [Green Version]
- Sung, Y.; Lee, S.; Kim, Y.; Park, H. Development of a Smart Air Quality Monitoring System and its Operation. Asian J. Atmos. Environ. 2019, 13, 30–38. [Google Scholar] [CrossRef]
- Jo, J.H.; Jo, B.W.; Kim, J.H.; Kim, S.J.; Han, W.Y. Development of an IoT-Based Indoor Air Quality Monitoring Platform. J. Sens. 2020, 14, 8749764. [Google Scholar] [CrossRef]
- Peladarinos, N.; Cheimaras, V.; Piromalis, D.; Arvanitis, K.G.; Papageorgas, P.; Monios, N.; Dogas, I.; Stojmenovic, M.; Tsaramirsis, G. Early Warning Systems for COVID-19 Infections Based on Low-Cost Indoor Air-Quality Sensors and LPWANs. Sensors 2021, 21, 6183. [Google Scholar] [CrossRef] [PubMed]
- Phillips, S.D.; Estler, W.T.; Doiron, T.; Eberhardt, K.R.; Levenson, M.S. A Careful Consideration of the Calibration Concept. J. Res. Natl. Inst. Stand. Technol. 2001, 106, 371–379. [Google Scholar] [CrossRef]
Figure 1.
Schematic diagram of multi-item air quality monitoring system.

Figure 2.
Hardware of (a) multi-item air quality monitoring system device front part; (b) rear part.
Figure 2.
Hardware of (a) multi-item air quality monitoring system device front part; (b) rear part.

Figure 3.
Hardware of air quality monitoring system (probe).

Figure 4.
Software (application) structure diagram.

Figure 5.
Manufactured of (a) multi-item air quality monitoring system device outside appearance; (b) inside appearance.
Figure 5.
Manufactured of (a) multi-item air quality monitoring system device outside appearance; (b) inside appearance.

Figure 6.
Structure diagram of the manufactured smartphone application.

Figure 7.
Comparative test between the developed device and Airkorea data. (a) PM10 results; (b) PM2.5 results; (c) O3 results; (d) NO2 results; (e) CO results; (f) SO2 results.
Figure 7.
Comparative test between the developed device and Airkorea data. (a) PM10 results; (b) PM2.5 results; (c) O3 results; (d) NO2 results; (e) CO results; (f) SO2 results.


Figure 8.
Temperature and humidity accuracy test result by the developed device and the closed chamber environment. (a) Temperature result; (b) humidity result.
Figure 8.
Temperature and humidity accuracy test result by the developed device and the closed chamber environment. (a) Temperature result; (b) humidity result.

Figure 9.
Operating temperature test result by the developed device and the closed chamber environment.
Figure 9.
Operating temperature test result by the developed device and the closed chamber environment.


Table 1.
Sensors and Module characteristics in the multi-item air quality monitoring system.
| Sensors/Modules | Characteristics |
|---|---|
| Particle Matter Sensor (Sensirion_SP30) | Method: light scattering method, Size 48 × 41.5 × 12.9 mm PM10, PM4.0, PM2.5 and PM1.0 Range 0~1000 μg/m3, Accuracy ± 10 μg/m3 |
| CO2 Sensor (Sensirion_SCD30) | Non-dispersive infrared absorption (NDIR) Size 35 × 23 × 7 mm Range 400~10,000 ppm, Accuracy ± 30 ppm ±3% of reading |
| CH4 Sensor (ELT Sensor_DS-CH4-D3) | Non-dispersive infrared absorption (NDIR) Size 33 × 33 × 13.1 mm Range 0~50,000 ppm, Accuracy ± 3% |
| Temperature and Humidity Sensor (SHT30-DIS-B) | Electrochemical method, Size 2.5 × 2.5 × 0.9 mm −40 °C to 125 °C, with accuracy of ±1 °C 0% to 100%, with accuracy of ±1% |
| VOCs Sensor (Sensirion_SGP30) | Electrochemical method, Size 2.45 × 2.45 × 0.9 mm 0~60,000 ppb, Accuracy 15% of meas. Value |
| O2 Sensor (Mixen_O2) | Electrochemical method, Size Φ23.5 × 24.5 mm 0~25%, Accuracy ± 0.1% |
| H2S Sensor (Mixen_H2S) | Electrochemical method, Size Φ23.5 × 24.5 mm 0~100 ppm, Accuracy ± 0.1 ppm |
| NH3 Sensor (Mixen_NH3) | Electrochemical method, Size Φ23.5 × 24.5 mm 0~100 ppm, Accuracy ± 0.1 ppm |
| SO2 Sensor (Mixen_SO2) | Electrochemical method, Size Φ23.5 × 24.5 mm 0~20 ppm, Accuracy ± 0.1 ppm |
| NO2 Sensor (Mixen_NO2) | Electrochemical method, Size Φ23.5 × 24.5 mm 0~20 ppm, Accuracy ± 0.01 ppm |
| O3 Sensor (Mixen_O3) | Electrochemical method, Size Φ23.5 × 24.5 mm 0~20 ppm, Accuracy ± 0.01 ppm |
| CO Sensor (Mixen_CO) | Electrochemical method, Size Φ23.5 × 24.5 mm 0~1000%, Accuracy ± 1 ppm |
| ESP8266 Serial WiFi Module -ESP-12S | WiFi: • 802.11 b/g/n_IOT Integrated low power 32-bit MCU, 10-bit ADC • Integrated TCP/IP protocol stack • Integrated TR switch, LNA, power amplifier and matching network |
| Bluetooth 4.2 NRF52832 Module | Frequency range: 2360–2483 MHZ Output power: 4 dBm Receiver sensitivity: −96 dBm Bluetooth Modulation method: GFSK Kernel: Cortex-M4F Module Size: 21 × 25 mm Interface spacing 1.27 mm |
Table 2.
Warning notifications for each pollutant source according to measurement items.
| Index | Item | Unit | Normal | Bad | Very Bad | Risk |
|---|---|---|---|---|---|---|
| Measurement item | PM2.5 | μg/m3 | 0~35 | 36~75 | 76~1000 | Respiratory hazard |
| PM10 | μg/m3 | 0~80 | 81~150 | 151~1000 | Respiratory hazard | |
| CO | ppm | 0.0~9.0 | 9.1~15.0 | 15.1~1000 | Poisoning | |
| CO2 | ppm | 0~1000 | 1001~3000 | 3001~10,000 | Poisoning | |
| VOCs | ppb | 0~300 | 301~500 | 501~60,000 | Poisoning | |
| O2 | % | 19.0~30.0 | 18.9 or less, 30.1 or more | Poisoning | ||
| H2S | ppm | 0~5 | 6~100 | Poisoning | ||
| NH3 | ppm | 0~5 | 6~40 | 41~100 | Poisoning | |
| CH4 | ppm | 0~140 | 141~50,000 | Explosion Hazard | ||
| SO2 | ppm | 0.0~0.1 | 0.2~20.0 | Poisoning | ||
| NO2 | ppm | 0.0~0.1 | 0.2~20.0 | Poisoning | ||
| O3 | ppm | 0.0 | 0.1~0.15 | 0.16~20.0 | Poisoning | |
Publisher’s Note: MDPI stays neutral with regard to jurisdictional claims in published maps and institutional affiliations. |
© 2021 by the authors. Licensee MDPI, Basel, Switzerland. This article is an open access article distributed under the terms and conditions of the Creative Commons Attribution (CC BY) license (https://creativecommons.org/licenses/by/4.0/).
Share and Cite
MDPI and ACS Style
Park, B.; Kim, S.; Park, S.; Kim, M.; Kim, T.Y.; Park, H. Development of Multi-Item Air Quality Monitoring System Based on Real-Time Data. Appl. Sci. 2021, 11, 9747. https://0-doi-org.brum.beds.ac.uk/10.3390/app11209747
AMA Style
Park B, Kim S, Park S, Kim M, Kim TY, Park H. Development of Multi-Item Air Quality Monitoring System Based on Real-Time Data. Applied Sciences. 2021; 11(20):9747. https://0-doi-org.brum.beds.ac.uk/10.3390/app11209747
Chicago/Turabian StylePark, Beomseok, Sebin Kim, Seoryeong Park, Minji Kim, Tae Yoo Kim, and Hanbai Park. 2021. "Development of Multi-Item Air Quality Monitoring System Based on Real-Time Data" Applied Sciences 11, no. 20: 9747. https://0-doi-org.brum.beds.ac.uk/10.3390/app11209747
Note that from the first issue of 2016, this journal uses article numbers instead of page numbers. See further details here.