Article

An Investigation into the Effect of Emissions from Industrial Complexes on Air Quality in the Ulsan Metropolitan City Utilizing Trace Components in PM2.5

1
National Institute of Environmental Research, Hwangyong-ro 42, Seogu, Incheon 22689, Korea
2
Department of Advanced Technology Fusion, Konkuk University, 120 Neungdong-ro, Gwangjin-gu, Seoul 05029, Korea
*
Author to whom correspondence should be addressed.
Submission received: 16 September 2021 / Revised: 20 October 2021 / Accepted: 22 October 2021 / Published: 26 October 2021
(This article belongs to the Special Issue Air Pollution II)

Abstract

:
This study investigates the impact of industrial complexes on the air quality in the Ulsan Metropolitan City, Korea, by analyzing the concentration of trace substances. Importantly, this study performs segmentation and analysis of the components of particulate matter for tracking emission sources. Concentrations of particulate matter with aerodynamic diameters ≤10 and ≤2.5 µm (PM10 and PM2.5, respectively) and 19 substances comprising PM2.5 (such as ions, carbon, and nine elements) were measured hourly during the year 2017 in the southeastern intensive air quality monitoring station of the National Institute of Environmental Research, Korea. This study identified and investigated the time periods during which the vanadium content in PM2.5 was higher than the annual mean (1.026 ng/µg) through selection cases (SCs). The annual mean concentrations of PM2.5 and PM10 were 18.50 and 32.35 µg/m3, respectively, and were higher (i.e., 26.54 and 45.84 µg/m3, respectively) in SCs. Notably, the concentrations were high even when the main wind direction of SCs was southeasterly, which was mainly the case in summer. Furthermore, the emission sources contributing to PM2.5 were estimated using the correlations of organic carbon, elemental carbon, zinc, iron, manganese, and titanium concentrations in the SCs. This study demonstrated that a detailed tracking of the emission sources at a local scale is possible by analyzing the composition of the components of PM2.5.

1. Introduction

The World Health Organization (WHO) estimates that approximately 4.2 million people died from air pollution in 2016 [1]. Particulate matter (PM) has been reported to aggravate respiratory diseases such as asthma and decrease lung capacity [2,3]. It can also increase the risk of premature death from cardiovascular diseases [4,5,6,7,8,9,10,11]. Per capita mortality attributable to PM2.5 are 25–63 deaths per 105 populations [12], and each 10 µg/m3 rise in PM2.5 concentrations increases daily mortality rates by approximately 1–5% [13,14,15,16,17]. In addition, it has been reported that PM2.5 has a more significant impact on infants and children than adults [18,19].
PM2.5 is not only emitted naturally as solids and particle mixtures in a droplet state but also originates from fixed emission sources such as factories and mobile emission sources such as vehicles [9,20]. PM2.5 can be classified into primary products that are directly discharged from emission sources and secondary products that are generated by gaseous substances, such as sulfur dioxide (SO2) and nitrogen oxides (NOx). Studies have shown that the concentrations of ions and secondary carbons increase in high-concentration PM2.5 [21,22]. PM2.5 in the air is mainly composed of water-soluble ion components, oxidized metal elements, organic carbon (OC), elemental carbon (EC), and water [23]; however, the composition varies depending on the source [24]. For instance, PM2.5 in large cities is generally composed of mineral dust (mainly from road erosion, construction, and demolition) and carbon materials generated from transportation, and other urban sources [25]. In contrast, particulate matter in industrial complexes is mainly composed of secondary inorganic components from industrial sources [26].
Among water-soluble ions, ammonium (NH4+), sulfate (SO42−), and nitrate (NO3) constitute a high proportion of PM2.5 [27,28]. SO42− and NO3 are produced from SO2 and NOx gases, respectively, both of which are generated during the combustion of fossil fuels. The carbon component is either directly discharged into the atmosphere in a particulate form or is condensed into a particulate phase by the conversion of anthropogenic or biogenic volatile precursors from the gas phase to the particulate phase [29].
PM2.5 composition also differs between regions [30,31], and it is important to understand the characteristics of the chemical composition of PM2.5 for different regions [32]. Furthermore, investigating the characteristics of these chemical components could be immensely beneficial for quantitatively evaluating the risks to human health.
PM2.5 in cities with higher contributions from vehicles and industries is more toxic [33]. However, the differences exist in toxicity even in similar levels of PM2.5 absorbed by respirators due to the difference in toxicity of the components in PM2.5 [34]. The composition of PM2.5 in industrial complexes is different from that observed in residential areas; therefore, further studies on the effects of PM2.5 on air quality in industrial complexes as well as residential areas are required [35,36].
In the present study, the changes in the components of PM2.5 due to the influence of industrial complexes in the Ulsan Metropolitan City were analyzed. Many cities in Korea have several industrial complexes; among them, the Ulsan Metropolitan City has a geographical advantage for monitoring as the air pollutants that are generated from industrial complexes and pass through the downtown area can be observed from an intensive monitoring site set up in the city. Using the trace elements in PM2.5 as tracers, the effect of air pollutants emitted from industrial complexes near the Ulsan Metropolitan City on the urban air quality according to the air flow was analyzed.

2. Materials and Methods

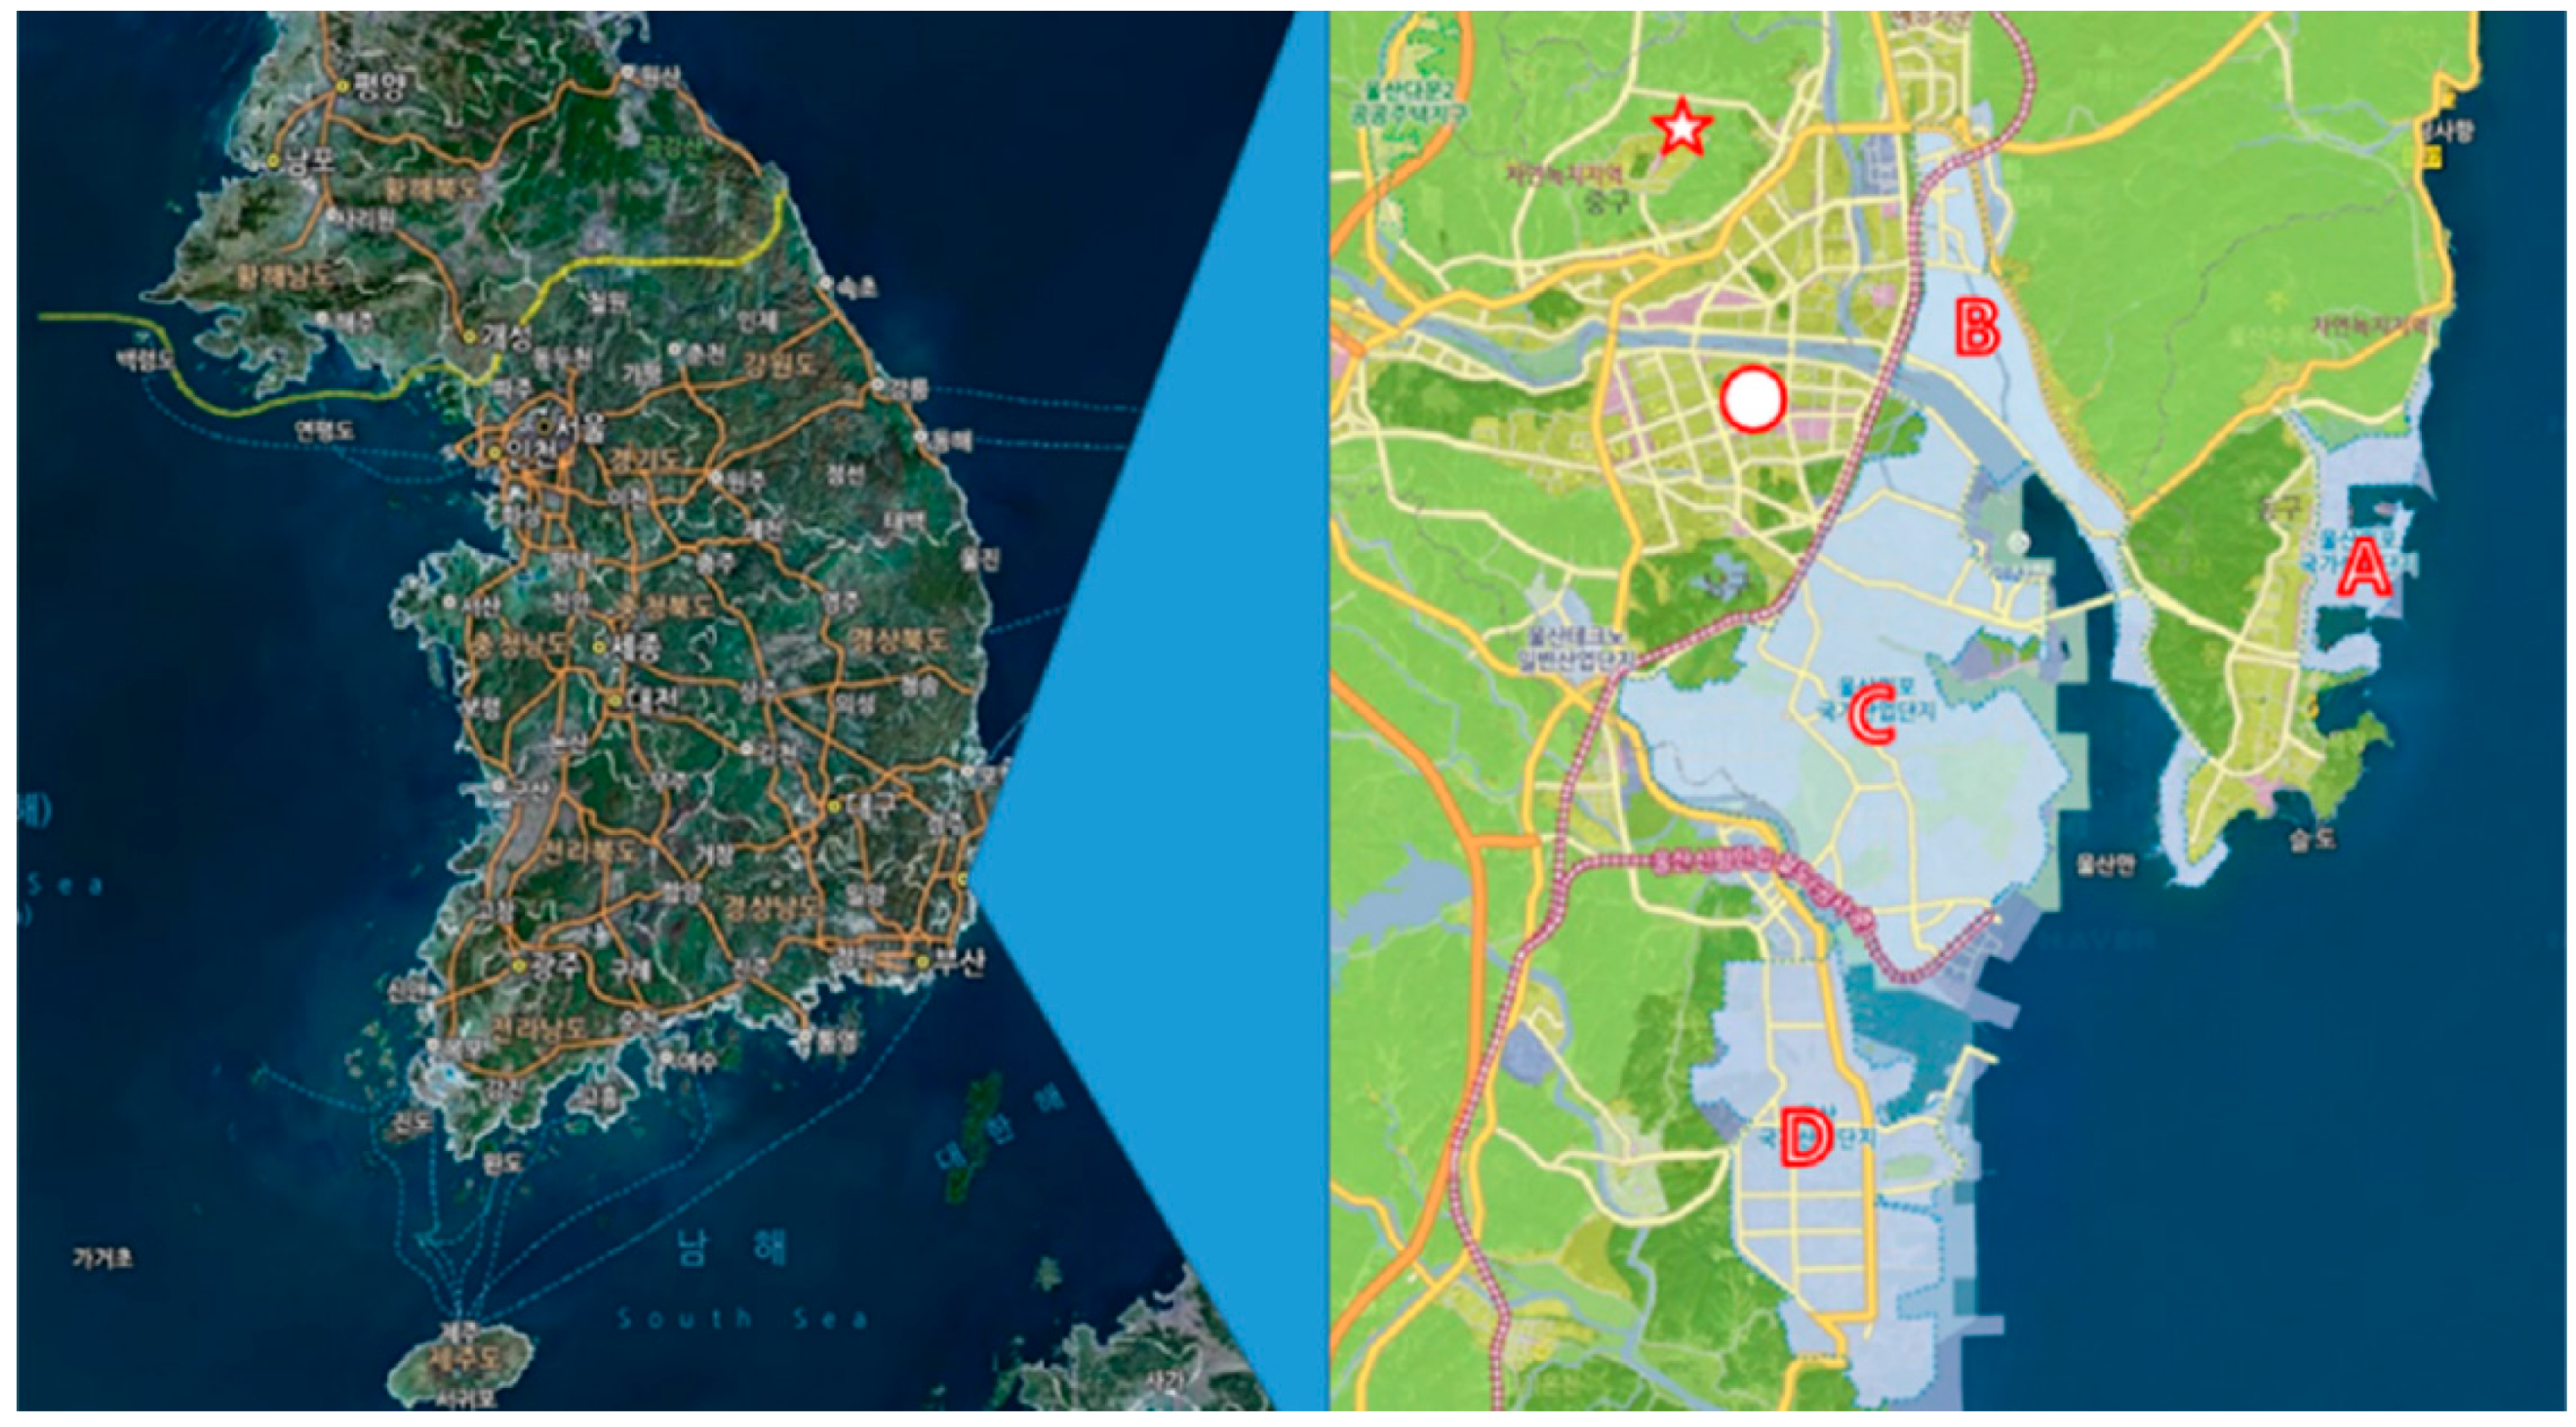
2.1. Description of Study Area and Determination of the Air Flow Affecting the Air Quality in the Industrial Complex Area

The monitoring site in the study area is located near industrial complexes (Figure 1). The Ulsan Metropolitan City is an industrial city located in southeastern Korea, and covers an area of 1062 km2 with a population of 1,175,000 people. The Ulsan Metropolitan City contains four large industrial complexes, including the Ulsan Mipo National Industrial Complex and the Onsan National Industrial Complex. The Mipo National Industrial Complex is the largest heavy chemical industrial complex in Korea, and encompasses shipbuilding, heavy industry (A in Figure 1), automobile and steel industry (B in Figure 1), and petrochemical plants (C in Figure 1). Onsan National Industrial Complex is a nonferrous metal industrial complex (D in Figure 1). Vanadium (V), titanium (Ti), and Zinc (Zn), and nonferrous metal-smelting plants operate in these complexes (C and D in Figure 1). These industrial complexes are expected to have direct effects on the air quality of residential areas due to their proximity to the downtown area of Ulsan. The particulate matter in the air in Ulsan contains trace materials discharged from these industrial complexes, which may have harmful effects on human health, and therefore need to be continuously tracked and monitored [37].
In this context, an intensive air quality monitoring station was installed in the southeastern region in 2013 (Figure 1) to examine the effects of local industries on the air quality in Ulsan. This station determines the concentration of PM10 and PM2.5 and the composition of PM2.5 by measuring the component data (such as ions, carbon, and heavy metals) in real time using automatic monitoring equipment. Because the downtown city area is located between the monitoring station and the industrial complexes, the station is expected to be able to analyze the effects of the pollutants discharged from the industrial complexes on the downtown area (for southeastern winds) as well as the effects of the pollutants discharged from the downtown area.
Because the monitoring station is located away from the industrial complexes, a case that was expected to affect the air quality of the station by particles generated from the industrial complexes was selected to analyze the components of PM2.5, and an additional analysis of this case was performed. For this air flow condition, the concentrations of the components of PM2.5 were compared with those from the weather data, and the case of air flow into the urban area of Ulsan was selected by identifying a tracer from the PM2.5 components.

2.2. Data

The data used in this study included the concentrations of PM2.5 and PM10 over time that were measured by the intensive air quality monitoring station in the Ulsan Metropolitan City. Furthermore, it also included the concentrations of eight ions that constitute PM2.5 (SO42−, NO3, Cl, Na+, NH4+, K+, Mg2+, and Ca2+), which were automatically sampled over time and analyzed using an Ambient Ion Monitor (URG-9000D, URG, Chapel Hill, NC, USA). The data from Ambient Ion Monitor agreed with those obtained using a filter at low levels of sulphate (<20 µg/m3) and SO2 (<30 ppbv) [38]. Concentrations of OC and EC were measured using the nondispersive infrared (NDIR) method (Model-4, Sunset Laboratory Inc., Tigard, OR, USA). The relative standard deviation (RSD) for OC and EC have been reported as 5.3–5.6% and 9.6%, respectively [39]. The concentrations of 9 elements (K, Ti, V, Mn, Fe, Ni, Zn, As, and Pb) were measured over time using X-ray fluorescence spectrometry (Xact625, Cooper environmental, Beaverton, OR, USA). The RSD of Xact625 has been reported less than 2.04% [40], and this instrument can measure additional metals; however, owing to a matter of permission, this study could not report data for toxic elements. These data were confirmed following testing and calibration of the data that were analyzed every 3 days using a Zefluor (for ions), Quartz (for carbon), and Teflon (for heavy metal) filter.
Synoptic weather observation data (temperature, wind direction, wind speed, relative humidity, and air pressure) from the Ulsan Weather Station from 00:00 on 1 January 2017 to 23:00 on 31 December 2017 were used for the air flow analysis.

2.3. Statistical Analysis Method

Several statistical procedures were followed to remove the effects of external sources of pollution and to understand the emission characteristics of the industrial complex in Ulsan. First, (a) the average annual, seasonal, and diurnal and wind-specific average of PM2.5, PM10, and components of PM2.5 in the atmosphere observed every hour (ionic, carbon, and heavy metal components), (b) standard deviations, and (c) comparison using linear relationships were analyzed. Linux-based Fortran was used for data statistics, and SigmaPlot 12.5 (Systat Software Inc., San Jose, CA, USA) was used for visualization.
As the diurnal changes of the particulate matter concentration are affected by commuting [41], we analyzed the hourly changes of OC and EC over time. Additionally, linear regressions using the r2 values of hourly concentrations of Zn, Pb, As, Fe, and Mn were performed to analyze the effects of emissions from the industrial complex on the air quality monitoring station.

3. Results and Discussion
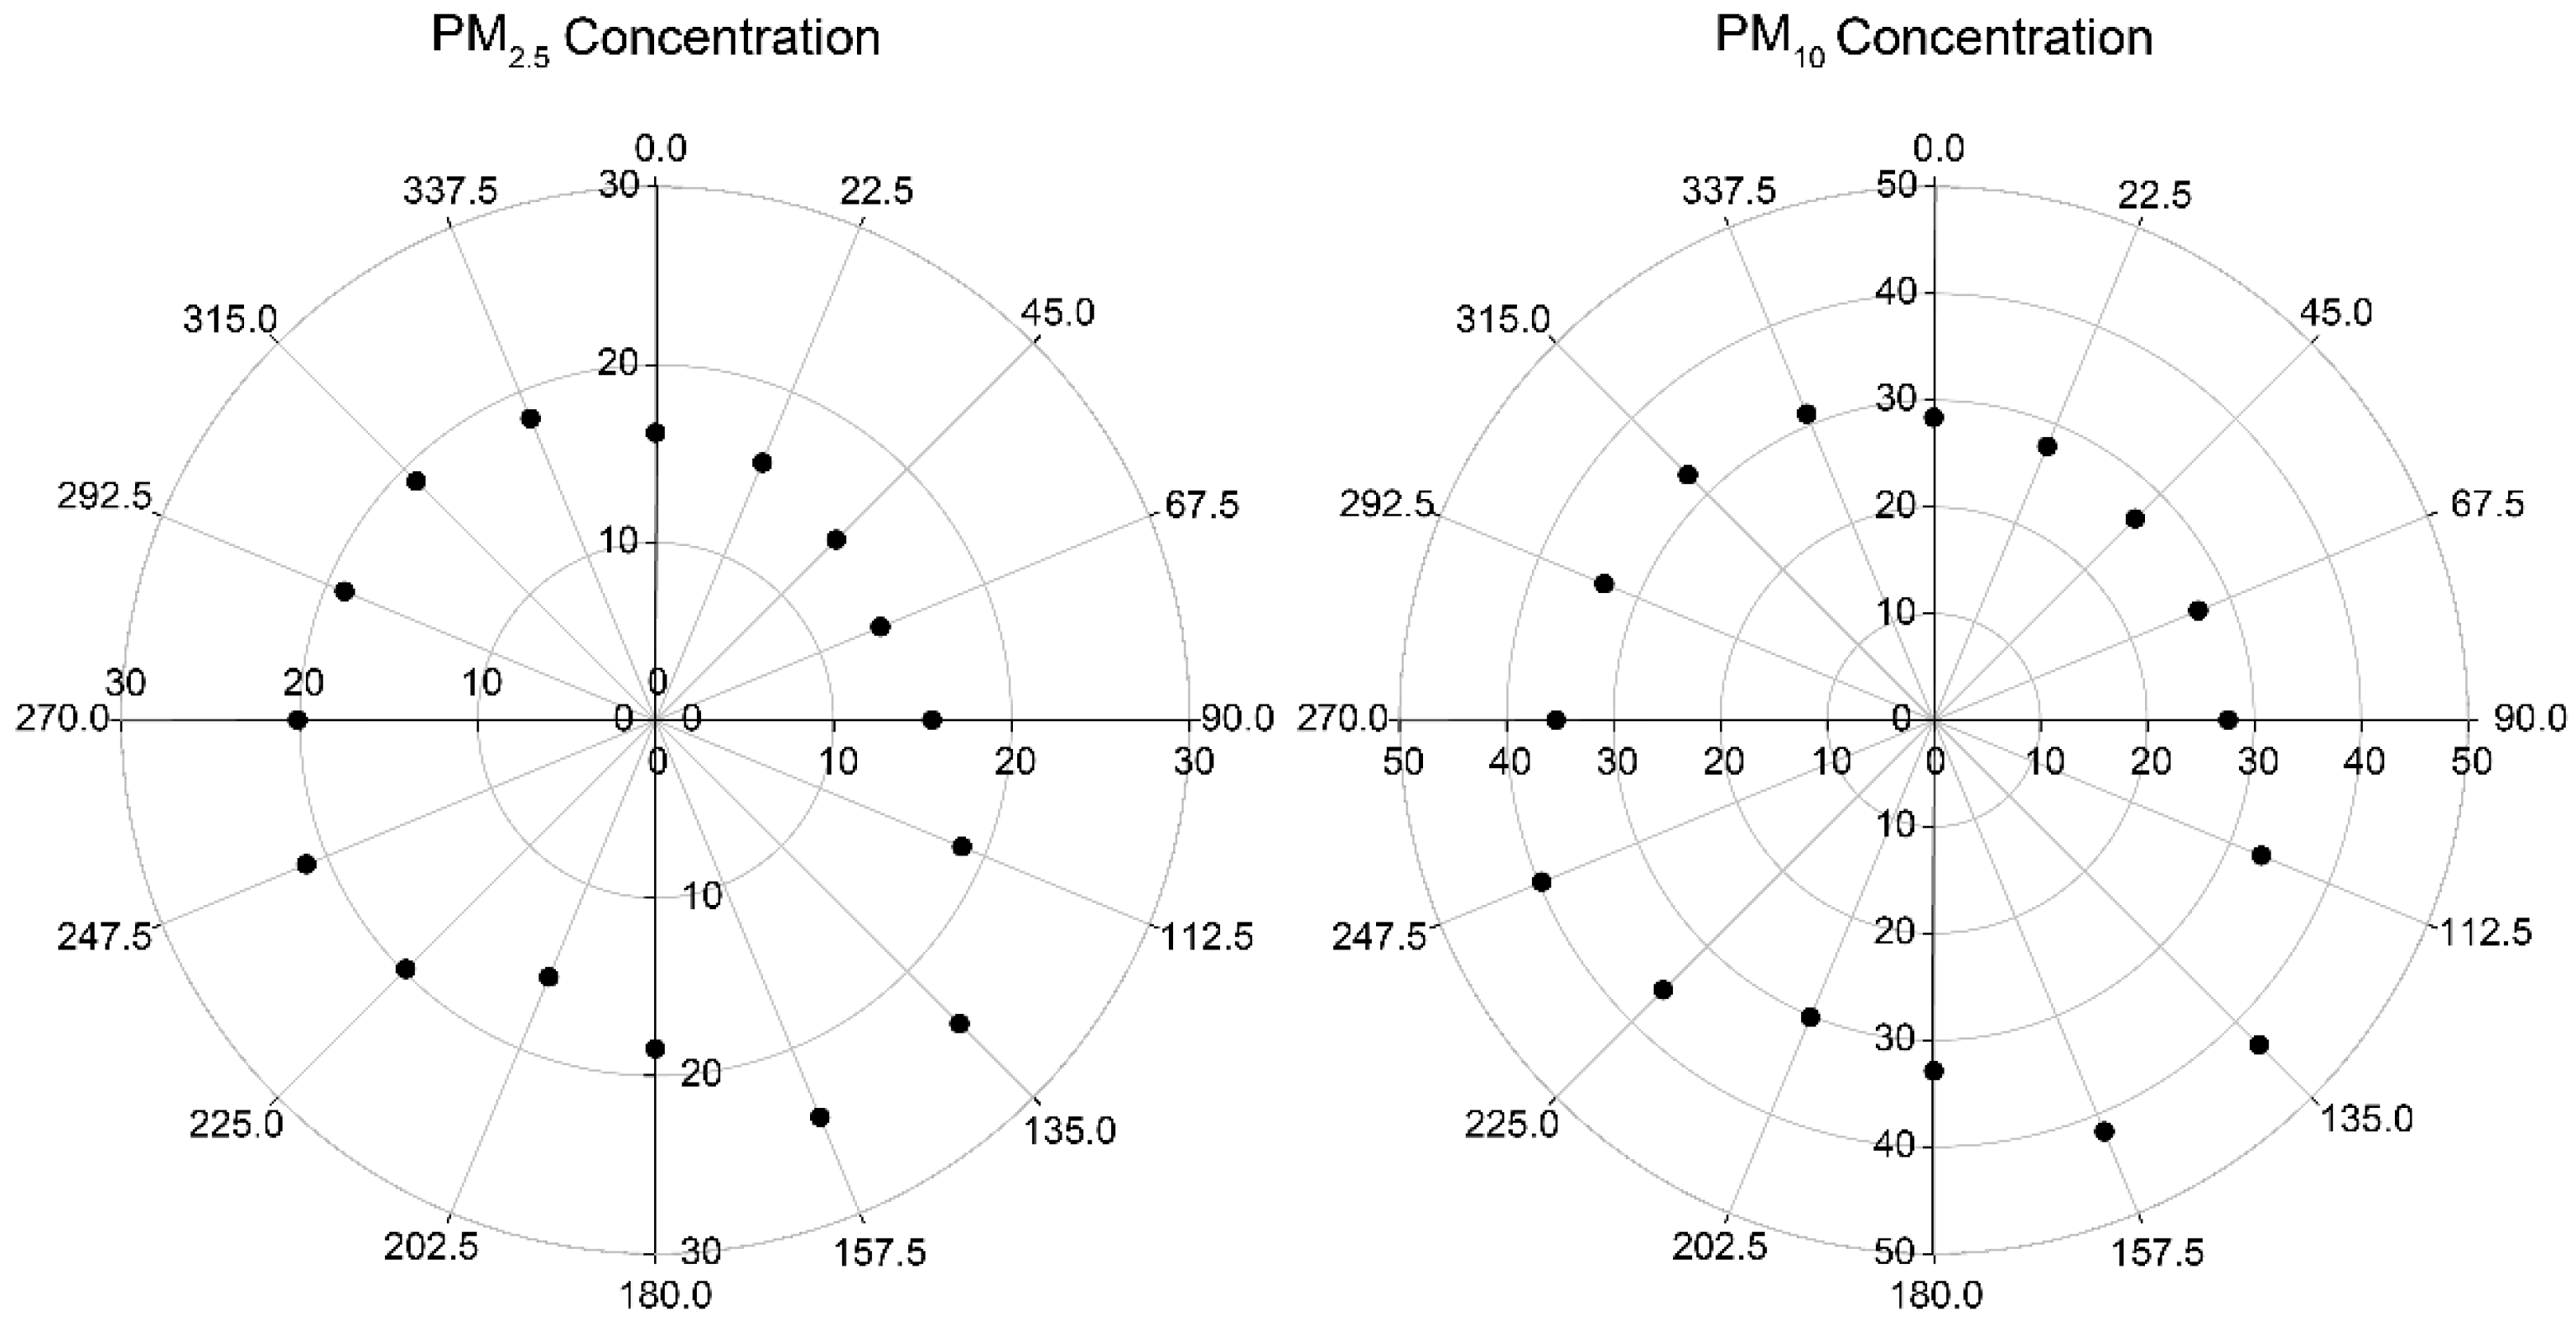
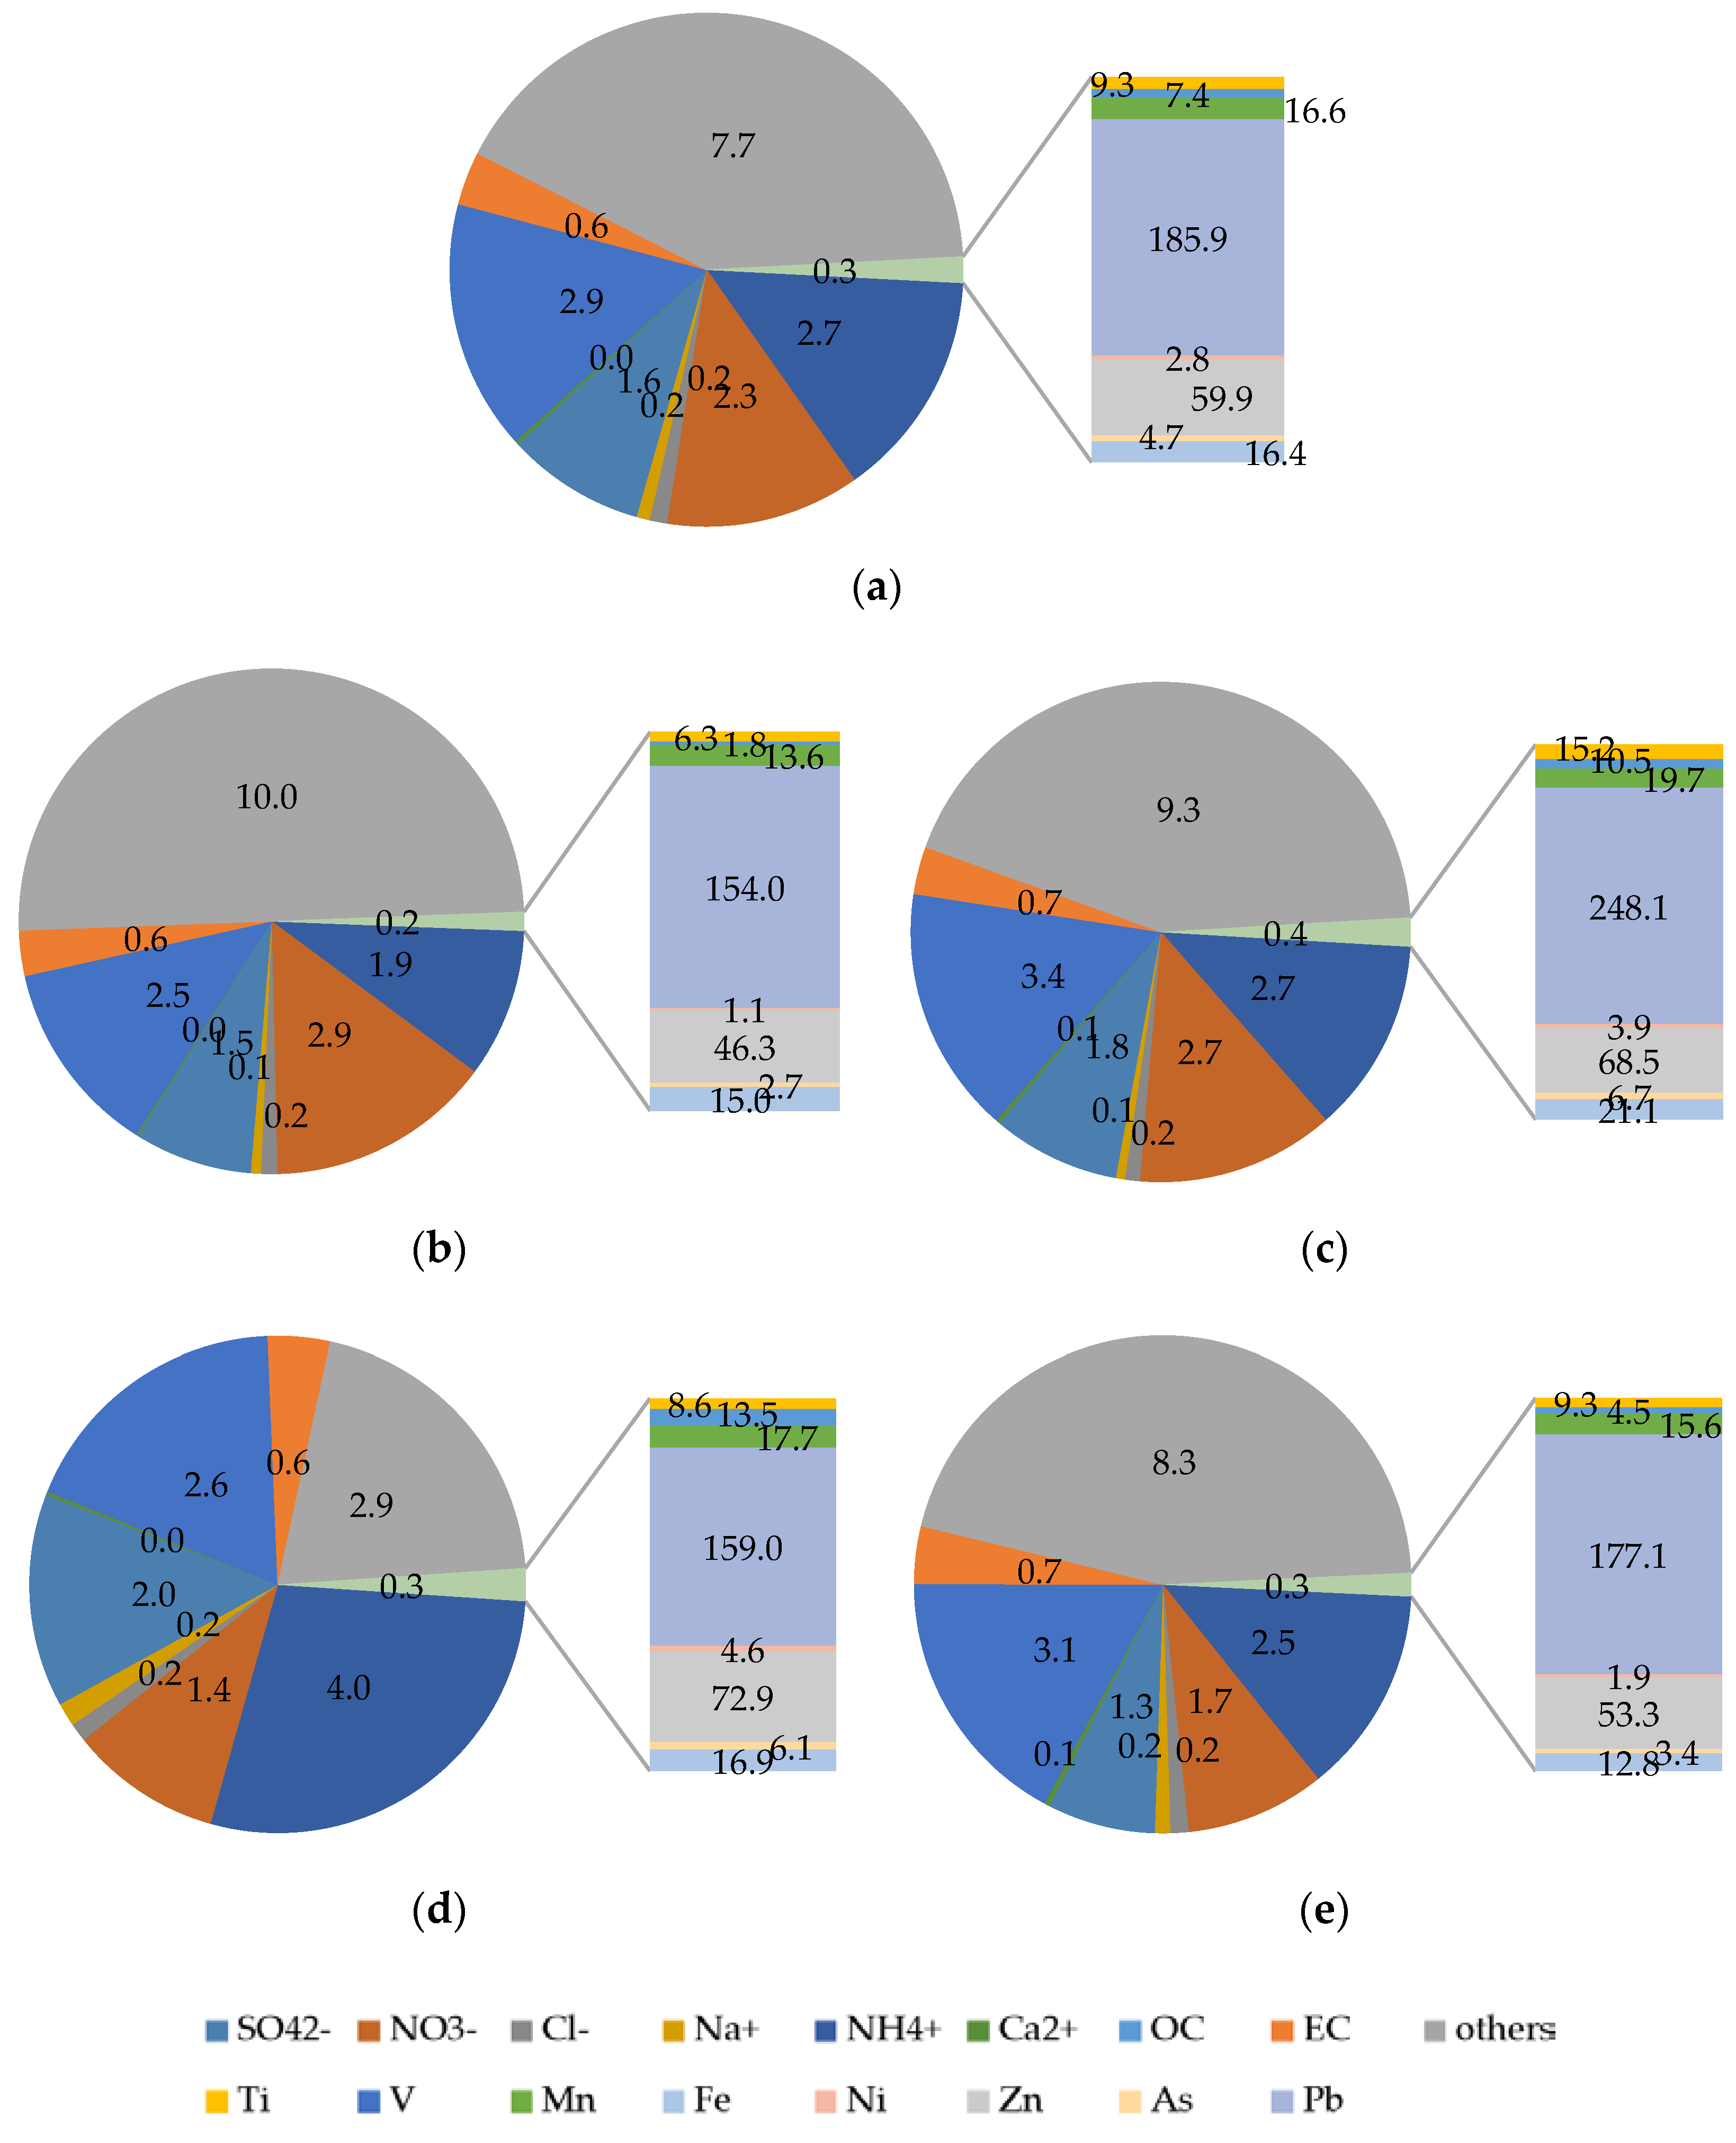
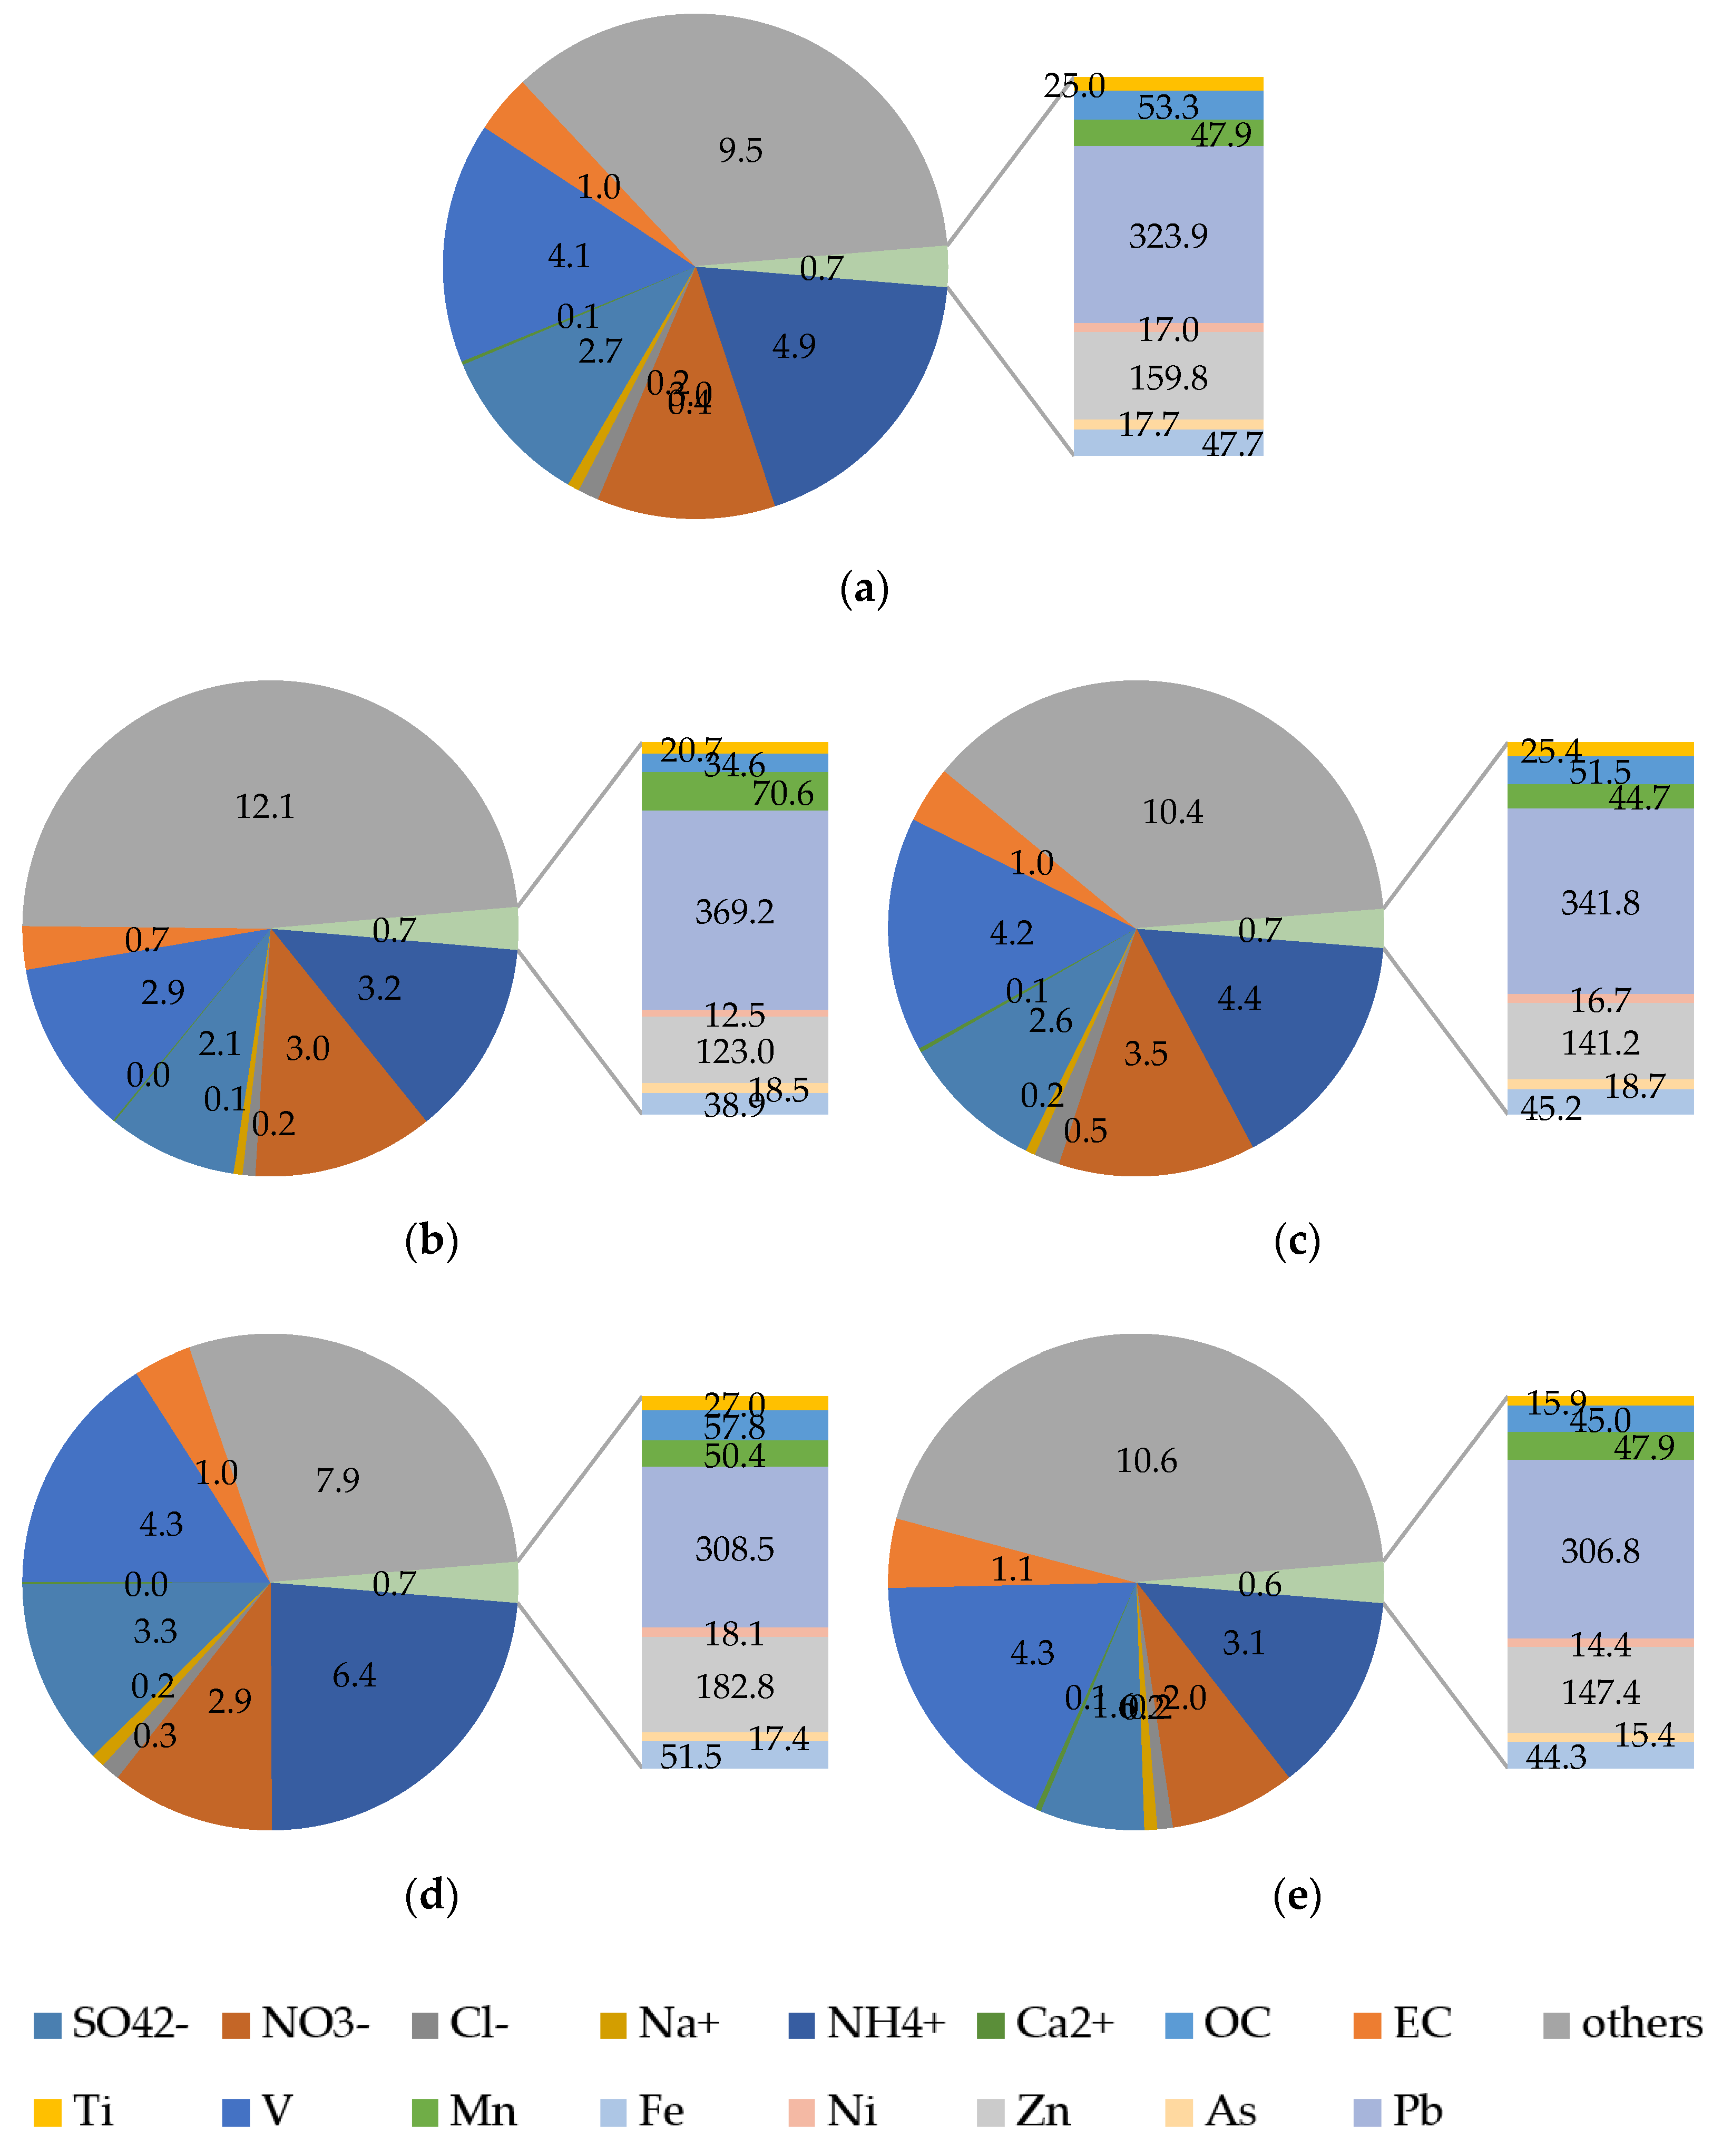
The annual mean of the PM2.5 and PM10 concentrations (obtained from hourly data of Ulsan in 2017) was analyzed to be 18.50 µg/m3 (18.22–18.78 µg/m3, 95% CI) and 32.35 µg/m3 (31.91–32.78 µg/m3, 95% CI), respectively. PM2.5 concentrations decreased with the improvement in air quality of Ulsan from 40.8 µg/m3 in 2003 [27] to 30.2 µg/m3 in 2008–2009 [37]. However, the PM2.5 and PM10 concentrations from 2017 were still higher than the WHO guidelines on annual mean (5 and 15 µg/m3, respectively) [42]. Hence, additional analysis of PM2.5 and PM10 concentrations are necessary to reduce their concentrations in the Ulsan Metropolitan City.
The dominant wind direction was from the north, and the PM2.5 and PM10 concentrations tended to be high in the southeasterly direction and low in the northeasterly direction (Figure 2). This can be assumed to be the effect of industrial complexes when considering their locations (Figure 1).

3.1. Air Analysis

Figure 3 and Table S2 presents the statistics of the data obtained in 2017 at the intensive air quality monitoring station. The results of the analysis of the ion components of PM2.5 showed generally high concentrations of SO42− and NH4+ in summer. Although the SO42− and NH4+ concentrations increased in summer, the PM2.5 concentration decreased. Moreover, the mean ratio of SO42− and NH4+ in PM2.5 was 23.98 and 11.83% in summer, respectively. The SO42− concentration in summer increased because of the photochemical activity that can increase the fraction of sulfate in total sulfur ([SO42−]/[SO2] + [SO42−]), which is consistent with the results of previous studies [43,44,45] that reported the concentration to be greater in summer (18%) than in winter (11%). In contrast, the NO3 concentration was the largest in winter (13.13%) for all the cases, followed by that in spring, fall, and summer. These results are consistent with those from a previous study [43].
EC is a primary pollutant generated only by the combustion process [46], whereas OC is generated primarily or secondarily in the form of aerosols [47]. In the present study, the annual mean concentrations of OC and EC were 2.91 and 0.62 µg/m3, respectively, in 2017. Regarding seasonality, OC concentrations were high in spring, whereas EC concentrations were high in winter. The annual mean OC/EC ratio was 5.62 (5.52–5.73, 95% CI), which was low in winter (4.98 (4.89–5.07, 95% CI)) and high in spring (6.78 (6.46–7.10, 95% CI)).
Compared to the results of previous research, the OC and EC concentrations measured in Cheongju (44.2 µg/m3 PM2.5) between October 1995 and August 1996 were 4.99 and 4.44 µg/m3, respectively [43]. The OC and EC concentrations in Sihwa (35.4 µg/m3 PM2.5) were 9.8 and 1.8 µg/m3, respectively [48]. The OC and EC concentrations in Seoul (72.5 µg/m3 PM2.5) in October and November 2011 were 18.0 and 8.13 µg/m3, respectively [21]. The OC and EC concentrations in Incheon between 2009 and 2010 (42.56 µg/m3 PM2.5) were 8.04 and 1.79 µg/m3, respectively [49]. These concentrations (reported by previous studies) are higher than those presented in this study, and the difference can be attributed to the lower PM2.5 concentration compared with that of previous studies, which led to the lower concentrations of its components. In this study, the OC and EC contents in PM2.5 were 16.4 and 3.3%, respectively. In previous studies, OC contents ranged from 11.3 [43] to 27.7% [48], and EC contents ranged from 4.2 [49] to 11.2% [21]. Hence, the annual mean of the OC and EC proportions in PM2.5 is considerably similar to that presented in this study.
Heavy metal concentrations in all cases were similar to those measured in Milan in 2002 (119–342 ng/m3 K, 6–14 ng/m3 Ti, 3–7 ng/m3 V, 5–18 ng/m3 Mn, 120–309 ng/m3 Fe, 2–9 ng/m3 Ni, 1–3 ng/m3 As, and 13–55 ng/m3 Pb) [50], and in four cities in Spain (6.32–53.81 ng/m3 Ti, 5.54–95.29 ng/m3 V, 3.20–13.77 ng/m3 Mn, 3.09–17.20 ng/m3 Ni, 26.40–48.80 ng/m3 Zn, 0.39–1.03 ng/m3 As, and 6.32–23.91 ng/m3 Pb) [51]. However, the heavy metal concentrations measured in this study in Ulsan in 2017 were lower than those reported in downtown Incheon from June 2009 to May 2010 and in Gwangju from February to March 2010 [49,52]. As was the case for the ion and carbon analysis results discussed above, the PM2.5 concentrations in this study were 2–4 times lower than those in previous studies, and the concentrations of the PM2.5 components were also comparatively low. This deduction can be verified by calculating the component proportions in PM2.5. In this study, the proportions of Ti (0.50‰), Fe (10.05‰), V (0.40‰), Mn (0.90‰), Ni (0.15‰), and As (0.26‰) were higher than those reported in Gwangju. Zn (3.24‰) proportions were similar to those reported in Gwangju, and the proportions of K (9.20‰) and Pb (0.89‰) were lower (Ti (0.19‰), Fe (5.23–6.92‰), V (0.09–0.10‰), Mn (0.44–0. 72‰), Ni (0.07–0.10‰), As (0.19–0.21‰), Zn (1.48–3.85‰), K (11.54–22.73‰), Pb (1.48–1.67‰); [52]).

3.2. Analysis of the Impacts of the Heavy Metal Content in the Industrial Complex Emissions on Air Quality

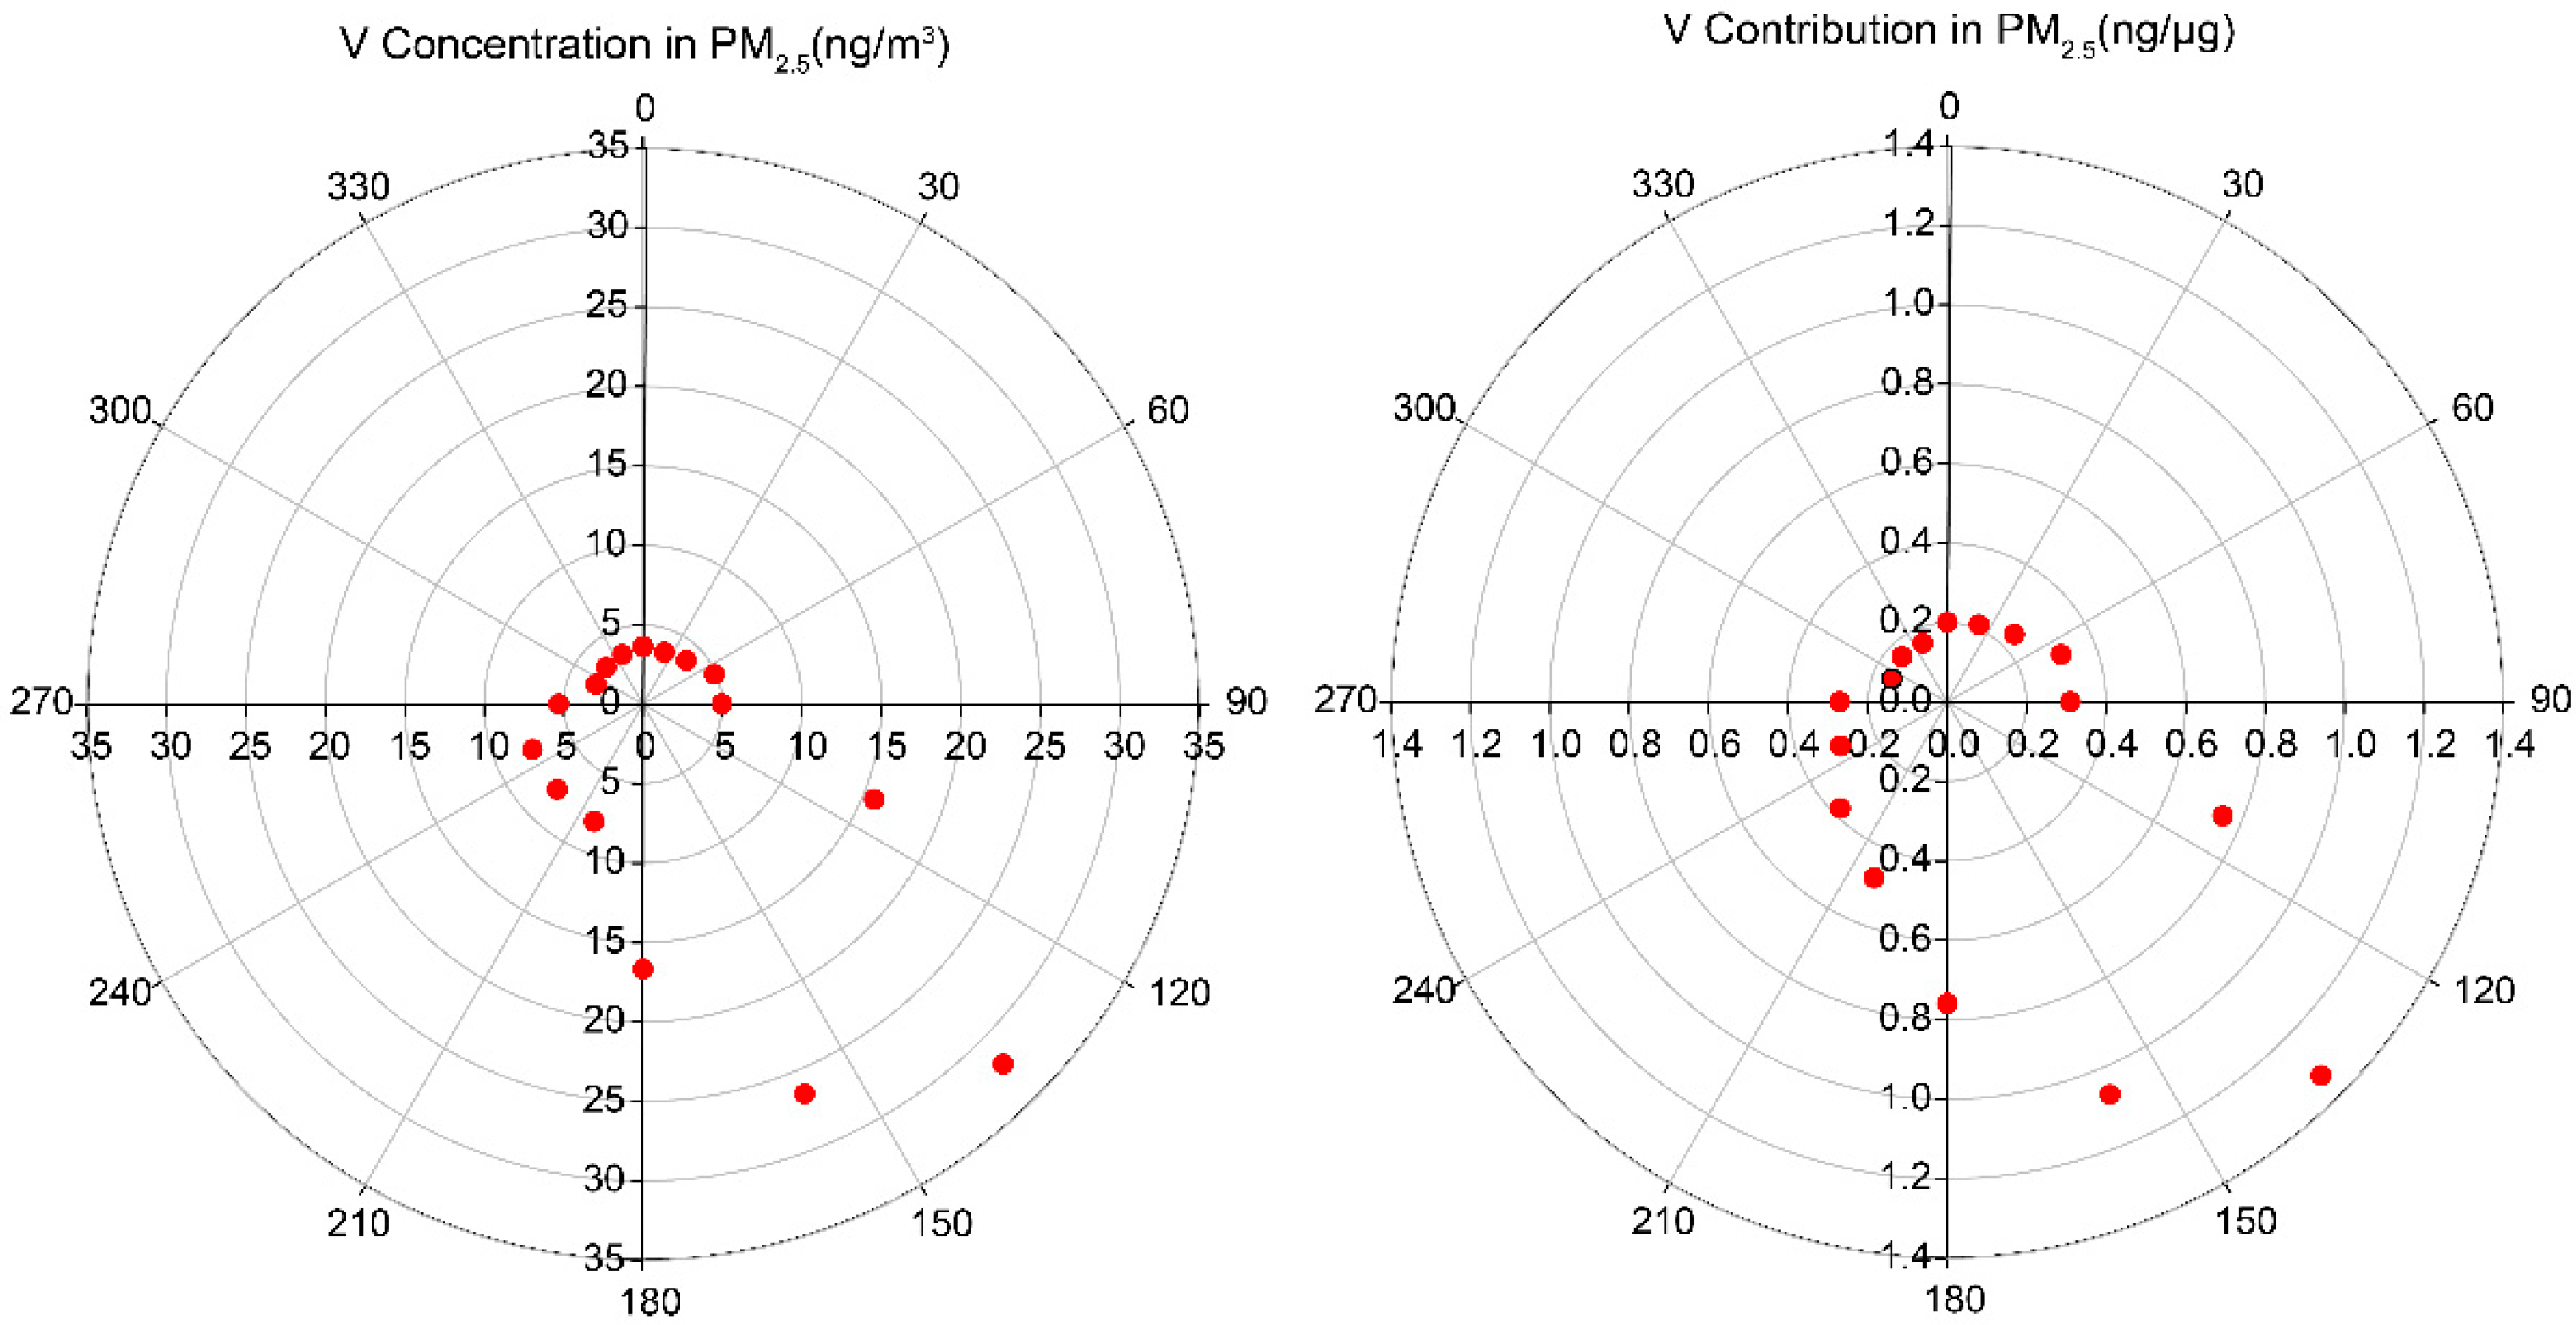
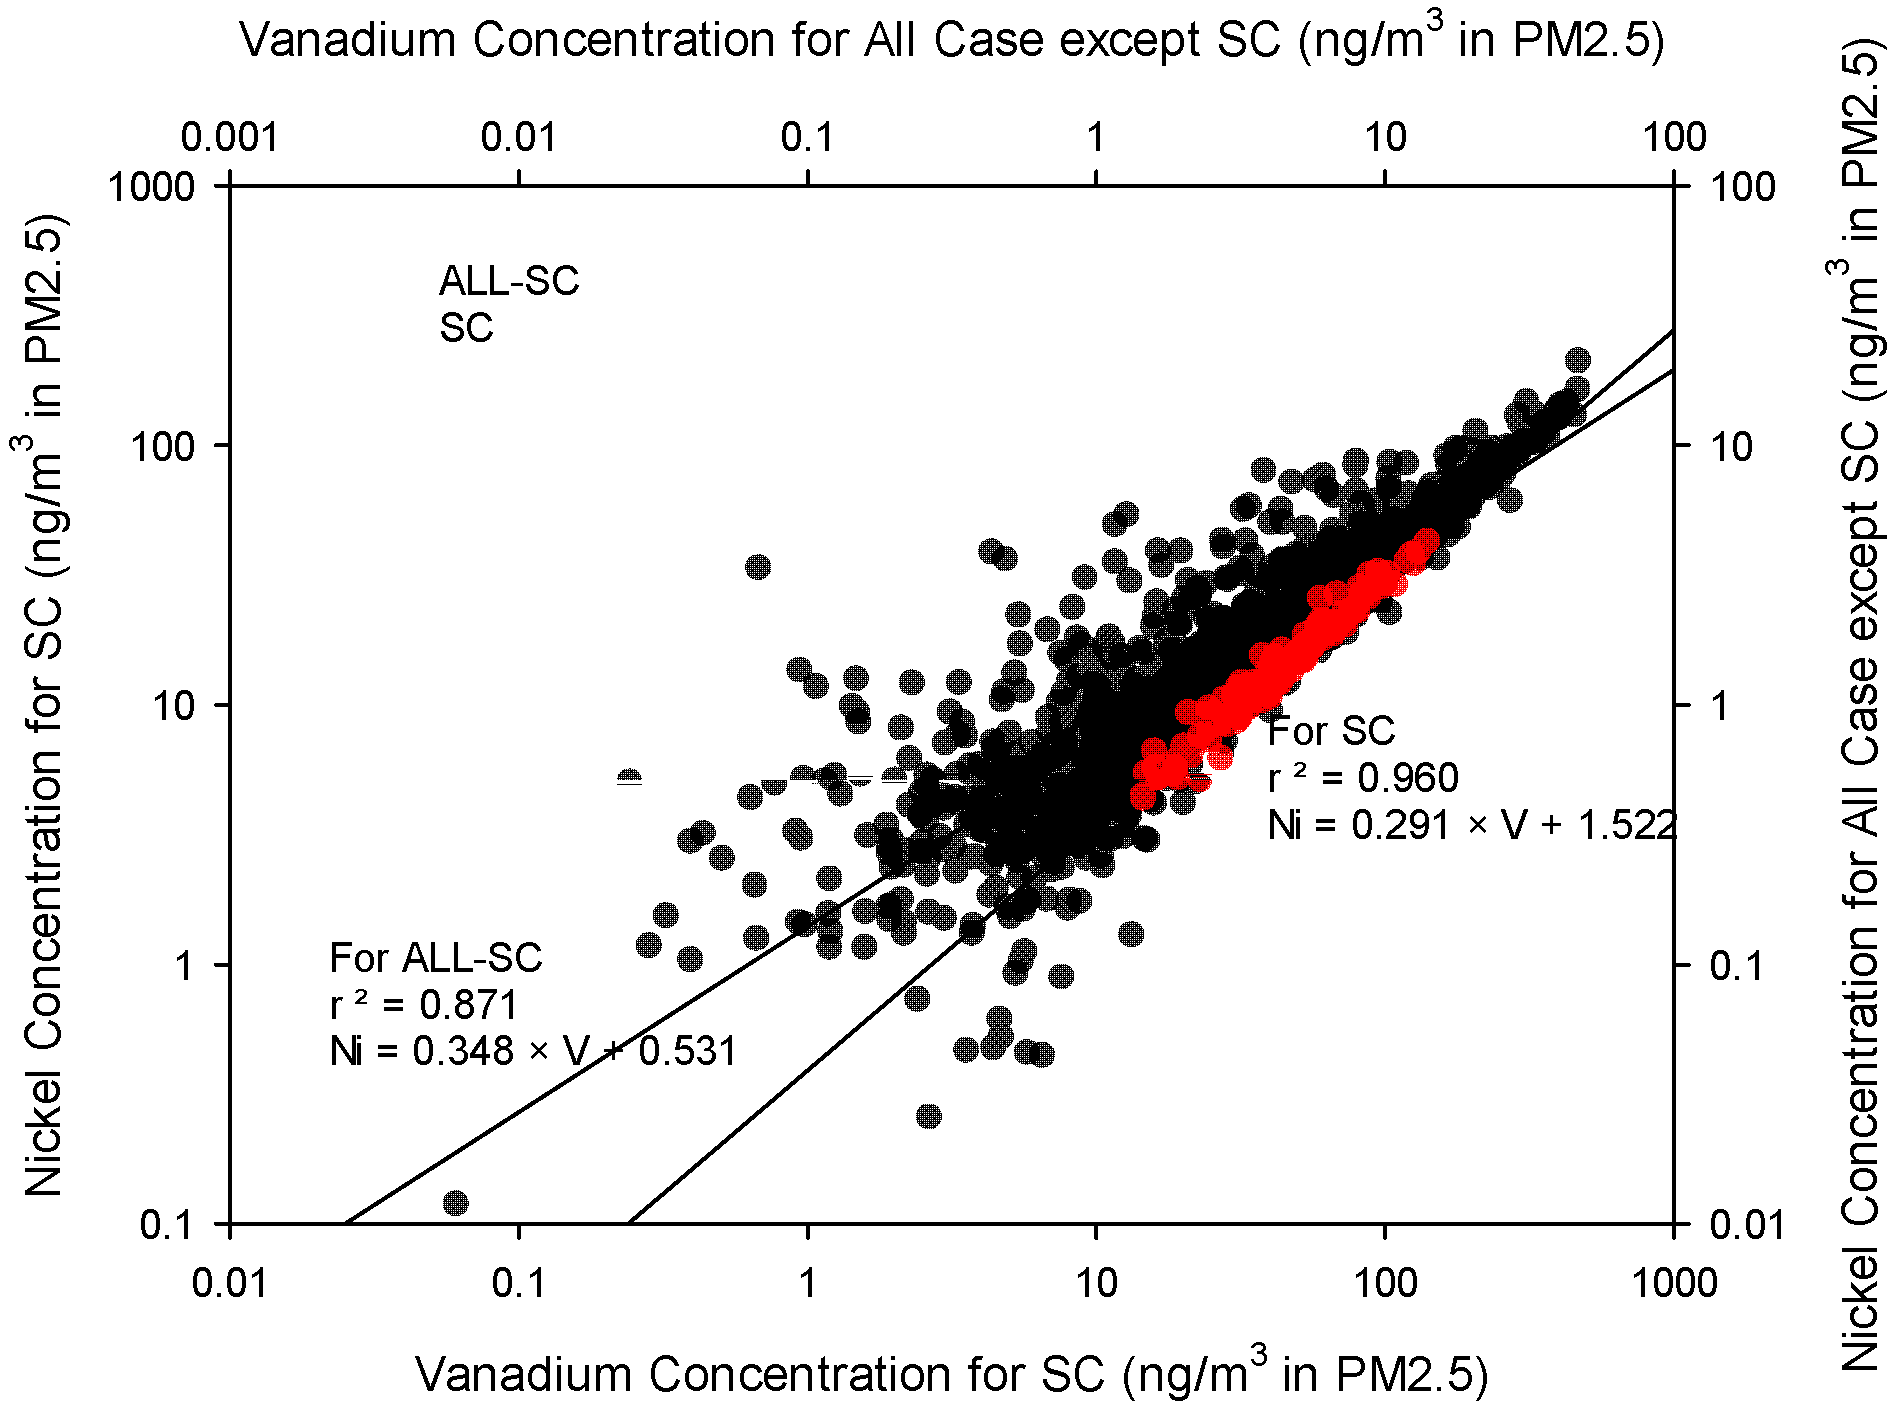
3.2.1. Case Selection Using Vanadium (V) Concentration

Figure 4 shows the V concentrations in PM2.5 depending on the wind direction, and the proportion of V in PM2.5 to remove the dependence of PM2.5 concentration change. The mass concentration of PM2.5 does not significantly depend on the wind direction (Figure 2). However, the proportion of V in PM2.5 was higher than the mean when the wind direction ranged between 90° and 180°.
V is a naturally occurring transition element. Previous studies have shown that humans are exposed to V by breathing in the atmosphere, and that most of it is emitted together with Ni from the combustion of fossil fuels in diesel vehicles, ships, and industrial complexes [53,54,55]. Moreover, the locations of industrial complexes and monitoring stations are insufficient evidence to estimate the effects of PM2.5 and PM10 from the industrial complex. Thus, V, a rare metal component of PM2.5, was used as an airflow tracer in this study, according to the wind direction. The V concentrations changed depending on the wind direction. In particular, the concentration of V in the southeasterly wind direction, where the industrial complex is located (Figure 1), was significantly higher than that in other directions. Therefore, it can be inferred that the concentration of V is affected by the industrial complex.
Many studies have used V in PM2.5 as a tracer of a combustion source [56,57,58,59]. It is expected that applying this method to study the air quality of an industrial city will enable us to analyze the air quality characteristics of the air inflow [60]. Because temporary wind direction changes are considered in the analytical data, this method is predicted to improve the accuracy of the analysis of air pollutants emitted from industrial complexes and can be advantageous for tracing pollutants at the city level compared to the positive matrix factorization (PMF), inverse trajectory analysis method, or airflow analysis method based on changes in the wind direction, which are used for analyzing long-distance movements of air pollutants.
Here, ‘ALL’ refers to the cases that include all data, whereas ‘SCs’ refers to the cases in which PM2.5 concentrations > 11 µg/m3 and at the same time, V in PM2.5 exceeds the annual mean of 1.026 ng/µg. This was implemented to reduce the error due to the measurement limitation of PM2.5 components that occurs when PM2.5 concentration is low, and to remove the cases in which the concentration of V rises owing to high PM2.5 concentration.
When SCs were excluded, the PM2.5 concentration decreased to 17.6 µg/m3 (annual mean: 18.5 µg/m3), and the V concentration decreased to 3.95 ng/m3 (annual mean: 7.39 ng/m3). These values are similar to the PM2.5 and V concentrations reported in Milan, Italy (18.7 ± 6.5 µg/m3 and 3 ± 2 ng/m3, respectively) [50]. Furthermore, these values are lower than those reported in Beijing, where the reported PM2.5 mean concentration was 55.4 µg/m3 and the V concentration was 15.3 ng/m3; however, the proportion of V in PM2.5 in these two studies was similar [61].
Following the SC selection, it was assumed that there would be changes in the correlations between heavy metals in PM2.5 due to the presence of a V smelting plant in Mipo National Industrial Complexes (C in Figure 1); thus, the correlations between heavy metals were analyzed to examine the representativeness of the effect of SC on the air quality of the industrial complexes. First, we examined the correlations between the proportions of V and Ni in PM2.5 between SCs and the cases excluding SCs (ALL-SC) (Figure 5). We found that in the ALL-SC, the correlation coefficient (r) of the ratio between Ni and V was 0.933, which is higher than the correlation (0.762–0.790) reported in a previous study [62]. When only SCs were examined, r was very high at 0.980. This correlation suggests that the heavy metals were emitted from the same source where the proportions of V and Ni remained constant based on previous studies, showing that the V/Ni ratio in PM2.5 varies by the fuel type and combustion facility [54,63], as well as by city [51].
The correlations between different combinations of Zn, Fe, Mn, and Ti were higher in SCs than those in ALL, except the correlation between Ti and Fe (Figure 6). However, the concentrations distributed around the 11:1 line between Ti and Fe were eliminated in SCs. Moreover, both extreme observations of the correlation between Zn and Ti as well as Zn and Fe were eliminated in SCs.
Furthermore, the Mn and Fe concentrations (Figure 7) were distributed between Fe = 3.8 × Mn and Fe = 43 × Mn and bisected near the two lines, with an r of 0.74; however, in SCs, r was 0.92 and the Mn and Fe ratio converged to 1:3.8. Especially, when the airflow affected by the industrial complex was extracted using V, the Mn/Fe ratio converged on 1:3.8, and those concentrations were distributed adjacent to the 1:3.8 line, and data near the 1:43 line had been removed.
The linear regression analysis of the concentrations of the four heavy metals between ALL and SCs showed that the p-values were <0.05, thereby implying that they were statistically significant. Considering these variations in the heavy metal concentrations, we conclude that the air inflow to the air quality monitoring station of the SC is affected by the specific emission sources.

3.2.2. Air Quality Analysis for Selection Cases (SCs)

Figure 8 shows the monthly wind direction frequencies in 16 directions for SCs. The southerly direction was dominant in April, May, June, and July; however, the main wind direction did not appear in other periods. This is because the Northeast Asia region, including South Korea, is an Asian monsoon region with clear seasonal changes in wind direction, and southeasterly winds occur in summer under the influence of high pressure in the North Pacific [64].
In SCs, PM2.5 and PM10 were 26.54 µg/m3 (25.78–27.31 µg/m3, 95% CI) and 45.84 µg/m3 (44.26–47.43 µg/m3, 95% CI), respectively, which were higher than the annual means (Figure 9 and Table S5). In particular, in SC, the concentrations of the metal components were higher than the total mean concentrations.
By component, the concentrations of SO42− and NH3+ were the highest in summer (6.41 µg/m3 (23.98%), and 3.31 µg/m3 (11.83%), respectively), whereas NO3 concentrations were the highest in spring (3.52 µg/m3 (11.64 %)). When analyzed by their proportions in PM2.5, the summer concentrations of SO42− and NO3 were similar to those reported in a previous study of Ulsan industrial complexes in 2003 (7 µg/m3 (27.2%) and 3–11.1 µg/m3 (17.4–25.4%), respectively), and NH4+ concentrations were higher (1.6 µg/m3 (6.2%)) [27]. However, our findings are similar to the results in the Ulsan downtown area in 2008–2009 reported in another study: 30.2 µg/m3 for PM2.5, 7.1 µg/m3 (23.5%) for SO42−, 2.6 µg/m3 (8.6%) for NH4+, and 3.0 µg/m3 (9.9%) for NO3 [36].
The OC concentration was 4.09 µg/m3 (all cases: 2.91 µg/m3), and the EC concentration was 0.99 µg/m3 (all cases: 0.62 µg/m3). Both OC and EC concentrations were higher than the annual means. Both OC and EC showed high concentrations in winter. The OC/EC ratio was 4.04 in winter and 4.41 in spring, indicating small changes.

3.2.3. Analysis of the Effects of Emission Sources for Selection Cases (SCs)

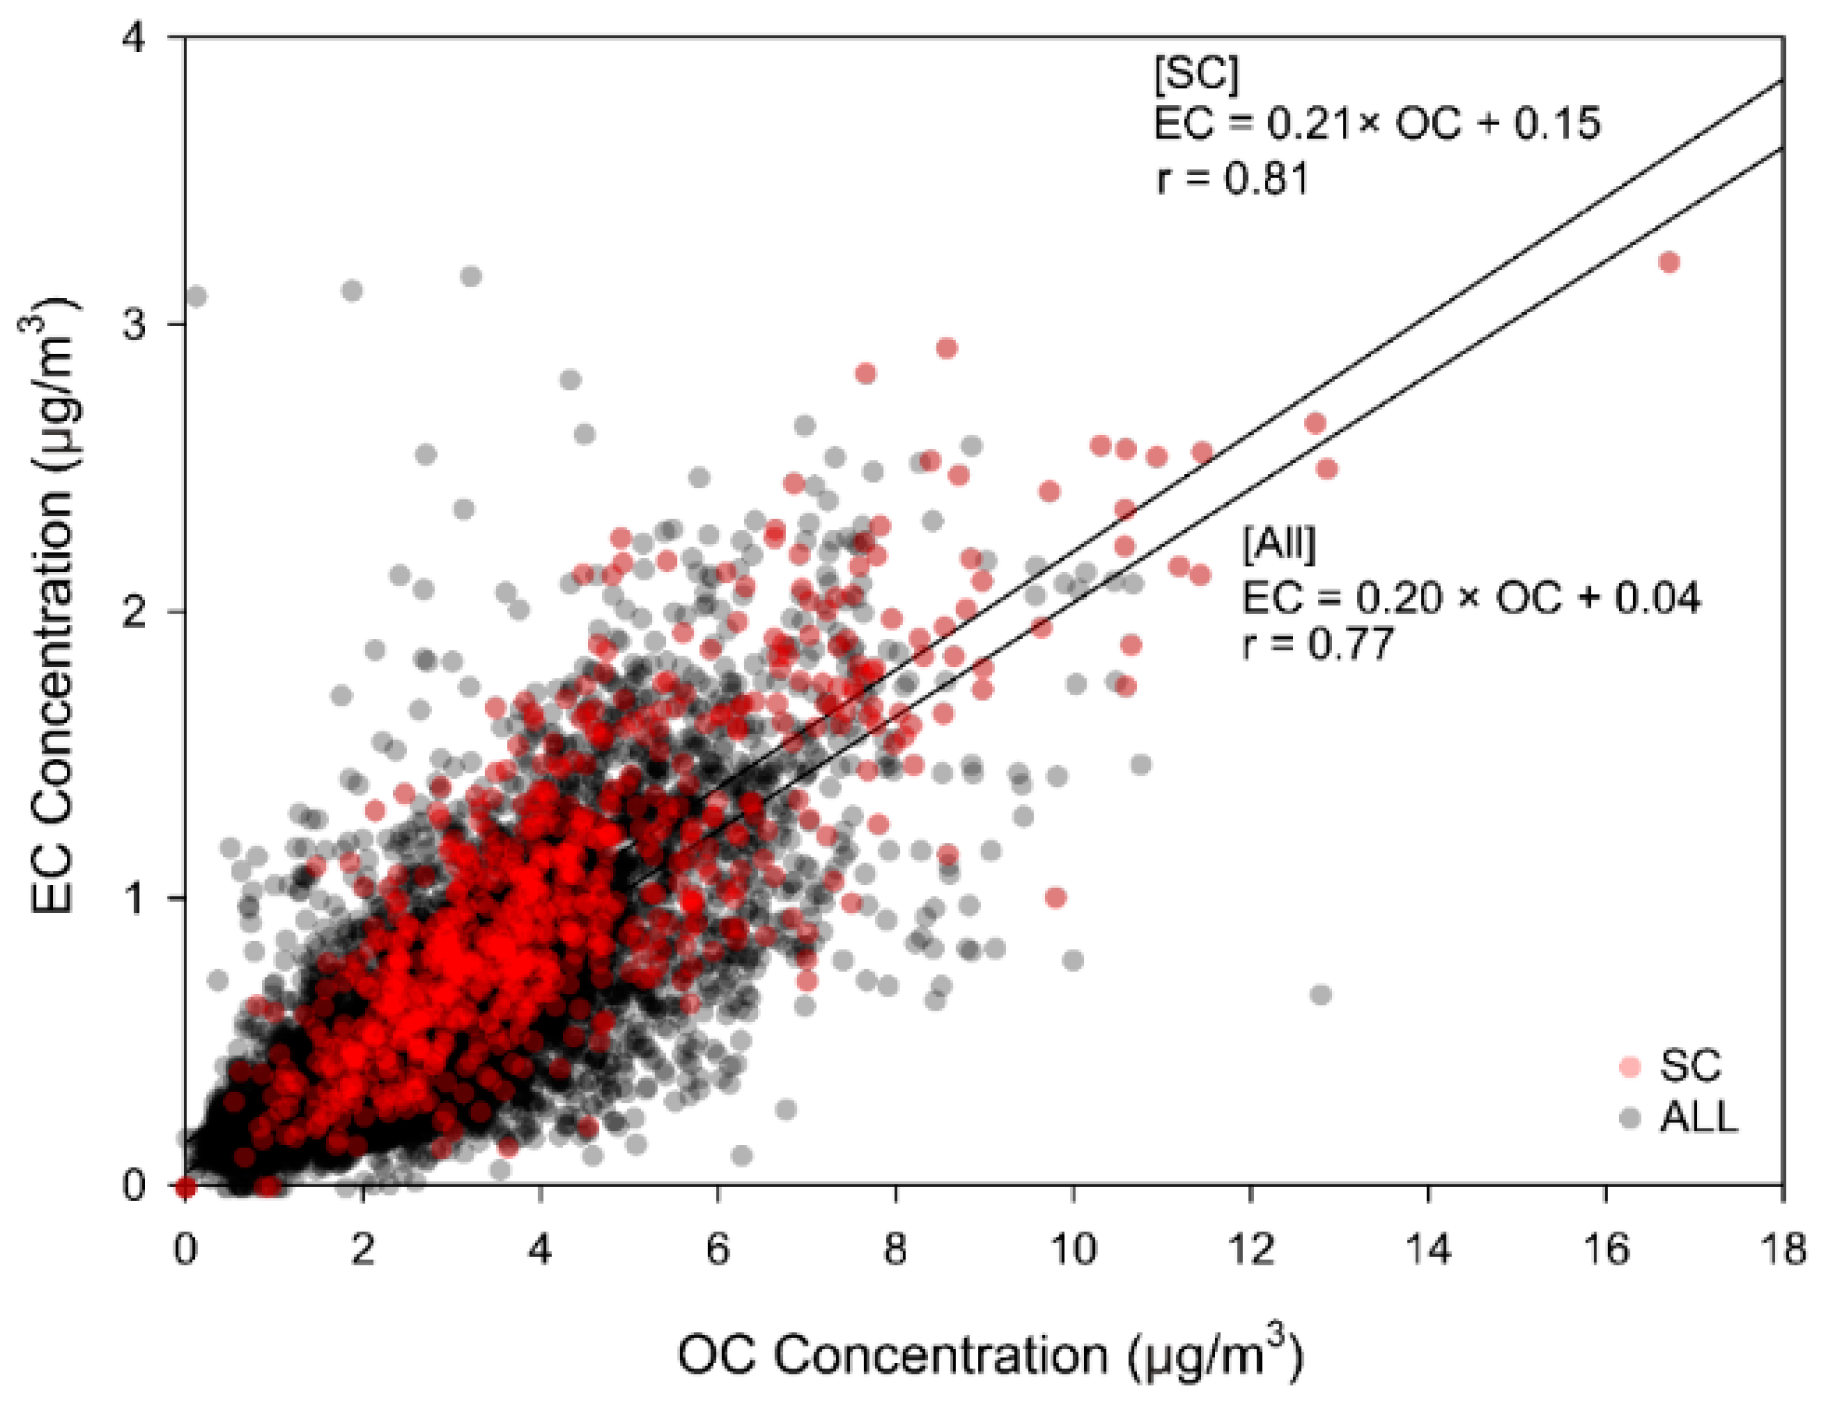
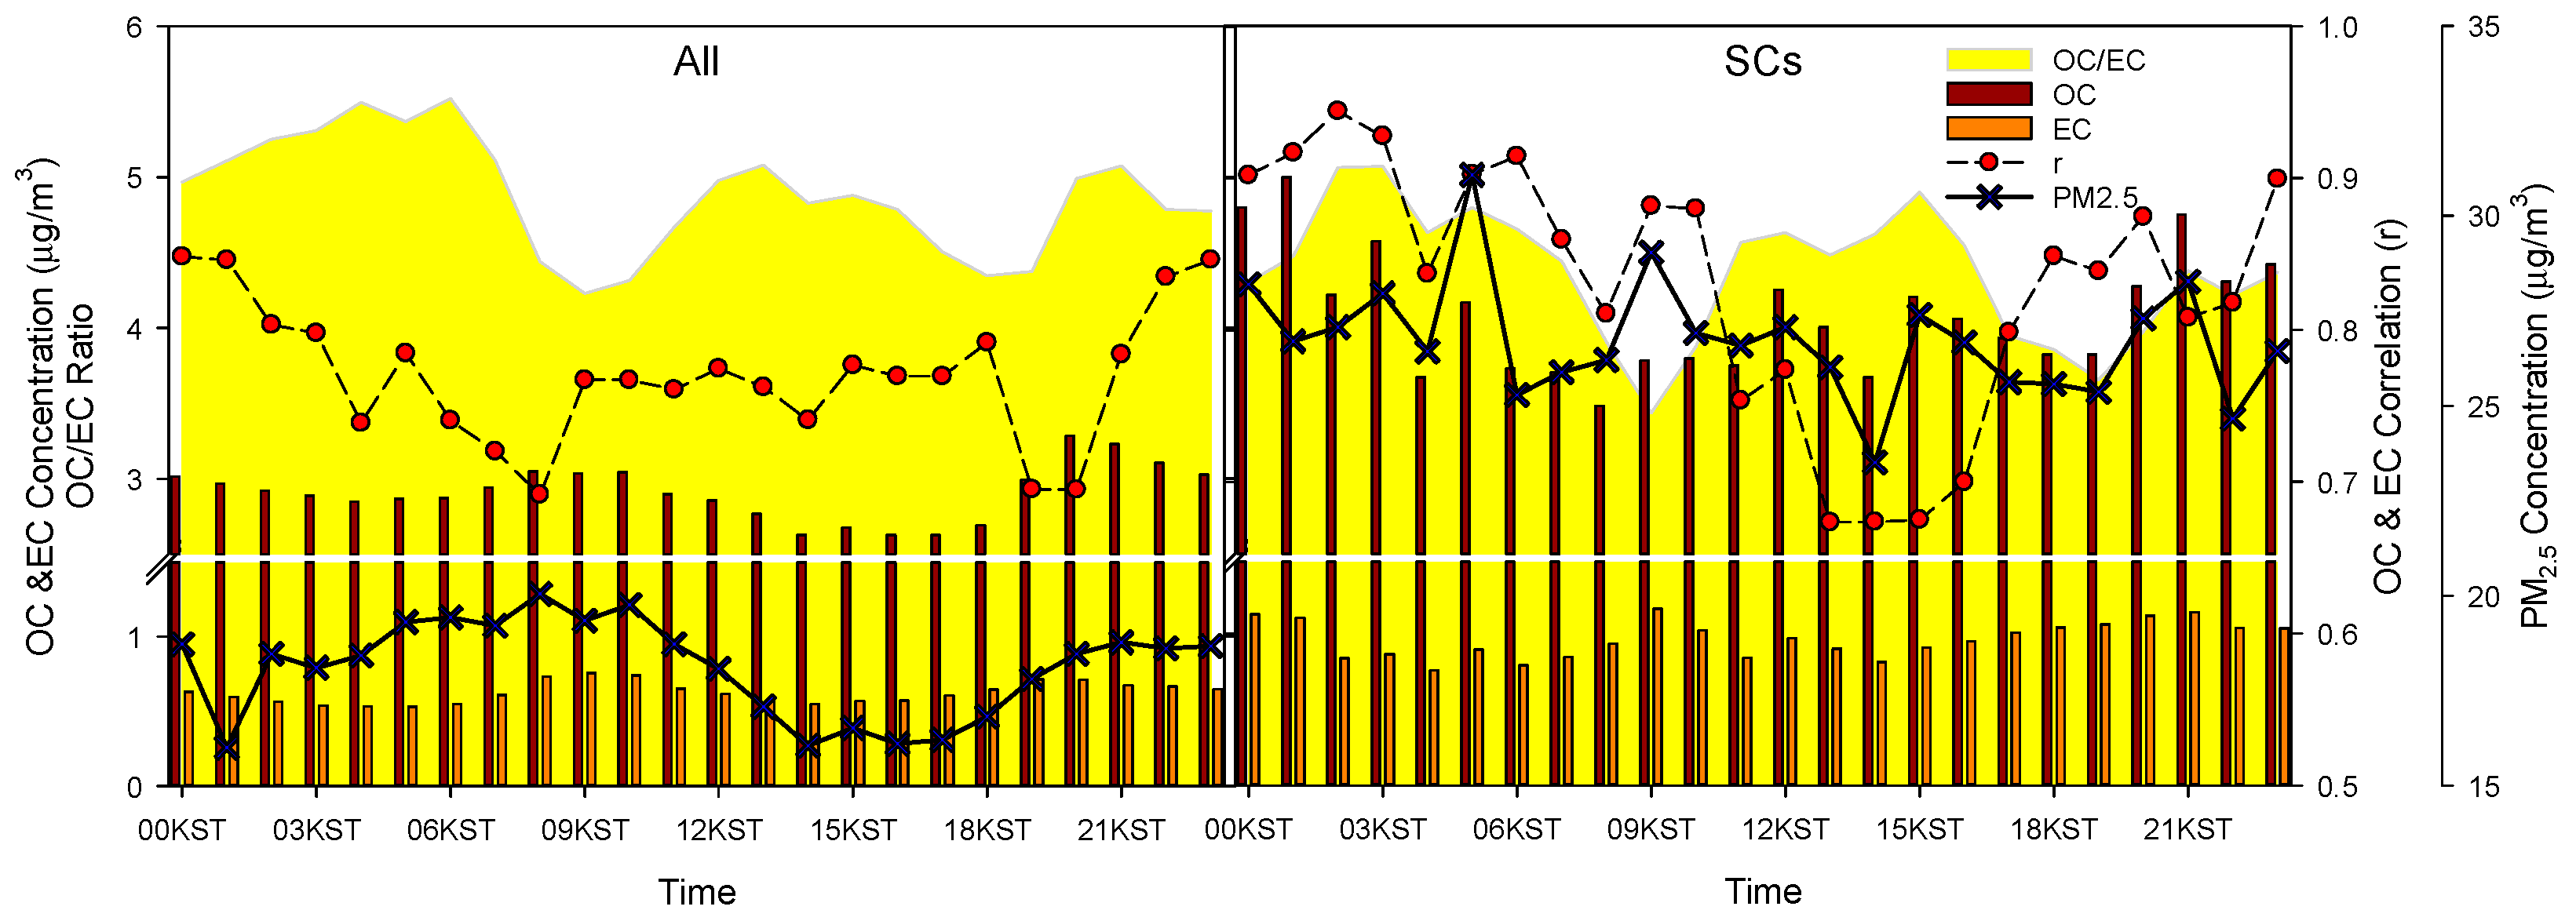
  • Estimation of the effect of carbon emissions from transportation.
EC is mainly generated by the combustion of fossil fuels. It has been used as a tracer of anthropogenic pollutants that are stable to chemical reaction. The OC/EC ratio is used to estimate the amount of secondary organic carbons (SOC) [47,65,66,67], and is an important factor for investigating the emission sources [68,69]. In this study, the correlations between OC and EC concentrations were analyzed, first for all cases, and then for SCs, as shown in Figure 10.
The OC/EC ratio of all cases was 4.87 (r = 0.77); for SCs, it was 4.34 (r = 0.81). The correlation between OC and EC increased compared with all cases, but was still lower than that reported in previous studies (r = 0.79–0.99) [70,71,72]. This is because the diversity of cases increased as the study was conducted for an entire year.
Figure 11 shows that the PM2.5 concentration for all cases tended to decrease during the day, when the atmospheric boundary layer is higher, and increase during the night. However, the PM2.5 concentration of SCs did not show this circadian tendency. In ALL, the OC and EC concentrations showed the peak values (OC: 20 KST 3.29 µg/m3, EC: 09 KST 0.76 µg/m3) and tended to become low during the daytime when the atmospheric boundary layer is high (OC: 14–17 KST 2.63 µg/m3, EC: 14 KST 0.55 µg/m3). In SCs, the OC concentrations did not show circadian changes; however, in ALL, not only PM2.5 concentration but also OC and EC concentrations were higher, and the OC/EC ratio was lower than that in SCs. The EC concentrations showed circadian changes for both all cases and SCs; in other words, EC concentrations increased at rush hour, which is presumed to be due to the effect of vehicular emissions in traffic during the commuting time [73]. Furthermore, in SCs, the EC concentrations were higher and the OC/EC ratio was lower than those in ALL. However, the proportion of the sum of OC and EC in PM2.5 did not show a large difference for SCs (16.39–22.61%), and the trend of the sum of OC and EC in PM2.5 did not follow the diurnal changes of EC (Figures S1 and S2), such as during the rush hour. Thus, we can conclude that traffic does not increase the PM2.5 concentration in SCs, and does not appear to be a major contributor to PM2.5 emissions.
The r2 of OC and EC became lower prior to the morning rush hour and following the afternoon rush hour in ALL; however, in SCs, it became lower outside of rush hours. The high correlation between OC and EC in SCs, excluding the daytime, indicates the consistency of the OC/EC ratio during the corresponding hours and appears to be an effect of specific carbon emission sources such as mobile sources. In contrast, during the daytime (11:00–16:00), the correlation between OC and EC decreased as the carbons emitted from various sources mixed with the SOCs. The temporal variations of the carbon component present important findings compared with the results of previous studies, which did not show temporal changes in OC and EC [74].
Above all, the increasing ratio of carbon components (OC and EC) in PM2.5 at around 09:00 (i.e., the morning rush hour) indicates that there is an impact on air quality in the short time between emissions and measurements.
  • Impacts of emissions from small businesses.
The results of the time-series analysis of the concentrations of heavy metals in PM2.5, including Pb, As, and Zn (Figure 12), show that distinct temporal changes did not occur in ALL; however, in SCs, they simultaneously increased at 08:00–09:00 when the daily work commenced, reaching the peak at 09:00. These temporal changes did not appear during holidays (including weekends). Thus, they are presumed to have occurred during the weekday operation of production facilities in the industrial complexes. However, considering that working hours are 09:00–18:00, the emission source for the peak concentrations of the three heavy metals appears to be in an area close to the monitoring station. In other words, we assume that the emission sources are small businesses with no emission reduction facilities, rather than the two large industrial complexes.
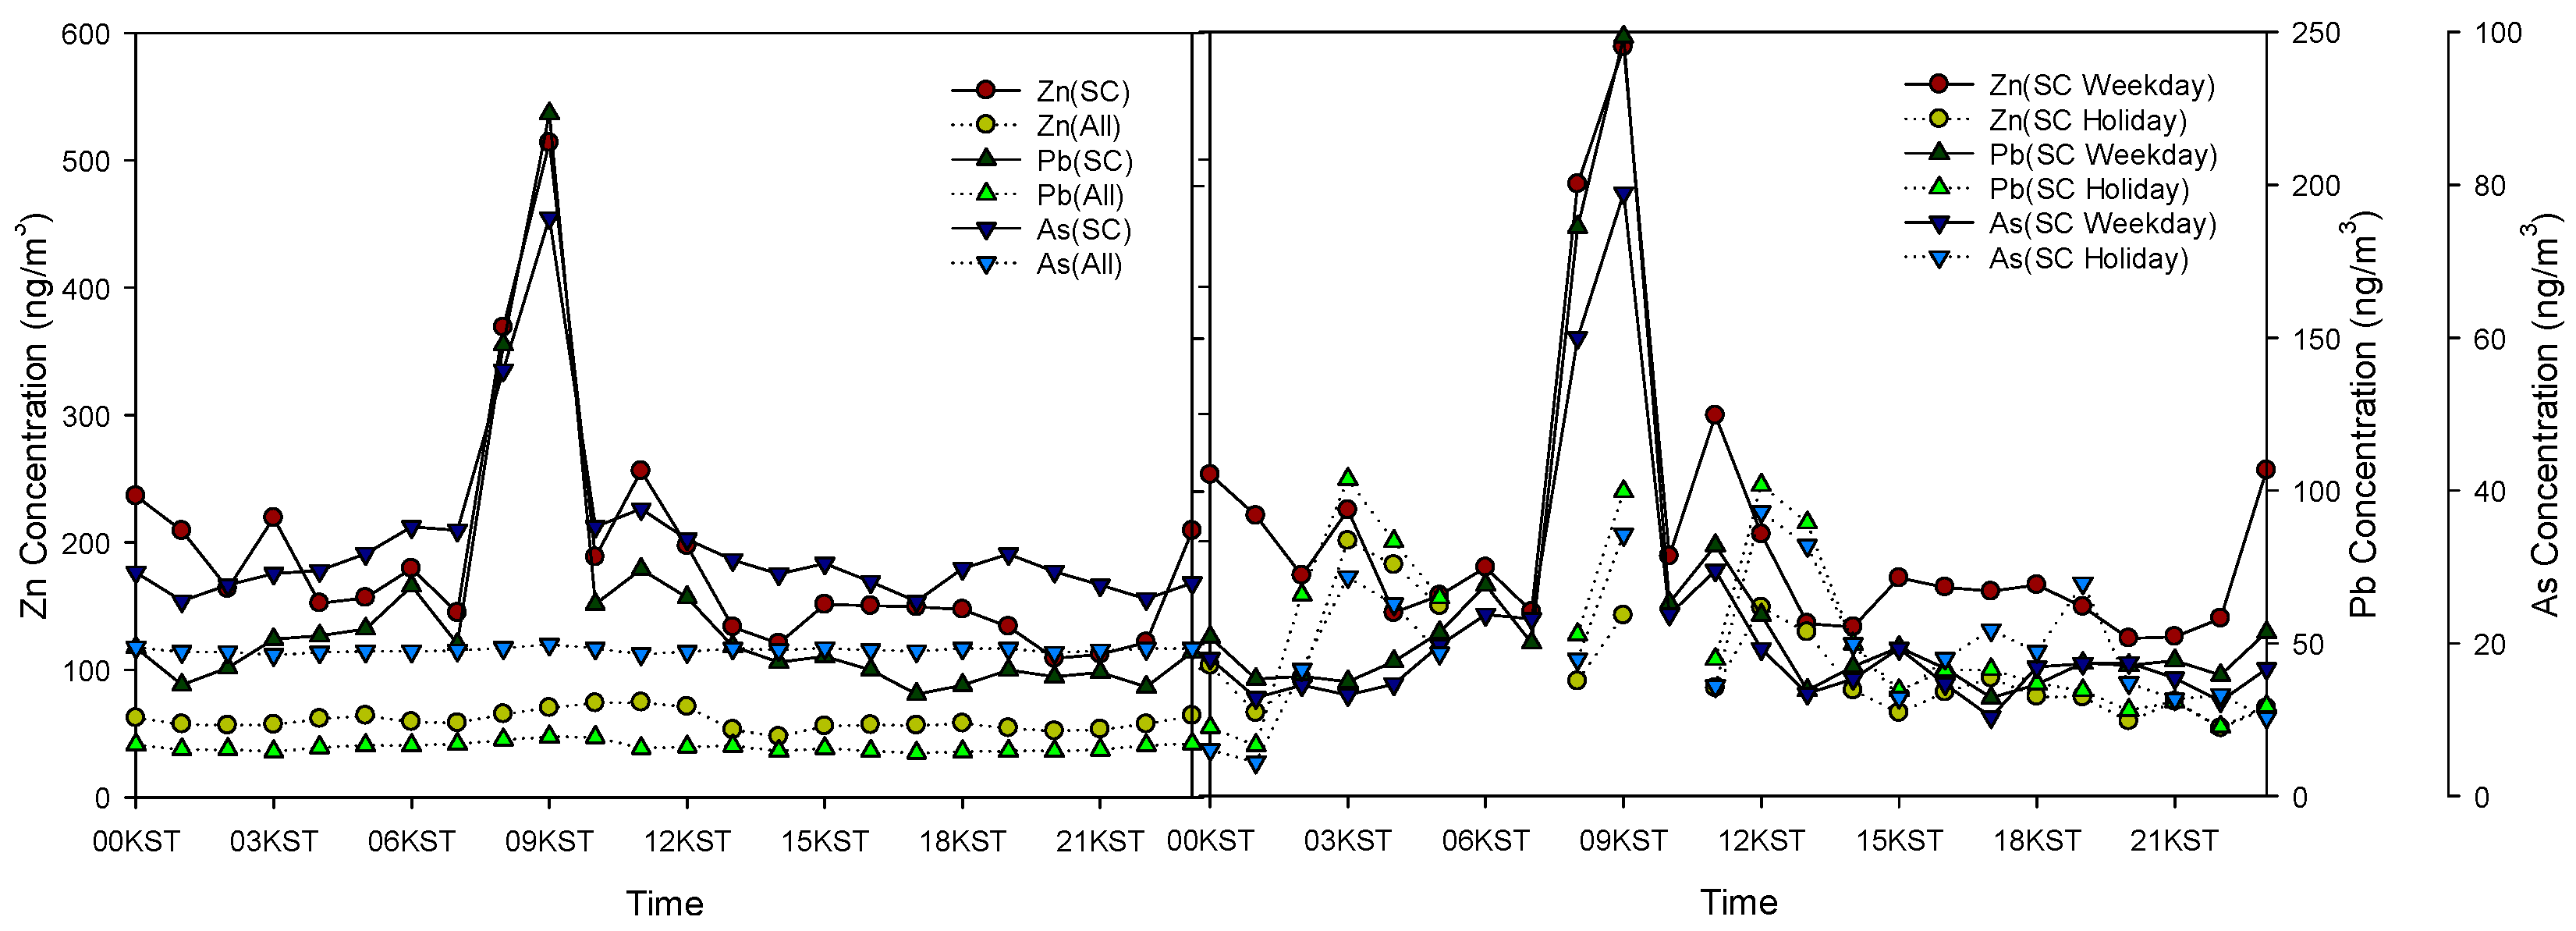
  • Impacts of emissions from the Onsan Industrial Complex.
The changes in the concentrations of Mn and Fe over time in ALL and SCs were analyzed (Figure 13). The time-series analysis results show that the concentrations begin to increase at 10:00 and peak at 12:00 and 17:00. They tend to decrease at 14:00, which is around lunchtime, and at night. The decrease in Mn/Fe concentration at 14:00 was due to reduced production activities during lunchtime. Considering that lunchtime was usually 12:00, the change was observed two hours after emission. These temporal changes seem to originate in an area that is at least two hours away (12.17–16.4 km) at a wind speed of 1.69–2.28 m/s, with the dominant wind direction of 90–180° in SCs (D in Figure 1, Onsan National Industrial Complex). Based on this estimation, it is presumed that the emissions were generated during work hours, and that heavy metals in PM2.5 were transported by the wind and were observed at the monitoring station. The concentrations increased at 11:00 and decreased at 14:00, which could also be related to the commencement of work and lunch break.
When we compare the Mn and Fe emissions from similar emission sources with the results in Figure 7 and temporal changes, it can be assumed that there is an industrial company in the Onsan Industrial Complex that emits Mn and Fe at a ratio of 3.8.

4. Conclusions

In this study, the concentrations of PM10, PM2.5, and 19 components of PM2.5 (SO42−, NO3, Cl, Na+, NH4+, K+, Mg2+, Ca2+, OC, EC, K, Ti, V, Mn, Fe, Ni, Zn, As, and Pb) were analyzed to investigate the effects of industrial complexes nearby the Ulsan Metropolitan City on the air quality. Although the annual PM2.5 concentration in the Ulsan Metropolitan City in 2017 improved over the previous years, it is still higher than the WHO’s recommendation. Results showed that the concentrations of Ti, Mn, Ni, Zn, As, and Pb in PM2.5 increased because of industrial complexes and that OC and EC were affected more by traffic changes than by industrial complexes. To investigate the effects of industrial complexes in the Ulsan Metropolitan City on the air quality, the V component of PM2.5 was used as the tracer given that the change in the V concentration of PM2.5 depends on the wind direction.
The result showed that among the weather variables of the SCs, the southeasterly wind direction (which is the direction of the two industrial complexes) mainly appeared at the monitoring station, and the frequency was high in summer due to the Northeast Asia monsoon. Furthermore, not only the concentrations of PM2.5, NO3 in PM2.5, and most heavy metals excluding K (a soil component) but also the correlations between V and Ni and between Mn and Fe/Zn were higher in SCs than in ALL. These cases can be considered to represent the effects of industrial complexes. When the temporal changes in the OC and EC concentrations were analyzed, the concentrations were higher during commuting hours, and the OC/EC ratio tended to decrease both in ALL and SCs. However, the changes over time and the correlation between OC and EC showed differences between all cases and SCs. The low correlation between OC and EC in SCs during the daytime than nighttime appeared to be due to the formation of SOCs that were not yet stabilized, considering the inverse correlation between OC/EC in SCs and the diurnal wind speed.
Additionally, the concentrations of heavy metals, namely, Zn, Pb, As, Mn, and Fe, in SCs were divided into weekdays and holidays, and the temporal changes were analyzed to infer the cause of each heavy metal. Pb, As, and Zn were inferred to be emissions due to cold start, wherein equipment that obtains energy through fossil fuel combustion, such as engines, generates a large amount of pollutants because of the low efficiency of air pollution reduction or incomplete fuel combustion without rising to the proper temperature, usually observed when the engine starts, because they increased at 9:00, i.e., at the beginning of work hours. Furthermore, based on the changes over time of Mn and Fe, it is presumed that there are emission sources in Ulsan industrial complexes that generate Mn and Fe emissions at the ratio of 1:3.8.
The above results show that the effect of the emissions from Ulsan industrial complexes on the air quality in the downtown area is greater in summer when the main wind direction is southeasterly. The concentrations of PM2.5 were expected to be high due to the presence of various industries in the area, such as oil refineries; however, this was not the case. This may be due to the use of enhanced air pollutant reduction devices. However, because the PM2.5 concentrations of the SCs, which seem to be impacted by Ulsan industrial complexes at the observation site, were higher than the annual mean, strong activities to control air pollutants in Ulsan industrial complexes would be necessary to reduce the PM2.5 concentration in the Ulsan Metropolitan City. At the same time, the concentrations of carbons and heavy metals increased at low levels. The concentrations of carbons and heavy metals in PM2.5 were found to correspond to activity cycles such as commuting hours. This study analyzed the atmospheric environment effects on the composition of PM2.5 generated in industrial complexes by using the proportion of V in PM2.5. In future studies, the components of PM2.5 at various other locations, such as residential areas, rather than cities containing industrial complexes, as in this study, will be analyzed to understand the differences in the effect of emission sources.
Our results demonstrated that detailed tracking of emission sources is possible at the local scale by analyzing the composition of the components of PM2.5. This technique is expected to be useful in determining pollution sources to reduce pollution and improve air quality across a range of urban centers.

Supplementary Materials

The following are available online at https://0-www-mdpi-com.brum.beds.ac.uk/article/10.3390/app112110003/s1, Figure S1: Diurnal changes in the concentration of PM2.5, and the ratio of total carbon (TC; OC+EC) to PM2.5 in SCs, Figure S2: Diurnal change in the concentration of organic carbon (OC), element carbon (EC), primary organic carbon (POC), secondary organic carbon (SOC), and the ratio of SOC to OC in SCs, Table S1: Annual average concentrations of particulate matter with an aerodynamic diameter ≤ 2.5 µm (PM2.5) and particulate matter with an aerodynamic diameter ≤ 10 µm (PM10) according to wind direction (degree) (Unit: μg/m3), Table S2: Mean concentrations of PM10 and PM2.5 and the mass concentrations of PM2.5 components, obtained from hourly data in Ulsan, Table S3: Annual average concentrations of vanadium (V) in PM2.5 according to wind direction (degree) (Unit: μg/m3), Table S4: Number of cases for each season according to wind direction (degree) (Unit: m/s3), Table S5: Mass concentrations of PM10 and components in PM2.5, obtained from hourly data in Ulsan for selected cases (SC).

Author Contributions

Formal analysis, B.J.; investigation, W.J.C.; methodology, W.J.C.; resources, H.K. (Hyunjung Kang) and H.K. (Hyosun Kim); software, B.J.; supervision, D.L.; validation, H.K. (Hyunjung Kang) and H.K. (Hyosun Kim); visualization, B.J.; writing—original draft, W.J.C.; writing—review and editing, H.H. All authors have read and agreed to the published version of the manuscript.

Funding

This work was supported by a grant from the National Institute of Environment Research (NIER) funded by the Ministry of Environment (MOE) of the Republic of Korea (grant numbers NIER-2017-03-01-002 and NIER-2019-01-01-027). The funder had no role in the study design; in the collection, analysis and interpretation of data; in the writing of the report, or in the decision to submit the article for publication.

Institutional Review Board Statement

Not applicable.

Informed Consent Statement

Not applicable.

Conflicts of Interest

The authors declare no conflict of interest.

References

  1. World Health Organization. Burden of Disease from Ambient Air Pollution for 2016, Version 2; World Health Organization: Geneva, Switzerland, 2018. [Google Scholar]
  2. Ayres, J.G.; Borm, P.; Cassee, F.R.; Castranova, V.; Donaldson, K.; Ghio, A.; Harrison, R.M.; Hider, R.; Kelly, F.; Kooter, I.M.; et al. Evaluation of the toxicity of airborne particulate matter and nanoparticles by measuring oxidative stress potential–A workshop report and consensus statement. Inhal. Toxicol. 2008, 20, 75–99. [Google Scholar] [CrossRef] [PubMed]
  3. Kim, K.-H.; Kabir, E.; Kabir, S. A review on the human health impact of airborne particulate matter. Environ. Int. 2015, 74, 136–143. [Google Scholar] [CrossRef]
  4. Pope, C.A., III; Burnett, R.T.; Thurston, G.D.; Thun, M.J.; Calle, E.E.; Krewski, D.; Godleski, J.J. Cardiovascular mortality and long-term exposure to particulate air pollution: Epidemiological evidence of general pathophysiological pathways of disease. Circulation 2004, 109, 71–77. [Google Scholar] [CrossRef] [Green Version]
  5. Brook, R.D.; Rajagopalan, S.; Pope III, C.A.; Brook, J.R.; Bhatnagar, A.; Diez-Roux, A.V.; Holguin, F.; Hong, Y.; Luepker, R.V.; Mittleman, M.A.; et al. Particulate matter air pollution and cardiovascular disease: An update to the scientific statement from the American Heart, Association. Circulation 2010, 121, 2331–2378. [Google Scholar] [CrossRef] [Green Version]
  6. Lee, B.-J.; Kim, B.; Lee, K. Air pollution exposure and cardiovascular disease. Toxicol. Res. 2014, 30, 71–75. [Google Scholar] [CrossRef]
  7. Münzel, T.; Gori, T.; Al-Kindi, S.; Deanfield, J.; Lelieveld, J.; Daiber, A.; Rajagopanlan, S. Effects of gaseous and solid constituents of air pollution on endothelial function. Eur. Heart J. 2018, 39, 3543–3550. [Google Scholar] [CrossRef] [Green Version]
  8. Miller, M.R. Oxidative stress and the cardiovascular effects of air pollution. Free Radic. Biol. Med. 2020, 151, 69–87. [Google Scholar] [CrossRef]
  9. Lighty, J.S.; Veranth, J.M.; Sarofim, A.F. Combustion aerosols: Factors governing their size and composition and implications to human health. J. Air Waste Manag. Assoc. 2000, 50, 1565–1618. [Google Scholar] [CrossRef] [PubMed]
  10. Shkirkova, K.; Lamorie-Foote, K.; Connor, M.; Patel, A.; Barisano, G.; Baertsch, H.; Liu, Q.; Morgan, T.E.; Sioutas, C.; Mack, W.J. Effects of ambient particulate matter on vascular tissue: A review. J. Toxicol. Environ. Health Part B 2020, 23, 319–350. [Google Scholar] [CrossRef]
  11. Synn, A.J.; Byanova, K.L.; Li, W.; Gold, D.R.; Di, Q.; Kloog, I.; Schwartz, J.; Estepar, R.S.J.; Washko, G.R.; O’Connor, G.T.; et al. Ambient air pollution exposure and radiographic pulmonary vascular volumes. Environ. Epidemiol. 2021, 5, e143. [Google Scholar] [CrossRef] [PubMed]
  12. Apte, J.S.; Marshall, J.D.; Cohen, A.J.; Brauer, M. Addressing global morality from ambient PM2.5. Environ. Sci. Technol. 2015, 49, 8057–8066. [Google Scholar] [CrossRef]
  13. Pope, C.A., III; Burnett, R.T.; Thun, M.J.; Calle, E.E.; Krewski, D.; Ito, K.; Thurston, G.D. Lung cancer, cardiopulmonary mortality, and long-term exposure to fine particulate air pollution. JAMA 2002, 287, 1132–1141. [Google Scholar] [CrossRef] [PubMed] [Green Version]
  14. Vodonos, A.; Awad, Y.A.; Schwartz, J. The concentration-response between long-term PM2. 5 exposure and mortality; a meta-regression approach. Environ. Res. 2018, 166, 677–689. [Google Scholar] [CrossRef] [PubMed]
  15. Burnett, R.; Chen, H.; Szyszkowicz, M.; Fann, N.; Hubbell, B.; Pope III, C.A.; Apte, J.S.; Brauer, M.; Cohen, A.; Weichenthal, S.; et al. Global estimates of mortality associated with long-term exposure to outdoor fine particulate matter. Proc. Natl. Acad. Sci. USA 2018, 115, 9592–9597. [Google Scholar] [CrossRef] [PubMed] [Green Version]
  16. Lelieveld, J.; Klingmüller, K.; Pozzer, A.; Pöschl, U.; Fnais, M.; Daiber, A.; Münzel, T. Cardiovascular diease burden from ambient air pollution in Europe reassessed using novel hazard ratio functions. Eur. Heart J. 2019, 40, 1590–1596. [Google Scholar] [CrossRef] [Green Version]
  17. Balakrishnan, K.; Dey, S.; Gupta, T.; Dhaliwal, K.R.S.; Brauer, M.; Cohen, A.J.; Stanaway, J.; Beig, G.; Joshi, T.K.; Aggarwal, A.N.; et al. The impact of air pollution on deaths, disease burden, and life expectancy across the states of India: The Global Burden of Disease Study 2017. Lancet Planet. Health 2019, 3, e26–e39. [Google Scholar] [CrossRef] [Green Version]
  18. Ostro., B.; Feng, W.-Y.; Broadwind, R.; Green, S.; Lipsett, M. The effects of components of fine particulate air pollution on mortality in California: Results from CALFINE. Environ. Health Perspect. 2007, 115, 13–19. [Google Scholar] [CrossRef] [Green Version]
  19. Seaton, A.; Godden, D.; MacNee, W.; Donaldson, K. Particle air pollution and acute health effect. Lancet 1995, 345, 176–178. [Google Scholar] [CrossRef]
  20. Klimont, Z.; Kupianinen, K.; Heyes, C.; Purohit, P.; Cofala, J.; Rafaj, P.; Borken-Kleefeld, J.; Schöpp, W. Global anthropogenic emissions of particulate matter including black carbon. Atmos. Chem. Phys. Discuss. 2017, 17, 8681–8723. [Google Scholar] [CrossRef] [Green Version]
  21. Kang, C.-M.; Lee, H.S.; Kang, B.-W.; Lee, S.-K.; Sunwoo, Y. Chemical characteristics of acidic gas pollutants and PM2.5 species during hazy episodes in Seoul, South Korea. Atmos. Environ. 2004, 38, 4749–4760. [Google Scholar] [CrossRef]
  22. Kim, H.-S.; Huh, J.-B.; Hopke, P.K.; Holsen, T.M.; Yi, S.-M. Characteristics of the major chemical constituents of PM2.5 and smog events in Seoul, Korea in 2003 and 2004. Atmos. Environ. 2007, 41, 6762–6770. [Google Scholar] [CrossRef]
  23. Kang, C.M.; Kang, B.W.; Lee, H.S. Source identification and trends in concentrations of gaseous and fine particulate principal species in Seoul, South Korea. J. Air Waste Manag. Assoc. 2006, 56, 911–921. [Google Scholar] [CrossRef] [Green Version]
  24. Aust, A.E.; Ball, J.C.; Hu, A.A.; Lighty, J.S.; Smith, K.R.; Straccia, A.M.; Veranth, J.M.; Young, W.C. Particle characteristics responsible for effects on human lung epithelial cells. Res. Rep. (Health Effects Inst.) 2002, 110, 1–65. [Google Scholar]
  25. Heo, J.B.; Hopke, P.K.; Yi, S.-M. Source apportionment of PM2.5 in Seoul, Korea. Atmos. Chem. Phys. 2009, 9, 4957–4971. [Google Scholar] [CrossRef] [Green Version]
  26. Querol, X.; Alastuey, A.; Viana, M.M.; Rodrigyez, S.; Artiñano, B.; Salvador, P.; Garcia do Santos, S.; Fernandez Patier, R.; Ruiz, C.R.; de la Rosa, J.; et al. Speciation and origin of PM10 and PM2.5 in Spain. J. Aerosol Sci. 2004, 35, 1151–1172. [Google Scholar] [CrossRef]
  27. Han, Y.-J.; Kim, T.-S.; Kim, H. Ionic constituents and source analysis of PM2.5 in three Korean cities. Atmos. Environ. 2008, 42, 4735–4746. [Google Scholar] [CrossRef]
  28. Yoo, S.-E.; Park, J.-S.; Lee, S.H.; Park, C.-H.; Lee, C.-W.; Lee, S.-B.; Yu, S.D.; Kim, S.-Y.; Kim, H. Comparison of short-term associations between PM2.5 components and mortality across six major cities in south Korea. Int. J. Environ. Res. Public Health 2019, 16, 2872. [Google Scholar] [CrossRef] [Green Version]
  29. Jacobson, M.C.; Hansson, H.C.; Noone, K.J.; Charlson, R.J. Organic atmospheric aerosols: Review and state of the science. Rev. Geophys. 2000, 38, 267–294. [Google Scholar] [CrossRef] [Green Version]
  30. Voutsa, D.; Samara, C. Labile and bioaccessible fractions of heavy metals in the airborne particulate matter from urban and industrial areas. Atmos. Environ. 2002, 36, 3583–3590. [Google Scholar] [CrossRef]
  31. Taiwo, A.M.; Beddows, D.C.; Shi, Z.; Harrison, R.M. Mass and number size distributions of particulate matter components: Comparison of an industrial site and an urban background site. Sci. Total Environ. 2014, 475, 29–38. [Google Scholar] [CrossRef] [PubMed] [Green Version]
  32. Burnett, R.T.; Brook, J.; Dann, T.; Delocla, C.; Philips, O.; Cakmak, S.; Vincent, R.; Goldberg, M.S.; Krewski, D. Association between particulate- and gas-phase components of urban air pollution and daily mortality in eight Canadian cities. Inhal. Toxicol. 2000, 12, 15–39. [Google Scholar] [CrossRef] [PubMed]
  33. Seagrave, J.; McDonald, J.D.; Bedrick, E.; Edgerton, E.S.; Gigliotti, A.P.; Jansen, J.J.; Ke, L.; Naeher, L.P.; Seilkop, S.K.; Zheng, M.; et al. Lung toxicity of ambient particulate matter from Southeastern U.S. sites with different contributing sources: Relationships between composition and effects. Environ. Health Perspect. 2006, 114, 1387–1393. [Google Scholar] [CrossRef] [PubMed] [Green Version]
  34. Kelly, F.J.; Fussell, J.C. Size, source and chemical composition as determinants of toxicity attributable to ambient particulate matter. Atmos. Environ. 2012, 60, 504–526. [Google Scholar] [CrossRef]
  35. Ryou, H.G.; Heo, J.; Kim, S.-Y. Source apportionment of PM10 and PM2.5 air pollution, and possible impacts of study characteristics in South Korea. Environ. Pollut. 2018, 240, 963–972. [Google Scholar] [CrossRef] [PubMed]
  36. Kwon, H.-O.; Park, M.-K.; Kim, S.-J.; Choi, J.; Oh, J.; Ahn, J.-Y.; Choi, S.-D. Size distributions of atmospheric particle matter and associated trace metals in the multi-industrial city of Ulsan, Korea. Environ. Eng. Res. 2019, 24, 331–338. [Google Scholar] [CrossRef] [Green Version]
  37. Lee, B.-K.; Hieu, N.T. Seasonal ion characteristics of fine and coarse particles from an urban residential area in a typical industrial city. Atmos. Res. 2013, 122, 362–377. [Google Scholar] [CrossRef]
  38. Wu, W.S.; Wang, T. On the performance of a semi-continuous PM2.5 sulphate and nirate instrument under high loadings of particulate and sulphur dioxide. Atmos. Environ. 2007, 41, 5442–5451. [Google Scholar] [CrossRef]
  39. Bauer, J.J.; Yu, X.Y.; Cary, R.; Laulanien, R.; Berkowitz, C. Characterization of the sunset semi-continuous carbon aerosol analyzer. J. Air Waste Manag. Assoc. 2009, 59, 826–833. [Google Scholar] [CrossRef] [PubMed]
  40. Kelly, T.; Dindal, A.; Mckernan, J. Environmental Technology Verification Report: Xact 625 Particulate Metals Monitor. Available online: https://archive.epa.gov/nrmrl/archive-etv/web/pdf/p100fk6b.pdf (accessed on 21 October 2021).
  41. Querol, X.; Alastuey, A.; Rodriguez, S.; Plana, F.; Ruiz, C.R.; Cots, N.; Massagué, G.; Puig, O. PM10 and PM2.5 source apportionment in the Barcelona Metropolitan area, Catalonia, Spain. Atmos. Environ. 2001, 35, 6407–6419. [Google Scholar] [CrossRef]
  42. World Health Organization. WHO Global Air Quality Guidelines: Particulate Matter (PM2.5 and PM10), Ozone, Nitrogen Dioxide, Sulfur Dioxide and Carbon Monoxide: Executive Summary; WHO: Geneva, Switzerland, 2021. [Google Scholar]
  43. Lee, H.S.; Kang, B.-W. Chemical characteristics of principal PM2.5 species in Chongju, South Korea. Atmos. Environ. 2001, 35, 739–746. [Google Scholar] [CrossRef]
  44. Khoder, M.I. Atmospheric conversion of sulfur dioxide to particulate sulfate and nitrogen dioxide to partivulate nitrate and gaseous nitric acid in an urban area. Chemsphere 2002, 49, 675–684. [Google Scholar] [CrossRef]
  45. Chan, K.L.; Wang, S.; Liu, C.; Zhou, B.; Wenig, M.O.; Saiz-Lopez, A. On the summertime air quality and related photochemical processes in the megacity Shanghai, China. Sci. Total Environ. 2017, 580, 974–983. [Google Scholar] [CrossRef]
  46. Chang, S.G.; Brodzinsky, R.; Gundel, L.A.; Navakov, T. Chemical and catalytic properties of elemental carbon. In Particulate Carbon; Springer: Boston, MA, USA, 1982; pp. 159–181. [Google Scholar]
  47. Turpin, B.J.; Huntzicker, J.J. Identification of secondary organic aerosol episodes and quantitation of primary and secondary organic aerosol concentrations during SCAQS. Atmos. Environ. 1995, 29, 3527–3544. [Google Scholar] [CrossRef]
  48. Park, S.S.; Kim, Y.J.; Fung, K. Characteristics of PM2.5 carbonaceous aerosol in the Sihwa industrial area, South Korea. Atmos. Environ. 2001, 35, 657–665. [Google Scholar] [CrossRef]
  49. Choi, J.-K.; Heo, J.-B.; Ban, S.-J.; Yi, S.-M.; Zoh, K.-D. Source apportionment of PM2.5 at the coastal area in Korea. Sci. Total Environ. 2013, 447, 370–380. [Google Scholar] [CrossRef] [PubMed]
  50. Vecchi, R.; Marcazzan, G.; Valli, G.; Ceriani, M.; Antoniazzi, C. The role of atmospheric dispersion in the seasonal variation of PM1 and PM2.5 concentration and composition in the urban area of Milan (Italy). Atmos. Environ. 2004, 38, 4437–4446. [Google Scholar] [CrossRef]
  51. Moreno, T.; Querol, X.; Alastuey, A.; de la Rosa, J.; de la Campa, A.M.S.; Minguillón, M.; Pandolfi, M.; González-Castanedo, Y.; Monfort, E.; Gibbons, W. Variations in vanadium, nickel and lanthanoid element concentrations in urban air. Sci. Total Environ. 2010, 408, 4569–4579. [Google Scholar] [CrossRef] [PubMed]
  52. Park, S.S.; Jung, S.-A.; Gong, B.-J.; Cho, S.-Y.; Lee, S.-J. Characteristics of PM2.5 haze episodes revealed by highly time-resolved measurements at an air pollution monitoring Supersite in Korea. Aerosol Air Qual. Res. 2013, 13, 957–976. [Google Scholar] [CrossRef]
  53. Zhang, Z.; Chau, P.Y.; Lai, H.K.; Wong, C.M. A review of effects of particulate matter-associated nickel and vanadium species on cardiovascular and respiratory systems. Int. J. Environ. Health Res. 2009, 19, 175–185. [Google Scholar] [CrossRef]
  54. Huffman, G.P.; Huggins, F.E.; Shah, N.; Huggins, R.; Linak, W.P.; Miller, C.A.; Pugmire, R.J.; Meuzelaar, H.L.C.; Seehra, M.S.; Manivannan, A. Characterization of fine particulate matter produced by combustion of residual fuel oil. J. Air Waste Manag. Assoc. 2011, 50, 1106–1114. [Google Scholar] [CrossRef] [PubMed] [Green Version]
  55. Hassanvand, M.S.; Naddafi, K.; Faridi, S.; Nabizadeh, R.; Sowlat, M.H.; Momeniha, F.; Gholampour, A.; Arhami, M.; Kashani, H.; Zareg, A.; et al. Characterization of PAHs and metals in indoor/outdoor PM10/PM2.5/PM1 in a retirement home and a school dormitory. Sci. Total Environ. 2015, 527, 100–110. [Google Scholar] [CrossRef]
  56. Chen, Y.; Shah, N.; Huggins, F.E.; Huffman, G.P. Investigation of the microcharacteristics of PM2.5 in residual oil fly ash by analytical transmission electron microscopy. Environ. Sci. Technol. 2004, 38, 6553–6560. [Google Scholar] [CrossRef]
  57. Li, Z.; Hopke, P.K.; Husain, L.; Qureshi, S.; Dutkiewicz, V.A.; Schwab, J.J.; Demerjian, K.L. Sources of fine particle composition in New York city. Atmos. Environ. 2004, 38, 6521–6529. [Google Scholar] [CrossRef]
  58. Thurston, G.D.; Ito, K.; Mar, T.; Christensen, W.F.; Eatough, D.J.; Henry, R.C.; Liu, H. Workshop report: Workshop on source apportionment of particulate matter health effects: Intercomparison of results and implications. Environ. Health Perspect. 2005, 113, 1768–1774. [Google Scholar] [CrossRef] [PubMed] [Green Version]
  59. Qin, Y.; Kim, E.; Hopke, P.K. The concentrations and sources of PM2.5 in metropolitan New York City. Atmos. Environ. 2006, 40, 312–332. [Google Scholar] [CrossRef]
  60. Thomaidis, N.S.; Bakeas, E.B.; Siskos, P.A. Characterization of lead, cadmium, arsenic and nickel in PM2.5 particles in the Athens atmosphere, Greece. Chemosphere 2003, 52, 959–966. [Google Scholar] [CrossRef]
  61. Yu, L.; Wang, G.; Zhang, R.; Zhang, L.; Song, Y.; Wu, B.; Li, X.; An, K.; Chu, J. Characterization and source apportionment of PM2.5 in an urban environment in Beijing. Aerosol Air Qual. Res. 2013, 13, 574–583. [Google Scholar] [CrossRef] [Green Version]
  62. Dai, Q.-L.; Bi, X.-H.; Wu, J.-H.; Zhang, Y.-F.; Wang, J.; Xu, H.; Yao, L.; Jiao, L.; Feng, Y.-C. Characterization and source identification of heavy metals in ambient PM10 and PM2.5 in an integrated iron and steel industry zone compared with a background site. Aerosol Air Qual. Res. 2015, 15, 875–887. [Google Scholar] [CrossRef] [Green Version]
  63. Linak, W.P.; Andrew Miller, C.; Wood, J.P.; Shinagawa, T.; Yoo, J.-I.; Santoianni, D.A.; King, C.J.; Wendt, J.O.; Seo, Y.-C. High temperature interactions between residual oil ash and dispersed kaolinite powders. Aerosol Sci. Technol. 2004, 38, 900–913. [Google Scholar] [CrossRef] [Green Version]
  64. Lau, K.M.; Yang, G.J.; Shen, S.H. Seasonal and intraseasonal climatology of summer monsoon rainfall over East Asia. Mon. Weather Rev. 1988, 116, 18–37. [Google Scholar] [CrossRef] [Green Version]
  65. Castro, L.M.; Pio, C.A.; Harrison, R.M.; Smith, D.J.T. Carbonaceous aerosol in urban and rural European atmospheres: Estimation of secondary organic carbon concentrations. Atmos. Environ. 1999, 33, 2771–2781. [Google Scholar] [CrossRef]
  66. Strader, R.; Lurmann, F.; Pandis, S.N. Evaluation of secondary organic aerosol formation in winter. Atmos. Environ. 1999, 33, 4849–4863. [Google Scholar] [CrossRef]
  67. Wu, C.; Yu, J.Z. Determination of primary combustion source organic carbon-to-elemental carbon (OC/EC) ratio using ambient OC and EC measurements: Secondary OC-EC correlation minimization method. Atmos. Chem. Phys. 2016, 16, 5453–5465. [Google Scholar] [CrossRef] [Green Version]
  68. Pio, C.; Cerqueira, M.; Harrison, R.M.; Nunes, T.; Mirante, F.; Alves, C.; Oliveira, C.; de la Campa, A.S.; Artíñano, B.; Matos, M. OC/EC ratio observations in Europe: Re-thinking the approach for apportionment between primary and secondary organic carbon. Atmos. Environ. 2011, 45, 6121–6132. [Google Scholar] [CrossRef]
  69. Khan, B.; Hays, M.D.; Geron, C.; Jetter, J. Differences in the OC/EC ratios that characterize ambient and source aerosols due to thermal-optical analysis. Aerosol Sci. Technol. 2012, 46, 127–137. [Google Scholar] [CrossRef] [Green Version]
  70. Feng, Y.; Chen, Y.; Guo, H.; Zhi, G.; Xiong, S.; Li, J.; Sheng, G.; Fu, J. Characteristics of organic and elemental carbon in PM2.5 samples in Shanghai, China. Atmos. Res. 2009, 92, 434–442. [Google Scholar] [CrossRef]
  71. Park, S.S.; Kim, Y.J.; Fung, K. PM2.5 carbon measurements in two urban areas: Seoul and Kwangju. Korea. Atmos. Environ. 2002, 36, 1287–1297. [Google Scholar] [CrossRef]
  72. Kim, Y.P.; Moon, K.C.; Lee, J.H. Organic and elemental carbon in fine particles at Kosan. Korea. Atmos. Environ. 2000, 34, 3309–3317. [Google Scholar] [CrossRef]
  73. Hamilton, R.S.; Mansfield, T.A. Airborne particulate elemental carbon: Its sources, transport and proportion to dark smoke and soiling. Atmos. Environ. Part A Gen. Top. 1991, 25, 715–723. [Google Scholar] [CrossRef]
  74. Lin, P.; Hu, M.; Deng, Z.; Slanina, J.; Han, S.; Kondo, Y.; Takegawa, N.; Miyazaki, Y.; Zhao, Y.; Sugimoto, N. Seasonal and diurnal variations of organic carbon in PM2.5 in Beijing and the estimation of secondary organic carbon. J. Geophys. Res. Atmos. 2009, 114. [Google Scholar] [CrossRef]
Figure 1. Location of the intensive air quality monitoring station (✩) in the southeastern region of Korea (A, B, C: Ulsan Mipo National Industrial Complex (A: Shipbuilding industries in high proportions, B: automobile manufacturing in high proportions, C: nonferrous industry and petrochemical industry in high proportions), D: Onsan National Industrial Complex (nonferrous industry and petrochemical industry in high proportions), and ○: Ulsan Downtown).
Applsci 11 10003 g001
Figure 2. Annual average concentrations of particulate matter with an aerodynamic diameter ≤ 2.5 µm (PM2.5) (left) and particulate matter with an aerodynamic diameter ≤ 10 µm (PM10) (right) according to wind direction (see Supplementary Materials Table S1 for more detail).
Applsci 11 10003 g002
Figure 3. Pie-chart showing the mean concentrations of different components of PM2.5, obtained using hourly data for Ulsan. (a) Annual mean; (b) mean for winter months; (c) mean for spring months; (d) mean for summer months; (e) mean for fall months. (Units: μg/m3 for pie-chart, ng/m3 for vertical chart) (see Table S2 for more detail).
Applsci 11 10003 g003
Figure 4. Vanadium (V) concentration in PM2.5 (ng/m3, left) and the proportion of V in PM2.5 (ng/µg, right) by wind direction (see Table S3 for more detail).
Applsci 11 10003 g004
Figure 5. Comparison of vanadium (V) and nickel (Ni) concentrations in the cases excluding selected cases (ALL-SC) and those in the selection cases (SCs).
Applsci 11 10003 g005
Figure 6. Correlations between heavy metals in all cases (ALL) and SCs.
Applsci 11 10003 g006
Figure 7. Correlations between iron (Fe) and manganese (Mn) in ALL (left) and SCs (right).
Applsci 11 10003 g007
Figure 8. Number of wind directions for each month in SCs (see Table S4 for more detail).
Applsci 11 10003 g008
Figure 9. Annual mean concentrations of components in PM2.5 in Ulsan, obtained using the hourly data, for SCs. (a) Annual mean; (b) mean for winter months; (c) mean for spring months; (d) mean for summer months; (e) mean for fall months (unit: μg/m3 for pie-chart, ng/m3 for vertical chart) (see Table S5 for more detail).
Applsci 11 10003 g009
Figure 10. Correlation between organic carbon (OC) and elemental carbon (EC) concentrations in ALL and SCs (all cases: black, SCs: red).
Applsci 11 10003 g010
Figure 11. Diurnal changes in the ratio of OC to EC, the concentrations of OC and EC, and the correlation between OC and EC (left: ALL, right: SCs).
Applsci 11 10003 g011
Figure 12. Diurnal changes in zinc (Zn), lead (Pb), and arsenic (As) concentrations (left: diurnal changes of ALL and SCs) (right: diurnal changes of weekdays and holidays (including weekends) in SCs).
Applsci 11 10003 g012
Figure 13. Changes in iron (Fe) and manganese (Mn) concentrations over time.
Applsci 11 10003 g013
Publisher’s Note: MDPI stays neutral with regard to jurisdictional claims in published maps and institutional affiliations.

