1. Introduction
Preventive conservation in exhibition halls is a complex challenge frequently conditioned by items exhibited, visitors’ regimes, and the near environmental characteristics. Reference literature has usually dealt with issues concerning environmental protection of collections [
1] as well as conservation concepts for curators and natural history collections [
2,
3]. The effects of pollutants in the museum environment (storerooms and exhibition halls) have been studied [
4,
5], and guidelines on preventive conservation have also been published [
6]. Very often, environmental conditions needed by goods do not fit well with those more comfortable for visitors, even though items exhibited are located inside showcases or in some kind of protected places. Moreover, outdoor environment, air quality, and potential pollution risk from urban locations could also affect long-term conservation [
7,
8]. Indoor air pollution and its control has been analyzed to design adequate conservation strategies [
9], and microclimates generated by pollutants in museums have been monitored to propose preventive conservation measures [
10]. In addition, the use of museum spaces as places for socialization and interaction between the general public and the museum culture makes the museum environment a fragile system that needs to be stabilized for proper preventive conservation of exhibited items [
11,
12]. Accordingly, the evaluation of the museum air quality and the limit of pollutants has been also investigated [
13].
In fact, these concepts and starting assumptions are the same or very close to those considered for storerooms of museums where many items, which are even more abundant than those exhibited, must be properly conserved [
14]. Environmental monitoring by using sensors has proved to be a useful strategy for protecting cultural and natural items, especially those sensitive to pollutants and susceptible to deterioration or corrosion [
15]. Within this subject, previous research was conducted in the Museo Nacional de Ciencias Naturales (MNCN) using environmental pH sensors. Resulting data pointed out the meaning and relevance of the deviation from neutral conditions and how it should be considered a direct methodology to evaluate air quality and real preventive conservation conditions.
Environmental pH sensors are based on sol-gel technology; they consist of a thin coating applied upon a common soda lime glass slide. The coating matrix is composed of a polysiloxane network obtained from a silicon alkoxide in which a sensitive organic dye, against pH, is immobilized into the porous coating structure. Partial thermal densification of the whole coating allows one to obtain a material able to exhibit sensitivity to air chemical acid/base species (due to its residual porosity) and is stable against water, chemicals and handling [
16].
Some former investigations carried out in different museums demonstrated that these sol-gel sensors are useful to indicate the current status of environmental pH in exhibition halls, showcases, storerooms, etc. They are also informative about pH variations due to natural or controlled ventilation, the impact of an unusual number of visitors, or when a special event took place in the museum spaces or in its surroundings [
17,
18]. Therefore, environmental pH monitoring by using these sensors is a useful tool to check preventive conservation conditions quickly, since no more than 24 h is needed for sensitization of sensors with accuracy high enough to detect small variations on air quality (sensor accuracy is estimated to be ±0.1 units of the pH scale) [
19].
Other properties and characteristics of pH sensors are reversibility, reuse, low cost, and miniaturization possibility, or adaptation for every real need in museum spaces. In addition, sensors can be used to check outdoor pH, which allows an air quality comparison indoors and outdoors, as well as an assessment of the impact of potential urban pollution on museum collections. One of the most practical properties of sensors is reversibility. They are able to determine environmental pH in a dynamic way, i.e., they detect all the acid/basic species affecting the whole pH at a given moment, since they are continuously sensitized, and indicate the air pH value quantitatively. Therefore, they can be regenerated in the laboratory by using pH-buffered solutions, which makes the sensors reusable for many evaluations until their lifetime is ended (at about 9 months for indoor use and 4 months for outdoor use). Among other papers on preventive conservation based on air quality monitoring and evaluation of air acidity [
20,
21,
22,
23], a work by some of the authors has reviewed other pH sensors currently available and the outstanding advantages of the present pH optical sensors [
19].
The aim of the present research was to evaluate environmental pH in several exhibition spaces of the MNCN. This main objective was essential to revise preventive conservation actions necessary to be taken into account for integral conservation of the MNCN collections and, in particular, of natural items exhibited, which are visited by many people, due to their high biological and cultural significance. This conservation interest is even higher because of the nature of these items which are, in part, dissected animals from varying geographical origins, dissection methods, sizes, and natural components (skin, hair, feather, squama, bone, etc.) [
24].
From previous work with environmental pH sensors carried out in the MNCN, the methodology applied consisted of sensor installation in the most critical positions and close to the most important specimens to be monitored, comparison with pH values detected outdoors, study of the ventilation regime, and assessment of the influence of meteorological parameters in the one full year evaluation. In this way, the interpretation of the overall results can be of great help for making decisions on a preventive conservation strategy of the MNCN.
2. Materials and Methods
Sol-gel pH-sensitive coatings upon common soda line glass slides were prepared following a previous patent by some of the present authors [
25]. The silica matrix was provided from tetrathoxysilane (Si(OC
2H
5)
4, TEOS), absolute ethanol (EtOH), and hydrochloric acid (37 wt. % HCl). All reagents used were of analysis grade purity. The pH-sensitive phase added to the prehydrolized silica matrix was chlorophenol red (C
19H
12Cl
2O
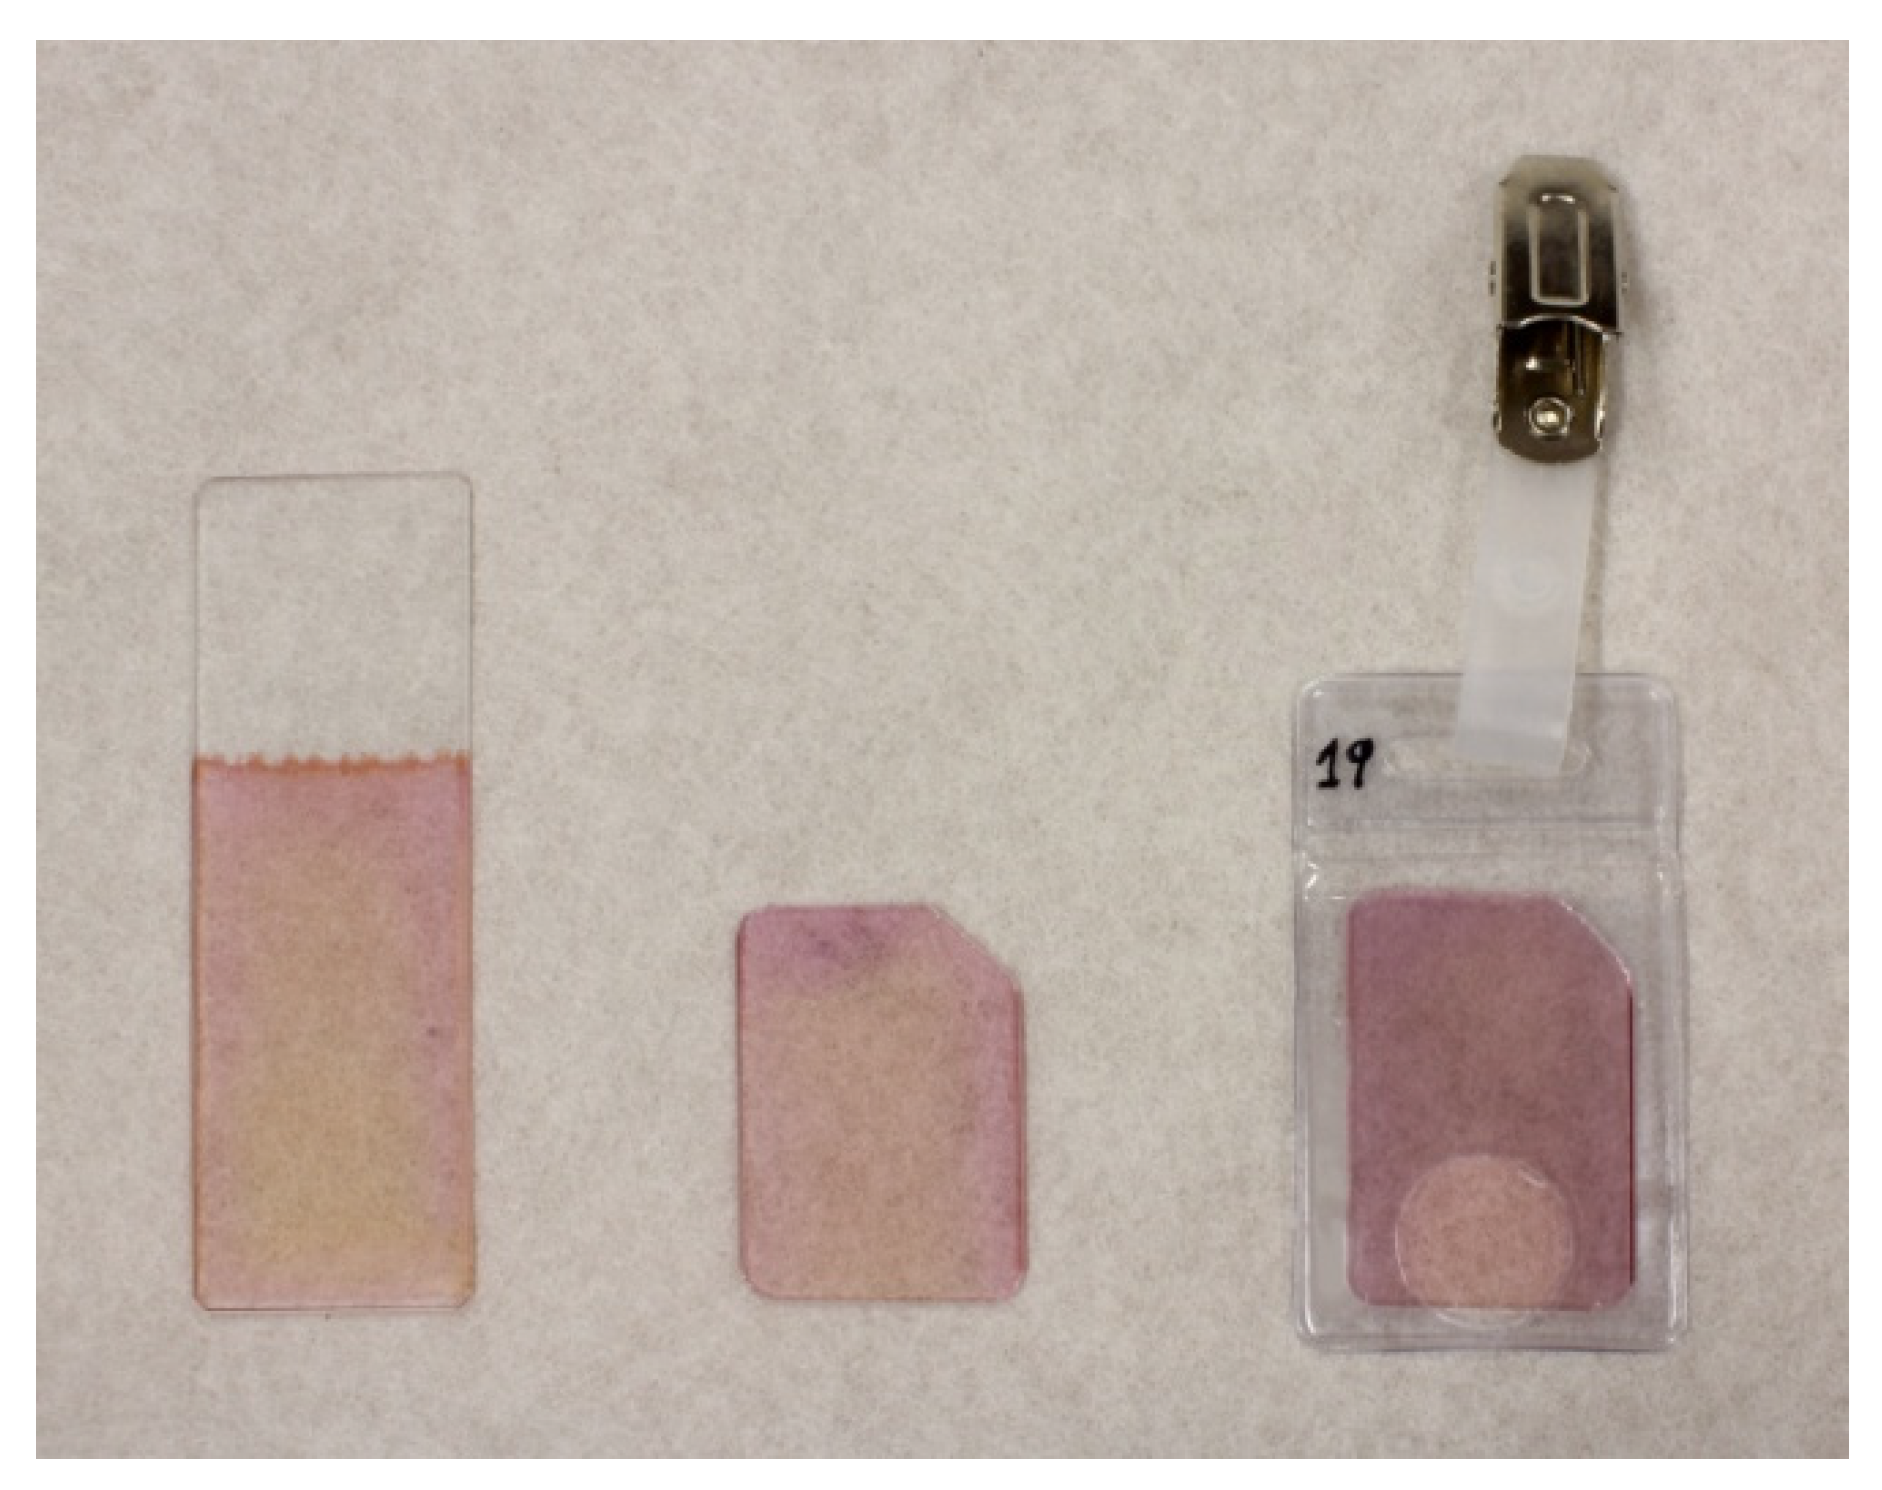
5S, 3′-3′-dichlorophenolsulfonaphthalein, CR), an organic dye that changes its optical absorption depending on pH: yellow below pH 4.8, violet above pH 6.7, pink around neutral pH. Details on sol synthesis are provided in [
19]. Coatings upon glass slides were obtained by dipping at room temperature and at a drawing rate of 1.35 mm × s
−1. Thermal partial densification of coatings was achieved at 60 °C for 3 days in a forced air stove. After that, the coated area of the glass slide was cut from the uncoated one, and the glass edges were then polished.
Figure 1 shows the aspect of one of the sensors obtained.
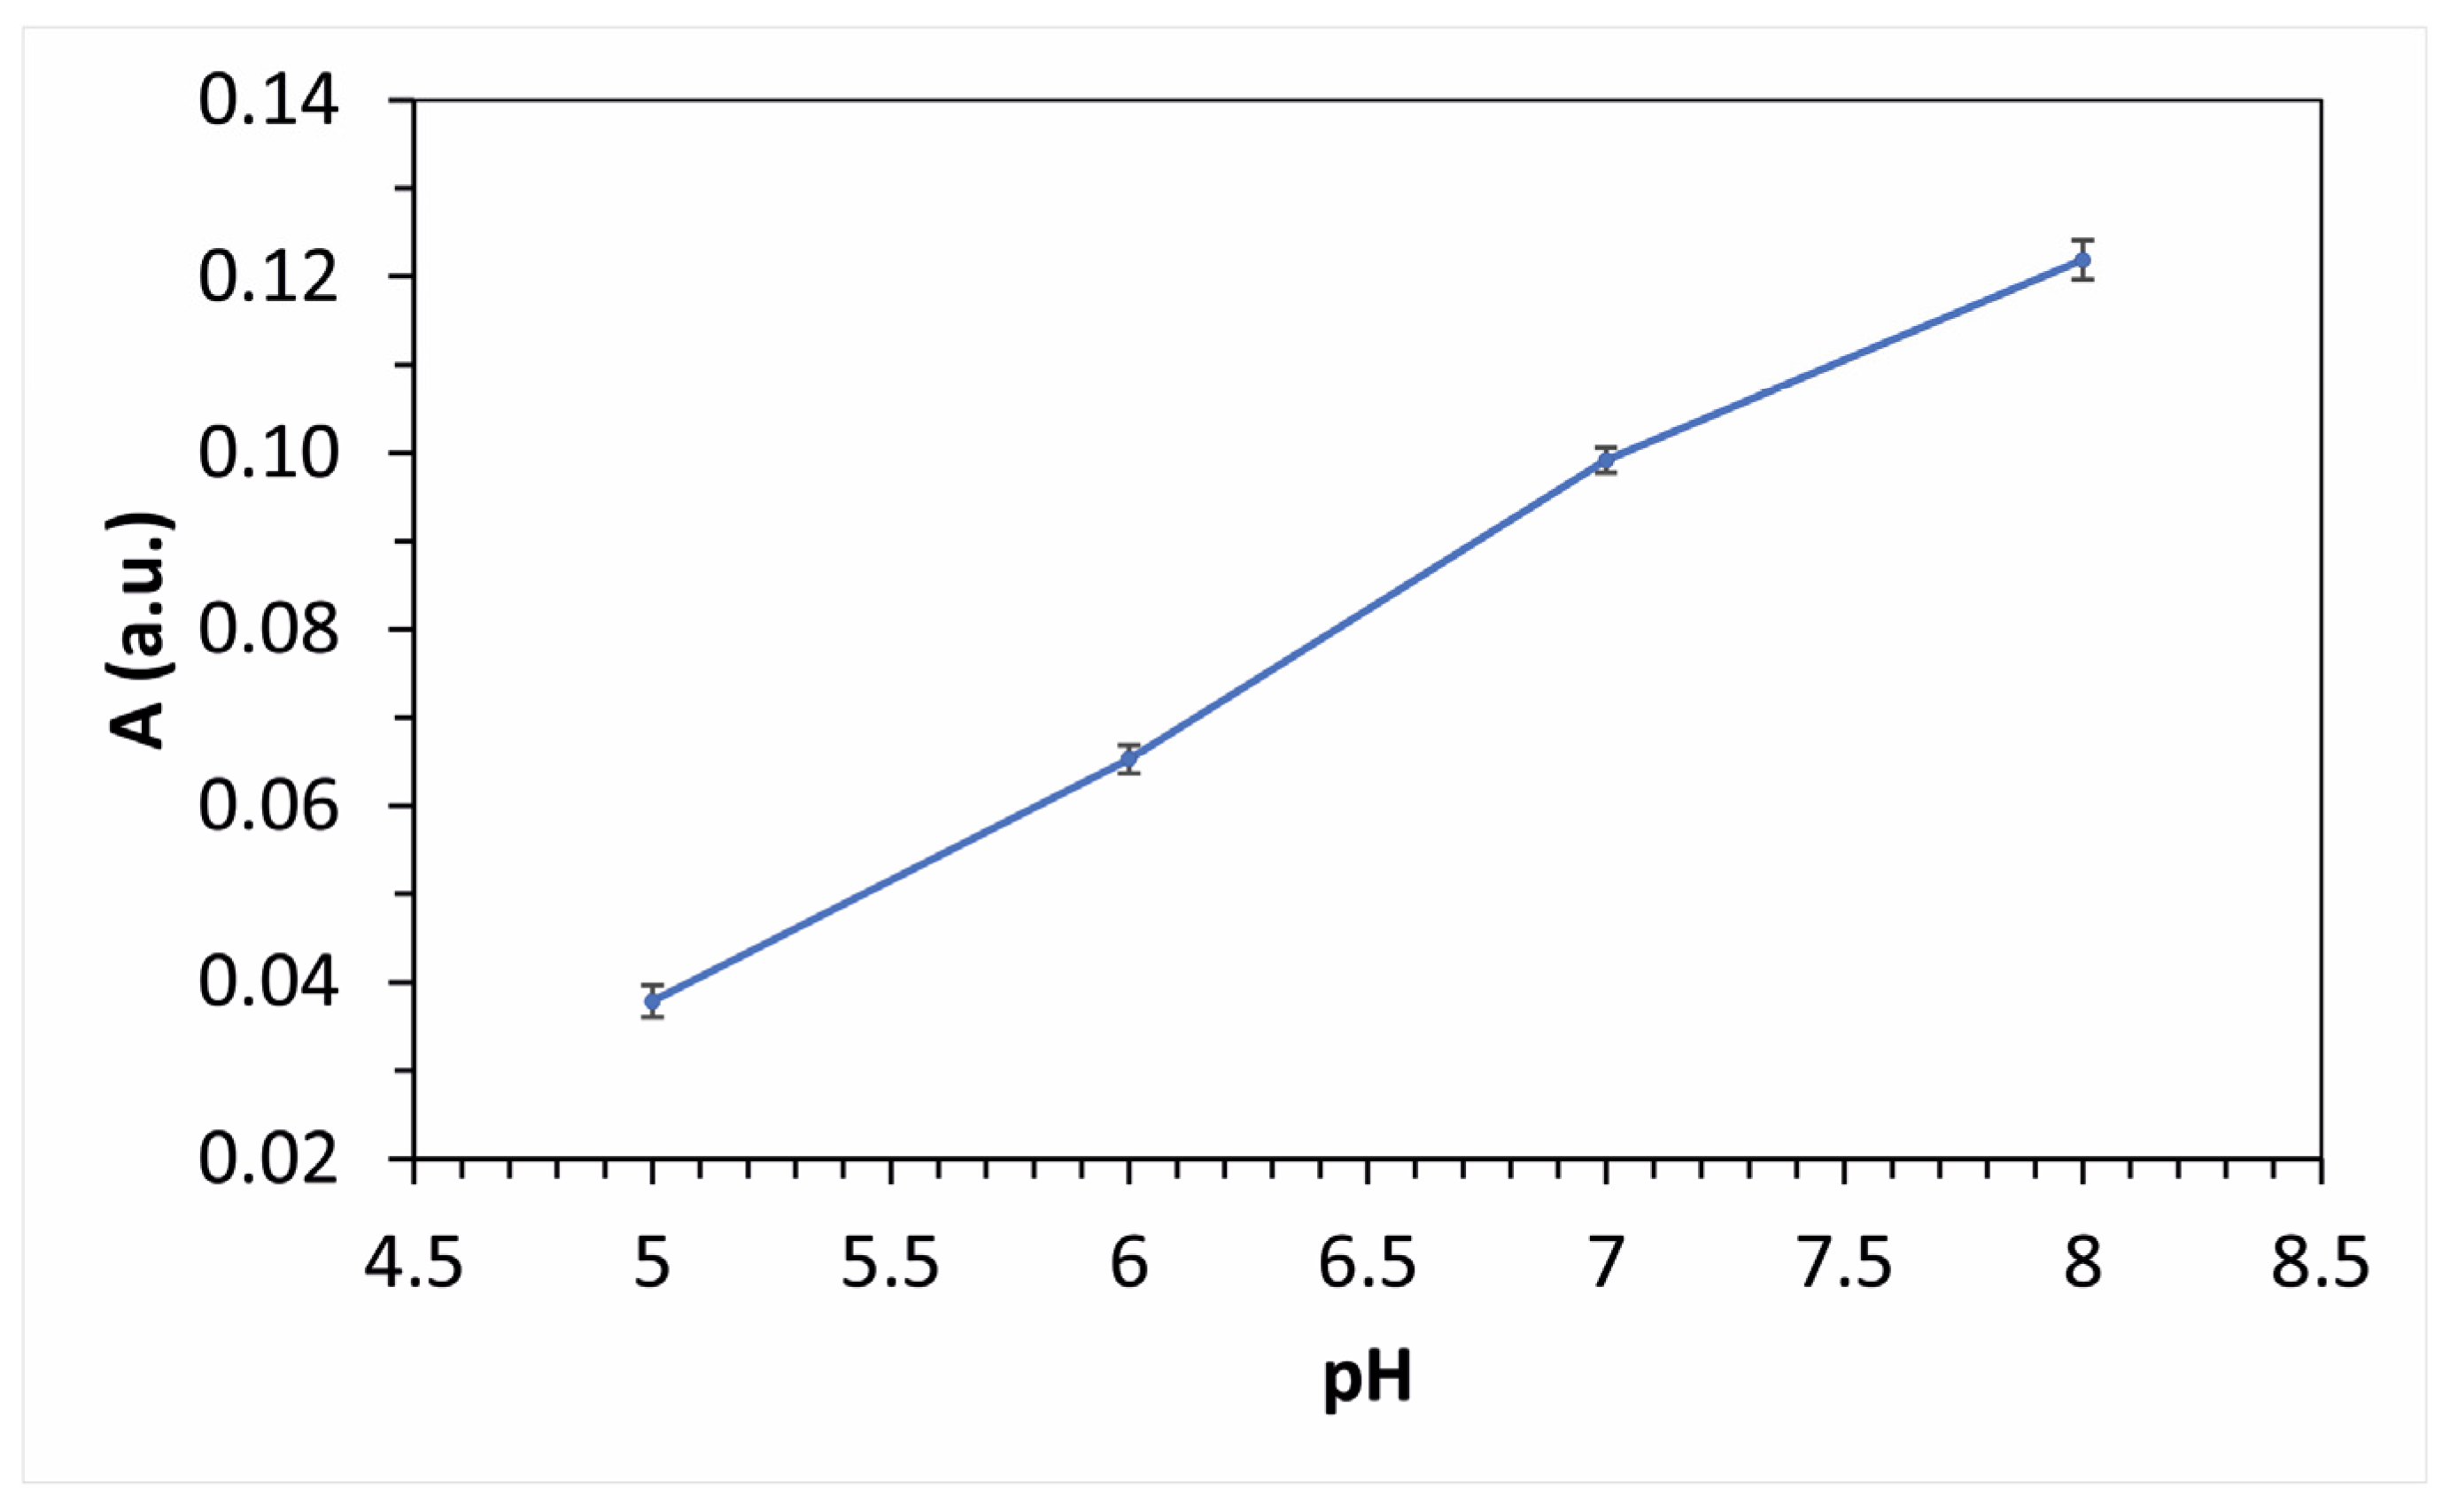
Sensors were calibrated one by one using pH-buffered solutions (Buffer Hydrion Salt, Sigma Aldrich, St. Louis, MO, USA) in which they were immersed for 10 min. After that immersion time, a visible spectrum was recorded within the 380–750 nm wavelength range. An Ocean Optics model HR 4000 CG spectrophotometer was used. Sensor calibration was mainly carried out at pH 5, 6, 7 and 8. These pH values were selected because the most important pH range to be evaluated is around neutrality. Values of the absorption band intensity at 575 nm (characteristic band of CR) for each pH nominal calibration were used to set up the calibration curve.
Figure 2 shows the calibration curve for one of the sensors synthesized and the error bars corresponding to standard deviation. On the basis of individual calibration curves for all sensors synthesized, estimated sensor accuracy is ±0.1 units of the pH scale.
Once the sensors were calibrated, they were installed in different positions of exhibition spaces of the MNCN, according to criteria of specimens’ importance and/or potential risk of urban pollution impact as well as of visitors’ impact.
Table 1 summarizes sensor positions during the evaluation carried out in February 2019.
Sensors were sensitized for 24 h, and then their optical response was recorded in situ using the patented portable measure unit [
25], which was connected to a laptop. The computer was provided with the specific software for handling the records [
26]. Methodology for recordings consisted of taking the sensor from its sensitization position and, immediately, introducing it in the measure unit. Then, the pH values detected appear in the laptop screen. This routine was repeated for all sensors installed, and, after that, all sensors were regenerated one by one at the laboratory by using pH-buffered solutions and repeating the calibration procedure explained above. Following this procedure, the sensors could be reused many times in the same or in different positions, according to needs and criteria of the museum collection curators. In general, sensors were installed once again in the same position to check potential pH changes due to meteorological seasons and/or to visitors, but in other cases in which pH showed noticeable stability near neutrality, the corresponding sensors were installed in other positions to obtain additional data on environmental pH. Recordings were taken after the first 24 h of sensor exposition and then at both 48 and 72 h. These later recordings were taken to confirm the results of the first recordings since 24 h is enough for sensors to be fully sensitized. After two or three confirmation recordings, sensors were uninstalled, regenerated, and recalibrated in the laboratory up to the next evaluation that could be undertaken immediately or after some days or weeks.
3. Results
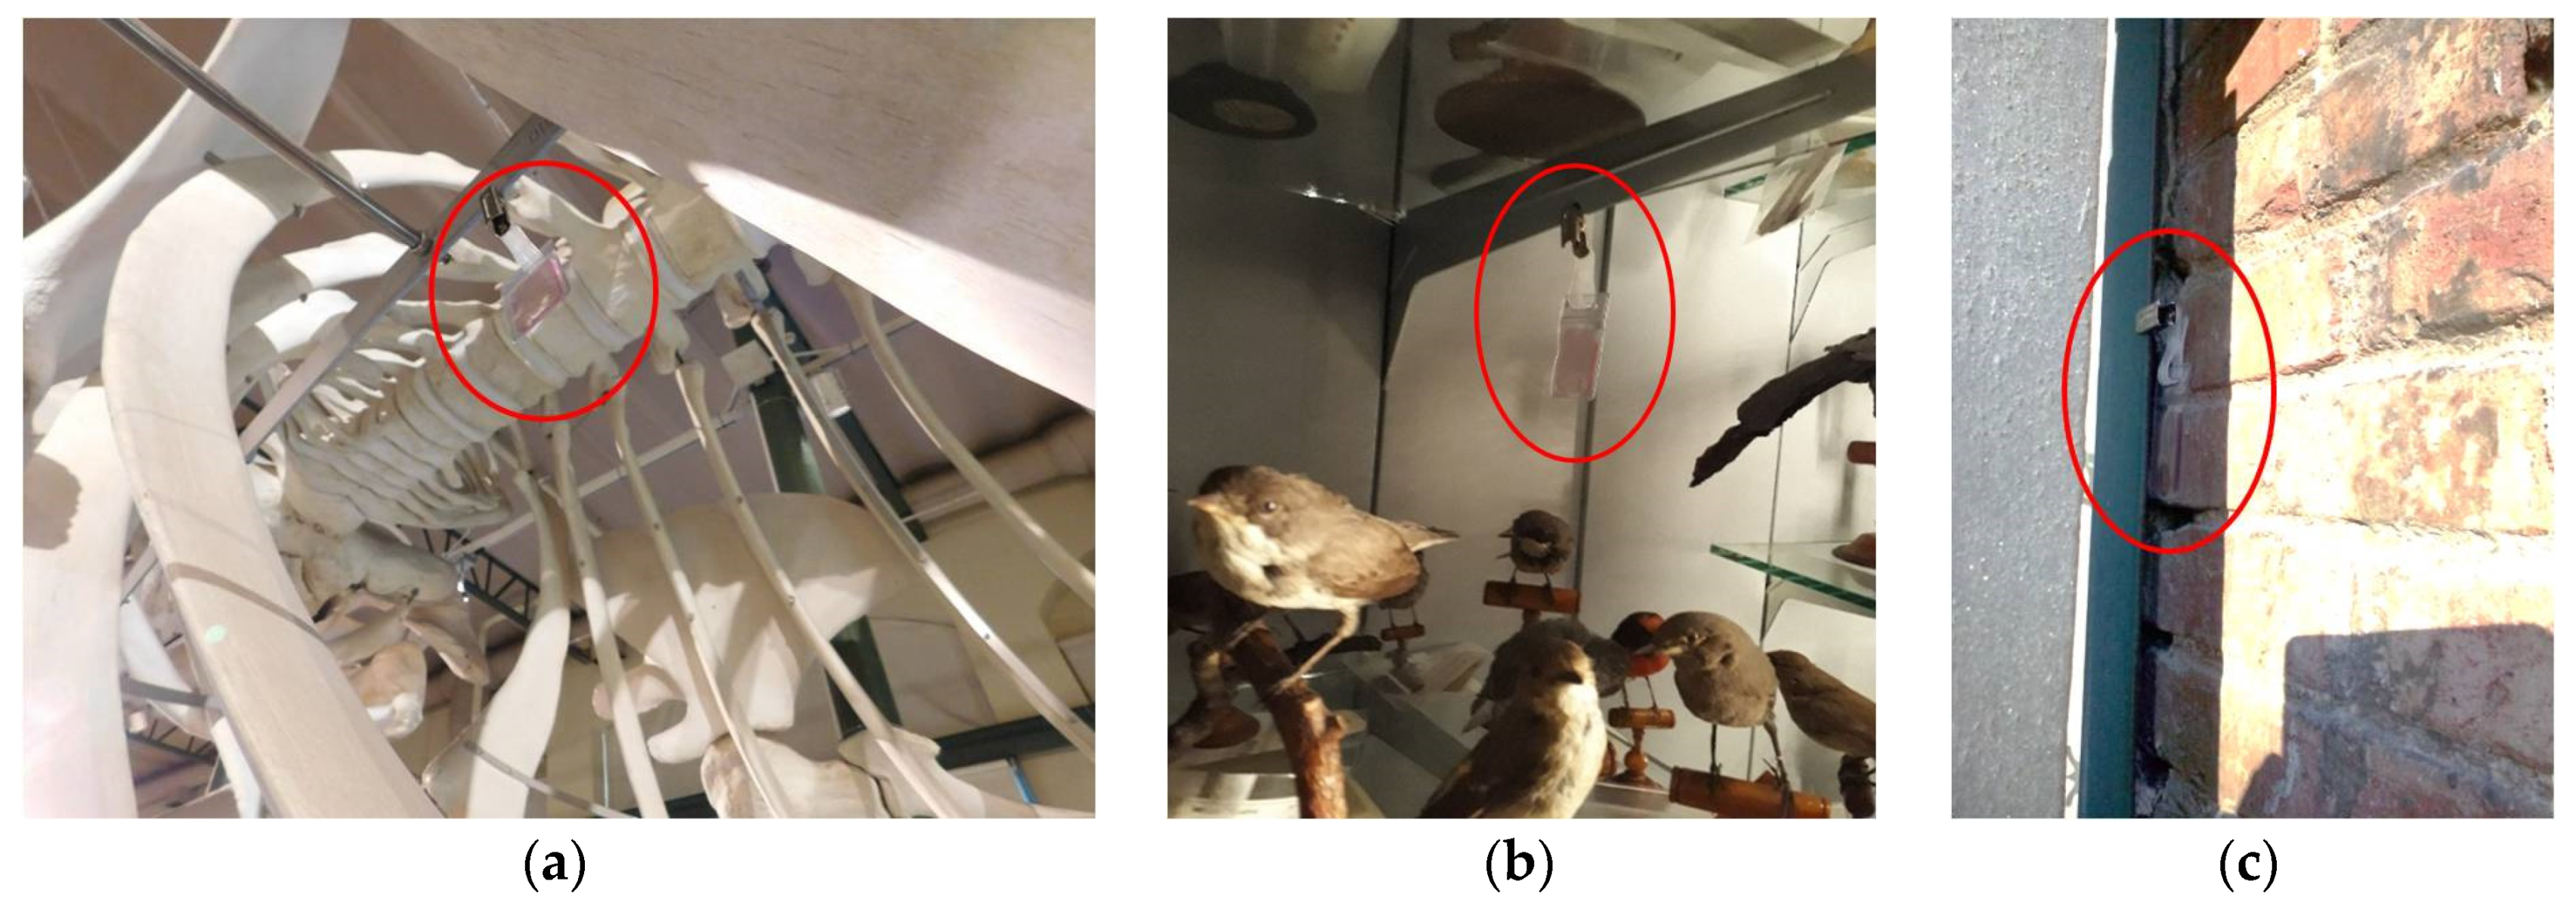
Evaluation with pH optical sensors has been accomplished for the four seasons of a full year from February 2019 to November 2019. Monitoring covered four different exhibition halls in which 12 positions were checked. A total of 236 recordings were made. In exhibition halls, the sensor positions were inside showcases as well as under the hall free environment. In addition, two sensors were installed outdoors for comparison purposes. One of them was installed in the main façade (West orientation) and another one in the rear façade (East orientation). The main façade is near Paseo de la Castellana, an important avenue in downtown Madrid with heavy road traffic. The rear façade is somehow protected from pollution and is very close to a backyard without road traffic.
Figure 3 shows some sensor positions.
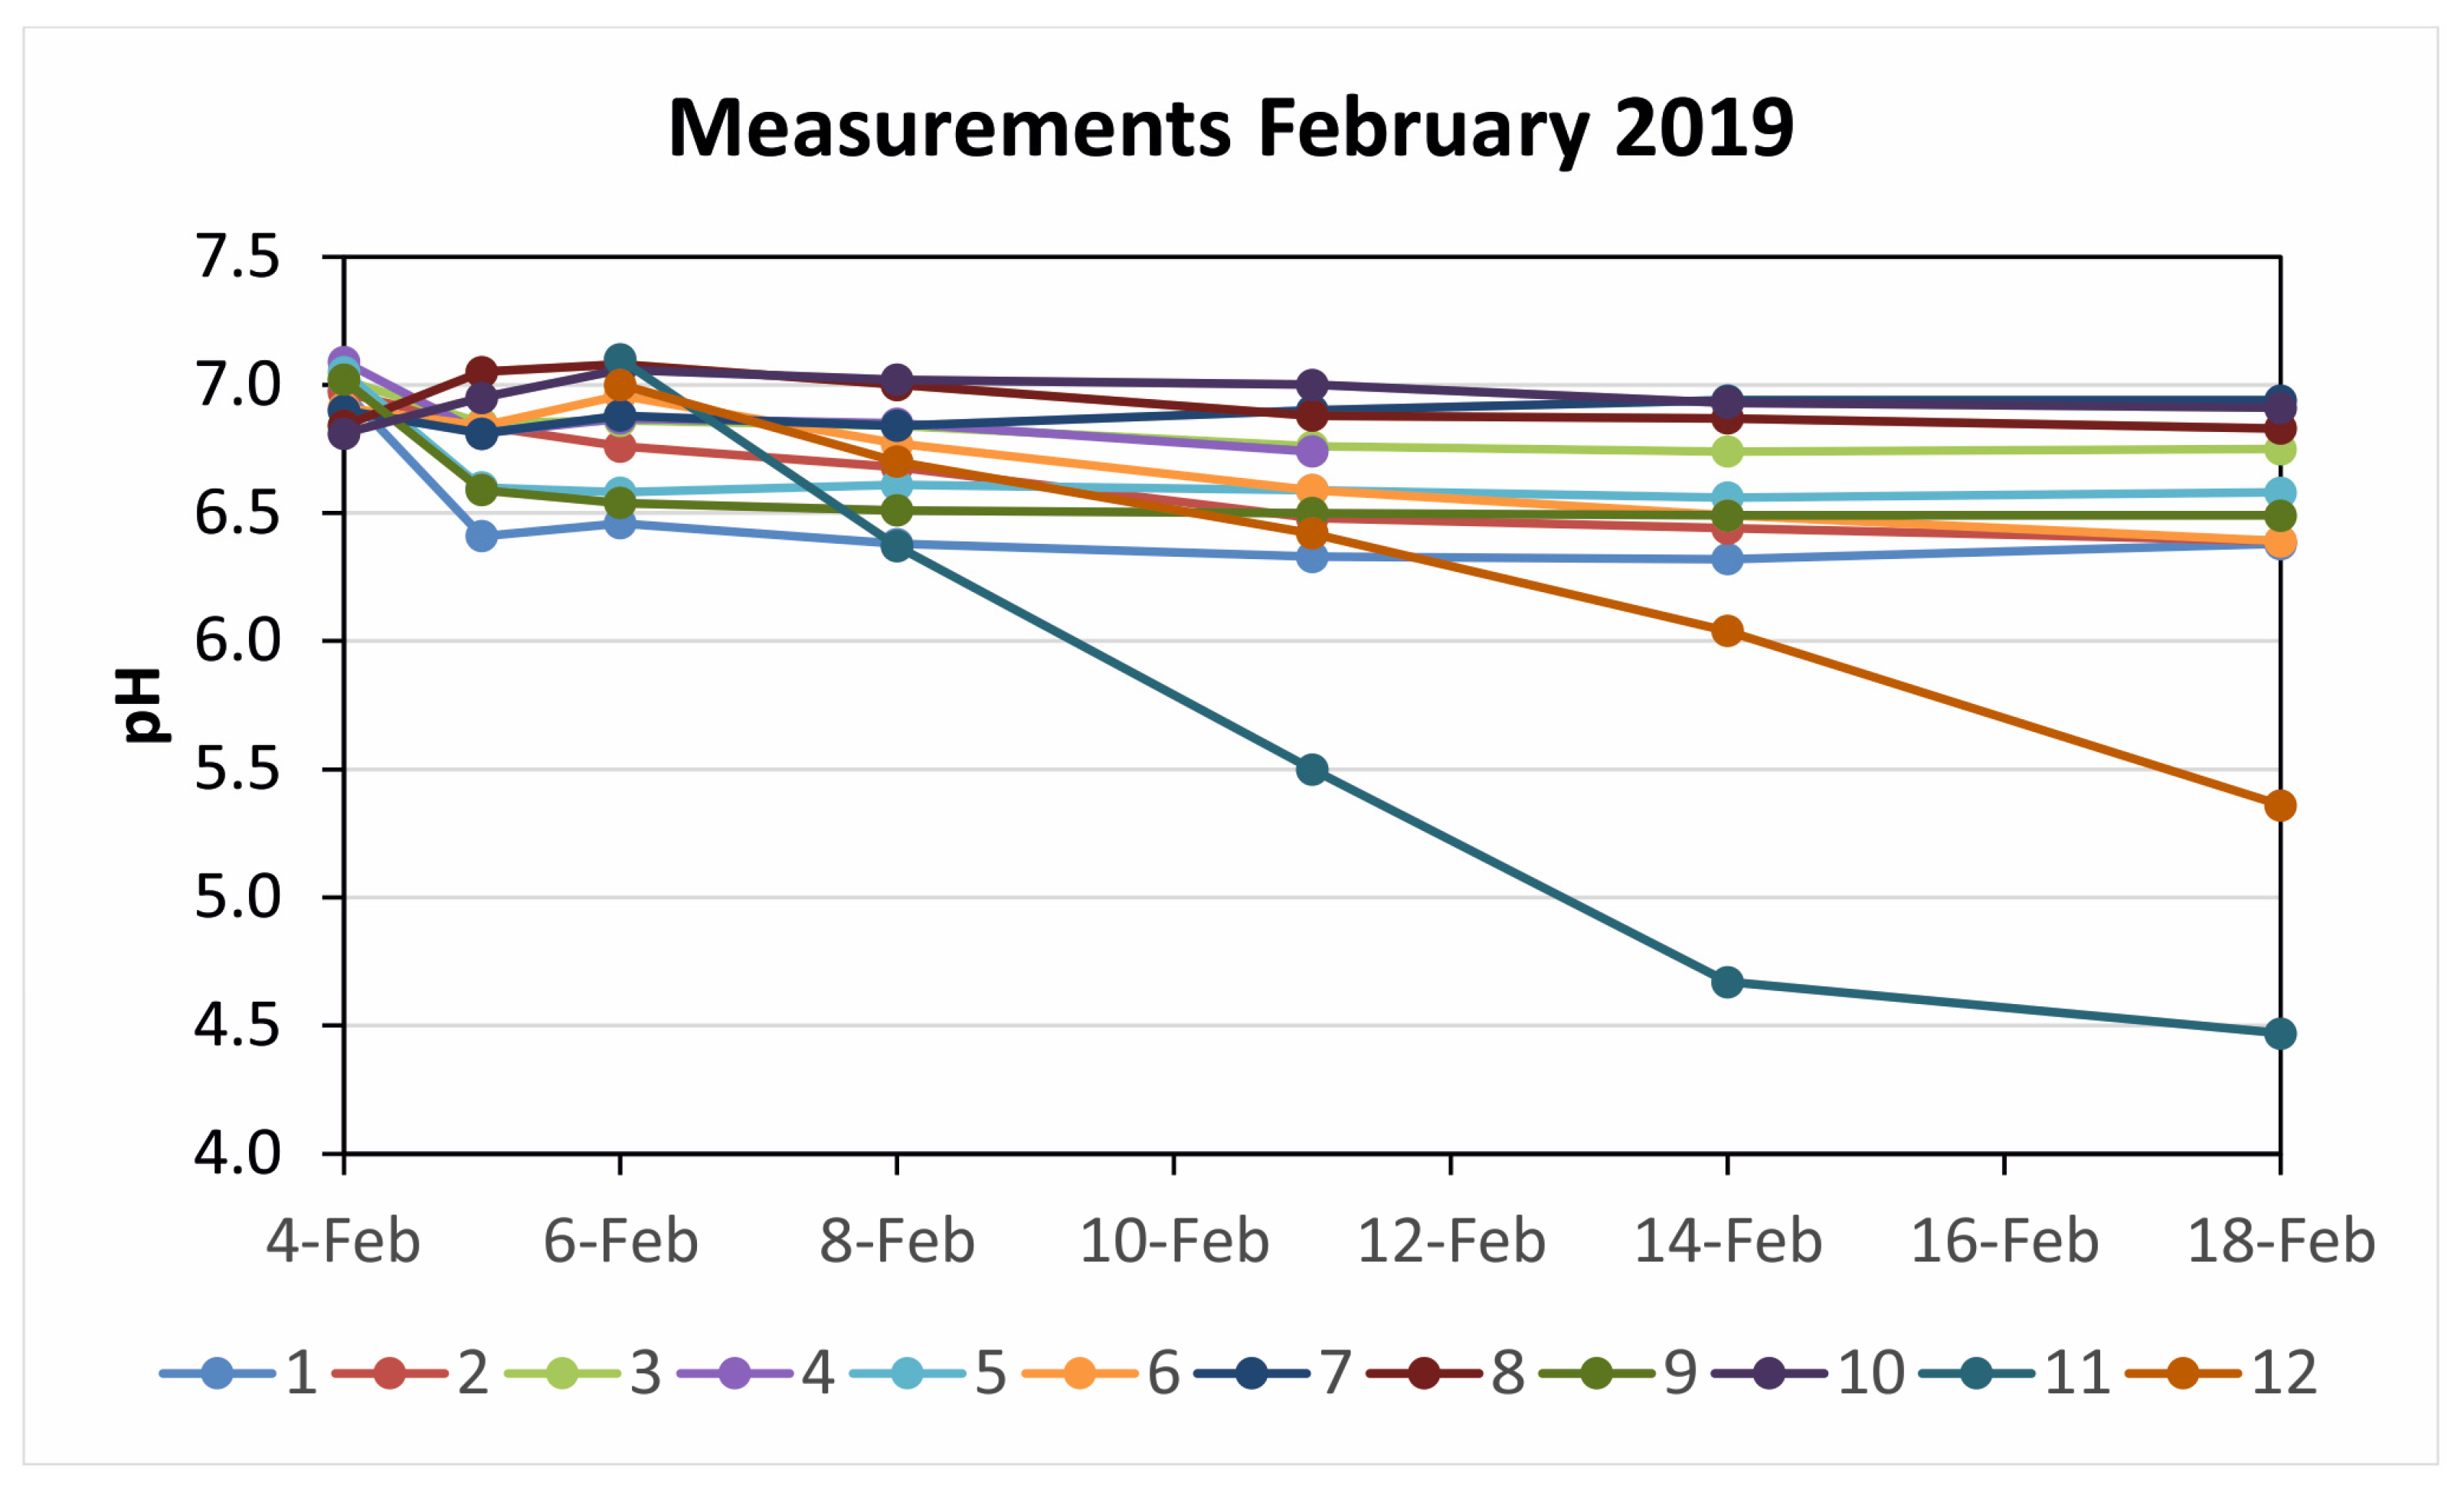
Winter evaluation (
Table 1) was carried out from 4 February up to 18 February. Six recordings were done for each sensor from the day after installation up to the end of evaluation when sensor recordings were stabilized. Outdoor sensors were installed on 6 February and they were exposed up to 18 February.
Figure 4 summarizes the average results obtained.
Although the initial pH values before sensor sensitization were plotted in
Figure 4, these values are not taken into account for average calculations. Sensor number 4 was lost during the evaluation period; therefore, its recordings of 14 and 18 February are missing. As can be seen in
Figure 4, all indoor sensors are stabilized after the first 24 h of exposition, which confirms, as expected, their high sensitivity and fast response time. However, sensors installed outdoors showed a decreasing habit that indicates an intensely acidic pH as well as insufficient exposition time. Probably they would reach stabilization after more days of exposition.
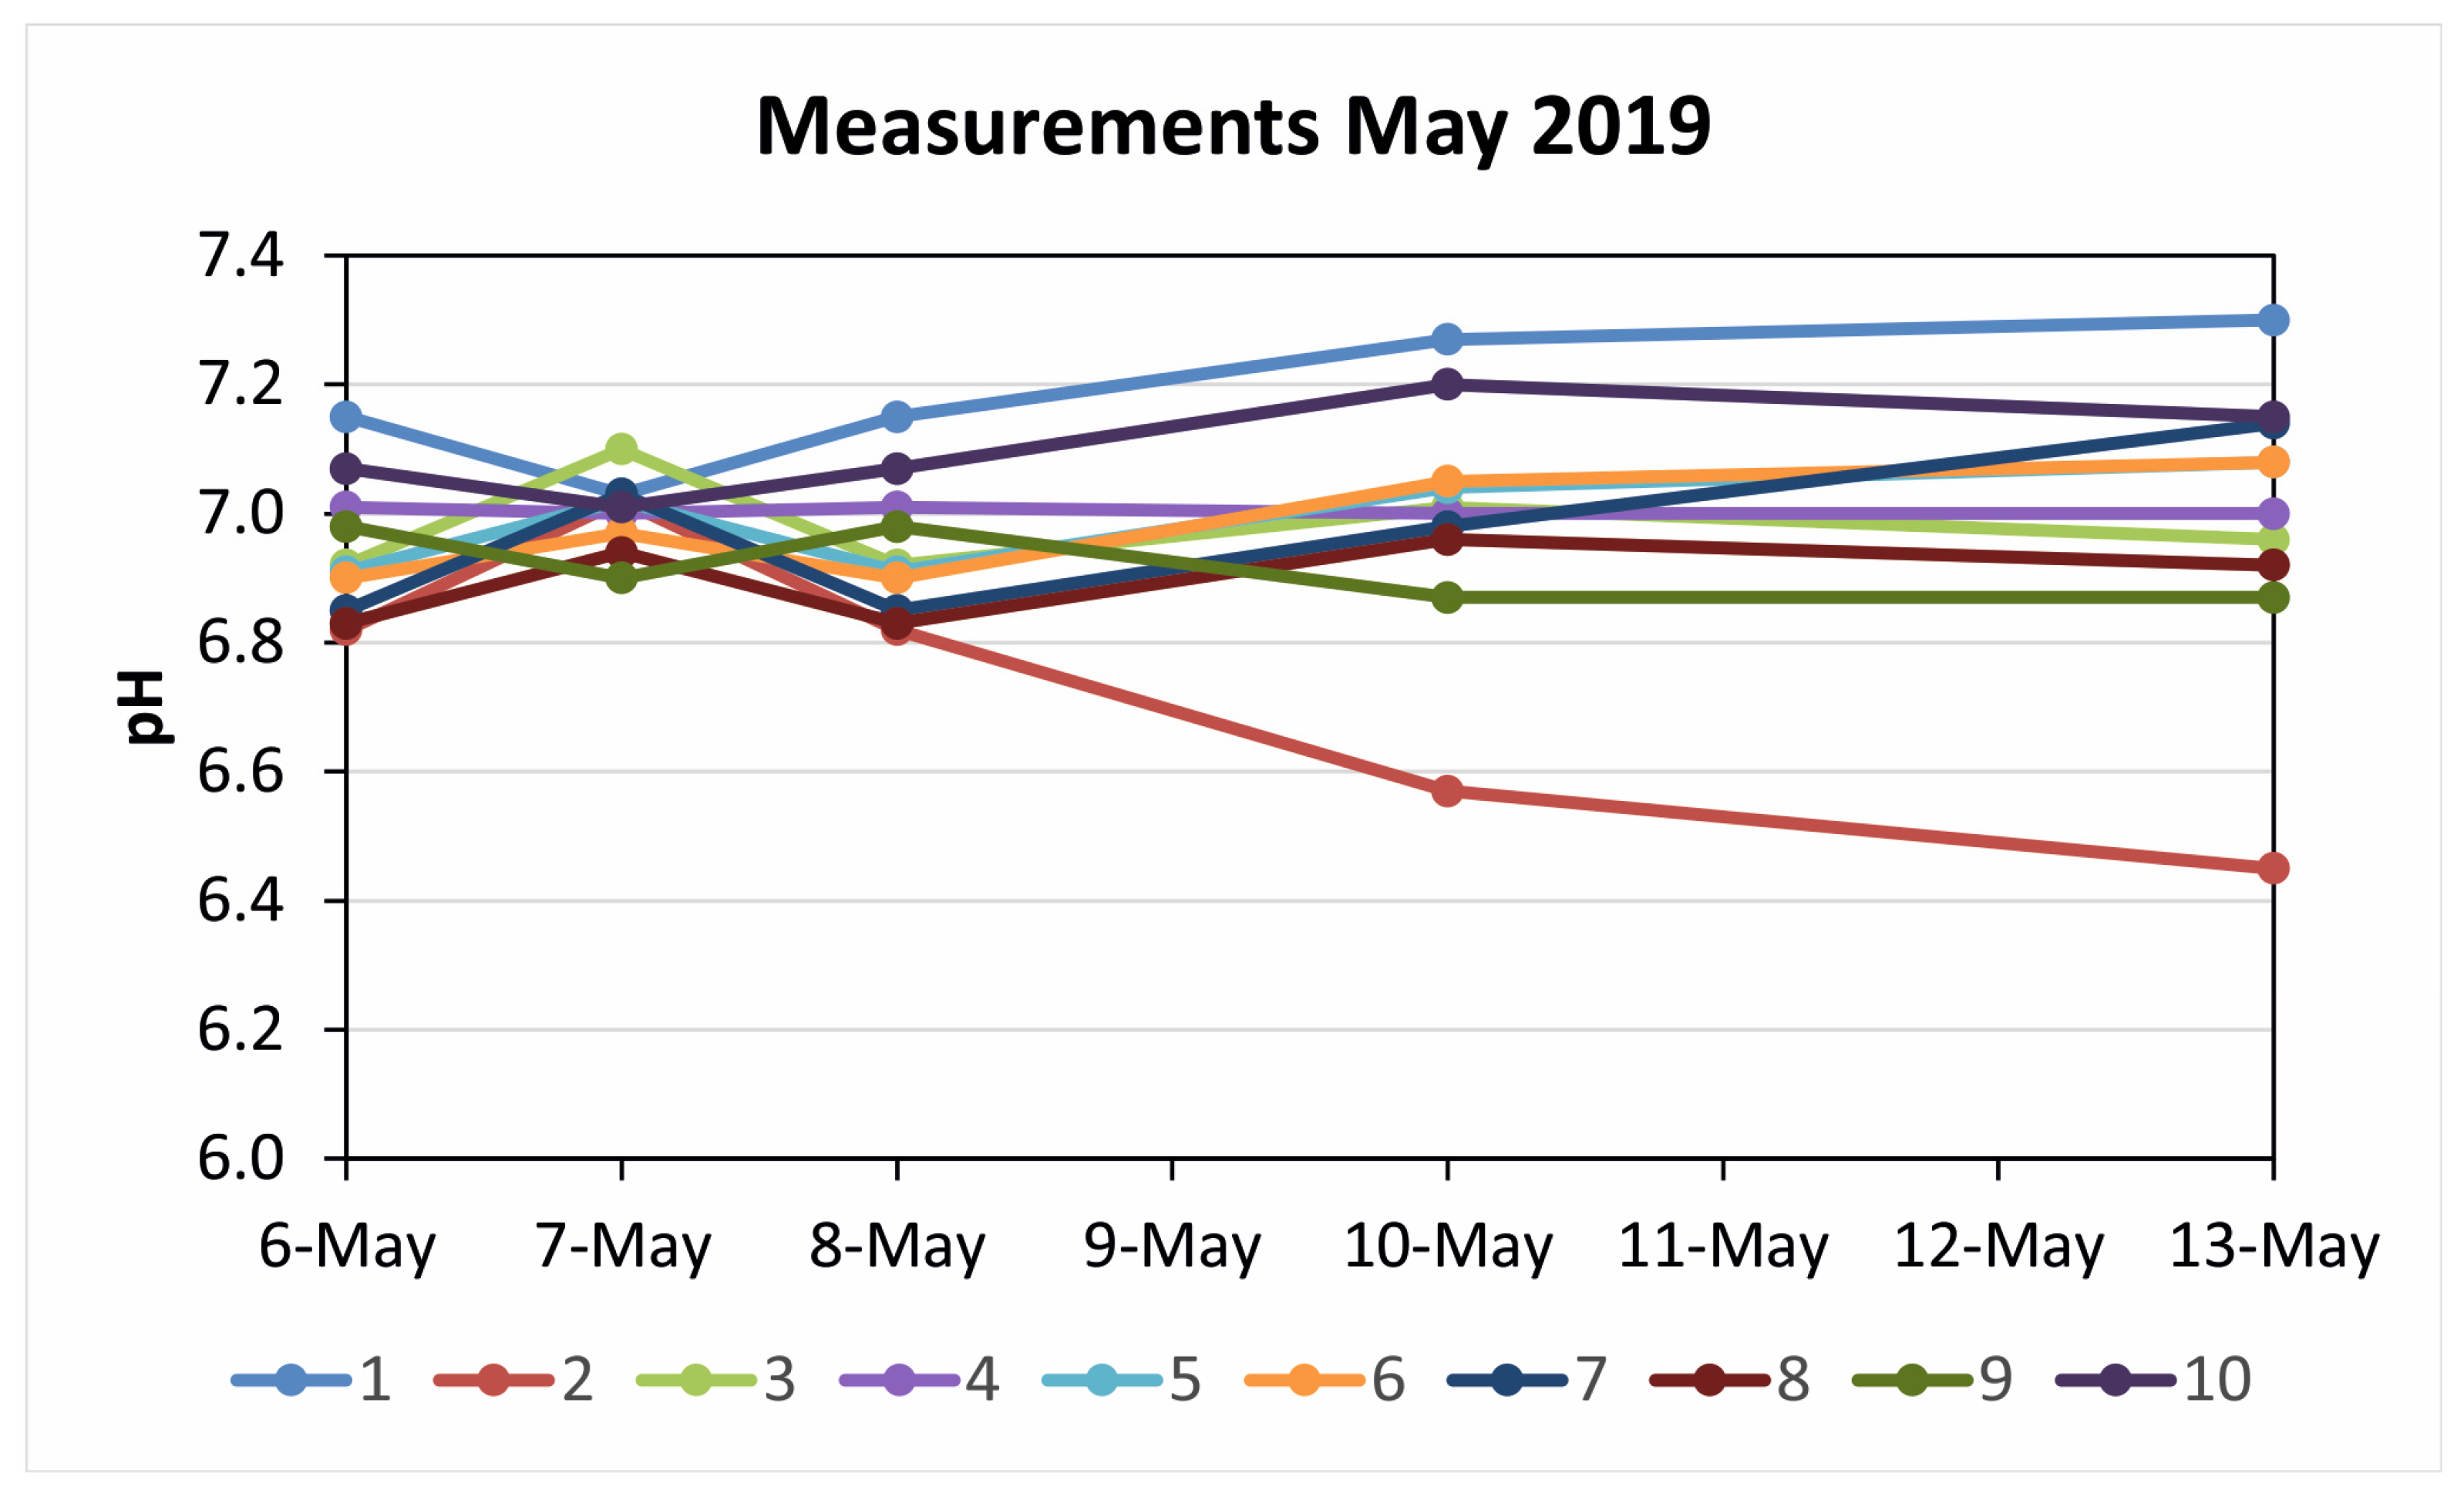
The second evaluation was undertaken from 20 May up to 27 May. Four recordings were taken for each sensor from the day after installation up to the end of evaluation. Sensor positions were the same as for the former evaluation. pH average results obtained are shown in
Figure 5. In this case, an initial stabilization of pH recordings from outdoor sensors can be observed.
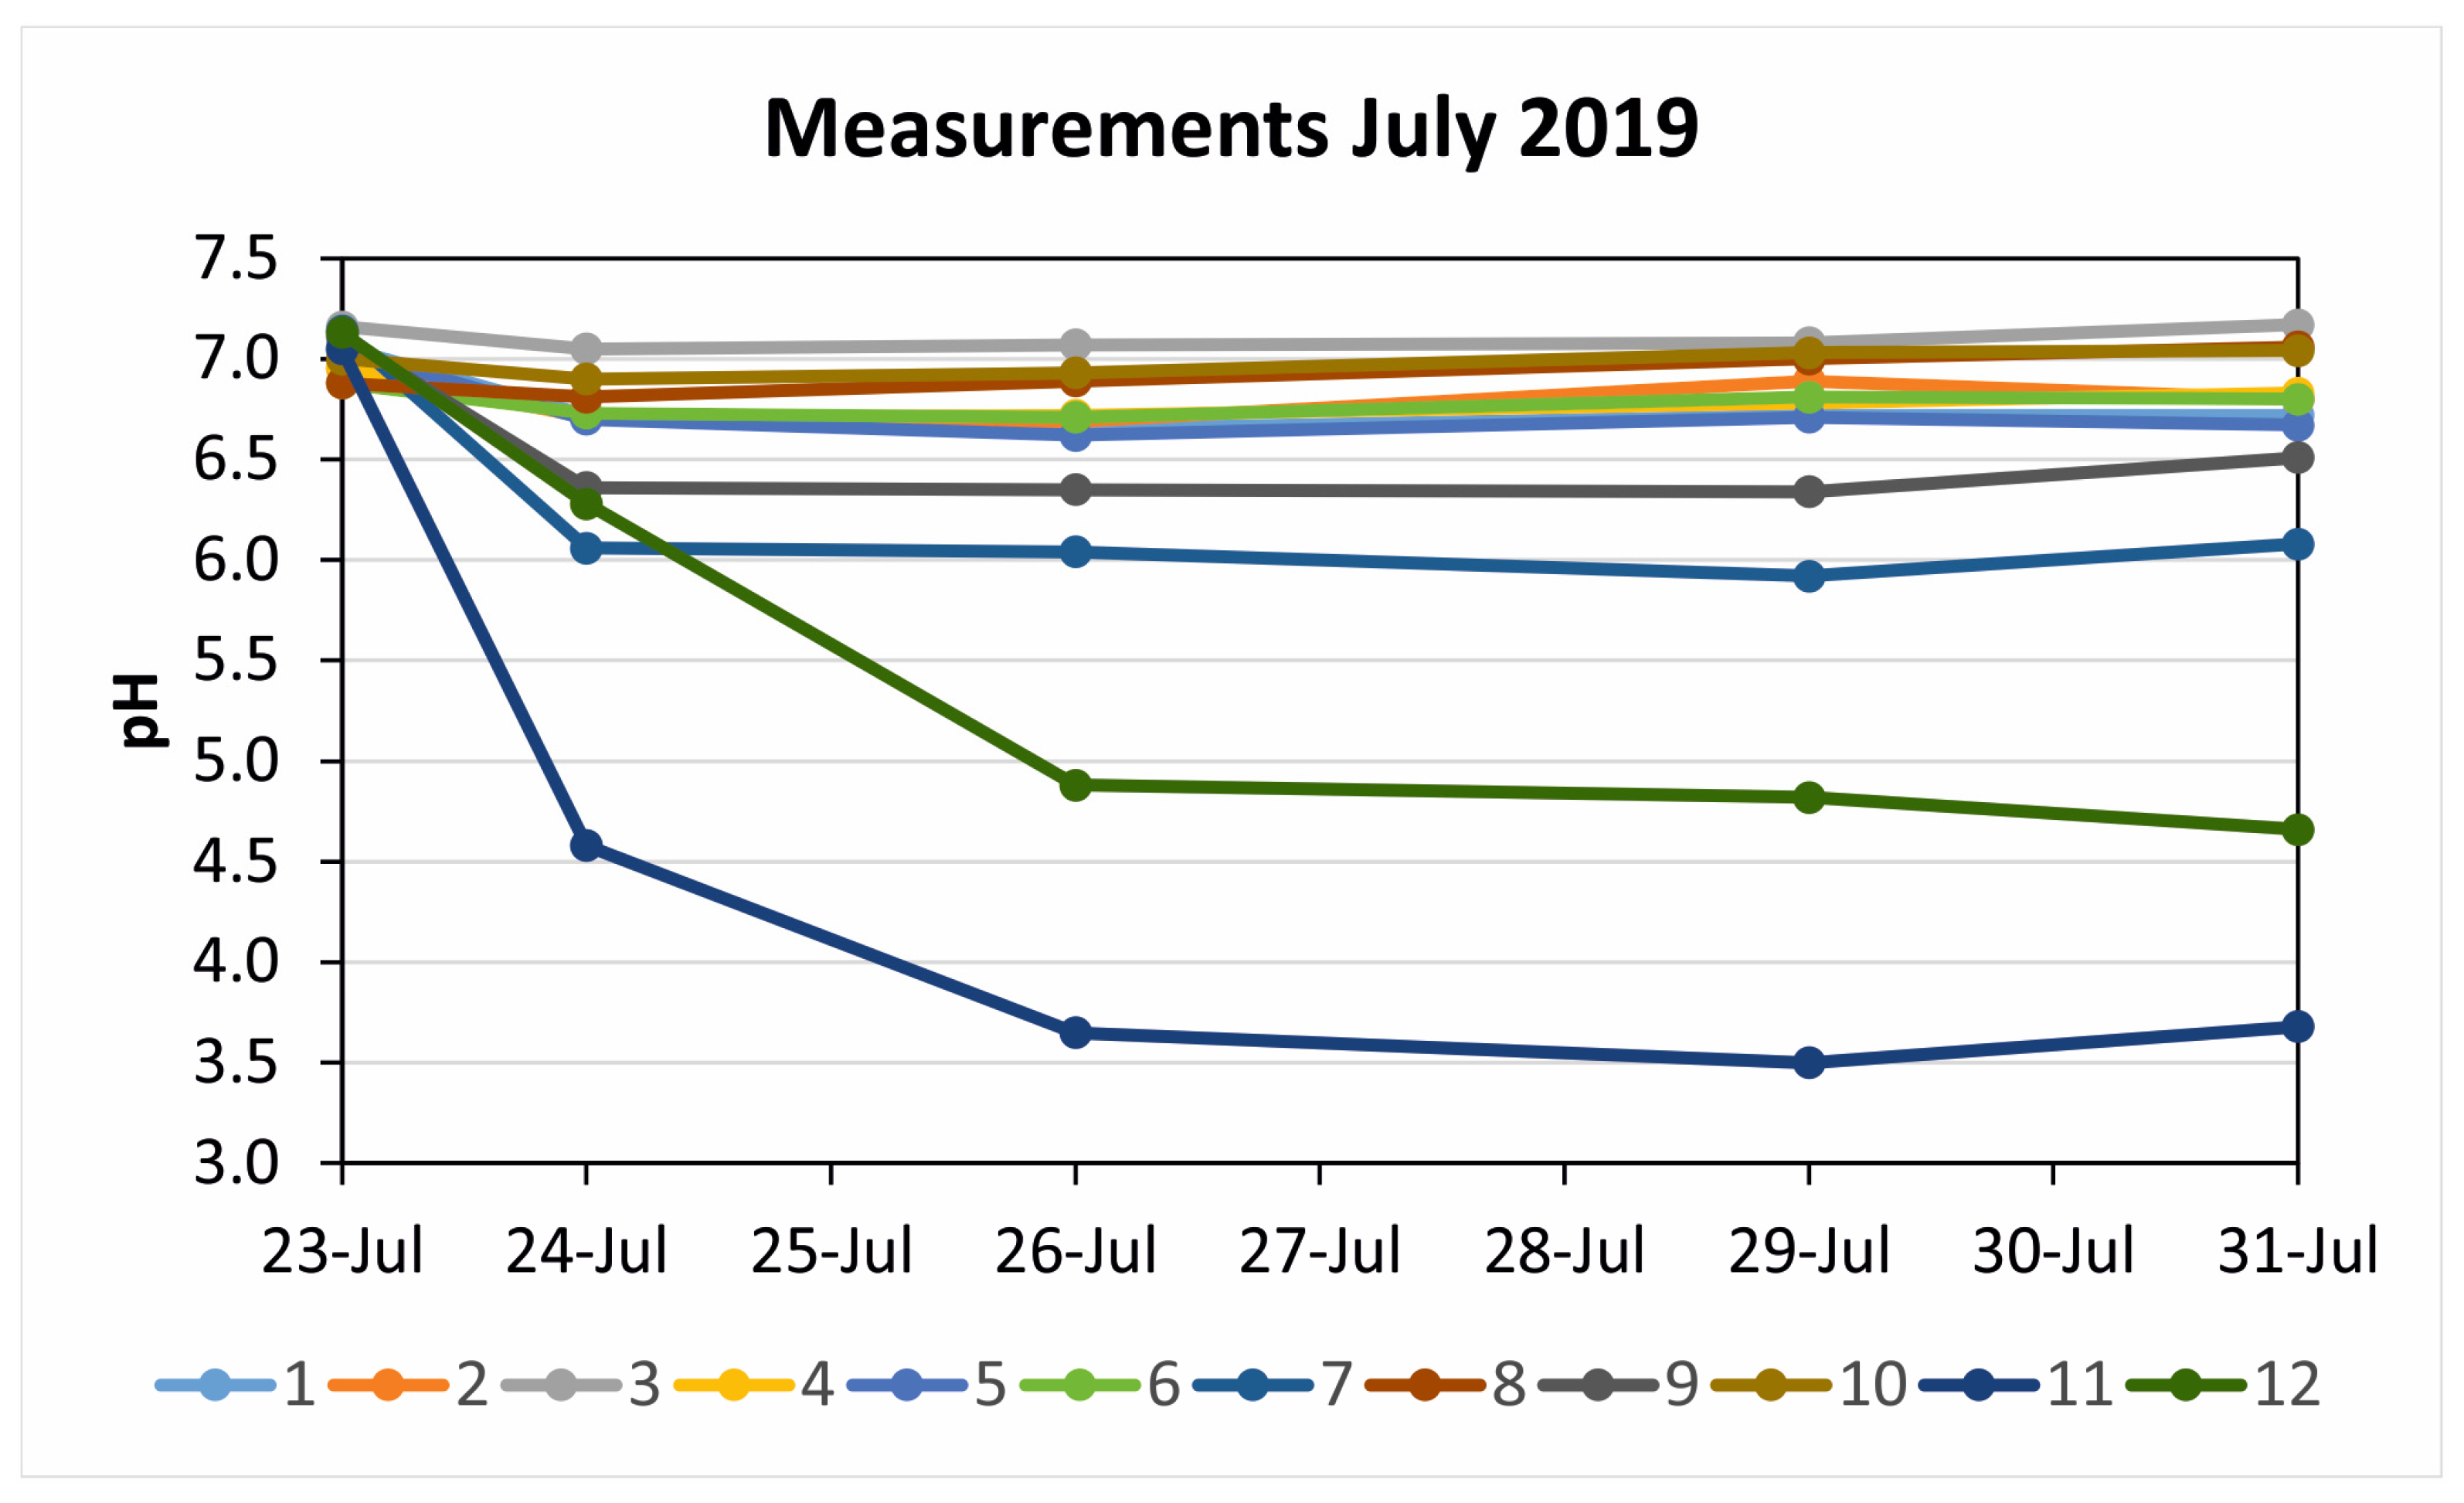
Summer evaluation was carried out from 23 July up to 31 July. Four measurements were recorded from the day after installation to the evaluation ending. All sensor positions were changed except those of showcase V18 near the MNCN entrance and the two sensors installed outdoors.
Figure 6 shows the results obtained, and
Table 2 summarizes the new sensor positions.
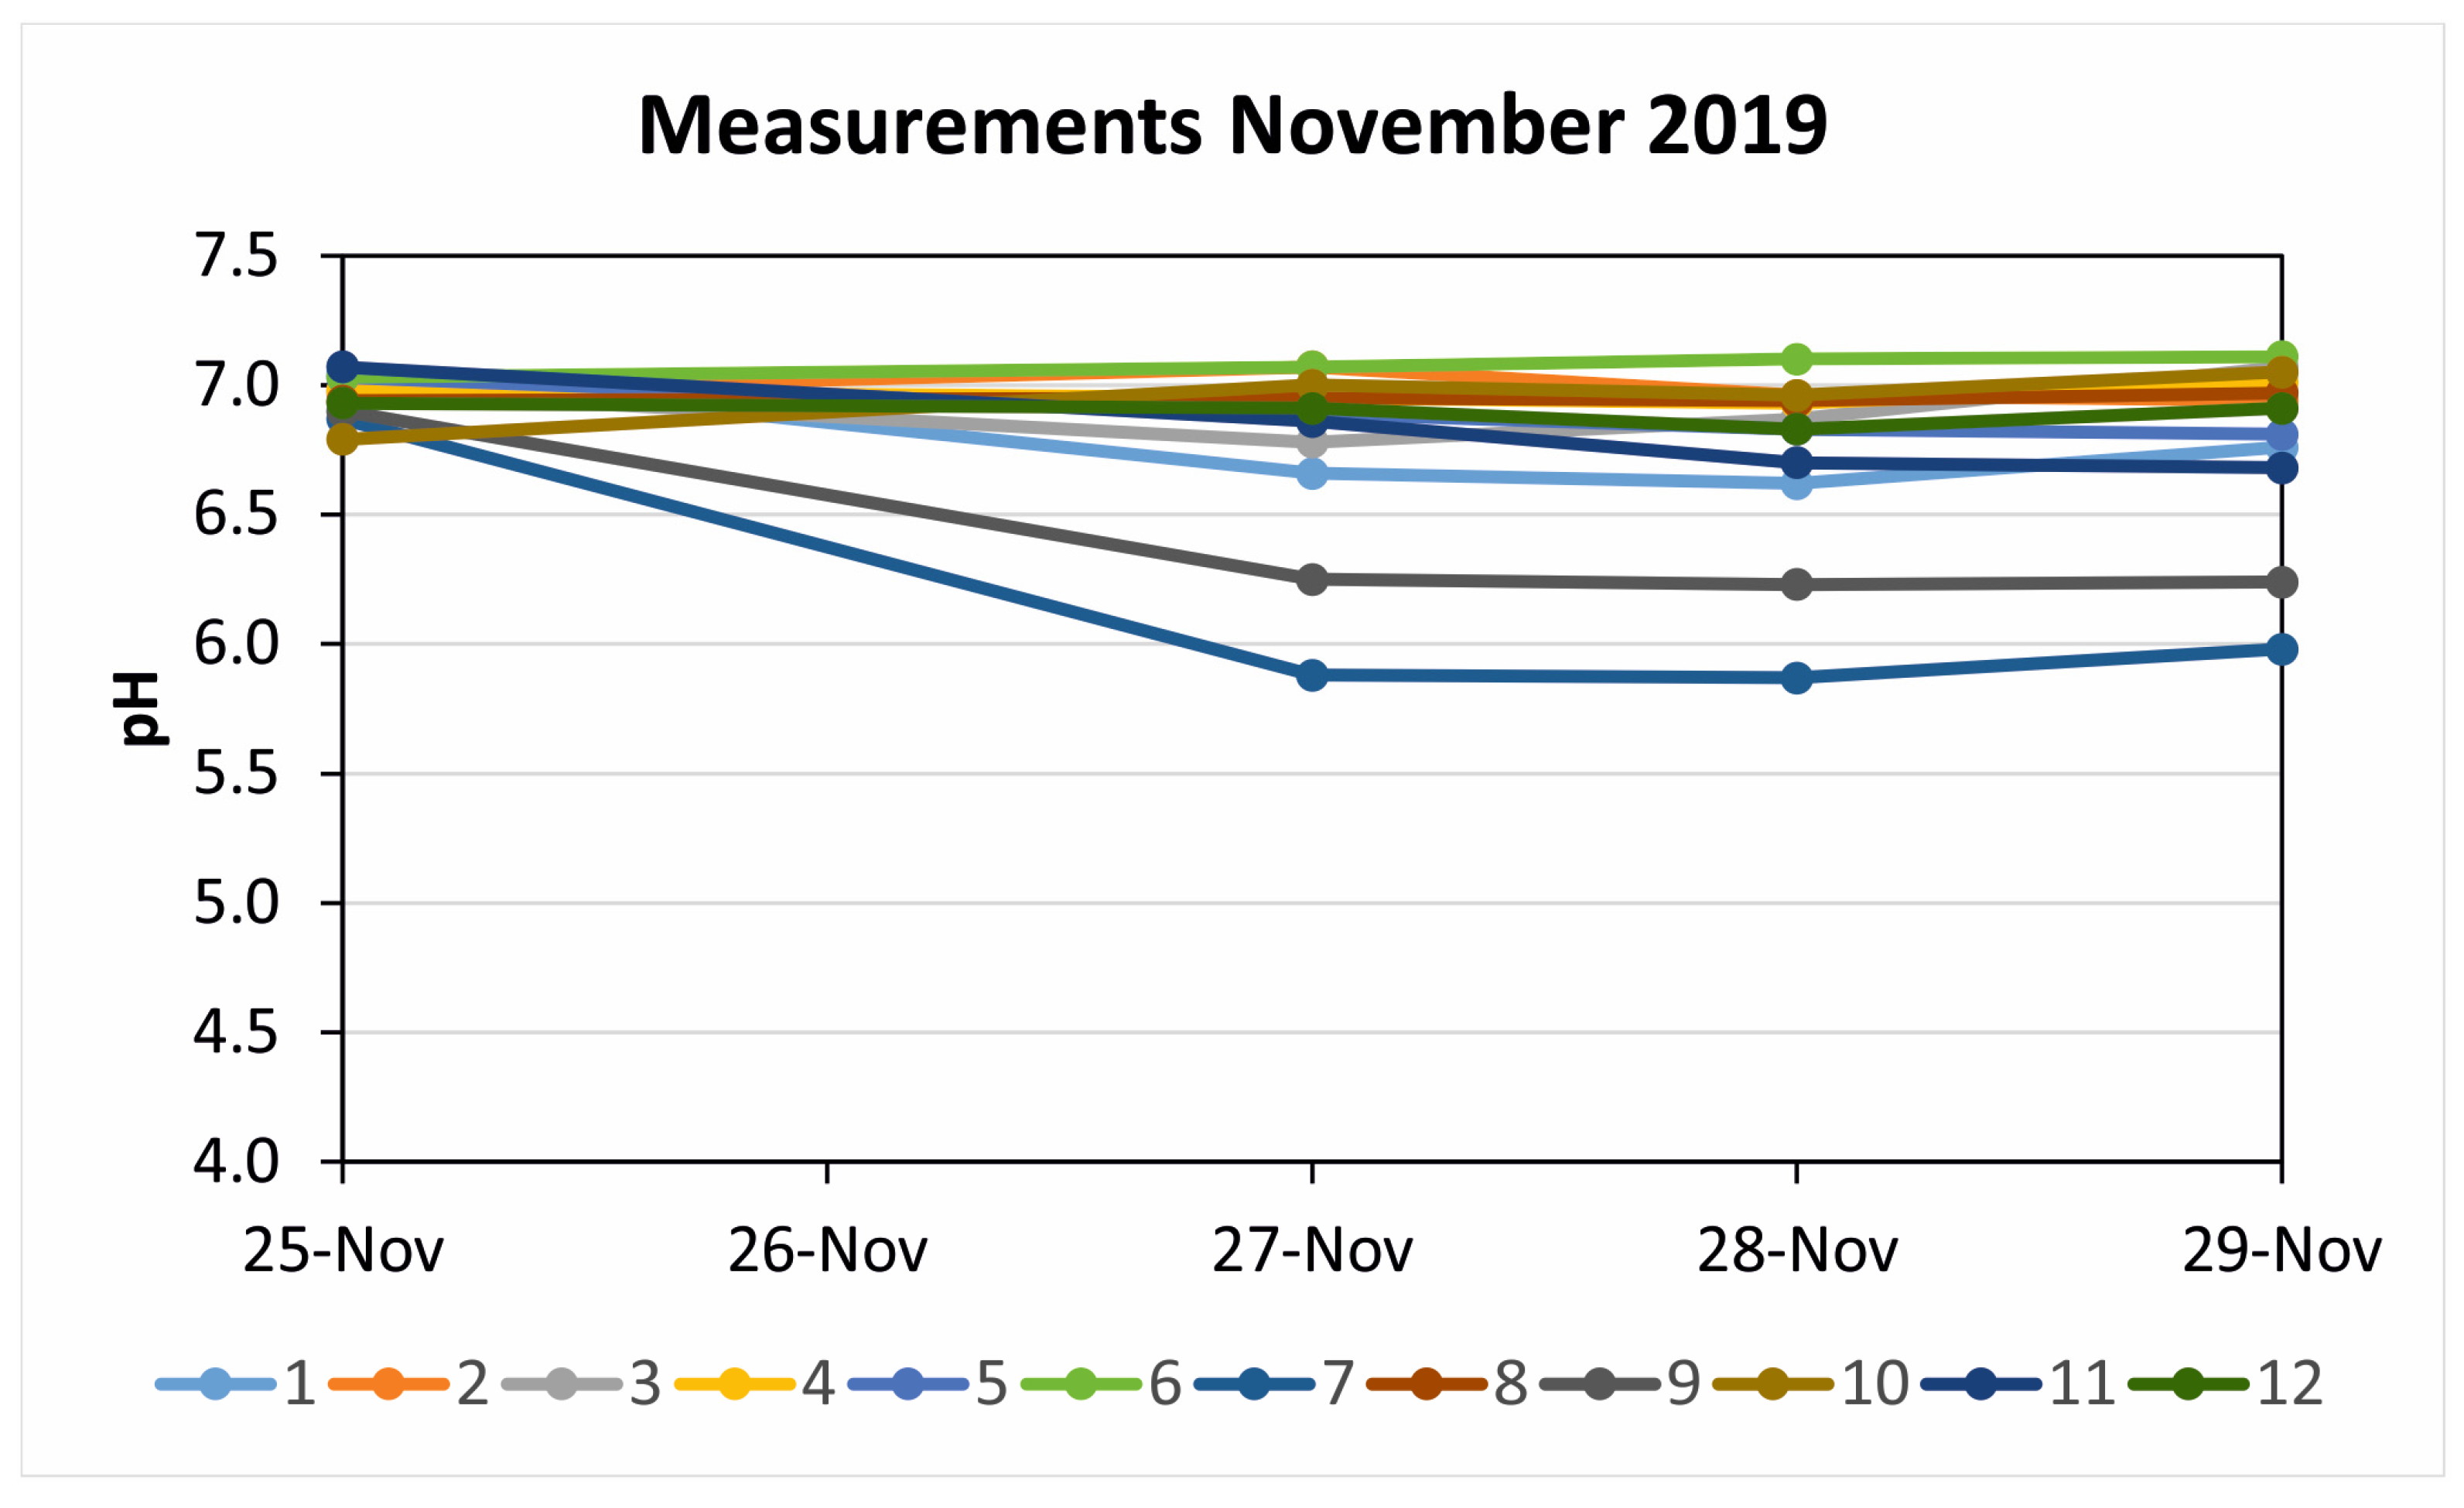
Finally, the fourth evaluation corresponding to fall was carried out from 25 November up to 29 November. Sensor positions were the same as in the former summer evaluation (
Table 2). Three recordings were taken for each sensor, and the corresponding results are summarized in
Figure 7. It should be noted that in this evaluation the pH values from outdoor sensors reached stabilization during the evaluation period.
Comparison of all pH recordings from the different meteorological seasons are summarized in
Table 3. For clarity, the results corresponding to different positions of the same sensor (e.g., 1a, 1b) are indicated in separated cells.
4. Discussion
Results obtained indicate that pH values recorded vary to a great extent depending on the particular location of exhibition halls and showcases as well as on meteorological seasons.
Related to the influence of sunlight, environmental humidity, and temperature in sensing results, sunlight, in this case, does not affect the sensor response since they were installed indoors and were always illuminated by LED systems. It was widely demonstrated in former research [
19] that environmental humidity affects the sensor response (obviously, pH depends on the amount of H
3O
+ and OH
−), while temperature affects results as far as it influences relative humidity. Temperature and relative humidity are simultaneously measured and controlled during pH sensor sensitization. The patented portable device that measures the sensors’ optical responses [
25] includes both relative humidity and temperature sensors. Either the calibration curves or the specific software for the corresponding results management take into account humidity and temperature effects. Such effects were widely investigated in [
27,
28,
29] and revised in [
19].
Concerning sensors two, four and six installed in the so-called Biodiversity hall (main greatest hall and the first one after the museum entrance), the positions of sensors two and six were changed during the third and fourth evaluation. Two other sensors were installed in two smaller halls (number eight in the National Parks hall and number ten in the Mediterranean hall); these were somehow protected from the urban air coming from the outdoors. Sensors two, four and six of the Biodiversity hall recorded an average pH between 6.7 and 6.9 (slightly acidic). Since some sensors were not stabilized after the evaluation period, the exposition time was then extended. This could be due to the particular environmental conditions of the Biodiversity hall, which is directly exposed to the urban air that enters through the very big main door oriented to Paseo de la Castellana, a big avenue with heavy road traffic. No control of such ventilation was provided during the sensor sensitization. Moreover, intake of potential polluted air could be intensified by the high number of visitors accessing the museum by this main door, which is the regular entrance for museum personnel also. However, sensor numbers eight and ten installed in other exhibition halls far from the main entrance recorded pH average values near neutrality (6.9–7.0). Therefore, the connection between urban air, probably polluted, and the slightly acid recordings at the Biodiversity hall seems to be clear.
As far as the five sensors installed in showcases (numbers one, three, five, seven and nine) are concerned, all their positions were changed during the third and fourth evaluations. Except the sensor located in the showcase containing a rhinoceros skull, which recorded neutral pH, all the other sensors recorded a slightly acidic pH in the 6.5–7.0 range. Among them, three sensors (numbers 1a, 7b and 9b), which were installed inside ancient wooden showcases with small size and abundant organic matter (e.g., dried plants, feathers, paper, wood, etc.), recorded pH average values below 6.5. Combination of these kinds of materials and showcase tightness could promote generation of an acidic microenvironment, probably due to the emission of volatile organic compounds (e.g., formaldehyde, formic acid and acetic acid).
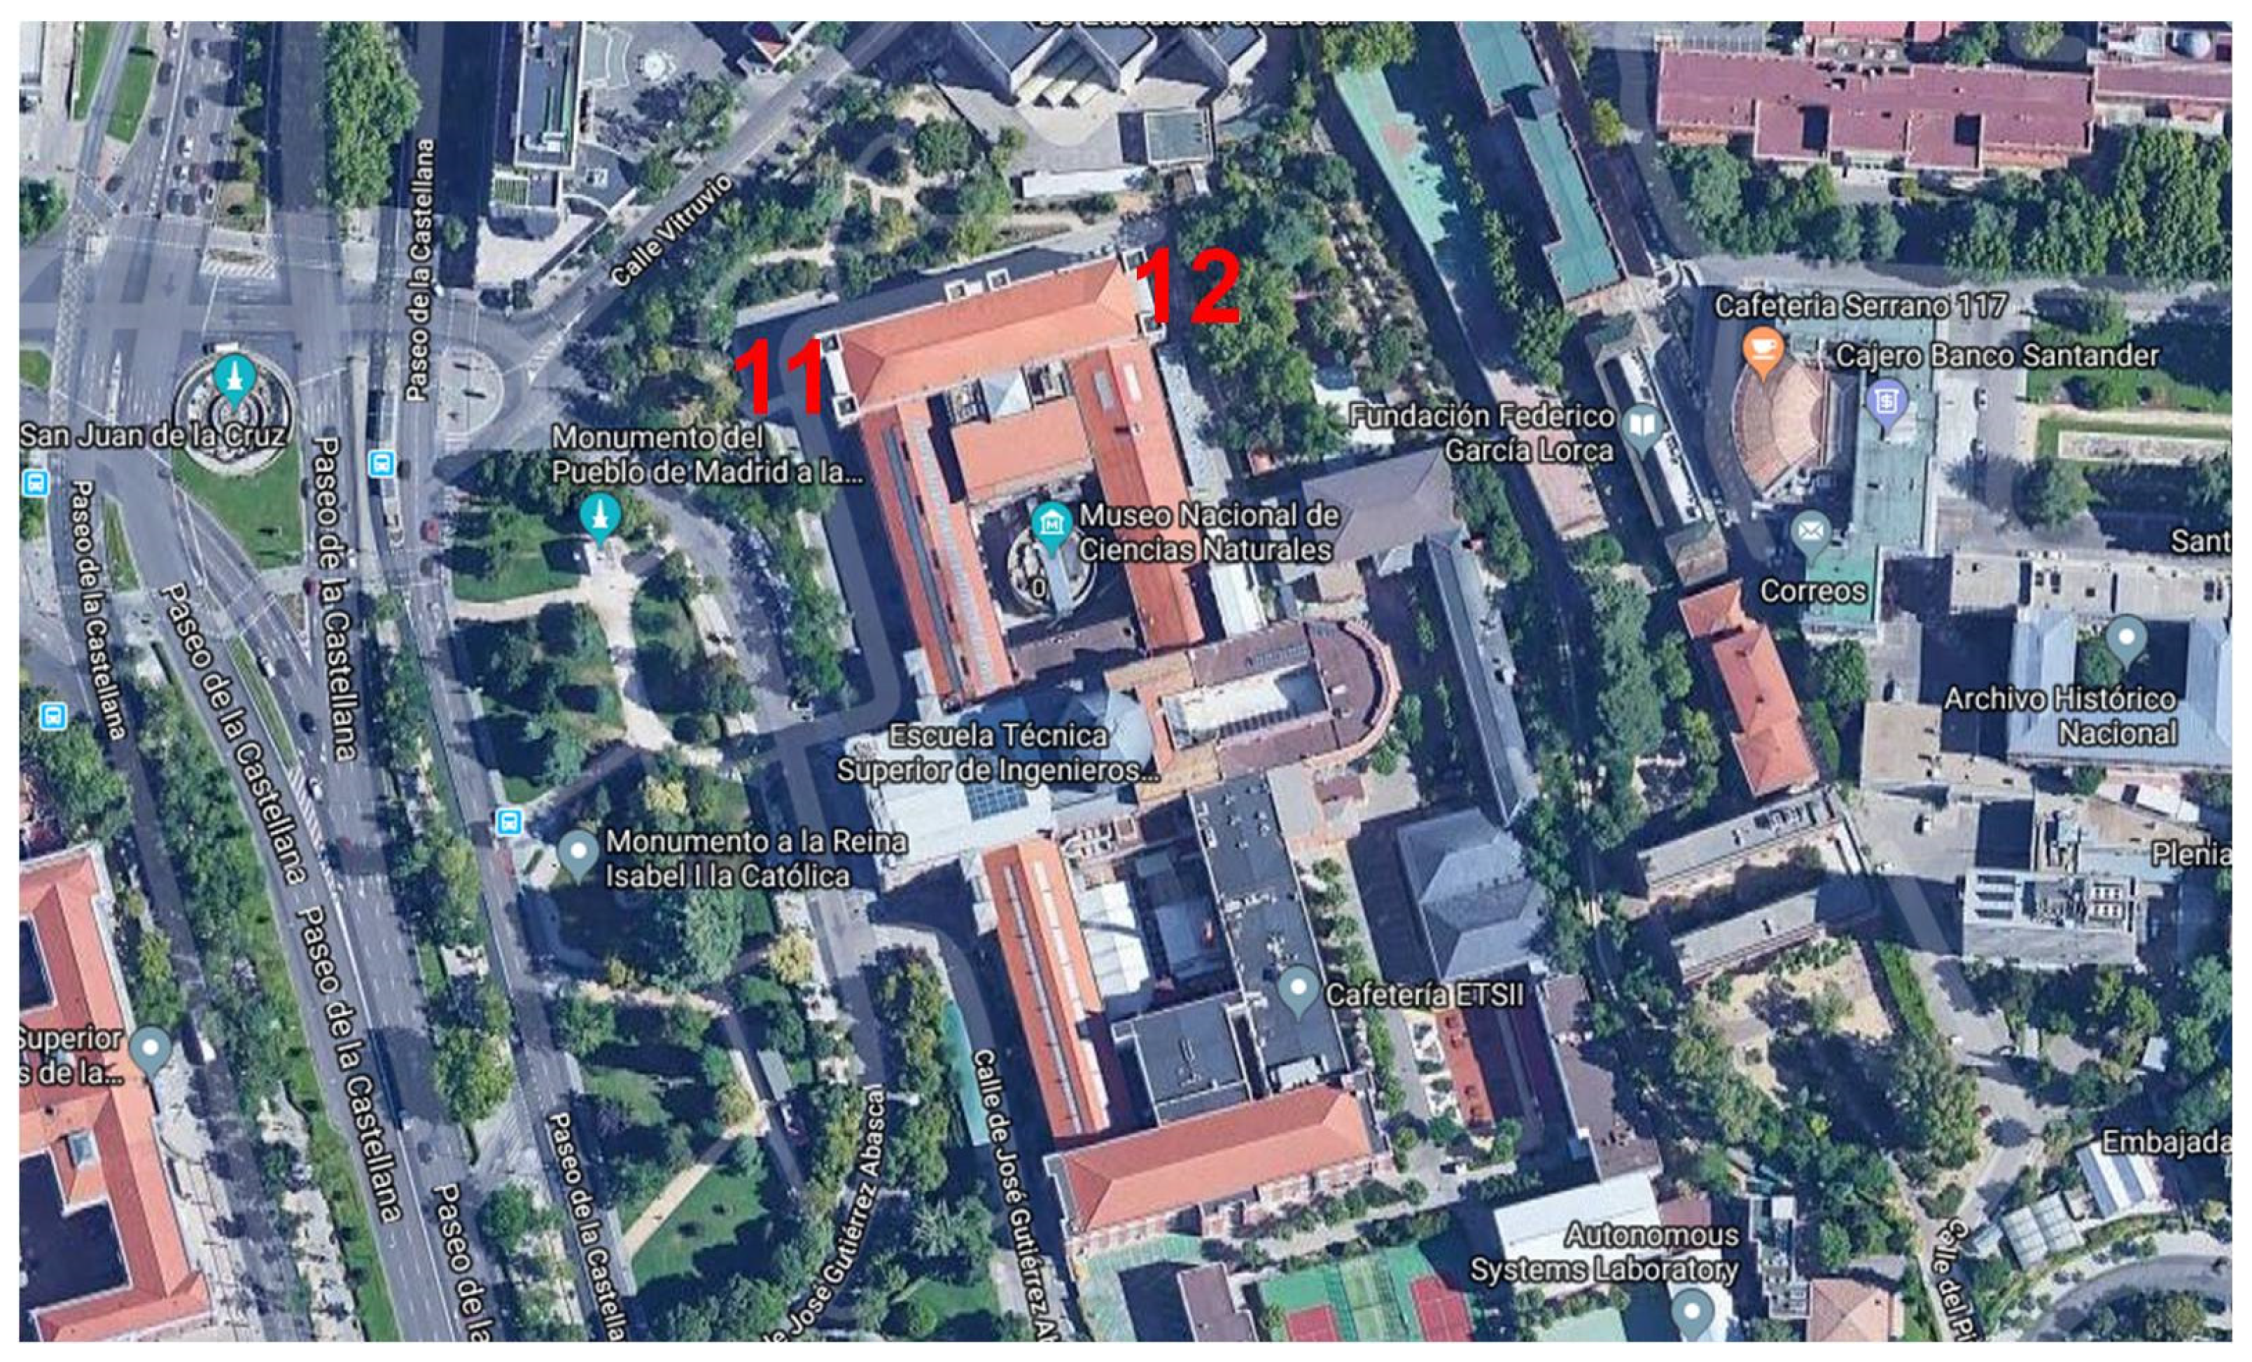
Concerning the sensors installed outdoors, recordings show a very acidic environment due to the heavy road traffic of Paseo de la Castellana as is mentioned above. The main acidic pollutants in urban areas are SO
2 and NO
x, which are combined with moisture generated sulfuric and nitric acid [
30]. In addition, when relative humidity is low, for instance during warm seasons, a dry acid deposition phenomenon takes place [
31,
32,
33]. Outdoor positions of sensors 11 and 12 are shown in
Figure 8, and the corresponding pH average recordings are summarized in
Table 3.
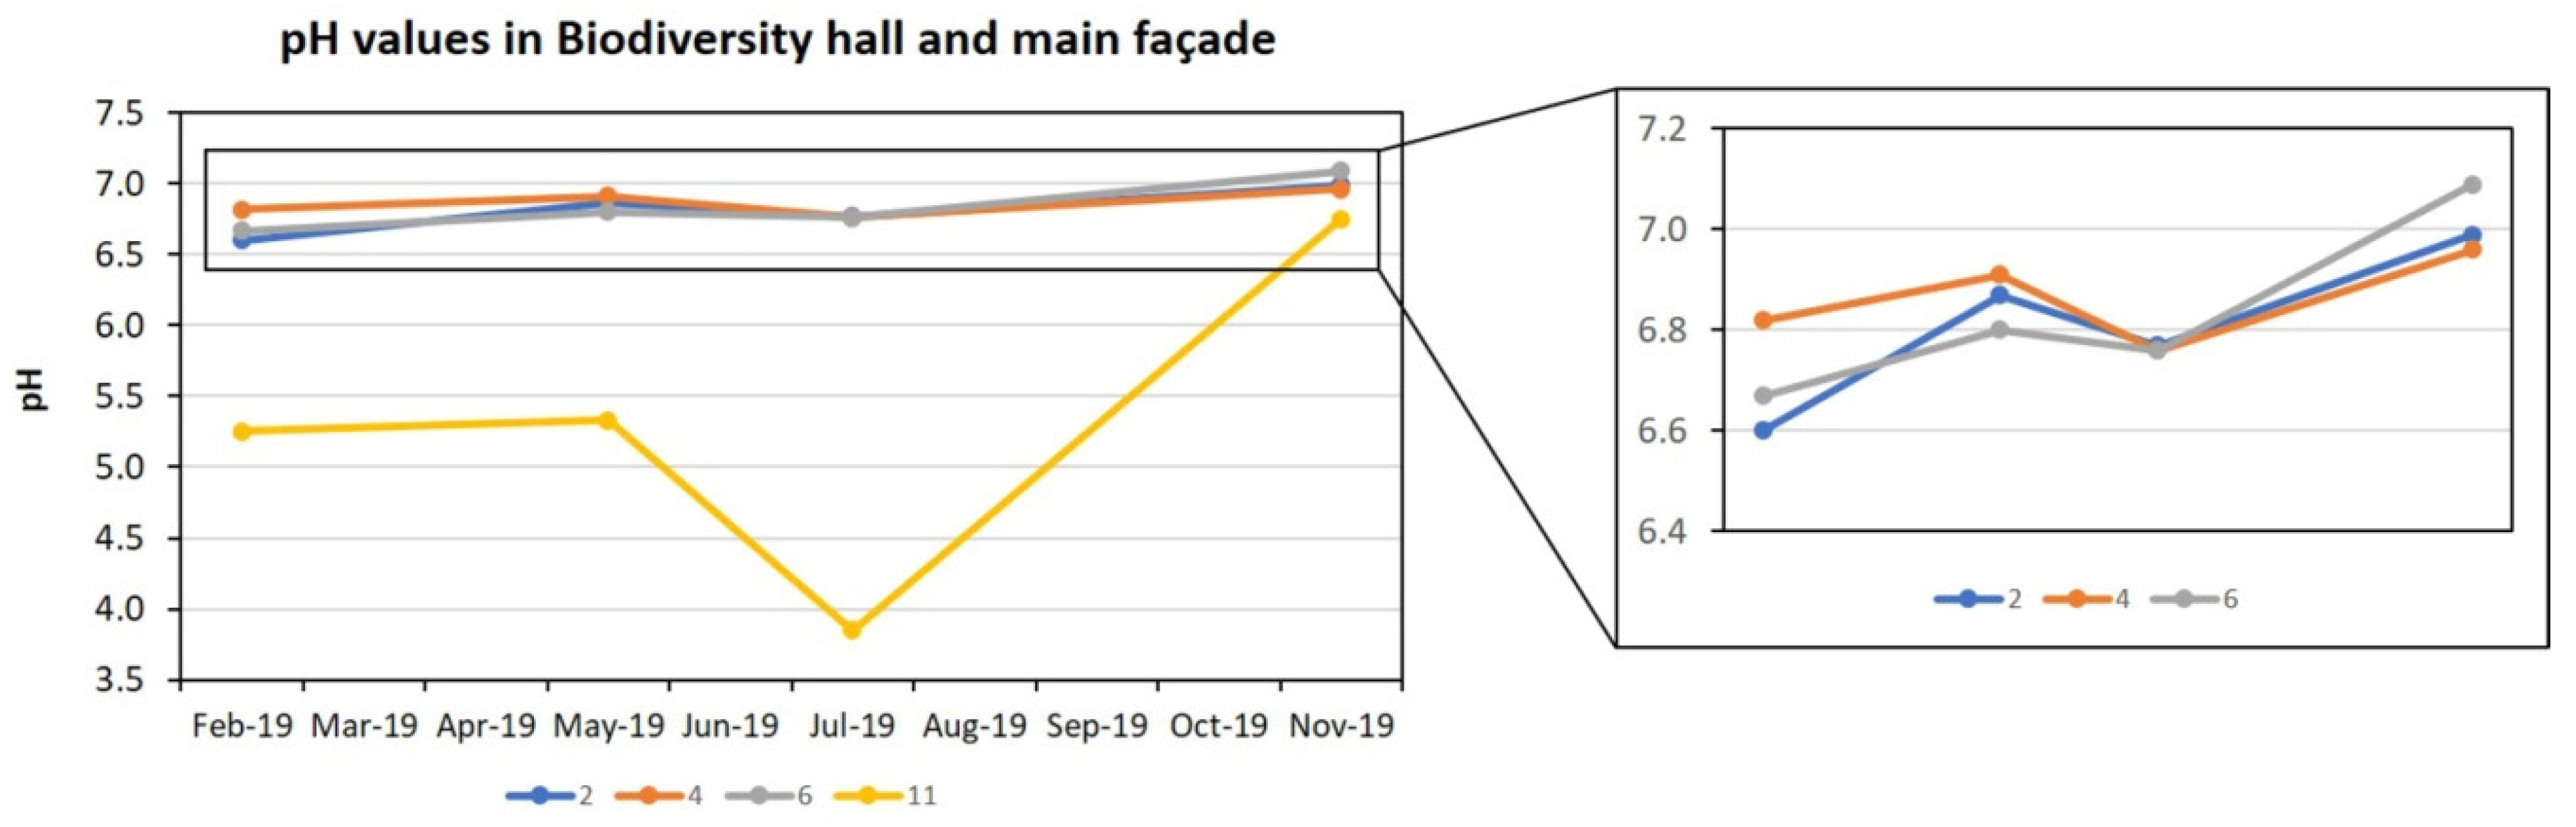
Although pH average values recorded in both main and rear façades of the MNCN are strongly acidic, pH values corresponding to the main façade are lower due to its direct exposure to road traffic, while the rear façade is oriented to the opposite direction towards a backyard. Influence of outdoor environmental conditions on indoor pH can be analyzed from the data of
Table 3 (sensors number 2a, 4, 6a and 11) and
Figure 9.
The same behavior pattern can be observed both indoors and outdoors, which means that the slightly acidic pH recorded in the Biodiversity hall is due to the influence of the nearby polluted urban environment. The fact that indoor pH is noticeably less acidic than outdoor pH is explained by the effect of the building as an absorbing surface for gaseous pollutants (e.g., porous materials: masonry, bricks, painted walls, tiles, etc.).
According to the present environmental evaluation results, the main entrance of the MNCN, including the circulation path of visitors and staff, has been redesigned to mitigate, as far as possible, the urban pollution which are combined with moisture and then generate sulfuric and nitric acid effects on the Biodiversity hall. Likewise, the pandemic situation generated by COVID-19 required a new organization of the museum entrance and new security protocols. Main access to the MNCN is composed of three big doors of the same size in central, right and left positions. These doors are directly connected to the Zoology area in which biodiversity exhibitions are located, where environmental pH measures indicated some acidic values. To minimize the direct entrance of outdoor air in this area (probably polluted), the visitor circulation was changed in such a way that the entrance was restricted to one of the side doors and the exit was restricted to the other, while the central one remained closed. Nowadays, this central door is reserved and only opened in case of exceptional events and emergency situations. From 5 June 2020, the museum reopened after the general confinement due to the country alarm situation. Since that date, the remodeled access will contribute to the preservation of a clean and safe environment for both natural items and human beings. Likewise, some other preventive actions concerning natural items in showcases were adopted, which include substances that absorb pollutants [
34,
35]; even more preventive measures are now under discussion and are being validated by interdisciplinary points of view, taking into account visitors and staff health and optimal conservation of natural and cultural items of collections and exhibitions.
Further pH measurements in the MNCN, to check the influence of mitigation measures carried out, are the subject of an ongoing research, and results will be published elsewhere.
5. Conclusions
Field research undertaken with sol-gel pH sensors in exhibition spaces of the MNCN and the corresponding outdoor locations has pointed out a very acidic pH near the building’s façades, especially in the main one oriented near a heavily trafficked avenue, which directly affects pH values recorded indoors in the adjacent hall. Climate and meteorological seasons influence pH values recorded. Acidity recorded during long dry seasons is stronger than that during rainy seasons, which are scarce in Madrid. This fact is related to the dry acid deposition phenomenon.
Comparison of pH average values of the main hall close to the MNCN entrance and pH values recorded in other smaller halls far from the main entrance indicates that uncontrolled ventilation promotes a more acidic environment. In showcases, pH average values vary from slightly acidic to moderately acidic, and are mainly due to natural goods exhibited and/or the kind of materials with which showcases were made.
Bearing in mind the former results, some recommendations could be stated. In exhibition halls located far from the main entrance, no special preventive conservation actions should be adopted. However, in the main Biodiversity hall, some preventive measures could be considered, such as those oriented to diminish the entrance of urban polluted air, especially during the long dry seasons, e.g., control of the main door opening, installation of some physical–chemical barrier in the entrance area by means of panels, etc. The slightly acidic pH detected inside showcases could be neutralized by periodic ventilation or tightness release, or by introducing absorbing substances to neutralize volatile organic compounds, e.g., active carbon.
Among other preventive measures, the main entrance to the MNCN through the façade big door has now been protected and changed to a lateral entrance that deadens urban pollution impact. Further research will include evaluation of air acidity in this MNCN area to re-check environmental conditions.


 and
and 


