Article

Building Tree Allometry Relationships Based on TLS Point Clouds and Machine Learning Regression

by
Fernando J. Aguilar
1,*,
Abderrahim Nemmaoui
1,
Manuel A. Aguilar
1 and
Alberto Peñalver
2
1
Department of Engineering and Research Centre CIAIMBITAL, University of Almería, Carretera de Sacramento s/n, La Cañada de San Urbano, 04120 Almería, Spain
2
Faculty of Technical Education for Development, Santiago de Guayaquil Catholic University, Av. Carlos Julio Arosamena, Guayaquil 090615, Ecuador
*
Author to whom correspondence should be addressed.
Submission received: 26 September 2021 / Revised: 24 October 2021 / Accepted: 27 October 2021 / Published: 29 October 2021
(This article belongs to the Special Issue New Trends in Design Engineering II)

Abstract

:
Most of the allometric models used to estimate tree aboveground biomass rely on tree diameter at breast height (DBH). However, it is difficult to measure DBH from airborne remote sensors, and is common to draw upon traditional least squares linear regression models to relate DBH with dendrometric variables measured from airborne sensors, such as tree height (H) and crown diameter (CD). This study explores the usefulness of ensemble-type supervised machine learning regression algorithms, such as random forest regression (RFR), categorical boosting (CatBoost), gradient boosting (GBoost), or AdaBoost regression (AdaBoost), as an alternative to linear regression (LR) for modelling the allometric relationships DBH = Φ(H) and DBH = Ψ(H, CD). The original dataset was made up of 2272 teak trees (Tectona grandis Linn. F.) belonging to three different plantations located in Ecuador. All teak trees were digitally reconstructed from terrestrial laser scanning point clouds. The results showed that allometric models involving both H and CD to estimate DBH performed better than those based solely on H. Furthermore, boosting machine learning regression algorithms (CatBoost and GBoost) outperformed RFR (bagging) and LR (traditional linear regression) models, both in terms of goodness-of-fit (R2) and stability (variations in training and testing samples).

1. Introduction

Forests contain 80% of the Earth’s biomass, accounting for 75% of the gross primary productivity of the terrestrial biosphere [1]. In this way, they are a major component of the global carbon cycle, representing up to 50% of the annual carbon flux between the atmosphere and the Earth’s land surface [2], thus contributing to atmospheric carbon fixing up to rates of about 30% of the fossil fuel emissions [3]. In other words, they are extremely important for our planet, and one of the reasons why forest modelling and monitoring are essential for the development of a sustainable bio-economy based on renewable resources [4]. Atmospheric carbon fixation by forests has become one of the main strategies followed by the United Nations Framework Convention on Climate Change in the context of Reducing Emissions from Deforestation and Forest Degradation (REDD) to help mitigate greenhouse gas emissions, especially in the case of developing countries with abundant forest cover [5].
Despite the increasing need for forest monitoring, studies headed up to collect forest data at tree level have been limited to traditional methods based on field inventory and aerial photography interpretation. However, field inventories are labor-intensive, time-consuming, and limited by spatial accessibility, while traditional large-scale aerial photography does not directly provide accurate 3D forest information [6].
Remote Sensing (RS) technology can help to solve the aforementioned drawback as we have witnessed an exponential increase in RS datasets derived from different sources (satellites, aircrafts, and UAV [Unmanned Aerial Vehicle]) at different resolutions based on different sensors (hyperspectral and multispectral cameras, LiDAR and SAR sensors, etc.) during the last decade. This has been accompanied by the fast development of computer-based processing techniques such as Structure from Motion stereo-photogrammetry to reconstruct 3D point clouds from low-cost UAV imagery [7,8]. In fact, RS can be considered an exceptional source of data and powerful tools for monitoring forest dynamics at different spatial and temporal resolutions [9,10]. For instance, and focusing on the tools applied in this study, terrestrial laser scanning (TLS) has proved to be an efficient and non-destructive measurement method that is becoming a new paradigm for implementing a tree-centric approach to deal with 3D forest modelling at plot scale [11,12,13,14].
At the same time, parallel developments in Information Technology (IT) allow for the storage of very large datasets and their efficient processing. It has driven the development of many libraries and packages that implement supervised machine learning algorithms to investigate phenomena by automatically creating regression (and classification) models from labeled datasets in a very efficient way. It makes it possible to use machine learning methods in datasets derived from RS with the aim of increasing the level of automaticity in the extraction of valuable information [15,16].
Current allometric models to estimate forest dry above-ground biomass (AGB) rely on stem diameter (diameter at breast height, DBH) and tree height (H) as key inputs [17,18]. However, it is impossible to measure DBH from airborne or spaceborne sensors which, on the other hand, turn out to be the most suitable RS technologies for carrying out large-scale forest inventories [10]. In this regard, the classical linear regression techniques, after applying a logarithmic transformation to linearize the allometric model in a potential form that is usually the most used, are commonly applied to model allometric relationships between DBH (dependent variable) and predictor variables (H and crown diameter [CD]/crown area [CA]) [14,18,19]. It is important to highlight that linear models have the advantage that they are easy to fit, while generally offering adequate accuracy for tree allometric modeling [20].
Considering the above-mentioned background, this study uses TLS data collected at tree level in three teak plantations located in the Coastal Region of Ecuador (tropical dry forest) to compare the performance of several supervised machine learning regression methods with respect to traditional linear regression for modeling the local allometric relationships between DBH and H and CD. The underlying hypothesis is that learning-based models could outperform the results provided by traditional linear regression in the case of highly non-linear relationships found in tree allometry. These locally calibrated machine learning based models could be used to improve forest AGB and carbon estimation, especially in large-scale inventories where only H and CD can be estimated from airborne or spaceborne sensors.

2. Materials and Methods
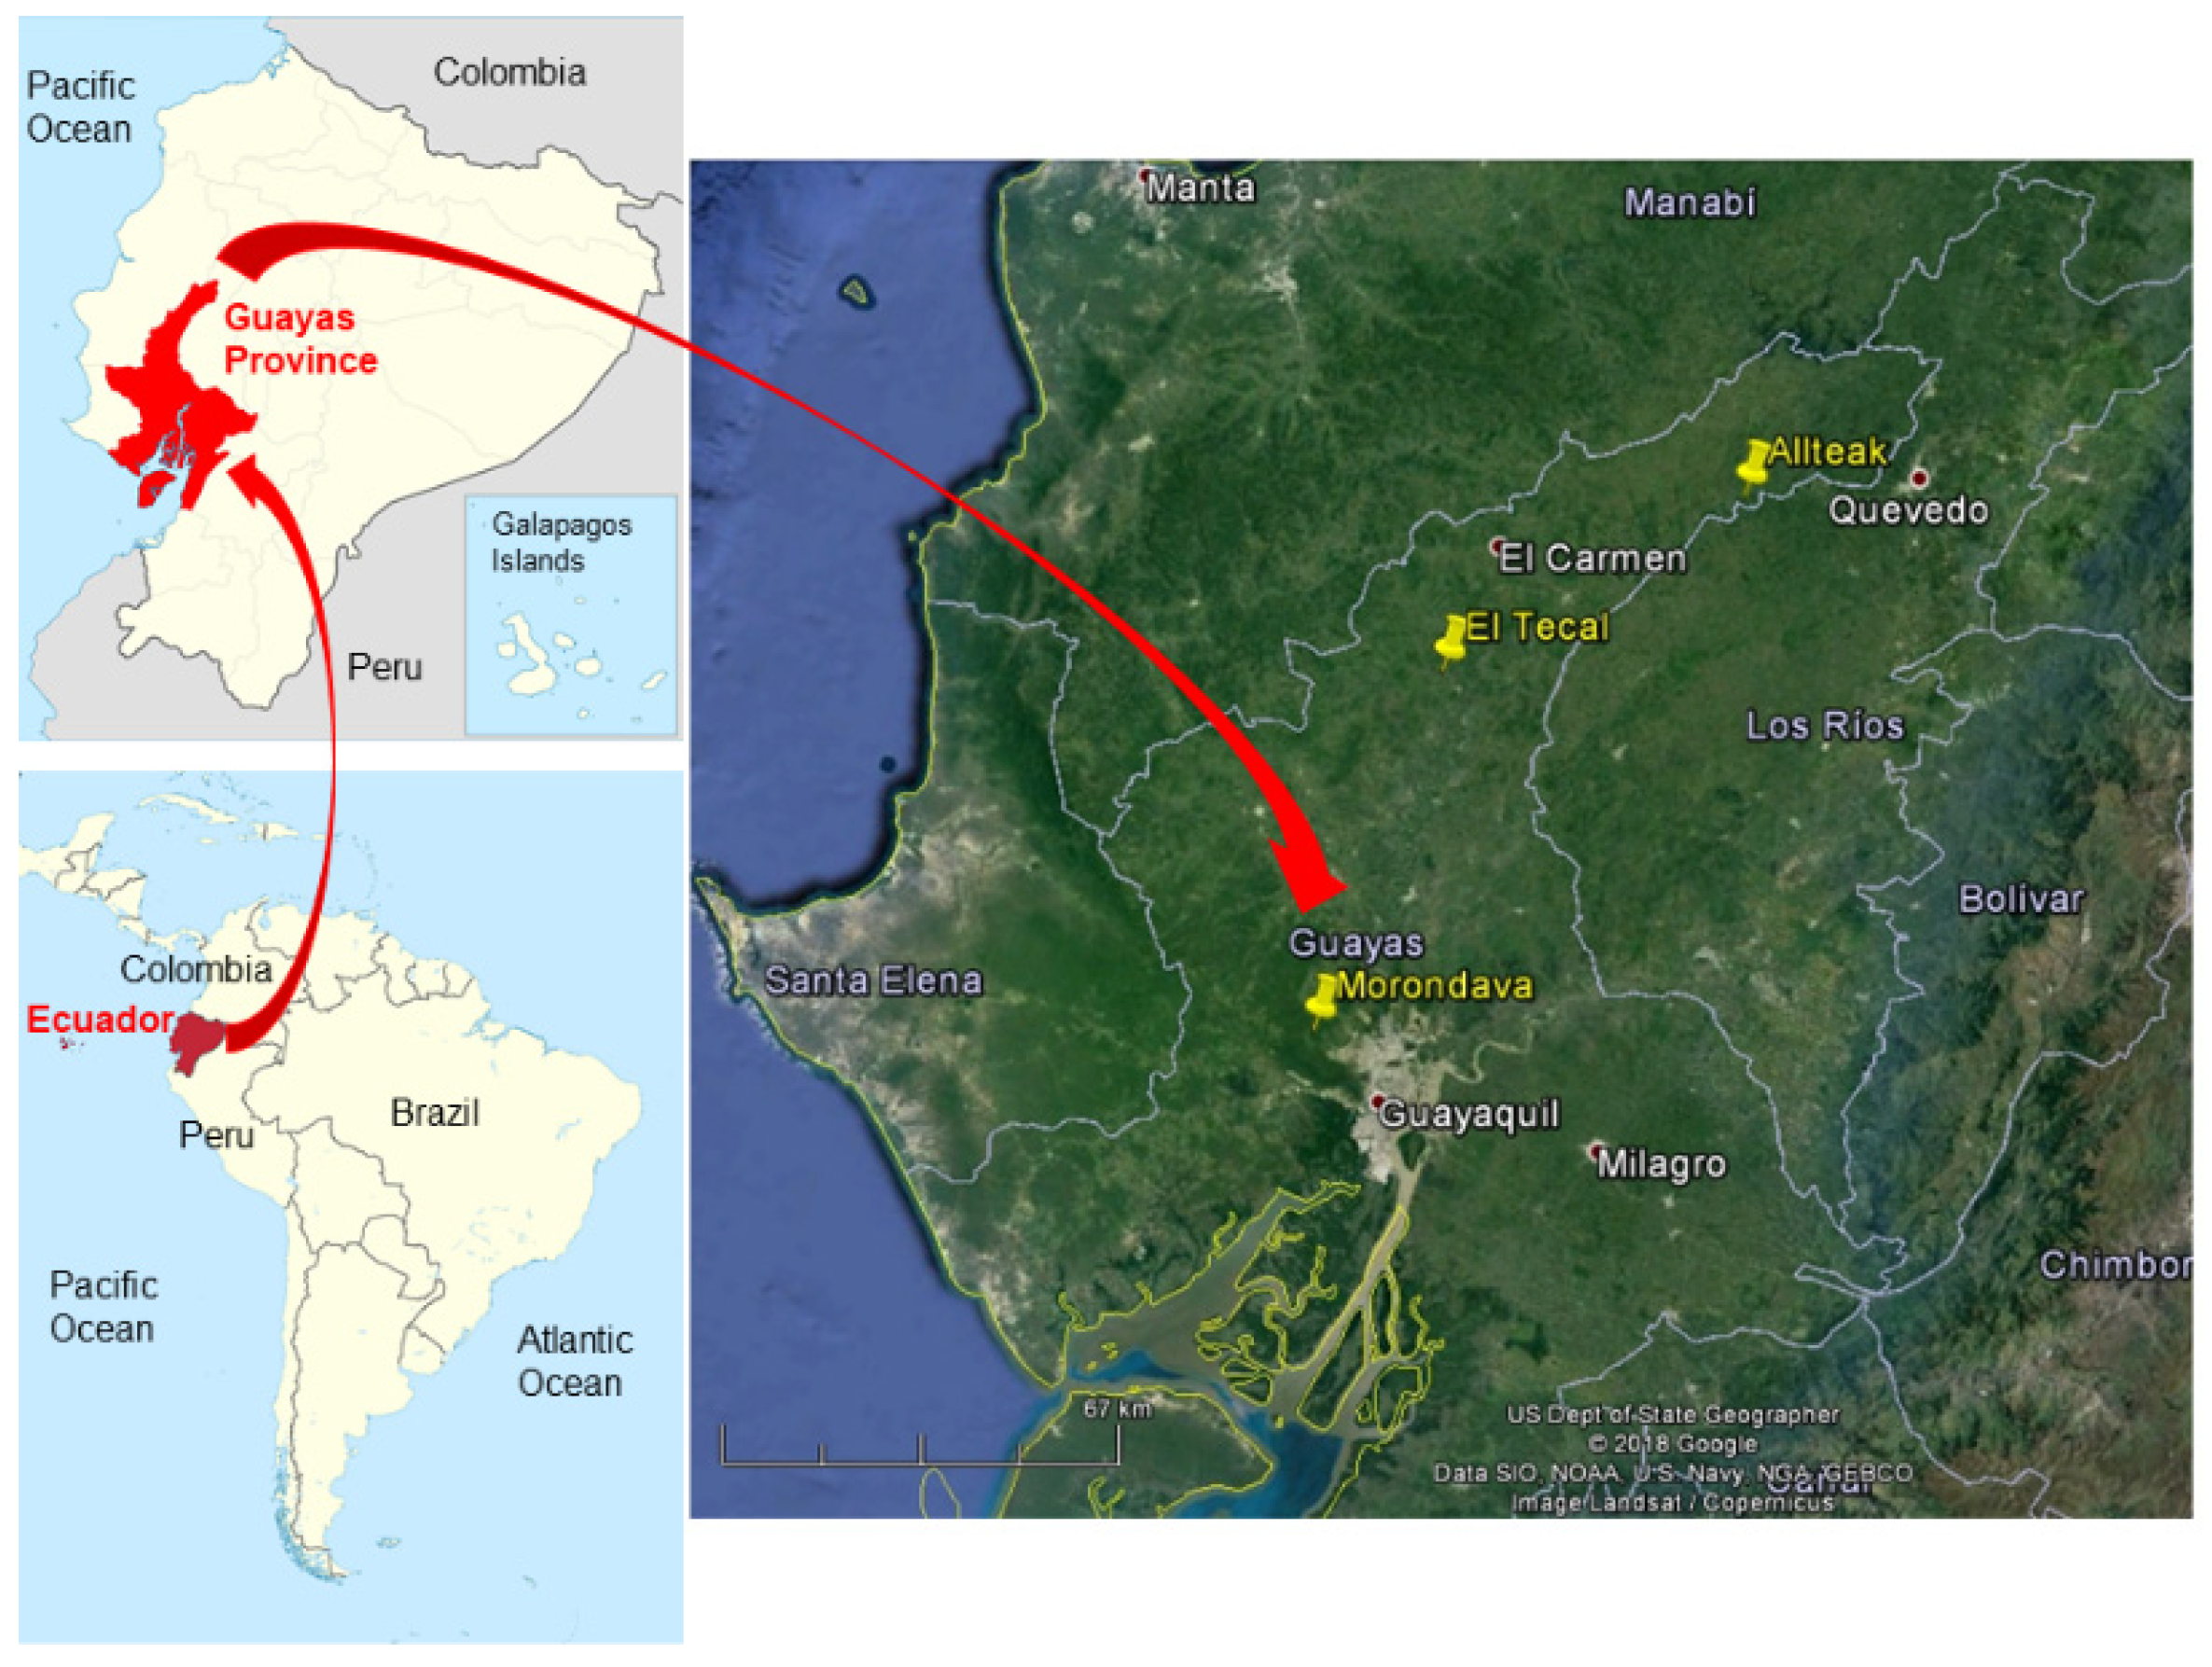
2.1. Study Area

The population under study was constituted of three teak plantations (Tectona grandis Linn. F.) located in the Province of Guayas, Coastal Region of Ecuador (Figure 1). The plantations selected as research areas were located on the following properties:
  • Morondava. With an area of 78.28 ha and teak trees between 2 and 3 years old at the time of the inventory. Geographic coordinates: latitude 2°6′11.72″ S and longitude 80°2′59.43″ W.
  • El Tecal. With an area of 21.12 ha and a homogeneous age of 17 years at the time of the inventory. Geographic coordinates: latitude 1°31′53.07″ S and longitude 80°20′30.51″ W.
  • Allteak. With an area of 57.22 ha and variable ages of 4, 10, and 12 years at the time of the inventory. Geographic coordinates: latitude 1°8′7.23″ S and longitude 79°41′58.08″ W.
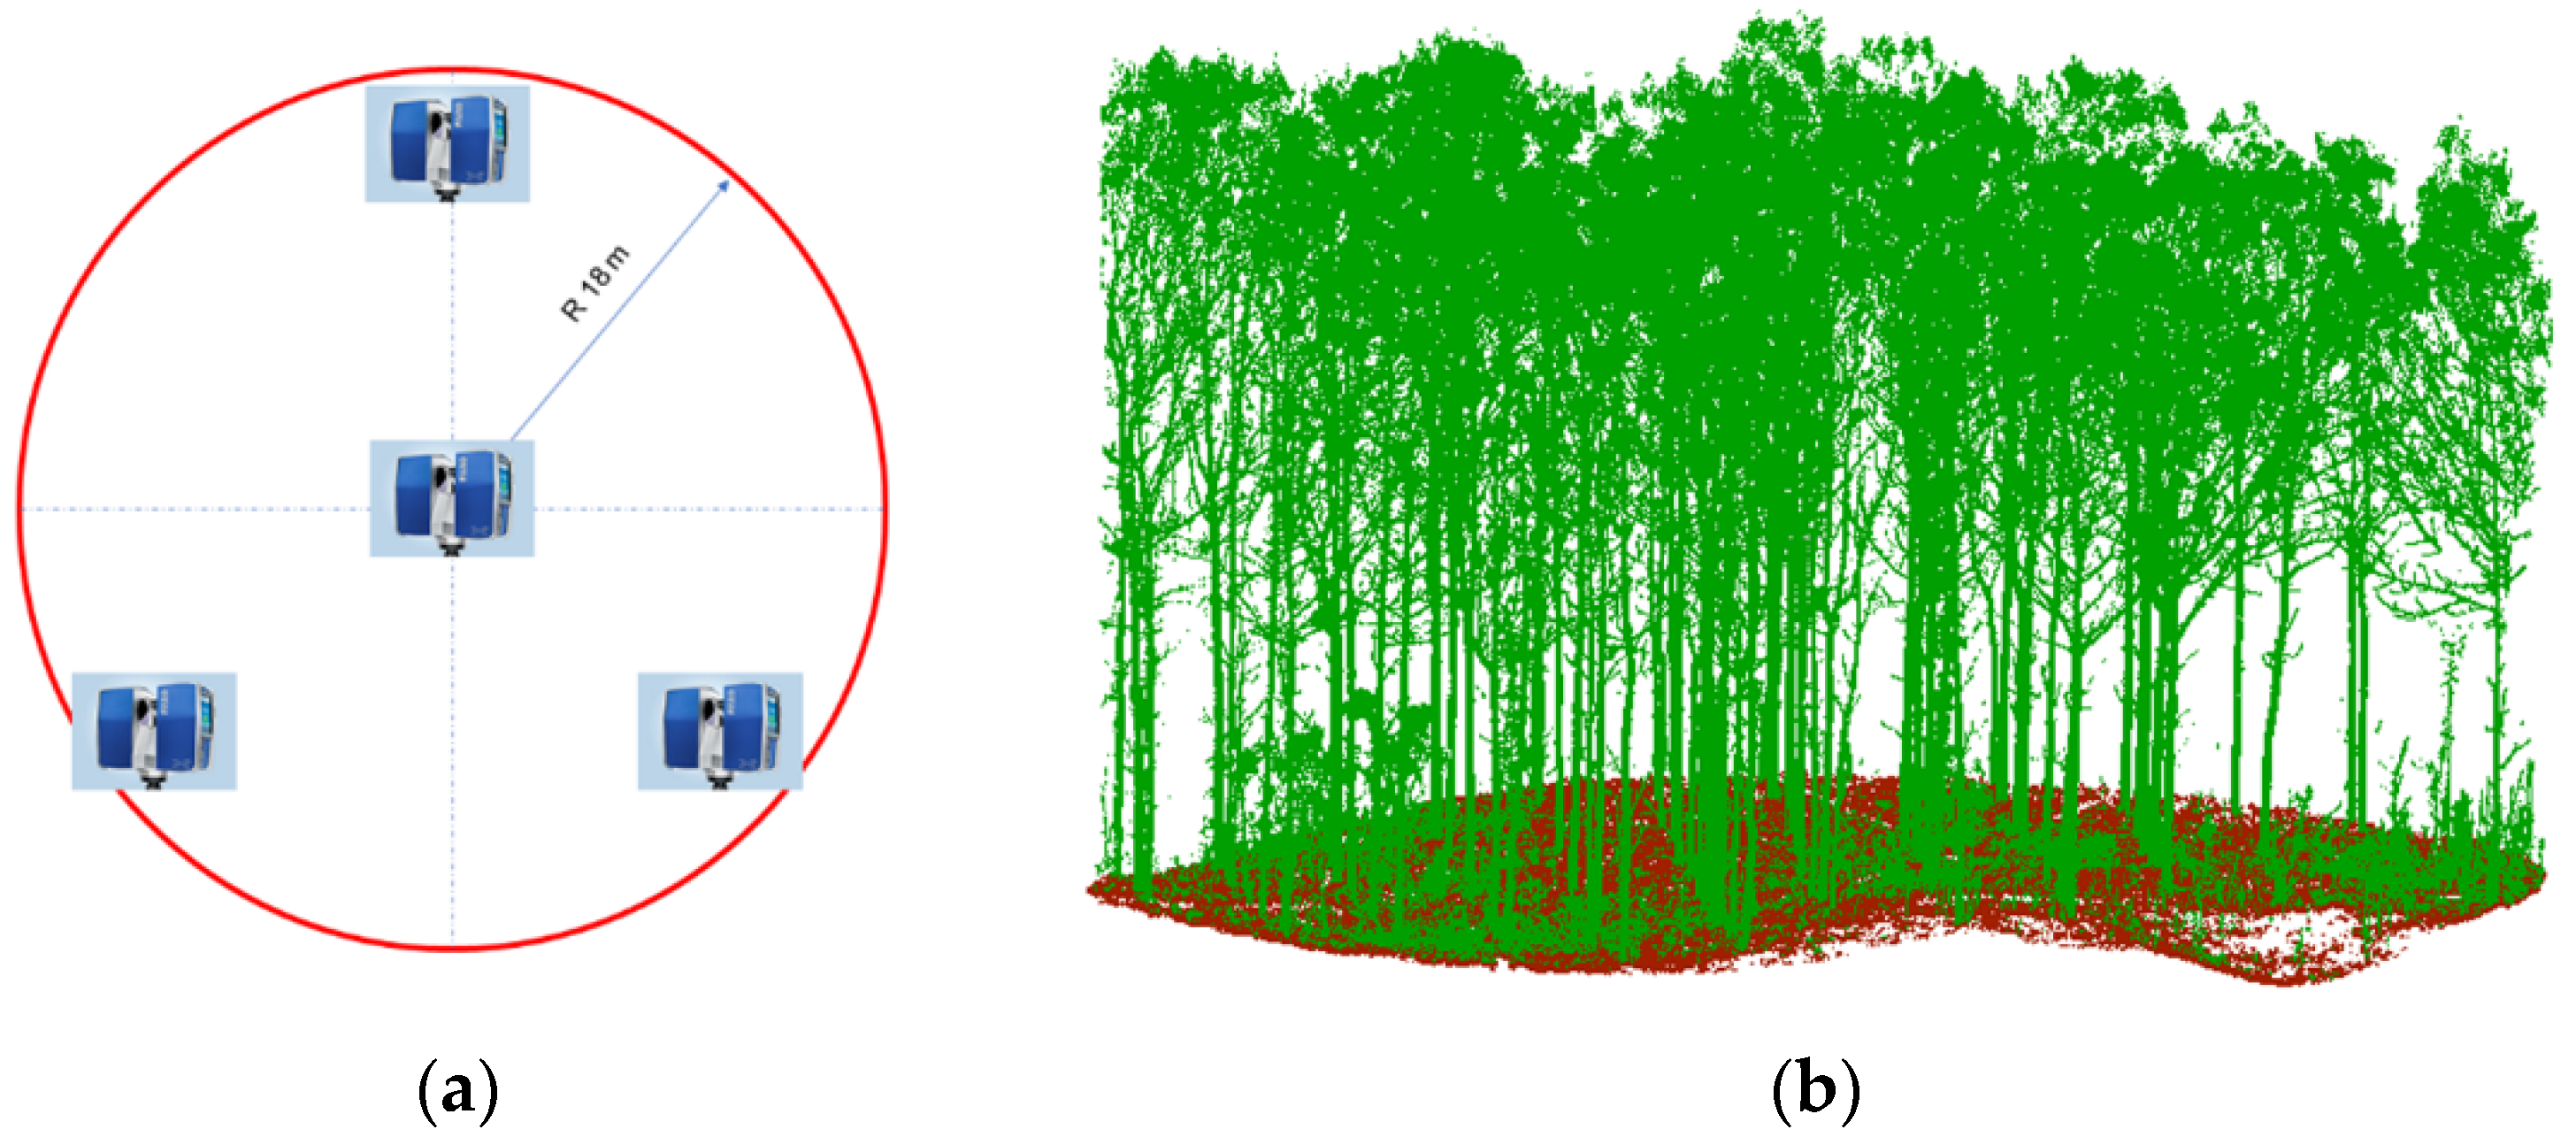
The 156.62 ha of teak plantations in this study is representative of the ecological characteristics of the tropical dry forest and the tropical semi-humid forest [21]. The precipitation regime in the study areas is characterized by being unimodal, with a rainy period in the first quarter of the year and a marked drought during the rest of the year. Average annual precipitation ranges between 600 mm and 1600 mm (from south to north), with an average annual temperature of about 25 °C, and a relative humidity between 80 and 90%.
A total of 58 circular (18 m radius) reference plots were established in the three teak plantations (30 in Morandava, 8 in El Tecal, and 20 in Allteak) to conduct a field inventory based on TLS in November 2018. A full description of the main characteristics of the reference plots can be found in [8].

2.2. Field Data

A TLS field campaign was conducted in November 2018 over the aforementioned 58 reference plots. Note that the phenological stage of teak at this time in the Coastal region of Ecuador can be qualified as leaf-off conditions.
The TLS used in the field study was the FARO Focus 3D X330 (FARO Technologies Inc., Lake Mary, FL, USA). This TLS captures nearly a million points per second with millimeter precision and with a range of about 330 m, along with high-resolution RGB images. Pre-tests were carried out to define the optimal parameters in terms of quality and exploration time [14]. Panoramic RGB images were taken to colorize the 3D point cloud and serve as a high-quality visual reference for post-processing tasks. All sensors incorporated in the scanner (i.e., GPS, inclinometer, compass, and altimeter) were activated.
Four scans were performed on each reference plot, including a central scan and three scans located around it in order to draw, approximately, an equilateral triangle (Figure 2a). The four scans were later co-registered and merged into the same spatial reference system using nine reference white spheres, with a size of 15 cm in diameter, which Scene™ software 7.1 (FARO Technologies Inc., Lake Mary, FL, USA) was able to automatically detect in the point cloud. These spheres were placed with the help of iron rods to ensure that at least three spheres were visible from every two consecutive scans. Note that multi-scan data are usually more accurate to measure stem diameter and tree height than single scans [22].
The processed TLS point clouds were clipped with a circular shape of 18 m radius. Next, bare earth points were classified by applying the octree search method implemented in the open-source software 3D Forest [23] (Figure 2b). A 20 cm grid spacing DTM was built from ground points to proceed with the calculation of the normalized heights of each TLS point. In addition, each tree in the plot was automatically segmented by using the point clusters method implemented in the software 3D Forest [23]. It should be noted that additional manual editing was also carried out to remove some errors observed in the automatic segmentation of each tree.
Finally, 3791 teak trees were extracted from the 58 reference plots. Those teak trees with DBH < 5 cm and/or CD < 1 m (underdeveloped trees) were removed from the original dataset. Thus, 2272 trees remained as the final dataset to develop the regression models (DBH = Φ(h) and DBH = Ψ(h, CD)) tested in this study.
A MATLAB code was developed for the automatic extraction of the dendrometic variables DBH and H [14] from the point clouds corresponding to segmented trees, while CD was manually measured for each tree in the digital environment provided by Fusion/LDV software [24]. A complete description about the methods followed in order to obtain the dataset used in this study can be found in [14].

2.3. Allometric Models
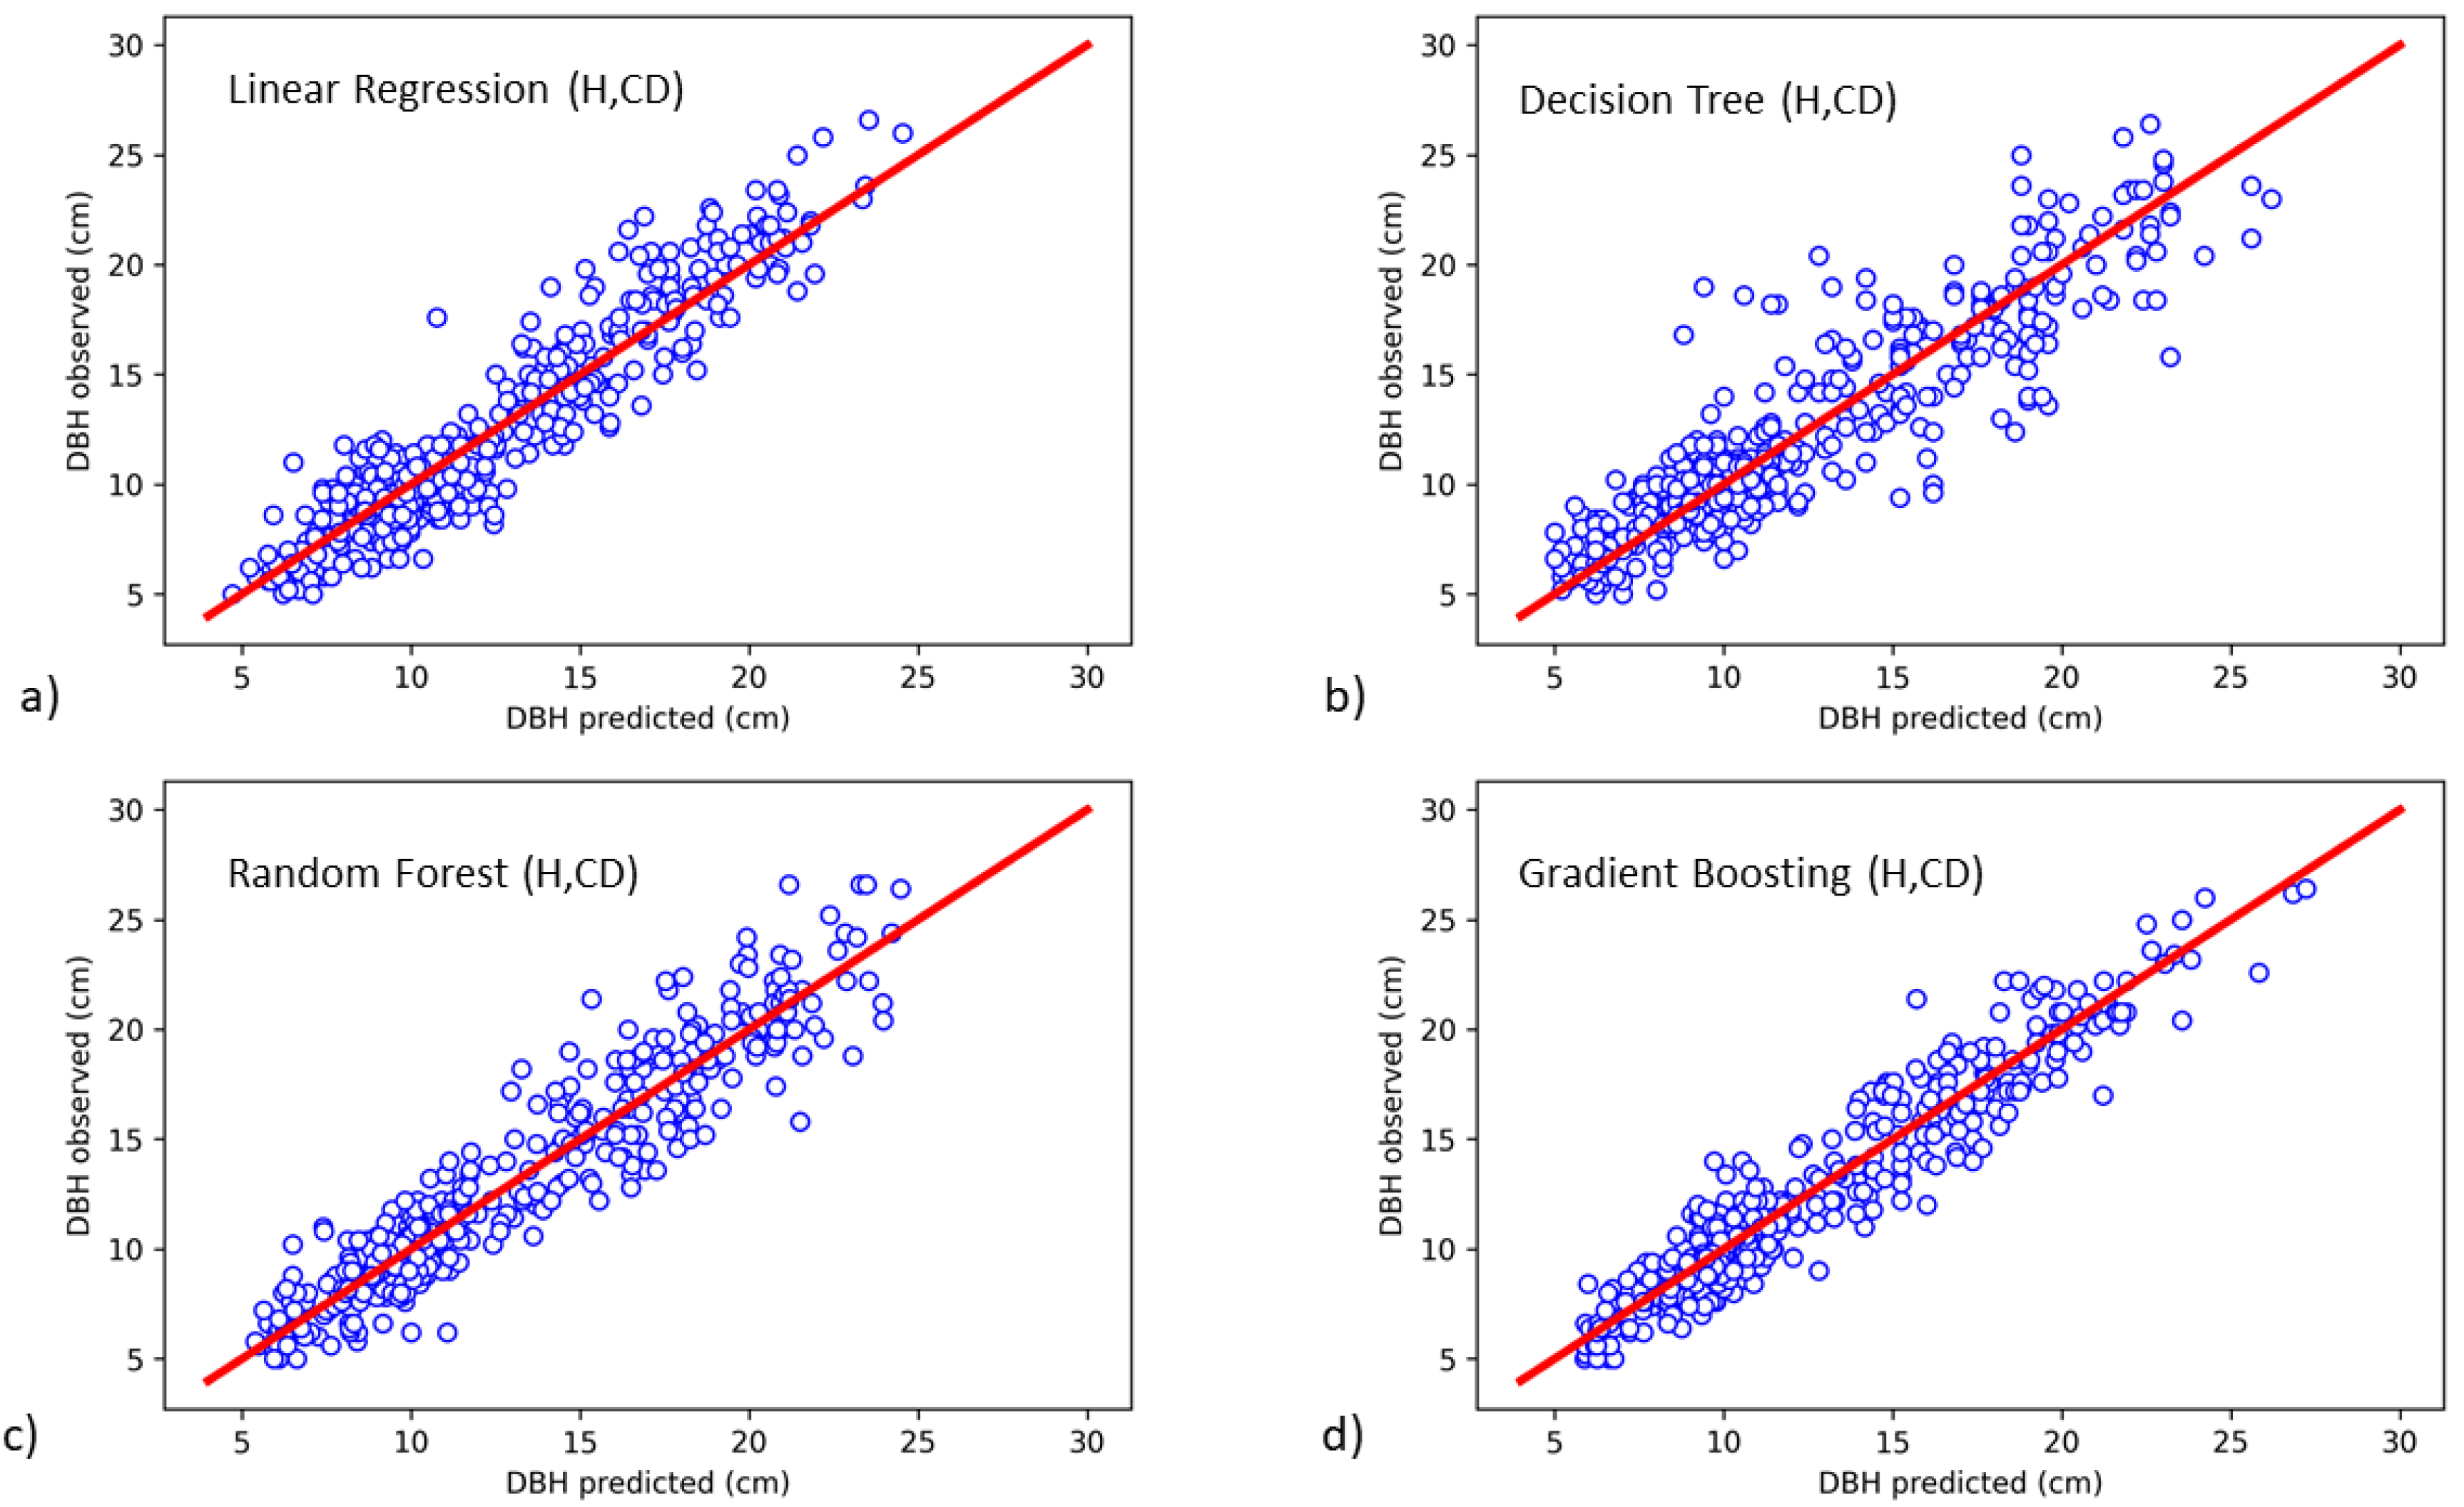
Six allometric models were tested to fit the DBH estimation from H and H + CD predictor variables; one based on traditional linear regression and the remaining five focused on supervised machine learning algorithms. An individual-based modelling approach was used by considering each individual tree measurement as an instance of the complex relationships modelled
The linear regression model used in this study was based on the widely known potential form (e.g., [14,18]). After taking logarithms to linearize the potential expression, we obtained the following equations:
DBH = e ( α + β ln ( H ) ) e ε = e ( α + β ln ( H ) ) e σ 2 2 ,
DBH = e ( α + β ln ( H . CD ) ) e ε = e ( α + β ln ( H . CD ) ) e σ 2 2 ,
where DBH is given in centimeters, and H and CD in meters. α and β are model coefficients, and ε is an error term. If it is considered that the error term is normally distributed with zero mean and standard deviation σ, the mean of eε could be approximated by e σ 2 2 [17]. This additional term would function as a correction factor applied to back transform the predicted values and remove bias from the logarithmically transformed data.
Regarding supervised machine learning methods, this study has focused on testing tree-based regression learners such as individual tree-based models (Decision Tree Regression, DTR) and some derive ensemble algorithms grouped in bagging techniques (Random Forest Regression, RFR) and boosting techniques (AdaBoost Regression, AdaBoost; Gradient Boosting Regression, GBoost; and Categorical Boosting Regression, CatBoost). The optimal combination of hyperparameters for each machine learning model was computed by applying a grid search with cross-validation method [25].
The validation of the tested allometric models was based on the widely accepted true validation method. This method states that the data used to train the model can never be used for validation. In this sense, the testing set for validation consisted of 20% of the 2272 available trees, leaving the remaining 80% as a set for training and computing the regression model. This procedure was repeated 100 times, splitting the original data between the training and the testing sets by using random sampling. It allowed studying the stability of the tested regression models against changes in the training samples.
Some error indicators related to the systematic and random error of the DBH values predicted by the regression models were calculated according to the following expressions:
Bias   ( % ) = 100 N i = 1 N ( DBHp i DBHo i DBHo i ) ,  
RMSE   ( cm ) = i = 1 N ( DBHp i DBHo i ) 2 N ,
RMSE relative   ( % ) = 100 RMSE DBH ¯ o   ,
where DBHp and DBHo corresponds to DBH values predicted and observed, respectively. N and DBH ¯ o are the number of teak trees in the testing dataset and the mean value of DBH observed values for the teak trees, respectively. Note that the Bias indicator constitutes a measure of the systematic error or bias of the model, while RMSE (root-mean-square error) is a quantitative indicator of its random error. RMSErelative represents a percentage measure of the random error with respect to the mean of the observed values.
The entire procedure mentioned above was coded in Python 3.8 with the support of the scikit-learn and catboost libraries.

3. Results

Table 1 shows the statistics of goodness-of-fit (R2) for the six tested allometric models in the case of only including H as explanatory variable for estimating DBH. Specifically, it represents the mean value, the standard deviation, and the range of R2 for the 100 repetitions performed, pointing out that individual tree-based models like DTR performed significantly worse (p < 0.05) than linear regression or ensemble machine learning regression algorithms. In fact, small changes in the learning sample can cause dramatic changes in the built tree derived from individual tree-based models, and so the estimated results can be unstable and inaccurate. This is the reason why most recent studies have adopted bagging and boosting ensemble algorithms [25,26].
Traditional linear regression turned out to be very competitive, providing results statistically similar to those yielded by sophisticated ensemble boosting algorithms, while, surprisingly, RFR worked significantly worse than boosting or linear regression methods, showing a high variability in prediction when varying training samples. It is important to note that ensemble learning is a branch of machine learning that builds and combines multiple learners to improve the outcomes of the learning process. In the case of bagging methods, such as RFR, they apply bootstrap samples randomly generated from the original dataset to train tree models and then aggregate the ensembles to obtain final predictions by majority voting. In this sense, the RFR algorithm usually improves predictions by decreasing the variance and avoiding overfitting, which is more recommended when developing models that include several explanatory variables (multivariate models).
The statistics of goodness-of-fit corresponding to the multivariate allometric models, in which DBH depends on H and CD, are shown in Table 2. First, it should be noted that the prediction results were clearly better than those provided by the bivariate allometric models presented in Table 1, especially in the case of machine learning methods. Except linear regression, they also showed lower variability in R2 when varying training samples, which points to a greater stability of the machine learning models tested in the case of multivariate regression than in the bivariate.
Quite the opposite occurred with traditional linear regression, where the inclusion of the CD variable slightly improved the mean value of R2, but also increased its standard deviation. This result indicates that machine learning regression methods are able to identify complex relationships between covariates not found using conventional regression-based approaches. In this regard, GBoost has been rated as one of the most competitive methods for learning problems when it comes to noisy data and complex non-linear dependencies [27].
GBoost and CatBoost boosting regression algorithms performed significantly better (p < 0.05) than traditional linear regression and DTR, also showing high stability to the variation of training samples. These similar results between GBoost and CatBoost were expected as CatBoost is a member of the family of gradient boosting decision tree machine learning ensemble techniques.
AdaBoost and RFR were statistically situated between the very good results offered by GBoost and CatBoost and the good results offered by linear regression, providing predictions not significantly different from those provided by linear regression. In this way, boosting methods, such as GBoost, CatBoost, and AdaBoost, are qualified as sequential ensemble algorithms that converts weak learners to strong learners by paying the most attention to the samples with the highest prediction errors, so increasing their weights in the next iteration and improving prediction accuracy by decreasing bias [27].
The bias of the multivariate models tested in this study was very low, as can be qualitatively appreciated in Figure 3. Indeed, the multivariate DTR model provided bias values between −0.62% and 3.87% for the 100 repetitions, with a mean value of 1.31%. It means a very slight overestimation of the observed values of DBH. The rest of the models represented in Figure 3 also showed very low bias values, with mean values of 1.33%, 1.57% and 1.84% for RFR, GBoost and LR, respectively.
Regarding the random error of the multivariate regression models, the four models represented in Figure 3 yielded acceptable RMSE mean values for estimating DBH, which ranged from 2.02 cm (std = 0.10 cm), in the case of DTR, to 1.45 cm (std = 0.06 cm) in the case of GBoost. These values involved a mean relative RMSE of 16.56% and 11.95% for DTR and GBoost models, respectively. LR and RFR models provided an intermediate random error, with RMSE mean values of 1.62 cm (std = 0.07) and 1.57 cm (std = 0.06 cm), respectively, which means relative RMSE values of 12.85% for RFR and 13.34% in the case of LR.

4. Discussion

The main objective of this work is to model the allometric relationships—DBH = Φ(H) or DBH = Ψ(H, CD)—of teak trees located in the Coastal Region of Ecuador. Such models are important components for calibrating remote sensing products used to estimate natural forest stocks. In fact, AGB estimates at tree level could be obtained from airborne and spaceborne sensors by only extracting some key variables such as tree height and crown diameter. This remote sensing-oriented approach is gaining importance in recent years [18] because it enables large-scale mapping of AGB for forest management and monitoring [10,28] in the context of mitigating climate change (REDD monitoring programmes) [5,29]. It is worth noting that this is the exact opposite of what is common in traditional fieldwork based inventories, where DBH is usually easier and cheaper to measure than tree height, especially due to the difficulty of locating tree tops inside closed-canopy forests [30].
Most allometric models to estimate AGB at tree level are based on knowing the DBH value. This is the case of the generalized pantropical AGB model proposed by Chave et al. [17] given by the following equation:
AGB = 0 . 0673 ( ρ DBH 2 H ) 0.976 ,  
where AGB represents estimated aboveground biomass (kg), DBH is diameter at breast height (cm), H is tree height (m), and ρ is wood density (g cm−3). The same occurs with specific models developed for the estimation of AGB of teak trees such as those proposed by Lara [31] or Pérez and Kanninen [32] that also have DBH as an explanatory variable.
However, it is not possible to directly measure DBH from airborne or spaceborne sensors, a drawback that could be overcome if we counted on reasonably accurate allometric models to estimate DBH from variables that can be extracted from remote sensing techniques such as H and CD [4,19,33,34,35]. This requires accurate algorithms to extract the position and height of each tree within a study plot as well as methods aimed at automated tree crown delineation [15].
Machine learning methods have been widely applied to develop AGB prediction models from different remote sensing data sources such as optical satellite imagery, UAV stereo-imagery, airborne hyperspectral images, ALS (airborne laser scanning), and spaceborne SAR [15,16,25,26,36,37].
However, there are very few published works comparing the results offered by traditional linear least squares regression with those provided by machine learning methods in relation to modeling tree height-diameter allometry. Most of these studies test some formulation of artificial neural networks (ANN) [38,39,40] or even Deep Learning (DL) approaches [30,41], which generally showed greater precision than traditional linear regression methods.
For example, Chen et al. [40] successfully applied a new approach for using ANN machine learning to synthesize spatiotemporal tree measurement data collected in a boreal forest in central Canada to model DBH-H and DBH-H-age relationships for six dominant tree species. Ogana and Encarli [30] trained a complex DL algorithm with 100 neurons distributed into six, seven or nine hidden layers for predicting tree heights in a tropical rain forest of Nigeria. They found that DL approach outperformed the results provided by nonlinear least squares and nonlinear mixed-effects models. In the same way, Ercanli [41] reported that a DL model with 100 neurons and nine hidden layers was the best network model compared to ANN, nonlinear regression, and nonlinear mixed-effect models to predict the relationships between H and DBH in stands of even aged and pure Anatolian Crimean Pine.
Even fewer studies have addressed tree height and diameter allometry relative to machine learning methods other than ANN and DL. In this sense, Filho et al. [42] tested four machine learning algorithms (k-nearest neighbors, RFR, support vector regression [SVR], and ANN) for modeling the height–diameter relationship of Pinus taeda L. stands at different ages, comparing the results to those obtained by linear regression models. They reported that the machine learning models showed statistical indicators similar to the linear regression models when only H was included as an explanatory variable, which fully agrees with the results obtained in this work. They did not test including CD as an additional explanatory variable. In the same research line, Tavares Júnior et al. [43] evaluated the accuracy of predictions of annual periodic increment in diameter of individual trees in the Atlantic Forest using three machine learning techniques (ANN, SVR, and RFR), finding that ANN was the technique that presented the highest efficiency to predict the diameter increment of trees.
In a recent work published by the authors, a traditional regression univariate model based on robust least squares fitting was proposed to express DBH as a function of H [14]. In this case, the inclusion of CD as an additional explanatory variable (multivariate model) did not significantly improve the accuracy of the predicted DBH values. In this way, the present work represents a step forward, aiming at testing the potential of machine learning regression models as an alternative to traditional linear regression methods to fit highly nonlinear allometric relationships in teak trees. Indeed, our study has demonstrated that allometric models involving both H and CD to estimate DBH performed better than those based solely on H. In addition, easy-to-apply boosting machine learning regression methods such as GBoost or CatBoost outperformed LR models (traditional linear regression) both in terms of goodness-of-fit (R2) and stability (variations in training and testing samples).
When quantitatively comparing multivariate GBoost, one of the best machine learning methods tested in this work, and multivariate LR, both showed a low systematic error, slightly overestimating the observed values of DBH with a mean bias of 1.57% (ranging from 0.05% to 3.35%) and 1.84% (ranging from −0.04% to 3.65%), respectively. Multivariate GBoost and LR also provided reasonably low values of random error, predicting the observed values of DBH with mean RMSE figures of 1.45 cm (RMSErelative = 11.95%) and 1.62 cm (RMSErelative = 13.34%), respectively.
In any case, the techniques used in this work should be adapted in order to be applied to other forest areas and species, since the height–diameter models not only depend on the species, but also on the characteristics of the stand and edaphoclimatic factors. In this regard, the authors of this study are currently testing machine learning regression algorithms to model tree allometric relationships in Mediterranean forest species such as Aleppo pine (Pinus halepensis Mill.).
It is worth underlining that the TLS-based method applied in this study to extract some dendrometric variables at tree level could be applied even to natural forests with mixed species. However, the two following drawbacks should be considered. First, the total height of the trees could probably be underestimated depending on the density and 3D structure of the forest stand, the phenological conditions, and the design of the TLS scan positions [44]. Note that the main reason of the underestimation of tree height by TLS is that the top of the tree crown is occluded by itself or a neighboring tree [45]. This issue can be partially solved by performing TLS fieldwork in leaf-off conditions [14], although it only works on deciduous tree species. Second, dealing with mixed species poses an additional requirement, such as prior classification of individual trees by species to obtain single-species allometric relationships, which are often much more accurate than those for multiple species. The need to do so will depend on the objective of the study and the precision required. Focusing on dendrometric variables extracted from TLS data over monoculture deciduous plantations (teak plantations in this case), it has been found that the results obtained can be qualified as very similar to those provided by traditional field techniques [46].
As it was discussed above, it would be difficult to guarantee the precision required in estimating the total tree height using TLS data in the case of very dense evergreen forests, being more appropriate to use point clouds derived from above-canopy flights of airborne or UAV-mounted sensors (e.g., digital aerial photogrammetry or LiDAR sensor) [7,47]. However, it should be noted that top-down approaches based on above-canopy flights can be a very useful way to obtain the total height of dominant trees, but are not effective for detecting small trees below the canopy or estimating DBH in evergreen dense forests [48].
Finally, it is necessary to clarify that the dendrometric data used in this study could have been properly collected by means of traditional field techniques instead of being extracted from TLS data. However, prior research has demonstrated that high-resolution/high-accuracy point clouds acquired by TLS are valuable for deriving not only georeferenced DBH, total tree height, and crown diameter measurements at stand level, but also an automatically computed 3D description of tree architecture [49]. This detailed 3D tree description is very valuable for estimating, for example, the commercial/total stem volume of a tree or even its stem taper curve [14,50,51].

5. Conclusions

In this study, we tested several supervised machine learning algorithms to model height–diameter allometry in teak plantations. The results obtained were compared with those provided by traditional linear regression, checking both bivariate models—DBH = Φ(H)—and multivariate models—DBH = Ψ(H, CD). In this way, the allometric models that involved both H and CD to estimate DBH performed better than those based solely on H. Furthermore, boosting machine learning regression algorithms (CatBoost and GBoost) significantly outperformed (p < 0.05) individual tree-based model (DTR) and traditional linear regression model (LR), both in terms of goodness-of-fit (R2) and stability of regression models against changes in training samples. Random forest regression (ensemble bagging based algorithm) was statistically situated between the very good results offered by GBoost and CatBoost and the good results offered by linear regression, not achieving a significant improvement on the predictions provided by LR.
The results obtained in this work demonstrate the great potential of supervised machine learning regression methods to model complex nonlinear allometric relationships between DBH and two variables, such as tree height and crown diameter, which can be remotely sensed from spaceborne or airborne sensors. Without a doubt, it is a great step to facilitate the swift upscaling of plot-based field forest inventories to the immediate geographic area by applying remote sensing methods.

Author Contributions

Conceptualization, F.J.A. and M.A.A.; methodology, F.J.A. and A.N.; software, F.J.A. and A.N.; validation, A.N.; formal analysis, F.J.A., A.N., M.A.A. and A.P.; investigation, F.J.A., A.N., M.A.A. and A.P.; resources, F.J.A. and A.P.; data curation, A.N.; writing—original draft preparation, F.J.A.; writing—review and editing, F.J.A., A.N., M.A.A. and A.P.; visualization, F.J.A. and A.N.; supervision, F.J.A. and A.P.; project administration, F.J.A. and A.P.; funding acquisition, F.J.A. and A.P. All authors have read and agreed to the published version of the manuscript.

Funding

This research was funded by the following projects: (1) “Enabling interdisciplinary COllaboration to Foster Mediterranean foREST sustainable management and Socio-ECOnomic valuation (ECO2-FOREST)” (Proyecto Retos Junta de Andalucía, Spain, grant number P18-RT-2327). (2) “Evaluación de tecnologías de detección remota para la estimación de biomasa de teca en la Región Costa de Ecuador” (Research and Development System of the Catholic University of Santiago de Guayaquil, Ecuador). This work also takes part of the general research lines promoted by the Agrifood Campus of International Excellence ceiA3, Spain (http://www.ceia3.es/en). Finally, this work was supported for publication by the “Conselleria de Innovación, Universidades, Ciencia y Sociedad Digital” of the “Generalitat Valenciana”. The authors would also like to thank the INGEGRAF association.

Institutional Review Board Statement

Not applicable.

Informed Consent Statement

Not applicable.

Acknowledgments

The authors wish to thank José Rivas Barzola (Universidad Católica de Santiago de Guayaquil and Grupo Barzola, Ecuador) for his valuable technical and logistical support to carry out the field survey in November 2018.

Conflicts of Interest

The authors declare no conflict of interest.

References

  1. Pan, Y.; Birdsey, R.A.; Phillips, O.L.; Jackson, R.B. The structure, distribution, and biomass of the world’s forests. Annu. Rev. Ecol. Evol. Syst. 2013, 44, 593–622. [Google Scholar] [CrossRef] [Green Version]
  2. Beer, C.; Reichstein, M.; Tomelleri, E.; Ciais, P.; Jung, M.; Carvalhais, N.; Rödenbeck, C.; Arain, M.A.; Baldocchi, D.; Bonan, G.B.; et al. Terrestrial Gross Carbon Dioxide Uptake: Global Distribution and Covariation with Climate. Science 2010, 329, 834–838. [Google Scholar] [CrossRef] [PubMed] [Green Version]
  3. Pan, Y.; Birdsey, R.A.; Fang, J.; Houghton, R.; Kauppi, P.E.; Kurz, W.A.; Phillips, O.L.; Shvidenko, A.; Lewis, S.L.; Canadell, J.G.; et al. A large and persistent carbon sink in the world’s forests. Science 2011, 333, 988–993. [Google Scholar] [CrossRef] [PubMed] [Green Version]
  4. Lindberg, E.; Holmgren, J. Individual Tree Crown Methods for 3D Data from Remote Sensing. Curr. For. Rep. 2017, 3, 19–31. [Google Scholar] [CrossRef] [Green Version]
  5. Houghton, R.A.; Nassikas, A.A. Negative emissions from stopping deforestation and forest degradation, globally. Glob. Chang. Biol. 2018, 24, 350–359. [Google Scholar] [CrossRef]
  6. Li, W.; Guo, Q.; Jakubowski, M.K.; Kelly, M. A New Method for Segmenting Individual Trees from the Lidar Point Cloud. Photogramm. Eng. Remote Sens. 2012, 78, 75–84. [Google Scholar] [CrossRef] [Green Version]
  7. Wallace, L.; Lucieer, A.; Malenovskỳ, Z.; Turner, D.; Vopěnka, P. Assessment of forest structure using two UAV techniques: A comparison of airborne laser scanning and structure from motion (SfM) point clouds. Forests 2016, 7, 62. [Google Scholar] [CrossRef] [Green Version]
  8. Aguilar, F.J.; Rivas, J.R.; Nemmaoui, A.; Peñalver, A.; Aguilar, M.A. UAV-Based Digital Terrain Model Generation under Leaf-Off Conditions to Support Teak Plantations Inventories in Tropical Dry Forests. A Case of the Coastal Region of Ecuador. Sensors 2019, 19, 1934. [Google Scholar] [CrossRef] [Green Version]
  9. Gómez, C.; Alejandro, P.; Hermosilla, T.; Montes, F.; Pascual, C.; Ruiz, L.Á.; Álvarez-Taboada, F.; Tanase, M.A.; Valbuena, R. Remote sensing for the Spanish forests in the 21stcentury: A review of advances, needs, and opportunities. For. Syst. 2019, 28, 2171–9292. [Google Scholar] [CrossRef]
  10. White, J.C.; Coops, N.C.; Wulder, M.A.; Vastaranta, M.; Hilker, T.; Tompalski, P. Remote Sensing Technologies for Enhancing Forest Inventories: A Review. Can. J. Remote Sens. 2016, 42, 619–641. [Google Scholar] [CrossRef] [Green Version]
  11. Kankare, V.; Holopainen, M.; Vastaranta, M.; Puttonen, E.; Yu, X.; Hyyppä, J.; Vaaja, M.; Hyyppä, H.; Alho, P. Individual tree biomass estimation using terrestrial laser scanning. ISPRS J. Photogramm. Remote Sens. 2013, 75, 64–75. [Google Scholar] [CrossRef]
  12. Liang, X.; Kankare, V.; Hyyppä, J.; Wang, Y.; Kukko, A.; Haggrén, H.; Yu, X.; Kaartinen, H.; Jaakkola, A.; Guan, F.; et al. Terrestrial laser scanning in forest inventories. ISPRS J. Photogramm. Remote Sens. 2016, 115, 63–77. [Google Scholar] [CrossRef]
  13. Cabo, C.; Ordóñez, C.; López-Sánchez, C.A.; Armesto, J. Automatic dendrometry: Tree detection, tree height and diameter estimation using terrestrial laser scanning. Int. J. Appl. Earth Obs. Geoinf. 2018, 69, 164–174. [Google Scholar] [CrossRef]
  14. Aguilar, F.J.; Nemmaoui, A.; Peñalver, A.; Rivas, J.R.; Aguilar, M.A. Developing allometric equations for teak plantations located in the coastal region of ecuador from terrestrial laser scanning data. Forests 2019, 10, 1050. [Google Scholar] [CrossRef] [Green Version]
  15. Gleason, C.J.; Im, J. Forest biomass estimation from airborne LiDAR data using machine learning approaches. Remote Sens. Environ. 2012, 125, 80–91. [Google Scholar] [CrossRef]
  16. Li, Y.; Li, C.; Li, M.; Liu, Z. Influence of Variable Selection and Forest Type on Forest Aboveground Biomass Estimation Using Machine Learning Algorithms. Forests 2019, 10, 1073. [Google Scholar] [CrossRef] [Green Version]
  17. Chave, J.; Réjou-Méchain, M.; Búrquez, A.; Chidumayo, E.; Colgan, M.S.; Delitti, W.B.C.; Duque, A.; Eid, T.; Fearnside, P.M.; Goodman, R.C.; et al. Improved allometric models to estimate the aboveground biomass of tropical trees. Glob. Chang. Biol. 2014, 20, 3177–3190. [Google Scholar] [CrossRef]
  18. Jucker, T.; Caspersen, J.; Chave, J.; Antin, C.; Barbier, N.; Bongers, F.; Dalponte, M.; van Ewijk, K.Y.; Forrester, D.I.; Haeni, M.; et al. Allometric equations for integrating remote sensing imagery into forest monitoring programmes. Glob. Chang. Biol. 2017, 23, 177–190. [Google Scholar] [CrossRef]
  19. Dalponte, M.; Coomes, D.A. Tree-centric mapping of forest carbon density from airborne laser scanning and hyperspectral data. Methods Ecol. Evol. 2016, 7, 1236–1245. [Google Scholar] [CrossRef] [Green Version]
  20. McRoberts, R.E.; Westfall, J.A. Propagating uncertainty through individual tree volume model predictions to large-area volume estimates. Ann. For. Sci. 2016, 73, 625–633. [Google Scholar] [CrossRef] [Green Version]
  21. Holdridge, L.R. Ecología Basada en Zonas de Vida; IICA. Serie de Libros y Materiales Educativos; Instituto Interamericano de Cooperacion para la Agricultura: San José, Costa Rica, 1982; ISBN 9789290390398. [Google Scholar]
  22. Pueschel, P.; Newnham, G.; Rock, G.; Udelhoven, T.; Werner, W.; Hill, J. The influence of scan mode and circle fitting on tree stem detection, stem diameter and volume extraction from terrestrial laser scans. ISPRS J. Photogramm. Remote Sens. 2013, 77, 44–56. [Google Scholar] [CrossRef]
  23. Trochta, J.; Krůček, M.; Vrška, T.; Král, K. 3D Forest: An application for descriptions of three-dimensional forest structures using terrestrial LiDAR. PLoS ONE 2017, 12, e0176871. [Google Scholar] [CrossRef] [Green Version]
  24. FUSION/LDV LIDAR Analysis and Visualization Software. Available online: http://forsys.cfr.washington.edu/fusion/fusion_overview.html (accessed on 22 April 2021).
  25. Zhang, Y.; Ma, J.; Liang, S.; Li, X.; Li, M. An Evaluation of Eight Machine Learning Regression Algorithms for Forest Aboveground Biomass Estimation from Multiple Satellite Data Products. Remote Sens. 2020, 12, 4015. [Google Scholar] [CrossRef]
  26. Luo, M.; Wang, Y.; Xie, Y.; Zhou, L.; Qiao, J.; Qiu, S.; Sun, Y. Combination of Feature Selection and CatBoost for Prediction: The First Application to the Estimation of Aboveground Biomass. Forests 2021, 12, 216. [Google Scholar] [CrossRef]
  27. Hancock, J.T.; Khoshgoftaar, T.M. CatBoost for big data: An interdisciplinary review. J. Big Data 2020, 7. [Google Scholar] [CrossRef] [PubMed]
  28. Maack, J.; Kattenborn, T.; Fassnacht, F.E.; Enßle, F.; Hernández, J.; Corvalán, P.; Koch, B. Modeling forest biomass using Very-High-Resolution data—Combining textural, spectral and photogrammetric predictors derived from spaceborne stereo images. Eur. J. Remote Sens. 2015, 48, 245–261. [Google Scholar] [CrossRef] [Green Version]
  29. Agrawal, A.; Nepstad, D.; Chhatre, A. Reducing Emissions from Deforestation and Forest Degradation. Annu. Rev. Environ. Resour. 2011, 36, 373–396. [Google Scholar] [CrossRef] [Green Version]
  30. Ogana, F.N.; Ercanli, I. Modelling height-diameter relationships in complex tropical rain forest ecosystems using deep learning algorithm. J. For. Res. 2021 2021, 1, 1–16. [Google Scholar] [CrossRef]
  31. Lara, C.E. Aplicación de ecuaciones de conicidad para teca (Tectona grandis L.F.) en la zona costera ecuatoriana. Cienc. Tecnol. 2012, 4, 19–27. [Google Scholar] [CrossRef]
  32. Pérez, L.D.; Kanninen, M. Aboveground biomass of Tectona grandis plantations in Costa Rica. J. Trop. For. Sci. 2003, 15, 199–213. [Google Scholar] [CrossRef]
  33. White, J.; Wulder, M.; Vastaranta, M.; Coops, N.; Pitt, D.; Woods, M. The Utility of Image-Based Point Clouds for Forest Inventory: A Comparison with Airborne Laser Scanning. Forests 2013, 4, 518–536. [Google Scholar] [CrossRef] [Green Version]
  34. Mohan, M.; Silva, C.; Klauberg, C.; Jat, P.; Catts, G.; Cardil, A.; Hudak, A.; Dia, M. Individual Tree Detection from Unmanned Aerial Vehicle (UAV) Derived Canopy Height Model in an Open Canopy Mixed Conifer Forest. Forests 2017, 8, 340. [Google Scholar] [CrossRef] [Green Version]
  35. Ferraz, A.; Bretar, F.; Jacquemoud, S.; Gonçalves, G.; Pereira, L.; Tomé, M.; Soares, P. 3-D mapping of a multi-layered Mediterranean forest using ALS data. Remote Sens. Environ. 2012, 121, 210–223. [Google Scholar] [CrossRef]
  36. Calders, K.; Jonckheere, I.; Nightingale, J.; Vastaranta, M. Remote Sensing Technology Applications in Forestry and REDD+. Forests 2020, 11, 188. [Google Scholar] [CrossRef] [Green Version]
  37. Vafaei, S.; Soosani, J.; Adeli, K.; Fadaei, H.; Naghavi, H.; Pham, T.D.; Bui, D.T. Improving Accuracy Estimation of Forest Aboveground Biomass Based on Incorporation of ALOS-2 PALSAR-2 and Sentinel-2A Imagery and Machine Learning: A Case Study of the Hyrcanian Forest Area (Iran). Remote Sens. 2018, 10, 172. [Google Scholar] [CrossRef] [Green Version]
  38. Vieira, G.; de Mendonça, A.; da Silva, G.; Zanetti, S.; da Silva, M.; Dos Santos, A. Prognoses of diameter and height of trees of eucalyptus using artificial intelligence. Sci. Total Environ. 2018, 619–620, 1473–1481. [Google Scholar] [CrossRef]
  39. Bayat, M.; Bettinger, P.; Heidari, S.; Khalyani, A.H.; Jourgholami, M.; Hamidi, S.K. Estimation of Tree Heights in an Uneven-Aged, Mixed Forest in Northern Iran Using Artificial Intelligence and Empirical Models. Forests 2020, 11, 324. [Google Scholar] [CrossRef] [Green Version]
  40. Chen, J.; Yang, H.; Man, R.; Wang, W.; Sharma, M.; Peng, C.; Parton, J.; Zhu, H.; Deng, Z. Using machine learning to synthesize spatiotemporal data for modelling DBH-height and DBH-height-age relationships in boreal forests. For. Ecol. Manage. 2020, 466, 118104. [Google Scholar] [CrossRef]
  41. Ercanlı, İ. Innovative deep learning artificial intelligence applications for predicting relationships between individual tree height and diameter at breast height. For. Ecosyst. 2020, 7, 1–18. [Google Scholar] [CrossRef] [Green Version]
  42. Filho, S.V.S.D.C.; Arce, J.E.; Montaño, R.A.N.R.; Pelissari, A.L. Configuração de algoritmos de aprendizado de máquina na modelagem florestal: Um estudo de caso na modelagem da relação hipsométrica. Ciência Florest. 2019, 29, 1501–1515. [Google Scholar] [CrossRef] [Green Version]
  43. Tavares Júnior, I.D.S.; Torres, C.M.M.E.; Leite, H.G.; de Castro, N.L.M.; Soares, C.P.B.; Castro, R.V.O.; Farias, A.A. Machine learning: Modeling increment in diameter of individual trees on Atlantic Forest fragments. Ecol. Indic. 2020, 117, 106685. [Google Scholar] [CrossRef]
  44. Abegg, M.; Kükenbrink, D.; Zell, J.; Schaepman, M.E.; Morsdorf, F. Terrestrial laser scanning for forest inventories-tree diameter distribution and scanner location impact on occlusion. Forests 2017, 8, 184. [Google Scholar] [CrossRef] [Green Version]
  45. Suraj Reddy, R.; Rakesh, A.; Jha, C.S.; Rajan, K.S. Automatic Estimation of Tree Stem Attributes Using Terrestrial Laser Scanning in Central Indian Dry Deciduous Forests. Curr. Sci. 2018, 114, 201–206. [Google Scholar] [CrossRef]
  46. Peñalver, A.; Aguilar, F.J.; Nemmaoui, A.; Rivas, J.R.; Triana, Á.A.; Aguilar, M.A.; Llanderal, A. Precisión y eficiencia del inventario de plantaciones de teca en Ecuador mediante escáner láser terrestre. Madera Bosques 2021, 27, e2712097. [Google Scholar] [CrossRef]
  47. Guerra-Hernández, J.; Cosenza, D.N.; Rodriguez, L.C.E.; Silva, M.; Tomé, M.; Díaz-Varela, R.A.; González-Ferreiro, E. Comparison of ALS- and UAV(SfM)-derived high-density point clouds for individual tree detection in Eucalyptus plantations. Int. J. Remote Sens. 2018, 39, 5211–5235. [Google Scholar] [CrossRef]
  48. Lin, Y.-C.; Liu, J.; Fei, S.; Habib, A. Leaf-Off and Leaf-On UAV LiDAR Surveys for Single-Tree Inventory in Forest Plantations. Drones 2021, 5, 115. [Google Scholar] [CrossRef]
  49. Newnham, G.J.; Armston, J.D.; Calders, K.; Disney, M.I.; Lovell, J.L.; Schaaf, C.B.; Strahler, A.H.; Mark Danson, F. Terrestrial laser scanning for plot-scale forest measurement. Curr. For. Rep. 2015, 1, 239–251. [Google Scholar] [CrossRef] [Green Version]
  50. Liang, X.; Kankare, V.; Yu, X.; Hyyppä, J.; Holopainen, M. Automated Stem Curve Measurement Using Terrestrial Laser Scanning. IEEE Trans. Geosci. Remote Sens. 2014, 52, 1739–1748. [Google Scholar] [CrossRef]
  51. Saarinen, N.; Kankare, V.; Vastaranta, M.; Luoma, V.; Pyörälä, J.; Tanhuanpää, T.; Liang, X.; Kaartinen, H.; Kukko, A.; Jaakkola, A.; et al. Feasibility of Terrestrial laser scanning for collecting stem volume information from single trees. ISPRS J. Photogramm. Remote Sens. 2017, 123, 140–158. [Google Scholar] [CrossRef]
Figure 1. Location map of the three teak plantations (Morondava, El Tecal and Allteak).
Applsci 11 10139 g001
Figure 2. Configuration of scan positions within a reference plot and TLS point cloud. (a) Sketch of circular reference plots depicting the approximate location of the four TLS scans. (b) Automatically segmented teak trees from TLS point cloud depicting ground (brown) and vegetation (green) classified points.
Applsci 11 10139 g002
Figure 3. Examples of plots of DBH predicted/observed values for test datasets (455 teak trees not used for training) given by four allometric models in which the explanatory variables are H and CD. (a) Linear regression (R2 = 87.99%); (b) Decision Tree Regression (R2 = 79.75%); (c) Random Forest Regression (R2 = 89.63%); (d) Gradient Boosting Regression (R2 = 91.01%). The red line refers to the 1:1 line.
Applsci 11 10139 g003
Table 1. Statistics of R2 for bivariate allometric models DBH = Φ(H). Mean values with different superscript letters in a column are significantly different (p < 0.05) (two-sample t statistic).
Regression MethodR2 Mean Value (%)R2 Standard Deviation (%)R2 Range
(Min/Max %)
GBoost87.21 a1.0284.92–89.65
CatBoost87.08 a1.0684.80–89.43
LR86.87 a1.0883.17–89.32
AdaBoost86.59 a1.2683.16–89.80
RFR82.50 b1.4479.04–86.42
DTR78.35 c2.2372.93–83.76
Table 2. Statistics of R2 for multivariate allometric models DBH = Ψ(H, CD). Mean values with different superscript letters in a column are significantly different (p < 0.05) (two-sample t statistic).
Regression MethodR2 Mean Value (%)R2 Standard Deviation (%)R2 Range
(Min/Max %)
GBoost90.16 a0.9187.52–92.32
CatBoost90.15 a0.9388.00–91.98
AdaBoost88.73 ab1.0285.75–91.46
RFR88.67 ab1.0485.23–91.13
LR87.81 b1.1384.33–90.70
DTR81.22 c1.6776.31–86.01
Publisher’s Note: MDPI stays neutral with regard to jurisdictional claims in published maps and institutional affiliations.

