1. Introduction
Electrotactile systems deliver low-intensity electrical currents to the surface of the skin, which depolarizes skin afferents and produces tactile sensations [
1]. This technology has been traditionally used for sensory communication in different areas of rehabilitation engineering [
1,
2], for instance, to restore somatosensory feedback in upper [
3,
4] and lower [
5] limb myoelectric prostheses, to provide vestibular substitution for patients with balance dysfunction [
6], and to implement auditory prostheses [
7,
8] and assistive devices for the visually impaired [
9,
10,
11,
12,
13]. Recently, electrotactile interfaces have penetrated the emerging applications [
1] that have so far been dominated by other haptic modalities, such as provision of tactile sensations in augmented/virtual reality [
14,
15,
16], design of multi-touch panels [
17], and conveying feedback to the human operator in teleoperation [
18]. Favorable physical characteristics (low power consumption, simple fabrication, fast response) combined with the possibility of modulating multiple stimulation parameters (e.g., pulse width, amplitude, frequency, and location) independently and simultaneously, allow the designing of compact and high-resolution electrotactile displays. Such displays, based on multi-pad electrode technology, can be leveraged to successfully deliver high-fidelity information on multiple variables of interest in an intuitive manner, as recently exemplified in the context of the restoration of proprioceptive and grasping force feedback in myoelectric prostheses [
19,
20,
21,
22,
23].
However, a clear drawback of electrotactile stimulation, which is even more pronounced in multi-pad systems, is inter- and intra-subject variability of psychometric parameters (e.g., sensation and discomfort thresholds) and qualities of elicited sensations [
24]. When stimulation parameters are not properly adjusted, stimuli can be unclear, uncomfortable, or even painful. In addition, the same stimulation parameters can produce substantially different sensations when applied to a different location. Therefore, electrotactile interfaces require intensity to be calibrated before each application. This takes time, especially when using a multi-channel interface, as the calibration needs to be performed for each channel individually.
The intensity of the elicited sensations depends on the quantity of electrical charge, which is a product of pulse width and amplitude. Hence, the intensity can be controlled by modulating either pulse width [
25,
26], or amplitude [
18]. In many applications, the stimulation is applied using a constant intensity, for instance, when conveying contact information by activating a specific pad. In this case, the stimulation intensity is adjusted to produce localized, clear, and comfortable sensations [
19,
27,
28], which requires determining the sensation threshold using the method of limits [
29] or a staircase procedure [
30]. The method of limits is a simpler procedure, in which the intensity is increased incrementally until the subject indicates that he/she has felt the sensation, whereas in the staircase approach, the intensity is adapted in each trial based on subject answers. The latter determines the parameters more accurately but is also more time-consuming. If the application requires modulating the intensity to convey continuous feedback variables (e.g., contact force in addition to contact event) [
31], then discomfort thresholds need to be determined as well, which further increases the calibration time. Nevertheless, the calibration procedure can be simplified by adopting an informed choice of the starting amplitudes in the calibration algorithm [
24].
Many researchers set the stimulation intensity based on sensation threshold (ST) [
32], i.e., by multiplying ST by a predefined factor to obtain clearly perceivable sensation. However, there is no consensus in literature and different multiplication values have been used, e.g., 1.2 × ST [
21], 1.5 × ST [
23,
33], 2 × ST [
30], 3 × ST [
34], as well as adding a constant value to ST (e.g., ST + 1.5 mA [
35]) or some percentage of amplitude range between the sensation and discomfort thresholds (DT), e.g., using the midpoint amplitude [
36] or three intermediate levels [
31].
In addition to obtaining a clear and comfortable sensation, an important aspect of calibrating the intensity is related to the subjects’ ability to localize delivered stimuli. When the stimulation amplitude is increased, the sensation intensity is stronger but the localization and area where the sensation is felt can increase due to a larger spread of the current injected into the skin. This can potentially impact the subject’s ability to localize the delivered electrotactile stimulus. Good localization is particularly important in the case of multi-channel interfaces where the information is often conveyed through the activation of different pads (e.g., contact location). In this case, if the pad activations elicit dispersed sensations, it can be difficult for the subject to identify the active pad and therefore interpret the stimuli. This can be especially pronounced when the stimulation is delivered to a confined area, such as the tip of a finger. Only a few studies compared the impact of different levels of stimulation intensity on spatial localization. The study tested subjects’ ability to detect the boundary of a small electrotactile display with 10 × 18 pads using three different amplitude levels: ST + 10%, 2 × ST, and a level manually set by the subject; it showed inconclusive results [
37]. Bobich et al. [
38] explored spatial discrimination of 2 × 2 electrode matrix positioned on the fingertip using amplitudes adjusted in two different ways. In both cases, ST was determined and slightly increased for each of four electrodes, and then additionally adjusted (1) so that subjects felt all points had similar intensity or (2) all points had the same pulse amplitude (highest value of the four sites). The findings showed that the latter condition resulted in better localization, but a drawback of this approach is that discomfort might be evoked in points for which the current amplitude was increased.
The present study systematically investigated the interaction between the stimulation intensity and the subject’s ability to localize the stimuli delivered using a multi-pad electrotactile interface. The assessment was conducted on the distal and proximal phalange of the index finger to investigate the potential impact of the stimulation location. First, in addition to commonly used sensation and discomfort thresholds, we aimed to establish the intensity levels that, as reported by the subjects, lead to a clear and comfortable sensation that is felt as localized below the active pad versus smeared sensations that spread outside of the pads. The determined intensities are then expressed relative to ST to potentially simplify the calibration procedure for the multi-pad electrode. Finally, we have compared the subjective impressions about the relation between the intensity and localization to the actual (objective) performance of the subjects during spatial discrimination tests. To this aim, spatial discrimination tests were conducted at several stimulation intensities covering the full range of amplitudes between sensation and discomfort threshold. We hypothesized that spatial discrimination performance would decrease for higher levels of intensity due to the spreading of the current in the tissue and the corresponding blurring of sensation area and location. We also expected that a similar decrease would be observed for low intensities, where the sensations are barely perceivable.
2. Methods
2.1. Setup
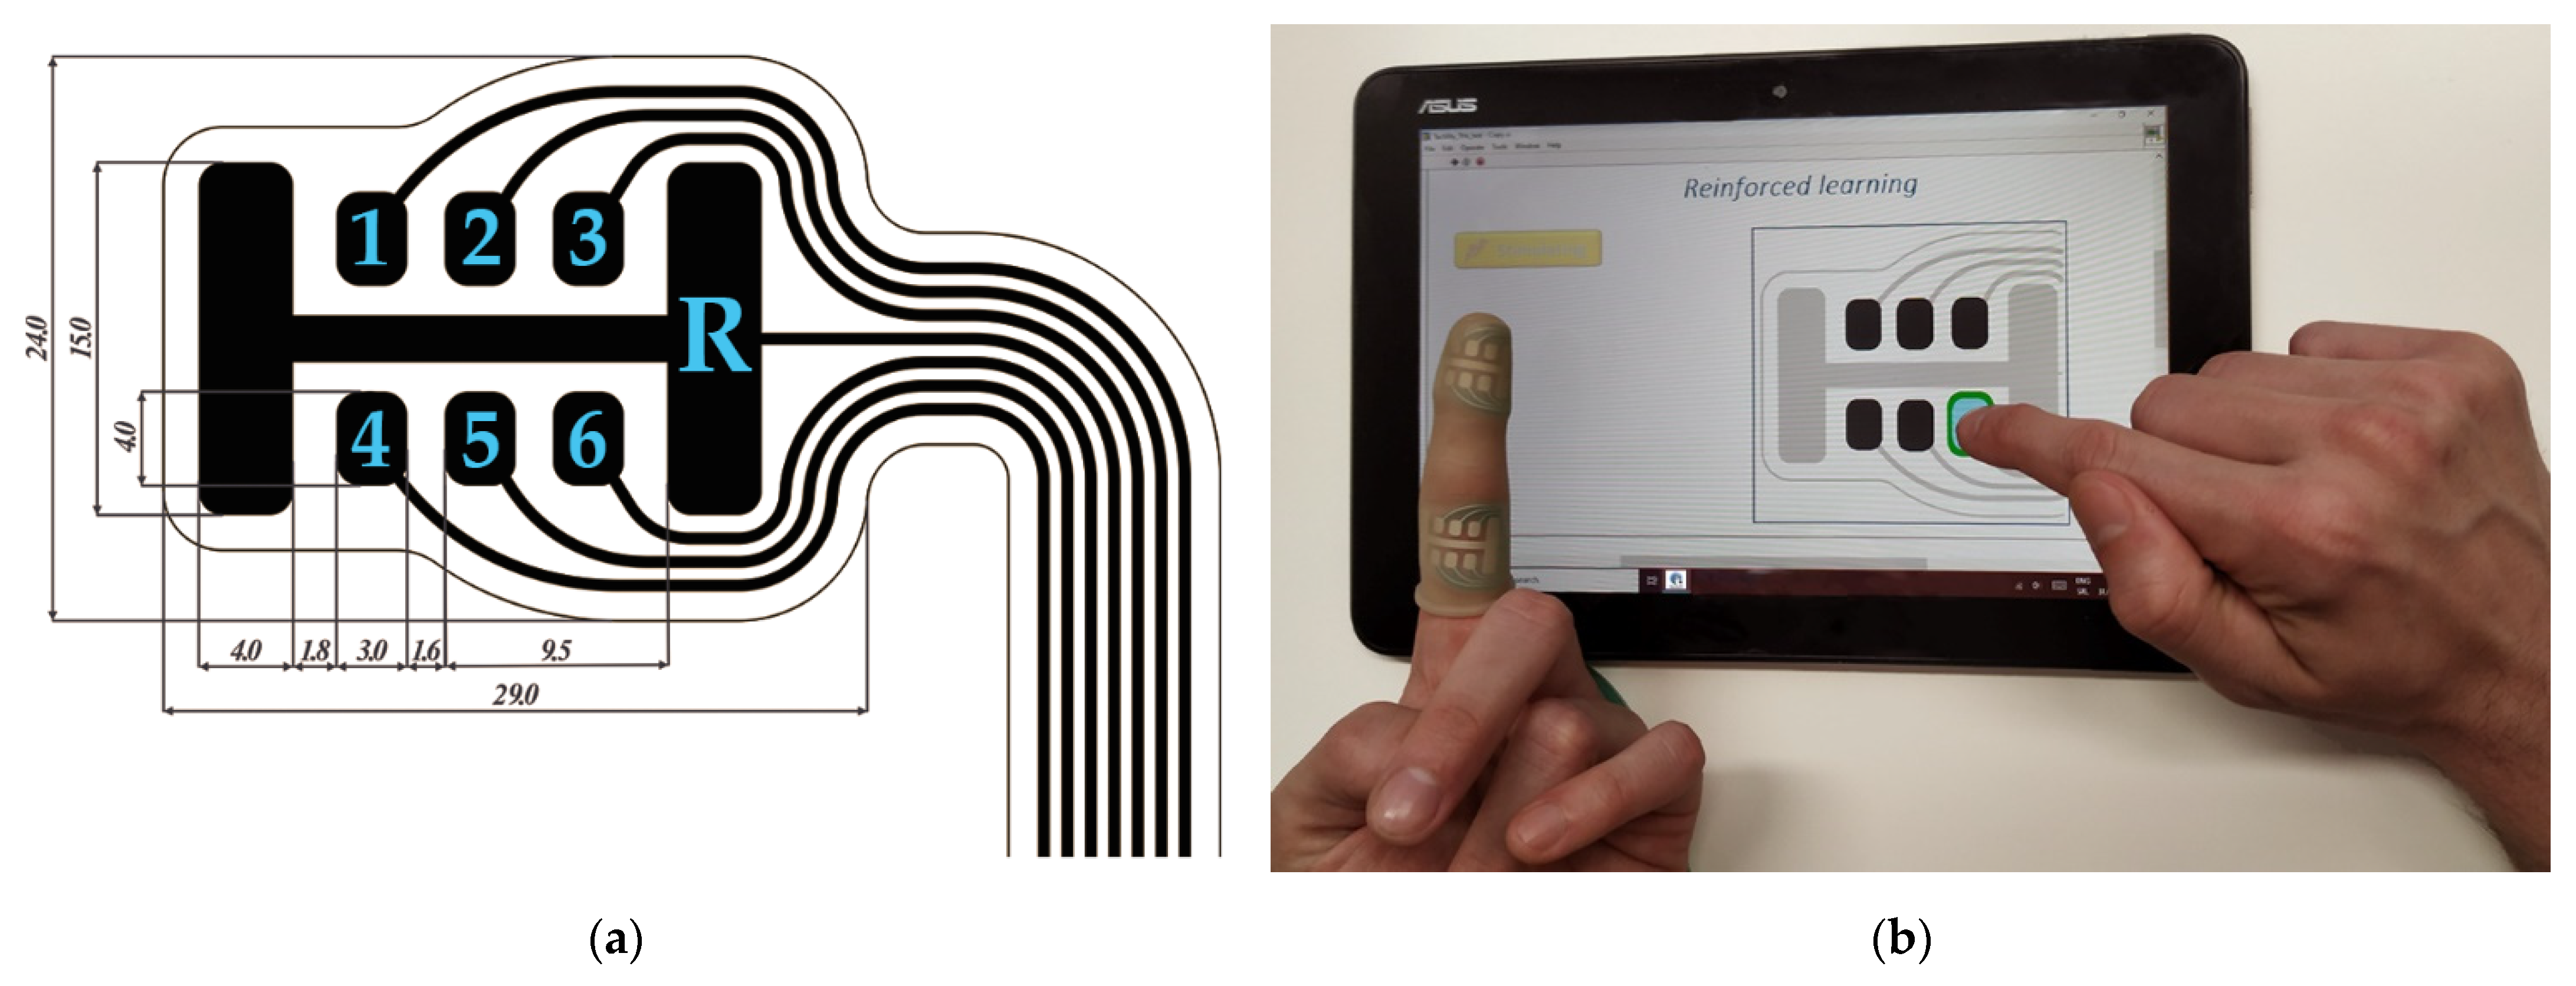
The experimental setup consisted of a custom-made multi-pad electrode prototype, a stimulator unit, and a tablet PC with dedicated LabVIEW 2020 (National Instruments, 78759 Austin, Texas, United States) applications. The electrode prototypes were produced by screen printing of conductive and dielectric inks for biomedical applications on a flexible substrate. The electrode comprised six rectangular conductive pads that acted as active electrodes. The surface of each pad was 11 mm
2. This size was selected in accordance with the hardware limitations of the stimulation unit, while following general recommendations from Szeto et al. [
39], suggesting that the best sensation quality was obtained when stimulating mechanoreceptors with an active electrode surface ranging from 7 mm
2 to 15 mm
2. The minimal distance between two pads of 1.6 mm (4.6 mm center-to-center) was in accordance with the electrotactile two points discrimination threshold (2.0–4.0 mm) for the adult fingertip [
40]. The reference electrode had an “H” shape and a significantly larger area (150 mm
2) compared to the active pads, as shown in
Figure 1a (marked with “R”). The electrode was designed to fit on the volar side of the finger’s phalanx. Vertical lines of the reference electrode were placed laterally, and central active electrodes were aligned with the midline of the phalange (
Figure 1b).
The stimulation unit generated trains of rectangular biphasic symmetric pulses [
41]. The stimulator output was current controlled, and the pulse amplitude could be modulated between 0 mA and 9 mA in steps of 0.1 mA. Bluetooth communication between the stimulator unit and the tablet PC allowed online control of the stimulation parameters and the selection of active electrode pads. Stimulation frequency and pulse width were constant during the experiment, and set to 30 Hz and 400 µs, respectively. It is shown that pulse polarity plays a role in the activation of mechanoreceptors in the human skin, i.e., cathodic pulses result with pressure-like stimuli, while anodic pulses provoke vibratory sensations [
42]. Although this approach enables better selectivity in terms of mechanoreceptors activation, monophasic pulses are prone to damaging the tissue and the stimulating electrode [
43]. Our system relies on charge-balanced biphasic pulses to ensure there is no uncompensated charge transfer and allow for safer prolonged use of the stimulation. Although the system is designed to have cathodic-leading pulses, it should be noted that the compensatory pulse may also influence the neuronal response to the stimulus [
44]. Considering that in the presented electrode the referent pad is more than 10 times larger than each of the active electrode pads, the higher current density below an active pad will ensure that there is no activation below the referent pad as a result of the compensatory pulse.
2.2. Protocol
Eleven healthy volunteers participated in the study (gender: 5/6 male/female, age: 30.3 ± 9.6 years, dominant hand: 10/1 right/left). The subjects had no musculoskeletal or somatosensory disorders. No visible damage of the skin was present on the subjects’ index fingers. Before participating in the experiments, the subjects were provided with an information sheet explaining the methods and objectives of the study. Each participant signed an informed consent form. The study was conducted following the Declaration of Helsinki and the experimental protocol was approved by the local ethics committee.
The experimental protocol included two separate sessions focused on thresholds determination and spatial discrimination, respectively. Since the first test was used to establish the amplitude ranges used in the second test, the second session was conducted only after all subjects performed the first one. In each session, the experiment was performed first for the electrode placed on the distal phalanx and then on the proximal phalanx of the index finger. During the experiment, the subject was seated in front of a table with the stimulator unit and a touch screen tablet PC equipped with custom-developed LabVIEW applications. The electrode was positioned on the index finger of the non-dominant hand, while the subject used the dominant hand to control the application. The electrode was secured with a transparent silicone garment to ensure good electrode skin contact (
Figure 1b). Transparency of the garment enabled visualization of the electrode pads, which for some participants was considered helpful for the localization of the stimuli [
45].
2.3. Threshold Assessment
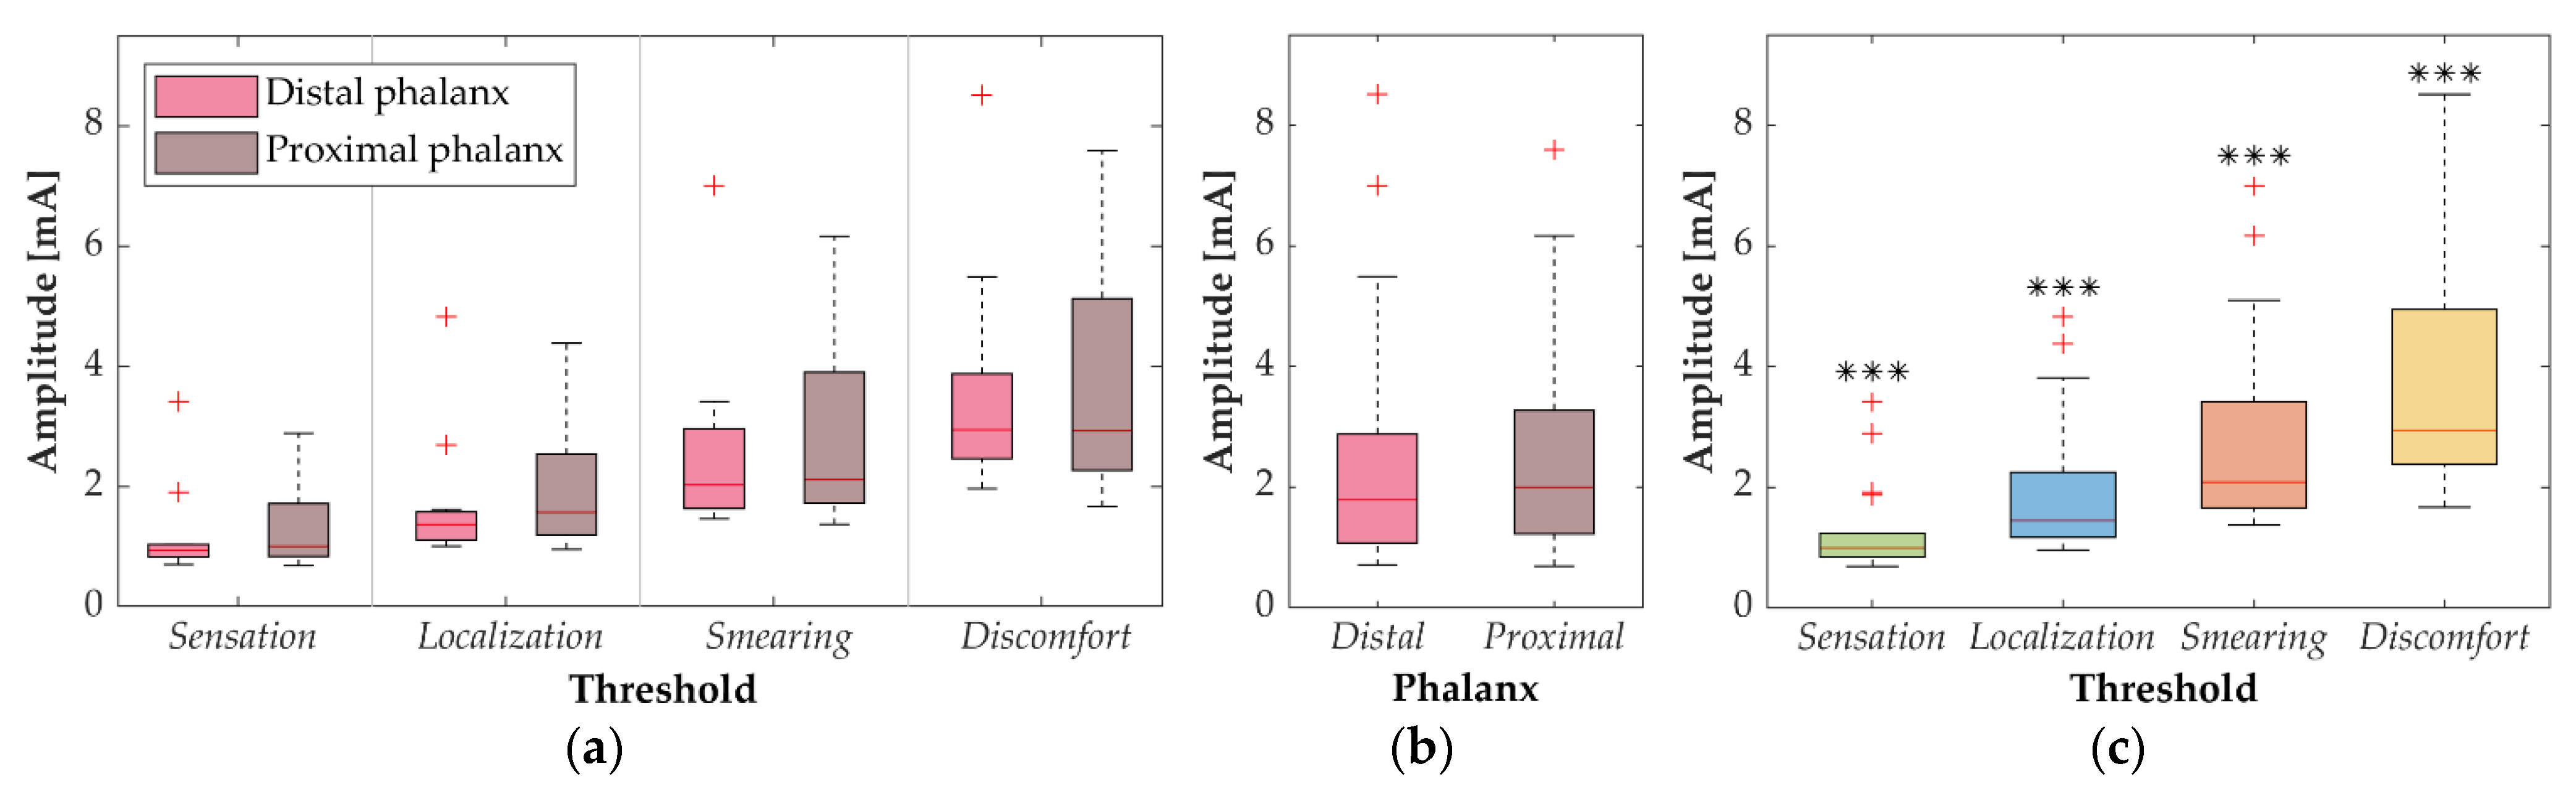
The aims of this test were threefold: (1) to determine four amplitude thresholds, namely, sensation, localization (LT), smearing (SMT) and discomfort (DT), for each pad within the electrode, (2) relate LT, SMT and DT to ST and (3) define amplitude ranges to be used in the spatial discrimination test. ST and DT are well-established psychometric measures [
1,
36] defined as the minimum current intensity resulting in stimuli that can be perceived (ST), and the current intensity that elicits an unpleasant sensation (DT). Therefore, for the stimulation to be comfortable during an actual application (e.g., restoration of touch in VR/AR), the intensity should always be maintained between these two threshold values [
46]. We introduced two additional subjective measures that related sensation intensity to the quality of spatial localization. LT was defined as the current intensity that resulted in a clear sensation that was localized under the active pad, while SMT denotes the threshold at which the subjects perceived that the sensation started shifting and/or radiating outside of the active pad area. LT is therefore a good candidate for the stimulation intensity that will be used in practical applications of the electrotactile interface. Contrary to ST, which corresponds to a barely perceptible sensation, LT elicits a clear perception that, at the same time, does not jeopardize the localization of the electrotactile stimulus. Contrarily, SMT denotes the threshold where, based on subjects’ own perception, the intensity of the stimuli could potentially reduce their ability to correctly identify an active pad.
Starting from pad number 1 (
Figure 1a), the subjects were instructed to adjust the current amplitude in steps of 0.1 mA to determine ST, LT, SMT and DT sequentially. The subjects started from 0 mA and then increased the current amplitude until they reached ST. Then, the subjects continued increasing the amplitude until LT, etc. For LT, SMT and DT, they were allowed to modulate the intensity up and down around the potential threshold value to cross check that the elicited sensation indeed corresponded to the threshold definition. After the DT was determined, the next electrode pad was automatically activated, the current intensity was set to 0 mA, and the procedure was repeated. If SMT and/or DT were not achieved even after reaching the maximum current (9 mA) the device could deliver, the thresholds were set to 9 mA (this, however, happened only in approximately 4% of cases). The session was completed when all the thresholds were determined for all electrode pads. Each subject repeated the test 12 times (6 per tested phalanx) in individual experimental sessions separated by at least 15 min. The electrode was carefully positioned to the target location at the beginning and removed at the end of each session.
2.4. Spatial Discrimination Test
In this test, the aim was to assess if the intensity of stimulation affects the subject’s ability to discriminate between active pads of the electrode. The experiment comprised four phases: ST assessment, familiarization, reinforced learning, and validation. The experimental session started by assessing the ST for each pad within the multi-pad electrode using the same procedure as in the previous test.
Once the STs for all pads were defined, the familiarization phase began. This phase aimed to familiarize the subject with the electrotactile sensations elicited by each pad and help them associate visual information to the perceived tactile sensation. During the familiarization phase, the pads were activated sequentially from pad number 1 to pad number 6 (following the labeling in
Figure 1a) with the current intensity set to 110% of ST for that pad. The stimulation lasted for 2 s, and the active pad was simultaneously highlighted on the electrode drawing on the screen (
Figure 1b). The sequence was repeated three times.
The reinforced learning phase provided further training through the active engagement of the subject. In this phase, the pads 1–6 were activated for 2 s in a pseudo random order with the current intensity set to 110% of ST. The subjects were asked to identify the active pad by pressing the corresponding pad on the electrode drawing in the application. One second after, the correct pad was shown on the screen. If the subject’s answer was correct, the pad was framed green (
Figure 1b), otherwise, the correct pad was indicated with red. The feedback on the correct answer, which was provided after each trial, allowed the subject to update the mental “mapping” between the elicited tactile sensation and the pad position. The six-pad sequence was repeated five times, each time using a new pseudo-random order.
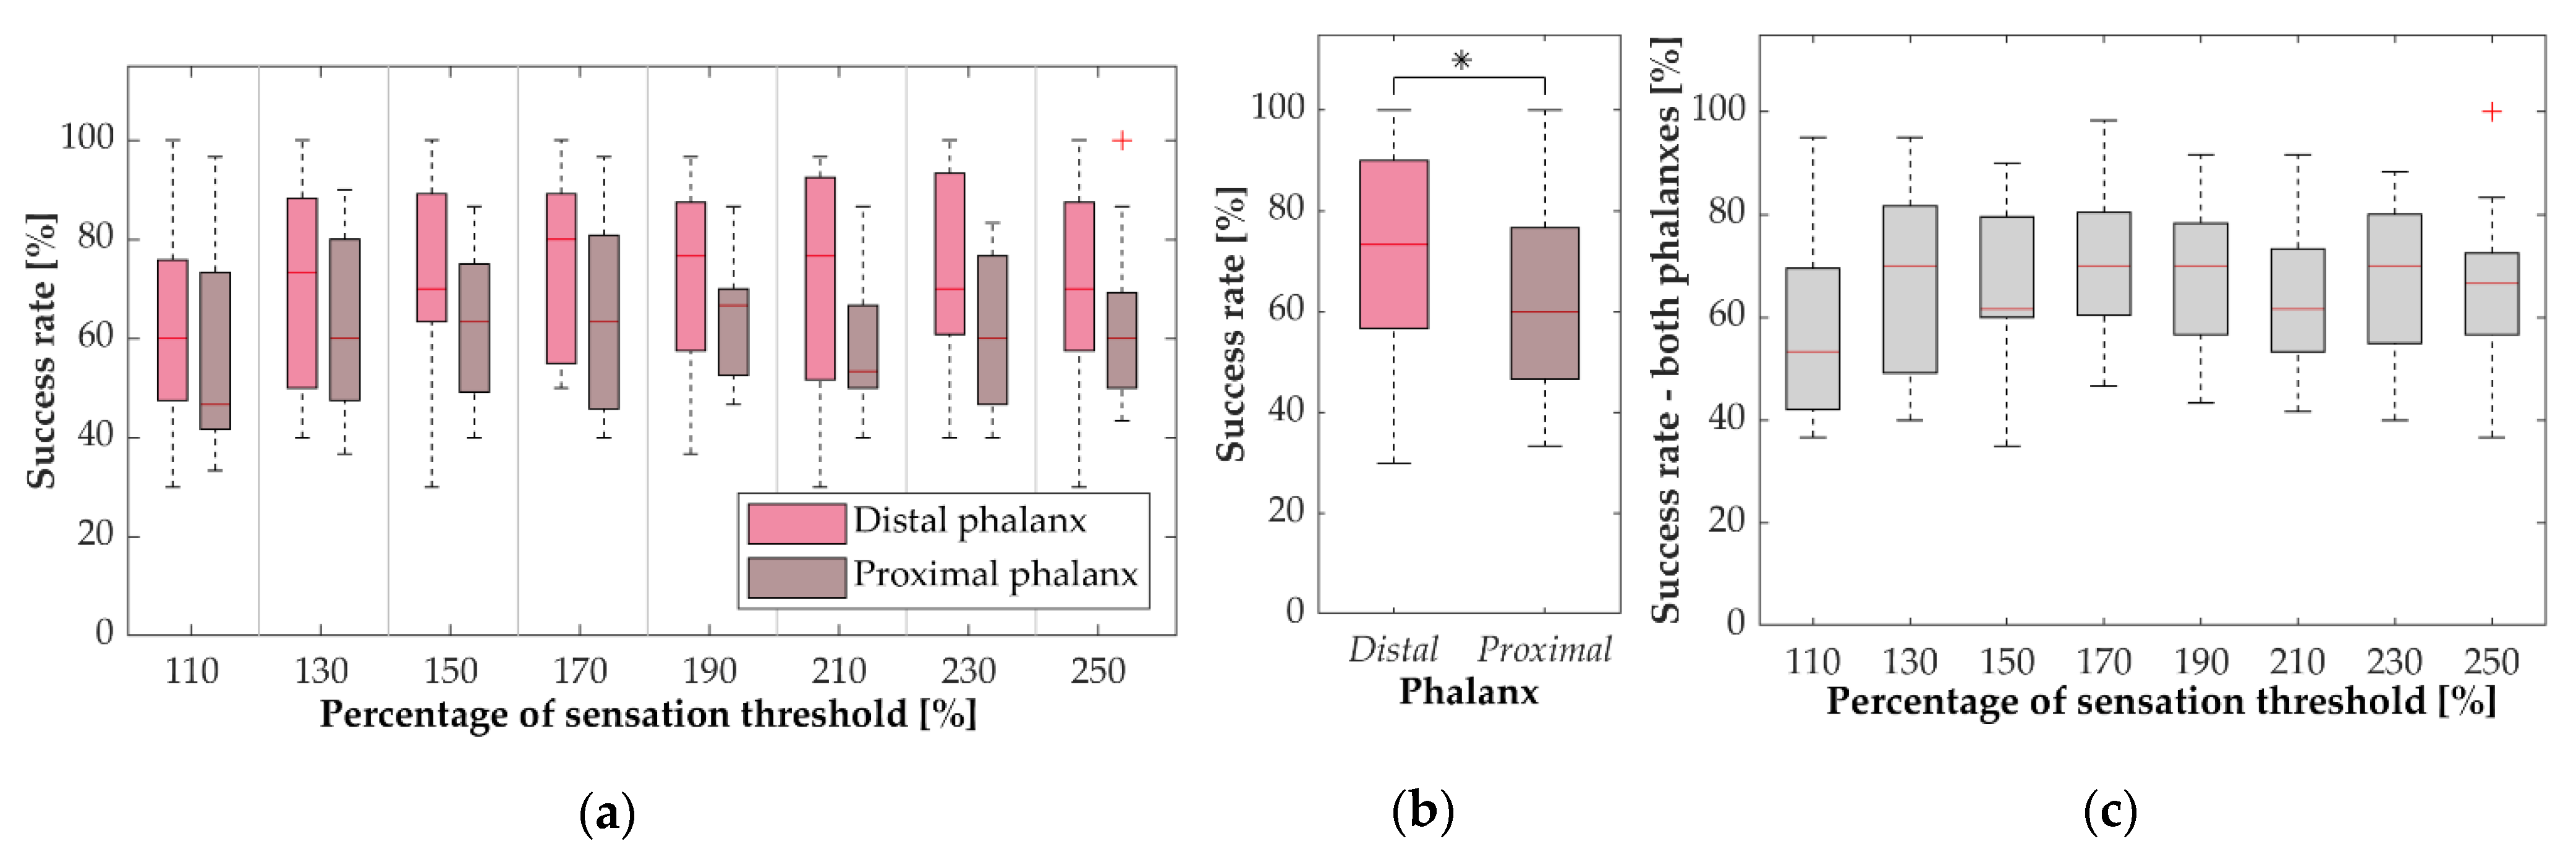
The validation phase followed a similar protocol as the reinforced learning. The subjects were instructed to identify the active pad on the electrode drawing presented in the application, but this time the visual feedback regarding the correct answer was not provided. Moreover, the pads were activated at a range of stimulation intensities based on the results from the first experimental session (threshold assessment). Eight stimulation levels were used in the amplitude range from 110% ST to 250% ST, in steps of 20% ST. The number of levels was selected to have a good coverage of the range while ensuring that the experiment did not cause significant mental fatigue. The stimulation levels were pseudo randomized, and the subjects were blinded regarding the stimulation level. Within the same level pads were pseudo-randomized within a sequence of six stimuli (as explained before in reinforced learning), and there were five repetitions per level. Therefore, the total number of test stimuli was 8 levels × 5 sequences × 6 pads = 240. The randomization was chosen to avoid activation of the same pad several times in a row, first with higher amplitudes and then with lower amplitudes, which could lead to diminished perception of the second train of pulses due to habitation, thus favoring higher amplitudes. The subjects needed between 12 and 17 min to finish the whole protocol.
2.5. Data Analysis
The average thresholds were calculated across subjects for each electrode pad. The Anderson–Darling test showed that none of the data were normally distributed. The differences in average thresholds between six pads within the electrode were investigated for four thresholds (ST, LT, SMT and DT) and two phalanges (proximal and distal). The Kruskal–Wallis test did not reveal statistically significant differences between six pads for any threshold/phalanx combination. Therefore, the data from six pads were averaged and used in further analysis resulting in 11 observations (i.e., one per subject) per threshold and phalanx. To assess the differences between four thresholds and two phalanges, the main effects analysis was performed. For each of the two factors (phalanx and threshold), the data were averaged across the other factor, and the appropriate non-parametric test was applied. The Wilcoxon signed-rank test was used to compare the phalanges, while the differences between the four thresholds were assessed using the Friedman test, followed by the Wilcoxon signed-rank test with Bonferroni correction for post-hoc pairwise comparisons.
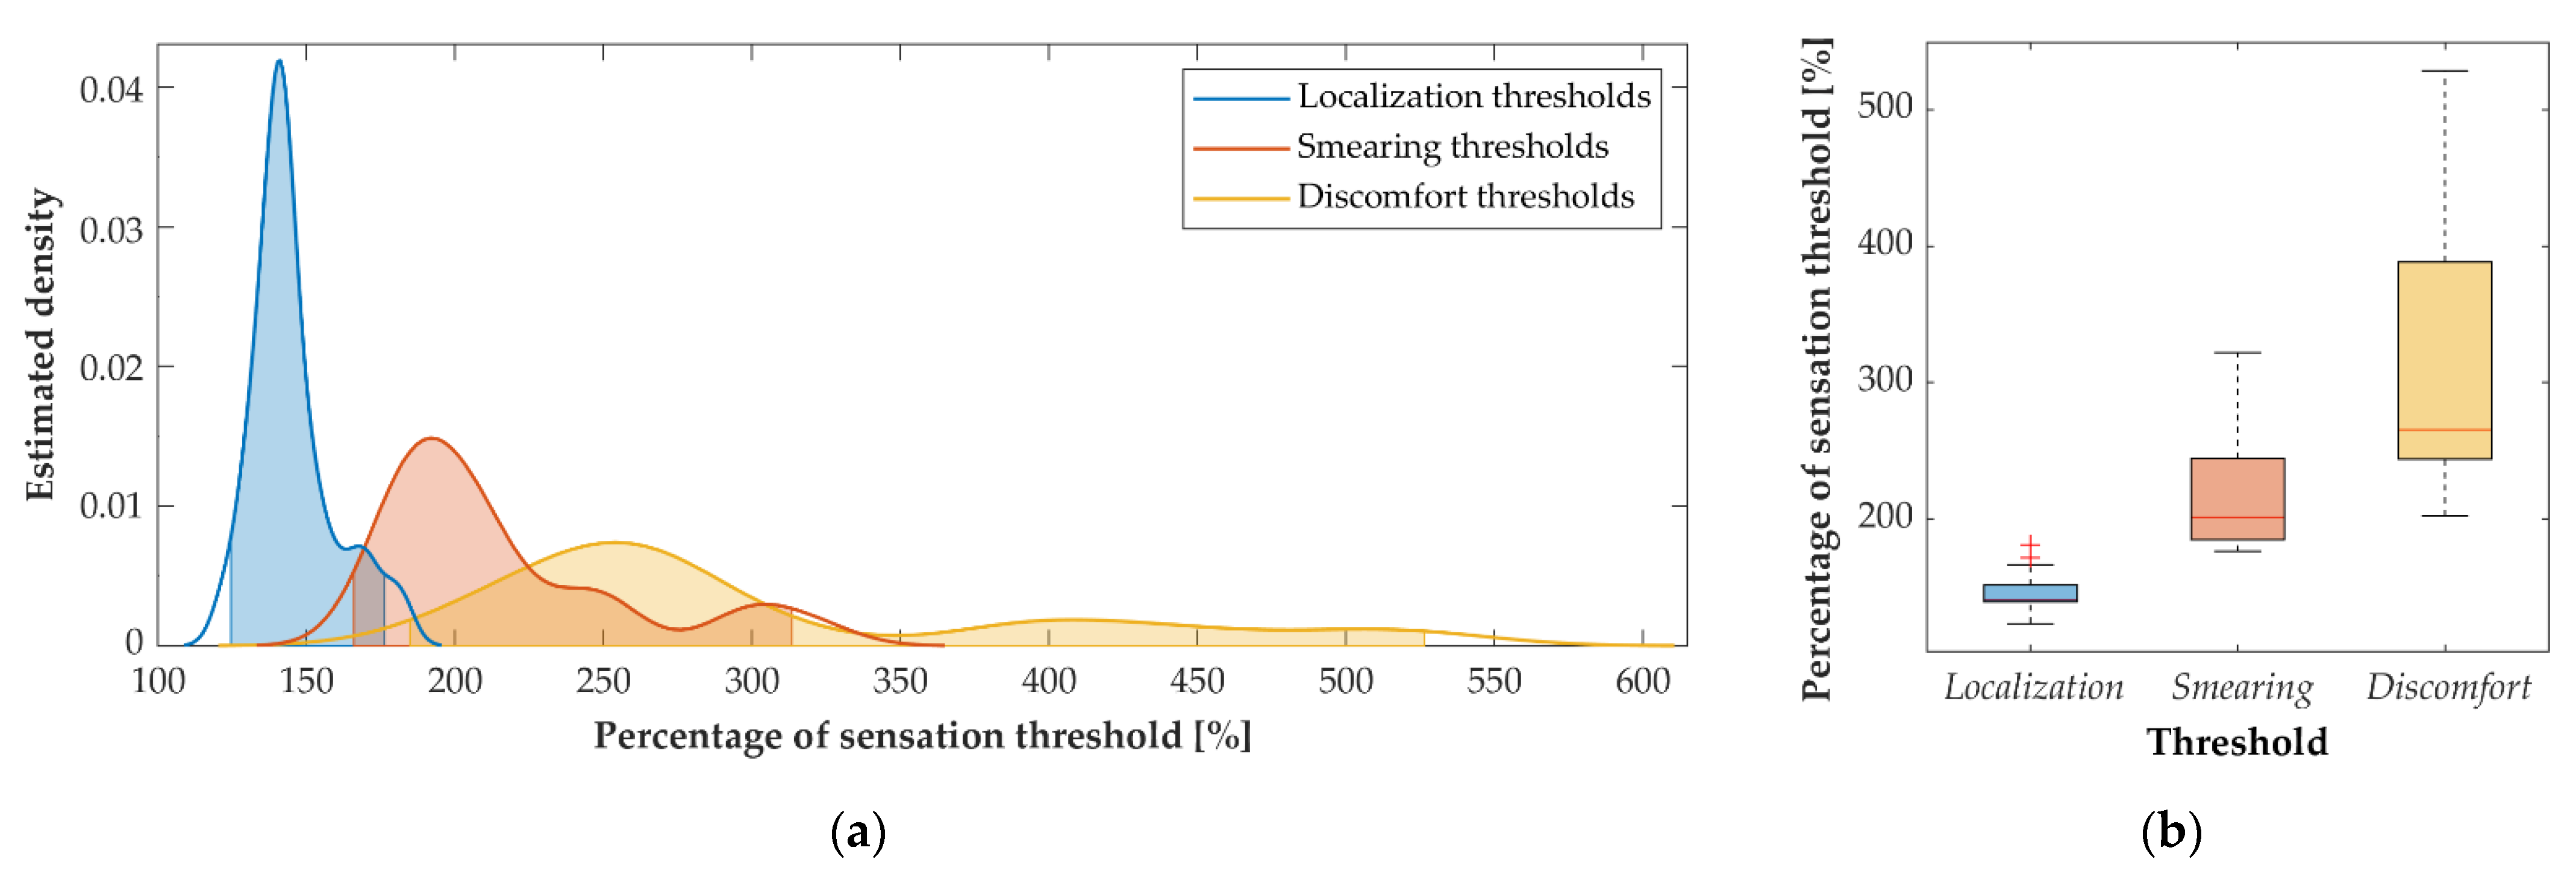
LT, SMT and DT were expressed as a percent of ST within the same trial. The distribution of these thresholds was modeled as a function of ST by estimating probability density using the kernel approach evaluated at equally spaced points.
The main outcome measure in the spatial discrimination test was the success rate in recognizing six electrode pads within the same phalanx, which was calculated as the percentage of correctly recognized pads per subject for each phalanx and amplitude level. The Anderson–Darling test showed that not all data were normally distributed. Therefore, non-parametric tests were employed for further statistical analysis. Similarly, as for the thresholds, the main effects analysis was performed to compare the success rates between two phalanges (Wilcoxon signed-rank test) and eight amplitude levels (Friedman test followed by Wilcoxon signed-rank test with Bonferroni correction for post-hoc pairwise comparisons).
4. Discussion
The aim of the present study was to investigate how stimulation intensity affects the subject’s ability to localize the sensation induced by electrotactile stimulation in proximal and distal phalanges of the index finger. This question was addressed from two perspectives, namely, by testing the subjective experience regarding the relation between stimulation intensity and perceived spreading of the elicited sensations (LT and SMT), and by objectively assessing the performance in the spatial discrimination test across a range of intensities.
The threshold assessment has indeed demonstrated that the subjects could identify the current amplitude values that produced clear but localized sensations (LT) and that they could also feel when these sensations started radiating around the active pad (SMT). The established thresholds, LT and SMT, were clearly separated (significantly different) between each other, as well as compared to ST and DT. In general, threshold values depend on several factors (e.g., stimulator properties, electrode surface and configuration, stimulation parameters, skin interface and contact), which makes it challenging to compare the results of different studies. However, the obtained STs are comparable with those reported by Bobich et al. [
38] as using a 2 × 2 array of electrodes positioned on the fingertips and of a similar surface (9.6 mm
2) as the one used in the present study.
The threshold assessment showed that the subjects could indeed feel the spreading of sensations when increasing the stimulation intensity, which was also verbally reported by the participants. Therefore, our hypothesis was that this will impact their ability to discriminate between active pads. More specifically, it was expected that the highest performance would be achieved for the three stimulation levels that were within the confidence interval of LT (130%, 150% and 170% of ST). For lower values, the spatial discrimination might be challenged by the low intensity (close to ST), while for the higher levels (above SMT), the spatial discrimination might be impaired due to the increased area of the perceived stimuli. The possibility of achieving better spatial discrimination in the fingertip when increasing amplitudes above the ST was previously suggested by Bobich et al. [
38].
Contrary to our expectations, the spatial discrimination test demonstrated that the stimulation intensity did not significantly affect the subjects’ ability to recognize an active pad. There is no visible trend in the performance across the tested intensities (see medians in
Figure 4a,c) and there is a substantial overlap between the distribution of success rates, as shown by the box plots. Although there is a slight drop for the lowest intensity (110% ST), the difference was not statistically significant. Importantly, more localized sensations are likely to assist in spatial discrimination, but the subjects can also rely on other cues to identify an active pad. During the training (familiarization and reinforced learning phases), the subjects could have learned to recognize the pads using differences in the quality or intensity of sensations elicited when activating specific pads. Such salient cues might explain why the performance did not decrease for the higher intensities as initially expected. Despite being contrary to our hypothesis, these results are encouraging as they imply that the full range of current intensities, between ST and DT, can be used in an application of the electrotactile interface without compromising spatial discrimination.
In general, there is a notable variability in spatial discrimination performance across subjects for all stimulation levels and both phalanxes with the success rate ranging from as low as 30% to up to 100% (
Figure 4a). One of the possible reasons is the difference in the finger size since there is evidence that tactile spatial acuity is better for smaller finger sizes [
47]. The subject with the lowest success rate for 10 out of 16 combinations of stimulation level and finger phalanx was the oldest (57 years) while the remaining subjects were all younger than 35 years suggesting that an additional factor could be age. Spatial acuity of touch is significantly affected by aging with middle-aged subjects (41–63 years) having two times larger grating orientation discrimination threshold than the young adults (18–33 years) [
48] and the difference being even larger for elderly subjects [
49]. However, with strong evidence that discrimination of electrotactile patterns can be significantly improved through training [
23,
50], we hypothesize that the performance could increase for all subjects, stimulation levels and finger phalanxes.
The overall success rate of spatial discrimination was significantly higher when the electrode was positioned on the distal phalanx (
Figure 4b). This result can be explained by the higher relative number of tactile sensory units innervating the distal phalanx of the index finger, especially SA1 and RA units [
51]. Higher tactile spatial acuity of the distal phalanx has been demonstrated with both two-point discrimination and two-point orientation tasks resulting in a lower mean 95%-correct threshold for the distal than for the proximal phalanx of the index finger [
52]. The required minimum clearance between two touch effectors is shown to be larger for the proximal and middle phalanx of the index finger than for the distal [
53,
54].
It should be noted that contact between the electrode and the skin plays a significant role in defining the current flow and resulting sensations. Many uncontrollable parameters contribute to this including inter-subject variability in skin type, sweat formation and composition (where the existence of sweat glands under the electrodes is a factor of relevance as well), and mechanical disturbances [
2]. Although the position of the electrode was precisely defined, small shifts in placement and differences evoked by these factors were expected. Considering that these variations are impossible to avoid in the practical use of the system, these factors were not considered in the data analysis. Another limitation of the study is that we focused only on one stimulation parameter, current amplitude, as changes in the pulse width and frequency also influence the sensation thresholds and perception of the stimuli. As in terms of elicited sensation, this set of stimulation parameters presents dependent variables that are nonlinear but ascending. We therefore decided to focus only on the amplitude calibration to determine the adequate amplitude level in which all three parameters can potentially be modulated to provoke various sensations. How the stimuli modulation can be used to provoke specific haptic effects in respect to the underlying position of the nerves and mechanoreceptors was out of the scope of the presented study but will be a theme of interest for our future research.
One of the motivations for this study was to establish an appropriate stimulation amplitude range, which in turn could simplify calibration procedure for electrotactile feedback interfaces. Setting the current amplitude in systems that rely on multi-channel electrotactile stimulation normally requires intensity adjustments for each individual channel. The tendency for future multi-pad electrotactile systems is to increase the number of pads in order to improve the fidelity of the feedback and the bandwidth of information that can be transmitted through the interface. This will further complicate the setup if the simplified procedures for multi-electrode intensity calibration are not established.
In the present study, there was no significant difference for any of the determined thresholds when they were compared across the pads within the same phalanx, as well as between phalanges (
Figure 2b). This means that the ST could be determined for a single pad, and this value could then be used as an initial guess for all other pads. The informed guesses for the other thresholds (e.g., LT) could be set as a percent of ST based on the median values in
Figure 3b. Such initial estimates could shorten the time needed for electrode calibration. In general, there is a tradeoff between optimizing the perception of stimuli and minimizing the time required for calibration. This study shows that, at least in terms of stimuli discrimination, there is little to be gained through careful adjustment of stimulation amplitude. In future studies, we plan to investigate how the robustness of spatial discrimination over a large amplitude range can be further exploited to simplify the calibration of a multi-pad electrotactile interface.


 ,
, 


