Article

A Simple Approach for Counting CD4+ T Cells Based on a Combination of Magnetic Activated Cell Sorting and Automated Cell Counting Methods

1
Key Laboratory of Enzyme and Protein Technology, VNU University of Science, Vietnam National University, 334 Nguyen Trai Street, Thanh Xuan Dist, Hanoi 100000, Vietnam
2
National Hospital for Tropical Diseases, No. 78 Giai Phong Street, Hanoi 100000, Vietnam
3
Nano and Energy Center, VNU University of Science, Vietnam National University, 334 Nguyen Trai Street, Thanh Xuan Dist, Hanoi 100000, Vietnam
4
Faculty of Physics, VNU University of Science, Vietnam National University, 334 Nguyen Trai Street, Thanh Xuan Dist, Hanoi 100000, Vietnam
*
Authors to whom correspondence should be addressed.
Submission received: 7 September 2021 / Revised: 15 October 2021 / Accepted: 18 October 2021 / Published: 20 October 2021

Abstract

:
Frequent tests for CD4+ T cell counting are important for the treatment of patients with immune deficiency; however, the routinely used fluorescence-activated cell-sorting (FACS) gold standard is costly and the equipment is only available in central hospitals. In this study, we developed an alternative simple approach (shortly named as the MACS-Countess system) for CD4+ T cell counting by coupling magnetic activated cell sorting (MACS) to separate CD4+ T cells from blood, followed by counting the separated cells using CountessTM, an automated cell-counting system. Using the cell counting protocol, 25 µL anti-CD4 conjugated magnetic nanoparticles (NP-CD4, BD Bioscience) were optimized for separating CD4+ T cells from 50 µL of blood in PBS using a DynamagTM-2 magnet, followed by the introduction of 10 µL separated cells into a CountessTM chamber slide for automated counting of CD4+ T cells. To evaluate the reliability of the developed method, 48 blood samples with CD4+ T cell concentrations ranging from 105 to 980 cells/µL were analyzed using both MACS-Countess and FACS. Compared with FACS, MACS-Countess had a mean bias of 3.5% with a limit of agreement (LoA) ranging from −36.4% to 43.3%, which is close to the reliability of the commercial product, PIMA analyzer (Alere), reported previously (mean bias 0.2%; LoA ranging from −42% to 42%, FACS as reference). Further, the MACS-Countess system requires very simple instruments, including only a magnet and an automated cell counter, which are affordable for almost every lab located in a limited resource region.

1. Introduction

To support the treatment of HIV/AIDS and other deficient immune diseases, CD4+ T cell counts are frequently monitored using highly reliable equipment. HIV selectively infects and kills CD4+ T cells and causes the gradual death of this cell population [1]. Thus, CD4+ T cell concentrations reflect the immune status of patients; in HIV-infected individuals, CD4+ T cell counts are usually lower than 500 cells/µL of blood and patients who progress to AIDS have fewer than 200 cells/µL [2]. Most patients living with HIV/AIDS receive antiretroviral treatment, and initiation of antiretroviral therapy (ART) is recommended based on the CD4+ T cell count threshold [3]. The CD4+ T cell count also reduces in the case of severe acute respiratory syndrome coronavirus (SARS-CoV) infection, especially in severe and critically ill SARS-CoV-2 patients [4,5]. Proposed mechanisms by which CD4+ T cells are lost during SARS-CoV infection are direct invasion [6], T cell exhaustion [7,8] or apoptosis [9], etc. Usually, CD4+ T cell counting is performed on a FACS system, also known as the gold standard method for cell sorting and enumeration. The key mechanism of cell sorting by FACS is that fluorescence-labeled antibodies recognize and bind specifically to markers expressed on cells; the cells are then passed through single-cell flow and fluorescence signals are detected using a laser beam. To count CD4+ T cells, fluorescence-labeled anti CD4 antibodies are used to recognize the CD4 markers on targeted cells. Though the CD4 marker is typical for CD4+ T cells, other cell types such as dendritic cells and monocytes also express CD4 but at lower levels [10]. Therefore, to confirm whether the separated cells are actually CD4+ T cells, a mixture of distinctive fluorescent dyes conjugated with CD4 and CD3 monoclonal antibodies is usually used for targeting the corresponding markers on CD4+ T cells, which do not co-appear on other cells expressing CD4 alone.
For diagnostic purposes, many factors are of great concern. The first and utmost important is the result reliability, followed by a short time for obtaining results as well as low cost, and availability. The FACS method has excellent reliability [11], but is rather complicated and thus requires technicians who are properly trained. Further, the high cost of reagents and maintenance is an additional cause leading to the unavailability of FACS in limited resource regions. Thus, a system that can perform CD4+ T cell counts, which is fast, cheap, reliable, and easy to handle, is urgently needed.
Several commercial point-of-care (POC) products for counting CD4 are already available including the CyFlow miniPOC (Partec), Pima analyzer (Alere), and CD4 Counter (Daktari). The frequently utilized technology for cell counting in these systems is the fluorescence-based method; for example, PIMA uses disposable cartridges which enable fluorescence labeling of CD4+ T cells, followed by signal collection to discriminate labeled cells from others [12]. Notably, PIMA has been reported in numerous studies to have high homology with the standard FACS methods and can thus be a candidate for alternative CD4 counting [13,14]. However, these instruments and their accompanying non-recyclable materials are still expensive compared with the affordability of medical sectors with limited resources, mostly because of optic combined fluidic technology, which requires quality control of all parts, calibration, and stringent reagent and test components during storage, which may be interrupted, as indicated by error codes [15]. Over time, one of these parts can be damaged and require replacement [16], consequently increasing the test costs. Another technology, magnetic-activated cell sorting (MACS), is an alternative and simple approach for the development of CD4+ T cell counting devices.
The mechanism by which MACS separates the target cells of interest resembles FACS in that it uses antibodies (Ab), which can recognize cell surface markers, but these are alternatively conjugated to magnetic particles (MPs) rather than to fluorescent dyes; magnetically labeled cells are then sorted using an external magnetic field. Using specific antigen–antibody recognition, MPs can be applied to separate a wide range of immune cell types once conjugated with Abs. For example, MPs conjugated with EpCAM antibody or anti-HER2 are used to separate rare cancer cells [17,18]; MPs conjugated with protein A are used for separation of monocytes and B-Lymphocytes [19] from blood samples, and anti-Salmonella-labeled MPs can be used to isolate harmful bacteria from food products [20]. Currently, there are many commercially available kits for the specific purification of CD4+ T cells. Typically, as illustrated by the Anti-Human CD4 Particles kit (BD Bioscience), CD4+ T cells are purified through a 2-step approach: first, about 2–4 mL of blood input is first pre-separated by sucrose-gradient centrifugation on a swing-out centrifuge to obtain peripheral blood mononuclear cells (PBMCs); CD4+ T cells are then specifically captured by anti-CD4 conjugated nanoparticles (NP-CD4), and then separated using a magnet. Another kit enables CD4+ T cell separation using combined streptavidin-conjugated particles and anti CD4-biotin (Dynabeads® FlowComp™ Human CD4, Invitrogen, Waltham, MA, USA): first, CD4-Biotin is incubated with 2 mL blood samples. Next, the cell sample is subjected to a short centrifugation so that cells can precipitate to the bottom of the sample tube, and excessive antibodies are removed after discarding the supernatant. Magnetic particles conjugated with streptavidin (MP-streptavidin) are then incubated with the sample to allow interaction of streptavidin and biotin. Finally, the MP-strep-bio-CD4 cell complexes are separated using a magnetic field. This format was used by Carinelli et al. for the semi-quantification of CD4+ T cells [21]. Magnetic-based cell separation systems have a simpler format compared with fluorescence-based methods, but the greatest obstacle preventing MACS to be applied in diagnostics is its fluctuating cell separation efficiency, followed by labor-extensive procedures. Despite being introduced as early as the nineteenth century [22], the application of MACS in diagnosis has still been limited. The main reason for this is that cells must be separated with stable efficiency so that the original cell counts can be calculated. In addition, the aforementioned procedure for cell separation remains complicated and/or requires a large sample input.
In an attempt to reduce the gap between MACS utilization and CD4+ T cell counting applications, we developed a CD4+ T cell counting system based on a simple MACS-separation for CD4+ T cells using a small blood input required, followed by automated cell counting. As CD4+ T cells are selectively isolated through the MACS process, the subsequent identification of cell types is not required, allowing the use of automated cell counting on CountessTM in the final step. CountessTM performs cell counting using image capture and analysis software. Cells within are defined using proper circular shape and diameter settings. As CountessTM only requires a digital camera for bright field recording, it is much less complicated than a fluorescent optic system that requires lasers, filters, and highly sensitive cameras.

2. Materials and Methods

2.1. Materials

Blood samples from healthy volunteers were collected by technicians at the National Hospital for Tropical Diseases under the protocol approved in ethics approval number IRB-VN01.001/IRB00003121/FWA 00004148 from the Ethics Committee at the Hanoi Medical University. The samples were collected between June and December 2020, stocked in K2 EDTA tubes, and processed within 24 h. Lymphocyte Separating Medium, Pancoll human (PAN Biotech, Aidenbach, Germany) was used for isolating PBMCs from total blood cells. Tritest reagent (BD Biosciences, Becton, San Jose, CA, USA) containing fluorescence-labeled antibodies including CD45-PerCP/CD4-FITC/CD3-PE, was used to label cells in the FACS method using the FACSCalibur system and Multiset software (BD Biosciences). FACS Lysis Solution 10X Concentrate (BD Biosciences) was diluted to 1X concentration by adding 9 mL of distilled water to 1 mL of 10X solution, and used to lyse red blood cells in the FACS method. Trucount tubes (BD Biosciences) with a predefined number of fluorescence beads were used as a reference to determine the absolute number of cells in FACS analysis. Anti CD4 Abs labeled with FITC and anti CD3 Abs labeled with PE (CD4-FITC, CD3-PE, Thermo Fisher Scientific, Waltham, MA, USA) were used for immunofluorescence staining. Anti-Human CD4 Particles—DM (NP-CD4) from BD Biosciences were used for cell capture and separation using a Dynamag™-2 magnet (Thermo Scientific), and were then counted using CountessTM, an automated cell-counting machine. A hemocytometer (Paul Marienfeld, Lauda-Königshofen, Germany) was used to estimate the cell concentration in the sample after PBMC isolation under a Primo Star (2) Microscope (Carl Zeiss, Oberkochen, Germany). Phosphate buffered saline (PBS, pH 7.4) supplemented with 0.5% BSA and 2 mM EDTA (PBS*) was used as a buffer for the incubating and washing steps.

2.2. Isolation of Peripheral Blood Mononuclear Cells (PBMC) from Whole Blood by Sucrose Gradient Centrifugation

PBMCs were isolated from blood by sucrose gradient centrifugation using the Pancoll Human Kit (PAN-Biotech). Briefly, approximately 4 mL of blood was collected in K2 EDTA tubes and diluted 2-fold with PBS. Diluted blood was then carefully layered on 8 mL Pancoll solution such that the two phases were separated. After centrifugation at 800× g on an Eppendorf 5810R for 20 min, brake = 0, and at room temperature, four fractions were separated from top to bottom: yellow serum, opaque white PBMCs, clear white Pancoll solution, and red blood cells. The PBMC phase was harvested into a new centrifuge tube using a pipette and was then filled with two- to three-fold volume of PBS, followed by centrifugation at 300× g for 10 min. After centrifugation, the cell pellet was precipitated at the bottom and the supernatant was discarded. The washing step was repeated once again for purified PBMCs.

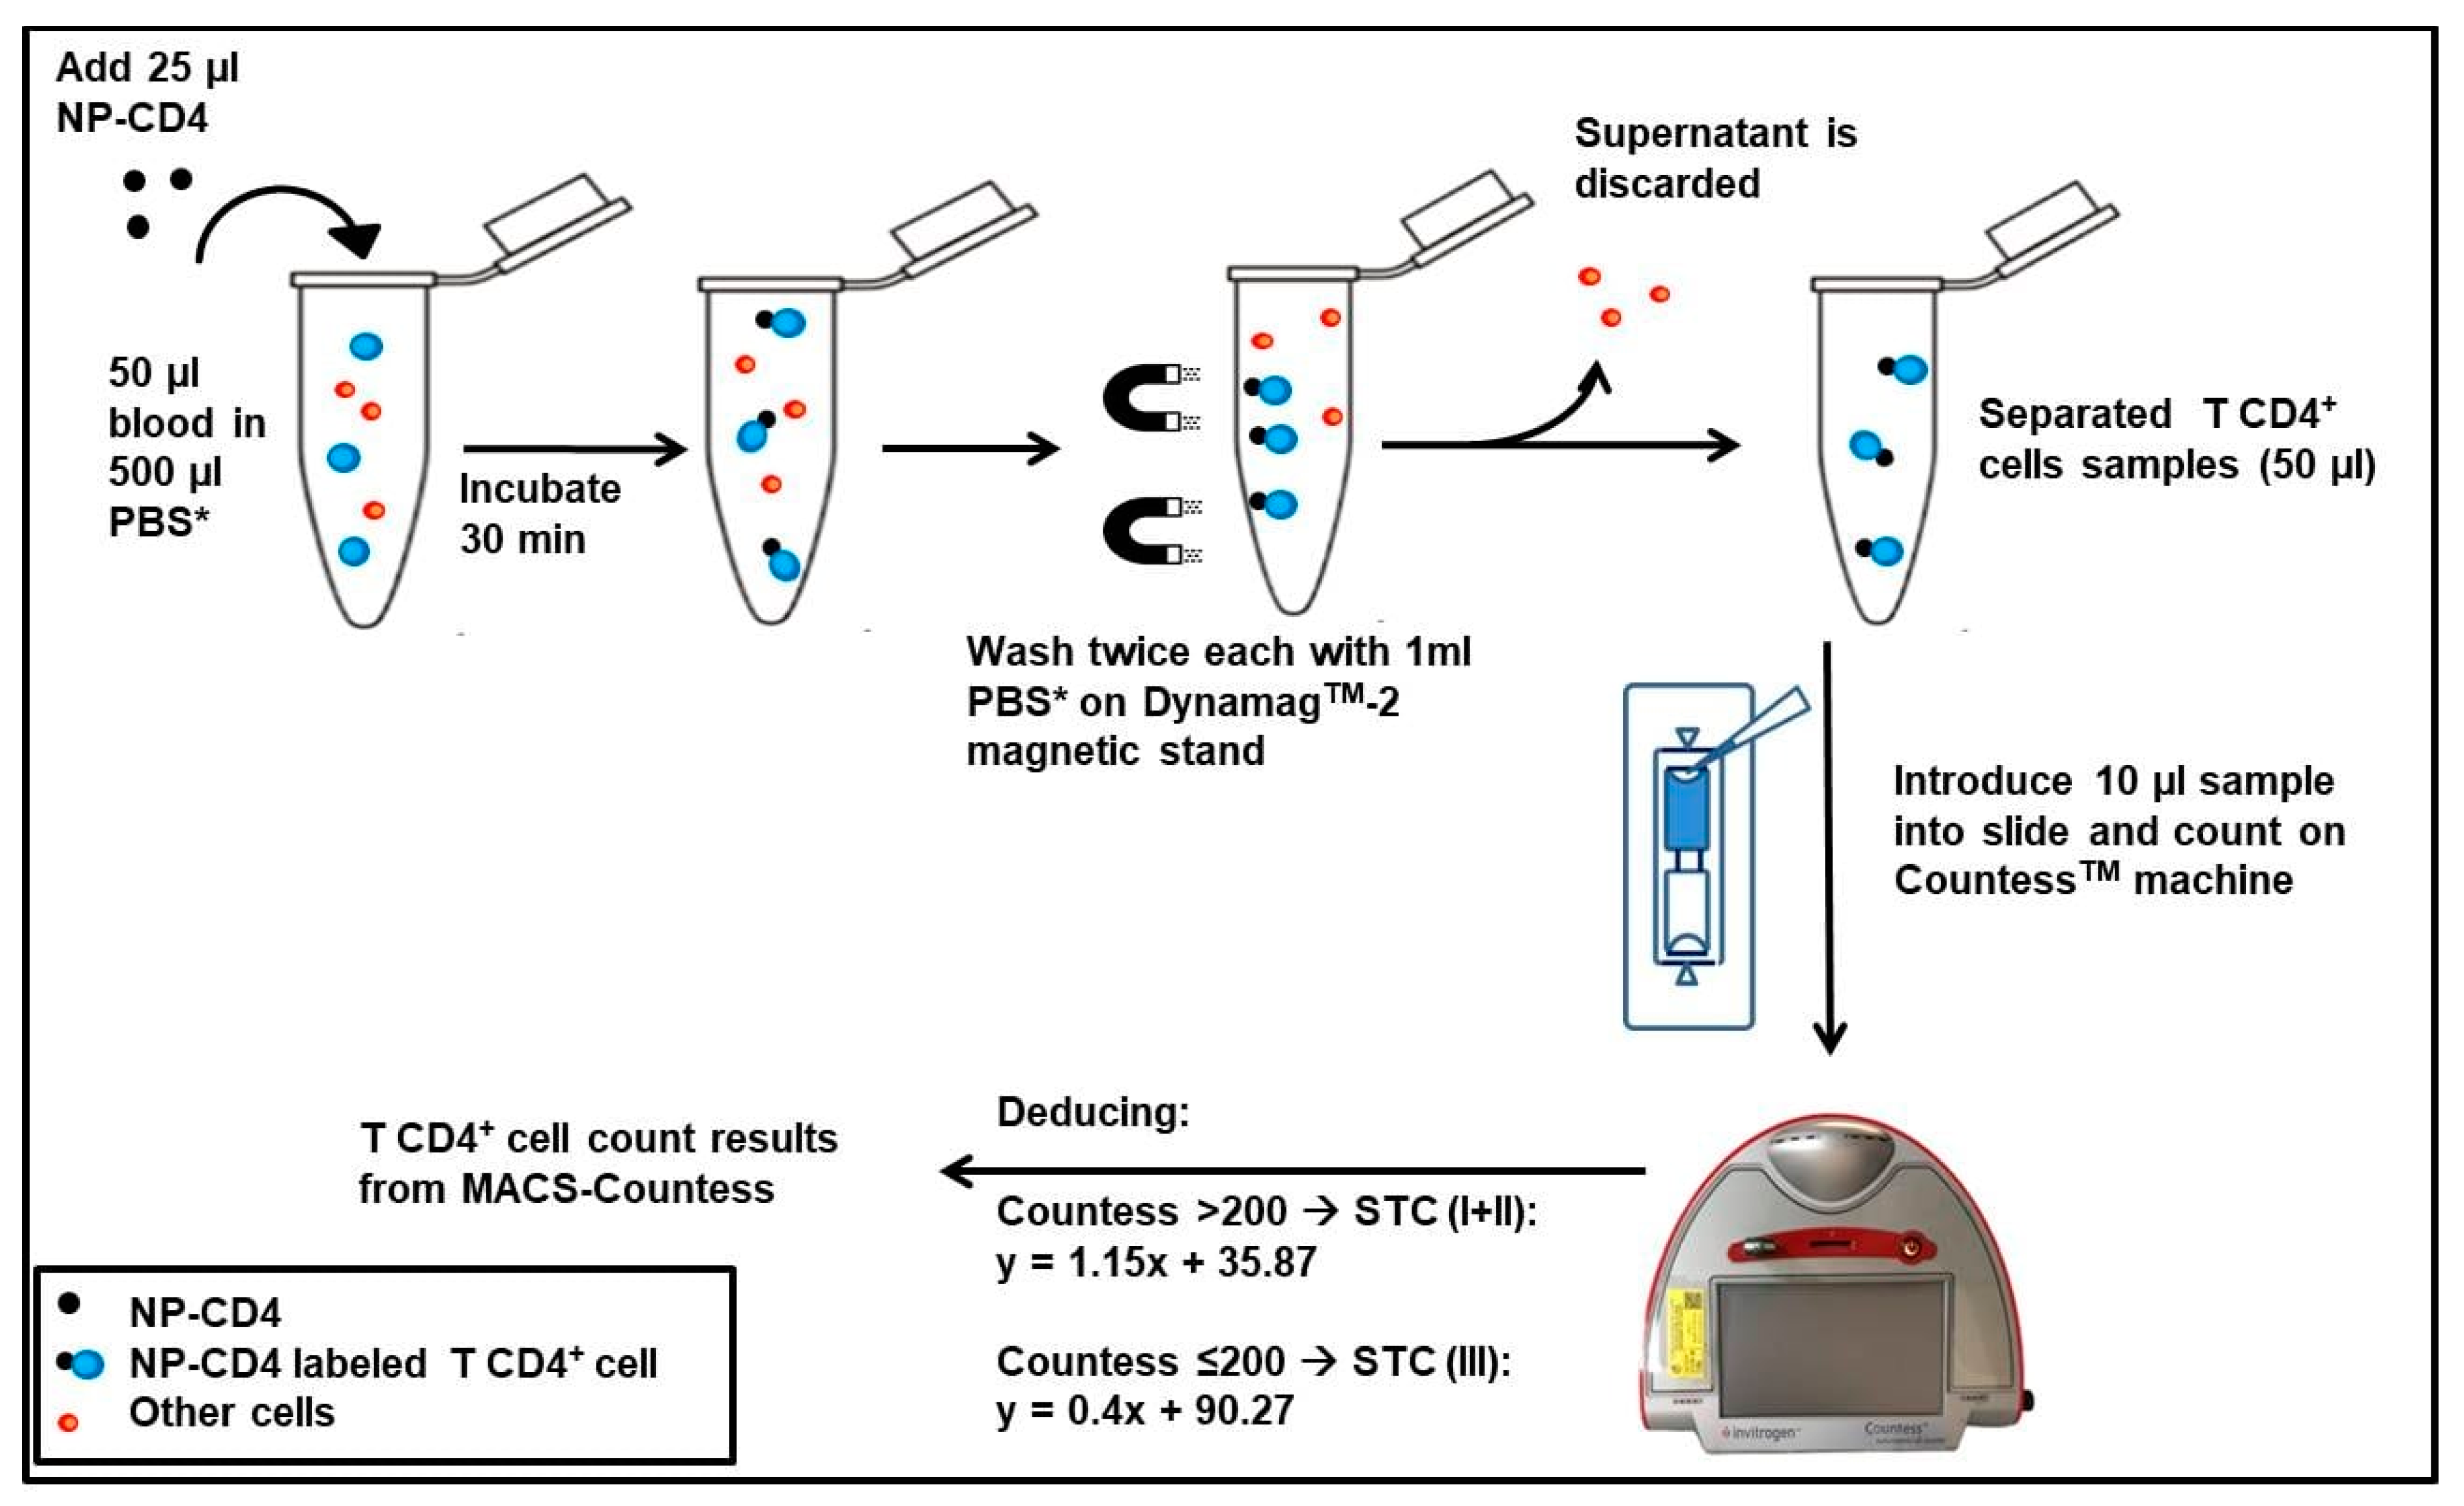
2.3. Isolation of CD4+ T Cells from PBMCs and Whole Blood Using Anti-CD4 Antibodies Conjugated with Magnetic Nanoparticles

As a conventional method, approximately 107 PBMCs previously isolated from whole blood were incubated in 1 mL PBS with 50 µL NP-CD4 for 30 min. The sample suspension was then placed on a Dynamag™-2 magnet for 10 min, following which the supernatant was discarded. The washing steps were performed twice by repeating washes with 1 mL PBS, placing the tube on the magnet for 7 min, and discarding the supernatant. The cell sample was finally resuspended in 1 mL PBS*. Separation efficiency (SE) was calculated as the ratio of the number of CD4+ T cells separated by the number of CD4+ T cells in the sample before separation.
MACS separation of CD4+ T cells from whole blood was performed using the same procedure as the conventional method, but with various ratios of blood input and NP-CD4. To find the optimal sample volume input, either 10 or 50 µL of blood with different cell concentrations were selected for CD4+ T cell separation using 10 or 50 µL of NP-CD4. Next, different NP-CD4 volumes were tested for cell separation, and the best working ratio was chosen. Separated cell samples in each experiment were analyzed by FACS to obtain the number of targeted cells after separation, and the separation efficiency was calculated. Parameters were selected based on separation of CD4+ T cells with high and stable efficiency using MACS.
To mimic the CD4+ T cell concentrations in the blood of HIV-infected individuals (200–600 cells/µL) or patients with AIDS (<200 cells/µL), and considering the limited biosafety levels for handling lethal infectious agents, whole blood was diluted 2-, 6-, and 12-fold, undiluted blood from healthy donors had CD4+ T cell concentrations ranging from to 600–1200 cells/µL.

2.4. Fluorescence-Activated Cell Sorting (FACS) and Flow Cytometry Analysis of Cell Population before and after Cell Separation

A total of 50 µL of cell samples (before or after MACS-separation) were incubated with 20 µL Tritest reagent in the Trucount tube for 15 min in the dark, followed by the addition of 450 µL lysis solution for fixing the cell-antibody complexes and lysing red blood cells in the samples. After 15 min, the samples were run on a FACSCalibur system, and the obtained data were further analyzed using Multiset software.

2.5. Immunofluorescence Labeling of Cell Population before and after Cell Separation

Twenty microliters of cell samples (before or after MACS-separation) were incubated with 5 µL CD4-FITC and 5 µL CD3-PE (Thermo Fisher Scientific) for 20 min in the dark, followed by the addition of formalin to the final concentration of 0.18% and incubation for another 10 min. Samples were centrifuged at 1500 rpm for 3 min then the supernatants were discarded to remove any excess antibodies that was not labeled to cells. Finally, fluorescence tagged cells fraction were re-suspended in 20 µL of PBS*. Fluorescence signals were observed under Axio Observer Co Apotome II (Carl Zeiss) fluorescence microscope at 20× magnification.

2.6. Cell Enumeration on CountessTM Automated Cell Counter

For cell counting on CountessTM, 10 µL of the sample was introduced into a CountessTM chamber slide, which was then inserted into the readout inlet of the CountessTM machine. In the preview mode, the focus was adjusted such that the cell margin appeared as clear as possible. The diameter was chosen to be 6–15 µm and the circularity was set at 75% to exclude any contaminants outside the range. Circularity was intentionally not set at an absolute 100% as the integrity of the cell’s round shape may be affected during the MACS process or by image distortion.

2.7. Statistical Analysis

The bias of MACS-Countess against FACS was calculated as the ratio between the difference in cell count from MACS-Countess compared with that from FACS to the average cell count of the two methods as a percentage [23]. The correlation coefficient was used to assess the strength of the relationship between MACS-Countess and FACS, whereas the Bland–Altman plot was used to assess the agreement between the two methods; for each pair of cell count values, the average was calculated and then plotted on a graph as the mean against bias [23,24]. Mean bias and standard deviation (SD) were determined. The limit of agreement (LoA) (upper and lower) was referred by adding or subtracting the mean bias with 1.96 SD (mean bias ± 1.96 × SD).
Percentage similarity (PS) analysis was generated to directly compare both methods, and was calculated as the ratio between the average cell counts from the two methods and the reference method to percentages [25]. The mean percentage similarity (MPS) and SD were estimated, and the coefficient of variance (CV) was calculated as the ratio of SD to MPS in percentage.
The sensitivity, specificity, and misclassification rate [26] were also calculated at the threshold ≤350 cells/µL and ≤500 cells/µL, as at these cut-off values, initiation of ART is recommended for the treatment of HIV-infected patients [27]. The number of true positives (TP), true negatives (TN), false positives (FP), and false negatives (FN) were determined. The TP at a particular cut-off, for instance, <350 (cells/µL), is defined as the case when FACS returns the cell count value of <350 (therefore eligible for ART treatment or “positive”) whereas MACS-Countess also returned a cell count <350 (true prediction of positive case). Similarly (at cut-off 350), TN, FP, and FN are defined as the case when FACS and MACS-Countess return cell count values of >350 and >350, >350 and <350, and <350 and >350 (cells/µL), respectively. Sensitivity was then calculated as the ratio of TP to the sum of TP and FN, whereas specificity was the ratio between TN and the sum of TN and FP. The upward misclassification rate was calculated as 1 minus sensitivity, whereas the downward misclassification rate was calculated as 1 minus specificity. Positive Predictive Value (PPV) was calculated as the ratio between TP and the sum of TP and FP; Negative Predictive Value (NPV) was the ratio between TN and the sum of TN and FN. The same was carried out for the cut-off 500 cells/µL.

3. Results

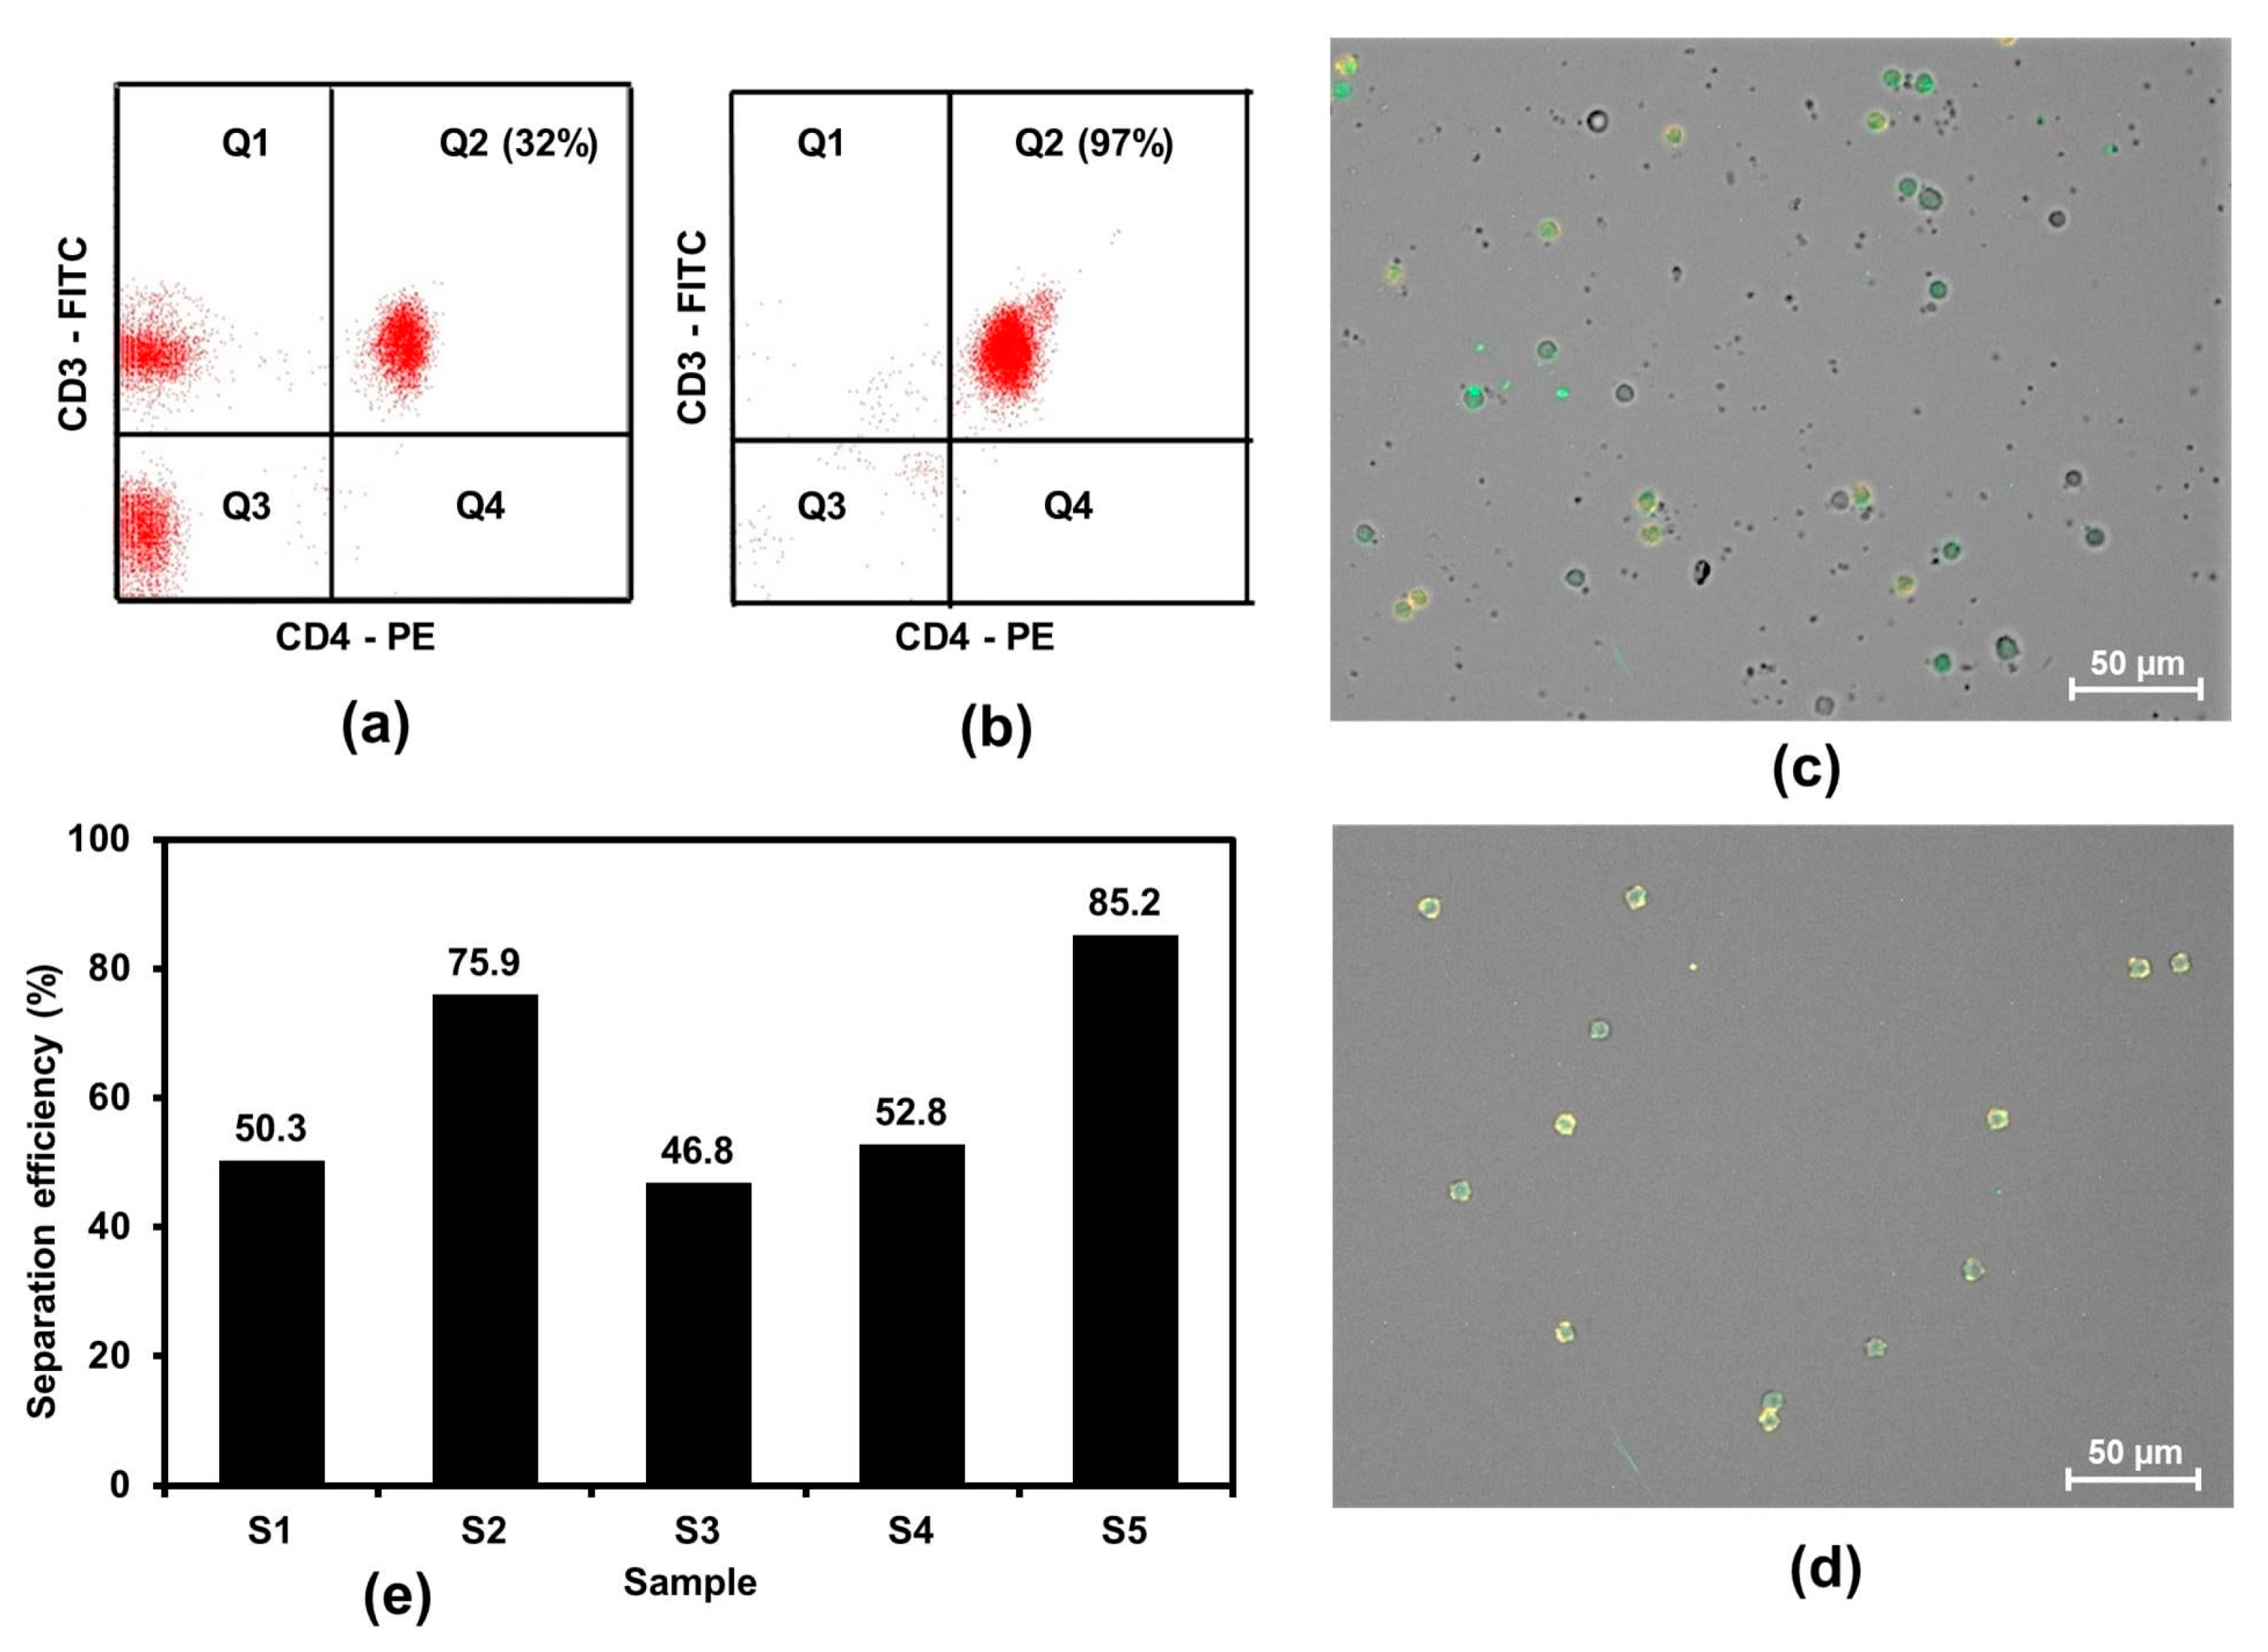
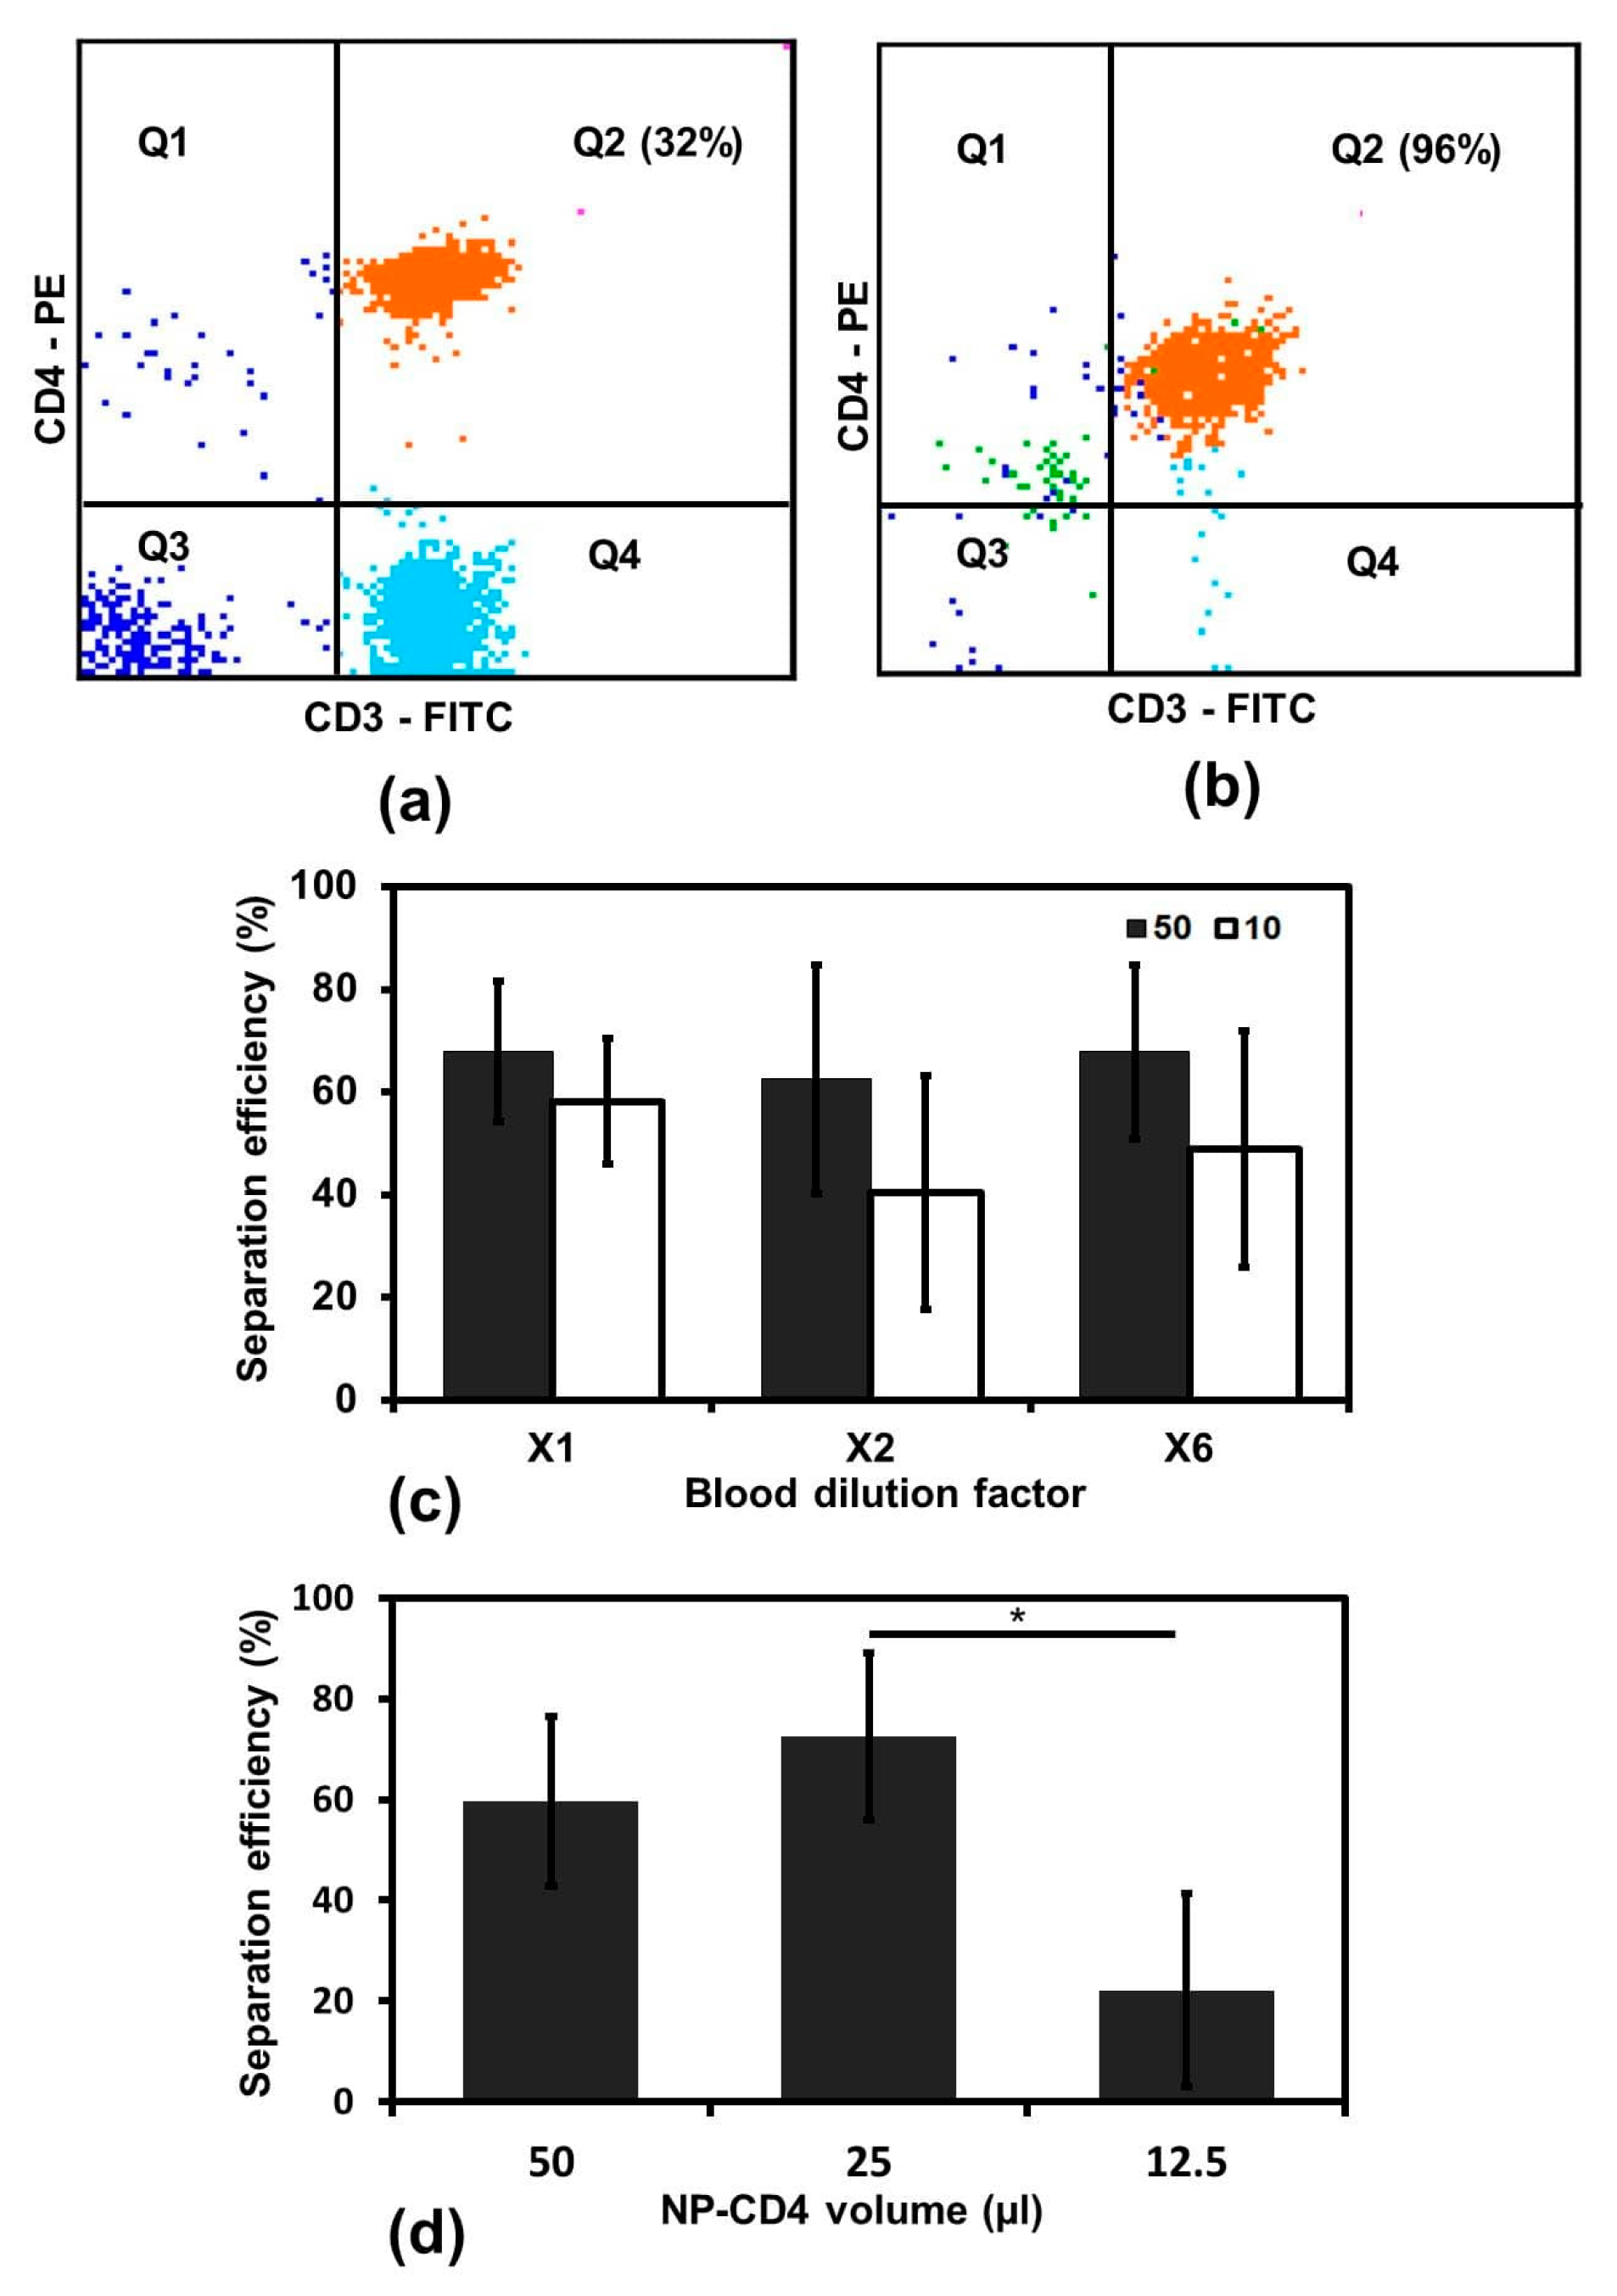
3.1. Separation of CD4+ T Cells from PBMCs Using NP-CD4

We aimed to establish a counting system that accurately determines CD4+ T cells in the whole blood. PBMC is known to be rich in CD4+ T cells (35%, [28]); therefore, to test the performance of NP-CD4 for the targeted cells, we first performed CD4+ T cell separation from PBMCs according to the recommended protocol.
As shown in Figure 1a,b, NP-CD4 had very high specificity for targeted cell capturing as CD4+ T cells accounted for >95% of the total lymphocyte population after the purification process, whereas only 32% of the population before separation was detected as CD4+ T cells. Further, we stained PBMCs and the separated cells with fluorescence-labeled CD4-FITC (green signal) and CD3-PE (red signal) antibodies and observed fluorescence emitting cells under a fluorescence microscope (Axio Observer Co Apotome II, Carl Zeiss). In this case, the monocytes emitted only green signals and CD4+ T cells emitted both green and red fluorescent signals, which were represented as green- and yellow-colored cells, respectively, in merged images under different light source illumination. Figure 1 indicated that the yellow-colored CD4+ T cells only form a minor part (Figure 1c), whereas after cell separation, they form the major population (Figure 1d). The cell separation efficiency in five samples ranged from 46.2–85.2% (Figure 1e).
This result suggests that the procedure recommended by the manufacturer is of good quality for CD4+ T cell purification. However, this procedure requires a very large blood volume and complex instruments such as a swing-out centrifuge for operation. In the subsequent experiments, we tried to improve the cell separation conditions to be oriented for diagnostic purposes.

3.2. Optimizing Variation for CD4+ T Cell MACS Separation

To be applicable for diagnosis, the MACS procedure needs to separate CD4+ T cells directly from a small volume of blood (<100 µL) so that sample processing is both labor-saving, convenient, and fast for obtaining data. Therefore, we optimized the blood volume input and the NP-CD4 volume used. Similar to cell separation performance from PBMC, the isolated cells from blood were also primarily CD4+ T cells (>95% population) as confirmed by FACS analysis (Figure 2a,b), suggesting that non-specific binding of NP-CD4 with monocytes and dendritic cells is negligible in a cell counting assay. Therefore, we continued to develop a CD4+ T cell separation assay without the need for a monocyte-depletion step.
As the CD4+ T cell concentration in a deficient immune system, such as in HIV-infected individuals, ranges from approximately 100 to less than 600 cells/µL, we used either 50 µL or 10 µL of blood with three dilution levels: undiluted (X1) and diluted twice (X2) or diluted sixth fold (X6) for MACS separation so that the concentration of CD4+ T cells in the sample covers the range of 100–600 cells/µL.
During the washing step, certain cell–NP-CD4 complexes were washed away as they did not bind strongly enough to the magnetic stand, and thus a small portion of complexes was lost, which interfered with the final separation efficiency (SE). As presented in Figure 2a, 50 µL of blood input had a tendency of higher separation efficiency and stability compared with 10 µL blood input, from all 3 dilution levels: X1 (67.9 ± 13.6% vs. 58.2 ± 12.3%), X2 (62.5 ± 22.2% vs. 40.4 ± 22.8%), and X6 (67.9 ± 16.9% vs. 48.9 ± 22.9%).
We continued to test different amounts of NP-CD4 for separating CD4+ T cells from 50 µL of undiluted blood. Three different NP-CD4 volumes (50, 25, and 12.5 µL) were chosen. As shown in Figure 2b, the separation efficiency was not linear with respect to the amount of NP-CD4 in this range. While the use of 50 or 25 µL NP-CD4 for MACS separation was not significantly different, the use of 12.5 µL NP-CD4 showed a significantly lower efficiency (p < 0.05). In detail, 50 µL NP-CD4 was more than saturated for cell capture because 25 µL NP-CD4 provided a similar SE (72.4 ± 16.6%) to that of 50 µL (59.7 ± 16.8%) (Figure 2b). The use of 12.5 µL NP-CD4 gained only 22.1 ± 19.1% SE (p < 0.05), indicating that the amount of NP-CD4 separated by this volume is insufficient for capturing the targeted cells in the samples. We thus conclude that a blood volume input of 50 µL and a NP-CD4 volume of 25 µL are optimal for good cell separation performance.

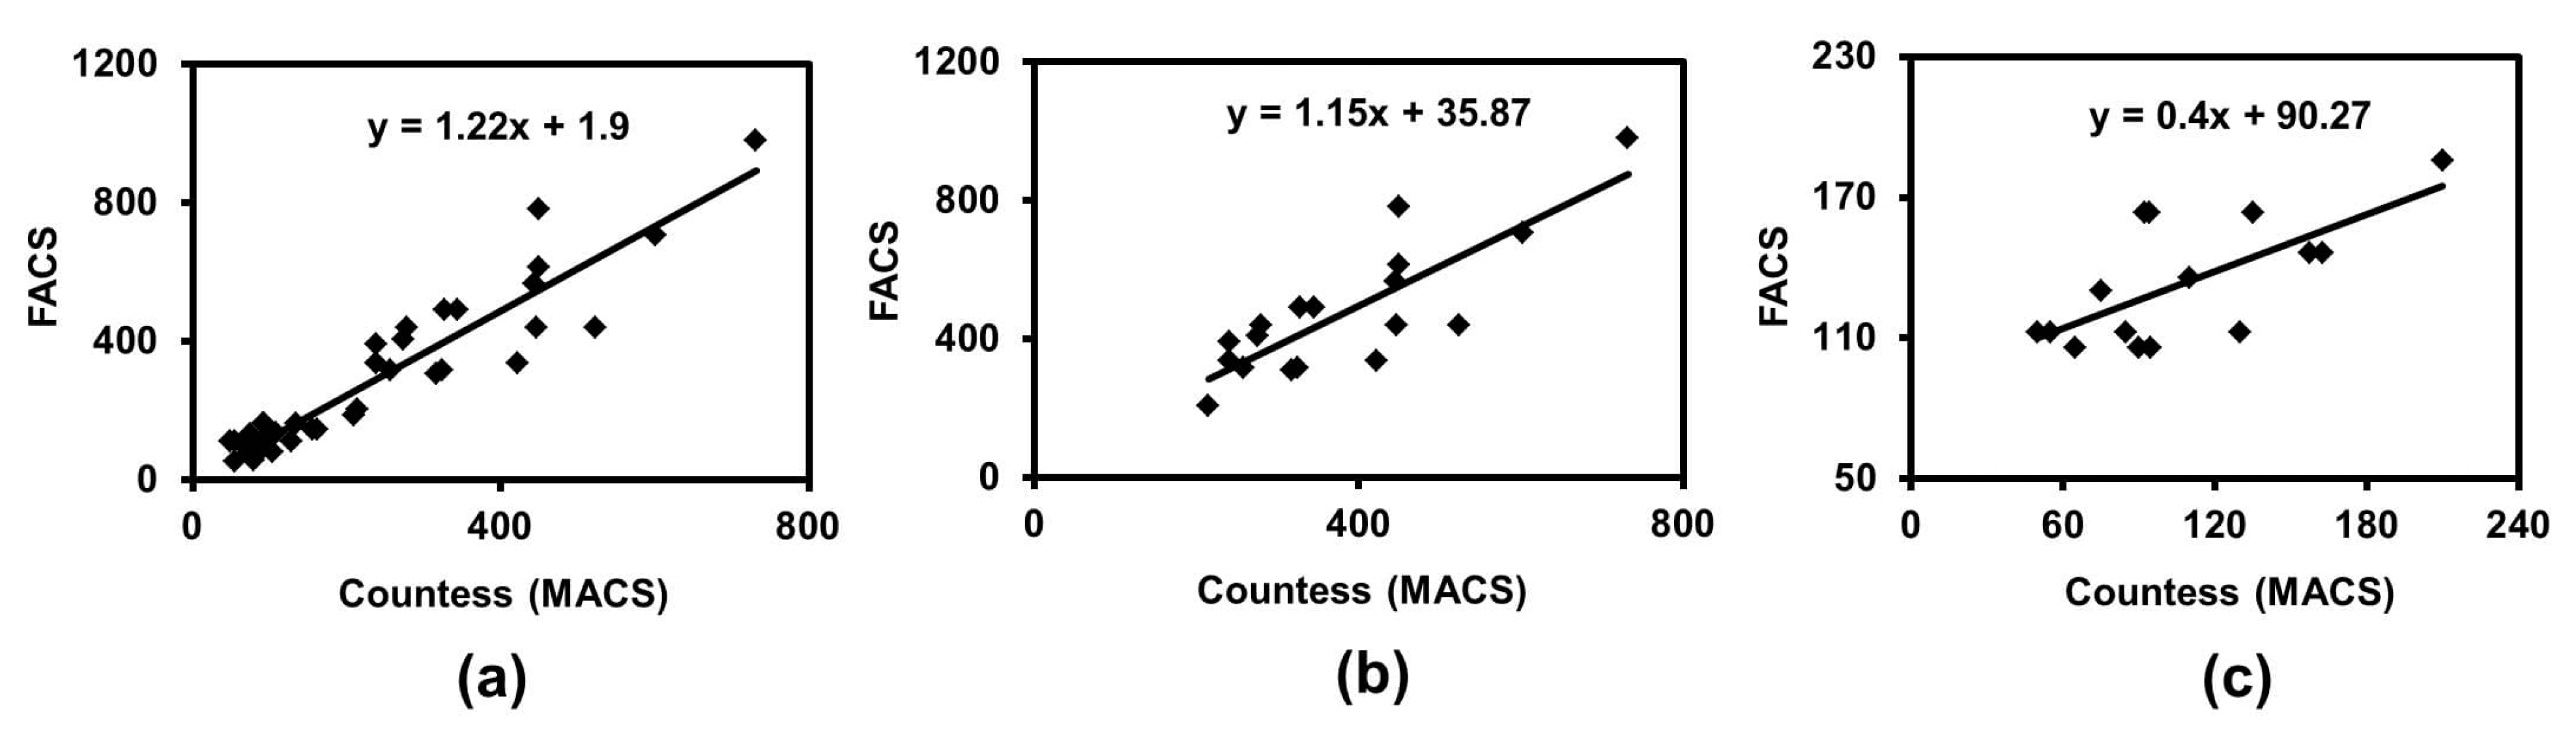
3.3. Comparison between MACS-Countess to FACS Methods

First, the linear regression plot between CD4+ T cells counted on CountessTM (Countess results) after MACS separation and the CD4+ T cells counted by FACS was generated. From that the experimental standard curves (STC) between two methods (n = 38) were yielded and correction factors for the MACS-Countess system were determined (Figure 3). After that, 15 samples with known CD4+ T cell concentration values from FACS analysis were analyzed on MACS-Countess, and CD4+ T cell counts were deduced using the correction factor of the STC (Table 1).

3.3.1. Generating STCs between Countess (MACS) and FACS

In all, 38 samples with different CD4+ T cell concentrations were analyzed using the FACS system and the optimized MACS-separation procedure (50 µL blood input, 25 µL NP-CD4). The regression plot of CD4+ T cell counts from the two methods was generated using Microsoft Excel. We focused on the CD4+ T cell concentration from 600 to 100 cells/µL, as this is the reported cell concentration range in blood samples of patients with immunodeficiency. We also tested the MACS separation in blood samples with cell concentrations as low as <100 cells/µL to determine if MACS-Countess can return good results. Thus, we divided 38 samples into 4 groups based on the frequencies of CD4+ T cell counts found in HIV-infected patients: group I contained 4 samples with CD4+ T cell concentrations >600 cells/µL (undiluted blood), group II contained 14 samples with cell concentration 600–200 cells/µL (2-fold diluted blood), group III contained 15 samples with cell concentration 200–100 cells/µL (6-fold diluted blood), and group IV contained 5 samples with cell concentration <100 cells/µL (12-fold diluted blood). Thus, Figure 3a represents a linear regression equation for all samples from the four groups, which is y = 1.22x + 1.9, where x is the number of CD4+ T cell counts in samples after MACS separation and y is that with FACS. Upon further analysis for particular groups as shown in Figure 3b,c, two STCs were obtained: Groups I and II shared the same STC (I + II), which was y = 1.15x + 35.87 (Figure 3b), whereas the STC (III) for group III was y = 0.4x + 90.27 (Figure 3c).
Unfortunately, for group IV with extremely low CD4+ T cell counts, the error of MACS-Countess compared with FACS was very large because of the diversified plot (highest error of 72%, data not shown); therefore, it does not ensure the accuracy of cell counting at this threshold. Therefore, we concluded that the developed MACS-Countess system has a limit of detection (LOD) of 100 cells/µL.
Finally, considering all the data shown in Figure 2, we demonstrate the operation scheme of the MACS-Countess system, as illustrated in Figure 4.

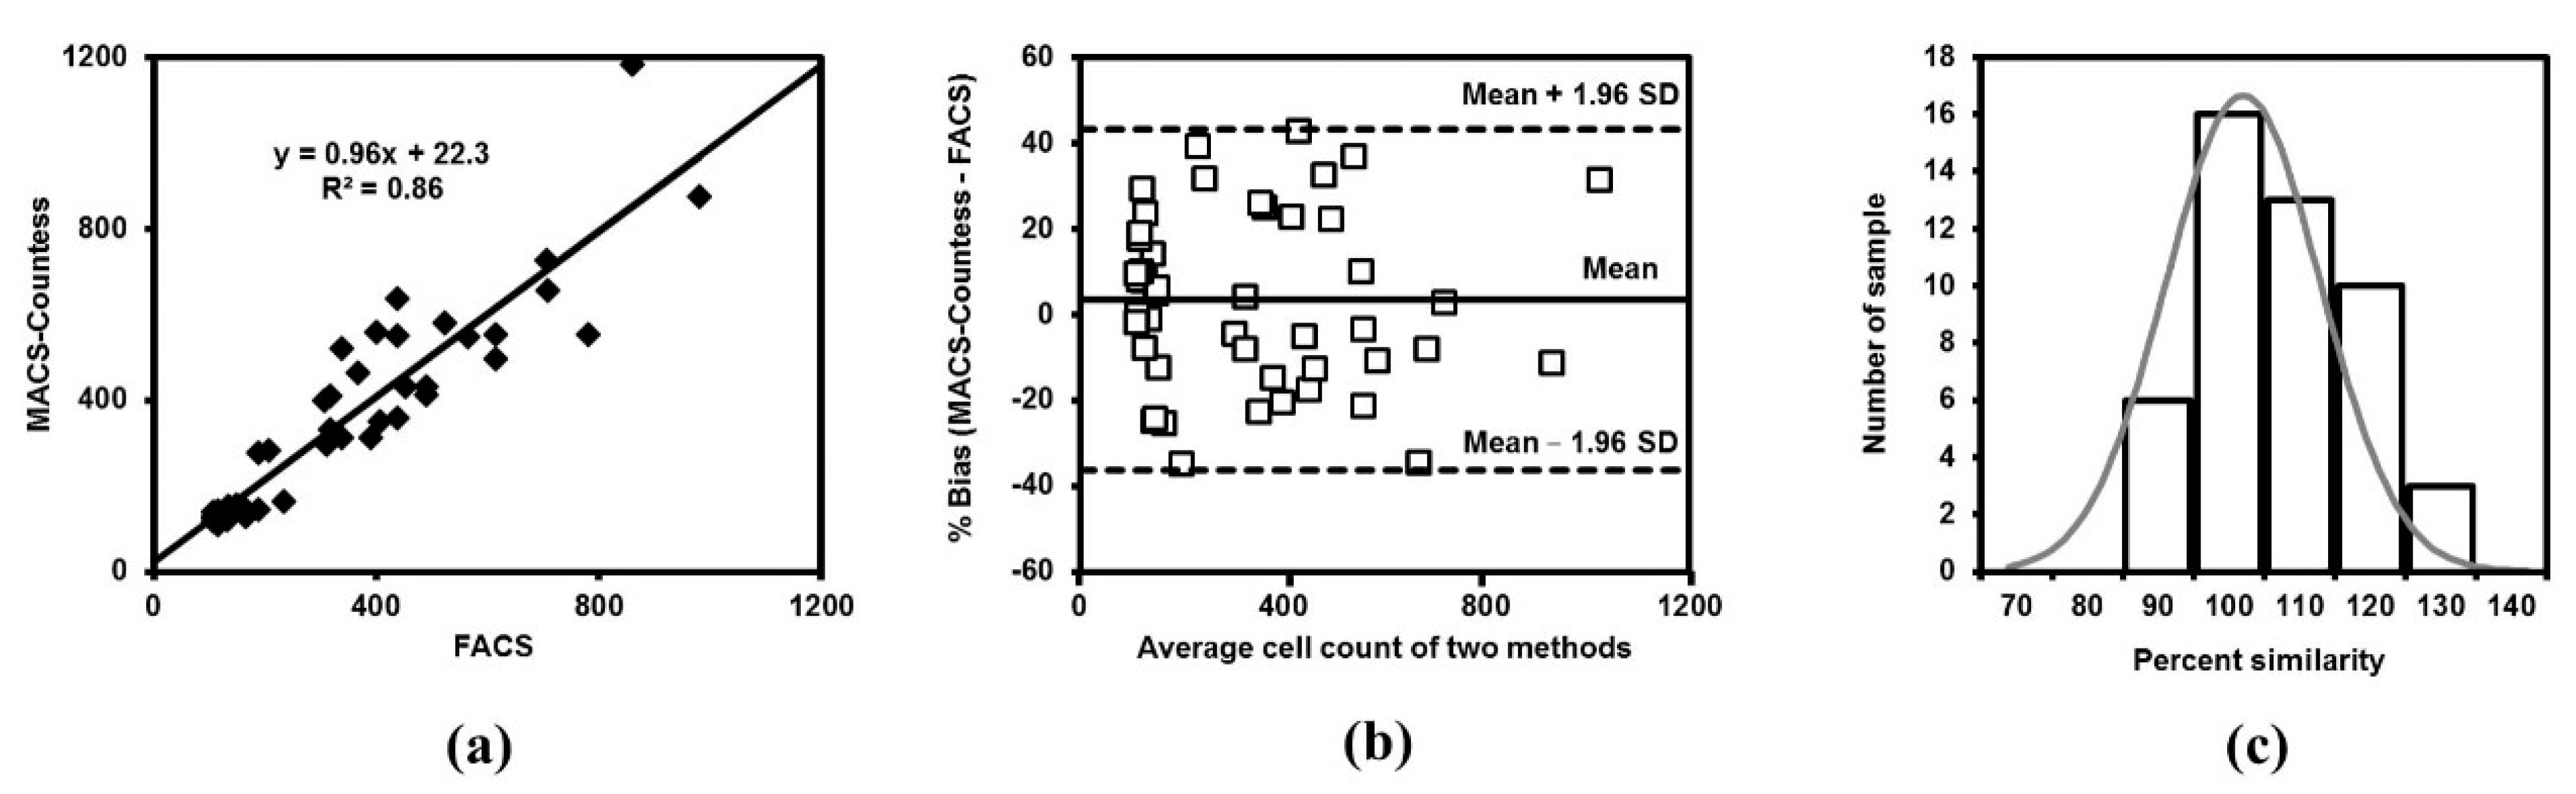
3.3.2. MACS-Countess Compared with FACS

After determining the STCs and operation scheme of the MACS-Countess system, we performed CD4+ T cell counting using the MACS-Countess system on 15 samples, including 9 samples with CD4+ T of >200 cells/µL (belonging to groups I + II) and the other six samples of 100–200 cells/µL (belonging to group III). The original CD4+ T cell counts in the blood of each group were deduced from the experimental values using the corresponding STCs, as mentioned above. CD4+ T cell counts by MACS-Countess and their deduced values, CD4+ T cell counts by FACS, and the bias of the deduced values compared with the FACS values in each sample group are listed in Table 1. We found that the biases ranged from −34.8% to 32.7% in group I + II and from −25.1% to 29.3% in group III.
By adding 33 samples used for generating STCs (38 samples excluding 5 samples with blood concentrations of <100 cells/µL) to these 15 samples, a total of 48 samples was used for deducing the CD4+ T cell counts in blood based on the MACS-Countess method (in brief, deduced MACS-Countess) to evaluate the reliability of this method compared with FACS (in brief, FACS). Linear regression showed that the deduced MACS-Countess had a good correlation with FACS, with an R2 equals to 0.86, slope of 0.96, and y-intercept of 22.3 (Figure 5a). We also compared the agreement of the deduced MACS-Countess with the PIMA analyzer, which is a commercially launched product for CD4+ T cell counting, using FACS as a reference. It has been reported that PIMA is comparable to conventional FACS with a mean bias of 0.2% and LoA from −42% to 42% in the field setting evaluation [13]. Meanwhile, the mean bias of the deduced MACS-Countess was 3.5% and LoA ranged from −36.4% to 43.3% (Figure 5b). The mean percentage similarity (MPS) of MACS-Countess was 102.9% with a coefficient of variance (CV) equaling 10.6% (Figure 5c), which is slightly different from that of PIMA with an MPS of 96.4% and CV of 13.1% [14]. The mean bias at cut-off <350 cells/µL of MACS-Countess was 6.4%, which was not significantly different from that at the cut-off of <500 cells/µL (5.4%, p < 0.05), suggesting that a good cell count performance is ensured at both low and high cell concentrations. The MPS of MACS-Countess at the two thresholds were 104.3% and 103.9%, respectively, and were not significantly different (p < 0.05).
Sensitivity, specificity, PPV, NPV, and misclassification rates were calculated to better understand the diagnostic results (Table 2). MACS-Countess deduced a good specificity of 94.7% at a cut-off of 350 cells/µL; however, the sensitivity was only 89.7%. This led to an upward misclassification rate of 10.3% and a downward misclassification rate of 5.3%. This means that among cases predicted to be eligible for ART treatment according to the reference method due to a CD4+ T cell count of <350 cells/µL, 10.3% of the cases would be falsely predicted (deduced by MACS-Countess) to be >350 and misclassified as ineligible until the next test. Additionally, at this threshold MACS-Countess had PPV and NPV of 96.3% and 85.7%, respectively. The PIMA system has either lower or similar upward misclassification values (0–10.4%) with a sensitivity of 89.6 to 100% [29,30], whereas it has a lower PPV at 91.2% and a higher NPV at 92.3% [31,32]. As the cut-off increases to 500 cells/µL, the specificity of MACS-Countess decreases to 88.9%, whereas the sensitivity remains 89.7%, which are not much different from those of PIMA, which are 95.5% and 84.2%, respectively [30].

4. Discussion

In this research, we used Anti-Human CD4 Particles—DM (NP-CD4, BD Biosciences) for capturing CD4+ T cells with a specificity higher than 95% from PBMCs sample (Figure 1a,b). Specificity of cell separation from whole blood sample as high as >95% was also confirmed (Figure 2a,b). This high selectivity could be attributed to a higher level of CD4+ biomarker expression on the surface of CD4+ T cells than on the surface of other cells, resulting in a stronger interaction affinity of the NP-CD4 with CD4+ T cells than with monocytes and dendritic cells. The optimal number of anti-CD4 molecules per nanoparticle of NP-CD4 could thus be a major factor in its high specificity.
Compared with the conventional method requiring 4 mL blood input, the optimized MACS procedure enables the separation of CD4+ T cells directly from a small blood volume of 50 µL, making the method friendly to patients. Further, the optimized procedure does not require a centrifugation process, resulting in a considerably shorter time and less labor for performing, while greatly reducing the risk of sample contamination to the environment.
The simplicity and small scale of the optimized MACS procedure are also available for further development for other applications, such as integration into microfluidic systems for automated operation. Microfluidic devices specifically for bio-separation have been developed for fractionation of CD34+ cells [33], rare cancer cells [34], and for capturing bacteria [35]. It is thus obvious that automation could reduce manual work and, therefore, decrease the errors originating from manual operation while increasing batch analysis. This study also provides a reproducible model of applying MACS to diagnosis with a simple cell isolation process, whereas a minimum of complicated instruments is required. Using a similar format, many other diagnostic tests can be developed by simply changing the antibody conjugated to the magnetic nanoparticles. The limit of detection of this assay is estimated to be 100 cells/µL and the assay accuracy deteriorates below this threshold. HIV-infected individuals with cell counts below 200 cells/µL have severe immunodeficiency and are usually susceptible to opportunistic infections. The treatment regimens for these patients in such circumstances are based on the type of opportunistic disease and/or CD4+ T cell counts mostly at a threshold of 100 cells/µL, as in yalaromycosis, Toxoplasma gondii encephalitis, cryptosporidiosis, and so on, a threshold of 150 cells/µL such as in histoplasmosis, or higher [36]. This LOD threshold is also sufficient enough to aid to assess the immune status of patient with severe SARS-CoV-2 infection because they usually have significantly lower CD4+ T cell counts (<200 cells/µL) than for mild-to-moderate group (<400 cells/µL) [4,5,37]. Lower CD4+ T cell counts also associated with higher mortality during disease treatment [5,38]. Furthermore, He et al. [37] has reported that among severe patients, the improved subgroup has a T lymphocyte count gradually back to a normal range within 15–25 days, while that of the dead subgroup keeps falling until death. These highlighted the need of monitoring CD4+ T cell counts in the treatment of COVID-19 patients having severe symptoms. Therefore, we consider that doctors can still refer to test results using the MACS-Countess method to make treatment decisions, or use this method for screening purposes.
In terms of accuracy, MACS-Countess showed high agreement with the gold standard FACS method with a mean bias of 3.5% and LoA from −36.4% to 43.3%. This is comparable to the commercially launched product, PIMA analyzer, which has a mean bias of 0.2% and LoA from −42% to 42% in the field setting evaluation (with FACS as the reference method).
Compared with the PIMA analyzer, MACS-Countess has slightly poorer sensitivity, resulting in a higher misclassification rate. This is reasonable as PIMA tends to underestimate the cell count with an MPS of 96.37% compared with 102.3% for MACS-Countess. Therefore, the upward misclassification rate of MACS-Countess can be reduced once the MPS is less than 100%. In practice, many other non-flow cytometric platforms tend to underestimate the CD4+ T cell counts. Underestimation would decrease the upward misclassification while increasing the downward misclassification, which will benefit the earlier initiation of ART. Lutwama et al. reported that Dynabeads (Dynal T4 Count, Dynal Biotech, Oslo, Norway) have a good sensitivity of 94% at a cut-off of <350 cells/µL. The specificity, however, is poor at 69% as Dynabeads highly underestimate the cell count, as illustrated by a low slope of 0.85 and the absolute mean difference (FACS—Dyna) of 8.8 cells/µL [39]. In the same report, the FDA-approved Cytospheres (CD4 Manual Count, Beckman Coulter, CA, USA) also repeat the same pattern with a high sensitivity yet low specificity, very low slope, and high absolute difference compared with the reference method at 99%, 32%, 0.58, and 58.6 cells/µL, respectively [39]. Conversely, a high positive bias leads to low sensitiity, typically illustrated by PointCare NOW (PointCare), also an FDA-approved platform [40], with a mean relative bias of 35% and a mean sensitivity of only 53% [41].
Based on these analyzed data, the MACS-Countess can be considered an alternative simple method for diagnostic purposes and is affordable for limited resource areas where expensive conventional FACS methods are unavailable.
To enable cell count by FACS, a center has to invest at least USD 27000 to buy a cytometer. In addition, the complexity of the fluidic system and optical system of the cytometer restricts its use to situations where the support of well-qualified technicians is present. In contrast, the MACS-Countess is very easy to access as the system requirements simply include: (i) a strong magnet for placing 1.5 mL microcentrifuge tubes that cost only several hundred US dollars, and (ii) an automated cell counter of only about USD 5000–6000, both of which are cost-effective and affordable for hospitals with limited resources. It is estimated that a CD4+ T cell counting test with MACS-Countess would cost less than USD 10 (the cost of 25 µL NP-CD4 accounts for USD 5). Meanwhile, the cost of a test based on the FACS method includes fluorescent-labeled antibodies, Trucount tubes, the fluid needed to run the cytometer machine (shutdown solution, clean solution, etc.) and cytometer maintenance and calibration, which is estimated to range roughly from USD 18—on the FACSCount system—to USD 30–40 on the FACSCalibur/FACSCanto system (these costs were estimated based on the import prices of reagents and consumables into Vietnam, which may not be universal).

5. Conclusions

In this study, we developed a simple and low-cost MACS-Countess system for the CD4+ T cell counting method. Using FACS as the reference method, MACS-Countess performance in blood covering the entire clinical range of CD4+ T cell concentration (105–980 cells/µL) has good reliability with a mean bias of 3.5% and LoA from −36.4% to 43.3%) along with good diagnostic performance with a sensitivity of 89.7% and specificity of >88.9% (n = 48), comparable to that of the commercially available point-of-care PIMA analyzer. With relatively good accuracy and affordable instrument requirements including a magnet and automated cell counter, the MACS-Countess offers a simple CD4+ T cell counting method that is suitable for resource-limited areas, where the gold standard FACS method is neither available nor affordable. This model is not only limited to CD4+ T counting, but can also be applied for counting other types of immune cells or cancer cells.

Author Contributions

Conceptualization, A.T.V.N., N.H.N. and H.T.T.P.; Data curation, N.D.V., H.T.L. and H.T.T.P.; Formal analysis, N.D.V. and H.T.T.P.; Funding acquisition, N.H.N.; Investigation, A.T.V.N. and H.T.T.P.; Methodology, A.T.V.N. and H.T.T.P.; Project administration, A.T.V.N. and N.H.N.; Resources, N.D.V., A.T.V.N., H.T.L. and H.T.T.P.; Supervision, H.T.T.P.; Validation, N.D.V. and N.H.N.; Visualization, N.D.V.; Writing—original draft, N.D.V. and H.T.T.P.; Writing—review and editing, A.T.V.N., N.H.N. and H.T.T.P. All authors have read and agreed to the published version of the manuscript.

Funding

This research was funded by the Ministry of Science and Technology of Vietnam (grant number ĐTĐL.CN-02/18).

Institutional Review Board Statement

All subjects gave their informed consent for inclusion before they participated in the study. The study was conducted in accordance with the Declaration of Helsinki, and the protocol was approved by the Ethics Committee of Hanoi Medical University, No. IRB-VN01.001/IRB00003121/FWA 00004148.

Informed Consent Statement

Informed consent was obtained from all subjects involved in the study.

Data Availability Statement

The data used to support the findings of this study are available from the corresponding author upon request.

Acknowledgments

We thank Ta Thi Anh May and Nguyen Ngoc Lan for their technical assistance.

Conflicts of Interest

The authors declare no conflict of interest.

References

  1. Klatzmann, D.; Barre-Sinoussi, F.; Nugeyre, M.T.; Danquet, C.; Vilmer, E.; Griscelli, C.; Brun-Veziret, F.; Rouzioux, C.; Gluckman, J.C.; Chermann, J.-C.; et al. Selective tropism of lymphadenopathy associated virus (LAV) for helper-inducer T lymphocytes. Science 1984, 225, 59–63. [Google Scholar] [CrossRef] [PubMed]
  2. Haase, A.T. Population biology of HIV-1 infection: Viral and CD4+ T cell demographics and dynamics in lymphatic tissues. Annu. Rev. Immunol. 1999, 17, 625–656. [Google Scholar] [CrossRef] [PubMed]
  3. Song, A.; Liu, X.; Huang, X.; Meyers, K.; Oh, D.-Y.; Hou, J.; Xia, W.; Su, B.; Wang, N.; Lu, X.; et al. From CD4-based initiation to treating all HIV-infected adults immediately: An evidence-based meta-analysis. Front. Immunol. 2018, 9, 212. [Google Scholar] [CrossRef] [PubMed] [Green Version]
  4. Wang, Q.Q.; Yao, Y.M.; Huang, Z.Y.; Cao, J.T.; Zhu, C.W.; Yu, K.H.; Pan, J.; Hu, B.J. Low CD4 T cell count predicts radiological progression in severe and critically ill COVID-19 patients: A case control study. J. Thorac. Dis. 2021, 13, 4723–4730. [Google Scholar] [CrossRef] [PubMed]
  5. Hoffmann, C.; Casado, J.L.; Härter, G.; Vizcarra, P.; Moreno, A.; Cattaneo, D.; Meraviglia, P.; Spinner, C.D.; Schabaz, F.; Grunwald, S.; et al. Immune deficiency is a risk factor for severe COVID-19 in people living with HIV. HIV Med. 2021, 22, 372–378. [Google Scholar] [CrossRef]
  6. Chu, H.; Zhou, J.; Wong, B.H.-Y.; Li, C.; Chan, J.F.-W.; Cheng, Z.-S.; Yang, D.; Wang, D.; Lee, A.C.-Y.; Li, C.; et al. Middle East respiratory syndrome coronavirus efficiently infects human primary T lymphocytes and activates the extrinsic and intrinsic apoptosis pathways. J. Infect. Dis. 2016, 213, 904–914. [Google Scholar] [CrossRef] [PubMed] [Green Version]
  7. Diao, B.; Wang, C.; Tan, Y.; Chen, X.; Liu, Y.; Ning, L.; Chen, L.; Li, M.; Liu, Y.; Wang, G.; et al. Reduction and functional exhaustion of T cells in patients with coronavirus disease 2019 (COVID-19). Front. Immunol. 2020, 11, 827. [Google Scholar] [CrossRef]
  8. De Biasi, S.; Meschiari, M.; Gibellini, L.; Bellinazzi, C.; Borella, R.; Fidanza, L.; Gozzi, L.; Iannone, A.; Tartaro, D.L.; Mattioli, M.; et al. Marked T cell activation, senescence, exhaustion and skewing towards TH17 in patients with COVID-19 pneumonia. Nat. Commun. 2020, 11, 3434. [Google Scholar] [CrossRef]
  9. De Wit, E.; Van Doremalen, N.; Falzarano, D.; Munster, V.J. SARS and MERS: Recent insights into emerging coronaviruses. Nat. Rev. Microbiol. 2016, 14, 523–534. [Google Scholar] [CrossRef]
  10. Filion, L.G.; Izaguirre, C.A.; Garber, G.E.; Huebsh, L.; Aye, M.T. Detection of surface and cytoplasmic CD4 on blood monocytes from normal and HIV-1 infected individuals. J. Immunol. Methods 1990, 135, 59–69. [Google Scholar] [CrossRef]
  11. Schnizlein-Bick, C.T.; Spritzler, J.; Wilkening, C.L.; Nicholson, J.K.A.; O’Gorman, M.R.G. Evaluation of TruCount absolute-count tubes for determining CD4 and CD8 cell numbers in human immunodeficiency virus-positive adults. Clin. Diagn. Lab. Immunol. 2000, 7, 336–343. [Google Scholar] [CrossRef] [Green Version]
  12. Glynn, M.T.; Kinahan, D.J.; Ducrée, J. CD4 counting technologies for HIV therapy monitoring in resource-poor settings–state-of-the-art and emerging microtechnologies. Lab Chip 2013, 13, 2731–2748. [Google Scholar] [CrossRef]
  13. Thakar, M.; Mahajan, B.; Shaikh, N.; Bagwan, S.; Sane, S.; Kabra, S.; Rewari, B.; Shaukat, M.; Singh, N.; Trevor, P.; et al. Utility of the point of care CD4 analyzer, PIMA, to enumerate CD4 counts in the field settings in India. AIDS Res. Ther. 2012, 9, 26. [Google Scholar] [CrossRef] [Green Version]
  14. Sukapirom, K.; Onlamoon, N.; Thepthai, C.; Polsrila, K.; Tassaneetrithep, B.; Pattanapanyasat, K. Performance evaluation of the Alere PIMA CD4 test for monitoring HIV-infected individuals in resource-constrained settings. JAIDS J. Acquir. Immune Defic. Syndr. 2011, 58, 141–147. [Google Scholar] [CrossRef]
  15. Pham, M.D.; Agius, P.A.; Romero, L.; McGlynn, P.; Anderson, D.; Crowe, S.M.; Luchters, S. Acceptability and feasibility of point-of-care CD4 testing on HIV continuum of care in low and middle income countries: A systematic review. BMC Health Serv. Res. 2016, 16, 343. [Google Scholar] [CrossRef] [Green Version]
  16. Larson, B.; Schnippel, K.; Ndibongo, B.; Long, L.; Fox, M.P.; Rosen, S. How to estimate the cost of point-of-care CD4 testing in program settings: An example using the Alere PimaTM analyzer in South Africa. PLoS ONE 2012, 7, e35444. [Google Scholar]
  17. Kang, J.H.; Krause, S.; Tobin, H.; Mammoto, A.; Kanapathipillai, M.; Ingber, D.E. A combined micromagnetic-microfluidic device for rapid capture and culture of rare circulating tumor cells. Lab Chip 2012, 12, 2175–2181. [Google Scholar] [CrossRef] [PubMed]
  18. Xu, H.; Aguilar, Z.P.; Yang, L.; Kuang, M.; Duan, H.; Xiong, Y.; Wei, H.; Wang, A. Antibody conjugated magnetic iron oxide nanoparticles for cancer cell separation in fresh whole blood. Biomaterials 2011, 32, 9758–9765. [Google Scholar] [CrossRef] [PubMed] [Green Version]
  19. Yoshino, T.; Hirabe, H.; Takahashi, M.; Kuhara, M.; Takeyama, H.; Matsunaga, T. Magnetic cell separation using nano-sized bacterial magnetic particles with reconstructed magnetosome membrane. Biotechnol. Bioeng. 2008, 101, 470–477. [Google Scholar] [CrossRef] [PubMed]
  20. Zheng, Q.; Mikš-Krajnik, M.; Yang, Y.; Xu, W.; Yuk, H.-G. Real-time PCR method combined with immunomagnetic separation for detecting healthy and heat-injured Salmonella Typhimurium on raw duck wings. Int. J. Food Microbiol. 2014, 186, 6–13. [Google Scholar] [CrossRef] [PubMed]
  21. Carinelli, S.; Xufre, C.; Alegret, S.; Marti, M.; Pividori, M.I. CD4 quantification based on magneto ELISA for AIDS diagnosis in low resource settings. Talanta 2016, 160, 36–45. [Google Scholar] [CrossRef] [PubMed]
  22. Zeb, Q.; Wang, C.; Shafiq, S.; Liu, L. An overview of single-cell isolation techniques. In Single-Cell Omics; Academic Press: Cambridge, MA, USA, 2019; pp. 101–135. [Google Scholar]
  23. Pollock, M.A.; Jefferson, S.G.; Kane, J.W.; Lomax, K.; MacKinnon, G.; Winnard, C.B. Method comparison—A different approach. Ann. Clin. Biochem. 1992, 29, 556–560. [Google Scholar] [CrossRef] [PubMed]
  24. Bland, J.M.; Altman, D. Statistical methods for assessing agreement between two methods of clinical measurement. Lancet 1986, 327, 307–310. [Google Scholar] [CrossRef]
  25. Scott, L.E.; Galpin, J.S.; Glencross, D.K. Multiple method comparison: Statistical model using percentage similarity. Cytom. Part B Clin. Cytom. J. Int. Soc. Anal. Cytol. 2003, 54, 46–53. [Google Scholar] [CrossRef]
  26. Stevens, W.; Gelman, R.; Glencross, D.K.; Scott, L.E.; Crowe, S.M.; Spira, T. Evaluating new CD4 enumeration technologies for resource-constrained countries. Nat. Rev. Microbiol. 2008, 6, S29–S38. [Google Scholar] [CrossRef]
  27. Peeling, R.W.; Sollis, K.A.; Glover, S.; Crowe, S.M.; Landay, A.L.; Cheng, B.; Barnett, D.; Denny, T.N.; Spira, T.J.; Stevens, W.S.; et al. CD4 enumeration technologies: A systematic review of test performance for determining eligibility for antiretroviral therapy. PLoS ONE 2015, 10, e0115019. [Google Scholar] [CrossRef] [Green Version]
  28. Kleiveland, C.R. Peripheral blood mononuclear cells. In The Impact of Food Bioactives on Health: In Vitro and Ex Vivo Models; Springer: Cham, Switzerland, 2015; pp. 161–167. [Google Scholar]
  29. Mwau, M.; Adungo, F.; Kadima, S.; Njagi, E.; Kirwaye, C.; Abubakr, N.S.; Okubi, L.A.; Waihenya, M.; Lusike, J.; Hungu, J. Evaluation of PIMATM® point of care technology for CD4 T cell enumeration in Kenya. PLoS ONE 2013, 8, e67612. [Google Scholar]
  30. Makadzange, A.T.; Bogezi, C.; Boyd, K.; Gumbo, A.; Mukura, D.; Matubu, A.; Ndhlovu, C.E. Evaluation of the FACSPresto, a new point of care device for the enumeration of CD4% and absolute CD4+ T cell counts in HIV infection. PLoS ONE 2016, 11, e0157546. [Google Scholar]
  31. Pinto, I.C.; Sabidó, M.; Pereira, A.B.; Mello, M.B.; de Melo Xavier Shimizu, A.; Protti, B.L.; Benzaken, A.S. Field evaluation of a point-of-care CD4 analyzer for monitoring HIV patients in the interior of the Amazon region, Brazil. PLoS ONE 2015, 10, e0121400. [Google Scholar] [CrossRef]
  32. Elharti, E.; Abbadi, H.; Bensghir, R.; El Filali, K.M.; Elmrabet, H.; Oumzil, H. Assessment of two POC technologies for CD4 count in Morocco. AIDS Res. Ther. 2020, 17, 31. [Google Scholar] [CrossRef]
  33. Schneider, T.; Karl, S.; Moore, L.R.; Chalmers, J.J.; Williams, P.S.; Zborowski, M. Sequential CD34 cell fractionation by magnetophoresis in a magnetic dipole flow sorter. Analyst 2010, 135, 62–70. [Google Scholar] [CrossRef] [PubMed] [Green Version]
  34. Pratt, E.D.; Huang, C.; Hawkins, B.G.; Gleghorn, J.P.; Kirby, B.J. Rare cell capture in microfluidic devices. Chem. Eng. Sci. 2011, 66, 1508–1522. [Google Scholar] [CrossRef] [PubMed] [Green Version]
  35. Yang, L.; Banada, P.P.; Chatni, M.R.; Lim, K.S.; Bhunia, A.K.; Ladisch, M.; Bashir, R. A multifunctional micro-fluidic system for dielectrophoretic concentration coupled with immuno-capture of low numbers of Listeria monocytogenes. Lab Chip 2006, 6, 896–905. [Google Scholar] [CrossRef] [PubMed]
  36. Kaplan, J.E.; Benson, C.; Holmes, K.K.; Brooks, J.T.; Pau, A.; Masur, H.; Centers for Disease Control and Prevention (CDC); National Institutes of Health; HIV Medicine Association of the Infectious Diseases Society of America. Guidelines for prevention and treatment of opportunistic infections in HIV-infected adults and adolescents: Recommendations from CDC, the National Institutes of Health, and the HIV Medicine Association of the Infectious Diseases Society of America. MMWR Recomm. Rep. 2009. Available online: https://pubmed.ncbi.nlm.nih.gov/19357635/ (accessed on 17 October 2021).
  37. He, R.; Lu, Z.; Zhang, L.; Fan, T.; Xiong, R.; Shen, X.; Feng, H.; Meng, H.; Lin, W.; Jiang, W.; et al. The clinical course and its correlated immune status in COVID-19 pneumonia. J. Clin. Virol. 2020, 127, 104361. [Google Scholar] [CrossRef] [PubMed]
  38. Wen, X.; Jiang, D.; Gao, L.; Zhou, J.; Xiao, J.; Cheng, X.; He, B.; Chen, Y.; Lei, P.; Tan, X.; et al. Clinical characteristics and predictive value of lower CD4+ T cell level in patients with moderate and severe COVID-19: A multicenter retrospective study. BMC Infect. Dis. 2021, 21, 57. [Google Scholar] [CrossRef]
  39. Lutwama, F.; Serwadda, R.; Mayanja-Kizza, H.; Shihab, H.M.; Ronald, A.; Kamya, M.R.; Thomas, D.; Johnson, E.; Quinn, T.C.; Moore, R.D.; et al. Evaluation of Dynabeads and Cytospheres compared with flow cytometry to enumerate CD4+ T cells in HIV-infected Ugandans on antiretroviral therapy. J. Acquir. Immune Defic. Syndr. 2008, 48, 297. [Google Scholar] [CrossRef] [Green Version]
  40. Boyle, D.S.; Hawkins, K.R.; Steele, M.S.; Singhal, M.; Cheng, X. Emerging technologies for point-of-care CD4 T-lymphocyte counting. Trends Biotechnol. 2012, 30, 45–54. [Google Scholar] [CrossRef] [Green Version]
  41. Bergeron, M.; Daneau, G.; Ding, T.; Sitoe, N.E.; Westerman, L.E.; Stokx, J.; Jani, I.V.; Coetzee, L.M.; Scott, L.; De Weggheleire, A.; et al. Performance of the PointCare NOW system for CD4 counting in HIV patients based on five independent evaluations. PLoS ONE 2012, 7, e41166. [Google Scholar] [CrossRef]
Figure 1. Separation of CD4+ T cells from peripheral blood mononuclear cells (PBMC) using the conventional method. Representative images of FACS analysis data showing the percentage of CD4+ T cell population (Q2) in the PBMCs from sample S1 (a) before and (b) after separating the CD4+ T cells using NP-CD4 and the Dynamag™-2 magnet (the lymphocyte is gated and colored red). Representative merged images showing cells stained with CD4-FITC (green color) and CD3-PE (red color) (c) before and (d) after separation was observed under a fluorescence microscope at 20× magnification. (e) Cell separation efficiencies from five PBMC samples (S1–S5).
Applsci 11 09786 g001
Figure 2. CD4+ T cell separation from blood. Representative images of FACS analysis data showing the percentage of CD4+ T cell population (Q2, orange) (a) before and (b) after separation from blood samples using NP-CD4. (c) The separation efficiency (SE) from 50 µL (dark black bar) and 10 µL (white bar) of undiluted (X1), 2-fold diluted (X2) and 6-fold diluted (X6) blood samples (n = 5); (d) SE from 50 µL undiluted blood using 50, 25, and 12.5 µL NP-CD4 (n = 3). p values were generated using Student’s t-test (* p < 0.05). The error bars represent the standard deviation of measurements.
Applsci 11 09786 g002
Figure 3. Linear regressions of CD4+ T cell counts using an optimized MACS procedure (50 µL blood, 25 µL NP-CD4) (x axis) against the counts obtained using FACS (y axis). Linear regressions generated from (a) a total of 38 samples, (b) 18 samples in groups I and II with CD4+ T counts > 200 cells/µL, and (c) 15 samples in group III with CD4+ T counts of 200–100 cells/µL. The plots are represented as the number of CD4+ T cells per microliter of blood.
Applsci 11 09786 g003
Figure 4. MACS-Countess operation and analysis scheme for CD4+ T cell counting. The 50 µL of blood to be tested is transferred to a new 1.5 mL microcentrifuge tube together with the addition of 25 µL NP-CD4 and 450 µL PBS*. After 30 min of incubation at room temperature, the sample is then washed twice each with 1 mL PBS on the DynamagTM-2 magnetic stand and is finally resuspended in 50 µL PBS. Then, 10 µL of the separated sample is introduced in the CountessTM slide and counted on the cell counter machine (Countess). For deducing the original CD4+ T cell count value: a Countess count of >200 cells/µL is applied to STC (I + II): y = 1.15x + 35.87, Countess count of ≤200 cells/µL is applied to STC (III): y = 0.4x + 90.27.
Applsci 11 09786 g004
Figure 5. CD4+ T cell counts by the deduced MACS-Countess and FACS methods. (a) Deduced MACS-Countess (x axis) correlates with FACS (y axis) at R2 = 0.86. (b) Bland–Altman plot with a mean bias of 3.5%, LoA ranging from −36.4% (Mean bias −1.96 SD) to 43.3% (Mean bias +1.96 SD). (c) Percentage similarity with MPS of 102.9% and CV of 10.6%.
Applsci 11 09786 g005
Table 1. Results of CD4+ T cell counts acquired using MACS-Countess and biases of MACS-Countess compared with FACS.
Group (CD4+ T Cells/µL)Sample OrderMACS-Countess (CD4+ T Cells/µL)STCDeduced Value
(CD4+ T Cells/µL)
FACS
(CD4+ T Cells/µL)
Bias (%)
I (1200–600)11000I + II1183.686031.7
2539.7I + II655.3709−7.9
3402.3I + II497.7615−21.1
II (600–200)1474.9I + II58152410.3
2343.8I + II430.5452−4.9
3454.5I + II557.5400.732.7
4372.4I + II463.336822.9
5227.3I + II296.7310.3−4.5
6182.5III163.8232.8−34.8
III (200–100)1135III144.6186.2−25.1
2152.3III151.6131.314.3
399.8III130.51208.3
495III128.5118.58.1
575III120.51118.2
6125III140.6104.729.3
Note: MACS separation was performed with a blood volume input of 50 µL, NP-CD4 volume of 25 µL, STC (I + II): y = 1.15x + 35.87; STC (III): y = 0.4x + 90.27.
Table 2. Sensitivity, specificity, PPV, NPV, and misclassification rates of MACS-Countess to the reference FASC at cut-off 350 and 500 cells/µL.
MethodCut-OffSensitivitySpecificityPPVNPVUpward Misclassification RateDownward Misclassification Rate
MACS-Countess350 cells/µL89.7%94.7%96.3%85.7%10.3%5.3%
500 cells/µL89.7%88.9%97.2%66.7%10.3%11.1%
PIMA [29,30,31,32]350 cells/µL89.6–100%85.7–86.7%91.2%92.3%0–10.4%13.3–14.3%
500 cells/µL95.5%84.2%76.0–80.2%94.9–96.4%4.5%15.8%
Publisher’s Note: MDPI stays neutral with regard to jurisdictional claims in published maps and institutional affiliations.

