1. Introduction
Electron dynamics on the atomic scale occurs on an attosecond time scale as dictated by quantum mechanics. Routinely, two-color photoionization schemes with XUV attosecond pulses obtained by high-order harmonic generation (HHG), driven by table-top laser sources, and a phase-locked near-infrared (NIR) dressing field are employed to investigate the dynamics with attosecond temporal resolution [
1]. These experiments demand a subcycle synchronization between the XUV pump and the NIR dressing fields to probe the electron dynamics. The temporal characterization of the attosecond pulses used in the two-color schemes is a fundamental prerequisite for their application in pump-probe experiments. Attosecond pulse trains (APTs) and the isolated attosecond pulses generated in the HHG process are usually characterized using the reconstruction of attosecond bursts by the interference of two-photon transitions (RABBITT) and streaking techniques, respectively [
2,
3]. Often, both the RABBITT and streaking approaches, initially developed as characterization schemes, are utilized for investigating different processes such as photoionization dynamics in atoms and molecules [
4,
5]. However, a few limitations of the HHG process restrict their application. Apart from the very low conversion efficiency of the HHG process, the harmonics generated are hard to manipulate in phase, amplitude, and polarization, thus limiting the pulse-shaping capability [
6,
7].
Free-electron lasers (FELs) are sources of radiation spanning the XUV and X-ray spectral ranges, characterized by durations ranging from a few femtoseconds to tens of femtoseconds and by unprecedented peak intensities [
8,
9,
10]. The advent of FELs led to the inception of schemes to determine the structural properties of single macromolecules exploiting the high number of photons interacting with the sample [
11]. The ultrashort pulse duration of the radiation bursts, on the other hand, led to several experiments investigating time-resolved studies of various molecular dynamics [
12,
13,
14,
15]. However, performing two-color experiments at the FEL facilities presents the formidable challenge of actively controlling the delay stability between the XUV and the external laser fields. Presently, the delay jitter between the two colors at various FEL facilities is found to be much higher than that needed for attosecond time-resolved experiments [
16,
17].
Until recently, the generation of attosecond pulses at the FEL facilities has been restricted to theoretical schemes [
18,
19,
20,
21]. Only in 2020, isolated attosecond pulses were produced at the LCLS [
22], and attosecond pulse train generation was observed at the FEL FERMI [
23]. The methods employed for the experimental observation of the attosecond pulses at these facilities differ significantly. The attosecond pulses generated at the LCLS suffer from shot-to-shot fluctuating spectral properties, which corresponds to a varying temporal structure of the attosecond pulses. This is the result of the self-amplified spontaneous emission (SASE) process, which calls for a pulse characterization technique able to provide pulse characteristics on a single-shot basis. On the contrary, at FERMI, the seeding mechanism ensures that the spectral properties are reproducible from shot-to-shot, and a multishot technique can be implemented for the temporal characterization of the XUV radiation. Moreover, while the technique demonstrated at the LCLS closely follows the attosecond streaking approach adopted for the characterization of isolated attosecond pulses, the method demonstrated at FERMI was inspired by the RABBITT technique used in the attosecond community for the characterization of attosecond pulse trains.
In this article, we present the generation of APTs and their shaping at the FEL FERMI using the beating of multiple phase-locked harmonics, which is similar to the scheme proposed to generate subfemtosecond waveforms using multiple table-top lasers [
24]. In particular, we describe the complex waveform synthesis using a harmonic comb containing three and four harmonics. The method described allows the generation of attosecond pulses with energies as high as tens of microjoules and with pulse durations as short as tens to hundreds of attoseconds.
The contents of the article are as follows: In
Section 2, the experimental setup used to generate the harmonic comb is discussed.
Section 3 describes the construction of the correlation plots and their evolution in a phase scan to extract the phases required for attosecond pulse reconstruction. The reconstruction of the attosecond pulses and complex wave shaping is demonstrated in
Section 4, providing an analytic form of the intensity profile for an attosecond waveform using an arbitrary number of harmonics in the harmonic comb (
Section 5).
2. Experimental Setup
FERMI is a seeded FEL, where the harmonics of an ultraviolet seed laser of frequency
are produced using the high-gain harmonic generation (HGHG) scheme [
10]. The seed laser itself is created by frequency tripling the pulses from an NIR laser of central frequency
(
). The harmonics generated using the technique of HGHG are phase-locked to the seed laser and possess very stable spectral properties on a shot-to-shot basis and a high degree of coherence, both transverse and longitudinal [
10,
25]. FERMI is equipped with six undulators (U
,
); a phase shifter (PS
,
) is situated between each pair of consecutive undulators. Each PS is a magnetic chicane used to match the phase between the radiation emitted by the undulators upstream and downstream of it by delaying the electron bunch. The harmonics are focused in the experimental chamber using a Kirkpatrick–Baez (KB) mirror setup. The NIR and the XUV are propagated collinearly using a drilled mirror, and are recombined after the KB mirror setup. A detailed experimental scheme has been presented elsewhere [
23,
26].
Our study used a harmonic comb consisting of either three (H
, H
, and H
) or four (H
, H
, H
, and H
) harmonics, where H
is the
qth harmonic of the seed laser. The undulator configuration for generating three and four harmonics is shown in
Section 3 and
Section 4. In the three-harmonic case, each harmonic is generated using two adjacent undulators with the phase difference between the generated harmonics controlled using the phase shifter PS
or PS
. In the four-harmonic case, each undulator generated a harmonic, and the last two undulators were left open, not generating any radiation. For the phase manipulation, phase shifters PS
and PS
were utilized. The RABBITT scheme generally used to characterize the APTs cannot be directly implemented at FERMI due to a delay jitter of ±3 fs between the XUV and NIR fields that is much higher than that required to observe the sideband oscillations [
16]. As the delay randomly varies on a shot-to-shot basis, a method independent of the delay stability between the XUV and the NIR fields is required.
3. Sidebands and Their Correlation Analysis
In the experiment, reconstruction of the generated APTs was accomplished using the technique of correlation-based reconstruction of attosecond pulses (CoBRA) inspired by the RABBITT scheme. For the implementation, neon was used as the target gas for the two-color photoionization scheme. A significant difference between the RABBITT and CoBRA schemes is the number of sidebands between consecutive harmonics. In our scheme, due to the frequency relation between the seed laser and the NIR laser, between each pair of consecutive harmonics, two sidebands were found, whose intensities are given by:
where
is the phase of harmonic H
,
is the delay between the APT and the NIR fields,
,
are coefficients depending on the photoelectron energy and the intensity of the two harmonics and of the NIR field, while + (−) corresponds to the sideband with higher (lower) energy. Each sideband (
) is a result of the interference of two pathways, each resulting from the ionization by the harmonic H
(H
) and absorption (emission) of a different number of NIR photons. As a result of the different number of exchanged photons reaching a particular sideband (
), the final states reached via the two pathways present the same final energy, but a different parity. The interference between the two pathways, therefore, does not lead to a variation of the total intensity of the sidebands when the relative phase between the two paths is changed (as in the RABBITT case), but to an asymmetric emission of the sideband photoelectrons. The strong-field approximation (SFA) [
27] on which Equation (
1) is derived, confirms a complete cancellation of the oscillations of the sideband intensities if the signals are integrated over the total solid angle of 4
sr. In the experiment, the photoelectron spectra were acquired by a magnetic bottle electron spectrometer (MBES) configured to collect the photoelectrons in 2
sr. This detection configuration allows one to observe oscillations of the sideband intensities upon changing the relative phase of the two pathways (i.e., upon changing the relative delay between the XUV and NIR fields). From the definition of the intensity of the sidebands, an oscillating component of the sidebands (
) is constructed, using the definition:
where
is a coefficient obtained with the approximations
. In the correlation plots, we use the oscillating component of the sidebands to visually represent the different degree of correlation between the sidebands.
Evolution of the Correlation Plots
The amplitudes and phases of the harmonics H
, H
, and H
are needed to reconstruct the APTs. The correlation plot of the oscillating components (
) is constructed using the single-shot intensities to extract the phase differences. The amplitudes are extracted from the photoelectron spectra acquired in the absence of the NIR dressing field. The correlation between two random variables refers to how the two signals behave with respect to each other. Using Equation (
2), it can be easily seen that the analytical form of the correlation plot of the oscillating components
and
describes an ellipse aligned at an angle to the
axis, with the length of the major and minor axes depending on the phase difference
, defined as:
where
is the relative phase between the harmonics H
and H
. The overall shape of the ellipse varies as the phase difference
is changed. When
approaches zero, the ellipse collapses to a straight line aligned at an angle
, and at
, the ellipse collapses to a straight line aligned at an angle
. The correlation distribution is periodic as a function of
with periodicity
, implying the generation of the same correlation distribution by increasing or decreasing the phase by
. Therefore, from the shape of the correlation distribution of the oscillating components, the phase difference
can be extracted. By definition,
is proportional to the group-delay dispersion (GDD) of the harmonic spectrum.
The shape of the correlation distribution is a good indicator of a phase difference, but only qualitatively. To quantitatively understand the variation of the phase difference, the so-called correlation coefficient is introduced. The method of associating the correlation coefficient with the shape of the correlation plots and phase difference extraction was presented in [
23,
26].
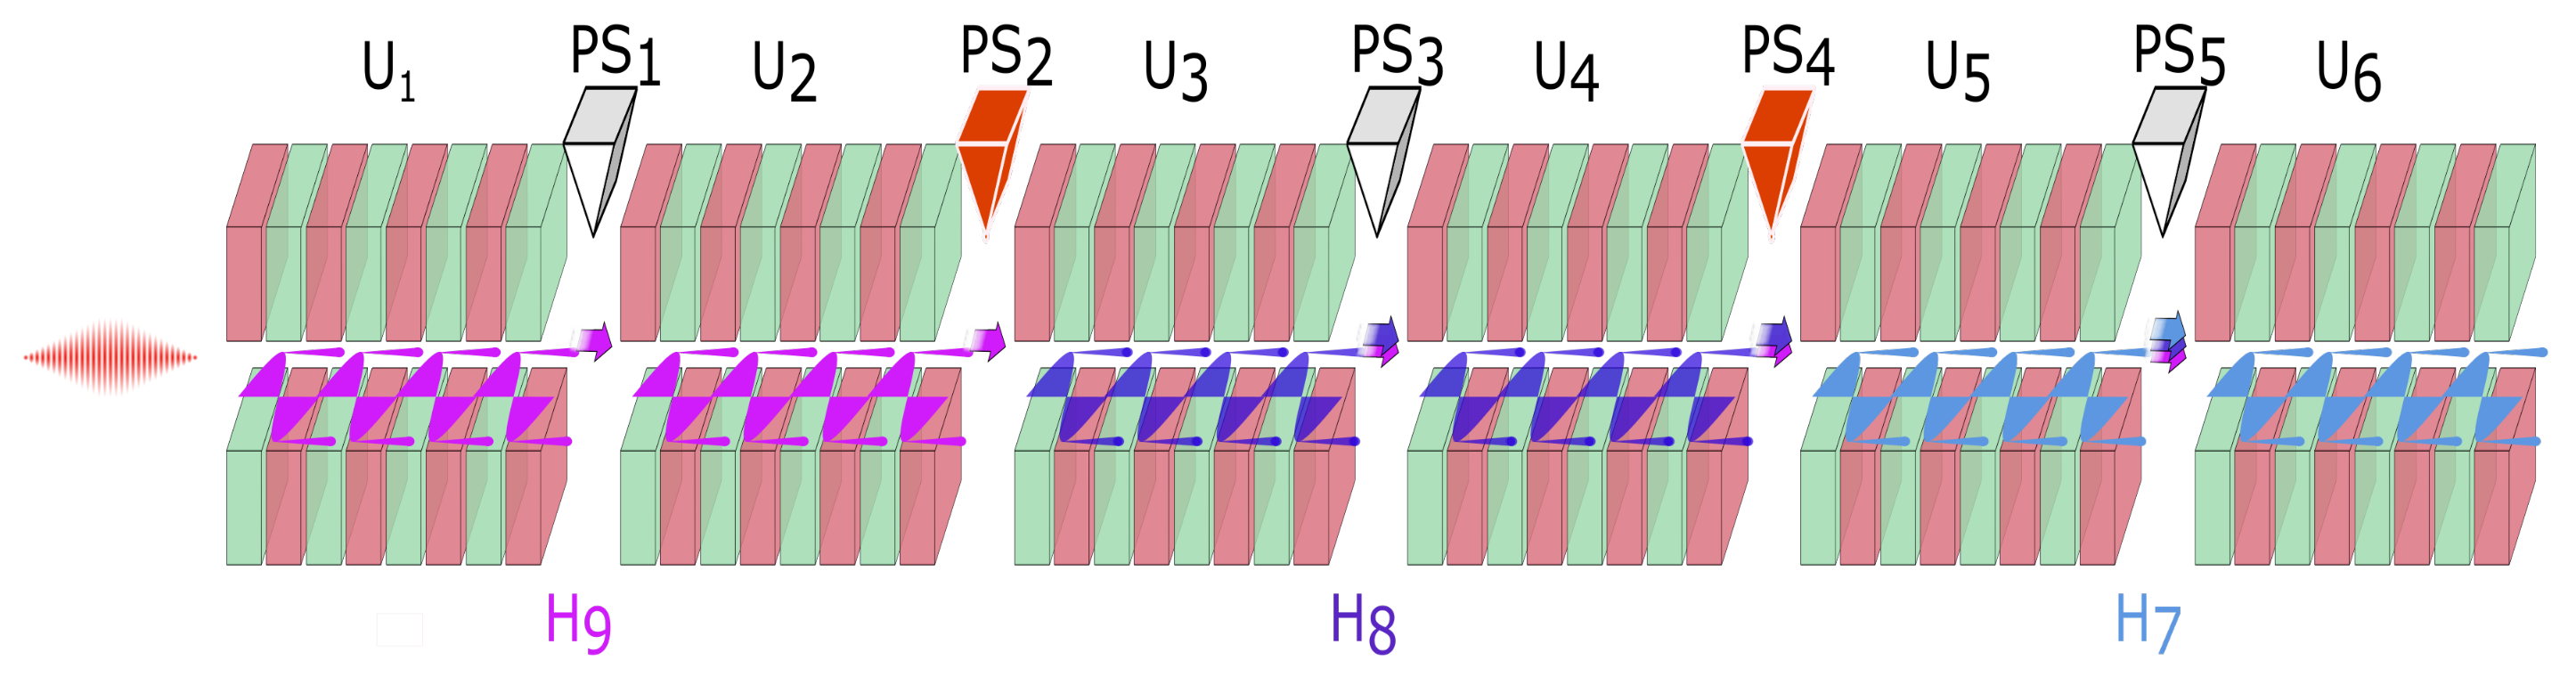
In
Figure 1, the undulator configuration to generate a harmonic comb with three harmonics is presented. In the CoBRA scheme, the phase difference
is extracted using the evolution of the correlation distributions of the oscillating components. The evolution is achieved by varying the phase difference between the harmonics using either the phase shifter PS
or PS
(shown in red). The variation in the phase difference
by the delay introduced by the two phase shifters is given by:
where
is the initial phase of the harmonic H
and
is the delay introduced by the phase shifter PS
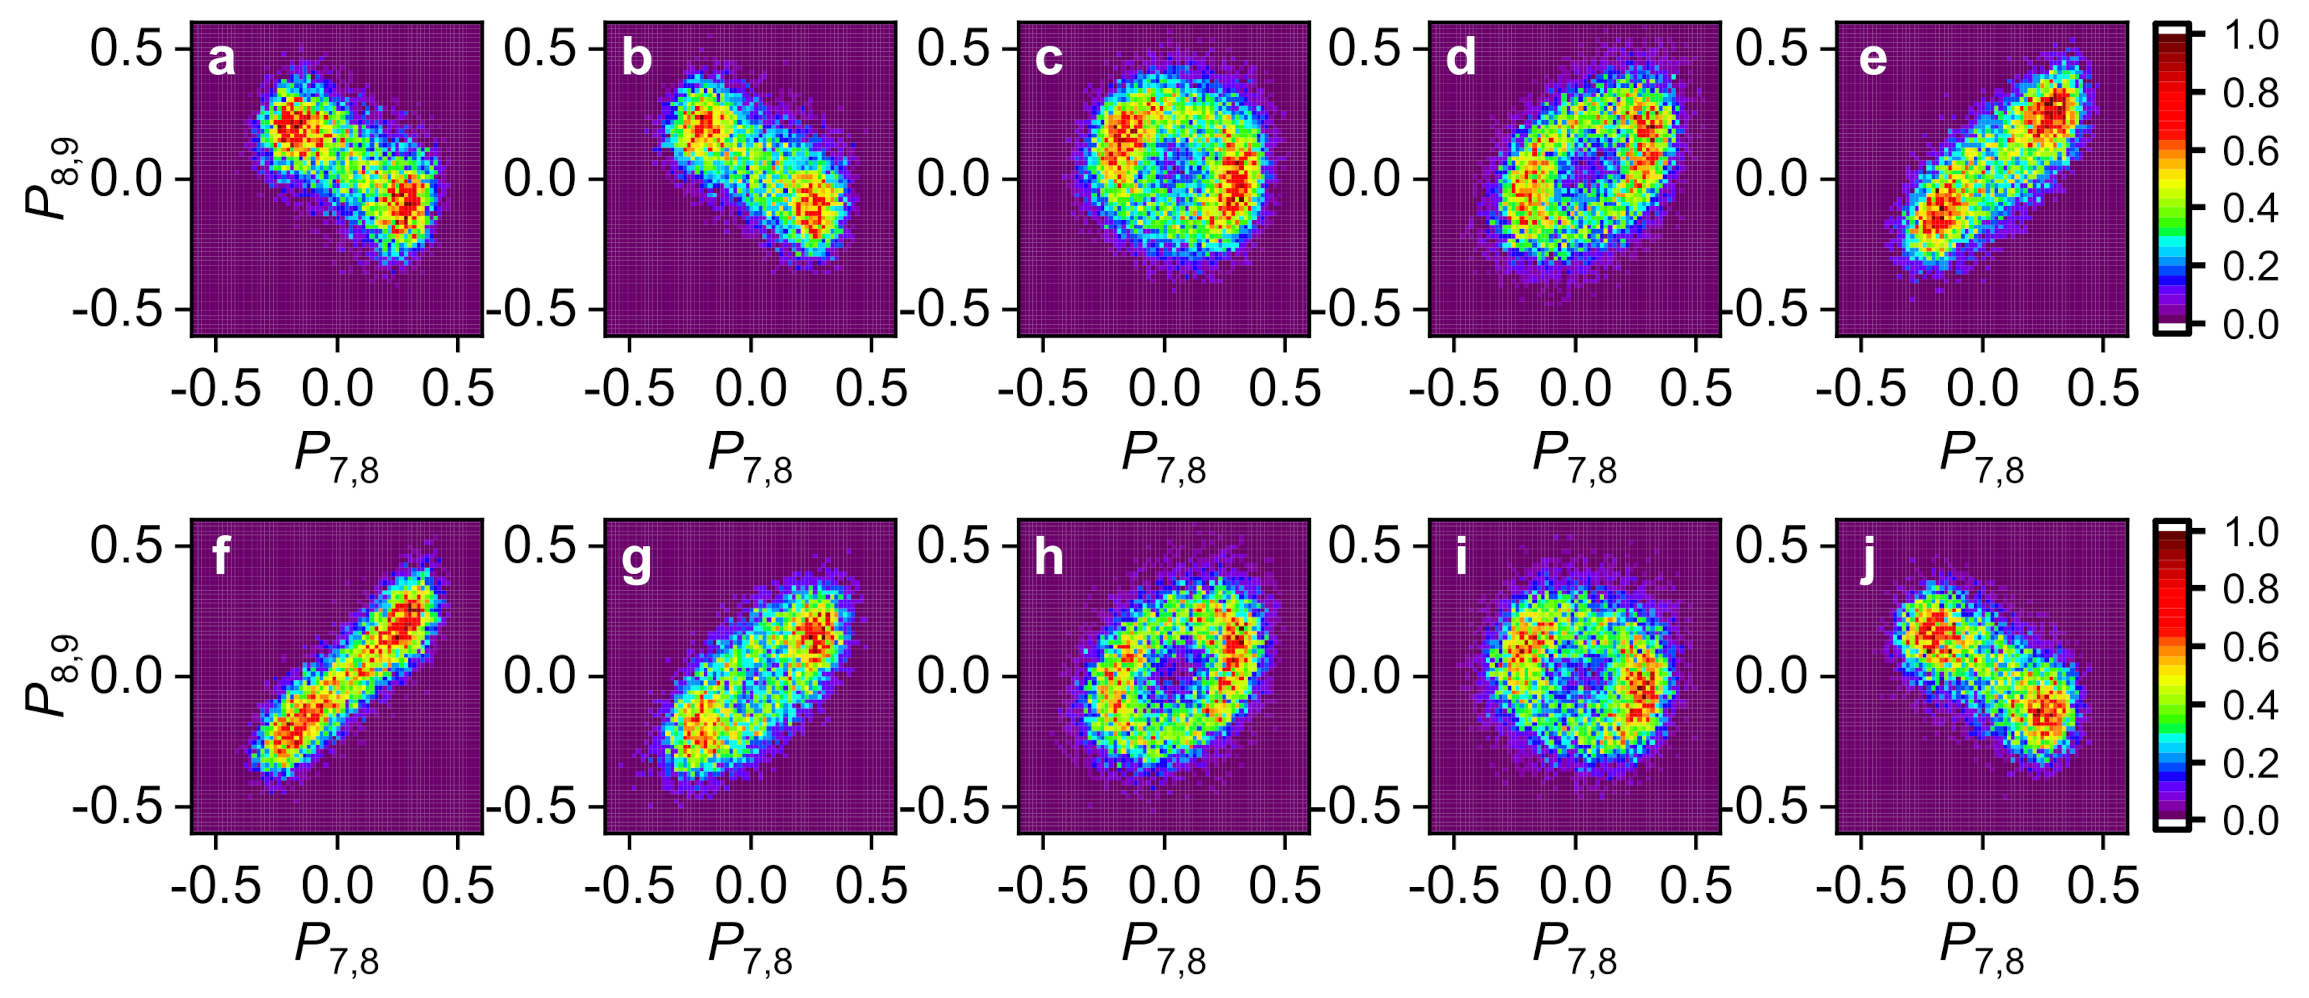
. The evolution of the shape of the correlation distribution of the oscillating components
and
as a function of the delay introduced by phase shifter PS
for a fixed phase shifter PS
(
) is shown in
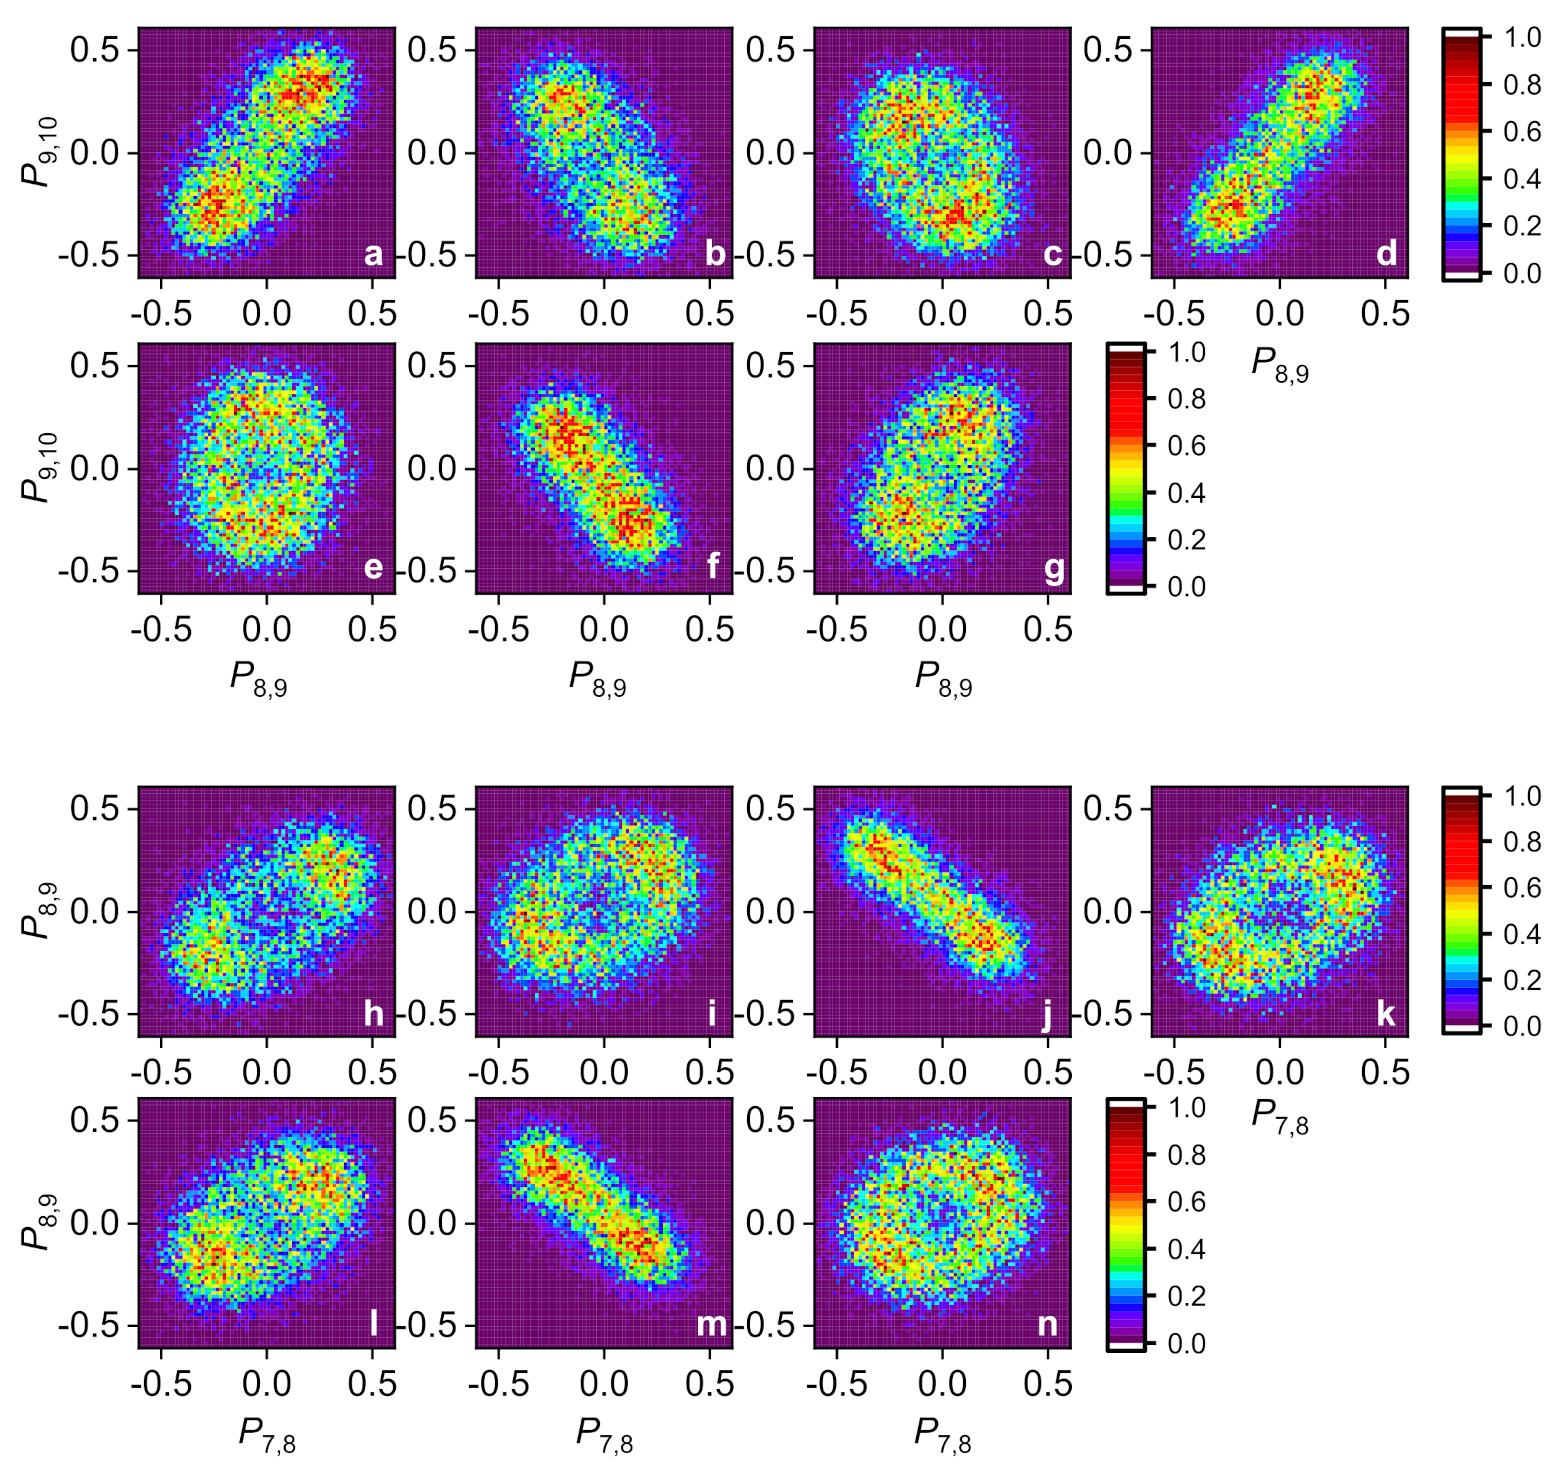
Figure 2. A noticeable change in shape can be observed in the different panels.
A delay of 13.76 as was added in each step. Assuming a phase difference
attributed to Panel a, the addition of nine delay steps results in the shape of the correlation distribution in Panel j. The total delay accounts for 123.84 as, corresponding to a phase change of 6.21 rad
, making the phase difference
-6.21 rad (from Equation (
4)). As a consequence, Panels a and j present a very similar distribution. Similarly, the evolution of the distribution from Panels a (f) to e (j) suggests a change in phase of ≈
rad. This is consistent with the observation that the phase difference between the two panels is 2.76 rad. The exact value of
can be extracted from the calibration of the evolution of the correlation coefficient as a function of the delay introduced. The evolution of the correlation plots follows the pattern and periodicity as expected; however, it is important to establish that the phase scan did not affect the amplitudes of the individual harmonics.
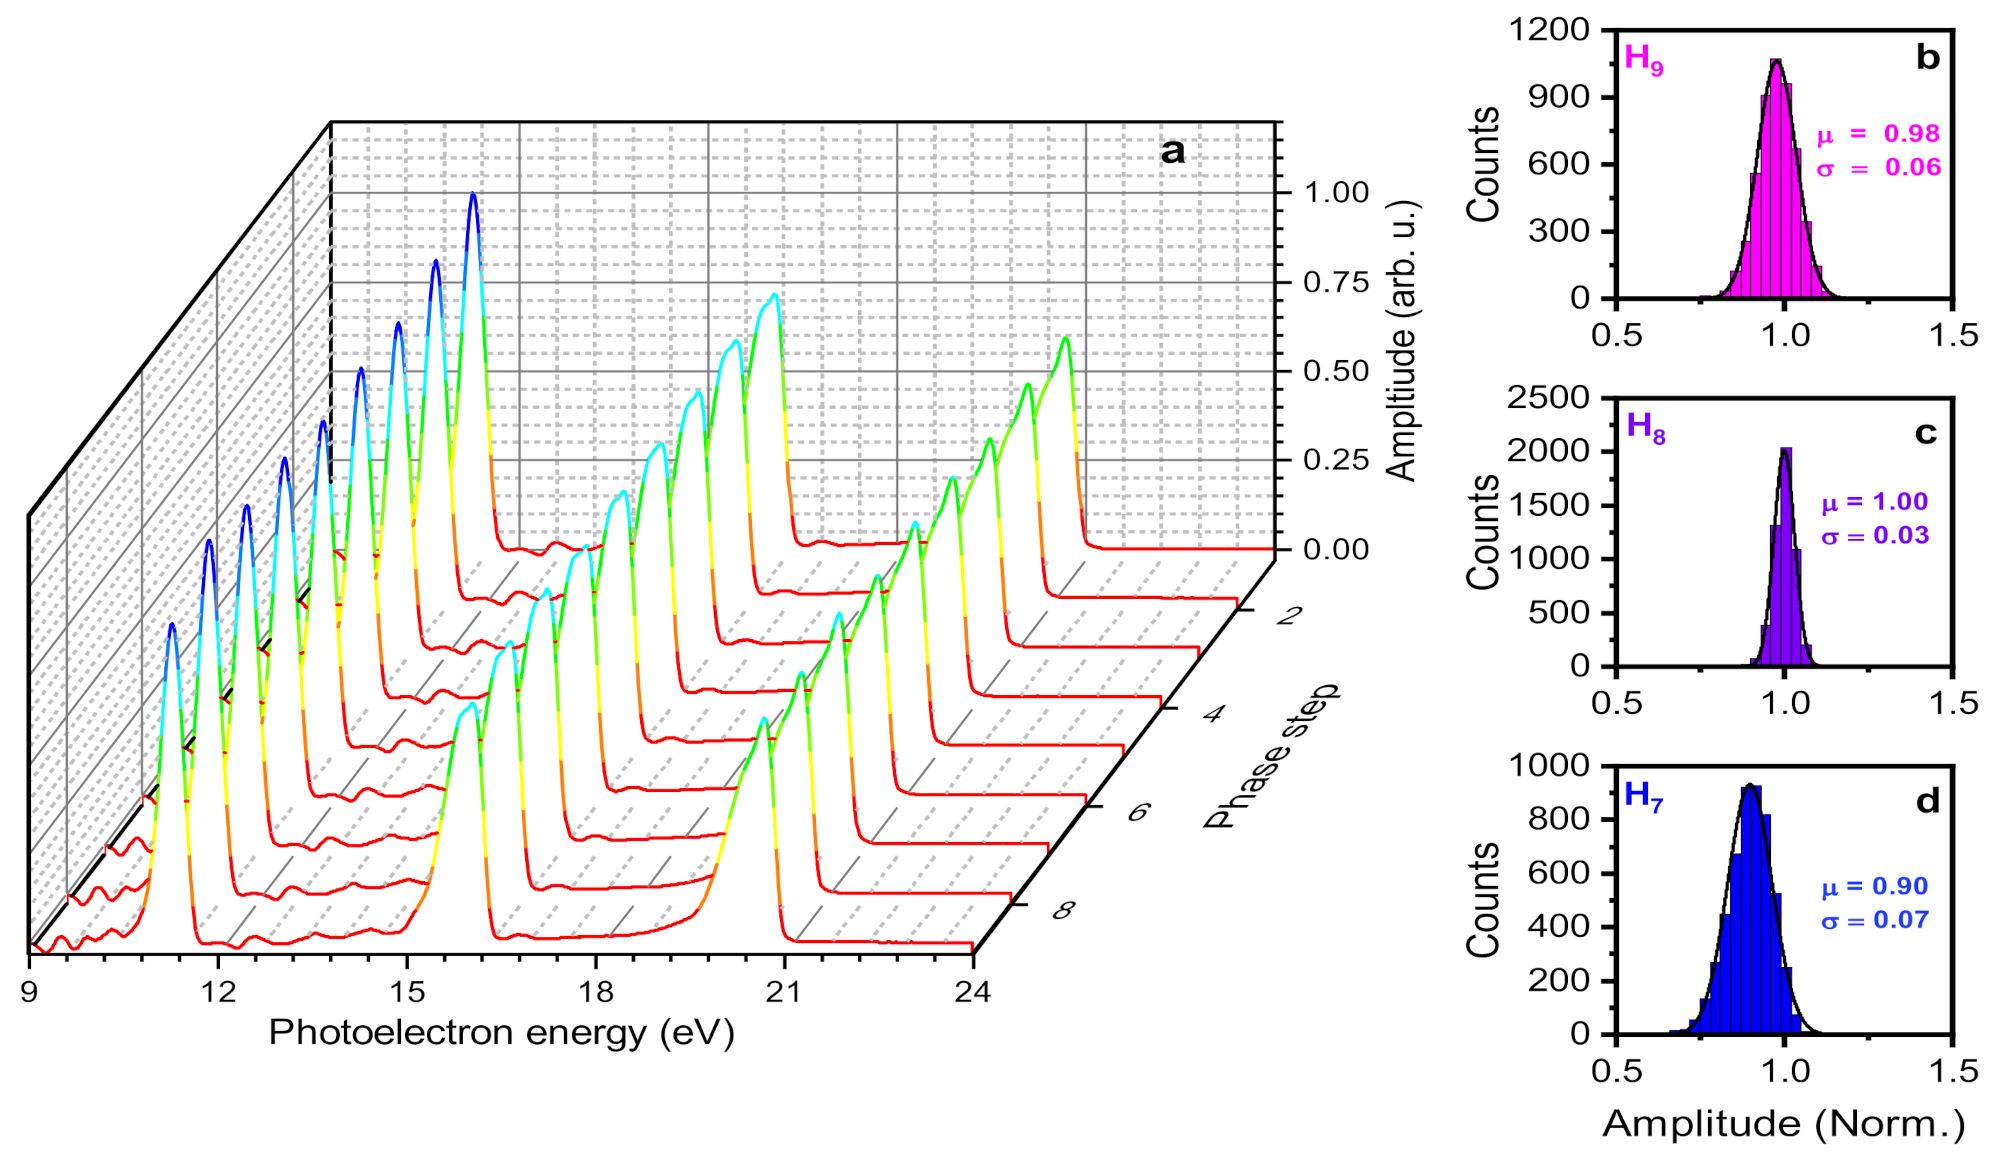
In
Figure 3a, the energy spectrum of the harmonics is presented for different phases in a phase scan without the NIR dressing field. Panels b–d display the distribution of the shot-to-shot amplitudes of the individual harmonics for a fixed delay of PS
and PS
. The amplitudes are evaluated as the square root of the area under the corresponding peaks. For the reconstruction, it is sufficient to consider the relative amplitudes of the harmonics, and hence, we normalized the distributions of the harmonics with the mean value of the H
amplitude. The mean (
) and the standard deviation (
) of the harmonic amplitudes are displayed in the panels showing the distribution of the harmonics H
(b), H
(c), and H
(d). The evolution of the correlation plots in a phase scan and a negligible effect of phase variation on the harmonic amplitudes suggest the possibility of a more advanced complex attosecond waveform synthesis.
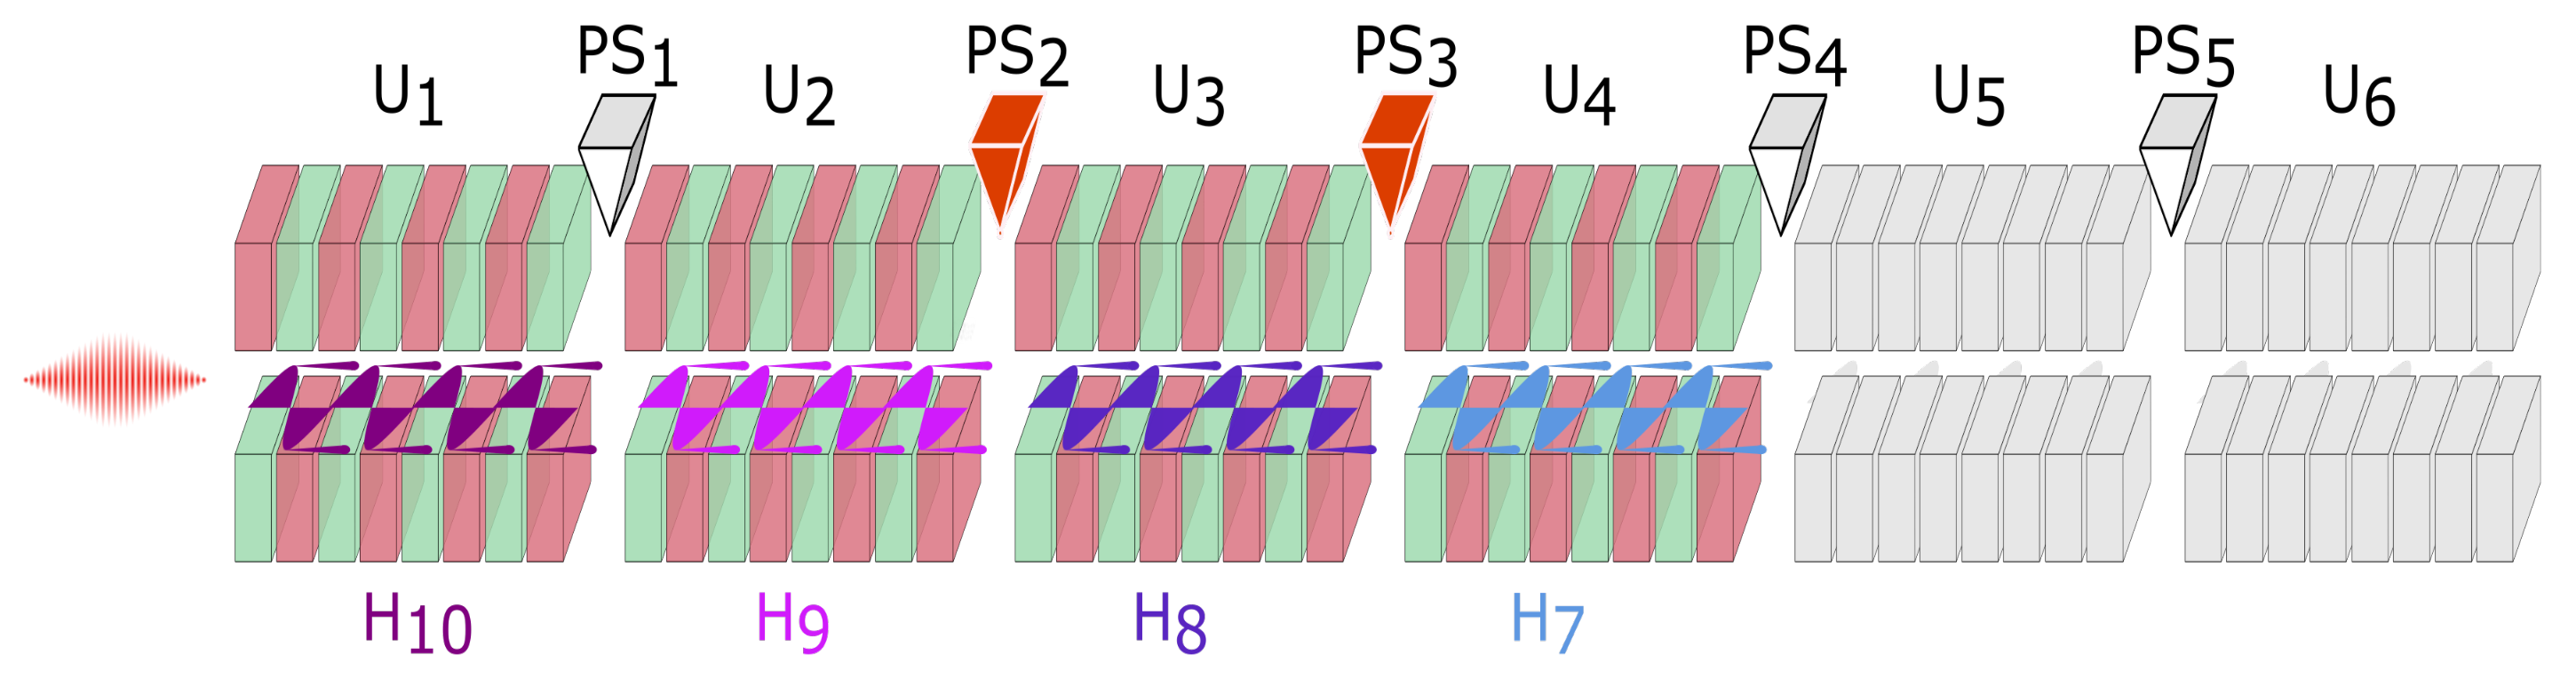
4. Attosecond Pulse Trains with Four Harmonics
The undulator configuration for generating a harmonic comb with four harmonics is shown in
Figure 4.
Each harmonic is generated in one undulator, and the last two undulators are not used for harmonic generation (shown in grey). In the configuration presented, phase scans were carried out with either PS
or PS
(indicated in red). The presence of four harmonics requires the analysis of two pairs of the correlation plots: (
) and (
). As a consequence, two phase differences
and
are available for manipulation, each of them affected in a different way by the delays introduced by the phase shifters PS
and PS
. The variation of the phase difference terms
and
as a function of the delay introduced is given by:
is dependent only on the delay introduced by the phase shifter PS
and independent of the phase shifter PS
, and
varies as either of the phase shifters PS
or PS
is changed. Hence, using the phase shifter PS
will affect both the phase difference terms
and
. The variation corresponds to an evolution of the correlation plots of the oscillating components pair (
) and (
). In
Section 4.1 and
Section 4.2, the evolution of the correlation plots along with the reconstructed attosecond pulse trains for the case of a phase scan with PS
and PS
are presented.
4.1. Complex Waveform Synthesis Using the Phase Shifter PS
A phase scan was conducted by introducing the delay using the phase shifter PS
. The evolution of the oscillating components (
) and (
) are presented in
Figure 5. A delay of 31.45 as was introduced between one panel and the next. The delay 31.45 as corresponds to a phase increment of 2.02 rad for
and a phase decrement of 1.80 rad for
. The periodicity of correlation distributions (
), (
) based on
,
can be easily established from the evolution of the correlation plots. Considering the evolution of the correlation plot of (
) from Panels a to d, the total phase variation corresponds to a value 5.40 rad, which is close to 2
, and hence, the corresponding distributions are very similar.
Similarly, for the evolution of the correlation plot of (
) from Panels j (k) to m (n), the total phase added is equal to 6.06 rad, reproducing a correlation plot in close similarity to Panel j (k). The phase differences
and
were obtained following the method described in [
23,
26]. From the amplitudes of the harmonics (
) obtained from the photoelectron spectra in the absence of the dressing NIR field, the intensity profile of the attosecond pulse trains is calculated using the equation:
where
,
are the amplitude and envelope of the harmonic H
. Phase
(=
) introduces a temporal shift of the intensity profile of the attosecond waveforms with respect to the envelope of the single harmonic and does not affect the shape of the individual attosecond pulses within the pulse train.
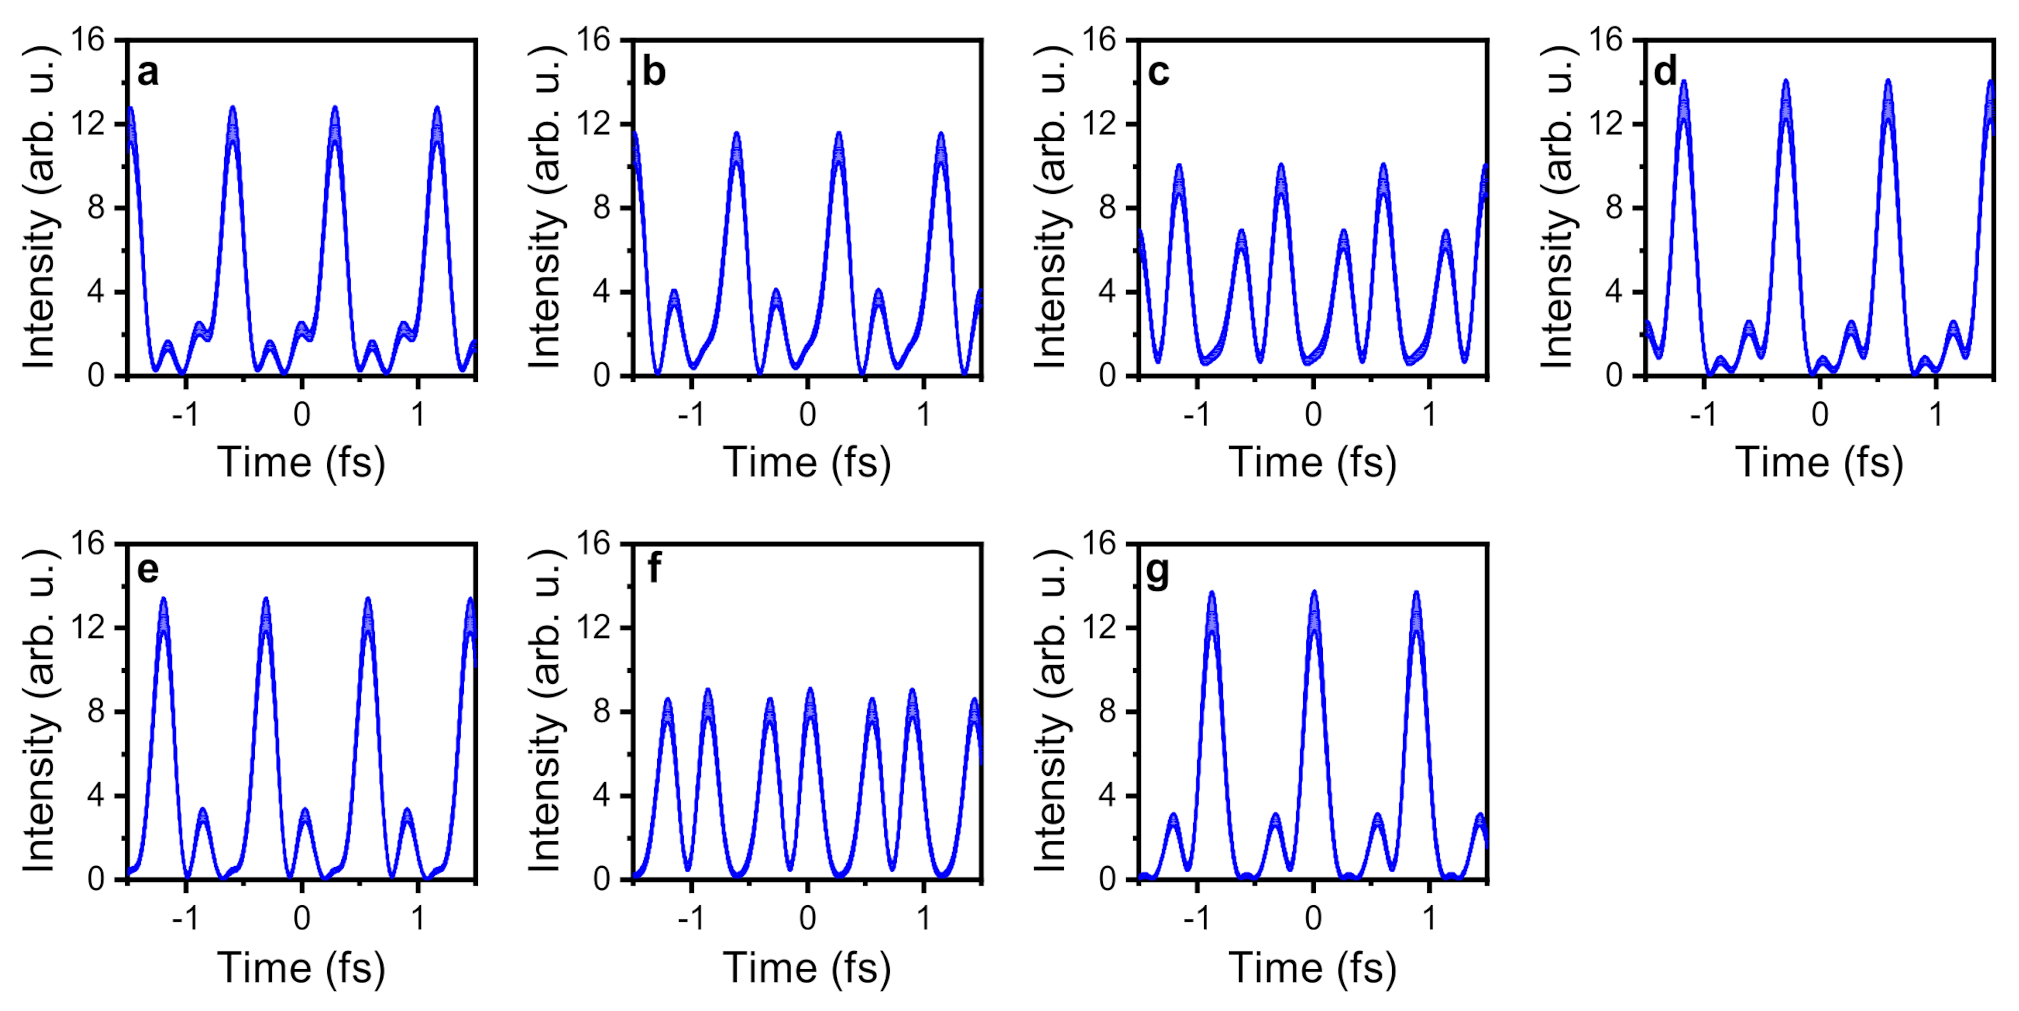
Reconstructed attosecond pulses corresponding to
Figure 5 are displayed in
Figure 6. The pulse duration (
) for each harmonic is considered equal and taken to be 50 fs FWHM [
28]. From the equation, the shortest attosecond pulses result when both the phase difference terms
and
are ≈0. Panel d displays the shortest attosecond pulses with a pulse duration of 216 ± 7 as FWHM with the error in the pulse duration calculated from the error in the extracted phase differences and the obtained amplitudes of the harmonics. As expected from the equation of the intensity profile, the shortest waveforms (
Figure 6d) result when the correlation plots of the oscillating components present a correlation distribution close to a straight line with a positive slope. When the distribution of both the correlation plots presents a nearly straight line inclined at a negative slope, a double structure is observed in the attosecond waveform (
Figure 6c,f). The values of the phase differences and the harmonic amplitudes used for the reconstruction are provided in
Table A1 of
Appendix A.
4.2. Complex Waveform Synthesis Using the Phase Shifter PS
A phase scan conducted using the phase shifter PS has an immediate effect, and as the phase altered does not affect the phase difference , the correlations plots of the oscillating components () should not show any change as a function of phase. However, the phase difference varies, and hence, the evolution of the correlation plots of the oscillating components () is expected.
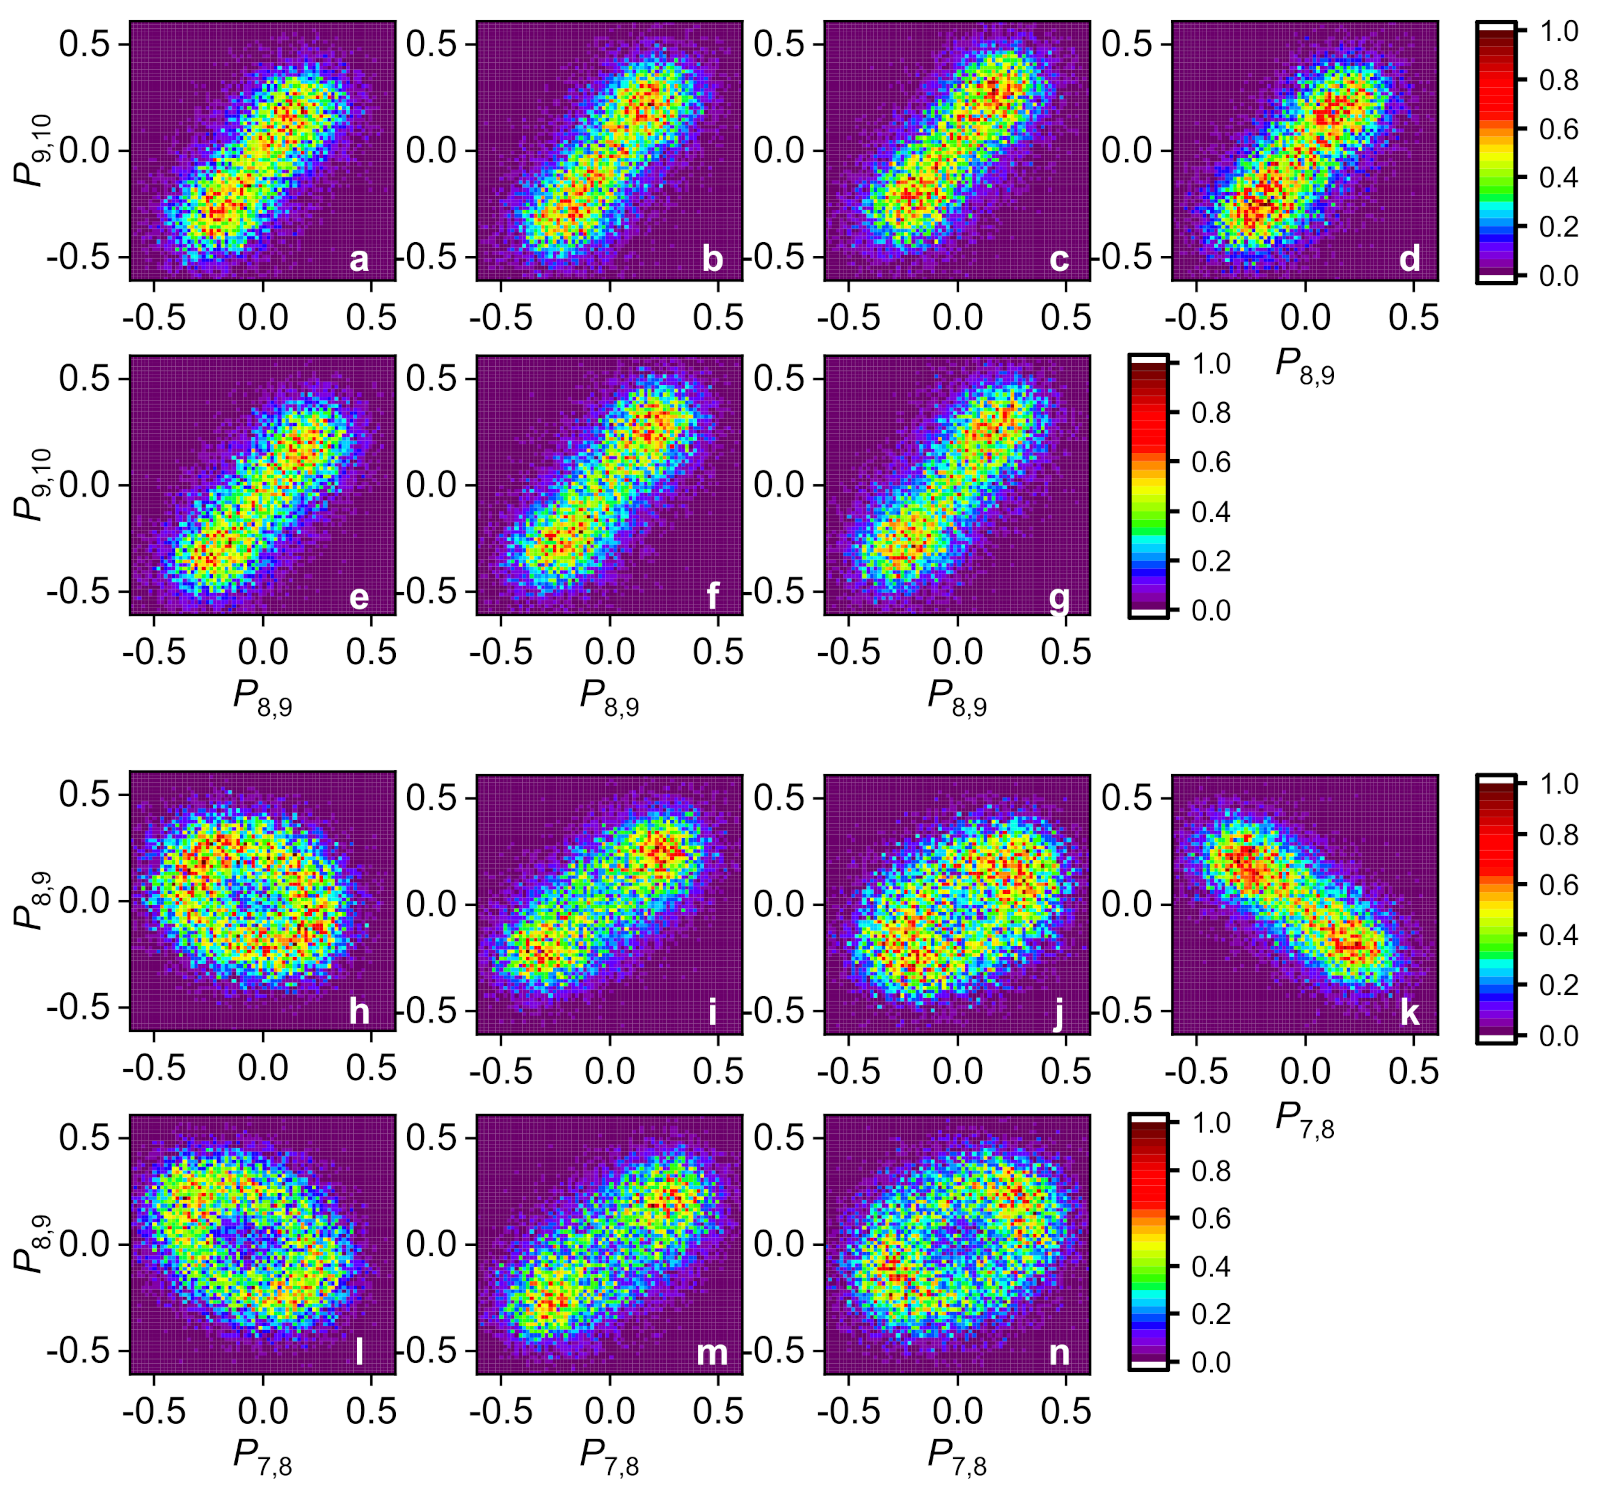
In
Figure 7, the correlation plots of the two pairs of oscillating components corresponding to different phase difference values are displayed. Panels a–g (i–n) show the evolution of the correlation distribution of the oscillating components
and
(
and
). The phase scan was carried out at a fixed PS
value corresponding to
Figure 5d. The delay
introduced in each step was 31.45 as, corresponding to a reduction of 1.57 rad in each step. The correlation plots of the oscillating components (
) do not show a variation in the correlation distribution as the delay
is varied. An addition of four delay steps corresponds to a reduction of 6.28 rad in
. From Panels h–n, a periodic repetition of the correlation distribution for every four panels can be observed. These results demonstrate the possibility to selectively manipulate the phase difference
in waveform shaping. The power of attosecond waveform synthesis to vary the phase of the harmonics of the harmonic comb independently allows the investigation of different dynamics dependent on the phase of the input radiation.
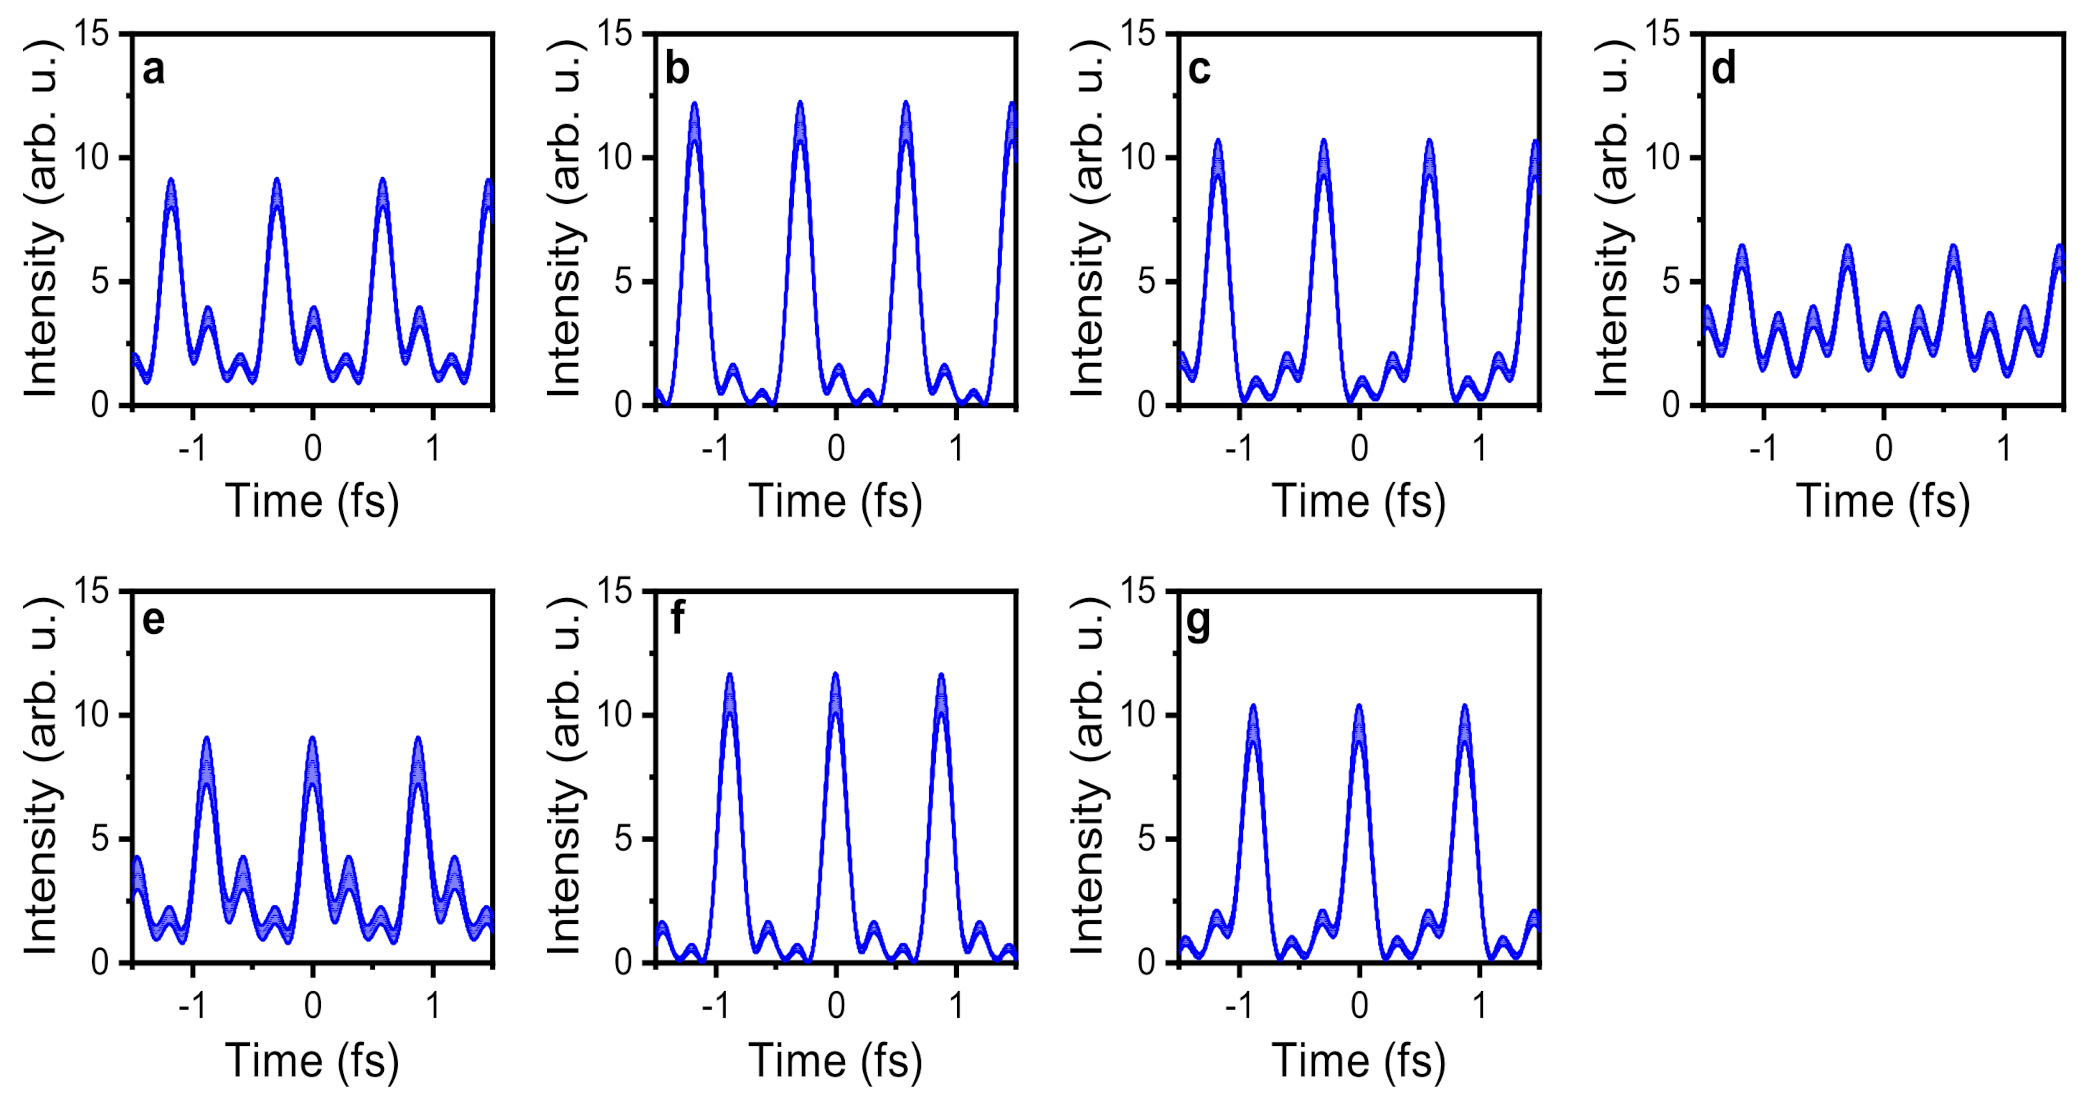
Figure 8 presents the reconstructed attosecond waveforms for the different values of
as the delay
is varied. The shortest attosecond waveform is produced when the phase difference
, corresponding to a correlation distribution of (
) close to a straight line. The reconstructed waveform displayed in
Figure 8b presenting the shortest pulse duration of 210 ± 5 as corresponds to the correlation plots presented in Panels b,i of
Figure 7. An attosecond waveform with double or multiple peaks results when
, producing a distribution close to a straight line with a negative slope. The correlation plots in
Figure 7d,k and the reconstructed waveform in
Figure 8d represent such a scenario. Moreover, the variation of
demonstrates the generation of waveforms that differ significantly from one another. The values of the phase differences and the harmonic amplitudes used for the reconstruction are provided in
Table A2 of
Appendix A.
5. Attosecond Pulse Shaping with an Arbitrary Number of Phase-Locked Harmonics
In the previous sections, attosecond waveform synthesis with three and four harmonics was presented. A generalized scheme to produce attosecond waveforms with a harmonic comb containing
N phase-locked harmonics is described in this section. The results from the phase scan in the four-harmonic case confirm the action of the phase shifter on the radiation. Significantly, phase shifters only alter the radiation that is generated in the undulators downstream of themselves. Consider an undulator chain consisting of
N undulators and a phase shifter in between each pair of consecutive undulators. The arrangement will have
phase shifters, each affecting the phase of the radiation generated in the undulators downstream, if each undulator (U
) is used to generate a harmonic (H
) of the seed laser. A phase shifter PS
, placed after the undulator U
, will affect the phases of all the harmonics H
to H
. The phase of each harmonic and the phase difference
are given by:
where
is the delay introduced by the phase shifter PS
. The phase difference
is only affected by the phase shifters PS
and PS
. In the general case of
N harmonics, the reconstruction of the attosecond pulse train requires the
phase difference terms (
,
) and amplitudes of
N harmonics. The difference between Equations (
5) and (
7) showing an opposite effect of the delays introduced by the phase shifters is due to the choice of the sequence of harmonics generated in the undulator chain. In the present discussion of a harmonic comb containing “
N” harmonics, the first undulator generates the lowest harmonic, and the subsequent undulators downstream generate harmonics with increasing order with the last undulator generating the highest harmonic. In the four-harmonic case presented in
Section 4, the highest harmonic was generated in the first undulator, and the subsequent undulators downstream generated harmonics with decreasing harmonic order.
In order to generate a waveform of interest, let us say the shortest attosecond waveform, the phase scans must be performed to obtain the correlation distribution close to a straight line with a positive slope for all the pairs of oscillating components. Once a set of three harmonics H, H, and H is optimized to obtain the desired correlation distribution of the oscillating components () using PS or PS, neither of the two phase shifters should be used for the optimization of another set of three harmonics. For instance, if harmonics H, H, and H (H, H, and H) are to be optimized to obtain a phase difference () after the optimization of H, H, and H, the phase shifter PS (PS) must be used and not PS (PS). A particular sequence does not need to be followed in optimizing each set of the three harmonics.
The phase difference
(
) terms and the amplitudes of the harmonics measured in the absence of the NIR field can be implemented to reconstruct the attosecond waveforms using the following equation:
where:
here
. Equation (
9) can be implemented in the reconstruction of waveforms in the experiments where only phases proportional to the GDD are accessible.
The experiment showed that one can successfully operate with four consecutive harmonics. Increasing this number to six is possible at FERMI in terms of hardware, and it will be investigated in future beam times. In experiments with a harmonic comb with six harmonics, the maximum energy acceptance of the time-of-flight spectrometer and its energy resolution should be considered. In order to overcome this limitation, time-of-flight spectra with good energy resolution in different energy ranges could be acquired sequentially, and the relative phases between groups of three consecutive harmonics could then be retrieved; for instance, if harmonics H () are generated, initially, the spectrometer can be optimized to collect the photoelectrons generated by harmonics H, H, H, and H. Implementing the CoBRA technique, phase differences () can be obtained. Subsequently, the spectrometer can be optimized to collect photoelectrons ionized by harmonics H, H, H, and H and follow the same procedure to calibrate the phase differences. From the two sets of acquisitions, attosecond waveforms can be reconstructed. A shortest attosecond pulse of ≈ 130 as FWHM was estimated from our simulations based on SFA with a seed laser of wavelength 264 nm.
Another important aspect is the temporal separation between the individual pulses in the pulse train. The time separation between individual attosecond pulses in the train is related to the energy separation between two consecutive harmonics. Changing the seed laser wavelength in the presently available range for the seed (230 nm–360 nm) at FERMI would allow changing the time separation in the range between 0.7 fs and 1.2 fs. A shorter separation can be achieved by setting the undulators of the FEL to alternate harmonics (e.g., ). While not yet possible at FERMI, spike separations up to tens of femtoseconds are technically attainable by seeding at a much longer wavelength. The seed laser used in the experiment (264 nm) reflected a pulse separation of ≈880 as.


 ,
, 


