
Mechanical Performance of Confined Autoclaved Fly-Ash-Brick Masonry Walls under Cyclic Loading


1
Key Laboratory of Earthquake Engineering and Engineering Vibration, Institute of Engineering Mechanics, China Earthquake Administration, Harbin 150080, China
2
School of Civil Engineering, Xi’an University of Architecture & Technology, Xi’an 710055, China
3
State Key Laboratory of Green Building in Western China, Xi’an University of Architecture & Technology, Xi’an 710055, China
*
Author to whom correspondence should be addressed.
Appl. Sci. 2021, 11(22), 10560; https://0-doi-org.brum.beds.ac.uk/10.3390/app112210560
Submission received: 15 September 2021
/
Revised: 21 October 2021
/
Accepted: 22 October 2021
/
Published: 10 November 2021
(This article belongs to the Special Issue Structural Vibration: Analysis, Control, Experiment, and Applications II)
Abstract
:In order to solve the limitations of masonry structures, such as poor seismic performance, complicated construction techniques, and energy wastage of wall materials, a new type of confined autoclaved fly-ash-brick wall was proposed and its mechanical performance was analyzed. An axial compression test of autoclaved fly-ash-brick short columns was carried out to analyze the failure mode and obtain the constitutive parameters of the brick. Meanwhile, a low-cyclic loading test of an assembly using an autoclaved fly-ash-brick wall was carried out to prove the correctness of the numerical model. Under multiple influencing parameters, the seismic performance of the assembly of autoclaved fly-ash-brick walls was analyzed by a numerical-simulation method. The results show that (1) the seismic performance of the assembled autoclaved fly-ash-brick walls is better than that of cast-in-place masonry walls; (2) low-strength mortar leads to premature cracking, which is unfavorable to earthquake resistance of the walls; and (3) the bearing capacity of the wall is increased and then decreased with the increase of the vertical compressive stress, so the number of layers of brick masonry structural should be limited. In addition, some construction measures were proposed to improve the mechanical performance of assembled autoclaved fly-ash-brick walls.
1. Introduction
In recent years, masonry structures have been severely damaged by several major earthquakes all over the world. For example, many buildings in Mediterranean regions such as Croatia and Greece are made of masonry, which have been seriously damaged by earthquakes [1,2]. Thus, earthquake-resistance problems have attracted academic attention. Structural measures have been adopted such as confined masonry (CM) that uses a ring beam and a constructional column to improve seismic performance. Tomazevic et al. [3] experimented with plain and CM walls to develop a rational method for modeling the seismic behavior of CM walls. Yoshimura et al. [4] investigated effective seismic-strengthening methods for masonry walls by testing unreinforced masonry and CM walls. Their results concluded that the connecting bars at the vertical wall-to-column connections and the horizontal-wall reinforcement were quite effective for improving seismic performance. Karantoni et al. [5] examined the seismic behavior of the confined masonry by FEM linear analysis and compared it to that of URM structures. They found this low-cost alternative method of construction is a very effective means of producing earthquake-resilient structures. Shedid et al. [6] carried out aseismic reinforcement tests of an earthquake-damaged building using reinforced-concrete constructional column and found that a horizontal stirrup could limit the development of cracks and improve the bearing capacity of the walls. Ashraf et al. [7] carried out quasi-static load tests, which were conducted on two full-scale brick masonry walls (one unreinforced wall and another confined wall) and subsequently investigated the wall in-plane lateral load behavior before and after retrofitting. The results demonstrated that the guidelines provided reasonable estimates of the test observations. Zheng et al. [8] conducted low-cycle loading tests of walls restrained by core tie columns. They concluded that similar to the cast-in-place tie columns, the core tie columns could greatly improve the seismic behavior of masonry walls. Quiroz et al. [9] carried out full-scale masonry-wall tests using a ring beam and a constructional column. By changing the reinforcement ratio of the ring beam and constructional column, the bearing capacity, lateral rigidity, energy-dissipating capacity, and equivalent viscous damping were studied under cyclic reversed loading.
From the aforementioned literature, the use of constructional columns and ring beams were found to be effective measures for improving the seismic performance of masonry structures. However, popularizing the cast-in-place constructional column and ring beam in a masonry structure is difficult because of the complex cast-in-place technology, high construction cost, and severe pollution in some poverty-stricken areas. Because a masonry structure is easily destroyed by earthquakes, an assembly-reinforced masonry structure was proposed in the U.S. in which the ductility and energy-dissipating capacity were improved using a steel rebar in the vertical holes and horizontal mortar joint with concrete [10]. Sucuoglu et al. [11] experimented with shear failure tests on reinforced hollow-brick masonry and reinforced-concrete block walls, which demonstrated that the vertical compressive stress and horizontal reinforcement ratio were the largest influencing factors on the shear hysteretic behavior, whereas the vertical reinforcement ratio has a marginal effect on the shear performance of masonry walls. With the advancement in wall technology, new reinforced blocks have been invented for application to reinforced block masonry in recent years. Zheng et al. [8] introduced a core tie column prefabricated block, which was a new style of tie column that offered the advantage of simple construction and low price. Similar to the cast-in-place tie columns, the core tie columns can greatly improve the seismic behavior of masonry walls. Liu et al. [12] proposed wall blocks, which were mainly applied to multi-layer masonry structures and too expensive to be used in single- or bi-layer masonry structures. Huang and Wu et al. [13,14] proposed new type of concrete horizontal-hole hollow-block masonry. The significance of their study was that it implemented a strength design for a new type of masonry and provided a basis for stress and numerical analyses under uniaxial compression behavior. The aforementioned studies show that a large number of prefabricated wall blocks have been applied to masonry structures. However, few articles presented studies on the seismic performance of a masonry structure that uses precast blocks of a ring beam and a constructional column.
With the development in building materials, many energy-saving and environment-friendly materials have been widely used in masonry structures. Among them, the autoclaved fly-ash brick, which is made of lime, fly ash, aggregates, and gypsum [15,16], is a typical material. As a new material, the autoclaved fly ash, which is widely used and rapidly developed [17,18], offers outstanding features such as energy-saving, waste-utilization, and low-cost features. Meanwhile, because of the material characteristics, the manufacturing technical requirement of fly-ash bricks is not high. The density of fly-ash bricks is small because of the small fly-ash particles, poor grain composition, and high saturated-water absorptivity. Kruschwitz and Wardeh et al. [19,20] researched the fly-ash-brick mass loss and strength reduction by experiment. Sahu et al. [21] obtained the optimal moisture content of fly-ash-brick masonry. Their work demonstrated that one of the important reasons for the occurrence of cracks in brick masonry was the expansion and contraction of bricks, which were closely related to water absorption and water loss. Many studies on the material performance of fly-ash brick have been performed, but there are few on the application of autoclaved fly-ash bricks in masonry structures; thus, its seismic performance in a masonry structure needs to be studied in depth.
To solve the limitations of masonry structures, such as poor seismic performance, complicated construction techniques, and energy wastage, this study proposed and presented the analysis of a new type of autoclaved fly-ash-brick masonry wall restrained by an assembly ring beam and a constructional column. First, two new assembly types of reinforced-concrete blocks were constructed, which can be used both as a wall material and a formwork to meet the requirement of a no-template construction process. Second, an axial compression test of autoclaved fly-ash-brick short columns was carried out to analyze the failure mode and obtain the constitutive parameters of the brick. Meanwhile, a low-cyclic loading test of an assembly using an autoclaved fly-ash-brick masonry wall was carried out in a structural laboratory to prove the correctness of the numerical model. Finally, under multiple influencing parameters, the seismic performance of the assembly of autoclaved fly-ash walls was analyzed by a numerical-simulation method using the bearing capacity, stiffness degradation, and displacement ductility.
2. Axial Compression Test of Autoclaved Fly-Ash-Brick Columns
To determine the deformability and compression characteristics of the autoclaved fly-ash brick and establish its constitutive relationship, which is critical in the numerical model [22,23], an axial compression test of the autoclaved fly-ash-brick short column is first carried out.
According to the basic test method of building mortar [24], which specifies the range of mortar strength, the mortar-strength design values of the brick columns were M7.5, M10, and M15. When building brick columns, mortar test blocks were cast to maintain the same condition for the material. The strength value of the mortar was tested using a pressure-testing machine. The average values of the mortar were 7.55, 10.12, and 14.89 MPa. Meanwhile, two halves of the brick were bonded using 32.5 MPa ordinary cement. The specimen was loaded with a maximum load by the pressure-testing machine. The test results showed that the average value of the brick compressive strength was 12.36 MPa.
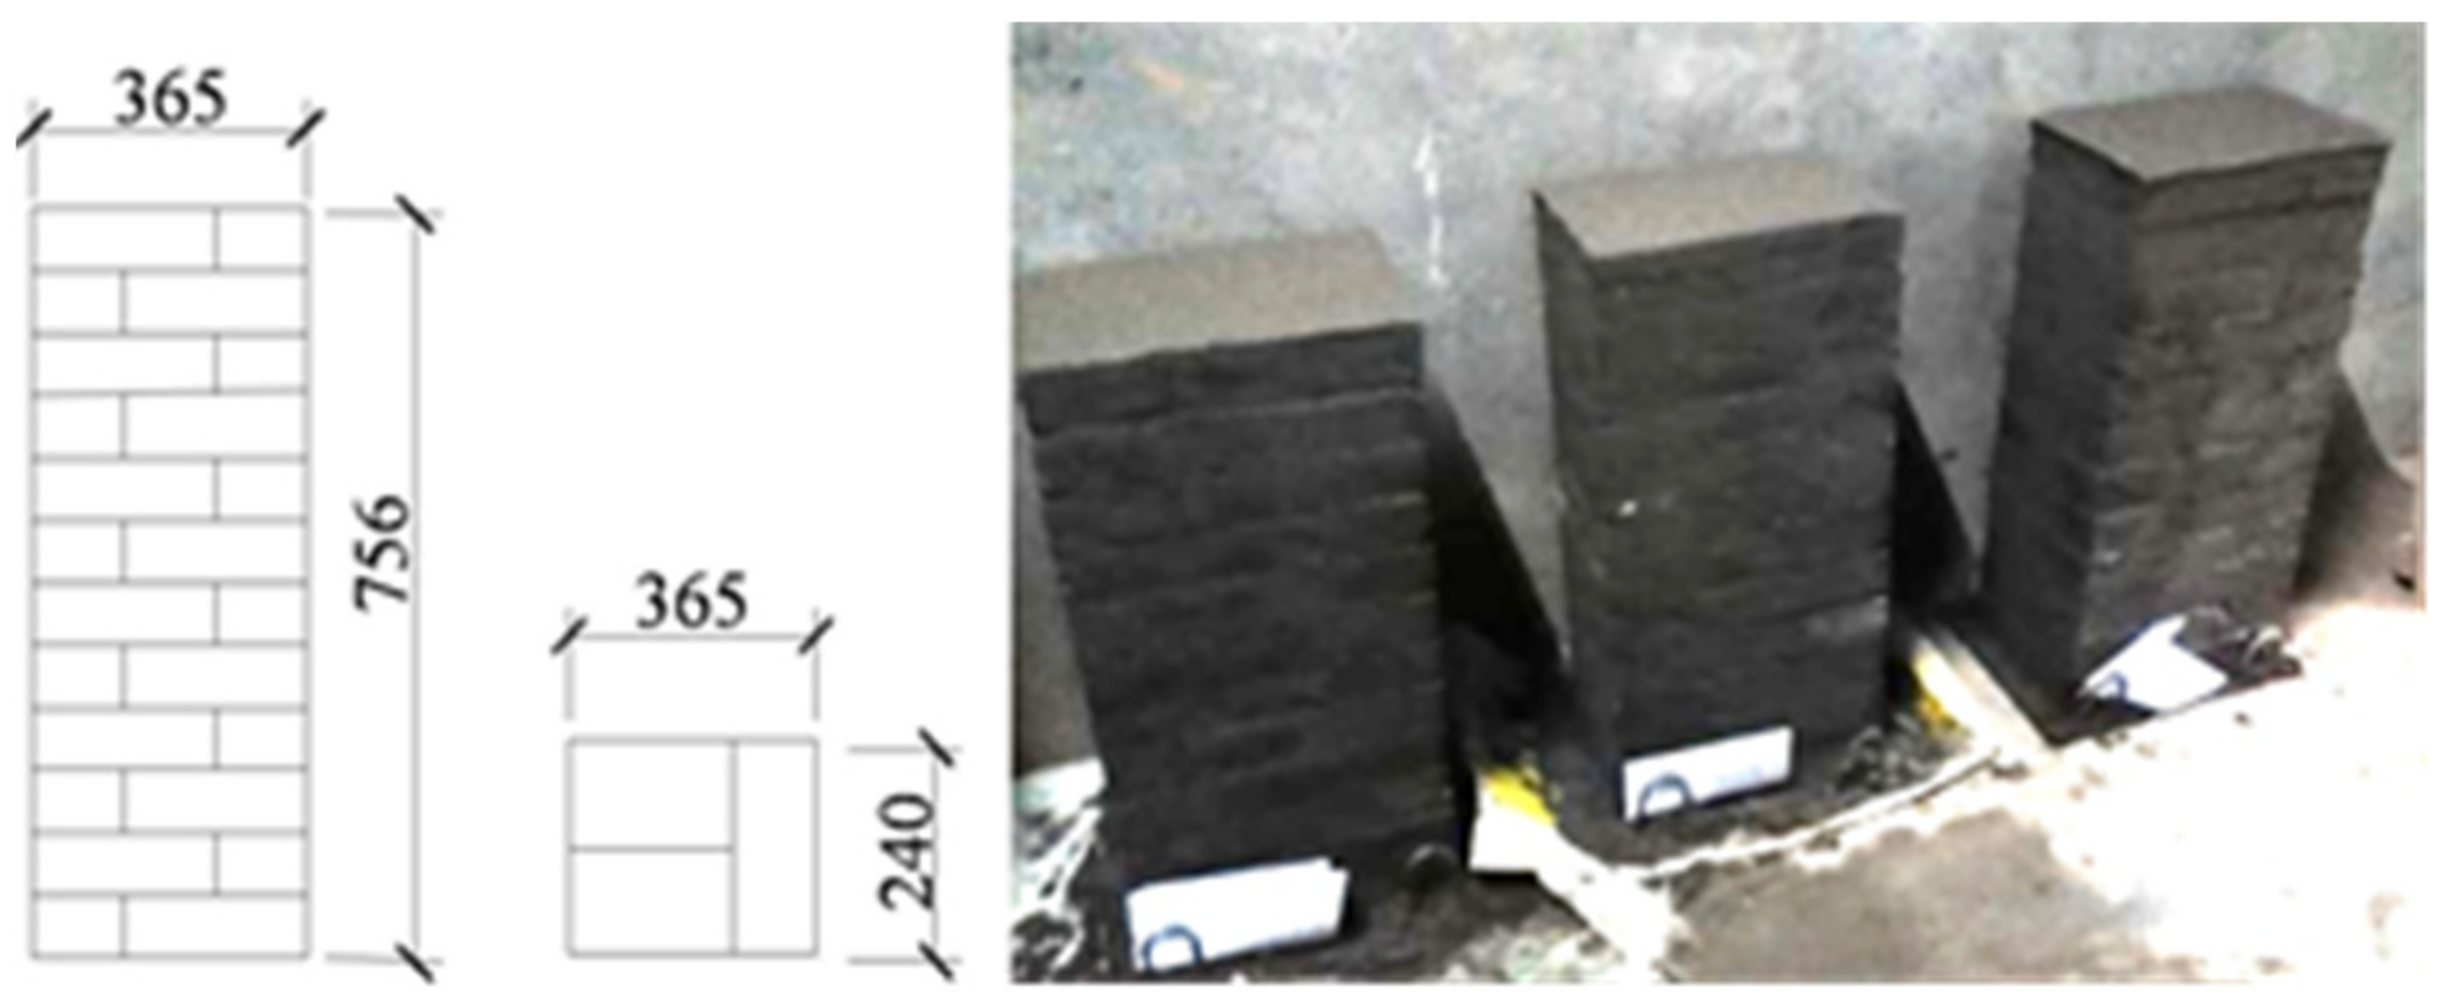
All the brick columns were constructed using autoclaved fly-ash bricks with a typical size of 240 mm × 115 mm × 53 mm (L × B × H) and 10-mm-thick cement mortar. The dimension of the autoclaved fly-ash-brick columns in the axial compression test was 240 mm × 365 mm × 756 mm, as shown in Figure 1.
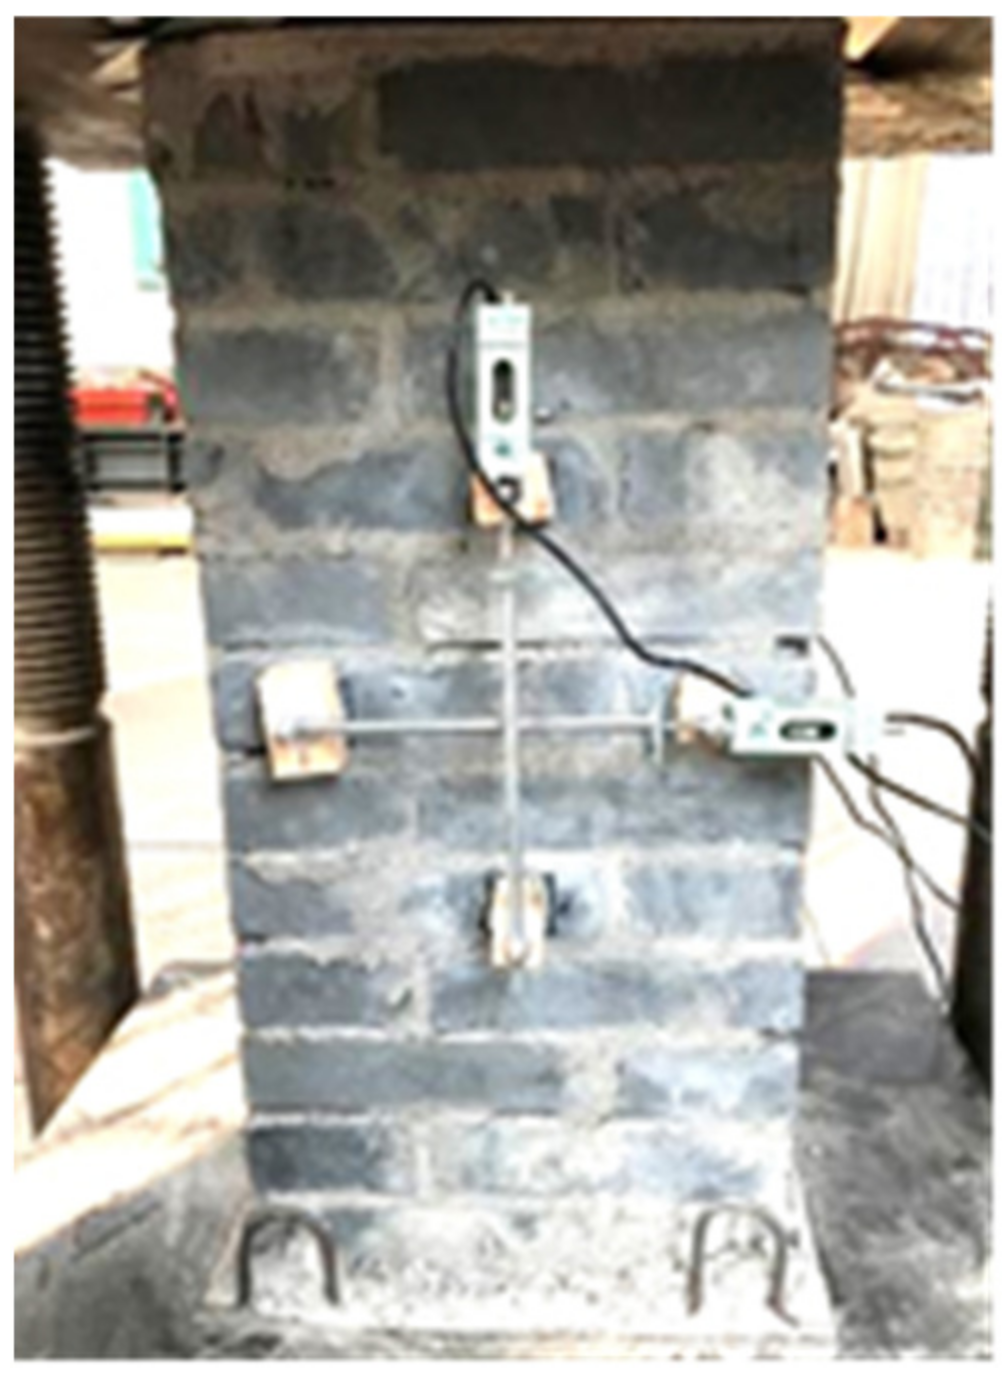
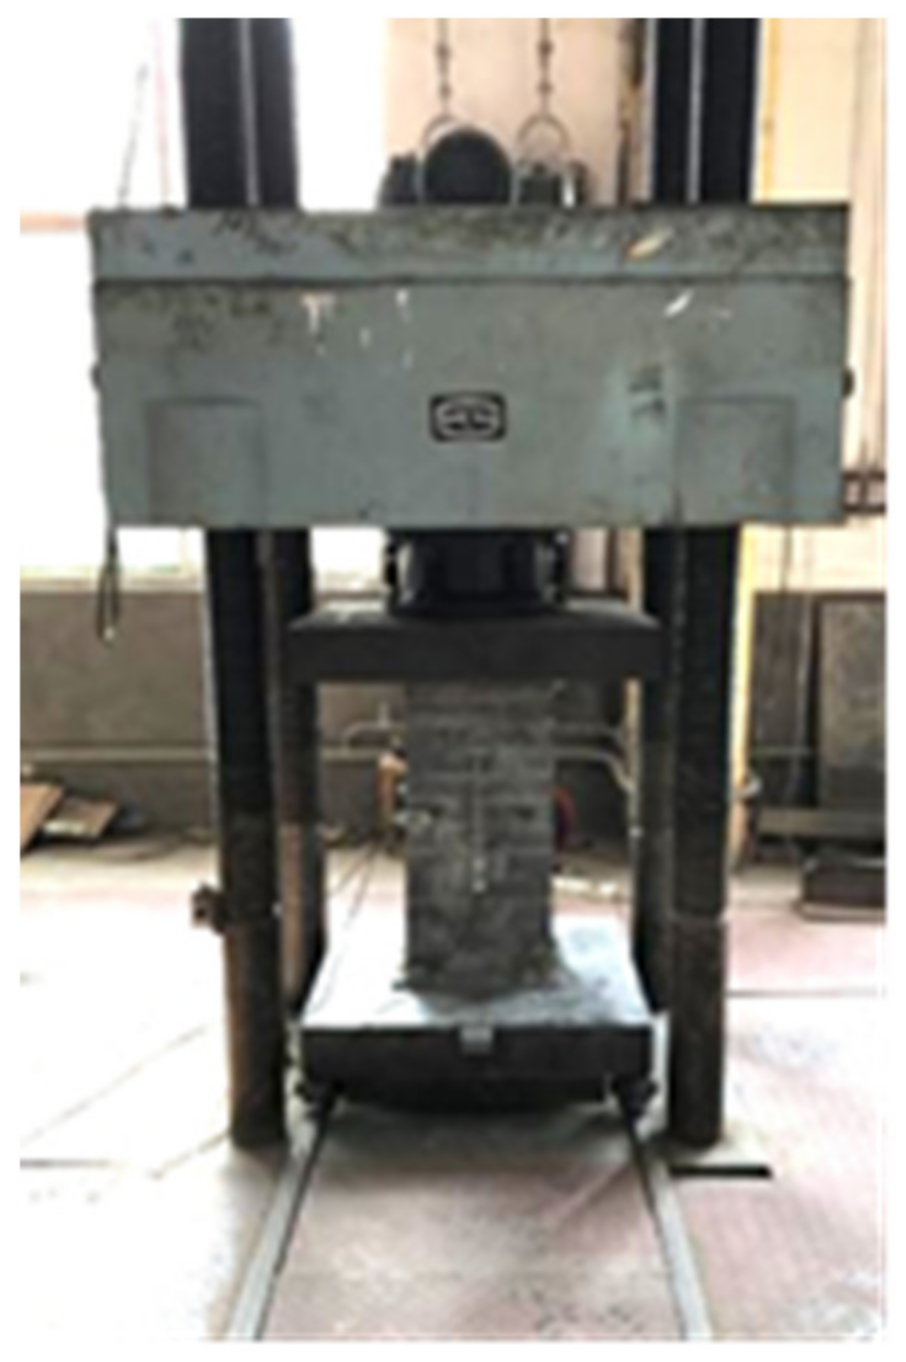
To obtain the stress–strain curves of the short brick columns, the deformation data were collected using displacement sensors, and the pressure value was recorded using the test machine. The test device was composed of a pressurized system (5000 kN pressure-testing machine), a press buffer system (jack and oil pump), and a measurement system. The actual load value of the test specimen was measured by a 1000 kN pressure sensor installed at the top of the test piece. The overall compression deformation of the test specimen was measured using an electrical indicator at the bottom of the test piece. Two micrometers were installed at the longitudinal and transverse centers of the test piece to test the longitudinal and transverse deformation, respectively. After the measured data were processed by the dynamic strain gauge, the load–displacement curves of the specimen were directly plotted on the X–Y function recorder. The micrometers were mounted on the test piece, as shown in Figure 2. The brick column was mounted on the test device, as shown in Figure 3.
The compressive performance of the autoclaved fly-ash-brick masonry mainly included the stress–strain curves and elastic modulus, which provided the parameters for seismic performance and numerical simulation analyses of the wall structures.
2.1. Test Phenomena and Deformation Characteristics
2.2. Stress–Strain Curve
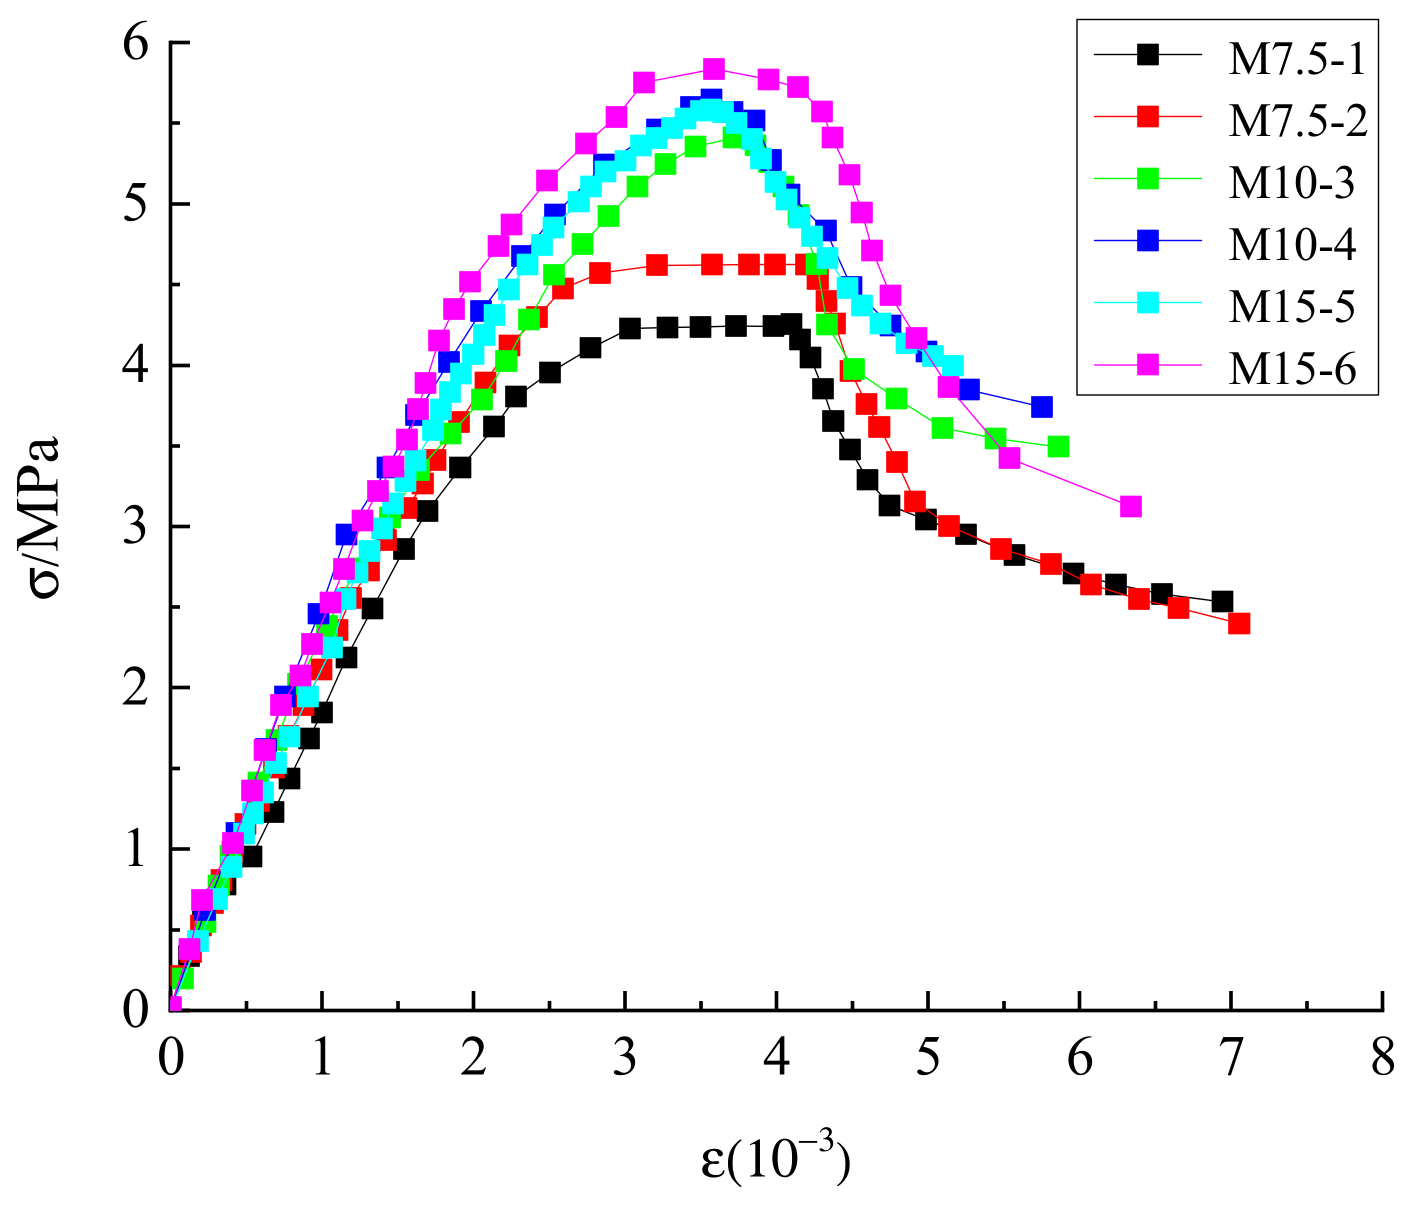
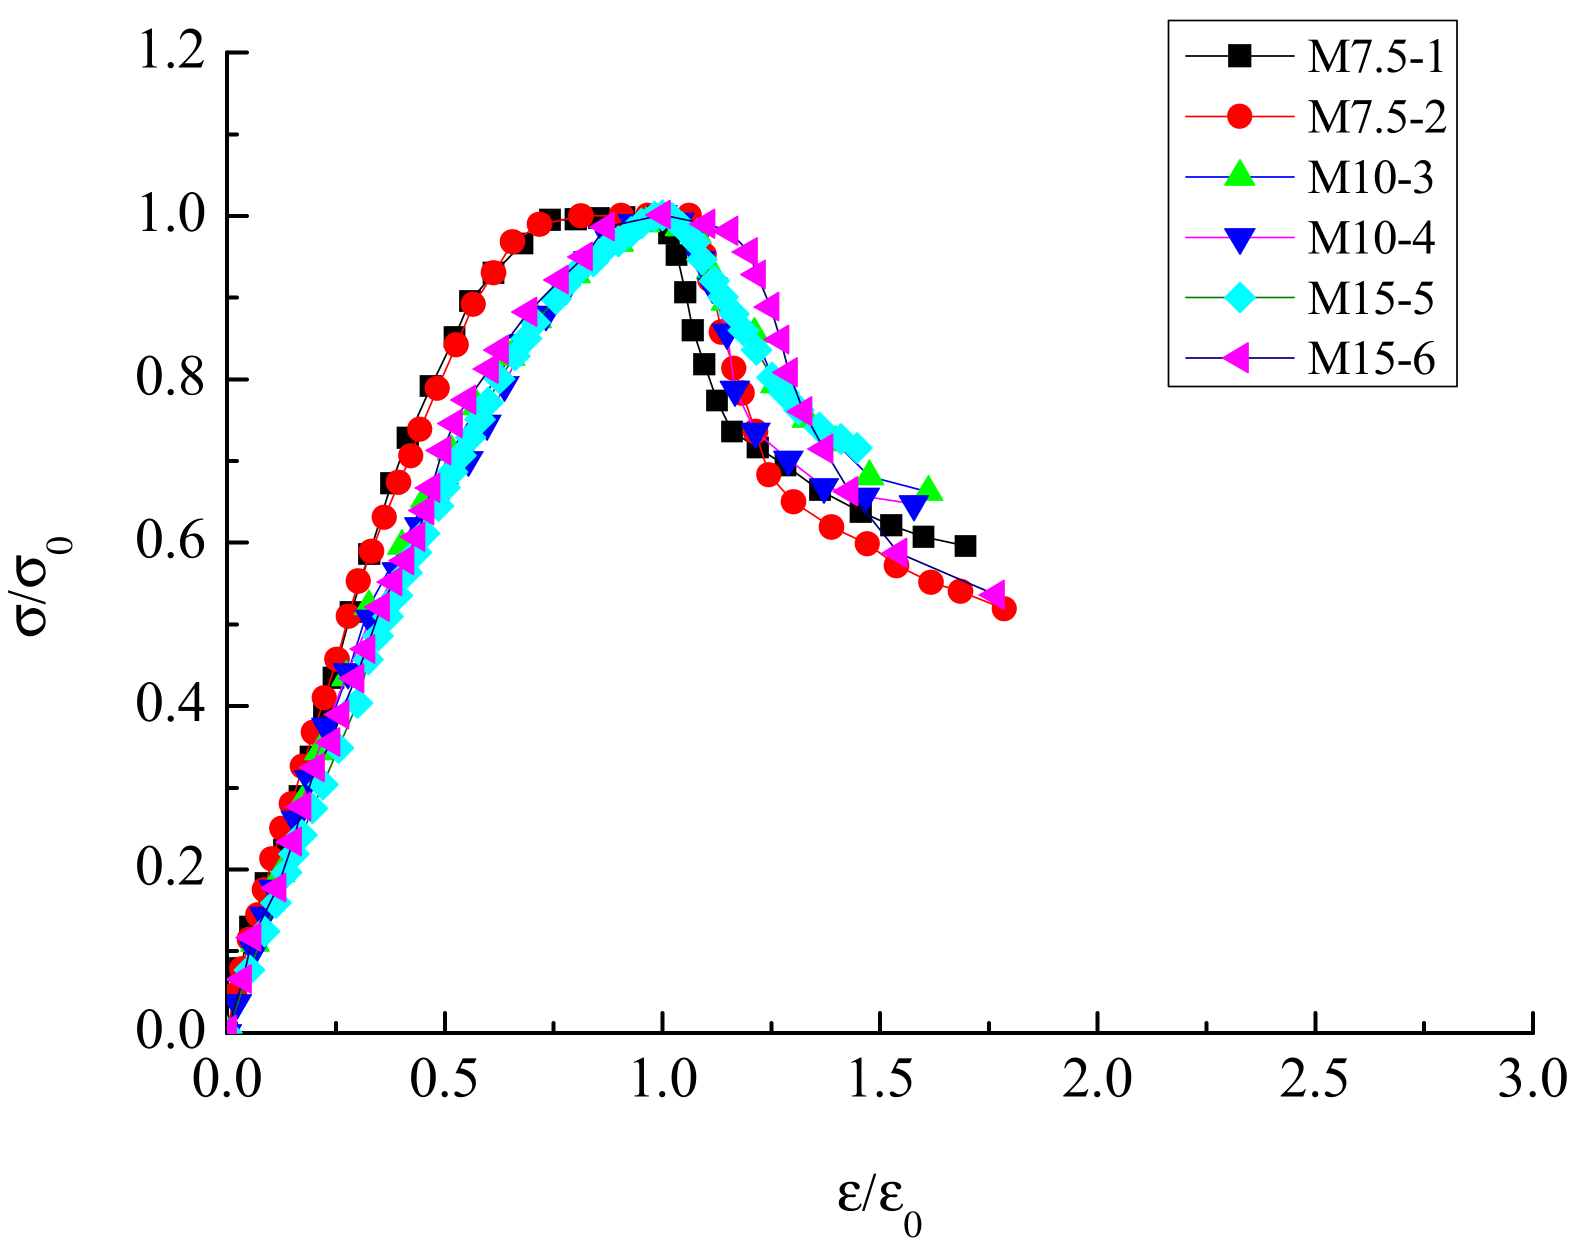
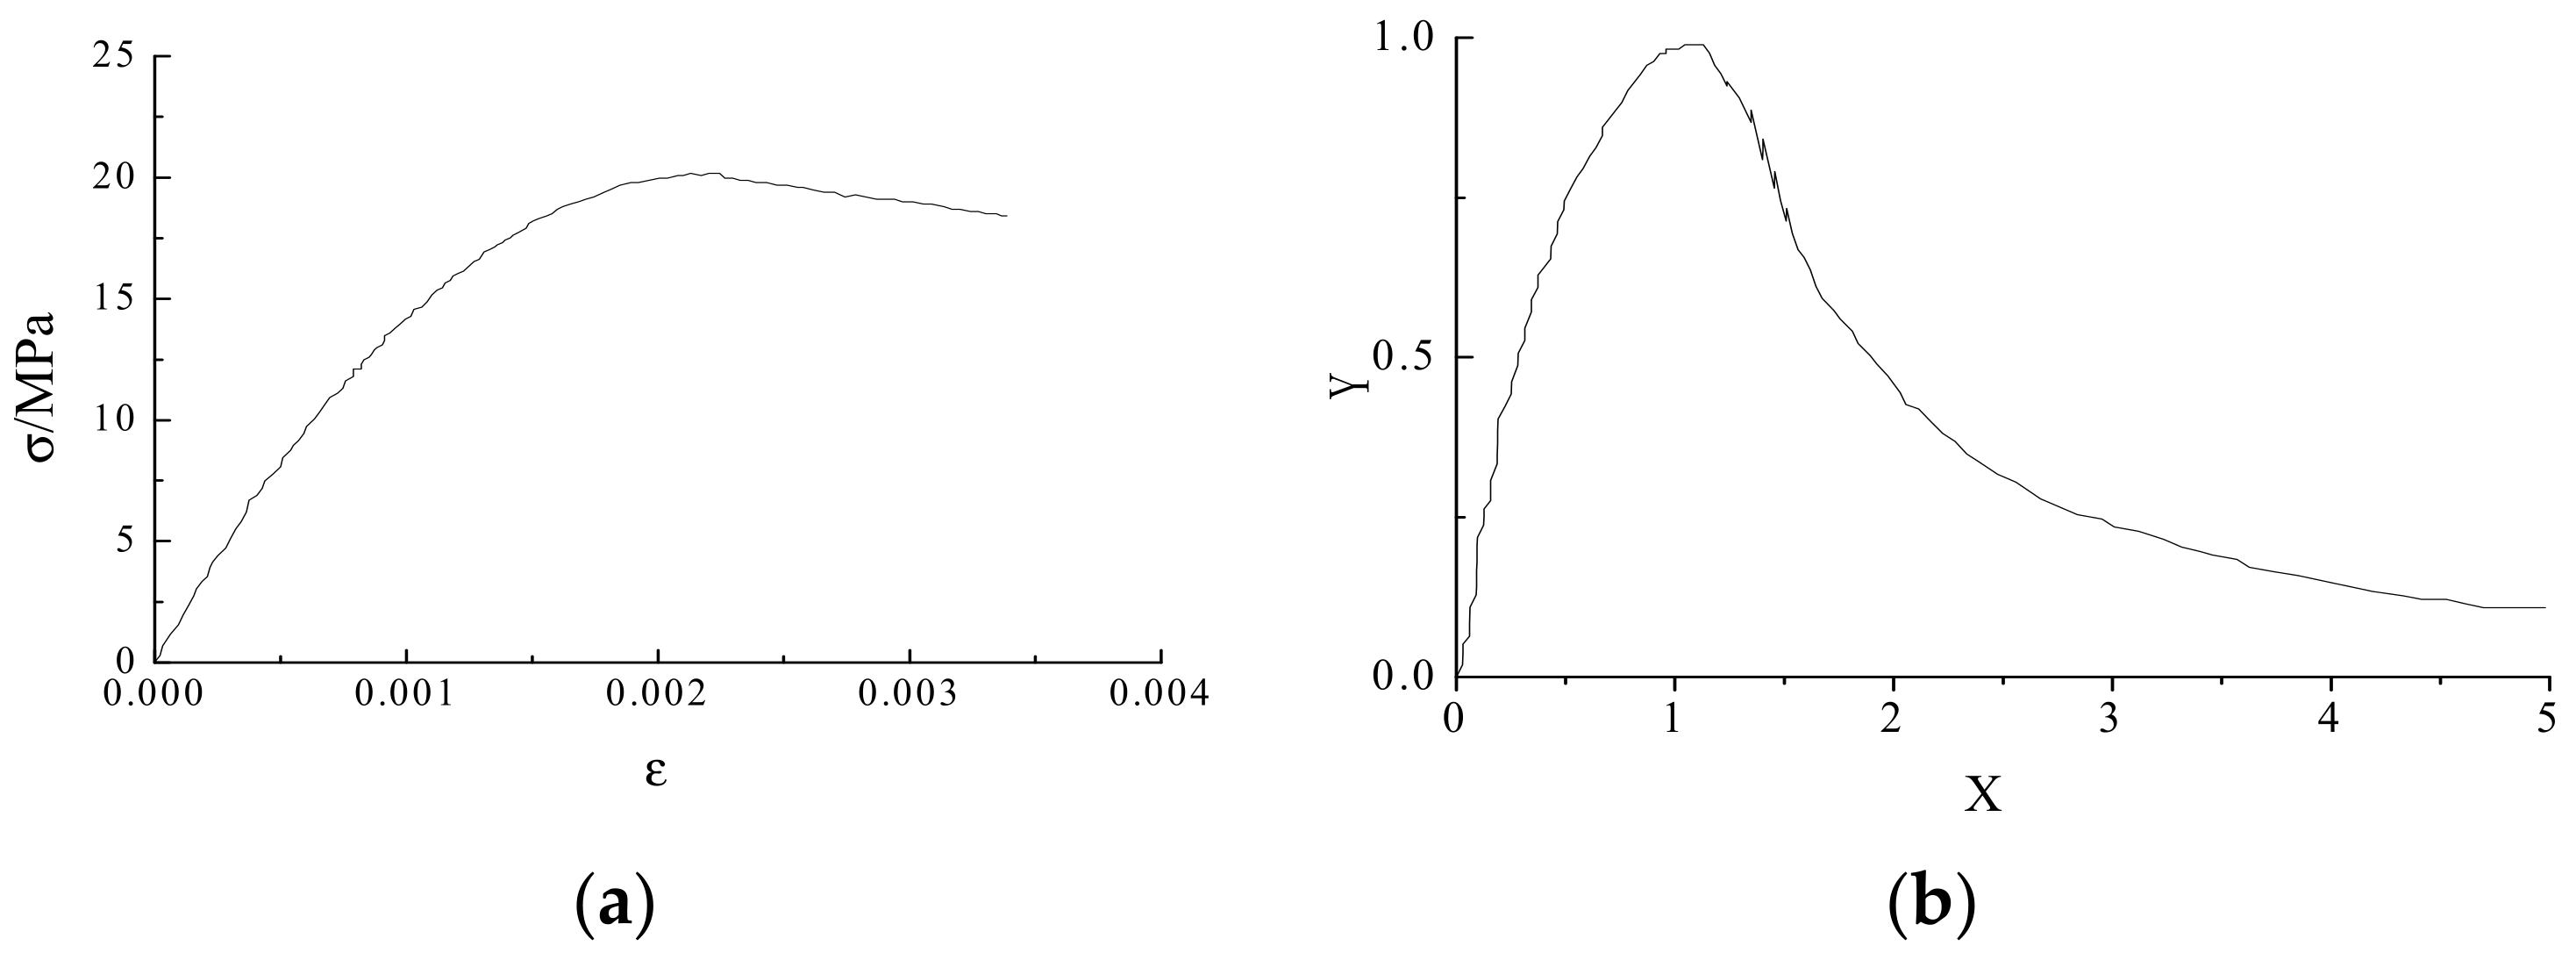
The stress–strain curves of the autoclaved fly-ash-brick short column with M7.5, M10, and M15 mortar strength obtained from the test are shown in Figure 5. The constitutive relationship of the autoclaved fly-ash-brick short column was analyzed using the dimensionless stress–strain curve in which dependent variable x = ε/ε0 and independent variable y = σ/σ0 by normalization [25,26], as shown in Figure 6. σ0 indicates the peak compressive stress, and ε0 denotes the peak compressive strain.
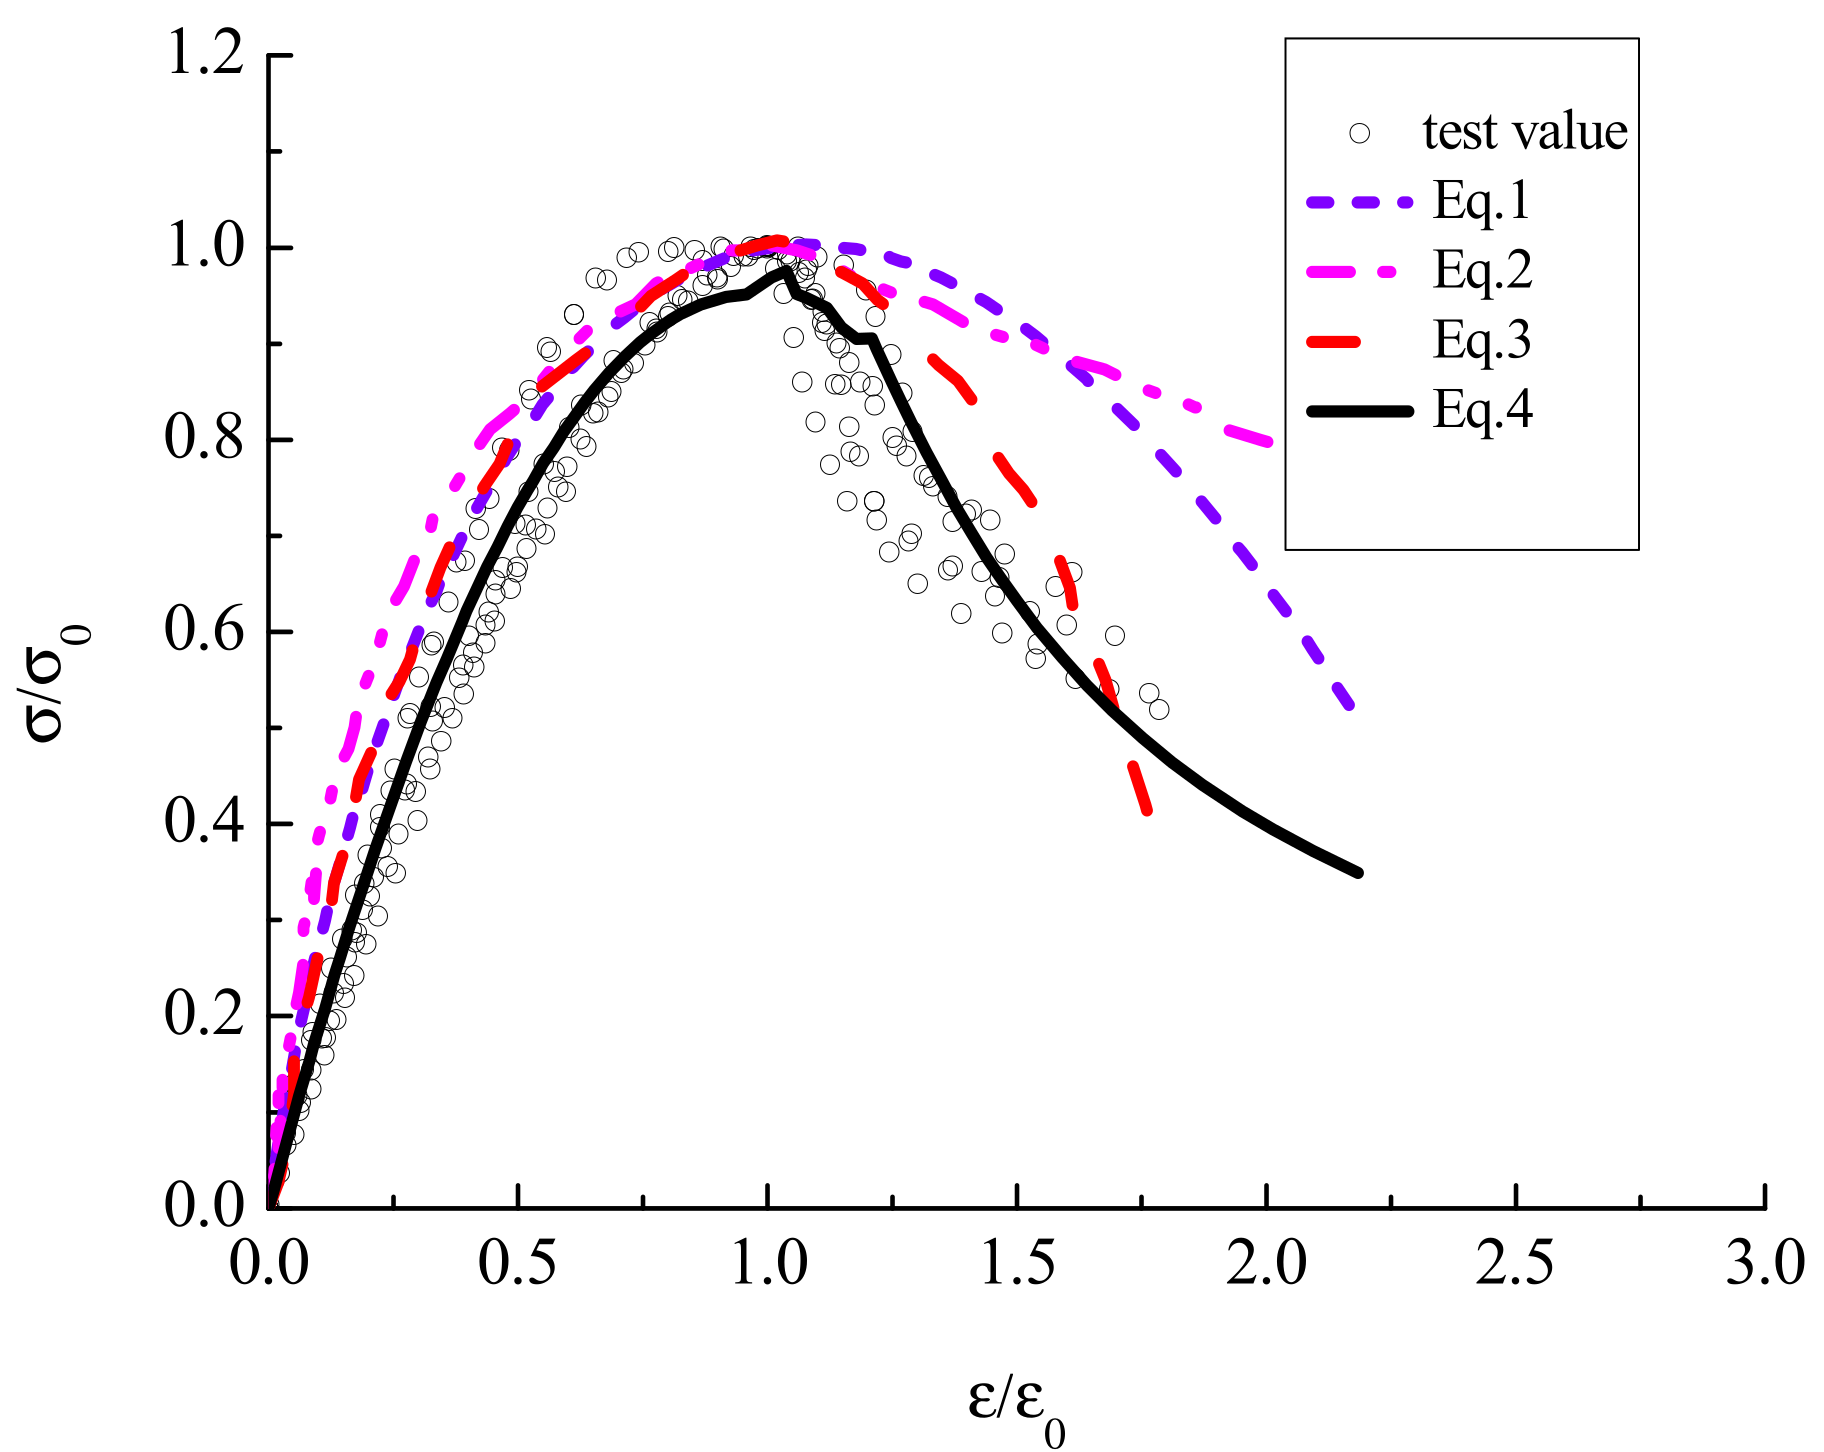
The experimental results showed that the cracking and failure processes of the brick specimens were similar. From the experimental phenomenon and normalized stress–strain curve of the autoclaved fly-ash brick, a large difference in the curve trend was observed between the upward and downward sections. The constitutive curve should include the elastic-limit, peak, anti-bending, and other numerical points. Mendola et al. [23] investigated a no-tension material using the non-linear stress–strain law in compression, and the constitutive relationship was obtained, as expressed in Equation (1). Zhu et al. [27] carried out many axial compression tests to study the compression constitutions of a common brick, and the constitutive relationship was obtained, as expressed in Equation (2). Naraine et al. [28] conducted a brick-masonry test to obtain a geometrical model for the uniaxial cyclic compressive behavior of brick masonry, which determined several focal points in the uniaxial stress–strain plane based on the geometrical properties of the experimental cyclic stress–strain curves, as expressed in Equation (3). With reference to the literature [23,27,28]), the current study presented a simple form of autoclaved fly-ash-brick constitutive relationship that is beneficial for model convergence. The ascending segment of the curve adopts a quadratic parabolic form, which includes the elastic-limit and peak points of the stress. The drawdown segment of the curve satisfies the boundary condition in a fractional form, including the peak, anti-bending, and convergence points of the stress. The stress–strain relationship of the autoclaved fly-ash-brick short column is modeled using test data, as expressed in Equation (4).
The correlation stress–strain curves obtained from other studies in the literature and the test points are shown in Figure 7. The constitutive curve proposed in this study was consistent with measured data. In the numerical model, the constitutive relationship expression is simplified, which is beneficial for numerical analysis calculation. The other constitutive relationship curves show relatively high performance, and the test-data points basically fall below the curves, indicating that these curves are not suitable for describing the compressive stress–strain characteristics of the fly-ash-brick masonry.
3. Numerical Simulation Analysis and Verification
3.1. The Numerical Model of Assembly Autoclaved Fly-Ash-Brick Wall
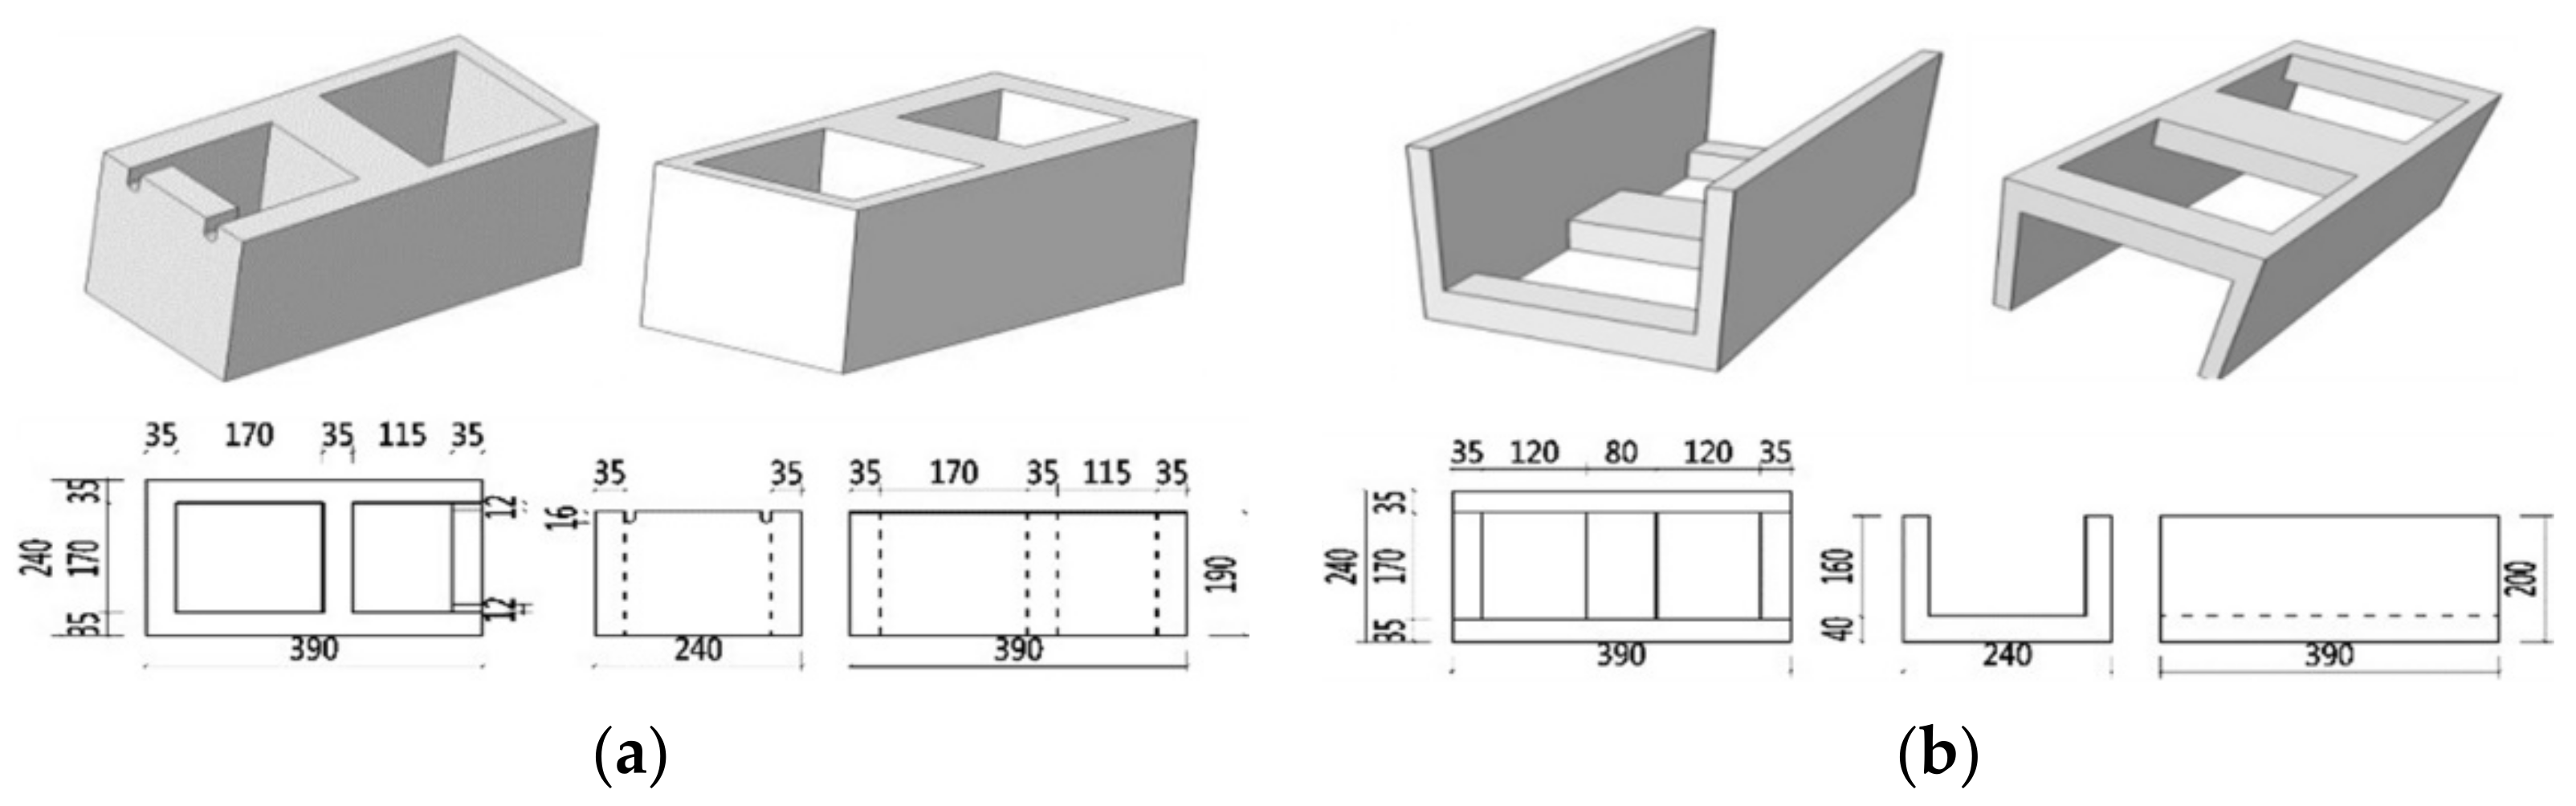
In order to simplify the construction process and shorten the construction period, two new types of template block were designed to replace steel or wood templates for the constructional column and ring beam [29], which are shown in Figure 8. The constructional column and ring beam blocks were constructed in the wall, in which the concrete was poured into the hole and the rebar was placed in the internal groove to build the constructional column and ring beam. The autoclaved fly-ash-brick was used as the wall material. The advantages of such block templates are that they can be the permanent part of the columns or beams and work with the concrete poured inside them. A typical model of assembly autoclaved fly-ash-brick masonry wall is shown in Figure 9. All dimension units are millimeters unless otherwise stated.
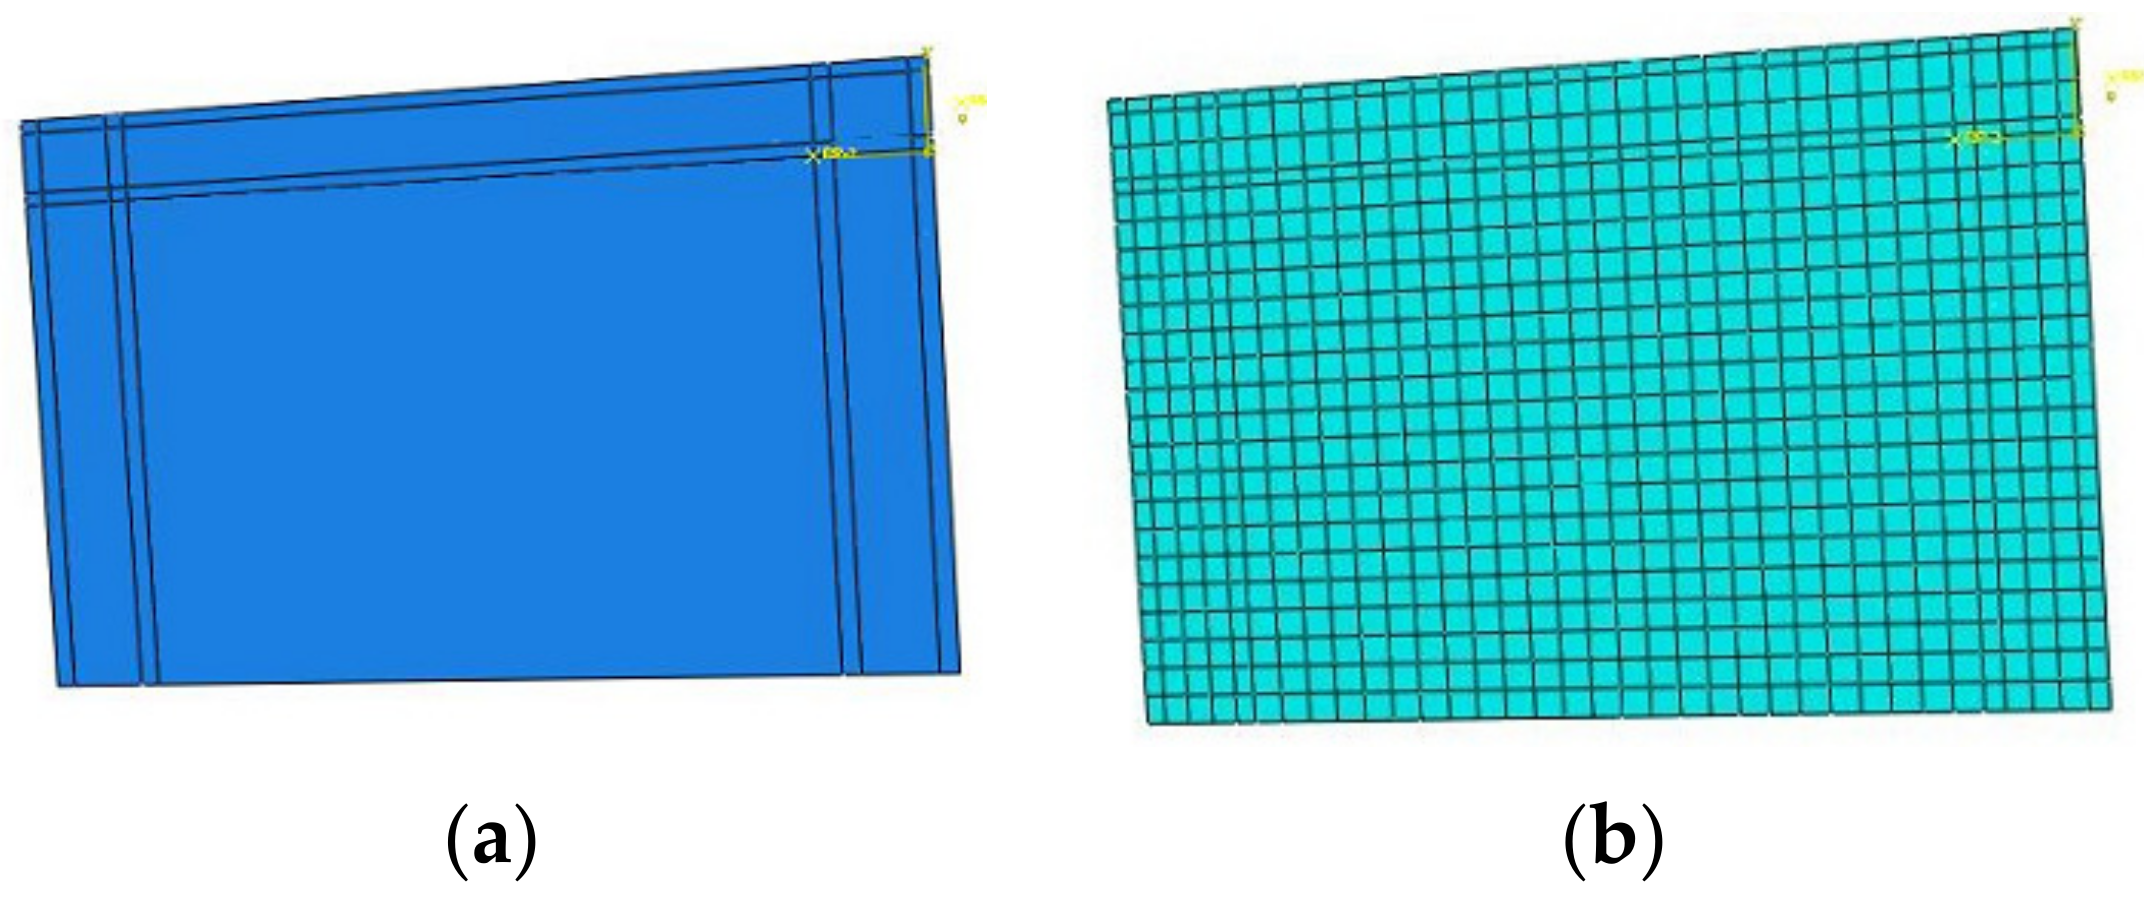
To generate an idealized numerical model and analyze the structural system, the macro-scale approaches of masonry walls were adopted in the numerical simulation [30]. The assembly wall models were established by numerical software ABAQUS, in which the C3D8R and T3D2 elements were selected to simulate the concrete, brick, and steel reinforcement, respectively [31], as illustrated in Figure 10. The units were meshed as 4 mm × 2 mm × 2 mm (length × width × height), in which the influence of the mesh density on the bearing capacity was small. The penalty stiffness value was 5 × 10⁵ N/mm3, and the influence of the penalty stiffness was negligible in analyzing the structural aseismic performance [32]. The concrete damage plasticity model was selected to simulate the nonlinear behavior of the masonry blocks, and the “embedded” command was used to simulate the interaction between the concrete and steel. The ring beam and constructional column blocks and cast-in-place concrete were two separate parts connected by the binding command. The constitutive model of autoclaved fly-ash-brick was obtained from the test, while the constitutive model of the new type of blocks was obtained from other researchers [8,32,33], the constitutive relations and curves of which are presented in Equations (5)–(8) and Figure 11, respectively.
The compression constitutive relation of the assembly concrete blocks in the constructional columns and ring beams is expressed as follows:
in which σ, ε, σc, and εc are the stress, strain, peak stress, and peak strain, respectively, under uniaxial compression. According to GB50003-2011 [25], the strain εc was 0.0022 and the ultimate strain εu was 0.0034.
The tension constitutive relation of the assembly concrete blocks, which used the concrete damage plasticity model, in the constructional columns and ring beams is as follows:
in which and is the correlation parameter of the uniaxial tensile stress–strain curve, is the uniaxial tensile strength value, is the tensile strain value corresponding to .
3.2. Verification of Assembly Masonry Wall Model
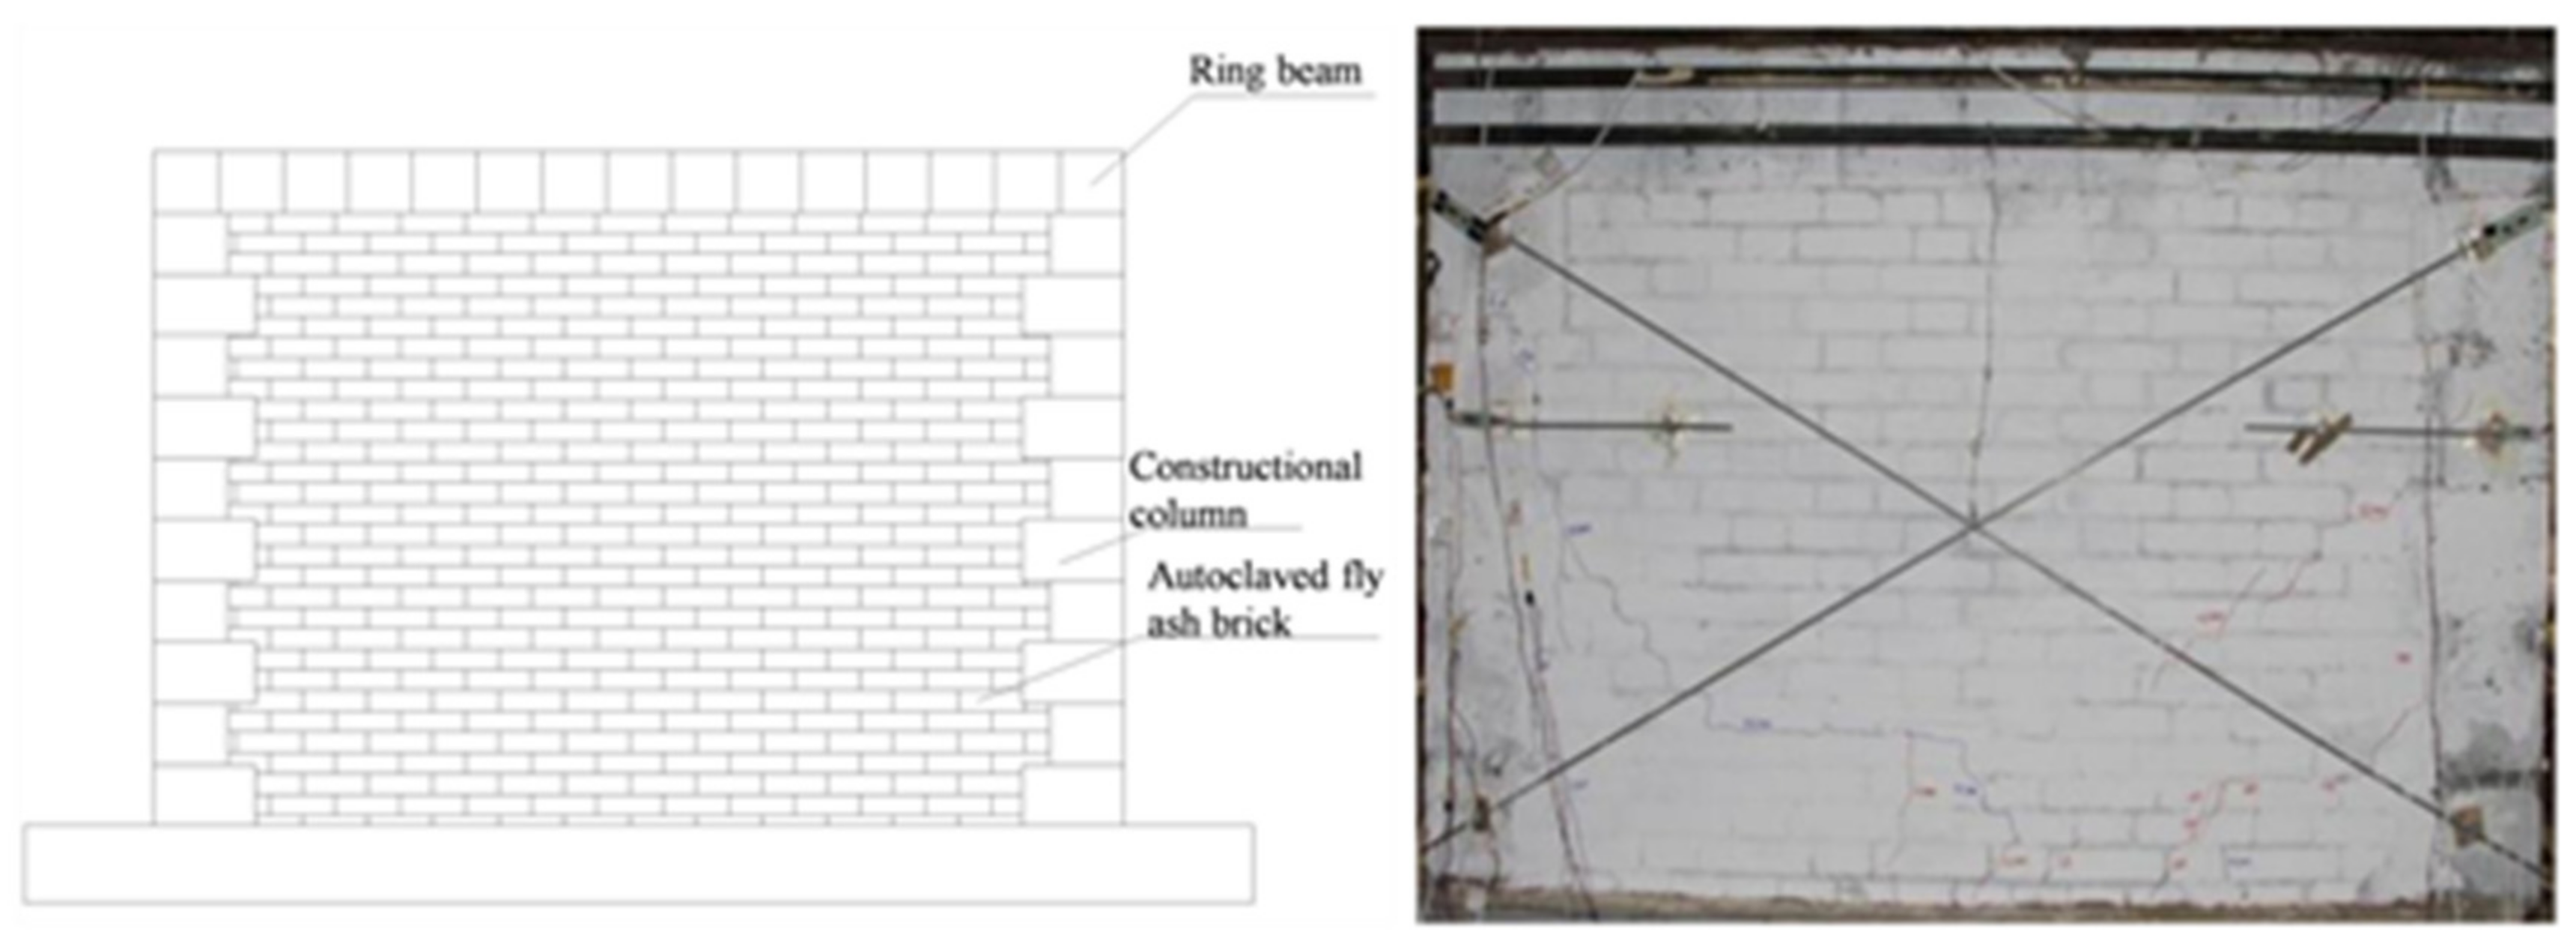
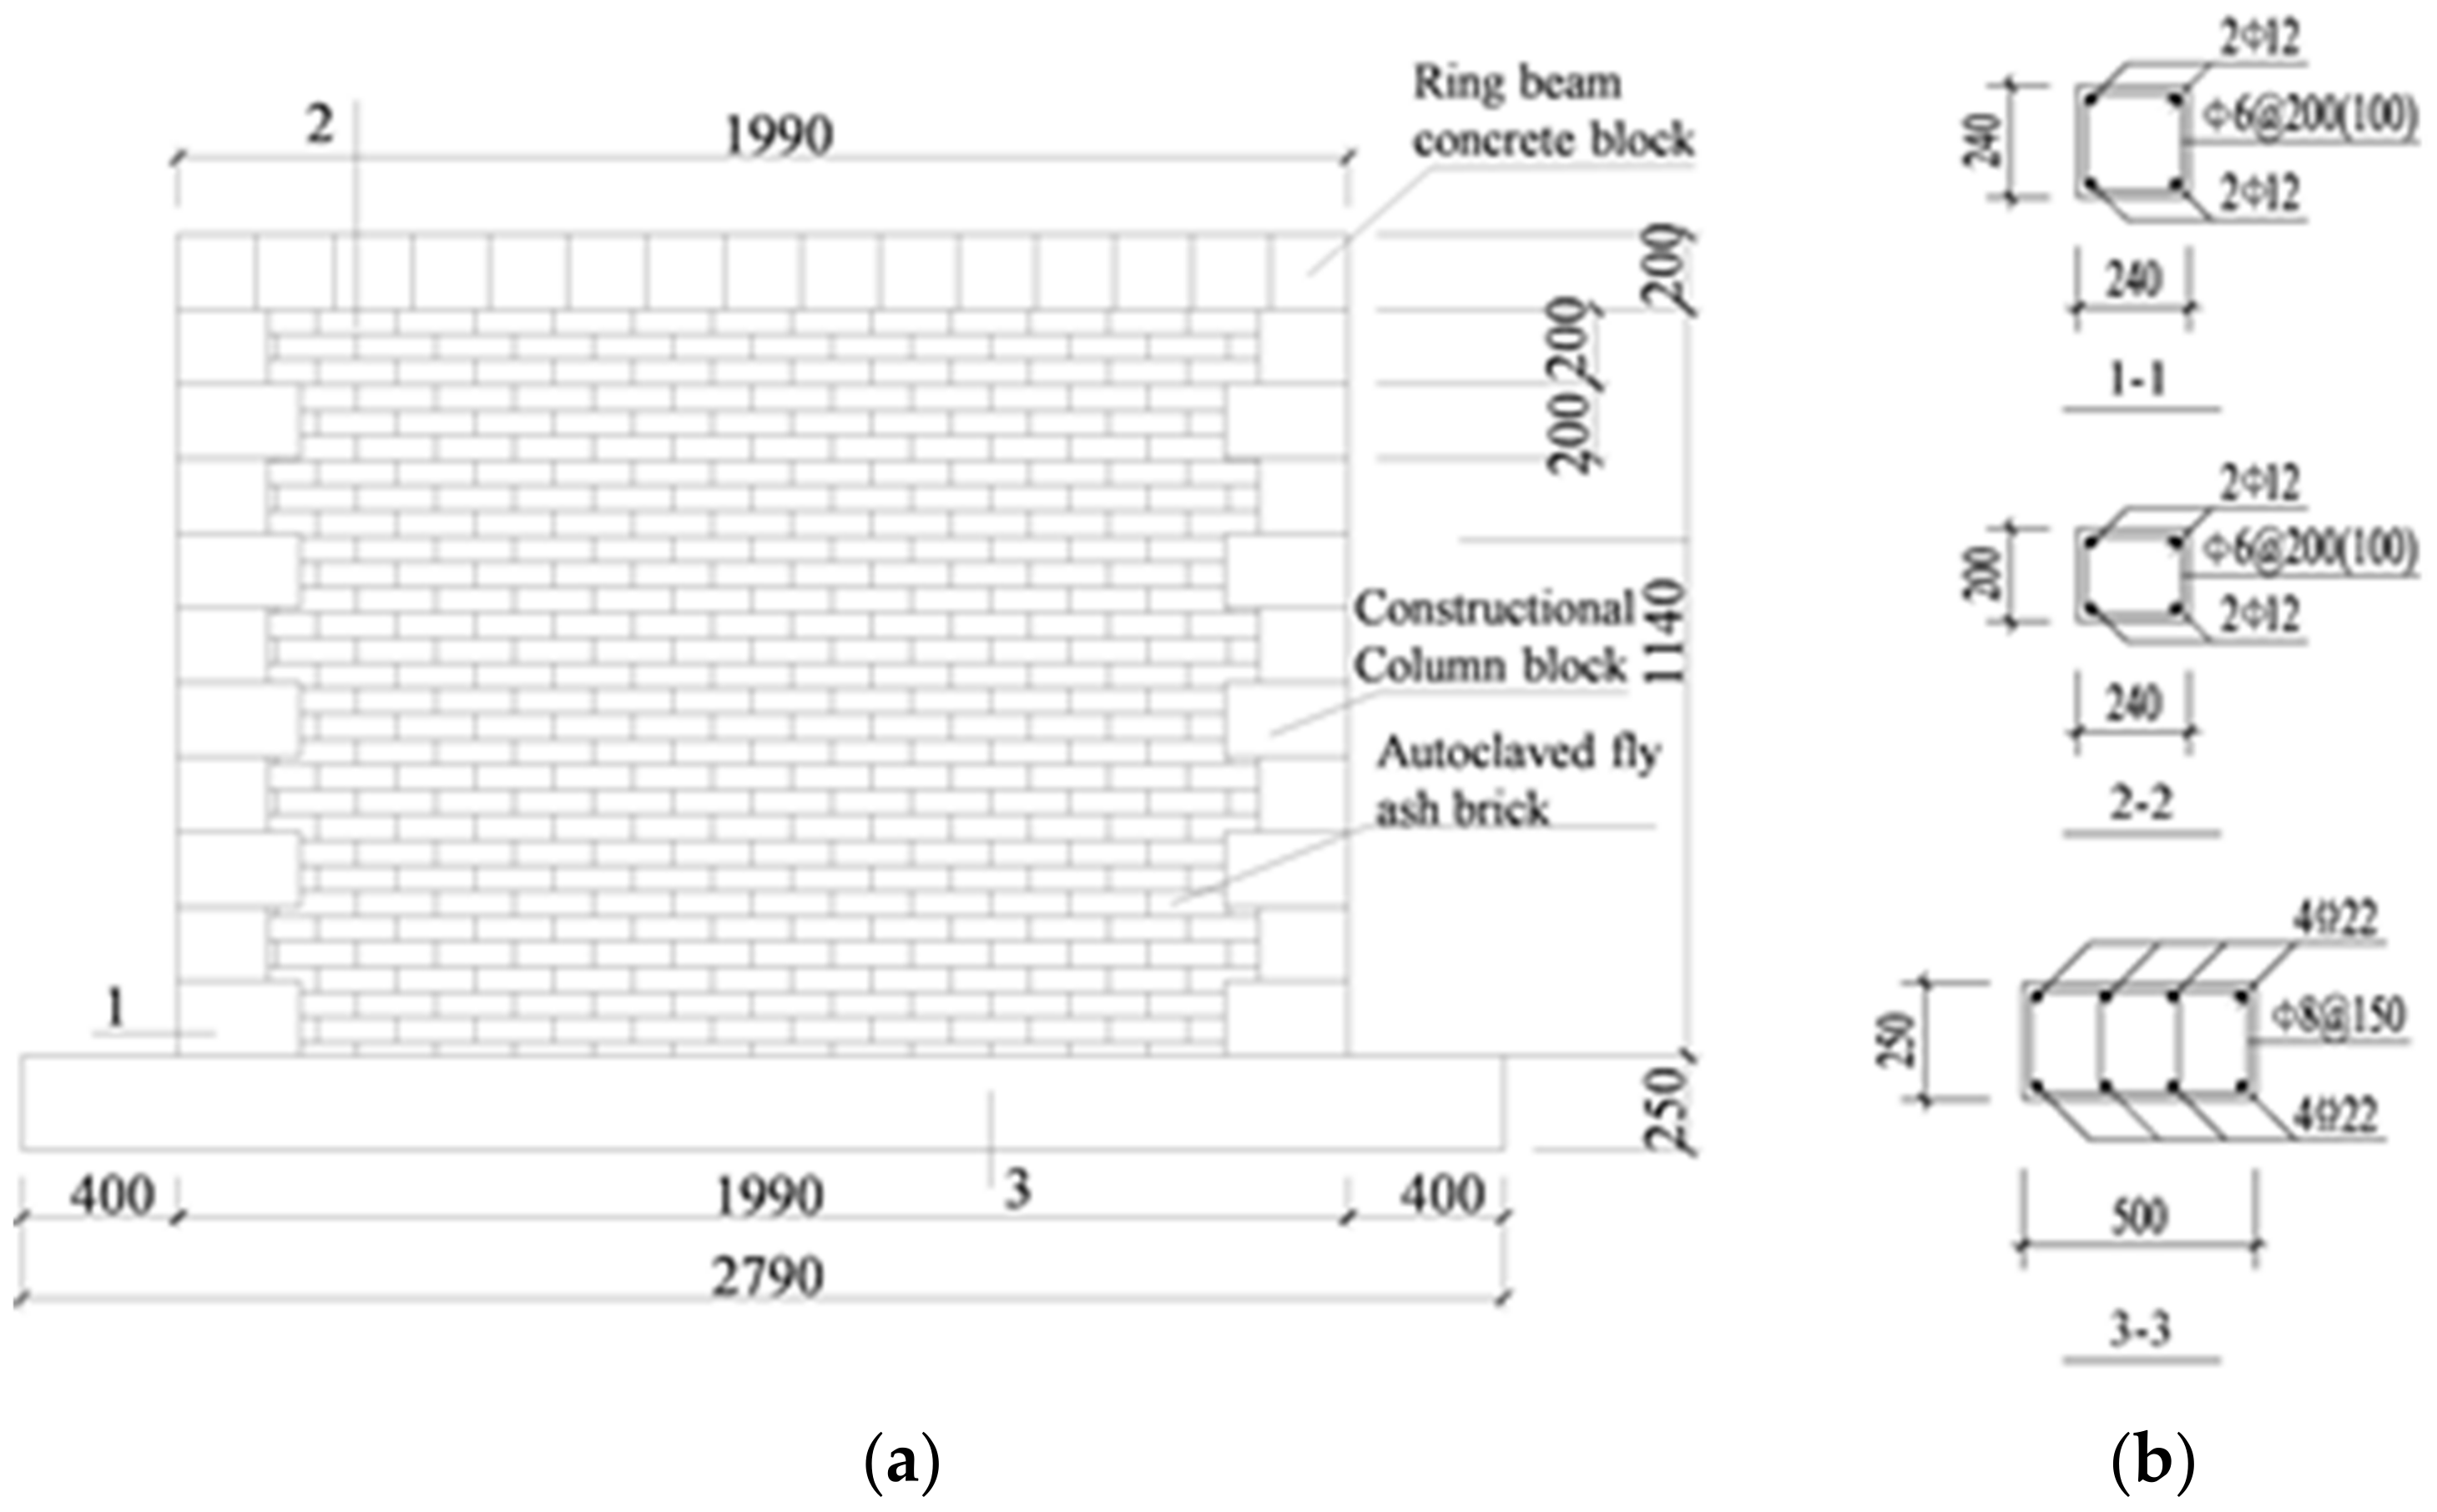
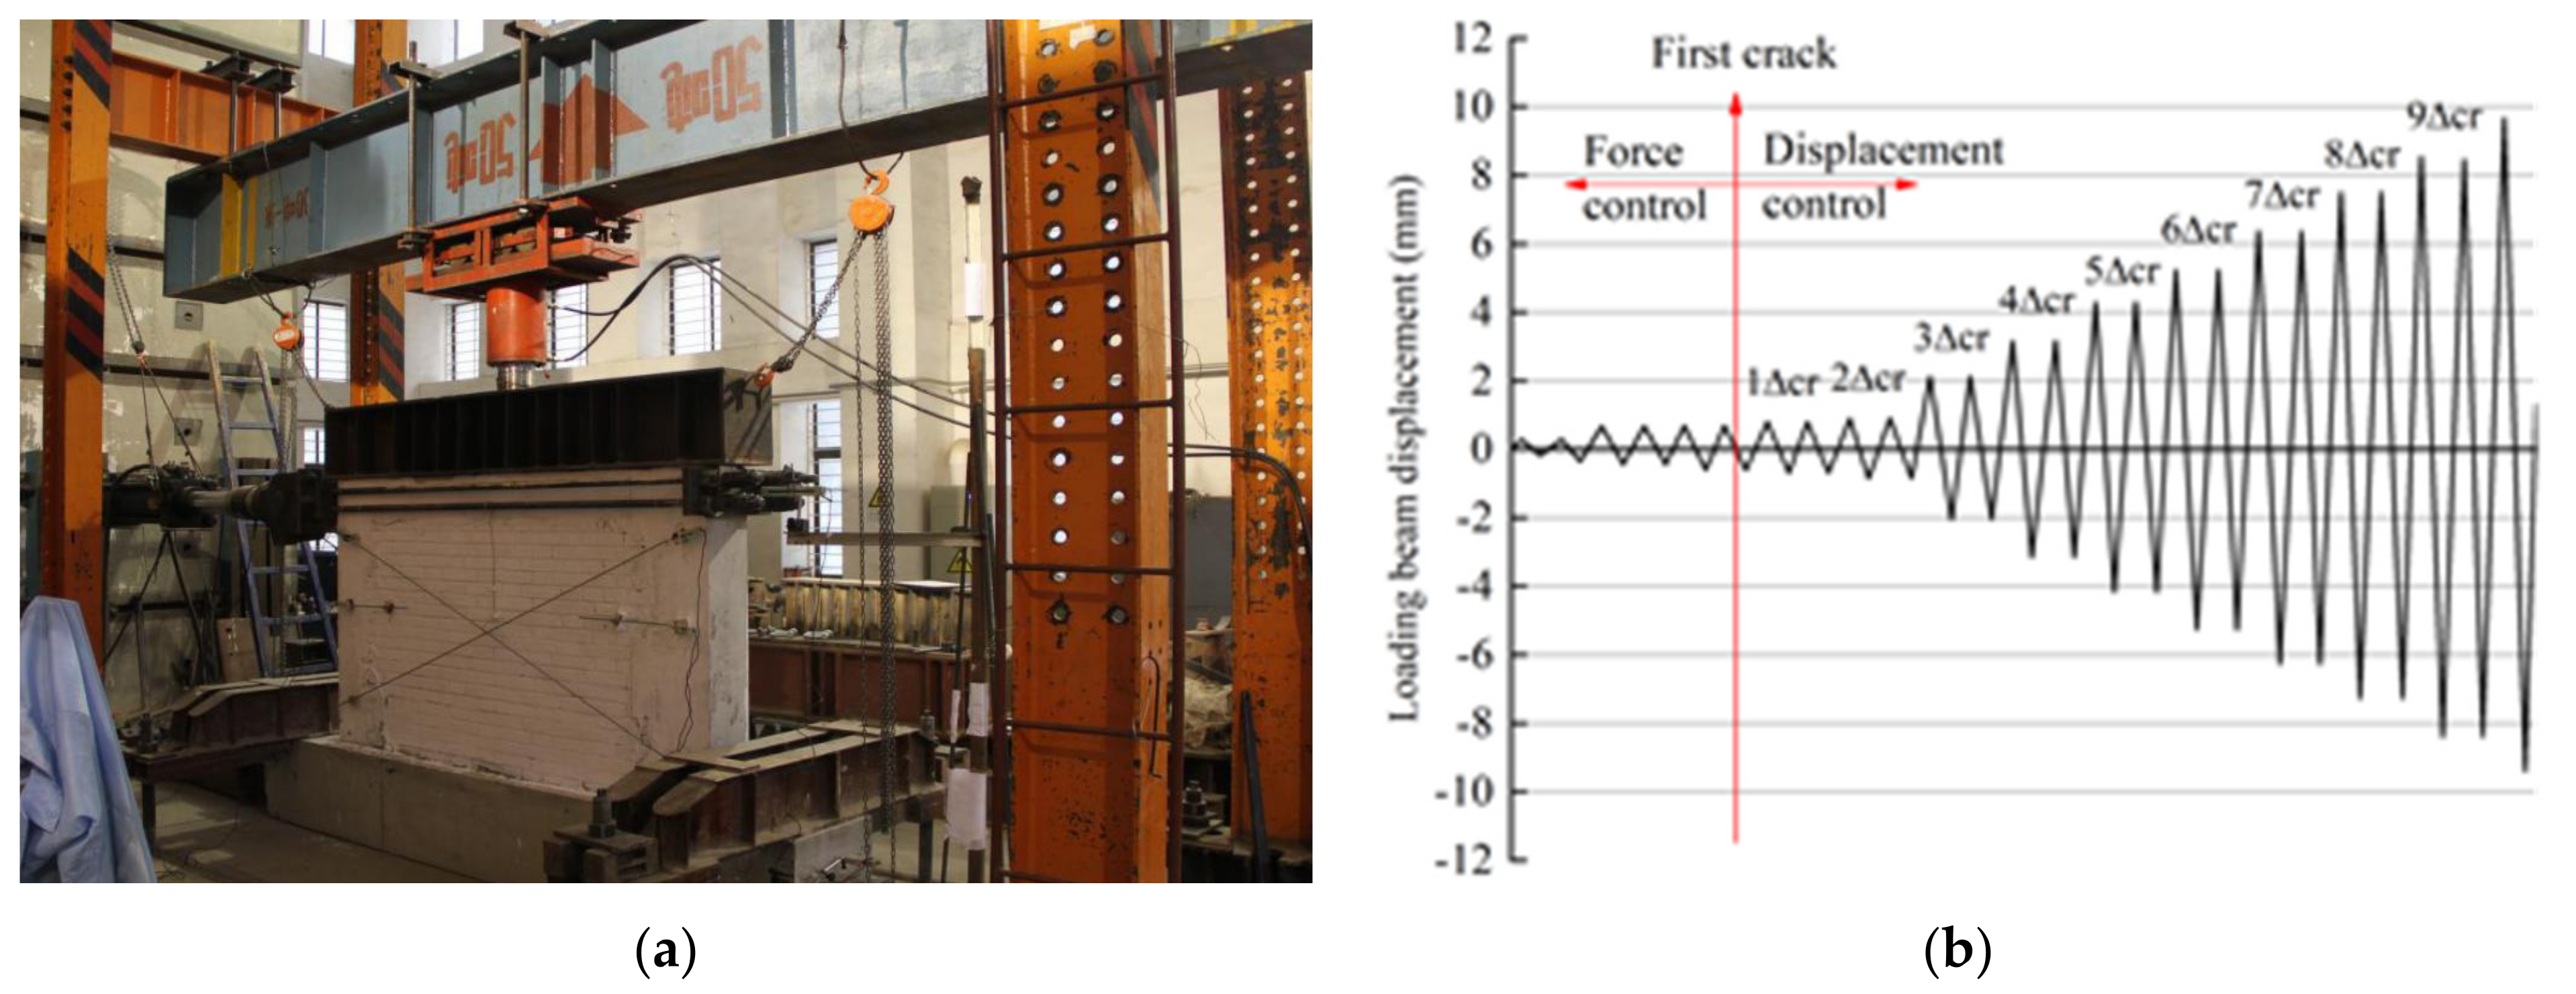
A low-cyclic loading test of the full-scale assembly using an autoclaved fly-ash-brick masonry wall was carried out in a structural laboratory to study the seismic responses of the brick masonry wall. By contrasting and analyzing the assembly masonry wall adopted by the above constitutive models and cyclic–load testing results, the purpose was to verify the correctness of the wall models’ parameters. The parameters of the test wall are shown in Table 2 and the detailed diagram of the assembly of the masonry wall is shown in Figure 12. The test wall consisted of four parts: ring beam, constructional column, brick wall and base beam. All the brick walls were constructed by autoclaved fly-ash-brick with typical size of 240 mm × 115 mm × 53 mm and 10 mm thickness cement mortar. The base beam were made of concrete which was installed together with brick masonry part by using epoxy mortar. The elastic modulus value of the autoclaved fly-ash-brick was measured by the secant modulus of 0.4 σ0 (peak compressive stress) on the stress-strain curve in the micrometer from Figure 9. Material properties of masonry unit and mortar were measured from the material property tests, as listed in Table 2. The test setup is shown in Figure 13a. The base beam was constrained by four screws in the vertical direction and two jacks in the lateral. In order to keep compressive loadings uniform and vertical, steel rollers were placed between ring beam and transfer beam with equal distances. The test wall was subjected to vertical load and cyclic lateral load until the wall was damaged. Before the application of the lateral loadings, the compression load was firstly applied to 0.60 MPa, and remained constant towards the end of the test. During the test, the cyclic lateral loadings were controlled by force initially and by displacement after cracking occurred. The initial displacement of the crack occurred defined as Δcr, and the lateral loading scheme for the cyclic tests is shown in Figure 13b. The maximum displacement value was 20 mm, or the bearing capacity of the wall corresponded to 85% of the ultimate load. The test wall was constructed with the same geometry, brick arrangement and material properties as the numerical wall model.
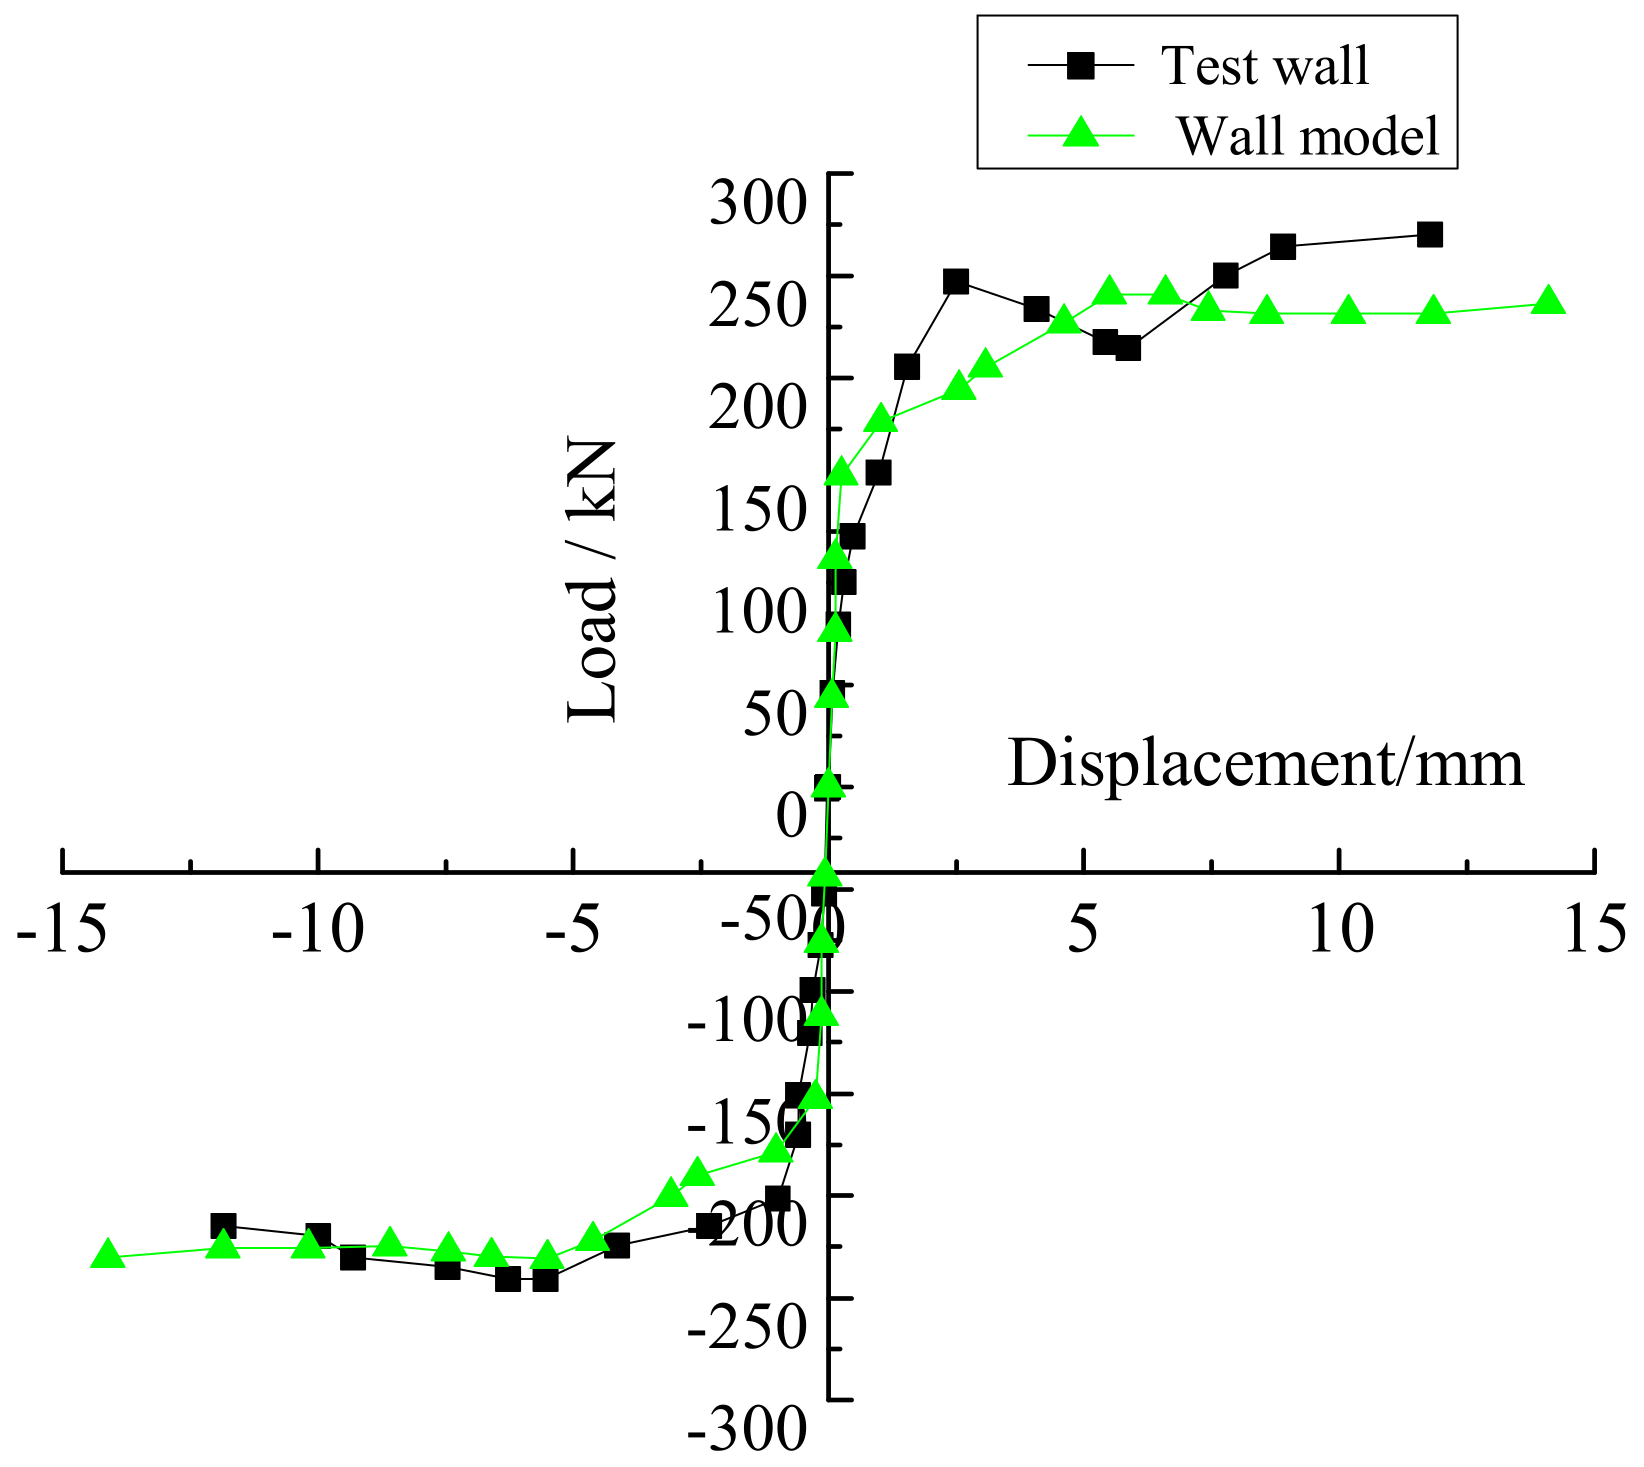
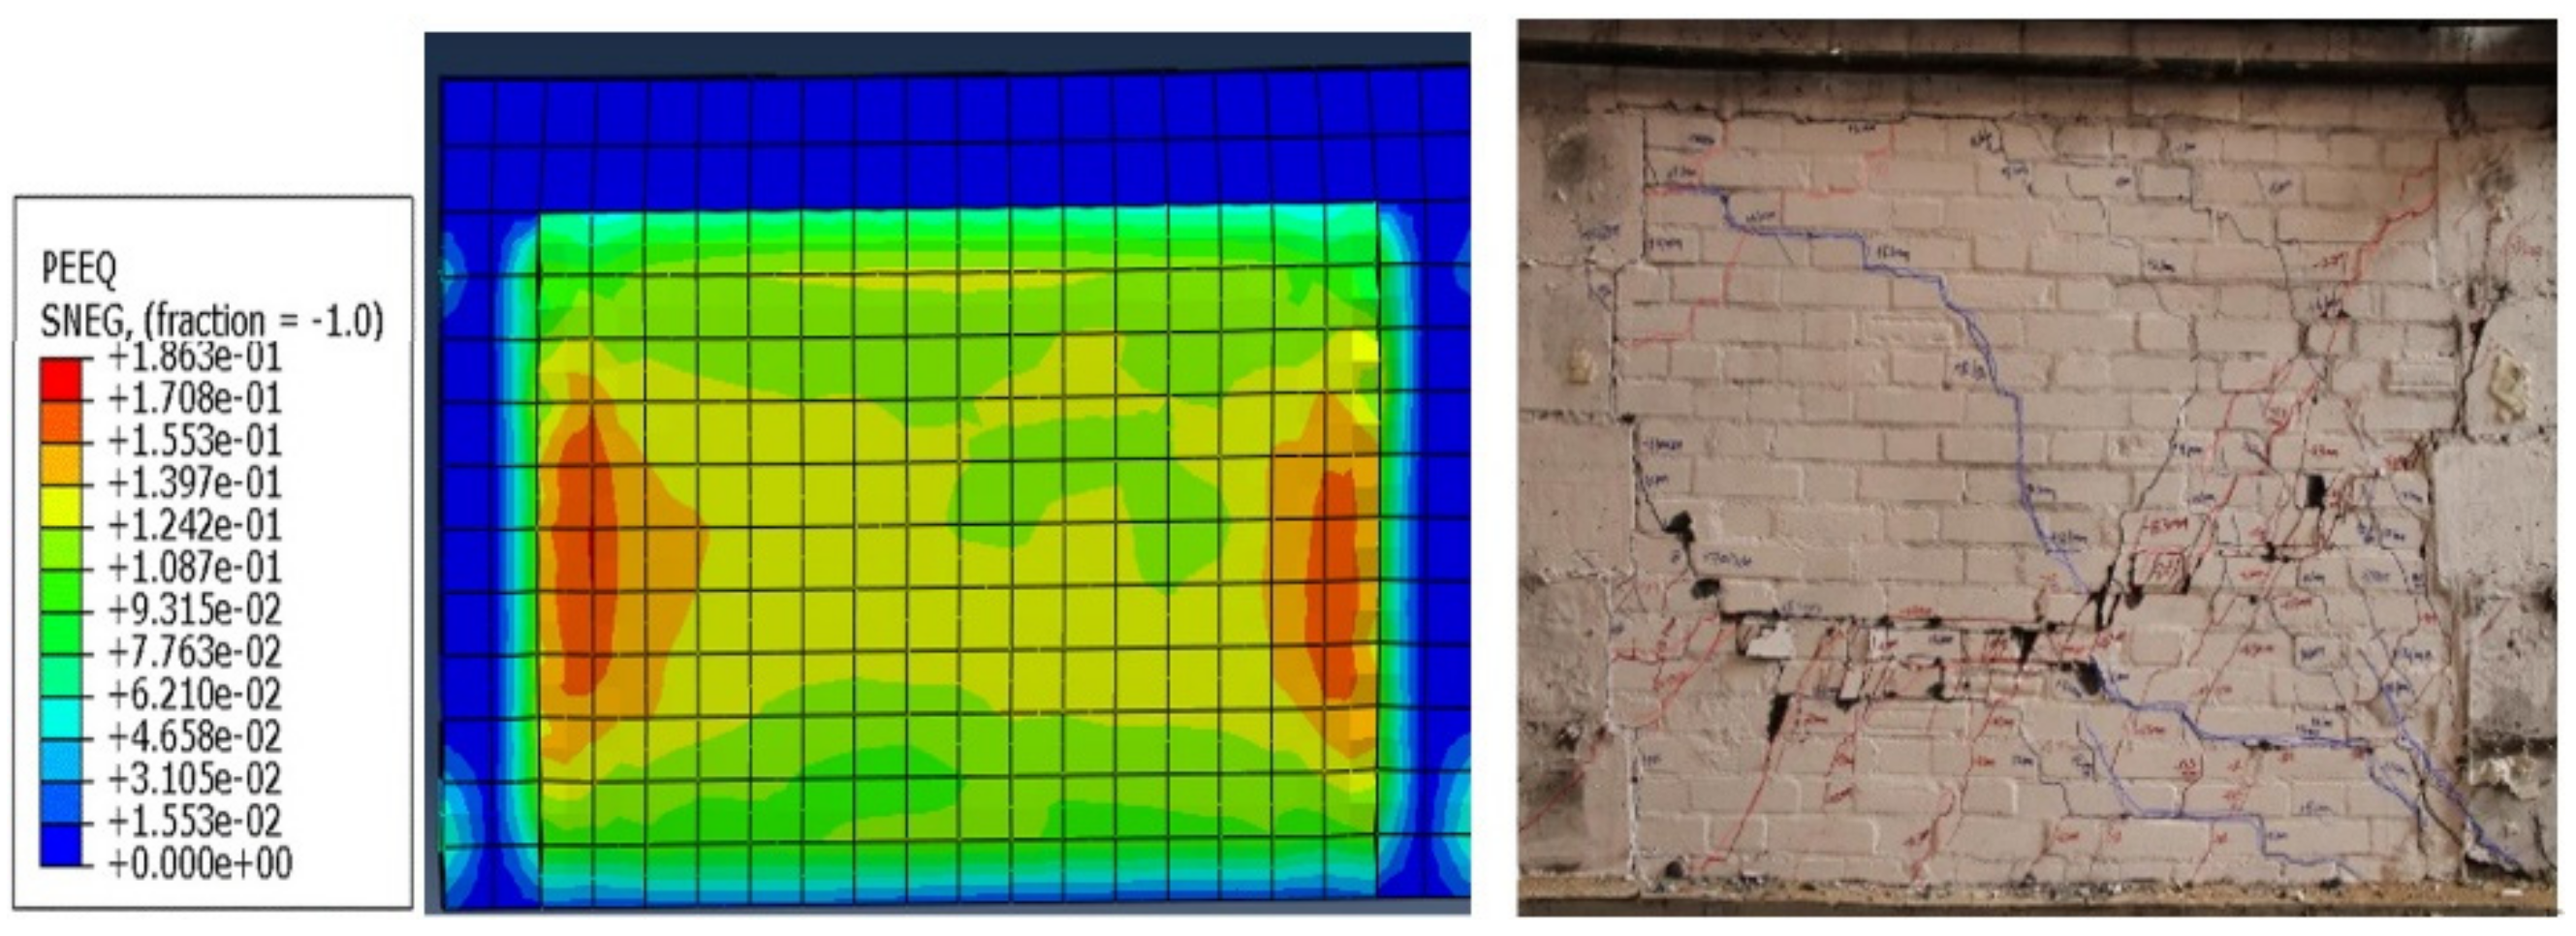
The numerical wall model was constructed into four parts, same as the test wall. The compressive pressure of 0.60 MPa was used in the cyclic-loading test. The loading system of the numerical wall model was the same as that of the test wall. For the model validation, the maximum displacements recorded in tests were loaded for the corresponding numerical models. The assembly autoclaved fly-ash-brick wall was simulated numerically to obtain the load-displacement skeleton curves and the ultimate loads of the test wall, as shown in Figure 14 and Table 3. The diagram of equivalent plastic strain and fracture distribution of the walls are shown in Figure 15. According to GB50003-2011 [25], the shear strength of masonry V0 is calculated:
in which fv is the design value of shear strength for the masonry wall, α is the modified coefficient, µ is the correction factor under shear compression load, σ0 is the compressive stress and A is the cross sectional area of a masonry wall.
The equivalent plastic strain (PEEQ) represented the deformation caused by unit load which changed along the diagonal of the wall. From Figure 14 and Figure 15, the distribution of it was the same as the X-type crack caused by shear failure of the wall under cyclic loading. The analogic skeleton curves of the assembled wall were basically consistent with the test wall, and the crack patterns agreed well with those walls, which proved that the parameters setting on the assembly wall model were reasonable.
3.3. Seismic Performance of Assembly Autoclaved Fly-Ash-Brick Wall
The seismic performance of the wall can be evaluated by the bearing capacity, ductility, and energy absorption [34,35]. The bearing capacity of the wall was obtained by Equation (9). The equivalent stiffness of the wall was obtained according to the ratio of load and displacement. In the design and evaluation of structures, it is important to assess the stiffness degradation with respect to the increment of the drift which is helpful for defining drift limits for design purposes.
In order to analyze the seismic performance of the assembly autoclaved fly-ash-brick wall, the types of construction measures and the wall materials were changed to establish the wall model. According to the parameters of the autoclaved fly-ash-brick wall mentioned in 4.2, the seismic performance of the assembly autoclaved fly-ash-brick wall was analyzed from three aspects on bearing capacity, stiffness degradation and displacement ductility.
3.3.1. Types of Walls in Analysis
The wall model established by numerical software was constructed with the same brick arrangement and material properties as the test wall. In order to investigate its performance, the fired common-brick walls were selected as comparison ones, whose dimension and physical parameters are shown in Table 4. The brick blocks of strength MU15 and mortar of strength M10 were built in the brick masonry walls. The strength grade of ring beam and constructional column concrete block was MU20, and the compressive strength of cast-in situ concrete was taken as 30 MPa. The hot-rolled steel bar was used in the wall, whose yield strength was 400 N/mm2. The dimension and physical parameters of the walls are shown in Table 4.
Those two wall models were subjected to cyclic loadings in Section 4.2 to assess the shear capacity and aseismic performance of the wall. The walls were put under 0.6 MPa vertical compression stress and the simulated loading was simplified by cyclic loading with 0.5 mm step size. The maximum displacement value was 20 mm, in which the endpoint on the load–displacement curve was selected at a non-convergent point in numerical models or the point corresponding to 85% of the ultimate load. From Equation (9) and simulation results, the bearing capacity values of the walls are shown in Table 5.
3.3.2. Construction Measures on Seismic Performance of Walls
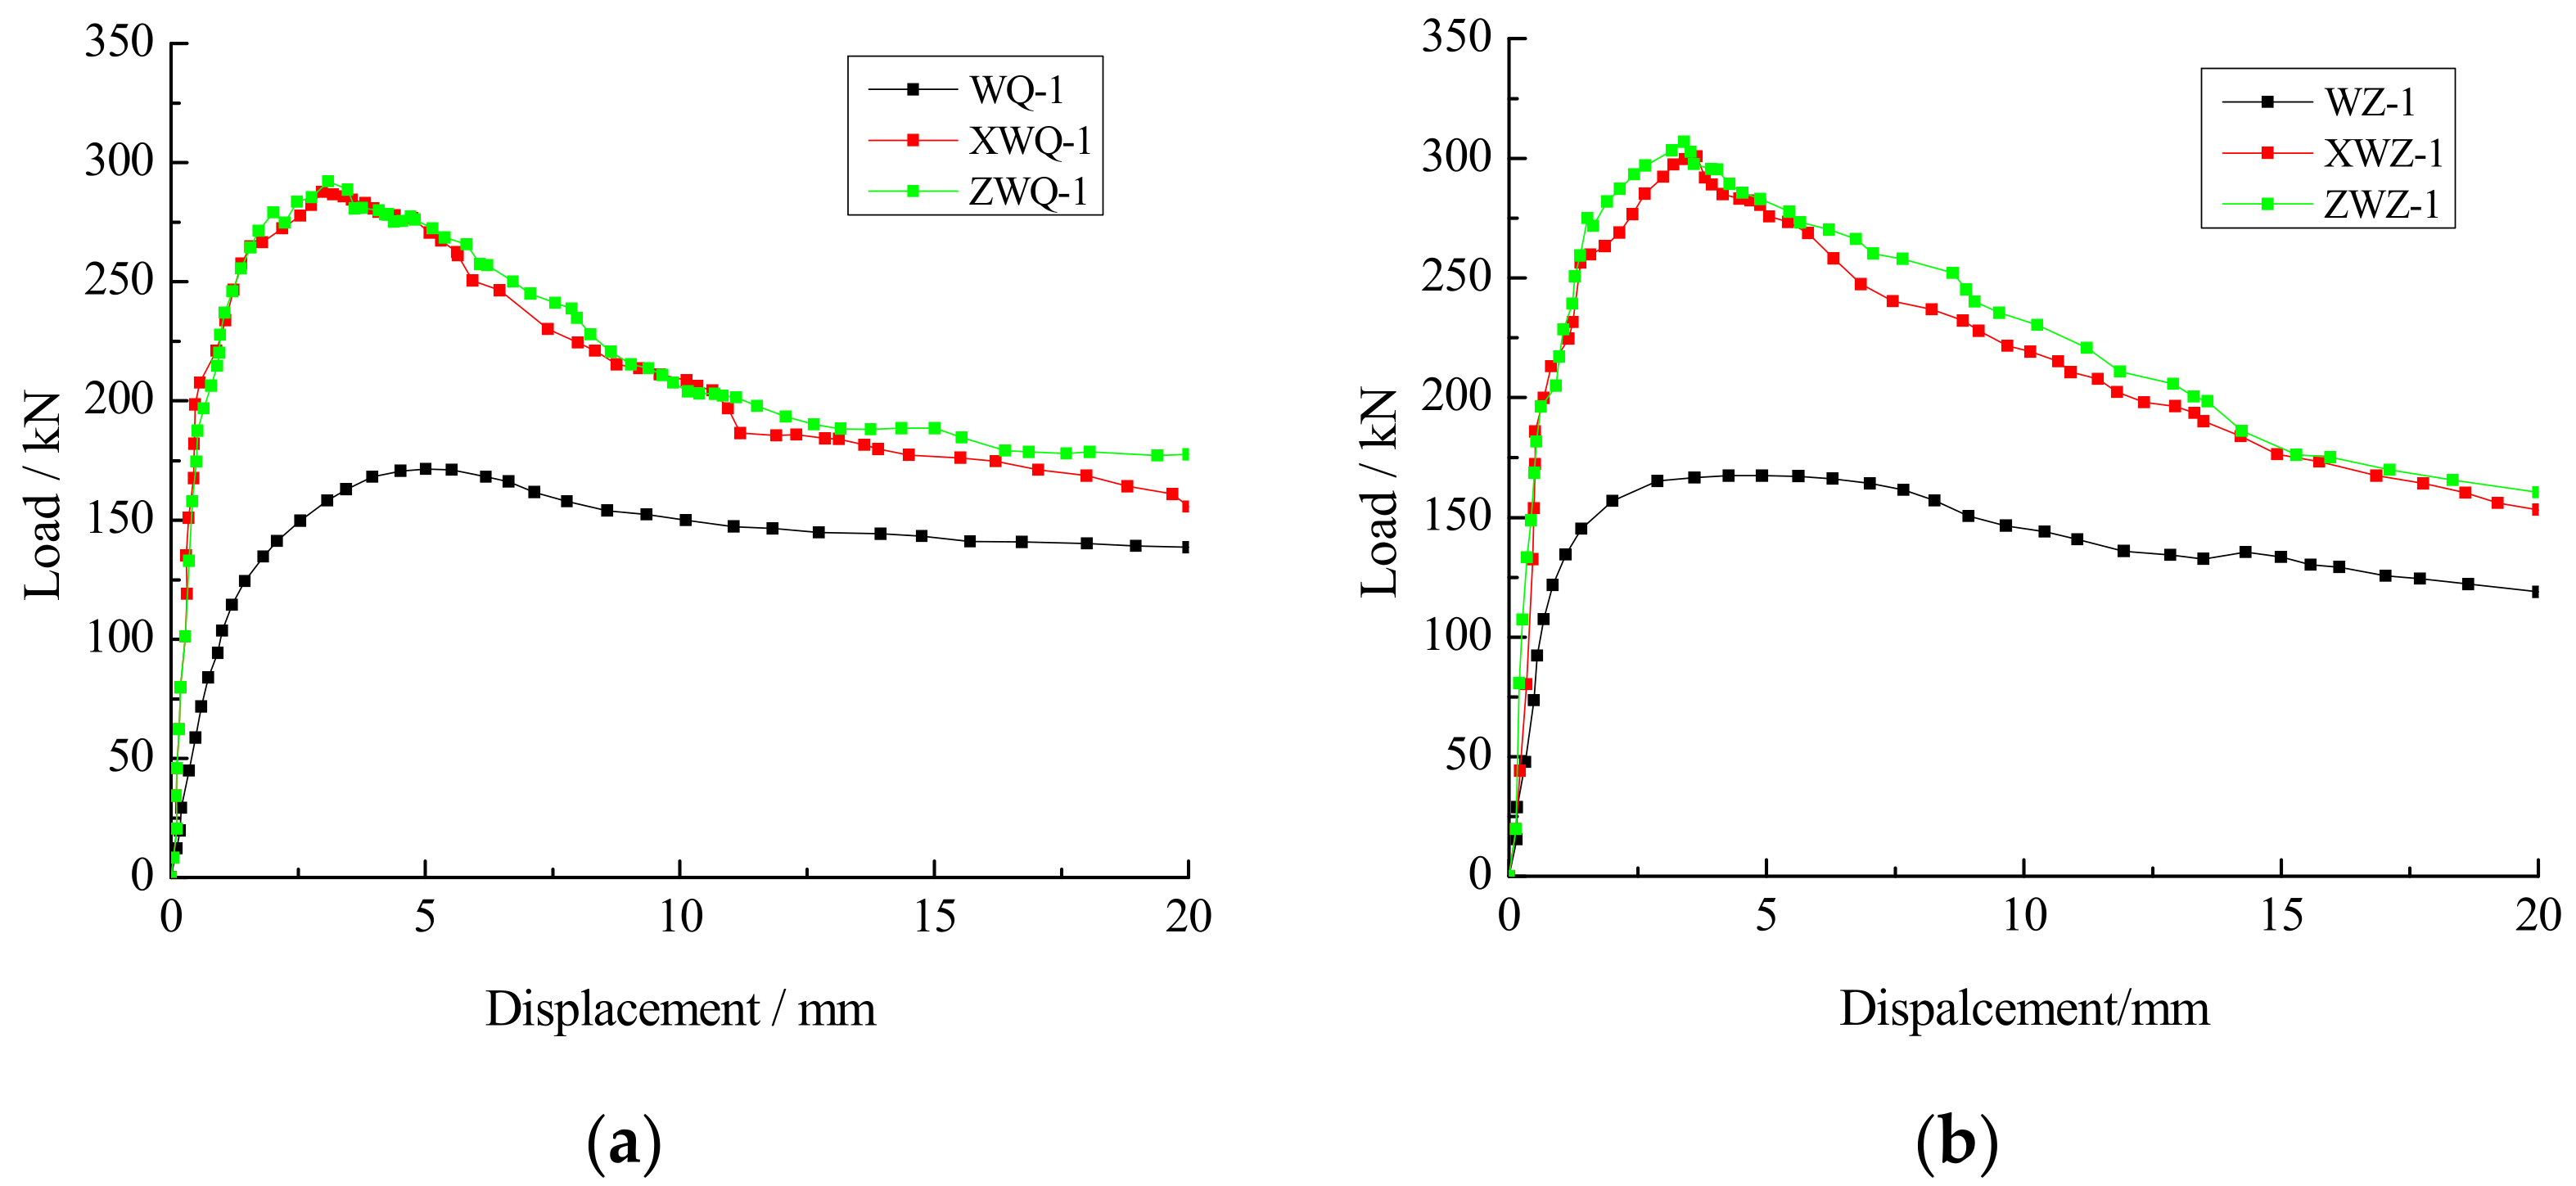
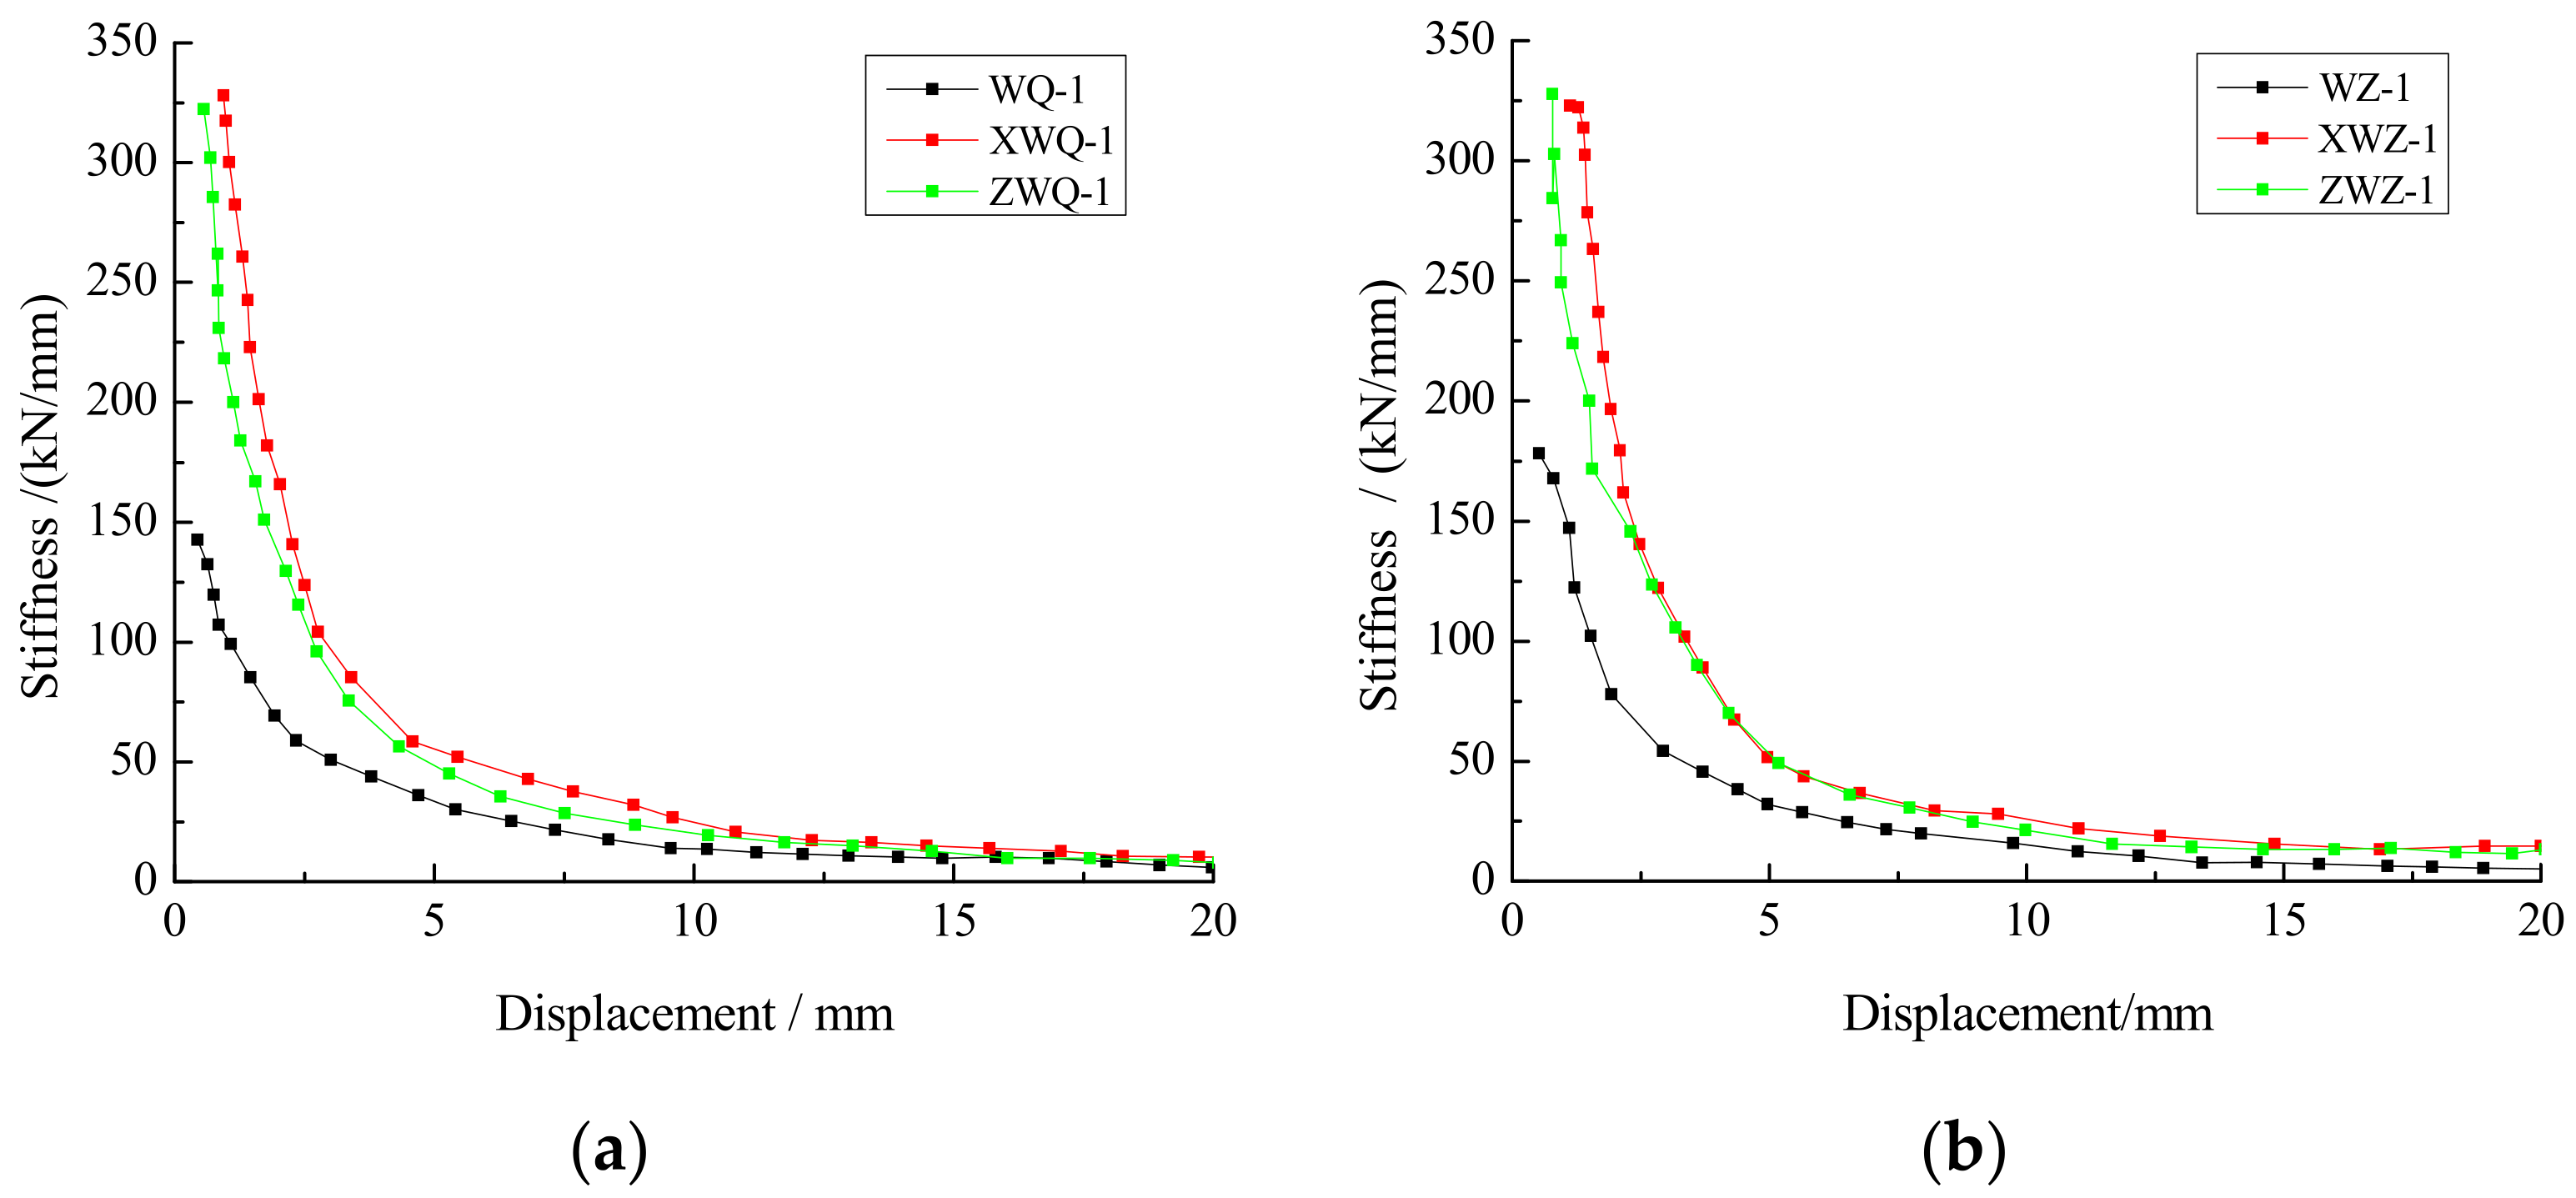
The load-displacement curves of the common brick masonry walls and autoclaved fly-ash-brick walls under different forms of construction measures are shown in Figure 16. The stiffness–displacement curves of those walls are shown in Figure 17.
According to Table 4, compared to the common brick wall WQ-1, the cracking, ultimate, and failure loads of wall XWQ-1 were increased by 77%, 73%, and 36%, respectively. Meanwhile, the cracking, ultimate, and failure loads of wall ZWQ-1 were increased by 92%, 74%, and 28%, respectively. Compared to wall WQ-1, from the ultimate load to the failure load of wall XWQ-1, the ratio of the failure displacement to ultimate displacement Δf/Δu was increased by 86%, while the ratio of the failure displacement to ultimate displacement Δf/Δu of wall ZWQ-1 was increased by 101%. Moreover, compared to wall WZ-1, the cracking, ultimate, and failure loads of wall XWZ-1 were increased by 86%, 79%, and 49%, respectively. Furthermore, compared to wall WZ-1, the cracking, ultimate, and failure loads of wall ZWZ-1 were increased by 81%, 75% and 38%, respectively. From the ultimate load to the failure load, the ratio of the failure displacement to ultimate displacement Δf/Δu of wall XWZ-1 was increased by 40%, and the ratio Δf/Δu of wall ZWZ-1 was increased by 55%.
From Figure 16 and Figure 17, it can be observed that the curvilinear trends of the walls under different construction measures were similar to others, in which the initial stiffness of the cast-in-place and assembled masonry walls were larger than those of unconstrained walls. With the increase in the imposed load, the displacement, stiffness, and bearing capacity of the constrained walls reached the same values, indicating that the energy dissipation and bearing capacity of these walls were similar. After reaching the ultimate load, the ductility of the assembled masonry wall was superior to that of the cast-in-place masonry wall.
3.3.3. Wall Materials and Seismic Performance of Walls
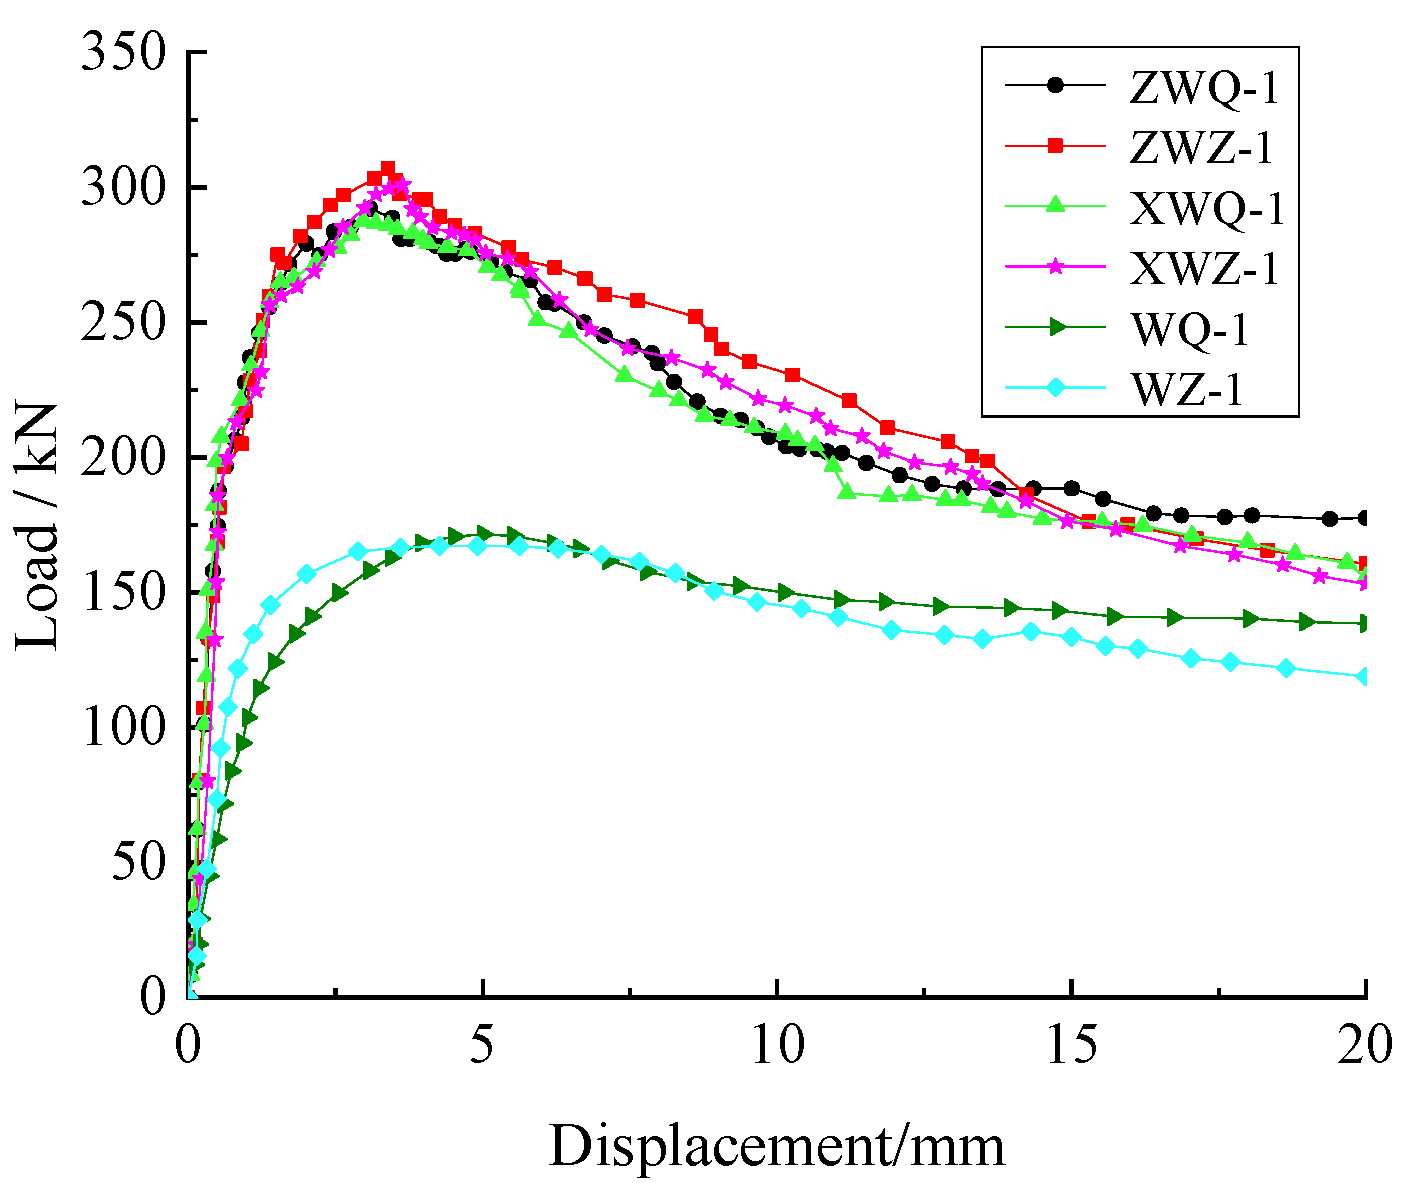
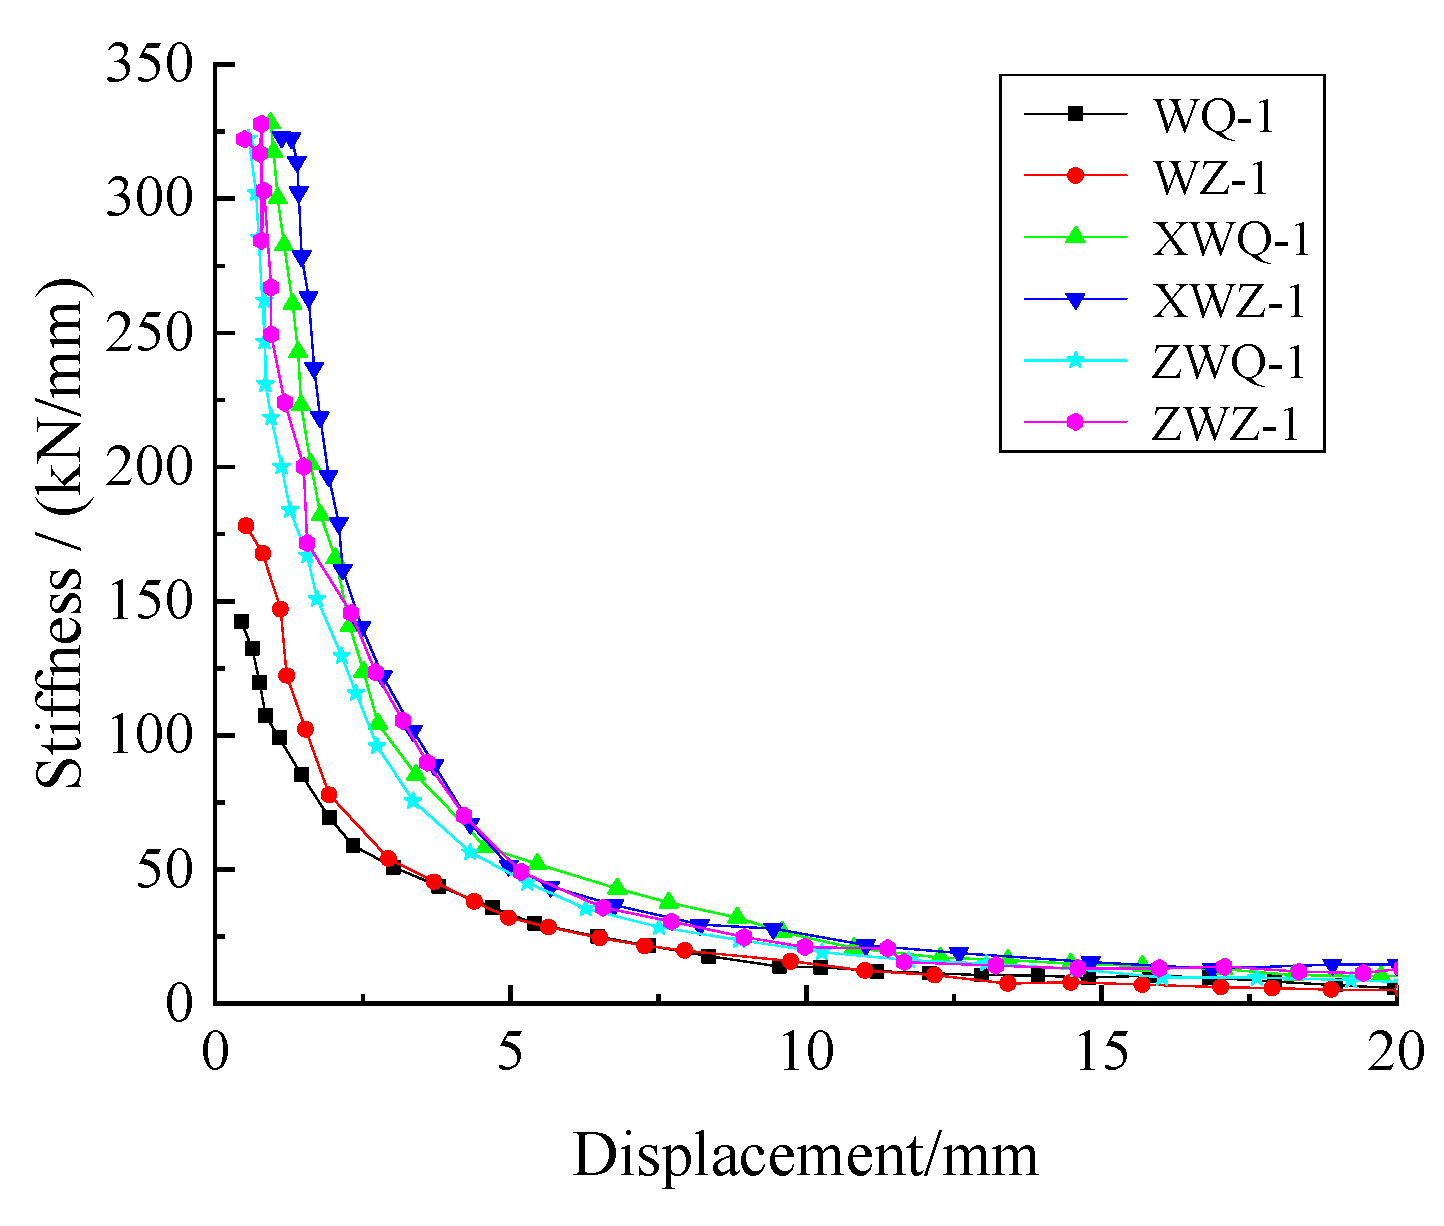
From Table 4, the seismic performance of the autoclaved fly-ash-brick wall and the common brick wall were analyzed as follows. The load-displacement curves of those walls are shown in Figure 18, and the stiffness–displacement curves of those walls are shown in Figure 19.
Without ring beams and constructional columns, the cracking, ultimate, and failure loads of the autoclaved fly-ash-brick wall WZ-1 had little difference with those of the common brick masonry wall WQ-1. Meanwhile, the cracking and ultimate displacements of the autoclaved fly-ash-brick wall were less than those of the common brick wall, while the failure displacements of those walls had the opposite trend. From the ultimate load to the failure load, the ratio of the failure displacement to ultimate displacement Δf/Δu of wall WZ-1 was increased by 27% compared to wall WQ-1.
With the cast-in-place ring beam and the constructional column, the cracking, ultimate and failure loads of the autoclaved fly-ash-brick wall XWZ-1 were larger than those of the common brick wall XWQ-1. Meanwhile, the cracking displacement and ultimate displacement of the autoclaved fly-ash-brick wall were similar to those of the common brick wall.
With assembly ring beam and constructional column, the cracking, ultimate and failure loads of the autoclaved fly-ash-brick wall ZWZ-1 were larger than those of the common brick wall ZWQ-1. Meanwhile, the cracking displacement and ultimate displacement of the autoclaved fly-ash-brick wall were larger than those of the common brick wall. From the ultimate load to the failure load, the ratio of the failure displacement to ultimate displacement Δf/Δu of wall ZWZ-1 was similar to that of wall ZWQ-1.
From Figure 18 and Figure 19, without construction measures, the curvilinear trend of the load-displacement were similar to others. With the assembly and cast-in-place ring beam and the constructional column, the bearing capacity of the autoclaved fly-ash-brick walls were similar to that of the common brick walls. However, the initial stiffness of autoclaved fly-ash-brick walls was larger than that of the common brick walls, and the stiffness degradation rate was the opposite. Therefore, the seismic performance of the autoclaved fly-ash-brick wall was better than that of the common brick wall.
4. Seismic Behavior of the Assembly Autoclaved Fly-Ash-Brick Wall under Multiple Influence Parameters
The parameters of the numerical-simulation method were described above in Section 3.1, and then the cyclic-load test of the full-scale assembly autoclaved fly-ash-brick wall was carried out to verify the rationality of the wall model. Meanwhile, it is verified that the seismic performance of new-type assembly autoclaved fly-ash-brick walls is better than that of common brick walls. Therefore, in order to study the influencing factors on seismic performance of those walls, the 12 pieces of wall models were established by numerical modeling. By changing some parameters such as mortar strength, the rate of holes and vertical compressive values, the bearing capacity, stiffness degradation and displacement ductility were obtained and analyzed.
4.1. Wall Model
The influences of numerical parameters, including mesh density and penalty stiffness of cohesive elements, were investigated in Section 3.1. The wall model was constructed with the same brick arrangement and material properties as the test wall. The autoclaved fly-ash-brick blocks of strength MU15 and mortar were built in the autoclaved fly-ash-brick walls. The strength grade of the ring beam and constructional column concrete block was MU20, and the compressive strength of cast-in situ concrete was taken 30 MPa. The hot-rolled steel bar was used in the wall, whose yield strength was 400 N/mm2. The dimension and parameters of the walls are shown in Table 6.
In order to compare the seismic performance parameters, bearing capacity curves and stiffness curves of the walls, the cyclic loading with 0.5 mm step size was applied to simulate the actual load value and the maximum displacement value was 20 mm.
4.2. Mortar Strength on Seismic Performance of Assembly Autoclaved Fly-Ash-Brick Walls
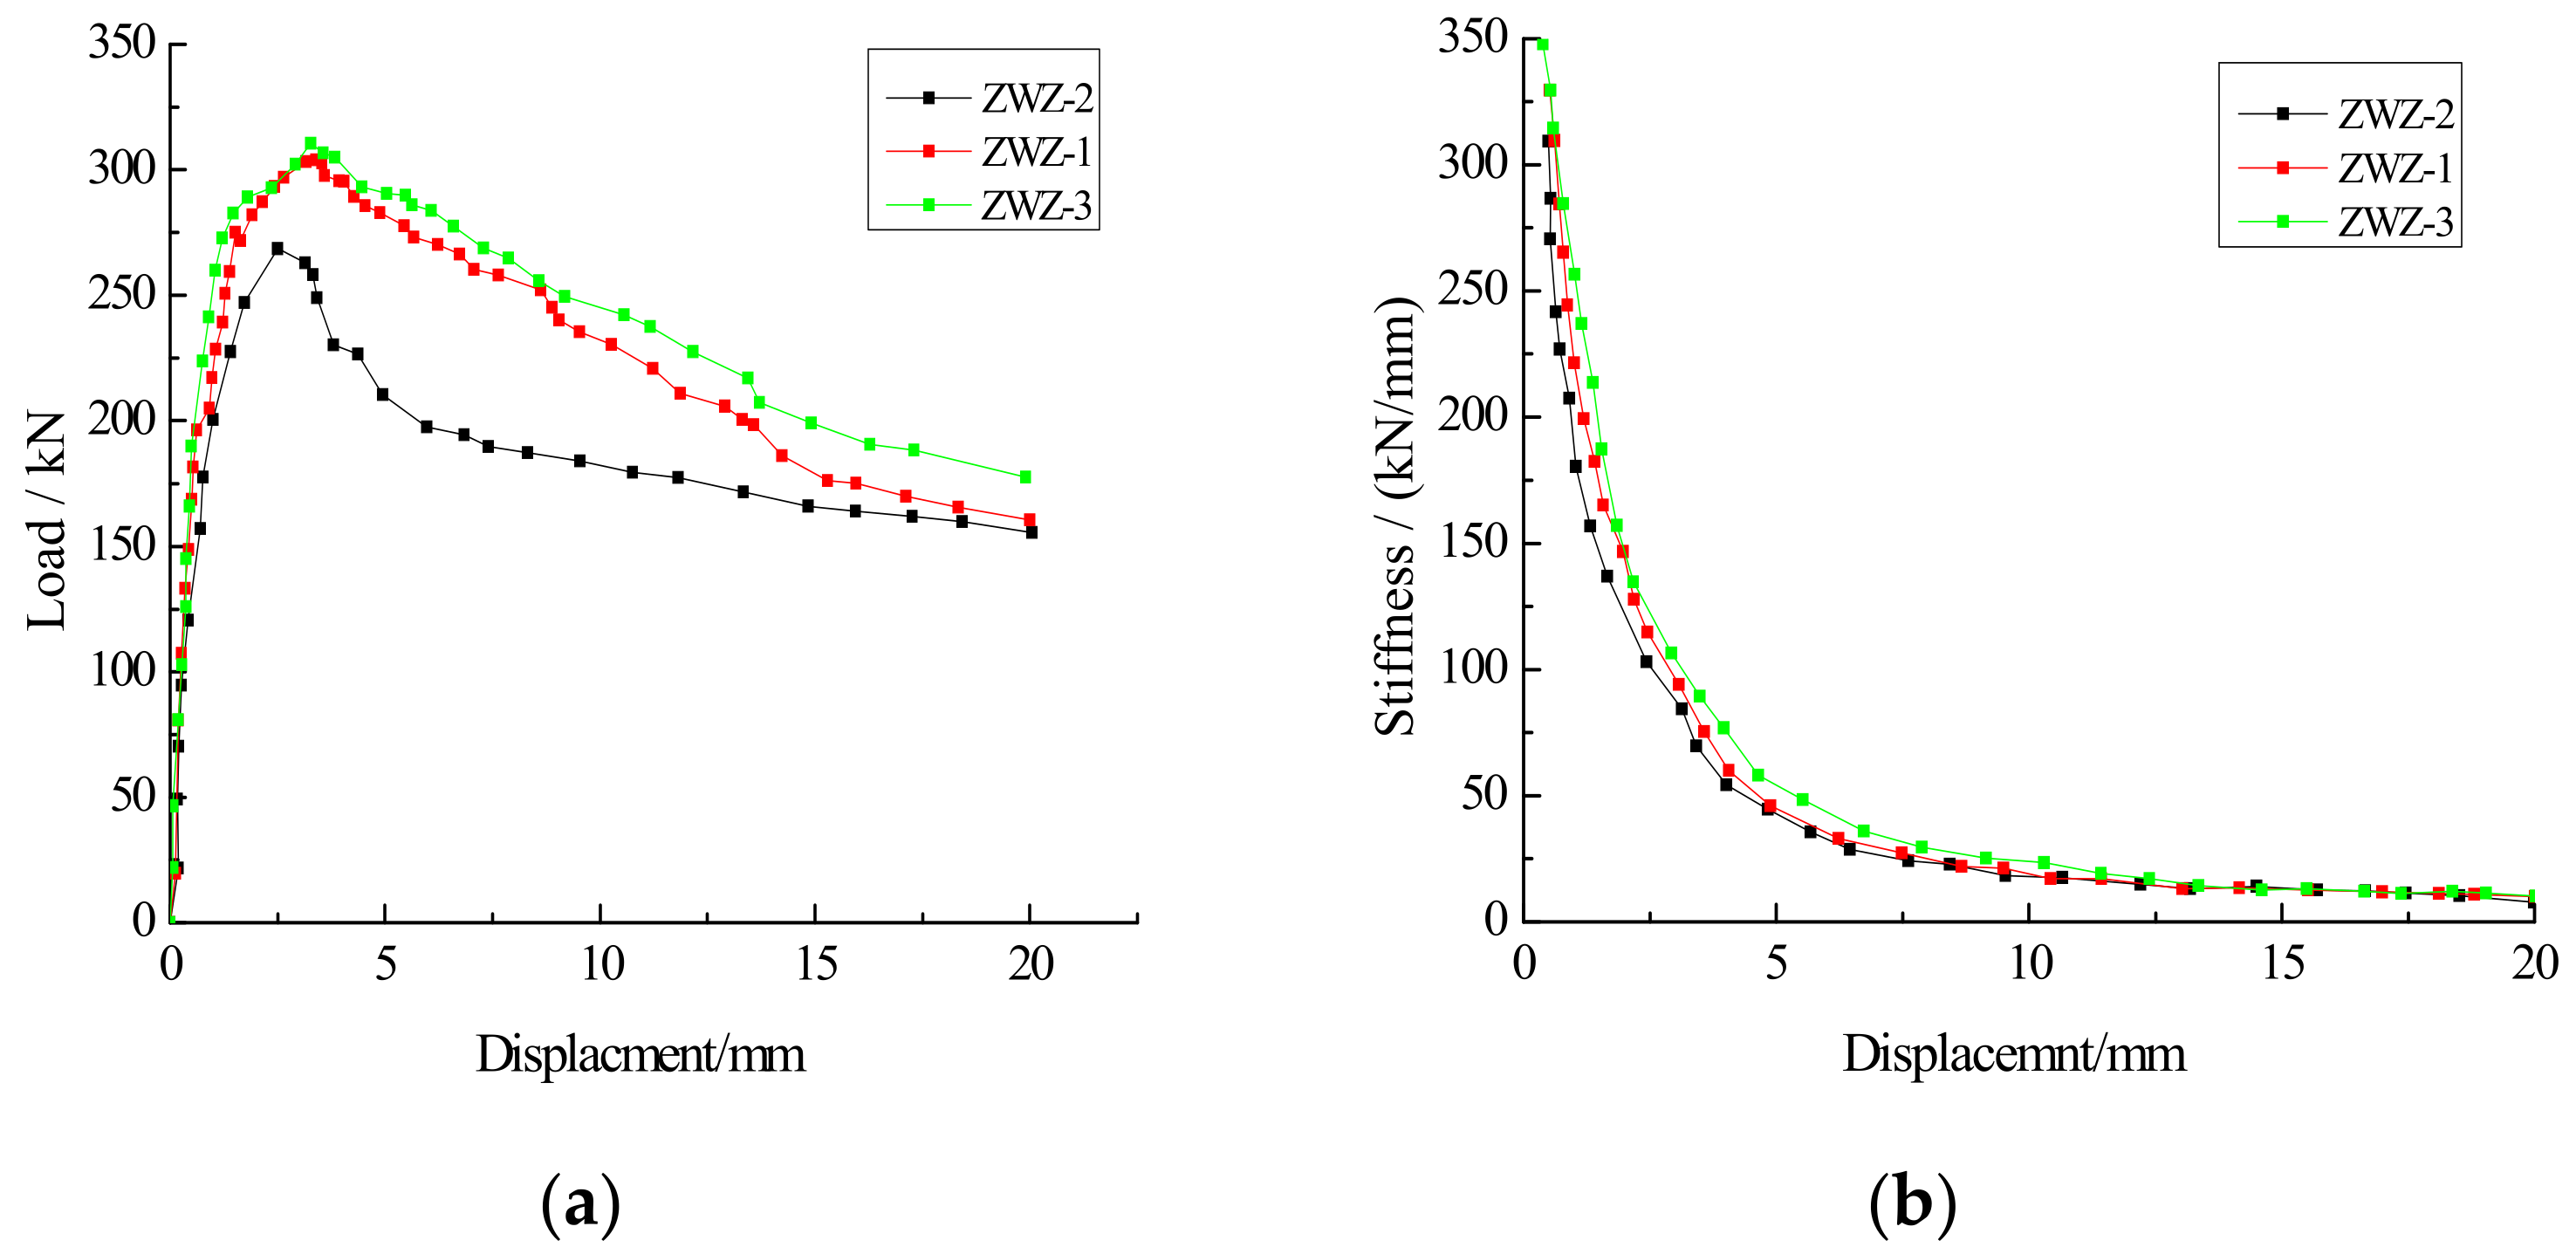
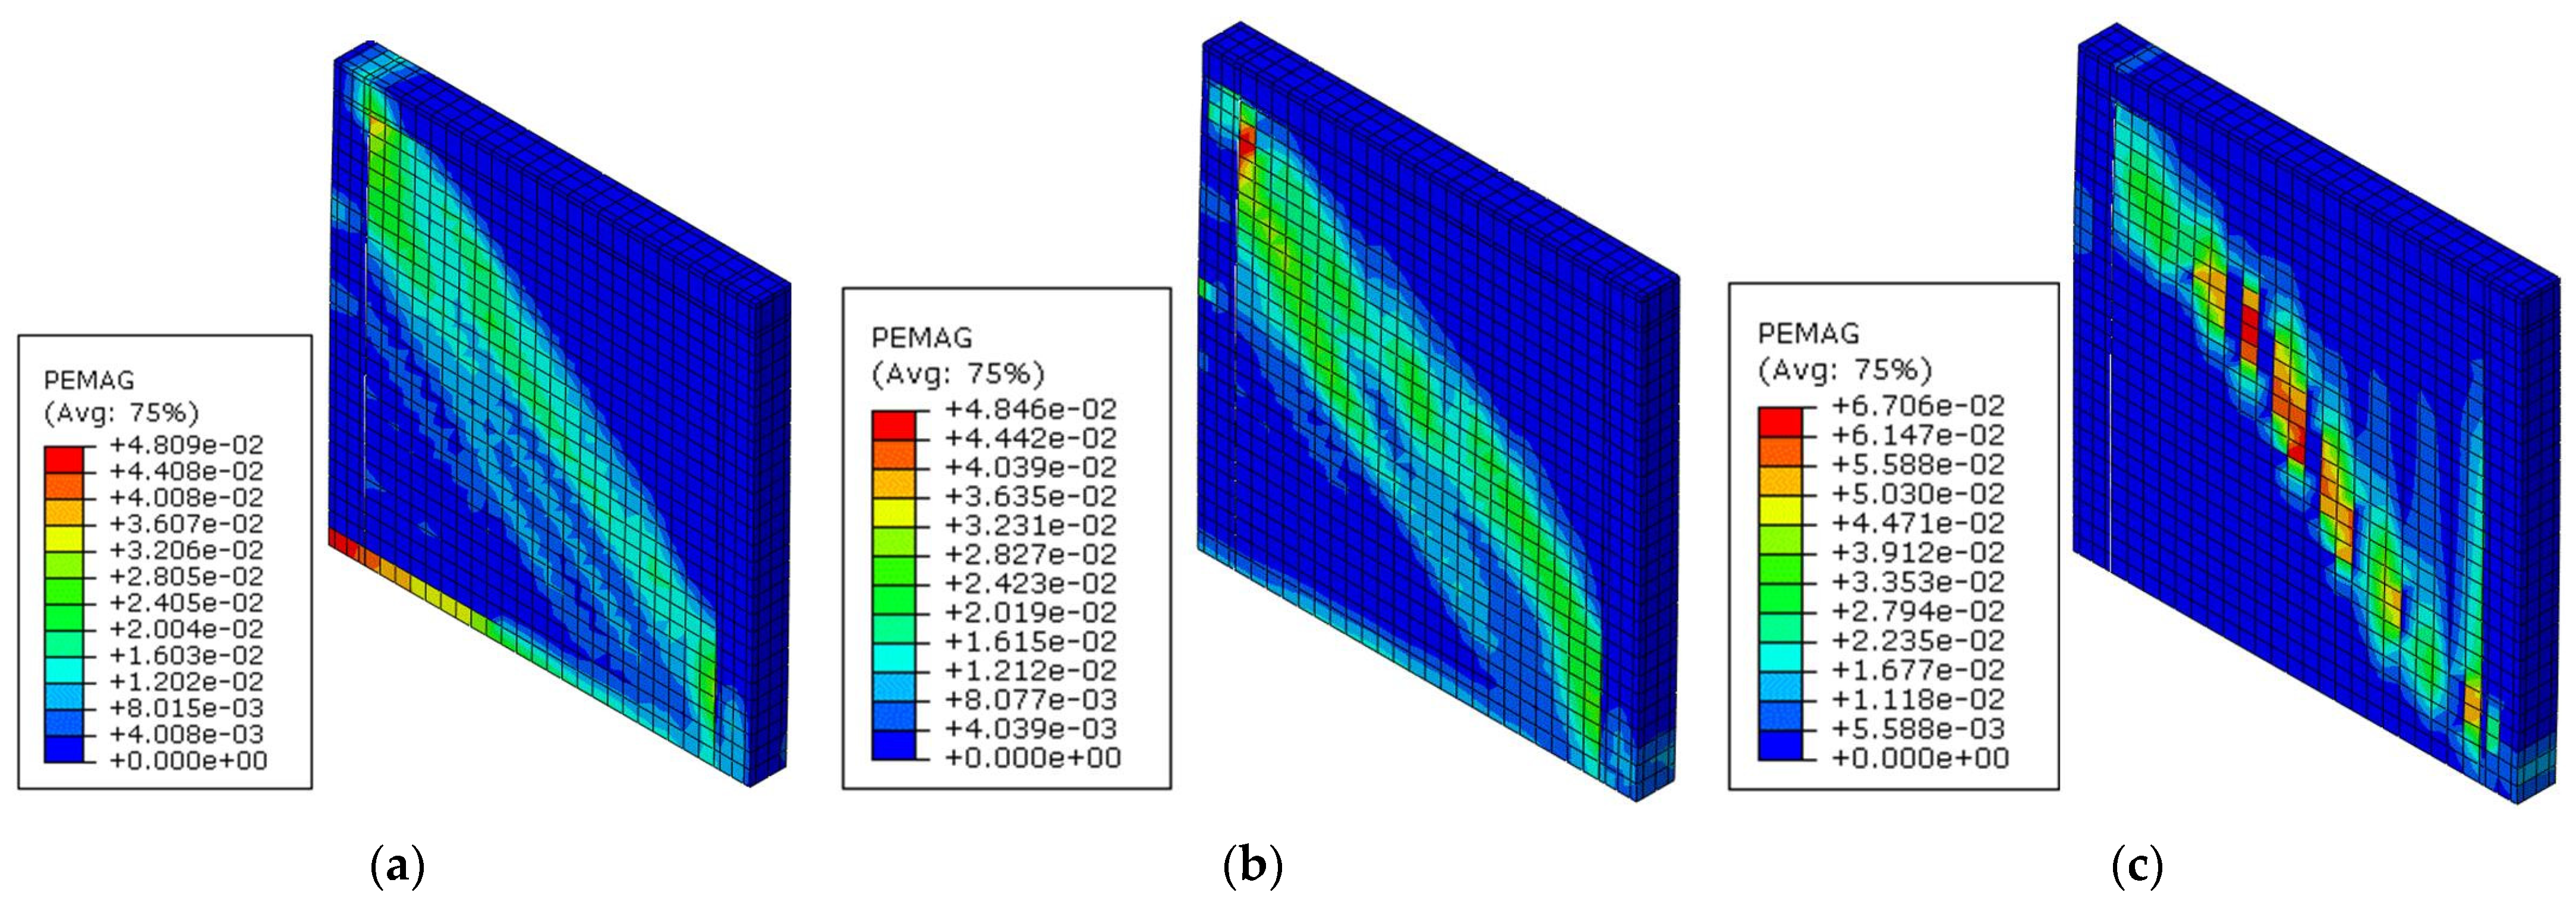
The influence of mortar strength on the seismic performance of assembly autoclaved fly-ash-brick walls was studied by the load–displacement and stiffness–displacement curves. From Equation (9) and simulation results, the bearing capacity values of walls ZWZ-1, ZWZ-2 and ZWZ-3 with different mortar strength are shown in Table 7. The load-displacement and stiffness-displacement curves of the walls with different mortar strength are shown in Figure 20. The plastic strain magnitudes of the walls with different mortar strength are shown in Figure 21.
From Table 7, compared to wall ZWZ-2 with M7.5 mortar strength, the cracking loads of walls ZWZ-1 and ZWZ-3 whose mortar strength were M10 and M15 were increased by 64% and 71%, and the ultimate loads of those walls were increased by 13% and 16%. Meanwhile, the failure loads of those walls were increased by 6% and 12%. Poor strength of mortar leads to premature cracking, which is unfavorable to earthquake resistance of the walls. In the aspect of displacement ductility from the ultimate load to the failure load, the ratio of the failure displacement to ultimate displacement Δf/Δu of walls ZWZ-1, ZWZ-3 were increased by 13% and 17% compared to wall ZWZ-2.
From Figure 20, with the increase of mortar strength, the ultimate, cracking and failure load increased constantly which indicates that the bearing capacity of the walls can be improved by high-intensity mortar. Meanwhile, the initial stiffness of the walls also increased and the descent part of stiffness-displacement curve of wall ZWZ-3 was smooth which indicates that the stiffness degradation rate of wall ZWZ-3 is lower than that of walls ZWZ-1 and ZWZ-2, namely the displacement ductility of wall ZWZ-3 is better than that of walls ZWZ-1 and ZWZ-2.
The plastic strain magnitude (PEMAG) represents the deformation caused by the unit load. According to Figure 21, the PEMAG value changed along the diagonal of the wall, and its distribution was the same as the X-type fracture distribution caused by shear failure of the wall. The color of each unit in the graph was deepened, indicating that the deformation of each unit increased. The PEMAG value of each unit of the wall was cumulative for analyzing the wall deformation with different mortar strengths. With the increase in the mortar strength, the wall deformation increased.
4.3. Holes and Seismic Performance of Assembly Autoclaved Fly-Ash-Brick Walls
4.3.1. Influence of Window Hole Dimensions on Seismic Performance of the Walls
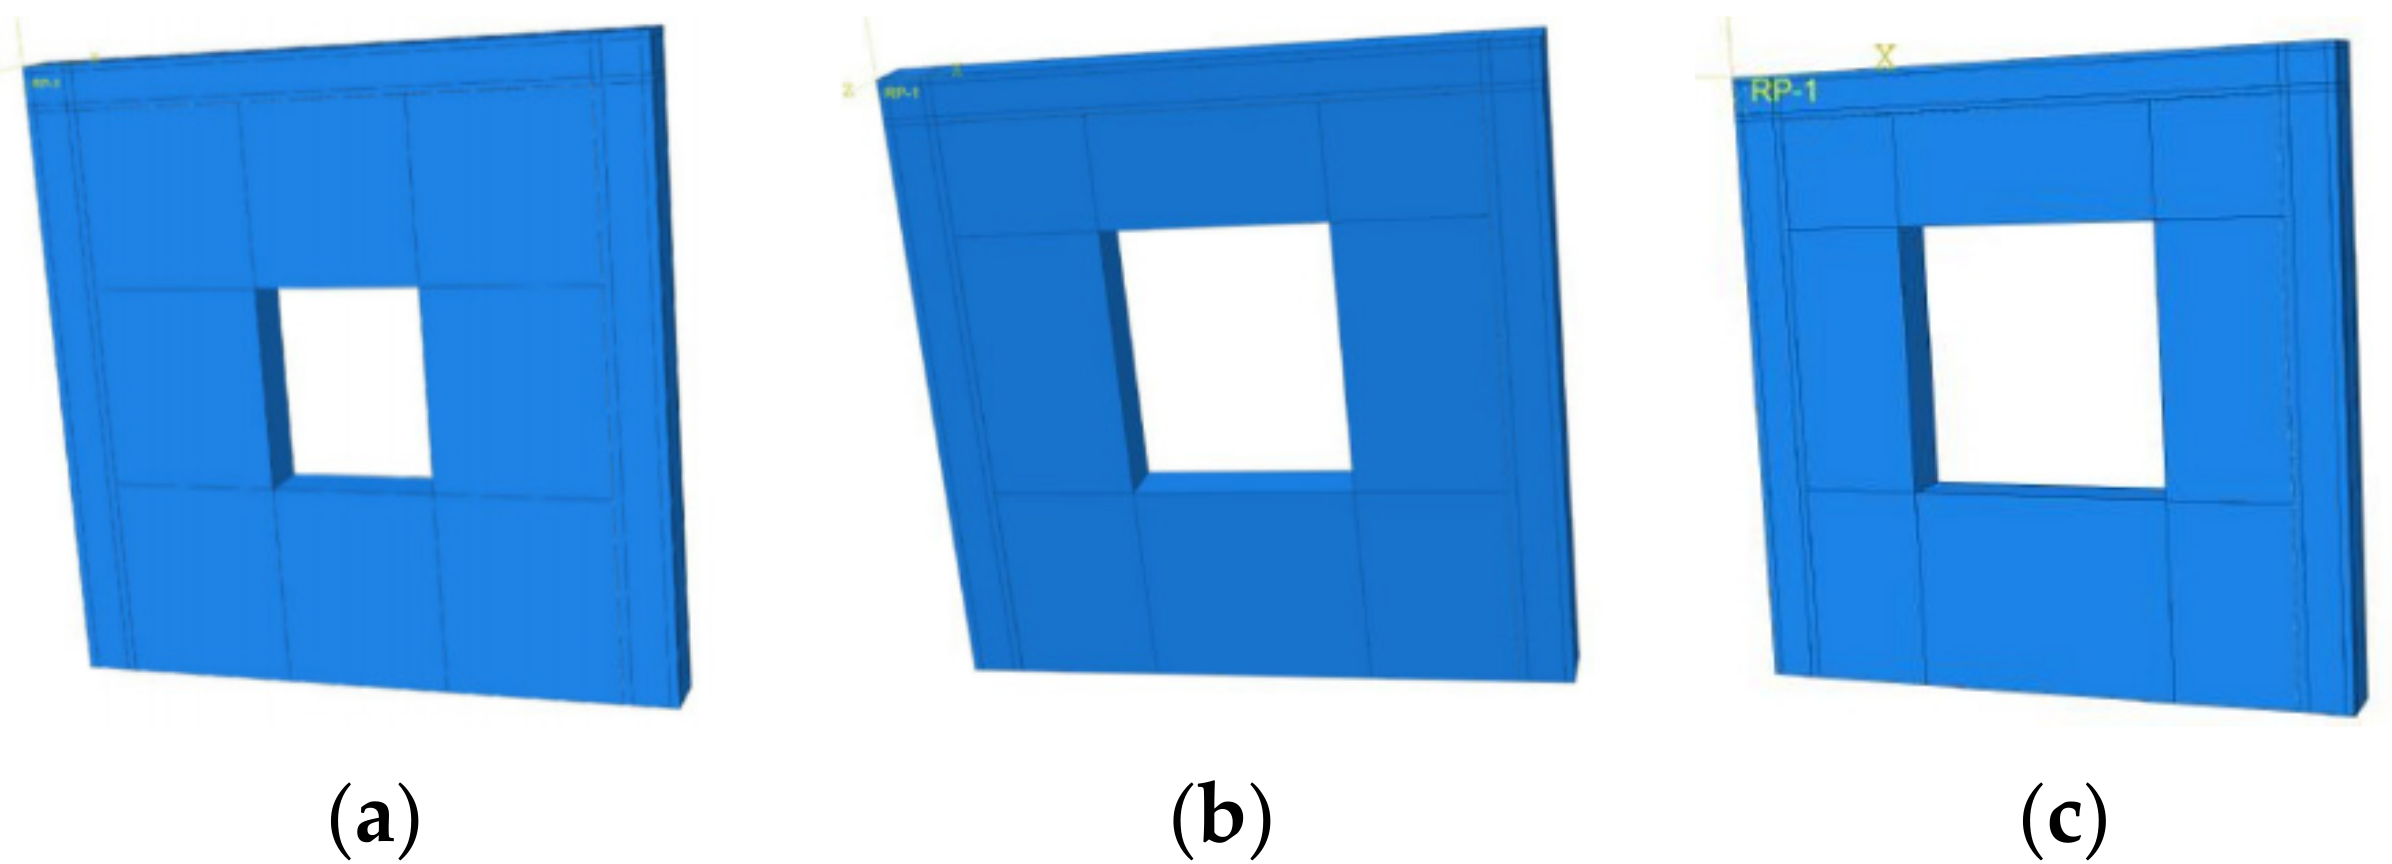
Compared to wall ZWZ-1 without an opening, walls ZWZ-4, ZWZ-5 and ZWZ-6, with different window hole dimensions, were analyzed comparatively to study the influence of different hole dimensions on the bearing capacity, stiffness degradation and displacement ductility of the walls.
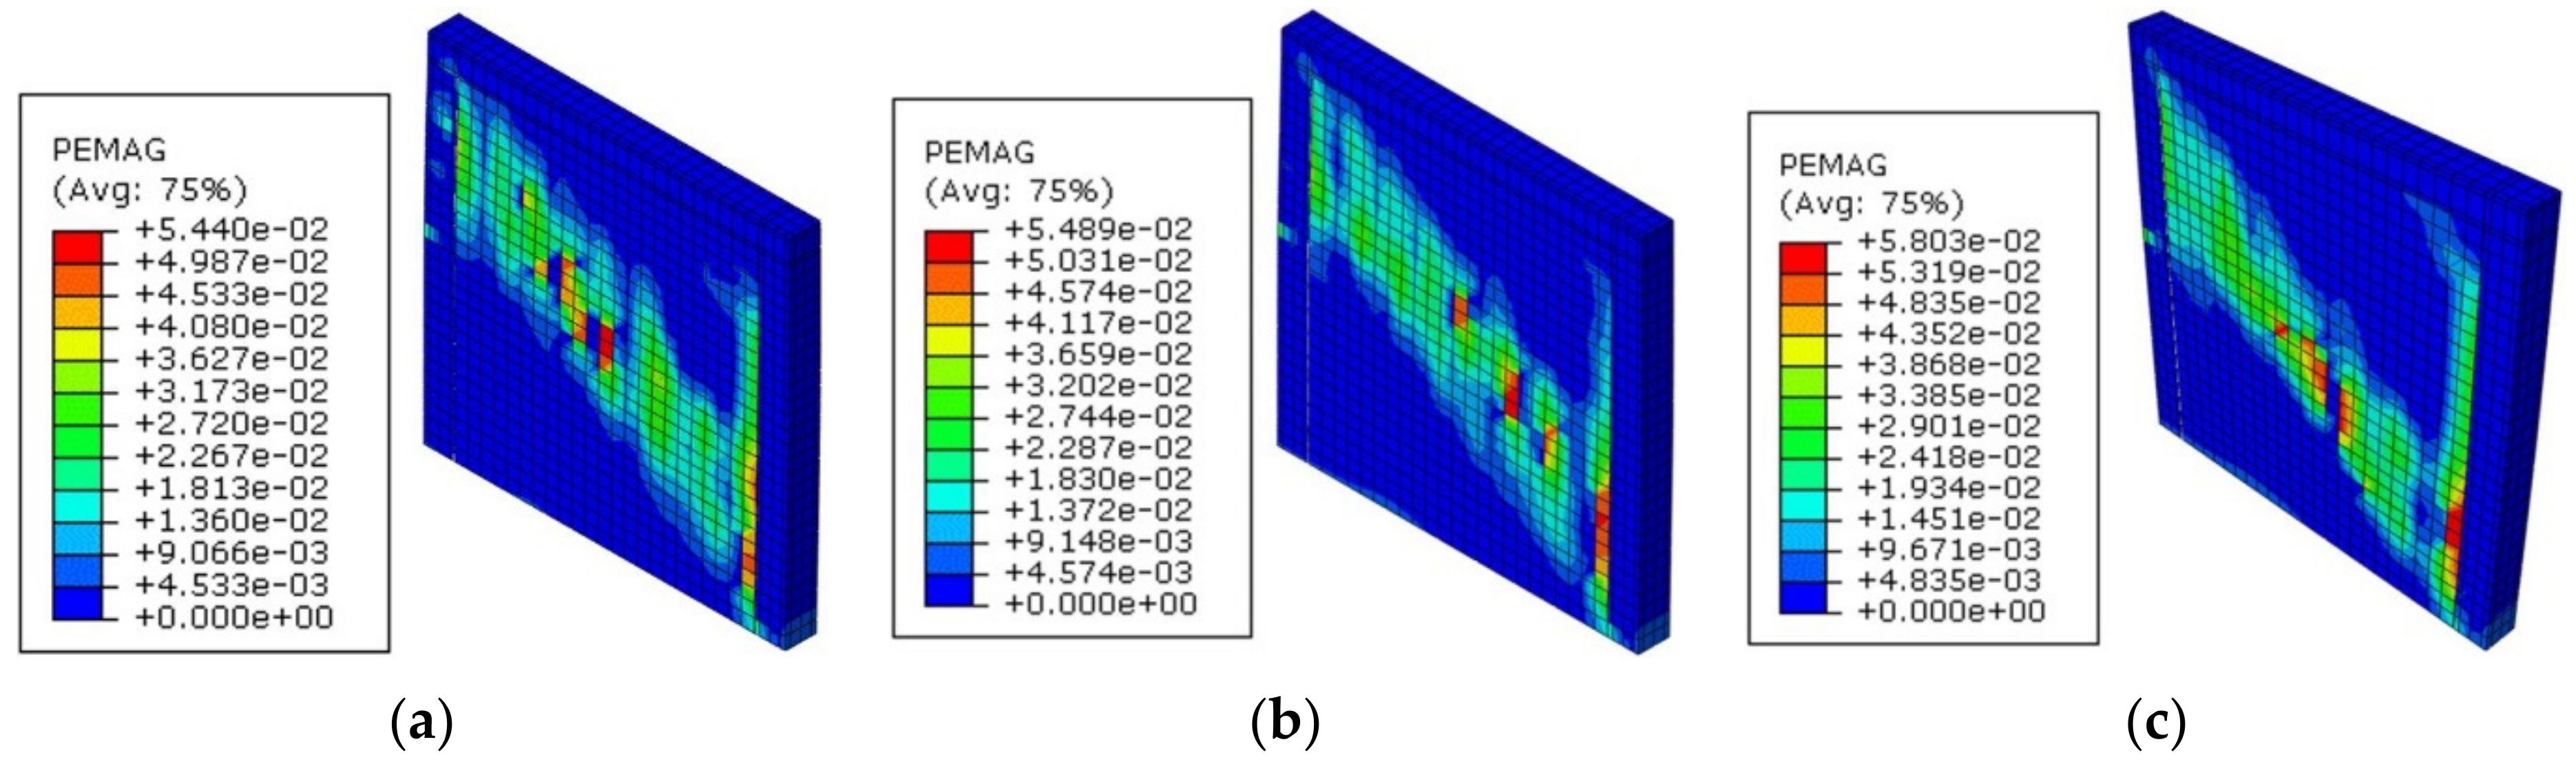
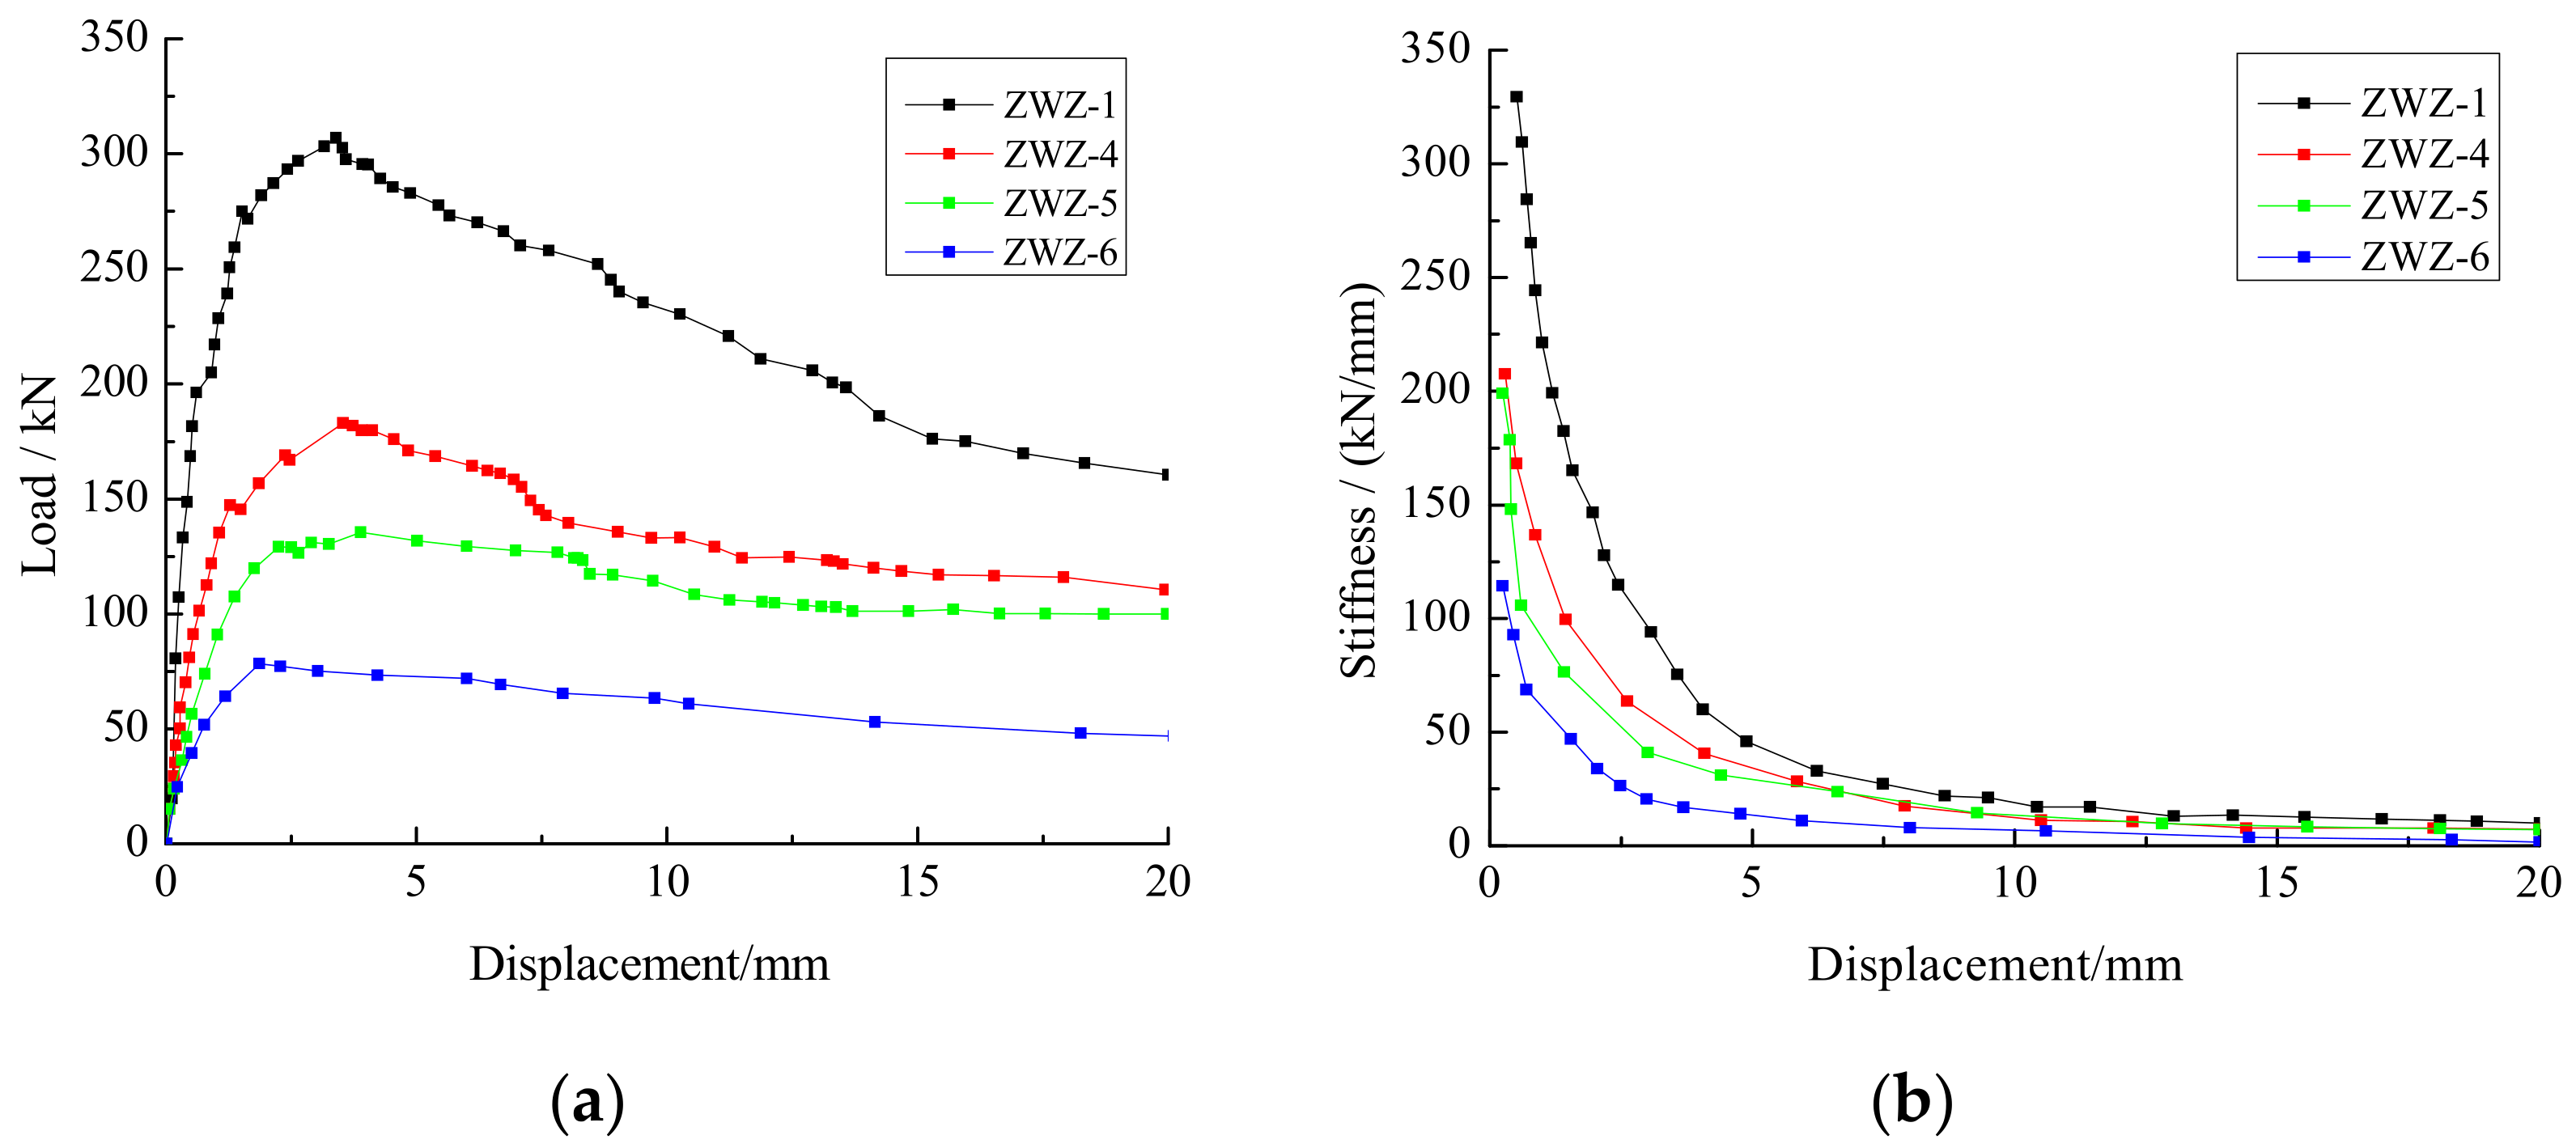
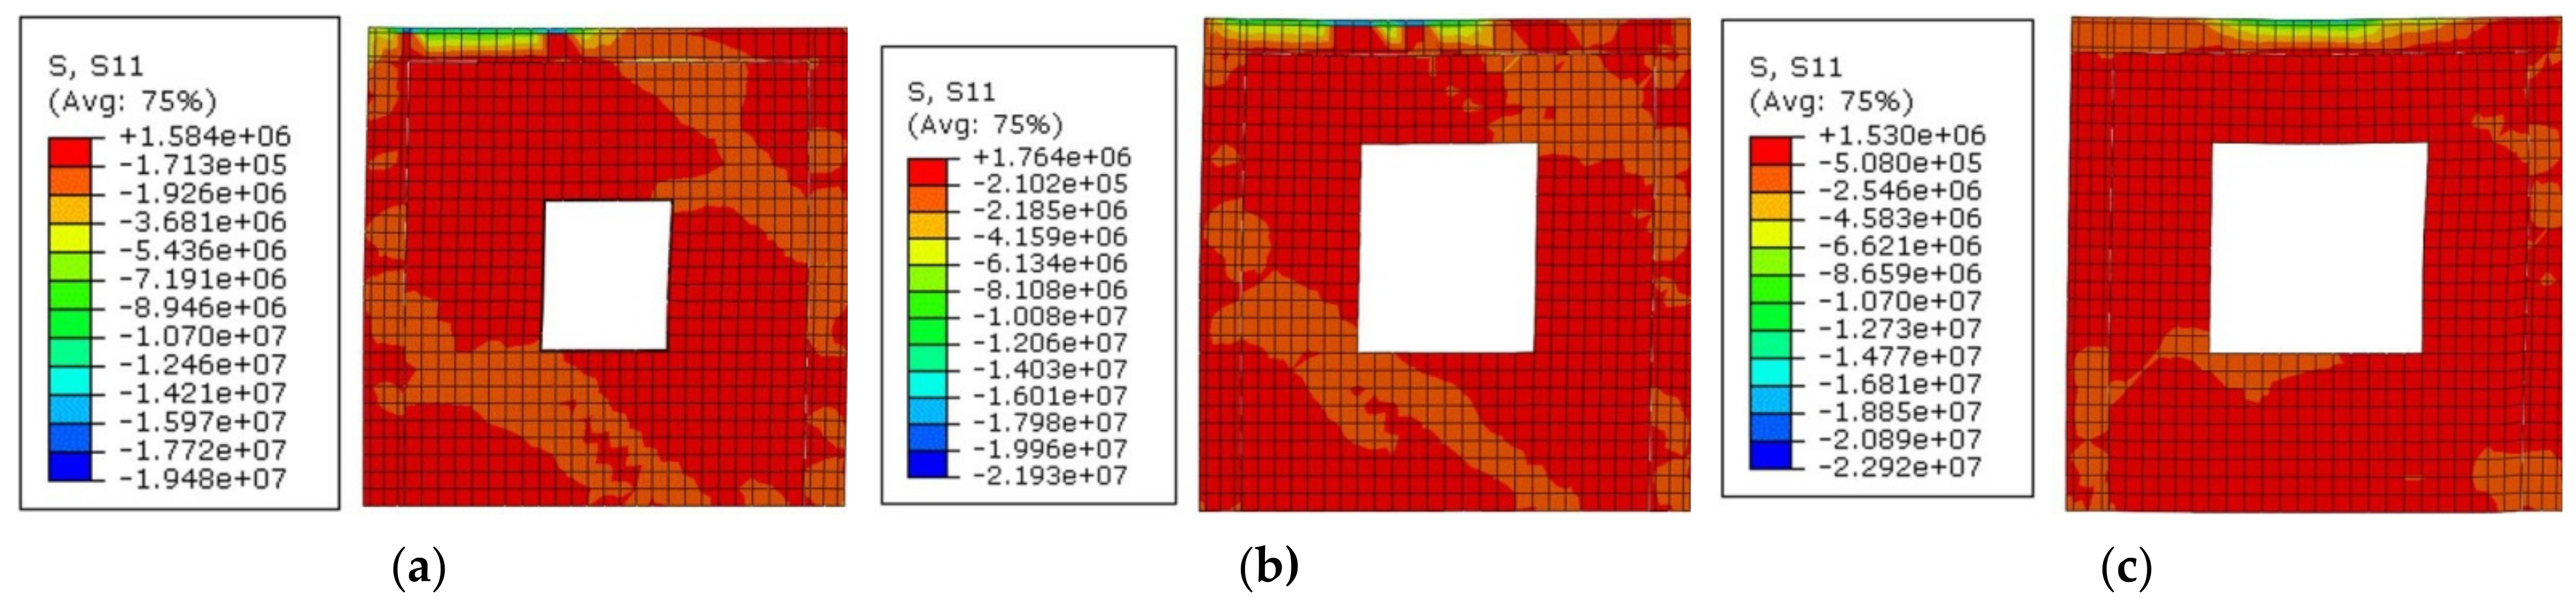
The window holes of walls ZWZ-4, ZWZ-5 and ZWZ-6 were located at the center of the wall, as shown in Figure 22. Meanwhile, the dimension and parameters of walls ZWZ-4, ZWZ-5 and ZWZ-6 are shown in Table 6. From Equation (9) and simulation results, the bearing capacity values of the walls with different window holes’ dimensions are shown in Table 8. The load-displacement and stiffness-displacement curves of the walls are shown in Figure 23. The stress nephogram of the walls with different window holes’ dimensions are shown in Figure 24.
According to Table 8, compared to wall ZWZ-1 without an opening, the cracking loads of walls ZWZ-4, ZWZ-5 and ZWZ-6 were decreased by 54%, 63% and 80%, respectively; the ultimate loads were decreased by 40%, 55% and 74%, respectively; the failure loads were decreased by 28%, 34% and 61%, respectively; and the displacement ductility ratios were decreased by 41%, 52% and 48%, respectively.
As can be observed from Figure 23 and Figure 24, with the increase in the window hole dimensions, the bearing capacity of the walls with holes was significantly decreased. The stress concentration near the hole was distinct. The color of the grid cell in the graph was deepened, indicating that the stress of the unit increased. With the large opening dimension, walls ZWZ-5 and ZWZ-6 reached the failure stage quickly after reaching the ultimate load, which led to the decline of the wall’s bearing capacity. The stiffness of the wall with an opening was lower than that of the unopened wall, which indicated that the holes’ dimensions have a great influence on the stiffness of the wall. With the increase in the hole dimensions, the stiffness of the walls decreased, and the slope of stiffness–displacement curves increased which indicated that the stiffness degradation rate of the walls increased.
4.3.2. Influence of Door Holes’ Dimension on Seismic Performance of the Walls
Compared to wall ZWZ-1 without an opening, walls ZWZ-7, ZWZ-8, and ZWZ-9, with different door hole dimensions were analyzed comparatively to study the influence of the different hole dimensions on the bearing capacity, stiffness degradation, and displacement ductility of the walls.
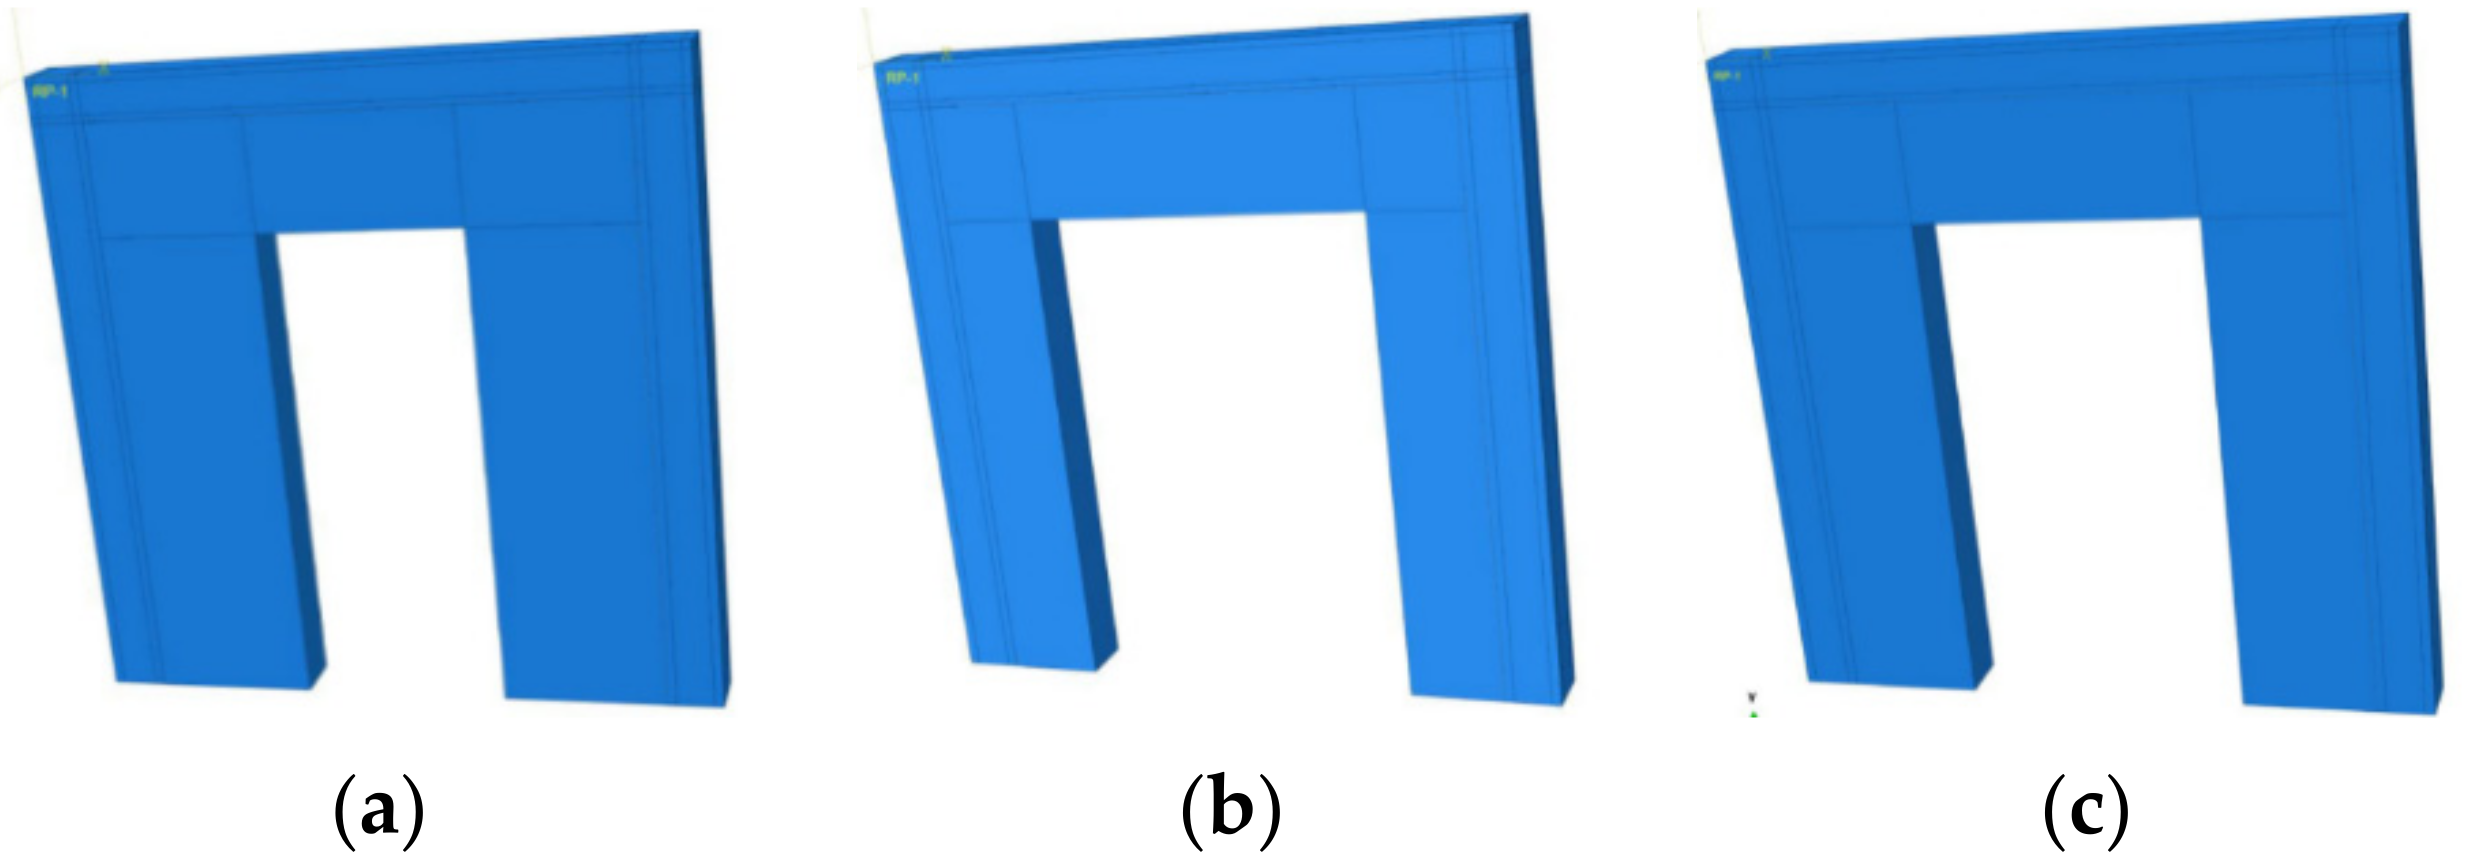
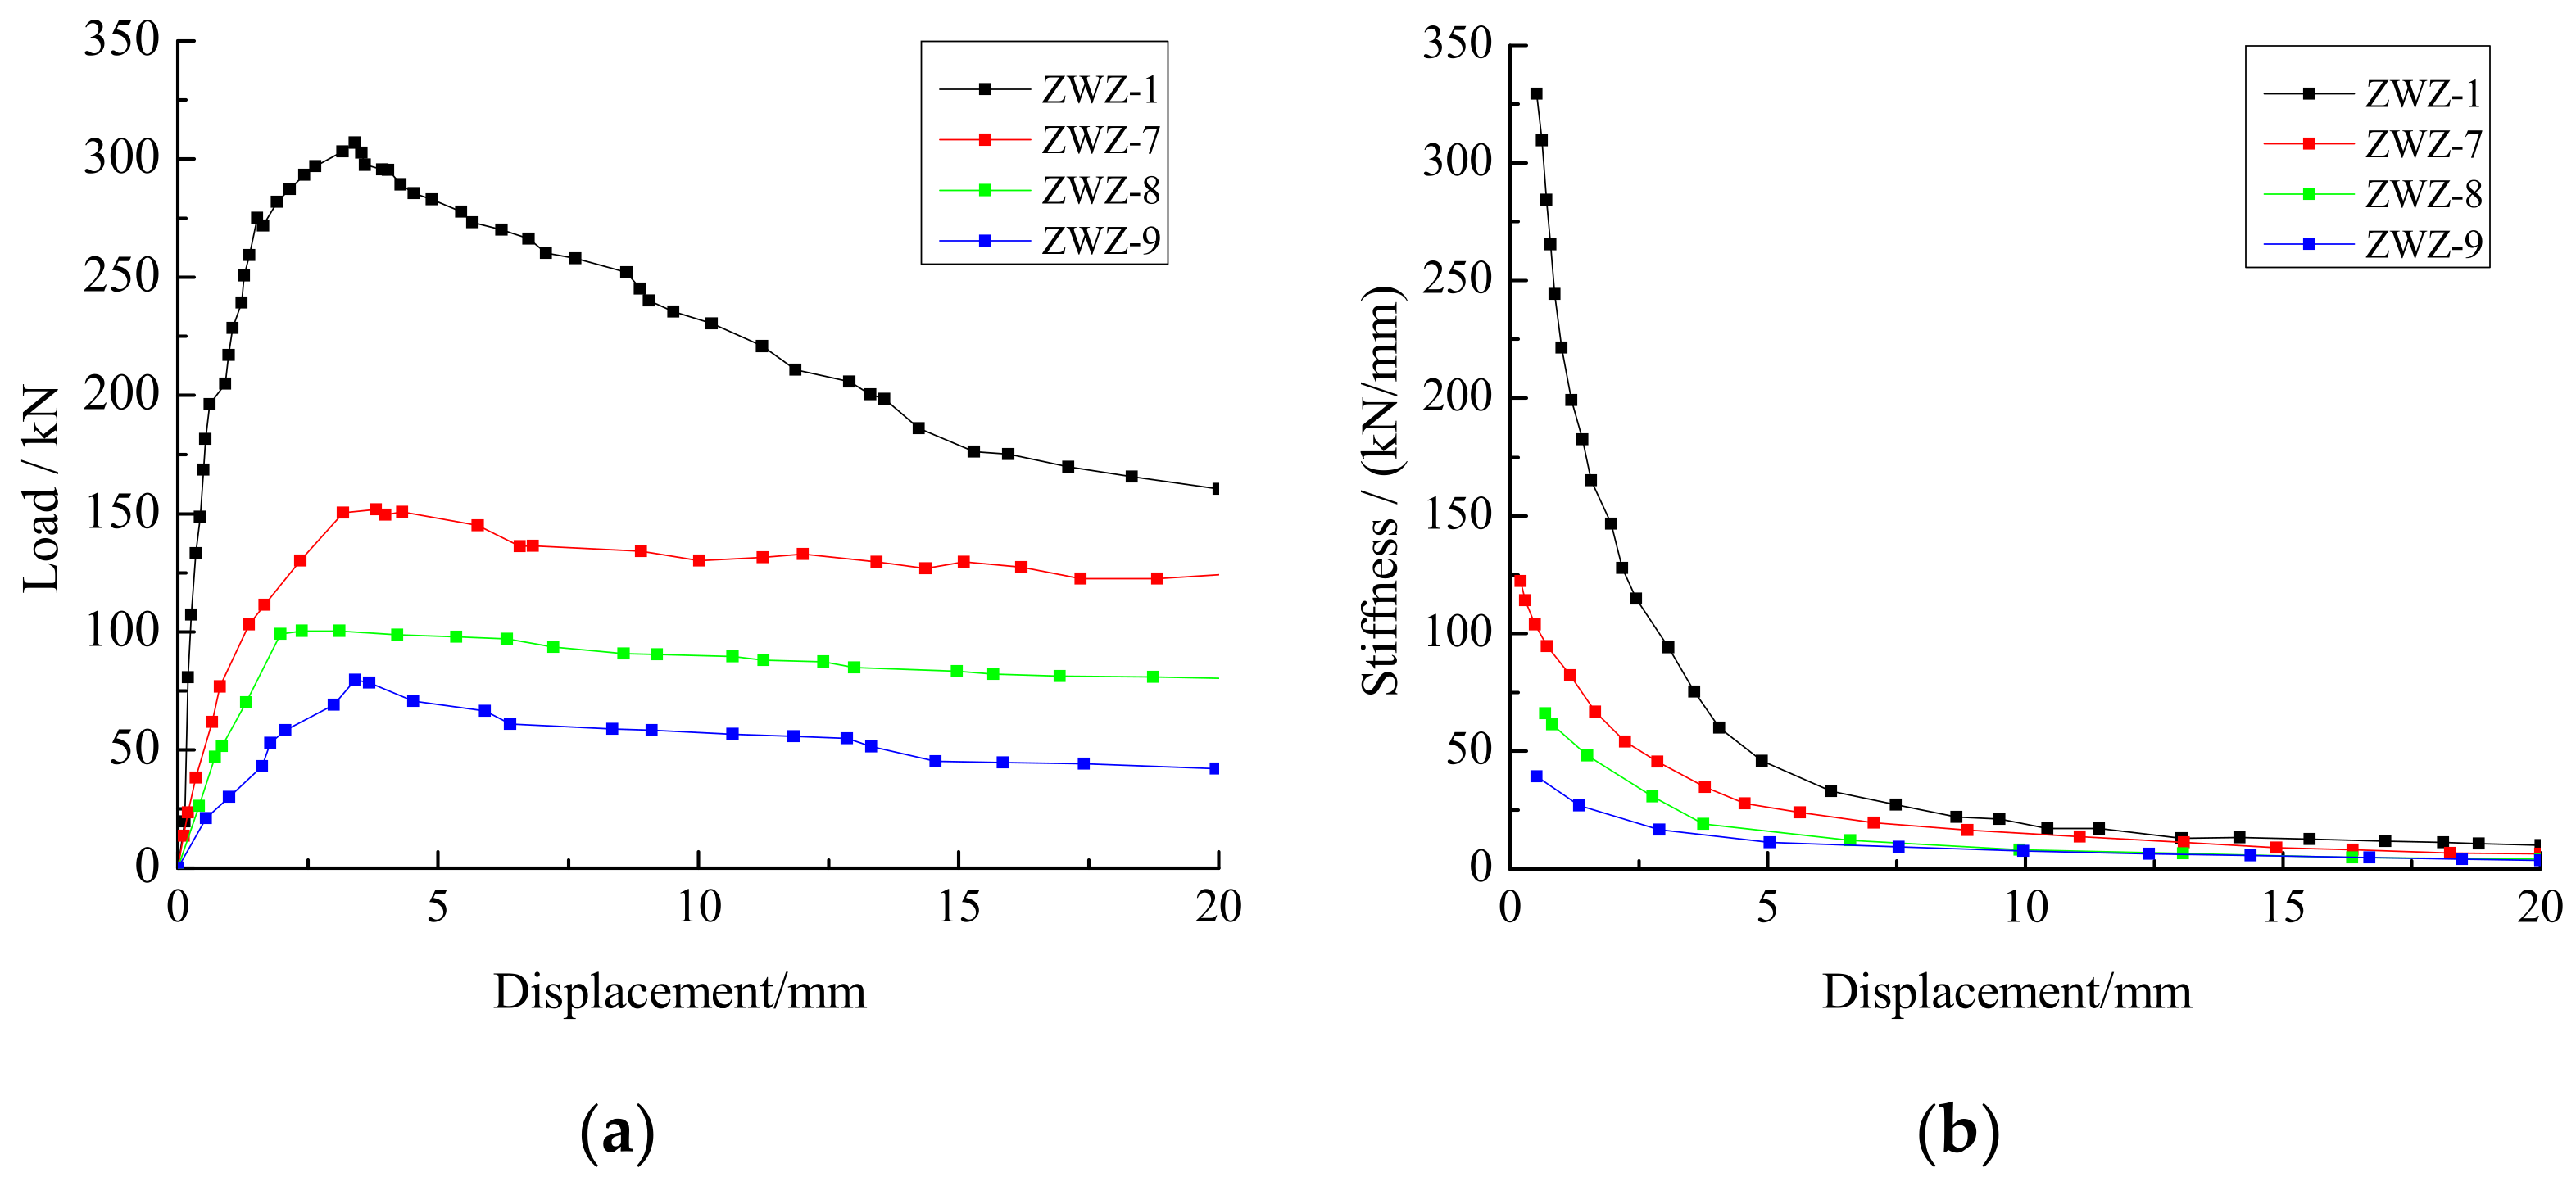
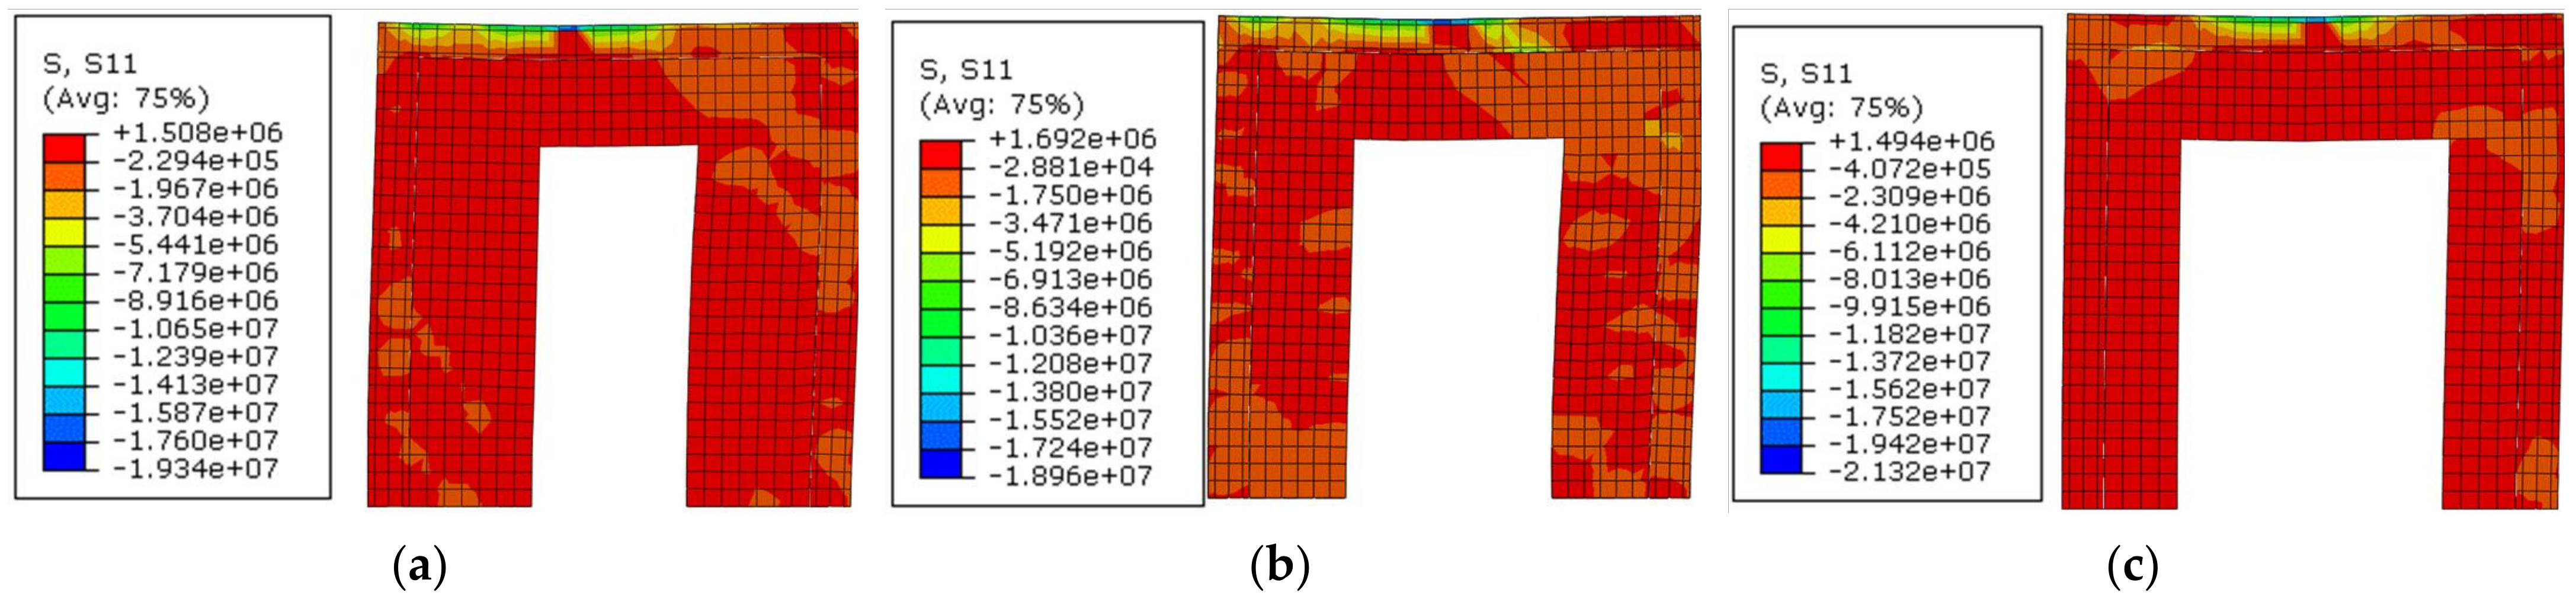
The door holes of walls ZWZ-7, ZWZ-8 and ZWZ-9 were located at the center of the wall, as shown in Figure 25. Meanwhile, the dimensions and parameters of walls ZWZ-7, ZWZ-8 and ZWZ-9 are shown in Table 6. From Equation (9) and simulation results, the bearing capacity values of the walls with different door hole dimensions are shown in Table 9. The load-displacement and stiffness-displacement curves of the walls are shown in Figure 26. The stress nephogram of the walls with different door hole dimensions are shown in Figure 27.
According to Table 9, compared to wall ZWZ-1 without an opening, the cracking loads of walls ZWZ-7, ZWZ-8, and ZWZ-9 were decreased by 69%, 76%, and 89%, respectively; the ultimate loads were decreased by 50%, 67%, and 74%, respectively; the failure loads were decreased by 31%, 48%, and 68%, respectively; and the displacement ductility ratios were decreased by 40%, 46%, and 57%, respectively. The ultimate loads of the walls were reduced owing to the large door holes, and strengthening measures should be implemented to improve the displacement ductility and earthquake resistance capacity of these walls.
As can be observed from Figure 26 and Figure 27, with the increase in the door hole dimensions, the bearing capacity of the walls with the holes was decreased. The stress concentration near the hole was distinct. The color of the grid cell in the graph was deepened, indicating that the stress of the unit increased. Regarding the wall damage, the wall near the holes had a weak area, particularly in the corner, in which stress concentration could easily form. Therefore, the wall cracking of the subregion was premature, and the bearing capacity and stiffness of the walls were reduced.
4.4. Vertical Compressive Stress on Seismic Performance of the Walls
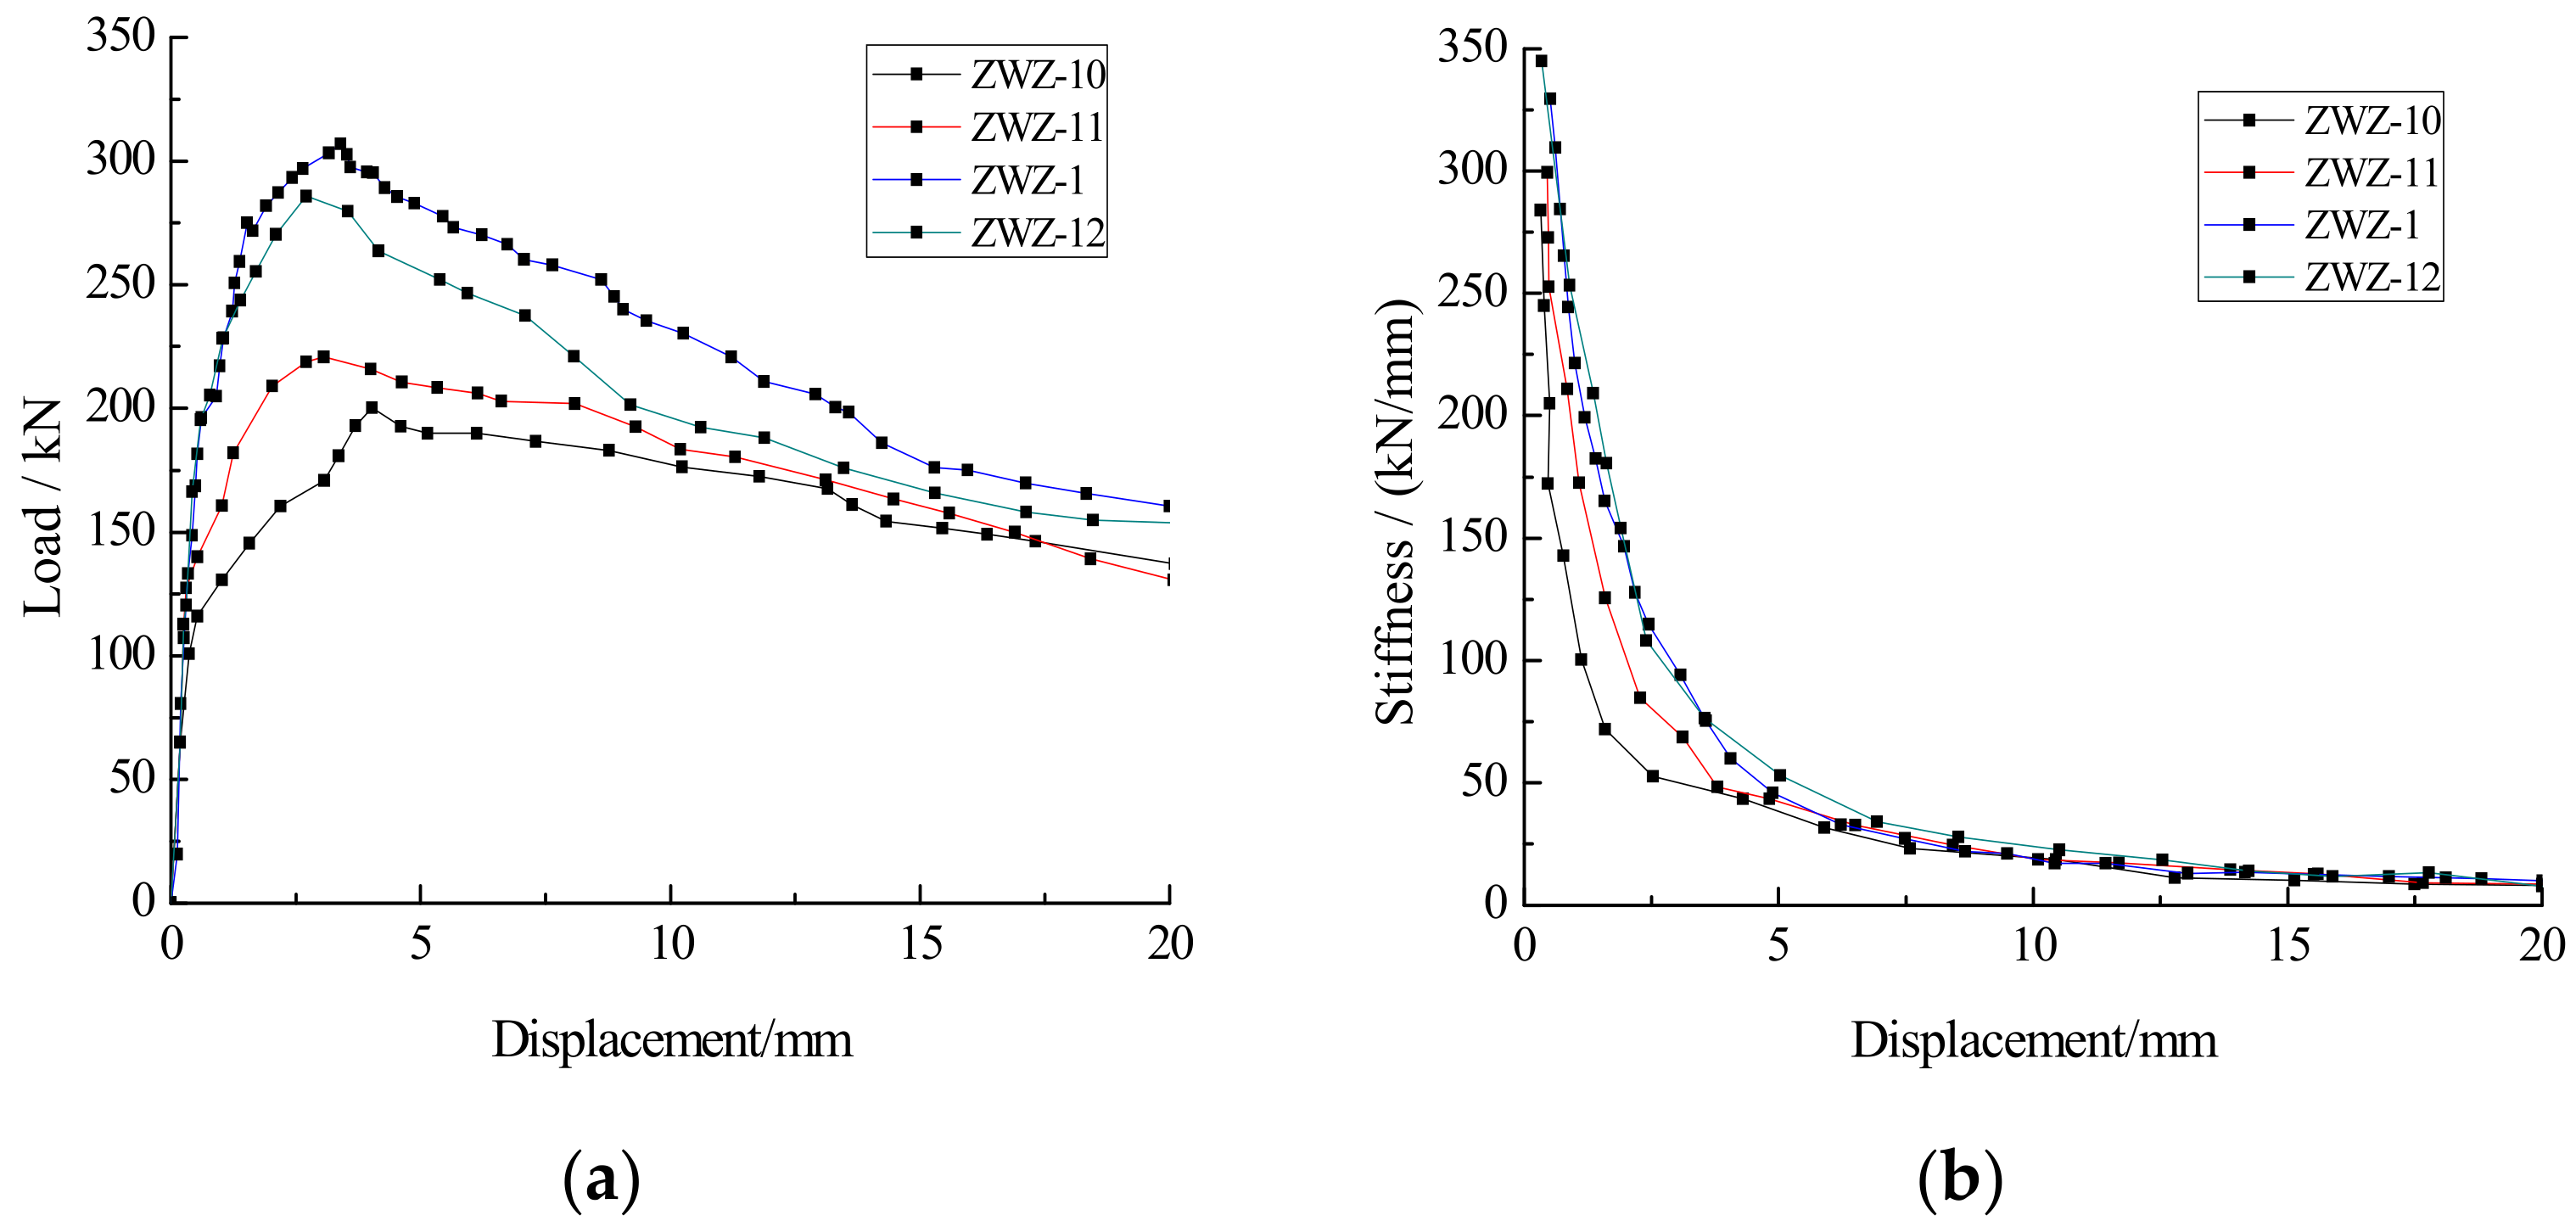
It is well known that there are three failure modes of the masonry wall including shear-friction failure, shear-compression failure and diagonal-compression failure with the increase of vertical compressive stress [36]. Vertical compressive stress has a significant impact on the shear strength of a masonry wall no matter what kind of failure occurs in the wall. From a nine-story residential building, Guo [37] concluded that the smallest vertical compressive stress located at the top floor was 0.2 MPa, the vertical compressive stress of the middle layer was assigned to 0.6 MPa, and the largest vertical compressive stress at the bottom floor was 0.9 MPa. According to the result, the vertical compressive stresses at the top of wall were 0 MPa, 0.2 MPa, 0.6 MPa and 1.0 MPa to simulate the different layers in the building. The dimensions and parameters of walls ZWZ-1, ZWZ-10 ZWZ-11 and ZWZ1-12 are shown in Table 6. From Equation (9) and simulation results, the bearing capacity values of the walls with vertical compressive stress are shown in Table 10. The load–displacement and stiffness–displacement curves of the walls with different vertical compressive stress are shown in Figure 28. The plastic strain magnitudes of the walls with different vertical compressive stress are shown in Figure 29.
From Table 10, compared to wall ZWZ-10 without the vertical compressive stress, the cracking loads of walls ZWZ-11, ZWZ-1 and ZWZ-12 were increased by 34%, 99% and 92% respectively, and the ultimate loads of walls ZWZ-1, ZWZ-11 and ZWZ-12 were increased by 5%, 52% and 43% respectively. With the vertical compressive stress increased, the cracking and ultimate loads of those walls increased at first and then decreased, but the ultimate displacement of those walls decreased. According to Figure 28, with the increase of the vertical compressive stress, the initial stiffness values and stiffness degradation rate of the walls increased, but the bearing capacity values of those walls increased at first and then decreased. The reason is that the shear-friction failure occurs in the wall when the vertical compressive stress is small, and then the friction increases with the increase of the vertical compressive stress to weaken the horizontal sliding of the wall. However, when the vertical compressive stress exceeds 0.6 MPa, diagonal-compression failure occurs in the wall and the bearing capacity and displacement of the walls decreased.
From Figure 29, the PEMAG value changed along the diagonal of the wall, and its distribution was the same as the X-type fracture distribution caused by shear failure of the wall. The color of each unit in the graph was deepened, indicating that the deformation of each unit increased. The PEMAG value of each unit of the wall was cumulative for analyzing the wall deformation with different vertical compressive stresses. With the increase of vertical compressive stresses, the wall deformation increased.
5. Conclusions
In this study, the authors proposed a new type of assembled autoclaved fly-ash-brick masonry wall to extend the application of masonry buildings. The mechanical property and seismic performance of the new type of assembled masonry walls were investigated by experiment and simulation analysis. A low-cyclic loading test of the assembled autoclaved fly-ash-brick masonry wall was carried out to verify the correctness of the numerical model. The factors influencing the seismic performance of the wall including mortar strength, opening rate of holes, and vertical compressive stress were analyzed quantitatively based on the bearing capacity, displacement ductility, and stiffness degradation. The methodology and main results are as follows:
- (1)
- The axial compression test of the autoclaved fly-ash-brick columns with different mortar strengths was carried out to obtain their failure mode and deformation characteristics. From the experiment, the stress–strain curve, which provides the constitutive model and material constants for the numerical model of the assembled autoclaved fly-ash-brick masonry walls, was built.
- (2)
- Two new types of assembled block, which can work as part of the walls and replace conventional templates to improve the seismic performance and shorten the construction period, were proposed to be used in constructional columns and ring beams.
- (3)
- The initial stiffness, bearing capacity, and stiffness degradation capacity of the assembled autoclaved fly-ash-brick masonry wall were close to those of the cast-in-place brick masonry wall, but the displacement ductility of the former was better than that of the latter. Therefore, the seismic performance of the assembled autoclaved fly-ash-brick masonry walls is better than that of cast-in-place masonry walls.
- (4)
- With the increase in mortar strength, the bearing capacity and displacement ductility of the assembled autoclaved fly-ash-brick walls increased. The stiffness degradation rate of the low-strength mortar masonry wall was large. The low-strength mortar led to premature cracking, which is unfavorable to the earthquake resistance of walls. Therefore, the 7.5 MPa mortar should be avoided in the aseismic design of masonry structures.
- (5)
- With the increase in the hole opening rate, the bearing capacity and the initial stiffness decreased, but the stiffness degradation rate increased. The wall around the holes caused stress concentration, which led to premature cracking and reduced the bearing capacity and stiffness of the assembled autoclaved fly-ash-brick walls. The influence of the opening rate was quantitatively analyzed to provide a reference value for masonry structural design.
- (6)
- The seismic performance of the brick walls was poor when the vertical compressive stress was large. Hence, the number of brick masonry structural layers should be limited to reduce the compressive stress.
Author Contributions
B.W. and L.Z.: formulation, writing, and analysis of the paper. B.W.: Data curation. D.N., G.G., Y.K. and D.L.: Supervision and Validation. All authors have read and agreed to the published version of the manuscript.
Funding
This research was funded by the Scientific Research Fund of Institute of Engineering Mechanics, China Earthquake Administration (Grant No. 2020EEEVL0415) (in China), the National Natural Science Foundation Project (No.51578450, No.51808438) (in China), Program for Innovative Research Team in University of Ministry of Education of China (Grant No. IRT_17R84) (in China), and Collaborative Innovation Project of Shaanxi Provincial Department of Education in China (No.20JY034) (in China).
Institutional Review Board Statement
Not applicable.
Informed Consent Statement
Not applicable.
Data Availability Statement
Data sharing not applicable.
Conflicts of Interest
The authors declare no conflict of interest. And the founding sponsors had no role in the design of the study; in the collection, analyses, or interpretation of data; in the writing of the manuscript, and in the decision to publish the results.
References
- Stepinac, M.; Lourenço, P.B.; Atalić, J.; Kišiček, T.; Uroš, M.; Baniček, M.; Šavor Novak, M. Damage classification of residential buildings in historical downtown after the ML5.5 earthquake in Zagreb, Croatia in 2020. Int. J. Disaster Risk Reduct. 2021, 56, 102140. [Google Scholar] [CrossRef]
- Vlachakis, G.; Vlachaki, E.; Lourenço, P.B. Learning from failure: Damage and failure of masonry structures, after the 2017 Lesvos earthquake (Greece). Sci. Direct. Eng. Failure Anal. 2020, 117, 104803. [Google Scholar] [CrossRef]
- Tomaževič, M.; Klemenc, A. Seismic behavior of confined masonry walls. Earthq. Eng. Struct. Dyn. 1997, 26, 1059–1071. [Google Scholar] [CrossRef]
- Yoshimura, K.; Kikuchi, K.; Kuroki, M.; Nonaka, H.; Kim, K.T.; Wangdi, R.; Oshikata, A. Experimental study for developing higher seismic performance of brick masonry wall. In Proceedings of the 13th World Conference on Earthquake Engineering, Vancouver, BC, Canada, 1–6 August 2004. [Google Scholar]
- Karantoni, F.; Pantazopoulou, S.; Ganas, A. Confined masonry as practical seismic construction alternative–the experience from the 2014 Cephalonia Earthquake. Front. Struct. Civ. Eng. 2018, 12, 270–290. [Google Scholar] [CrossRef]
- Shedid, M.T.; Dakhakhni, W.W.; Drysdale, R.G. Seismic response of linear, flanged and confined masonry shear walls. In Proceedings of the 14th World Conference on Earthquake Engineering, Beijing, China, 12–17 October 2008. [Google Scholar]
- Ashraf, M.; Khan, A.N.; Naseer, A.; Ali, Q.; Alam, B. Seismic behavior of unreinforced and confined brick masonry walls before and after ferrocement overlay retrofitting. Int. J. Archit. Herit. 2012, 6, 665–688. [Google Scholar] [CrossRef]
- Zheng, N.N.; Li, Y.M.; Liu, F.Q. Pseudo-static test study on seismic behavior of masonry wall restrained by core-tie-columns. China Civ. Eng. J. 2013, 46, 202–207. [Google Scholar]
- Quiroz, L.G.; Maruyama, Y.; Zavala, C. Cyclic behavior of peruvian confined masonry walls and calibration of numerical model using genetic algorithms. Eng. Struct. 2014, 75, 561–567. [Google Scholar] [CrossRef] [Green Version]
- Zhang, B.B.; Yang, D.J.; Wu, J.H. Development of research on reinforcement masonry building of concrete hollow block. J. Tianjin Inst. Urb. Constr. 2007, 13, 173–177. [Google Scholar]
- Sucuoglu, H.; Mcniven, H.D. Seismic shear capacity of reinforced masonry piers. J. Struct. Eng. 1991, 117, 2166–2185. [Google Scholar] [CrossRef]
- Liu, Z. Application of shear wall structure with reinforcement building blocks in engineering design. For. Sci. Technol. Inf. 2012, 44, 1–21. [Google Scholar]
- Huang, L.; Xu, Z.Y.; Gao, X. Research on the shear-resistance behavior of grouted block masonry. J. Hunan Uni. 2014, 41, 54–58. [Google Scholar]
- Wu, F.B.; Ren, H.Q.; Liu, B. Research on the compression behavior of the new horizontal-hole hollow concrete block masonry. J. Hunan Univ. 2015, 42, 25–32. [Google Scholar]
- Manjit, S.; Mridul, G. Cementitious binder from fly ash and other industrial wastes. Cem. Concr. Res. 1999, 29, 309–314. [Google Scholar]
- Ahmaruzzaman, M.A. Review on the utilization of fly ash. Prog. Energy Combust. Sci. 2010, 36, 327–363. [Google Scholar] [CrossRef]
- Kumar, S. A Perspective study on fly ash–lime–gypsum bricks and hollow blocks for low cost housing development. Constr. Build. Mater. 2002, 16, 519–525. [Google Scholar] [CrossRef]
- Chindaprasirt, P.; Pimraksa, K. A Study of fly ash-lime granule unfired brick. Powder Technol. 2008, 182, 33–41. [Google Scholar] [CrossRef]
- Kruschwitz, J.; Bluhm, J. Modeling of ice formation in porous solids with regard to the description of frost damage. Comput. Mater. Sci. 2005, 32, 407–417. [Google Scholar] [CrossRef]
- Wardeh, G.; Perrin, B. Freezing-thawing phenomena in fired clay materials and consequences on their durability. Constr. Build. Mater. 2008, 22, 820–828. [Google Scholar] [CrossRef]
- Sahu, S.; Teja, P.; Sarkar, P.; Davis, R. Effect of brick prewetting on masonry bond strength. J. Mater. Civ. Eng. 2019, 31, 06019009. [Google Scholar] [CrossRef]
- Mendola, L.L.; Papia, M. Stability of masonry piers under their own weight and eccentric load. ASCE J. Struct. Eng. 1993, 119, 1678–1693. [Google Scholar] [CrossRef]
- Mendola, L.L. Influence of nonlinear constitutive law on masonry pier stability. ASCE J. Struct. Eng. 1997, 123, 1303–1311. [Google Scholar] [CrossRef]
- Industrial Standard of the People’s Republic of China. JGJ70-2009. Basic Test Method of Building Mortar; China Architecture & Building Press: Beijing, China, 2009. [Google Scholar]
- National Standard of the People’s Republic of China. GB50003-2011. Code for Design of Masonry Structures; China Architecture & Building Press: Beijing, China, 2011. [Google Scholar]
- Madan, A. Modeling of Masonry infill Panels Analysis. ASCE J. Struct. Eng. 1997, 10, 56–61. [Google Scholar]
- Zhu, B.L. The Design Principle of Masonry Structures; Tongji University Press: Shanghai, China, 1991. [Google Scholar]
- Naraine, K.; Sinha, S. Model for cyclic compressive behavior of brick masonry. ACI Struct. J. 1991, 88, 603–609. [Google Scholar]
- Wen, B.; Zhang, L.; Niu, D. A Wall Formed by a Composite Block. China Patent CN205742610U, 30 November 2016. [Google Scholar]
- Aref, A.J.; Dolatshahi, K.M. A three-dimensional cyclic meso-scale numerical procedure for simulation of unreinforced masonry structures. Comput. Struct. 2013, 120, 9–23. [Google Scholar] [CrossRef]
- Smith, M. ABAQUS/Standard User’s Manual; Version 6.9; Dassault Systèmes Simulia Corp.: Providence, RI, USA, 2009. [Google Scholar]
- Zhang, S.; Yang, D.; Sheng, Y.; Garrity, S.W.; Xu, L. Numerical modelling of FRP-reinforced masonry walls under in-plane seismic loading. Constr. Build. Mater. 2017, 134, 649–663. [Google Scholar] [CrossRef]
- Zhang, Y.J. Study on Concrete Block Masonry Axial Compression Stress-Strain. Master’s Thesis, Harbin Institute of Technology, Harbin, China, 1 June 2002; pp. 45–62. [Google Scholar]
- Medeiros, P.; Vasconcelos, G.; Lourenço, P.B.; Gouveia, J. Numerical modelling of non-confined and confined masonry walls. Constr. Build. Mater. 2013, 41, 968–976. [Google Scholar] [CrossRef]
- El-Diasity, M.; Okail, H.; Kamal, O.; Said, M. Structural performance of confined masonry walls retrofitted using ferrocement and GFRP under in-plane cyclic loading. Eng. Struct. 2015, 94, 54–69. [Google Scholar] [CrossRef]
- Shi, C.X.; Xu, J.; Liu, G.Q. Design and Calculation of Masonry Structure; China Architecture & Building Press: Beijing, China, 2003. [Google Scholar]
- Guo, J. Experiment Research on Seismic Behavior of Small-Sized Hollow Concrete Block Full-Sized Wall. Master’s Thesis, Tsinghua University, Beijing, China, 1 May 2005. [Google Scholar]
Figure 1.
Size of autoclaved fly-ash-brick short columns.

Figure 2.
Sensors on the specimen.

Figure 3.
Loading test-piece.

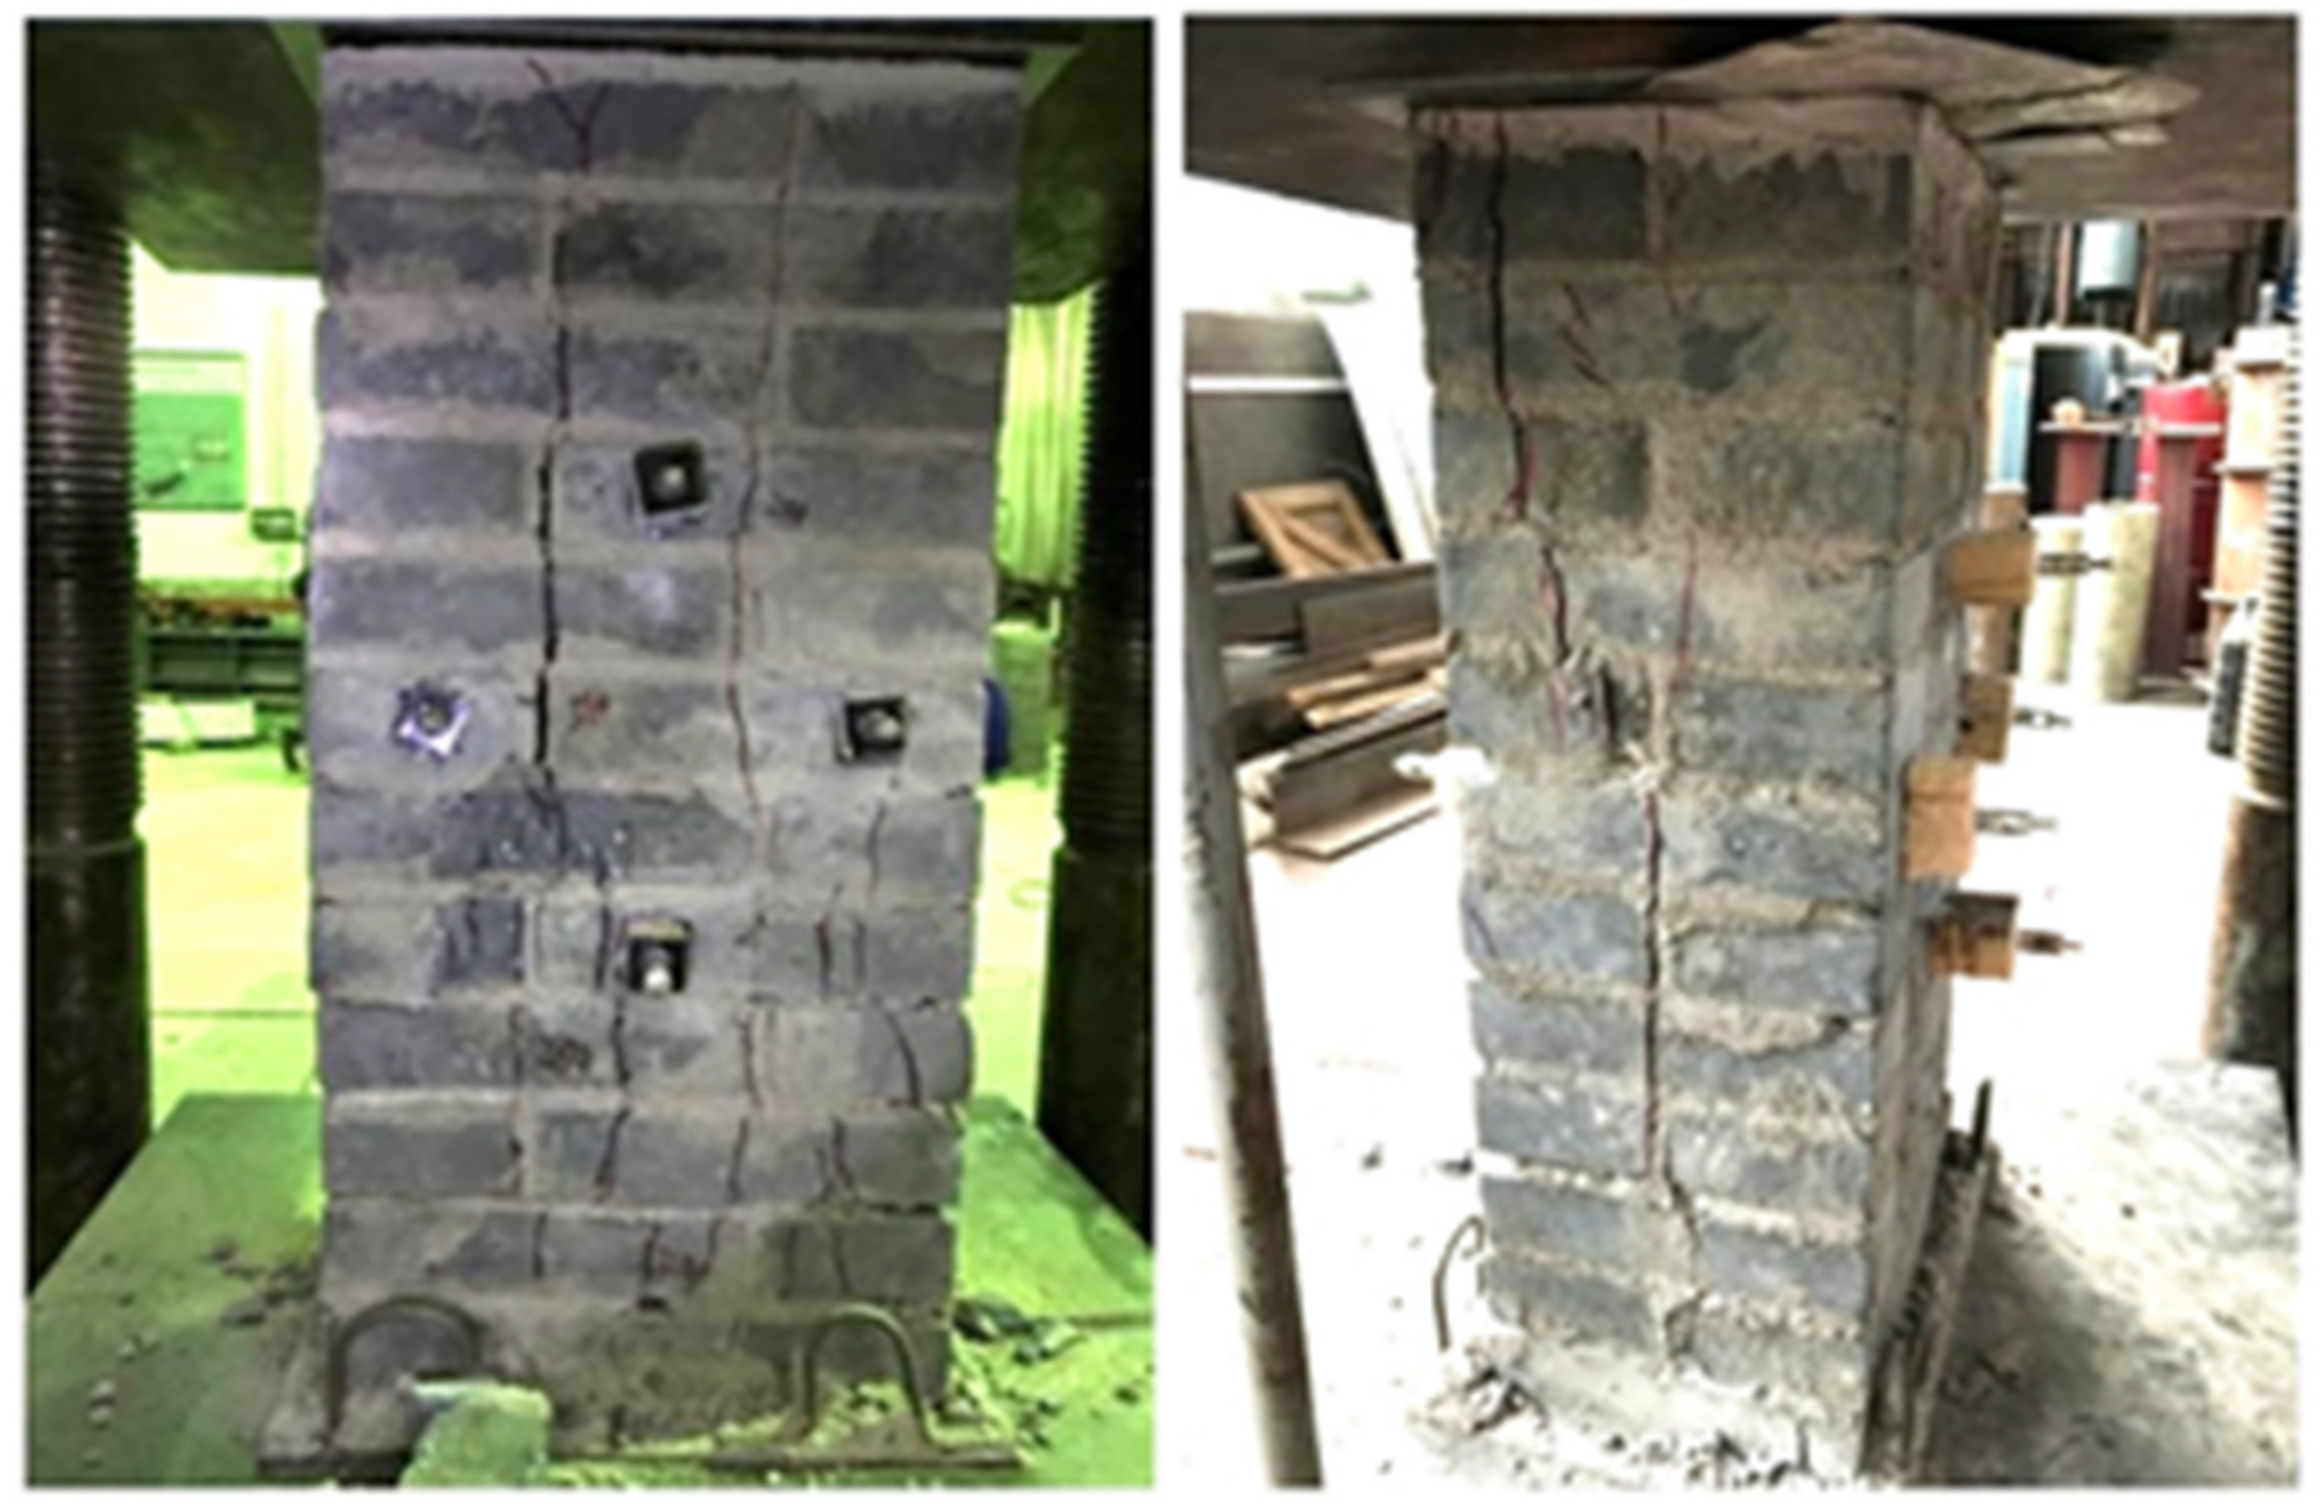
Figure 4.
Failure of the autoclaved fly-ash-brick column.

Figure 5.
Stress–strain curves.

Figure 6.
Dimensionless stress–strain curves.

Figure 7.
Correlation curves.

Figure 8.
Specification and dimension diagram of new-type assembly blocks: (a) constructional column block; (b) ring beam block.
Figure 8.
Specification and dimension diagram of new-type assembly blocks: (a) constructional column block; (b) ring beam block.

Figure 9.
Reinforced masonry blocks.

Figure 10.
(a) Wall numerical model; (b) wall mesh.

Figure 11.
Constitutive curves of new-type blocks: (a) compression constitutive curve (b) tensile constitutive curve.
Figure 11.
Constitutive curves of new-type blocks: (a) compression constitutive curve (b) tensile constitutive curve.

Figure 12.
Detailed diagram of assembly masonry wall: (a) wall dimensions (b) constructional reinforcement.
Figure 12.
Detailed diagram of assembly masonry wall: (a) wall dimensions (b) constructional reinforcement.

Figure 13.
Loading test-piece: (a) test setup; (b) lateral loading scheme.

Figure 14.
Load-displacement skeleton curves.

Figure 15.
Diagram of equivalent plastic strain and fracture distribution.

Figure 16.
Load–displacement curves: (a) common brick masonry walls; (b) autoclaved fly-ash-brick masonry walls.
Figure 16.
Load–displacement curves: (a) common brick masonry walls; (b) autoclaved fly-ash-brick masonry walls.

Figure 17.
Stiffness–displacement curves: (a) common brick masonry walls; (b) autoclaved fly-ash-brick masonry walls.
Figure 17.
Stiffness–displacement curves: (a) common brick masonry walls; (b) autoclaved fly-ash-brick masonry walls.

Figure 18.
Load-displacement curves of brick walls under different forms of construction measure.

Figure 19.
Stiffness-displacement curves of brick walls under different forms of construction measure.
Figure 19.
Stiffness-displacement curves of brick walls under different forms of construction measure.

Figure 20.
Load–displacement and stiffness–displacement curves of the walls with different mortar strength: (a) load–displacement curves; (b) stiffness–displacement curves.
Figure 20.
Load–displacement and stiffness–displacement curves of the walls with different mortar strength: (a) load–displacement curves; (b) stiffness–displacement curves.

Figure 21.
Plastic strain magnitude of the walls with different mortar strength: (a) wall ZWZ-2; (b) wall ZWZ-1; (c) wall ZWZ-3.
Figure 21.
Plastic strain magnitude of the walls with different mortar strength: (a) wall ZWZ-2; (b) wall ZWZ-1; (c) wall ZWZ-3.

Figure 22.
Wall models with different window holes’ dimensions: (a) wall ZWZ-4; (b) wall ZWZ-5; (c) wall ZWZ-6.
Figure 22.
Wall models with different window holes’ dimensions: (a) wall ZWZ-4; (b) wall ZWZ-5; (c) wall ZWZ-6.

Figure 23.
Load–displacement and stiffness–displacement curves of the walls with different window holes’ dimensions: (a) load–displacement curves; (b) stiffness–displacement curves.
Figure 23.
Load–displacement and stiffness–displacement curves of the walls with different window holes’ dimensions: (a) load–displacement curves; (b) stiffness–displacement curves.

Figure 24.
Stress nephogram of the walls with different window holes’ dimensions: (a) wall ZWZ-4; (b) wall ZWZ-5; (c) wall ZWZ-6.
Figure 24.
Stress nephogram of the walls with different window holes’ dimensions: (a) wall ZWZ-4; (b) wall ZWZ-5; (c) wall ZWZ-6.

Figure 25.
Wall models with different door holes’ dimensions: (a) wall ZWZ-7; (b) wall ZWZ-8; (c) wall ZWZ-9.
Figure 25.
Wall models with different door holes’ dimensions: (a) wall ZWZ-7; (b) wall ZWZ-8; (c) wall ZWZ-9.

Figure 26.
Load–displacement and stiffness–displacement curves with different door hole dimensions: (a) load–displacement curves; (b) stiffness–displacement curves.
Figure 26.
Load–displacement and stiffness–displacement curves with different door hole dimensions: (a) load–displacement curves; (b) stiffness–displacement curves.

Figure 27.
Stress nephogram of the walls with different door hole dimensions: (a) wall ZWZ-7; (b) wall ZWZ-8; (c) wall ZWZ-9.
Figure 27.
Stress nephogram of the walls with different door hole dimensions: (a) wall ZWZ-7; (b) wall ZWZ-8; (c) wall ZWZ-9.

Figure 28.
Load–displacement and stiffness–displacement curves of the walls with different vertical compressive stress: (a) load–displacement curves; (b) stiffness–displacement curves.
Figure 28.
Load–displacement and stiffness–displacement curves of the walls with different vertical compressive stress: (a) load–displacement curves; (b) stiffness–displacement curves.

Figure 29.
Plastic strain magnitude of the walls with different vertical compressive stress: (a) wall ZWZ-10; (b) wall ZWZ-11; (c) wall ZWZ-12.
Figure 29.
Plastic strain magnitude of the walls with different vertical compressive stress: (a) wall ZWZ-10; (b) wall ZWZ-11; (c) wall ZWZ-12.


Table 1.
Deformation characteristics of the autoclaved fly-ash-brick column.
| Load | Value | Behavior of the Specimen |
|---|---|---|
| loading pressure | 0.3–0.4 Pu | Vertical displacement and pressure value uniformly increased; almost no crack; stress–strain curve was linear; specimens work in the elastic phase |
| 0.62 Pu | Cracks appeared on the specimen surface where the longitudinal gray seam was not full, or the mortar was uneven. | |
| 0.7 Pu | Displacement value increased faster than that in the previous stage. | |
| 0.8–0.95 Pu | Main cracks extended to the entire specimen, whereas longitudinal cracks rapidly developed; The increase rate of the displacement value becomed smaller than that in the former stage, and the stress–strain curve slope tended to be parallel. | |
| 1 Pu | Main cracks widened to divide the specimens into small columns | |
| After above stages | Compression pressure values began to decrease; main vertical cracks expanded from the top of the column to the bottom, and small cracks penetrated one another; autoclaved fly-ash-brick short columns exhibited external drum phenomenon, and much brick slag was being peeled off, accompanied by a breaking sound (the autoclaved fly-ash brick was not able to bear the load) | |
| un-loading pressure | 0.6–0.75 Pu | Downward trend of the pressure values slows down, which lead to an inflection point. Then, the load values continued to decrease until the specimen was completely destroyed. |
Note: Pu is ultimate load.
Table 2.
Parameters of test walls.
| Number | Dimension B × H × b (mm) | Em (MPa) | fcm (MPa) | fb,c (MPa) | fm,c (MPa) |
|---|---|---|---|---|---|
| Assembly masonry wall | 1990 × 1340 × 240 | 2404 | 20.19 | 12.36 | 10.12 |
Note: Em is the modulus of elasticity of masonry; fcm is the average compressive strength of constructional column and ring beam blocks, fb,c and fm,c are the average compressive strength of masonry brick and mortar, respectively.
Table 3.
Ultimate loads and displacements of the walls.
| Wall | Ultimate Loads (kN) | Ultimate Displacement (mm) |
|---|---|---|
| Test wall | 245 | 10.9 |
| Wall numerical model | 231 | 9.32 |
| Error | 5.33% | 14.50% |
Table 4.
Dimensions and parameters of the walls.
| Number | Wall Material | Construction Measure | Form of Construction Work | Dimension (mm) (Length × Height × Thickness) |
|---|---|---|---|---|
| WQ-1 | fired common-brick | no | no | 2560 × 2600 × 240 |
| WZ-1 | autoclaved fly-ash-brick | no | no | 2560 × 2600 × 240 |
| XWQ-1 | fired common-brick | yes | cast in situ | 2800 × 2800 × 240 |
| XWZ-1 | autoclaved fly-ash-brick | yes | cast in situ | 2800 × 2800 × 240 |
| ZWQ-1 | fired common-brick | yes | assembly | 2800 × 2800 × 240 |
| ZWZ-1 | autoclaved fly-ash-brick | yes | assembly | 2800 × 2800 × 240 |
Note, XWQ means the fired common brick wall with cast-in-place construction measures; while ZWZ-1 means the autoclaved fly-ash-brick wall with assembly construction measures. The rest of the statements are similar to them.
Table 5.
Bearing capacity values of the walls.
| Number | Wall Material | Construction Measures | Cracking Load Pcr (kN) | Cracking Displacement Δcr (mm) | Ultimate Load Pu (kN) | Ultimate Displacement Δu (mm) | Failure Load Pf (kN) | Failure DisplacementΔf (mm) | Δf/Δu |
|---|---|---|---|---|---|---|---|---|---|
| WQ-1 | fired common brick | no | 103 | 1.01 | 171 | 5.01 | 147 | 11.07 | 2.21 |
| XWQ-1 | cast in situ | 182 | 0.45 | 296 | 3.19 | 200 | 13.13 | 4.12 | |
| ZWQ-1 | assembly | 198 | 0.48 | 298 | 3.09 | 188 | 13.75 | 4.45 | |
| WZ-1 | autoclaved fly-ash-brick | no | 107 | 0.87 | 167 | 4.26 | 136 | 11.94 | 2.80 |
| XWZ-1 | cast in situ | 199 | 0.67 | 299 | 3.41 | 202 | 13.43 | 3.94 | |
| ZWZ-1 | assembly | 199 | 0.62 | 303 | 3.16 | 188 | 13.75 | 4.35 |
Table 6.
Dimensions and parameters of walls.
| Number | Dimension (mm) (Length × Height × Thickness) | Distribution of Holes (mm) | Vertical Compressive Stress (MPa) | Mortar Strength (MPa) |
|---|---|---|---|---|
| ZWZ-1 | 2800 × 2800 × 240 | Without the opening | 0.6 | 10 |
| ZWZ-2 | 2800 × 2800 × 240 | Without the opening | 0.6 | 7.5 |
| ZWZ-3 | 2800 × 2800 × 240 | Without the opening | 0.6 | 15 |
| ZWZ-4 | 2800 × 2800 × 240 | Window opening 750 × 900 | 0.6 | 10 |
| ZWZ-5 | 2800 × 2800 × 240 | Window opening 1000 × 1200 | 0.6 | 10 |
| ZWZ-6 | 2800 × 2800 × 240 | Window opening 1200 × 1200 | 0.6 | 10 |
| ZWZ-7 | 2800 × 2800 × 240 | Door opening 900 × 2100 | 0.6 | 10 |
| ZWZ-8 | 2800 × 2800 × 240 | Door opening 1200 × 2100 | 0.6 | 10 |
| ZWZ-9 | 2800 × 2800 × 240 | Door opening 1500 × 2100 | 0.6 | 10 |
| ZWZ-10 | 2800 × 2800 × 240 | Without the opening | 0 | 10 |
| ZWZ-11 | 2800 × 2800 × 240 | Without the opening | 0.2 | 10 |
| ZWZ-12 | 2800 × 2800 × 240 | Without the opening | 1 | 10 |
Table 7.
Bearing capacity values of the walls with different mortar strength.
| Number | Mortar Strength | Cracking Load Pcr (kN) | Cracking Displacement Δcr (mm) | Ultimate Load Pu (kN) | Ultimate Displacement Δu (mm) | Failure Load Pf (kN) | Failure Displacement Δf (mm) | Δf/Δu |
|---|---|---|---|---|---|---|---|---|
| ZWZ-2 | M7.5 | 121 | 0.58 | 268 | 2.81 | 177 | 10.83 | 3.85 |
| ZWZ-1 | M10 | 199 | 0.62 | 303 | 3.16 | 188 | 13.75 | 4.35 |
| ZWZ-3 | M15 | 208 | 0.69 | 311 | 3.23 | 199 | 14.5 | 4.49 |
Table 8.
Bearing capacity values of the walls with different window holes’ dimensions.
| Number | Distributionof Holes (mm) | Cracking Load Pcr (kN) | Cracking Displacement Δcr (mm) | Ultimate Load Pu (kN) | Ultimate Displacement Δu (mm) | Failure Load Pf (kN) | Failure Displacement Δf (mm) | Δf/Δu |
|---|---|---|---|---|---|---|---|---|
| ZWZ-1 | Without opening | 199 | 0.62 | 303 | 3.16 | 188 | 13.75 | 4.35 |
| ZWZ-4 | 750 × 900 | 91 | 0.52 | 183 | 3.54 | 135 | 9.11 | 2.57 |
| ZWZ-5 | 1000 × 1200 | 73 | 0.78 | 135 | 3.89 | 124 | 8.14 | 2.09 |
| ZWZ-6 | 1200 × 1200 | 39 | 0.51 | 78 | 1.87 | 73 | 4.23 | 2.26 |
Table 9.
Bearing capacity values of the walls with different door hole dimensions.
| Number | Dimension of Holes (mm) | Cracking Load Pcr (kN) | Cracking Displacement Δcr (mm) | Ultimate Load Pu (kN) | Ultimate Displacement Δu (mm) | Failure Load Pf (kN) | Failure Displacement Δf (mm) | Δf/Δu |
|---|---|---|---|---|---|---|---|---|
| ZWZ-1 | Without the opening | 199 | 0.62 | 303 | 3.16 | 188 | 13.75 | 4.35 |
| ZWZ-7 | 900 × 2100 | 61 | 0.65 | 152 | 3.81 | 130 | 10.01 | 2.63 |
| ZWZ-8 | 1000 × 2100 | 47 | 0.71 | 100 | 2.37 | 98 | 5.56 | 2.35 |
| ZWZ-9 | 1200 × 2100 | 21 | 0.54 | 79 | 3.41 | 60 | 6.3 | 1.85 |
Table 10.
Bearing capacity values of the walls with different vertical compressive stress.
| Number | Vertical Compressive Stress (MPa) | Cracking Load Pcr (kN) | Cracking Displacement Δcr (mm) | Ultimate Load Pu (kN) | Ultimate Displacement Δu(mm) | Failure Load Pf (kN) | Failure Displacement Δf(mm) | Δf/Δu |
|---|---|---|---|---|---|---|---|---|
| ZWZ-10 | 0 | 100 | 0.36 | 200 | 4.11 | 174 | 10.77 | 2.62 |
| ZWZ-11 | 0.2 | 134 | 0.42 | 210 | 3.92 | 200 | 8.51 | 2.17 |
| ZWZ-1 | 0.6 | 199 | 0.62 | 303 | 3.16 | 188 | 13.75 | 4.35 |
| ZWZ-12 | 1 | 192 | 0.59 | 285 | 2.71 | 199 | 9.4 | 3.47 |
Publisher’s Note: MDPI stays neutral with regard to jurisdictional claims in published maps and institutional affiliations. |
© 2021 by the authors. Licensee MDPI, Basel, Switzerland. This article is an open access article distributed under the terms and conditions of the Creative Commons Attribution (CC BY) license (https://creativecommons.org/licenses/by/4.0/).
Share and Cite
MDPI and ACS Style
Wen, B.; Zhang, L.; Niu, D.; Gao, G.; Kang, Y.; Luo, D. Mechanical Performance of Confined Autoclaved Fly-Ash-Brick Masonry Walls under Cyclic Loading. Appl. Sci. 2021, 11, 10560. https://0-doi-org.brum.beds.ac.uk/10.3390/app112210560
AMA Style
Wen B, Zhang L, Niu D, Gao G, Kang Y, Luo D. Mechanical Performance of Confined Autoclaved Fly-Ash-Brick Masonry Walls under Cyclic Loading. Applied Sciences. 2021; 11(22):10560. https://0-doi-org.brum.beds.ac.uk/10.3390/app112210560
Chicago/Turabian StyleWen, Bo, Lu Zhang, Ditao Niu, Guanyi Gao, Yongkang Kang, and Daming Luo. 2021. "Mechanical Performance of Confined Autoclaved Fly-Ash-Brick Masonry Walls under Cyclic Loading" Applied Sciences 11, no. 22: 10560. https://0-doi-org.brum.beds.ac.uk/10.3390/app112210560
Note that from the first issue of 2016, this journal uses article numbers instead of page numbers. See further details here.