Article

Using the Instrumented Indentation Technique to Determine Damage in Sintered Metal Matrix Composites after High-Temperature Deformation

Institute of Engineering Science, UB RAS, 34 Komsomolskaya St., 620049 Ekaterinburg, Russia
*
Author to whom correspondence should be addressed.
Submission received: 18 October 2021 / Revised: 7 November 2021 / Accepted: 8 November 2021 / Published: 10 November 2021

Abstract

:
The paper shows the applicability of data on the evolution of the elastic modulus measured by the instrumented microindentation technique to the determination of accumulated damage in metal matrix composites (MMCs) under high temperature deformation. A composite with a V95 aluminum alloy matrix (the Russian equivalent of the 7075 alloy) and SiC reinforcing particles is used as the research material. The metal matrix composite was produced by powder technology. The obtained results show that, under macroscopic compression at temperatures ranging between 300 and 500 °C, the V95\10% SiC MMC has the best plasticity at 300 °C. At a deformation temperature of 500 °C, the plastic properties are significantly lower than those at 300 and 400 °C.

1. Introduction

Practical problems of materials processing by plastic deformation often require damage criteria and damage models, with the help of which it would be possible to assess the deformation ability of materials in various technological processes [1,2,3,4,5]. After thermomechanical deformation, damage models are most often experimentally identified and verified on the basis of density measurements of deformable material specimens [6,7,8,9], metallographic analysis [6,8,10,11], computed tomography [12,13], as well as on the basis of measurements of physical characteristics implicitly dependent on metal imperfection, such as the elastic modulus [8,10,13], hardness [10,14], electrical resistance [8,10,15], acoustic emission characteristics [8,16], and heat dissipation [17,18,19].
Under severe plastic deformation of specimens, an inhomogeneous stress-strain state is formed due to the loss of specimen stability. A neck is formed during tensile tests, and a barrel is formed during compression tests. This is especially evident at high temperatures, when lubricant effectiveness is greatly reduced, thus making the specimen barrel-shaped. In this case, the stress state and accumulated strain in the specimen strongly depend on the area under consideration. The smallest strain is concentrated at the specimen–die contact, the largest strain being found in the specimen center. Under certain conditions, the sign of the stress-state factors on the specimen side surface can reverse. Therefore, the level of accumulated damage in a specimen is significantly heterogeneous in volume, and the use of macro-level tests for determining the relation of accumulated material damage to external thermomechanical effects may lead to a significant error. As a result, micro-level testing is required to find the relationships between the stress-strain state history and material damage.
Methods for determining damage at the micro-level are based on data of metallographic analysis, computed tomography, hardness and elasticity measurements. The former two methods are direct methods for measuring damage, and they are theoretically the most accurate. However, their practical application is inconvenient. In the metallographic method, it is rather difficult to prepare a thin section where there would be no particles of the composite matrix or the alloy phase, which result from mechanical grinding and polishing. Besides, microcracks and micropores are polished out during thin section preparation. Another methodological difficulty of the metallographic technique is the lack of reliable methods for detecting all submicropores and submicrocracks, as well as all micropores and microcracks. At the moment, the only drawback of the technique based on computed tomography data is the resolution of computer tomographs, which allow us to detect reliably defects with a linear size of above 15 µm in real measurements of metal-based specimens [12,20].
Methods based on measuring hardness and elasticity by instrumented indentation at the micro-level avoid the disadvantages of the metallographic technique; however, they have a number of other significant problems [13,21]. As shown in [13], the technique based on hardness measurements cannot be used to calculate damage in metallic materials due to the presence of competitive processes associated with hardening and softening as a result of increasing material damage by defects. Damage determination based on elastic modulus measurements is devoid of the disadvantages of the metallographic technique caused by polishing out submicroscopic and microscopic material defects, as well as by their detection methods. Besides, the elastic modulus is weakly affected by relaxation processes and by grain shape and size [22,23]. Nevertheless, as shown in [13,21], the determination of the elastic modulus in metallic materials at the micro-level by the Oliver-Pharr method has a number of methodological difficulties, such as the effect of texture evolution on the elastic modulus, phase transformations during deformation and the appearance of residual stresses in materials, as well as the necessity to produce specimens with a surface plane perpendicular to the indenter. The latter problem is fairly easy to solve, but the issues related to the effect of residual stress formation, as well as texture and phase evolution, on the elastic modulus cannot be easily resolved since these characteristics represent the state of the material after deformation. The authors of [24] solved these problems for the DP600 steel using heat treatment of the specimen, which included recrystallization and recovery. Due to the thermal effect on the steel, they were able to restore the initial grain microstructure and texture and to remove residual stresses. At the same time, based on the metallographic method, the authors found that the density of specimen defects remained unchanged. This allowed them to determine specimen damage using the instrumented indentation technique. It was reported in [24] that this technique is laborious. Besides, thermal effects reduce material damage [9,25], thus generally making it impossible to use heat treatment to determine specimen damage proceeding from data on elastic modulus evolution.
At high deformation temperatures, relaxation processes associated with dynamic recovery and recrystallization occur in metal materials. This forms new grains and decreases texturization and residual stresses [26,27,28,29]. Thus, the deformation of metal materials under conditions of dynamic structure formation can form material microstructure suitable for the determination of damage in metallic materials from microindentation data.
Numerous studies have reported on the effect of thermomechanical conditions on damage accumulation [9,25,30,31,32,33] and damage healing [9,25,34,35] in metals and alloys in terms of both the mechanics of solids [9,25,31,32,33] and physical material science [25,30,34]. Unlike the case with alloys, interface boundaries between the phase constituents of metal matrix composites act more clearly as sources for the formation of discontinuities and barriers for micro- and macrocrack growth. As a result, the models relating the history of changes in temperature and the stress-strain state to damage accumulated in a metal matrix composite due to the presence of reinforcing particles may in general differ from previously constructed models for alloys. A limited number of studies deal with this problem [36,37,38,39], and this makes it relevant to study damage evolution in metal matrix composites under various thermomechanical conditions. The goal of this article is to evaluate the applicability of data on elastic modulus evolution at the micro-level to the study of damage in metal matrix composites under high-temperature deformation conditions. The best type of metal matrix composites used to estimate the damage measuring method is a composite produced by powder technology since microcracks can be much more easily detected in it than in a composite made by liquid-phase technology. This is what determined the choice of the method of composite manufacturing.

2. Material and Research Methods

The V95\10% SiC aluminum matrix composite and the V95\0% SiC material were manufactured using powder metallurgy technologies with and without the addition of reinforcing particles, respectively. The V95\10% SiC and V95\0% SiC materials were not extruded after sintering. The size of the used SiC particles with an average diameter of 3.0 ± 0.5 μm corresponded to F1200 (FEPA-Standard 42-2:2006). The V95 alloy powder particles had a shape close to a solid sphere. The particle diameter ranged between 1 and 60 μm. The V95 alloy (similar to the 7075 aluminum alloy in the chemical composition) had the following chemical composition, wt%: Al 89.73, Zn 5.72, Mg 1.95, Cu 1.71, Mn 0.34, Fe 0.26, Cr 0.14, Ni 0.06, Si 0.05, Ti 0.05, and Zn 0.02. Raw material constituents of the V95\10% SiC MMC and the V95\0% SiC material were mixed by a vibromixer. Sintering was carried out at 470 °C for 60 min. The sintering pressure was 30 MPa. There were no additives for modifying the surface of the SiC particles.
Particle examination and fracture surface analysis after specimen deformation were performed using a Vega II Tescan scanning electron microscope. The microstructure of the specimens before deformation was studied by the electron backscatter diffraction (EBSD) technique using a Vega II Tescan scanning electron microscope with an EBSD Oxford HKL NordlysF+ analysis accessory. Figure 1 shows the SEM image and the EBSD image of the matrix of the V95\10% SiC metal matrix composite and the V95\0% SiC material after sintering. When constructing EBSD images, we assumed that high-angle boundaries had a misorientation of more than 15° and that the low-angle boundaries were in the range from 2 to 15°. The grain boundaries in the EBSD images are black, and the low-angle boundaries are shown in gray. Dark spots on the EBSD images correspond to places where it was impossible to determine the orientation of the matrix lattice, and they generally correspond to areas with a large accumulation of SiC particles.
The scanning pitch in the EBSD analysis was 0.3 μm. The size of the scanned area was 300 × 200 μm. For EBSD analysis and search for pores and microcracks, the specimens were first mechanically polished. Then, they were ion-polished by a Linda SEMPrep2 ion milling device for 30 min at an accelerating voltage of 10 kV with the angle of specimen inclination to the ion beam equal to 7°.
Cylindrical specimens were tested for compression and tension in the Instron 8801 servohydraulic experimental system. The compression specimen had a diameter of d 0 = 6 ± 0.05 mm and a height of h 0 = 9 ± 0.05 mm. The cylindrical tensile specimen had the following dimensions: d 0 = 5 ± 0.05 mm and the length of the working part l 0 = 25 ± 0.1 mm. In compression tests, a graphite-based lubricant was used to reduce friction between the punch and the specimen. The lubricant provided the coefficient of Coulomb friction between the punch and the aluminum alloys equal to 0.09 at 300 °C; at temperatures of 400 and 500 °C, the coefficient of friction was 0.1 and 0.13, respectively. After the test, despite lubrication, the specimen became barrel-shaped (Figure 2) in the entire deformation temperature range. In order to determine the stress-strain state evolution in the specimen during the test, its computational model was constructed and solved by the finite element method in the DEFORM program. An isothermal viscoplastic model with isotropic strain hardening was adopted for the specimen material. The flow stress was set in tabular form based on cylindrical specimen compression testing (see Figure 3a). The calculations were performed under the assumption of the axisymmetric stress-strain state in the deformation center and deformation symmetry about the horizontal geometric symmetry axis of the specimen (see Figure 3b). Thus, only a quarter of the specimen cross-section was simulated. The simulation was performed in accordance with experimental conditions of specimen loading, when the punch movement speed V y ( t ) was constant and equal to 1.19 mm/s. It was assumed that the friction between the specimen and the punch followed Coulomb’s friction law and depended on temperature. In the simulation of specimen deformation at a temperature of 300 °C, the Coulomb friction coefficient was set to 0.09, and at temperatures of 400 and 500 °C it was equal to 0.1 and 0.13, respectively.
Indentation experiments were made in a Hysitron TI 950 nanomechanical testing device using a Berkovich indenter. A restriction was set on the movement of the indenter into the specimen. The indenter penetration and lifting rate was 0.5 µm/s, the holding time under load was 0 s. At this loading form, the device was tested on standard calibration samples made of fused quartz and monocrystalline aluminum.
After compressions, the specimens were indented in the zone close to the side surface on the thin sections after mechanical and ion polishing. The plane of the thin section was parallel to the direction of the compression axis, and it passed through the specimen symmetry axis (see Figure 2).
Material density was determined by the hydrostatic method according to ASTM B311-13 by weighing the specimens in air and in distilled water. The weighing was made on an Ohaus Pioneer PA 214 analytical balance. Table 1 shows the densities of the materials, as well as their porosity for the V95\10% SiC metal matrix composite and the V95\0% SiC material. The theoretical density ρ M M C t h of the V95\10% SiC MMC was calculated according to the mixture rule. The porosity P M M C of the V95\10% SiC MMC was calculated by the formula
P M M C = ( 1 ρ M M C e x p ρ M M C t h ) 100 % ,
where ρ M M C e x p is the experimentally determined density of the V95\10% SiC metal matrix composite; ρ M M C t h is the theoretically calculated density of V95\10% SiC.
The porosity P C M of the V95\0% SiC material was calculated by the formula
P C M = ( 1 ρ C M e x p ρ M e x p ) 100 % ,
where ρ C M e x p is the experimentally determined density of the V95\0% SiC material; ρ M e x p is the experimentally determined density of the V95 alloy.

3. Methodology for Measuring Damage in a Metal Matrix Composite and Discussion of Results

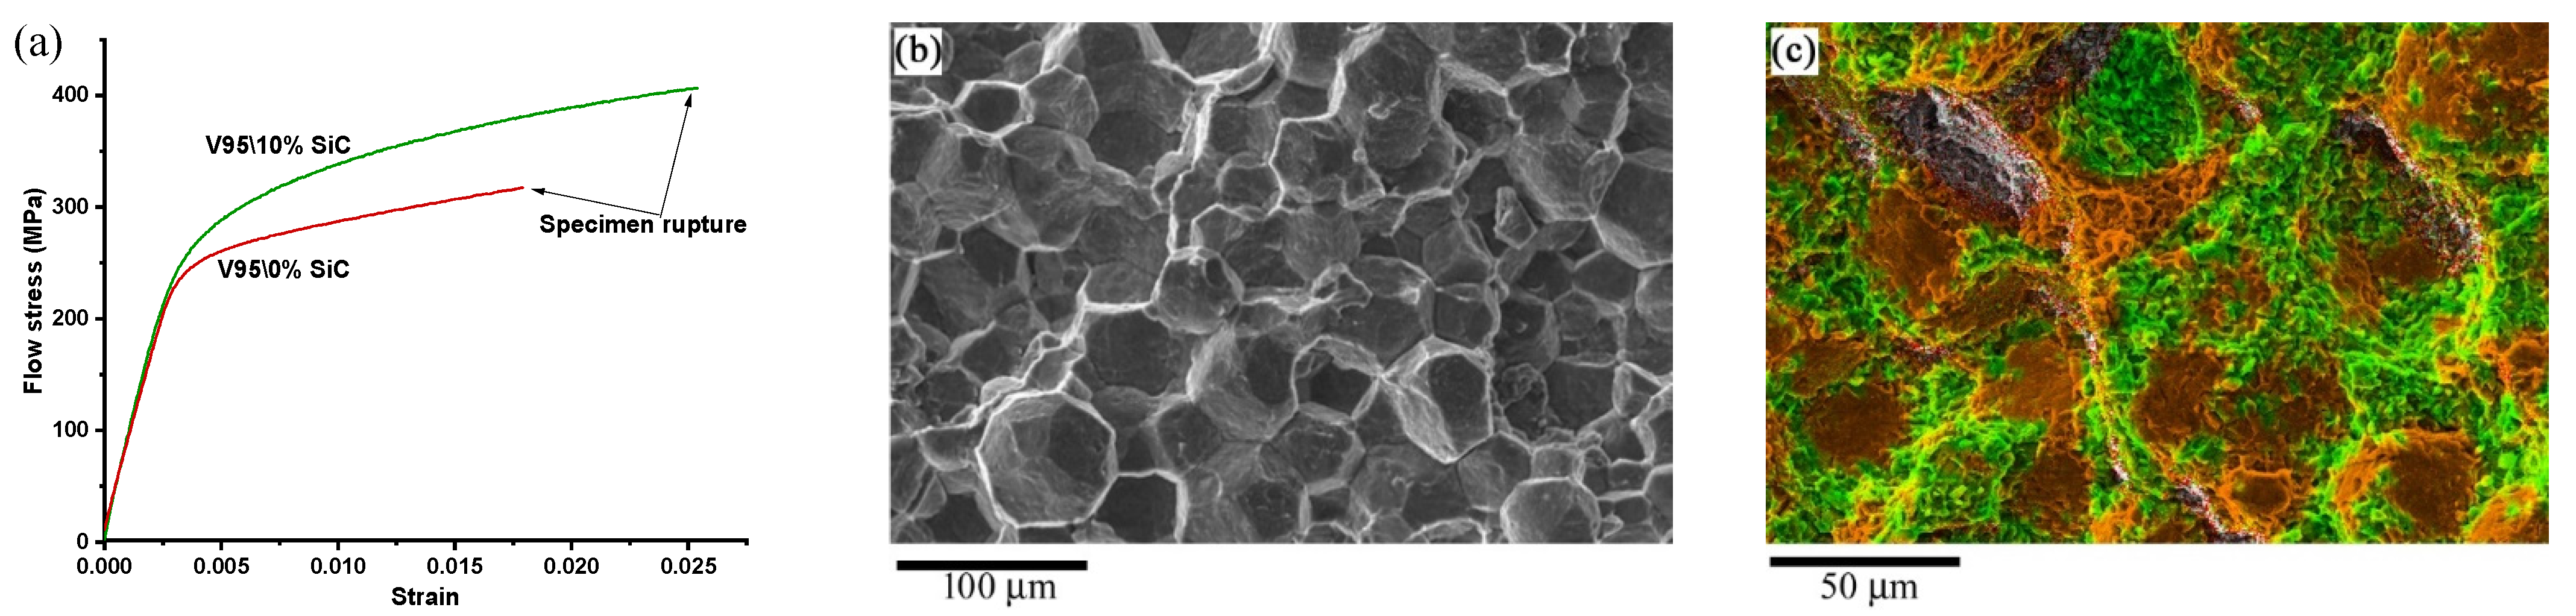
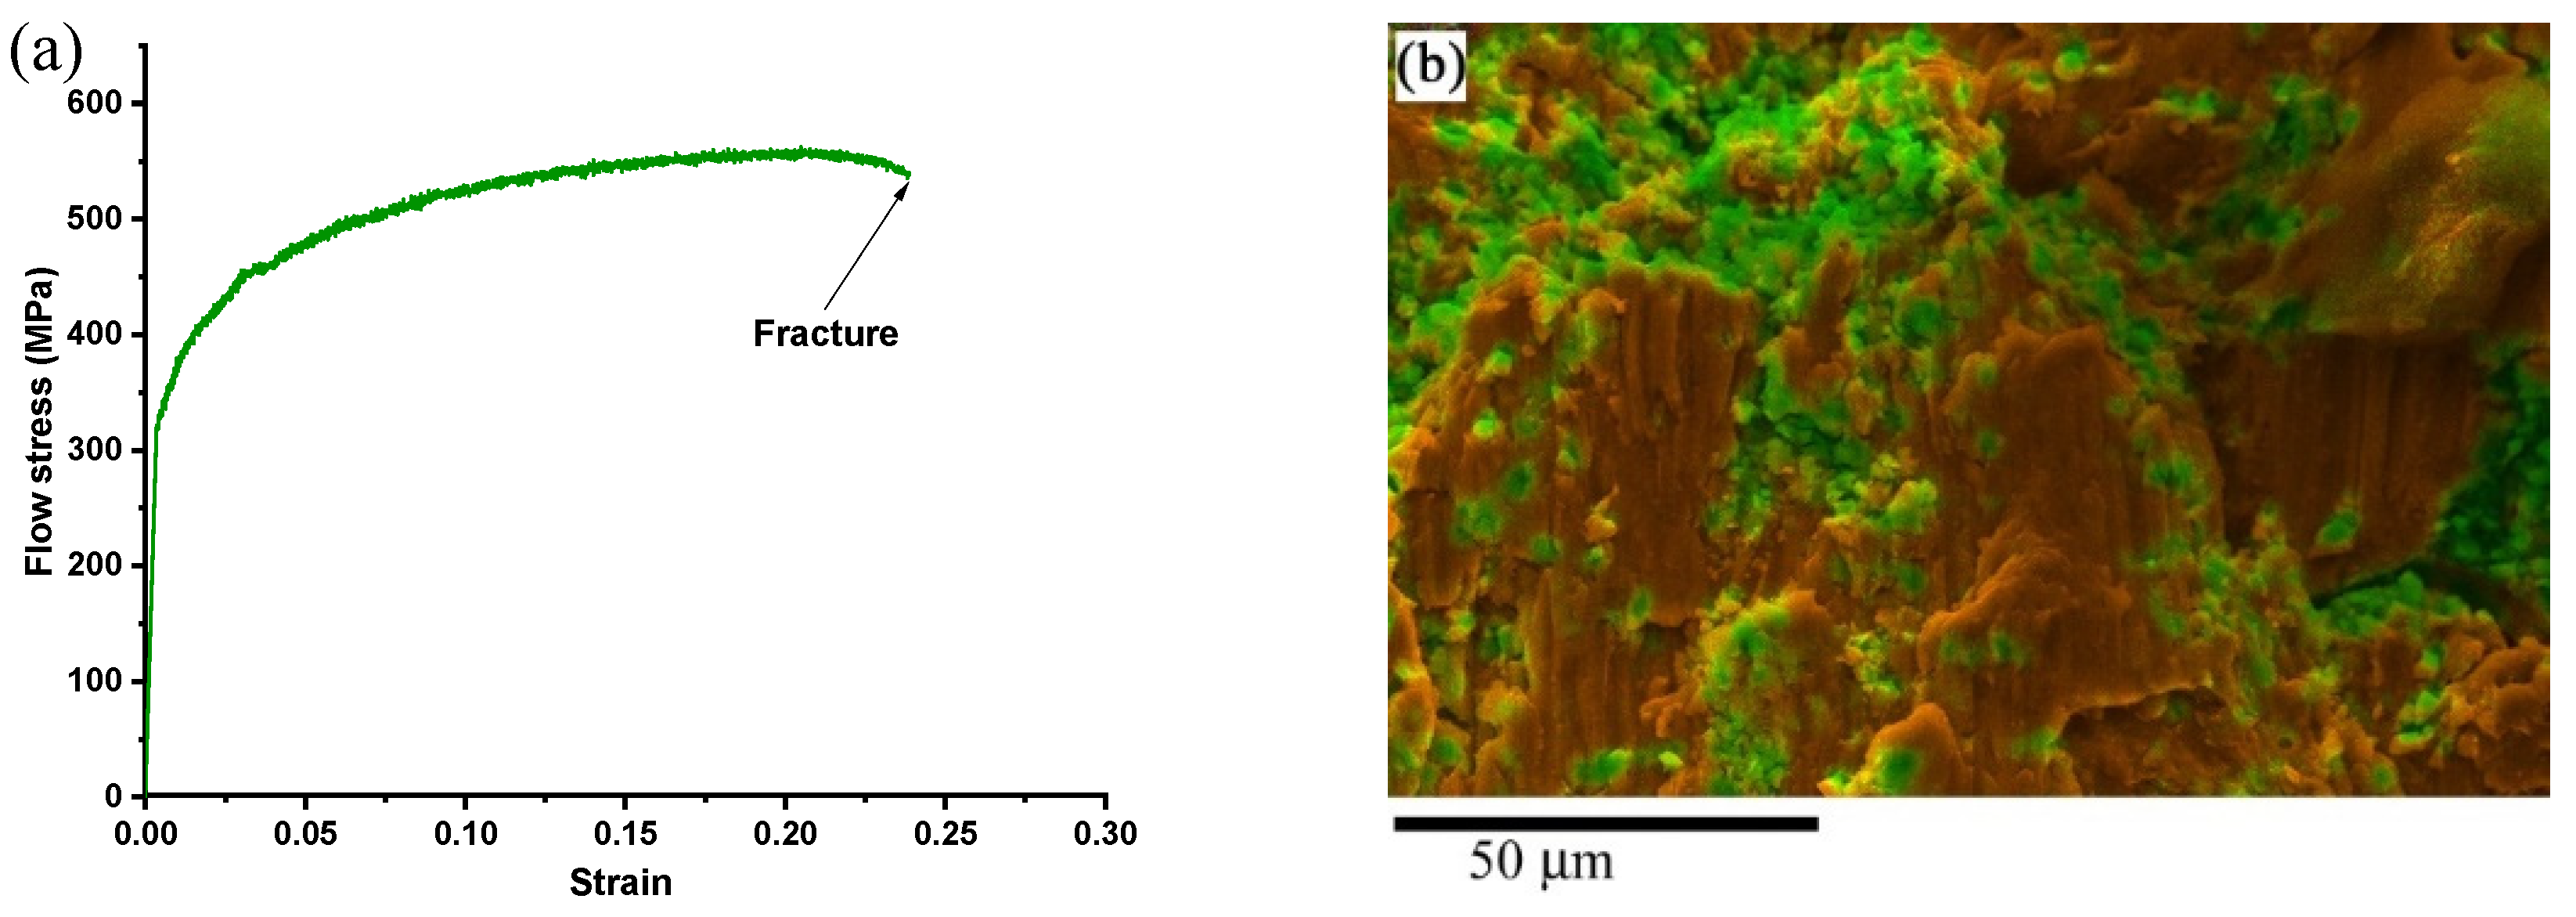
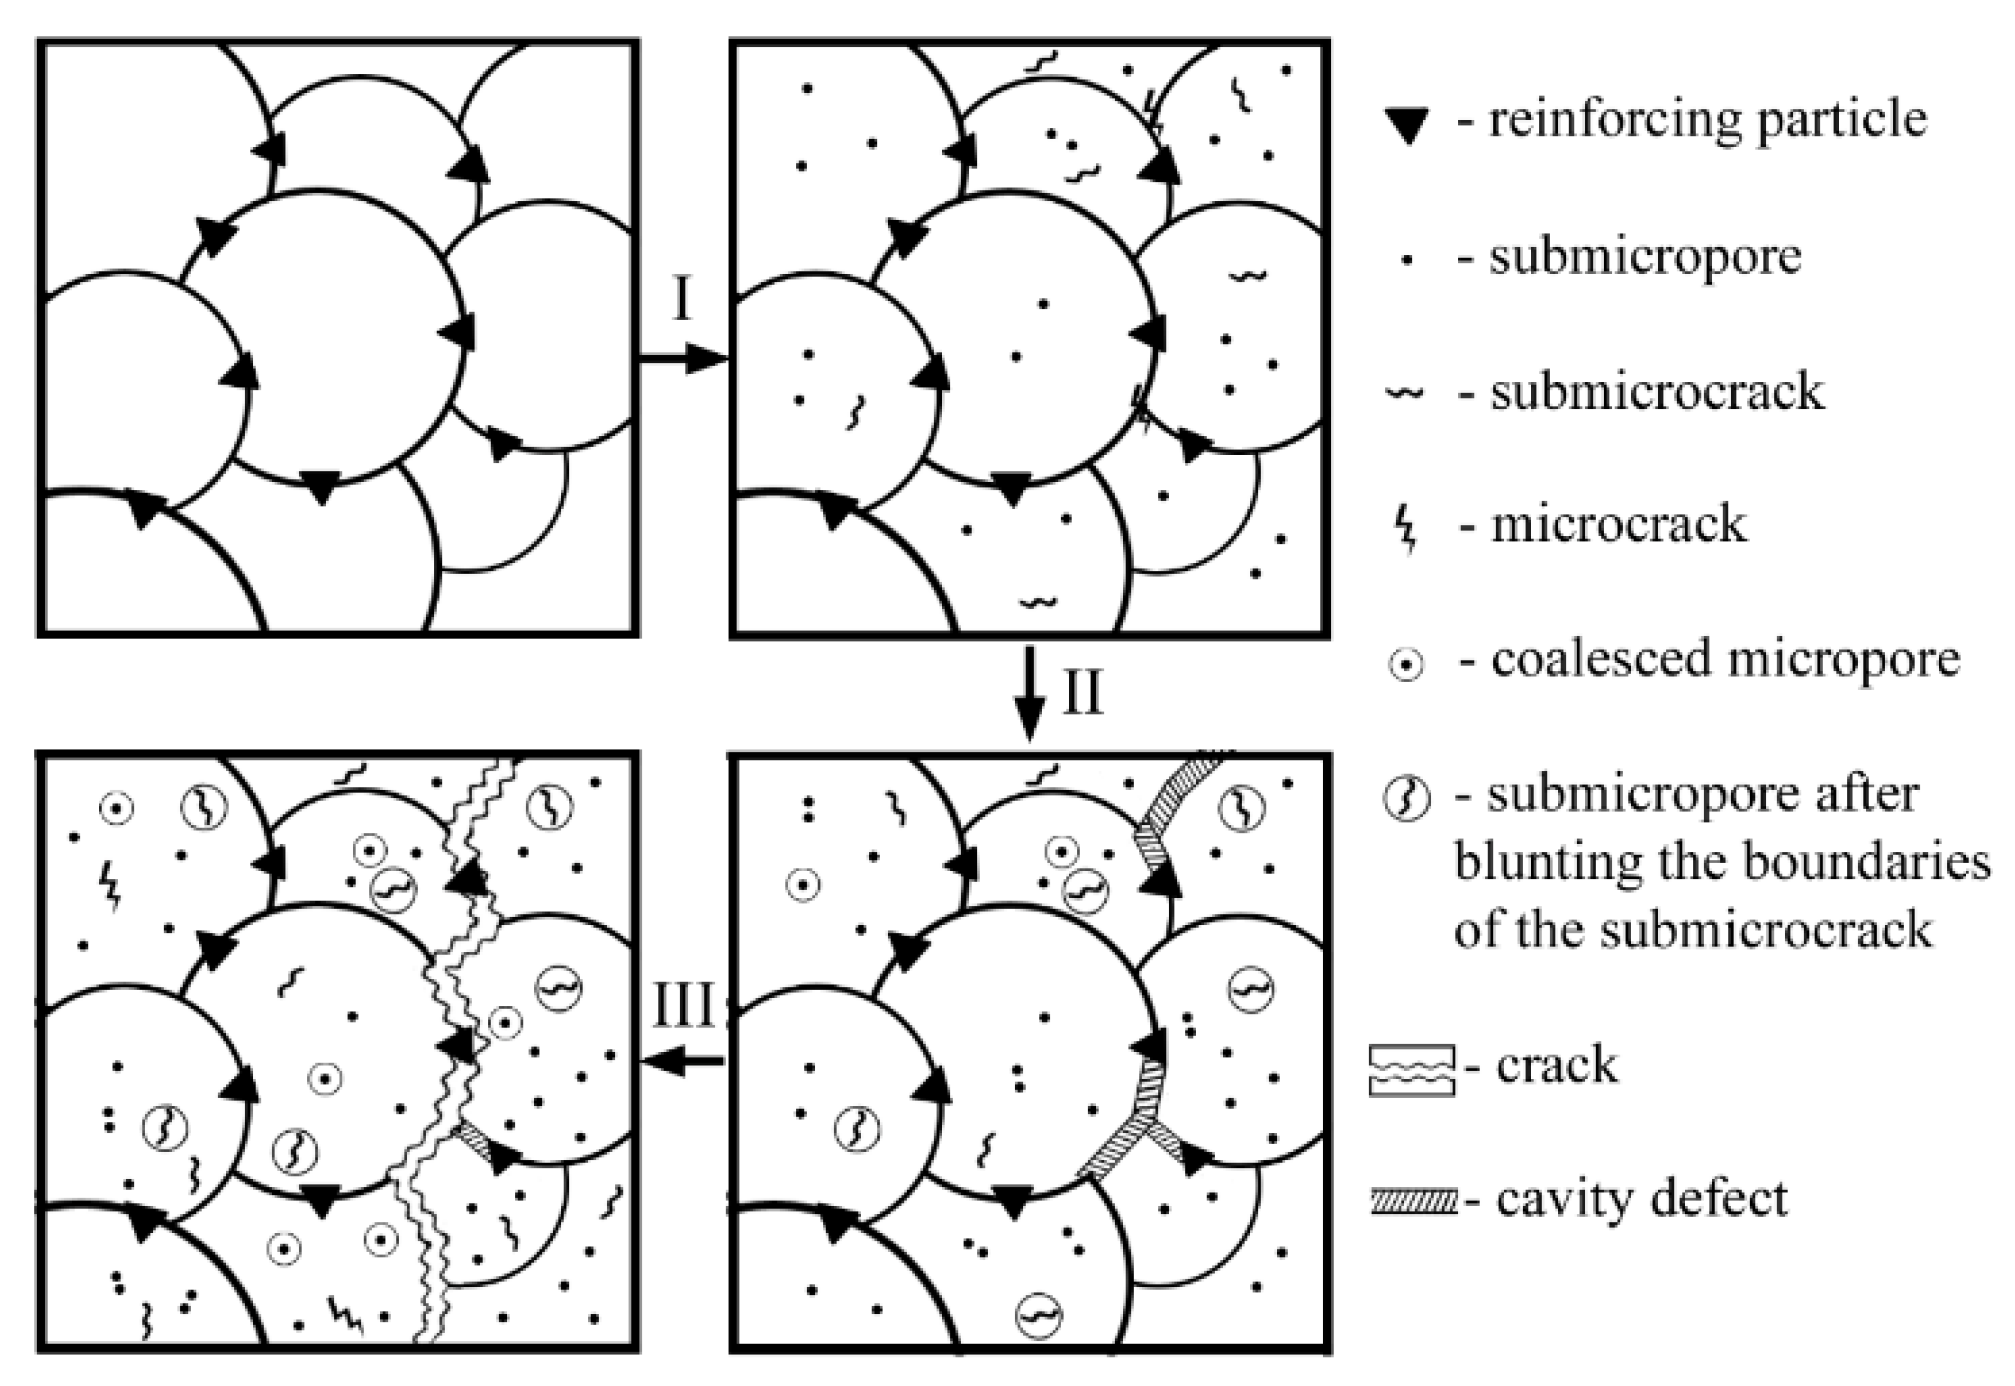
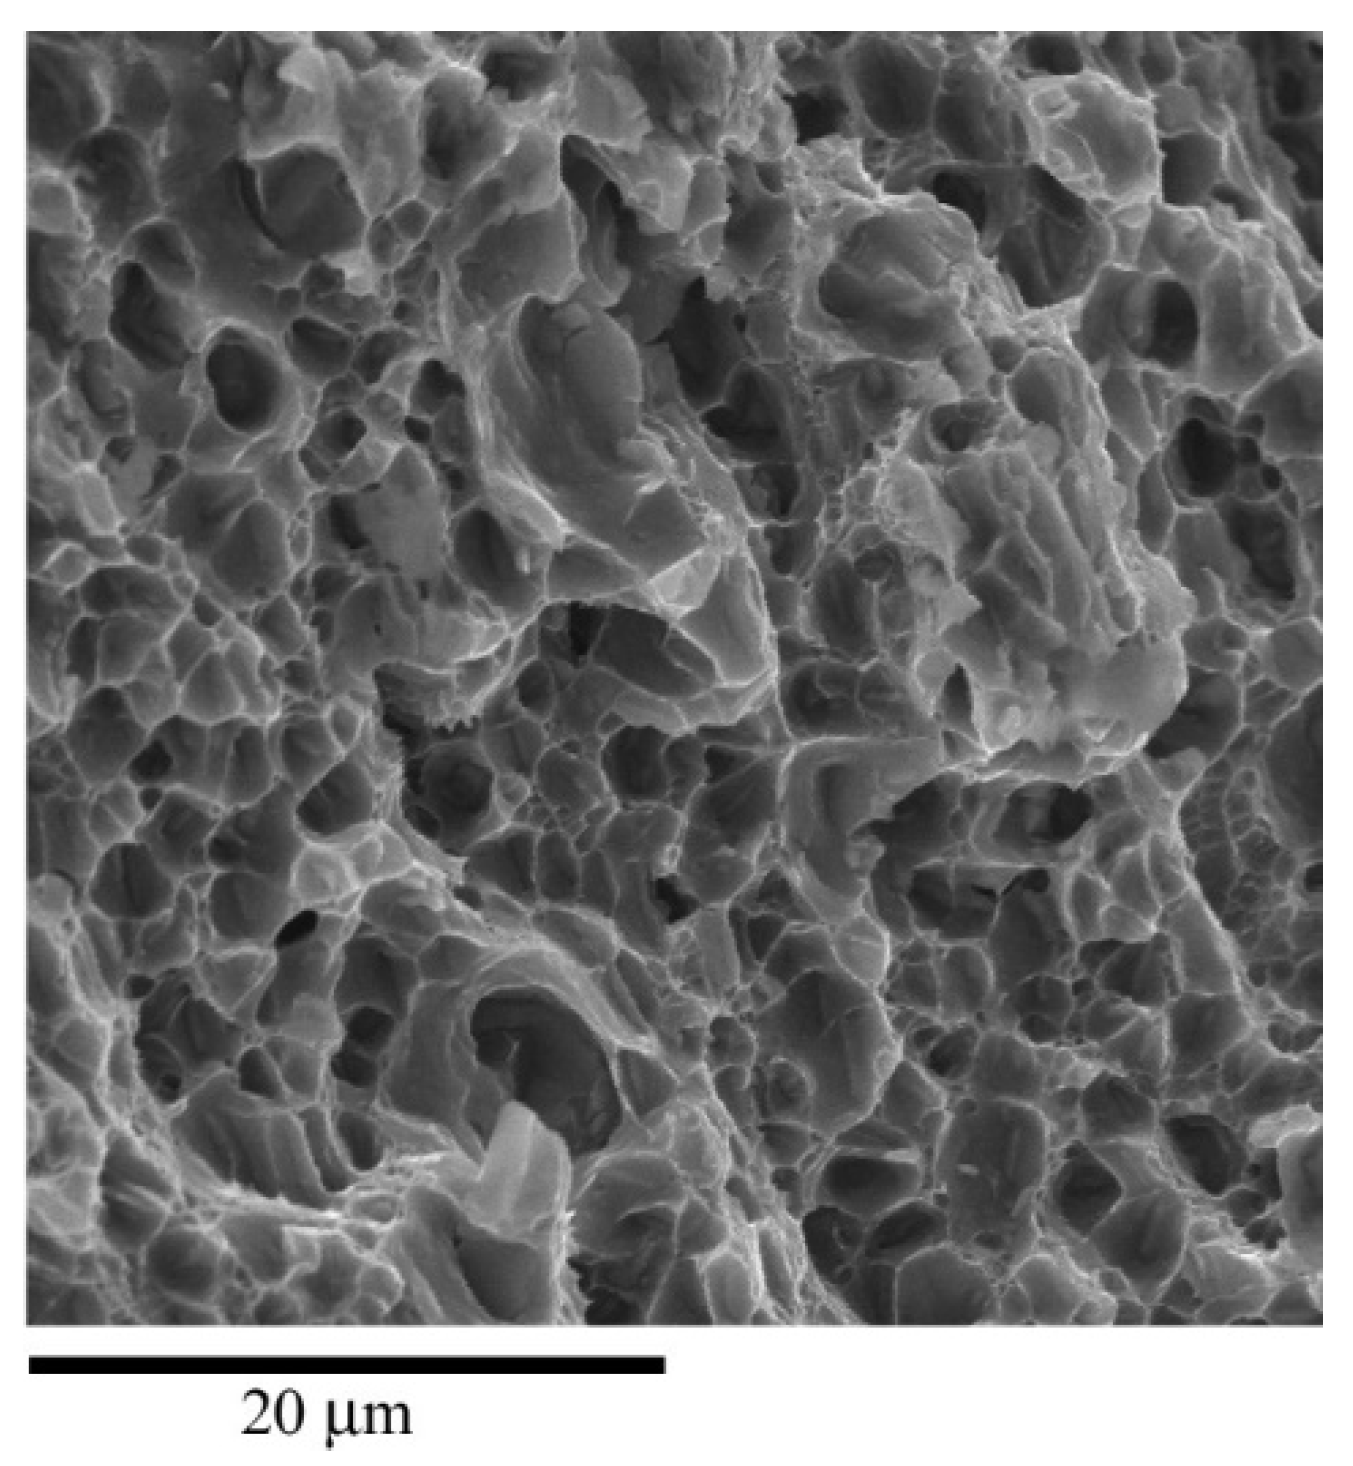
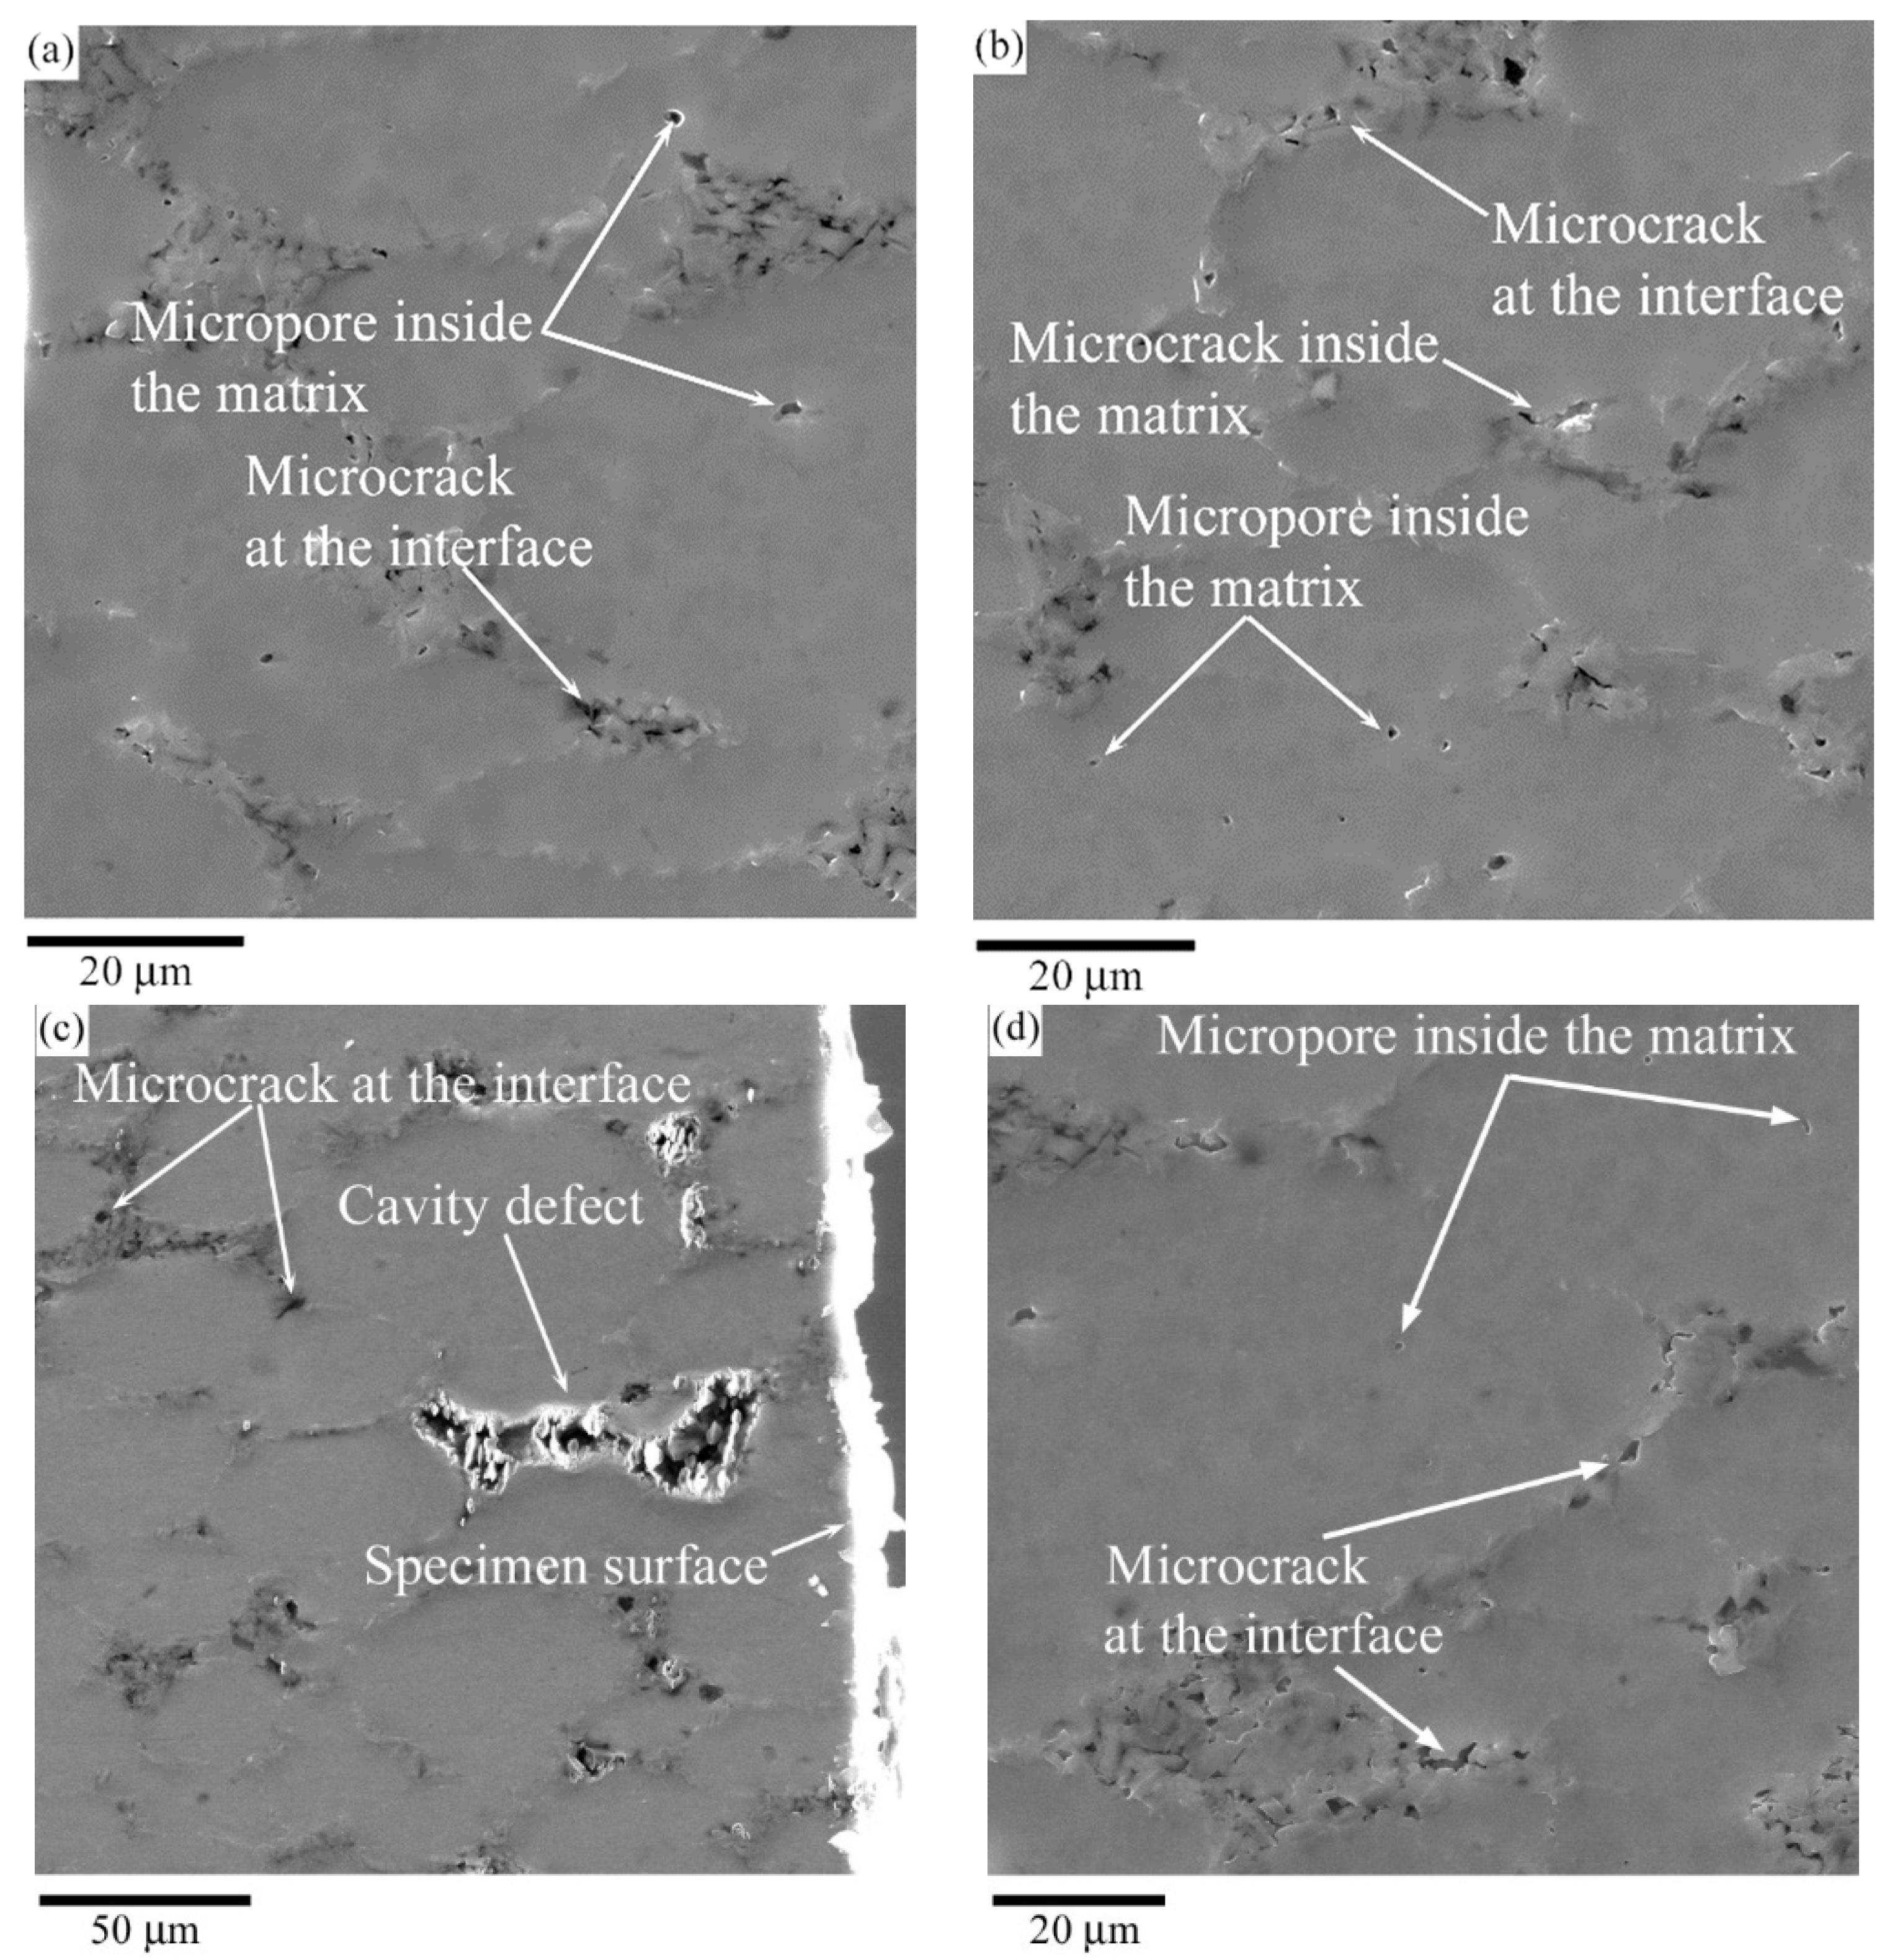
3.1. The Mechanism of Fracture in the Sintered V95\10% SiC Metal Matrix Composite

In order to determine the effect of reinforcing particles on the fracture mechanism in the V95\10% SiC metal matric composite, cylindrical specimens made from the V95\0% SiC material and the V95\10% SiC metal matrix composite were tensile tested at room temperature. The results of the mechanical tests are shown in Figure 4a. The figure shows that the strain to fracture of the composite is higher than that of the sintered material under external tensile stresses at room temperature. The fracture of both materials occurs along the interface boundaries rather than in the material matrix (see Figure 4b,c). A similar fracture of the composite occurs under compressive stresses, this being clearly demonstrated by the composite fracture surface in compression tests of the cylindrical specimens at room temperature (see Figure 5). Figure 4c and Figure 5b show SEM images of the fracture surface with a superimposed maps of the distribution of SiC particles and the composite matrix, which were constructed based on EDS analysis. In these figures, the SiC particles are highlighted in green and the matrix is orange.
The revealed deformation behavior of the metal matrix composite can be explained by the fact that the interface boundaries between the matrix and a reinforcing particle, as well as the interface boundaries among the matrix particles, were the main centers of fracture. The fracture of the composite did not occur in one stage; it resulted from gradual damage accumulation in the material leading to the appearance of macrocracks and subsequent fracture. According to the general ideas of the mechanisms of metallic material fracture [9,33,40], the fracture of the composite under study can be divided into three stages. At the first stage of the fracture of the V95\10% SiC MMC, submicropores and submicrocracks occur both inside the composite matrix and at the particle interface (see Figure 6, stage I). The composite matrix is plastically deformable and fails by ductile fracture (see Figure 7); therefore, in addition to the formation of new submicropores and submicrocracks in the matrix, the submicropores coalesce and previously formed submicrocracks become blunted, thus turning into submicropores. Then, with a significant deformation of the matrix, the submicropores coalesce, with the subsequent appearance of micropores and ductile microcracks. In parallel with increasing damage in the matrix, the stage of isolated development of microcracks occurs at the interfaces (see Figure 6, stage II). At this stage, sharp wedge-shaped microcracks quickly reach a critical value, above which their development requires no increase in external stresses (self-similarity). The growing microcrack runs into a barrier represented by a reinforcing particle or a matrix particle. A microcrack can overcome this barrier only with an increase in external stresses (see Figure 6, stage III); the microcracks coalesce thereafter to form a crack, and this leads to the final fracture of the composite along the interface boundary.

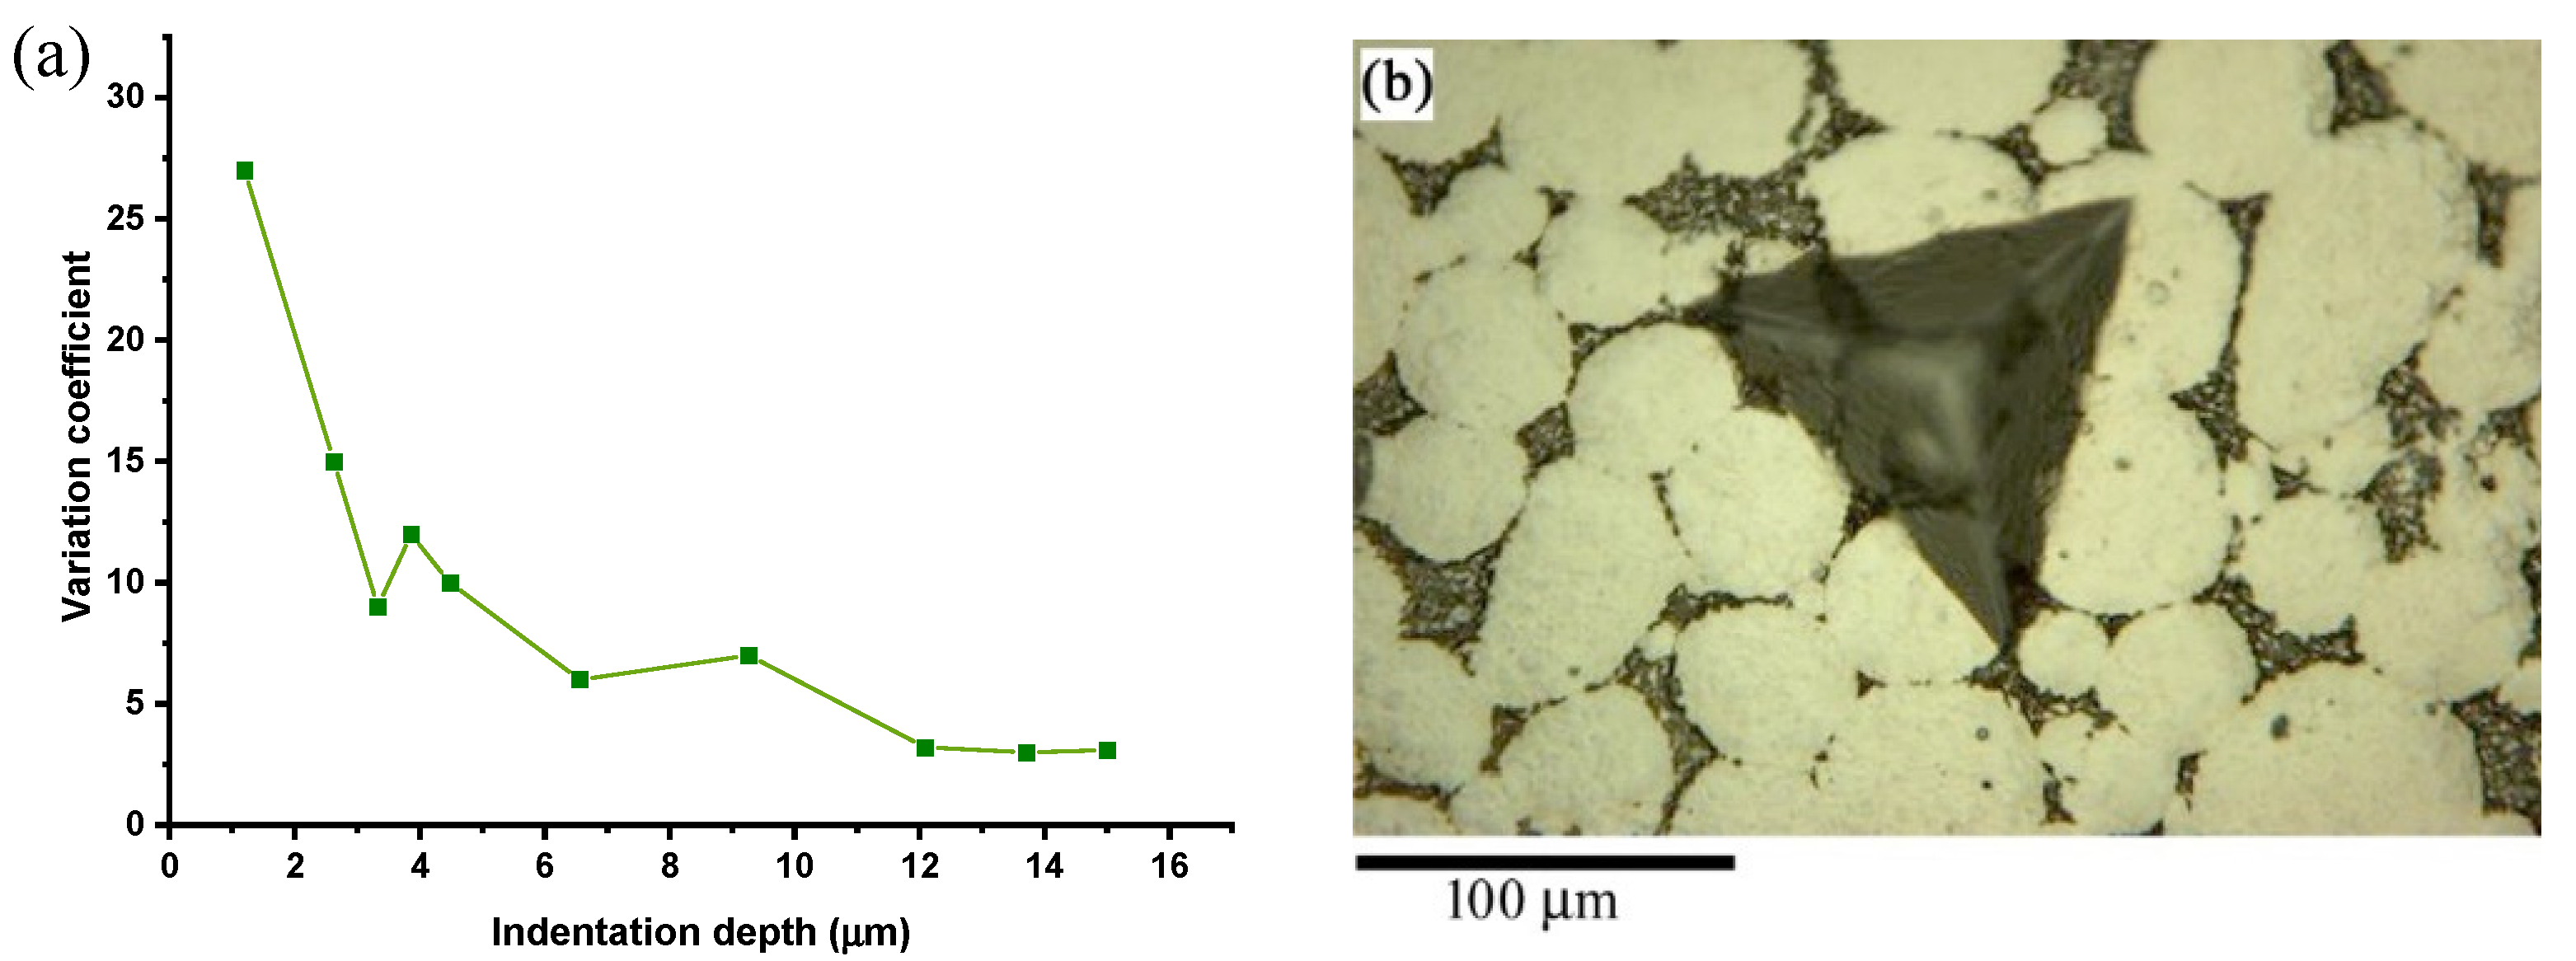
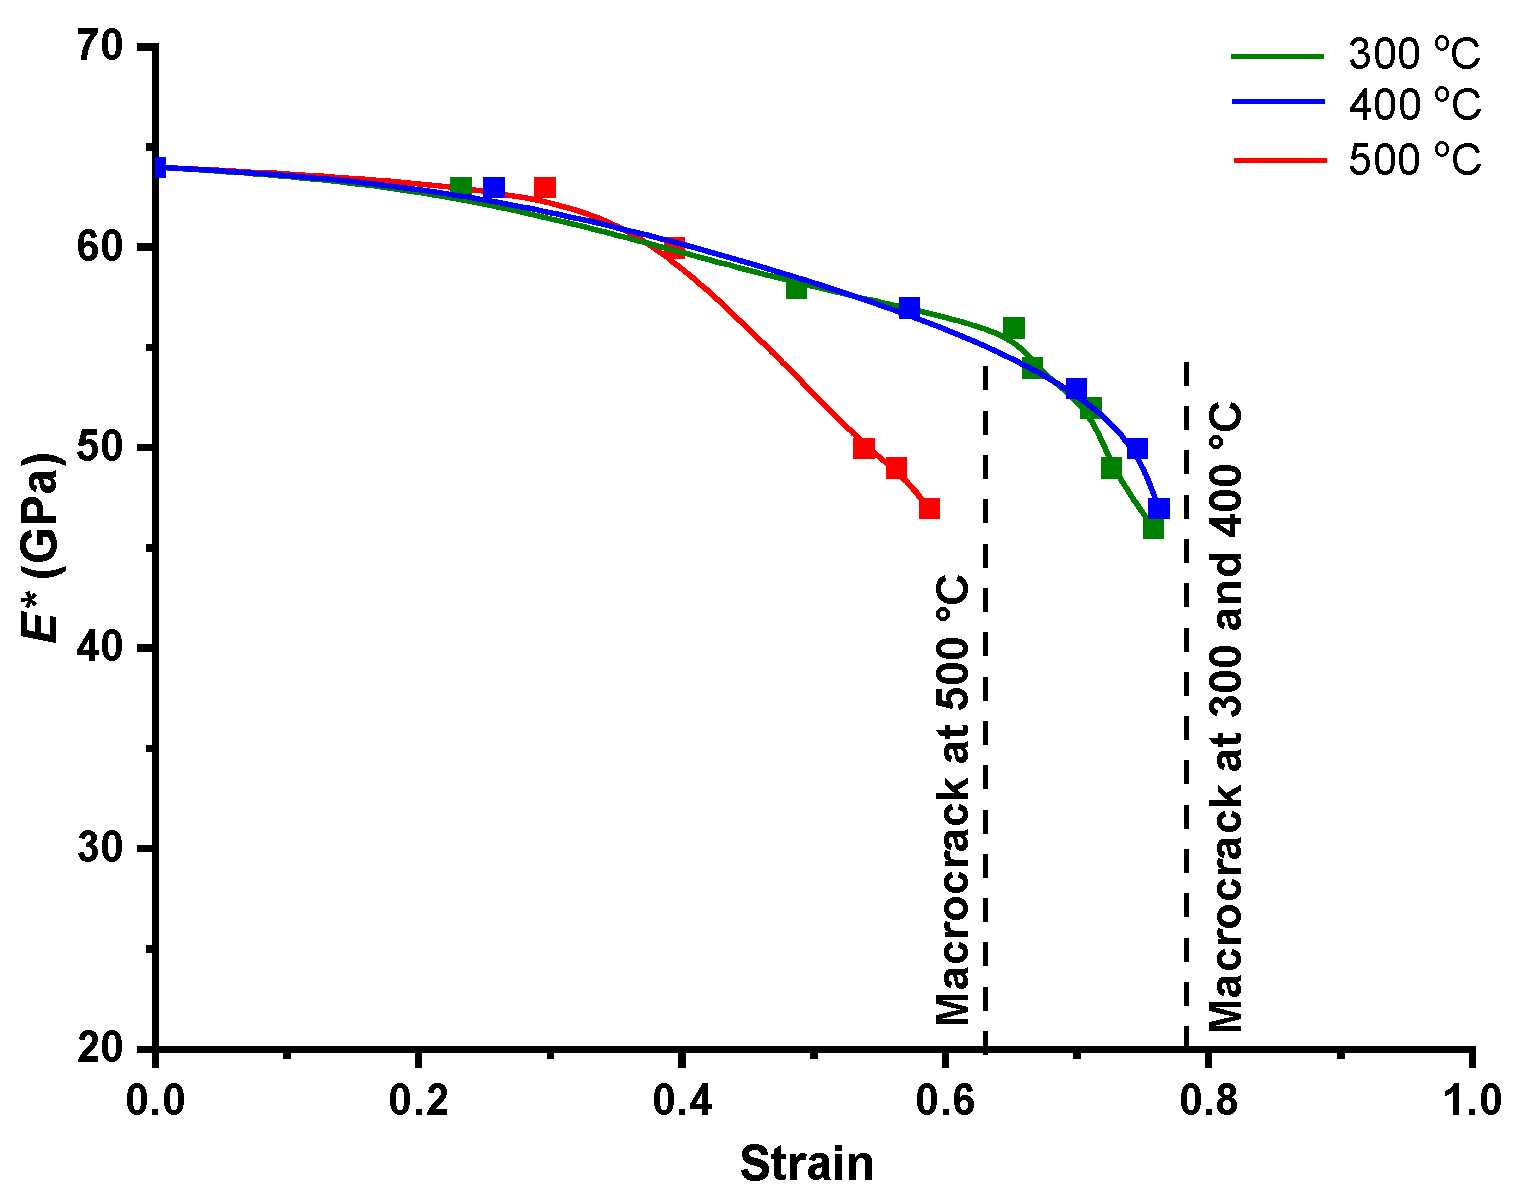
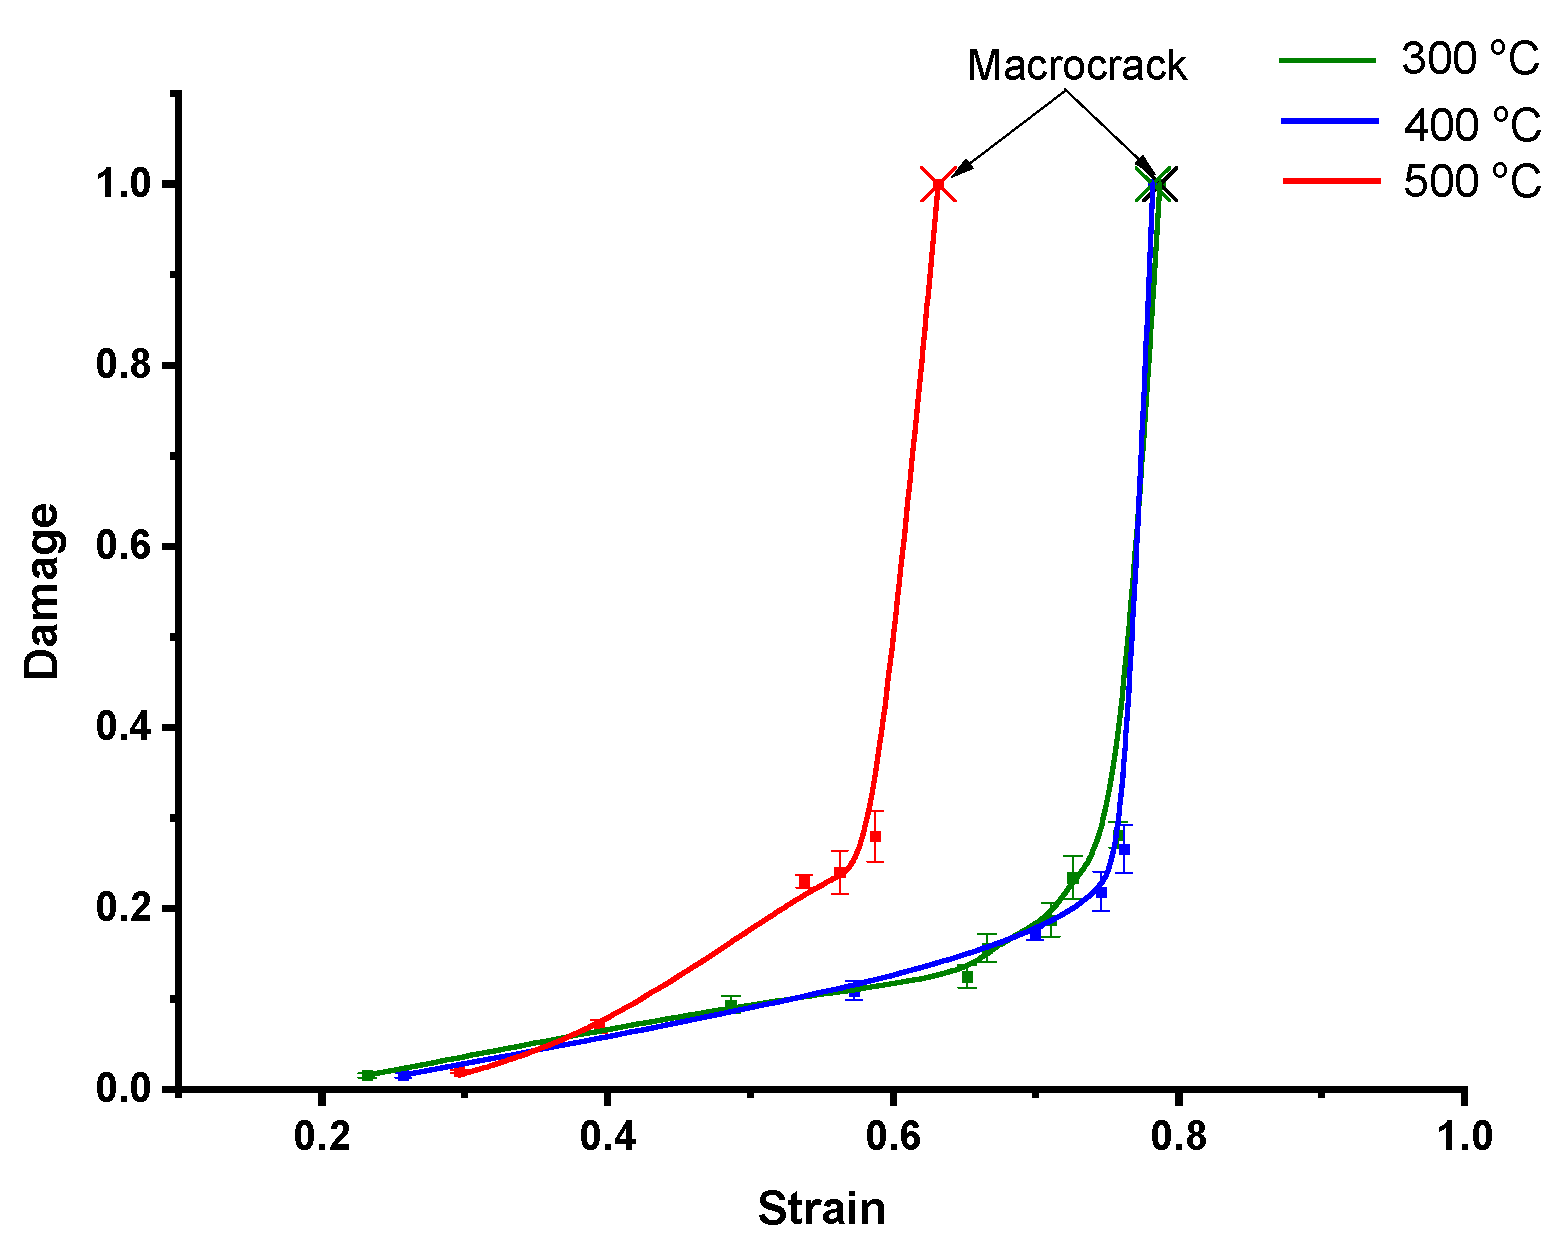
3.2. Damage Measurement Technique

The main non-damage-induced influences on the elastic modulus in metallic materials are texture change, residual stress formation, and phase composition evolution. In order to determine whether an oriented texture was formed in the composite during deformation, EBSD analysis was performed on the V95\10% SiC MMC specimens after deformation at temperatures ranging from 300 to 500 °C. Figure 8 shows images of {100} pole shapes, as well as EBSD images of the specimens before and after deformation in the presence of macrocracks on the side surface. This figure shows that the shape of the grains inside the matrix particles remains close to equiaxed although the matrix particles as wholes stretch along the material flow direction. This behavior of the material matrix is attributable to the active process of dynamic recrystallization, which causes the formation of new grains. In its turn, the dynamic recrystallization process in the matrix is responsible for the absence of a predominant lattice orientation. Thus, we can say that the formed microstructure of the matrix will have no effect on the measured elastic modulus.
Figure 9 shows microcracks formed at the interparticle boundary in the V95\10% SiC MMC before the appearance of macrocracks on the side surface of the specimen due to compressive plastic deformation. The elastic modulus of the material must decrease due to microcracking, and this can be detected via instrumented indentation by pressing a diamond indenter into the material.
When the indenter is pressed into the metal matrix composite, the indentation diagram is affected by both the composite matrix and the reinforcing particles. Under low loads, the indenter penetrates either only into the matrix or only into the reinforcing material, and this causes a large scatter in the indentation diagrams [41,42]. As the load gradually increases, this scatter decreases and reaches a certain threshold value, which is determined by the variation of the macroscopic properties of the specimen and by the measurement error of the device. The correctness of using the technique for determining damage by the indentation technique requires that the volume of the deformed material under the indenter exceed the minimum material volume (representative volume) containing the number of the carriers of the structural phase state sufficient for a statistical description of the material state. Reinforcing particles, matrix phases and interphase boundaries, matrix grains and subgrains, etc. act as such carriers in metal matrix composites. The representative volume during indentation, as well as the determined value of the elastic modulus, depends on the indenter depth. The variation coefficient δ was chosen as a measure of the relative variation of the reduced elasticity modulus, and the penetration depth dependence of the variation coefficient δ was plotted thereafter. Such dependences for the V95\10% SiC MMC are shown in Figure 10a. This figure demonstrates that the detected reduced elastic modulus for the composite remains unchanged at indenter penetration depth exceeding 12 µm. Thus, for the correct determination of the local value of the reduced elastic modulus for the whole composite, not its structural components, the indenter penetration depth must exceed 12 µm. In order to meet this requirement, all further micromechanical tests aimed at the determination of the reduced elastic modulus were performed at an indenter penetration depth of 15 µm. Typical images of indents on the specimens at this penetration depth are shown in Figure 10b.
Figure 11 shows the behavior of the reduced elastic modulus E * on the side surface of the metal matrix composite specimen depending on specimen strain ε at test temperatures of 300, 400 and 500 °C. The strain at each time t is calculated by the formula ε = 2 3 e i j e i j , where e i j denotes strain tensor deviator components determined from the results of the finite element simulation of cylindrical specimen compression (see Section 2). The data in Figure 11 show that the value of E * decreases with increasing strain. For temperatures of 300 and 400 °C, as soon as the strain reaches the value ε = 0.65 , there is a sharp decrease in the reduced elastic modulus E * . At a temperature of 500 °C, this occurs as early as at ε = 0.4 . Figure 9 shows the microstructures of the composite specimens in the region close to the side surface. These microstructures were obtained after compression to the strain ε = 0.76 at temperatures of 300 and 400 °C and ε = 0.59 at a temperature of 500 °C. As seen from this figure, the microstructures of the specimens before fracture are similar to each other. For all the test temperatures, the specimens have plenty of microcracks at the interparticle boundaries and micropores inside the matrix. Further deformation of the specimens leads to the appearance of macrocracks on the side surface at ε = 0.78 for temperatures of 300 and 400 °C. For a temperature of 500 °C, macrocracks appear at ε = 0.63 . Figure 9c shows a cavity defect on the specimen side surface, which may come out to the surface and develop into a macrocrack with further specimen compression.
Material damage D E is here considered to mean a measure that characterizes the degree of strain-induced material defectiveness. At the same time, the value of material damage is equal to 0 prior to deformation. At the time of macrocrack formation, damage takes the value equal to 1. In order to determine the moment of macrocracking, the specimens were deformed to different strains, and the moment of macrocrack appearance was determined iteratively. The presence of a macrocrack was detected by means of an optical microscope with ×20 magnification.
The parameter D E is calculated by the formula found in [7],
D E = 1 E c u r E i n
where E i n is the elastic modulus of the specimen in the initial (undeformed) state; E c u r is the elastic modulus of the specimen before macrocracking, i.e., at a current value of strain ε . The data obtained by the instrumented indentation technique do not allow us to determine the elastic modulus directly. The reduced elastic modulus E * is calculated from the results of instrumented indentation, which is related to the elastic modulus E by the following formula (ISO 14577-1-2002):
E = 1 ( ν s ) 2 1 E * 1 ( ν i ) 2 E i
where ν s is Poisson’s ratio for the test specimen; ν i is Poisson’s ratio for the indenter, which is equal to 0.07 for diamond (ISO 14577-1-2002); E * is the reduced elastic modulus of the test specimen; E i is the elastic modulus of the indenter, which is equal to 1.14 10 6 N/mm2 for diamond (ISO 14577-1-2002). Using the relation between the elastic modulus and the reduced elastic modulus represented by Equation (2) and then substituting it into Equation (1), we obtain the following formula for calculating material damage:
D E = E i ( E i n * E c u r * ) E i n * ( E i + ( E c u r * ν i 2 E c u r * ) )
According to the technique described above, the D E ε dependencies for the V95\10% SiC metal matrix composite deformed at temperatures of 300, 400, and 500 °C were obtained for the zone near the side surface of the specimen (see Figure 12). The last point on each D E ε curve is marked with a cross; it corresponds to the state of the specimen with a macrocrack detected on the side surface, and this corresponds to damage equal to 1.
Figure 12 shows that the beginning of damage accumulation in the composite belongs to the strain range from 0.2 to 0.3 and increases with deformation temperature. The results of damage accumulation indicate that the slowest damage accumulation occurs at 300 °C, that it is more rapid at 400 °C and the most rapid at 500 °C. The history of changes in the stress state is one of the factors affecting damage accumulation. In this paper, the stress state coefficient k and the Lode-Nadai coefficient μ σ are used as the stress state indices. They are calculated by the following formulas:
k = σ T   and   μ σ = 2 σ 22 σ 33 σ 11 σ 33 1 ,
where σ = 1 3 ( σ 11 + σ 22 + σ 33 ) is the average normal stress; T = 0.5 σ i j σ i j is the intensity of tangential stresses; σ i j are the stress deviator components; σ 11 ,   σ 22 ,   σ 33 are principal stresses. The stress state indices are calculated from finite element method computer simulation of specimen compression under conditions of the axisymmetric stress-strain state (see Section 2).
Figure 13a,b show changes in the stress state indices k and μ σ on the side surface of the specimens during testing at three test temperatures. The difference from the values k = 1 3 and μ σ = + 1 , which are typical for uniaxial compression conditions, is caused by the curvature of the side surface of the specimens under compression due to the action of friction forces on the contact surfaces. It is obvious from these figures that, even though the most favorable conditions of the stress state at the time of macrocracking on the lateral surface of the specimen exist at 500 °C, the composite demonstrates significantly lower plasticity at this temperature. At this temperature, the strain to fracture on the side surface of the specimen is the lowest and equal to 0.63, and it is 0.78 for test temperatures of 300 and 400 °C (see Figure 13c). Despite the same accumulated strain to fracture at 300 and 400 °C, the composite was deformed at a temperature of 300 °C under worse stress conditions (see Figure 13). This allows us to assume that the V95\10% SiC metal matrix composite has better plastic properties at 300 °C than at the other two temperatures.
As shown above, the fracture in the composite under study occurs along the interphase boundary. Reinforcing particles and matrix zones with high interparticle contact strength are barriers for the growth of microcracks (see Section 3.1). As the temperature increases, the strength of the interparticle contact in the matrix decreases due to the temperature softening of the V95 alloy. This fact may explain the identical strains of the composite at 300 and 400 °C despite the more rigid stress state at 300 °C. The same reason can explain a significant decrease in plastic properties at 500 °C.

4. Conclusions

1.
A mechanism of damage accumulation in a sintered V95\10% SiC metal matrix composite has been proposed. The mechanism consists of a three-stage accumulation of defects on the interphase boundaries and inside the composite matrix.
2.
The applicability of data on elastic modulus evolution obtained from instrumented microindentation in order to determine damage in sintered metal matrix composites after high-temperature deformation has been exemplified by the V95\10% SiC metal matrix composite. The correctness of using the technique for determining damage by indentation requires that the possible effect of residual stresses and texture be taken into account and that the volume of the deformed material under the indenter exceed the minimum material volume (the representative volume) containing a sufficient number of carriers of the structural phase state for a statistical description of the material state.
3.
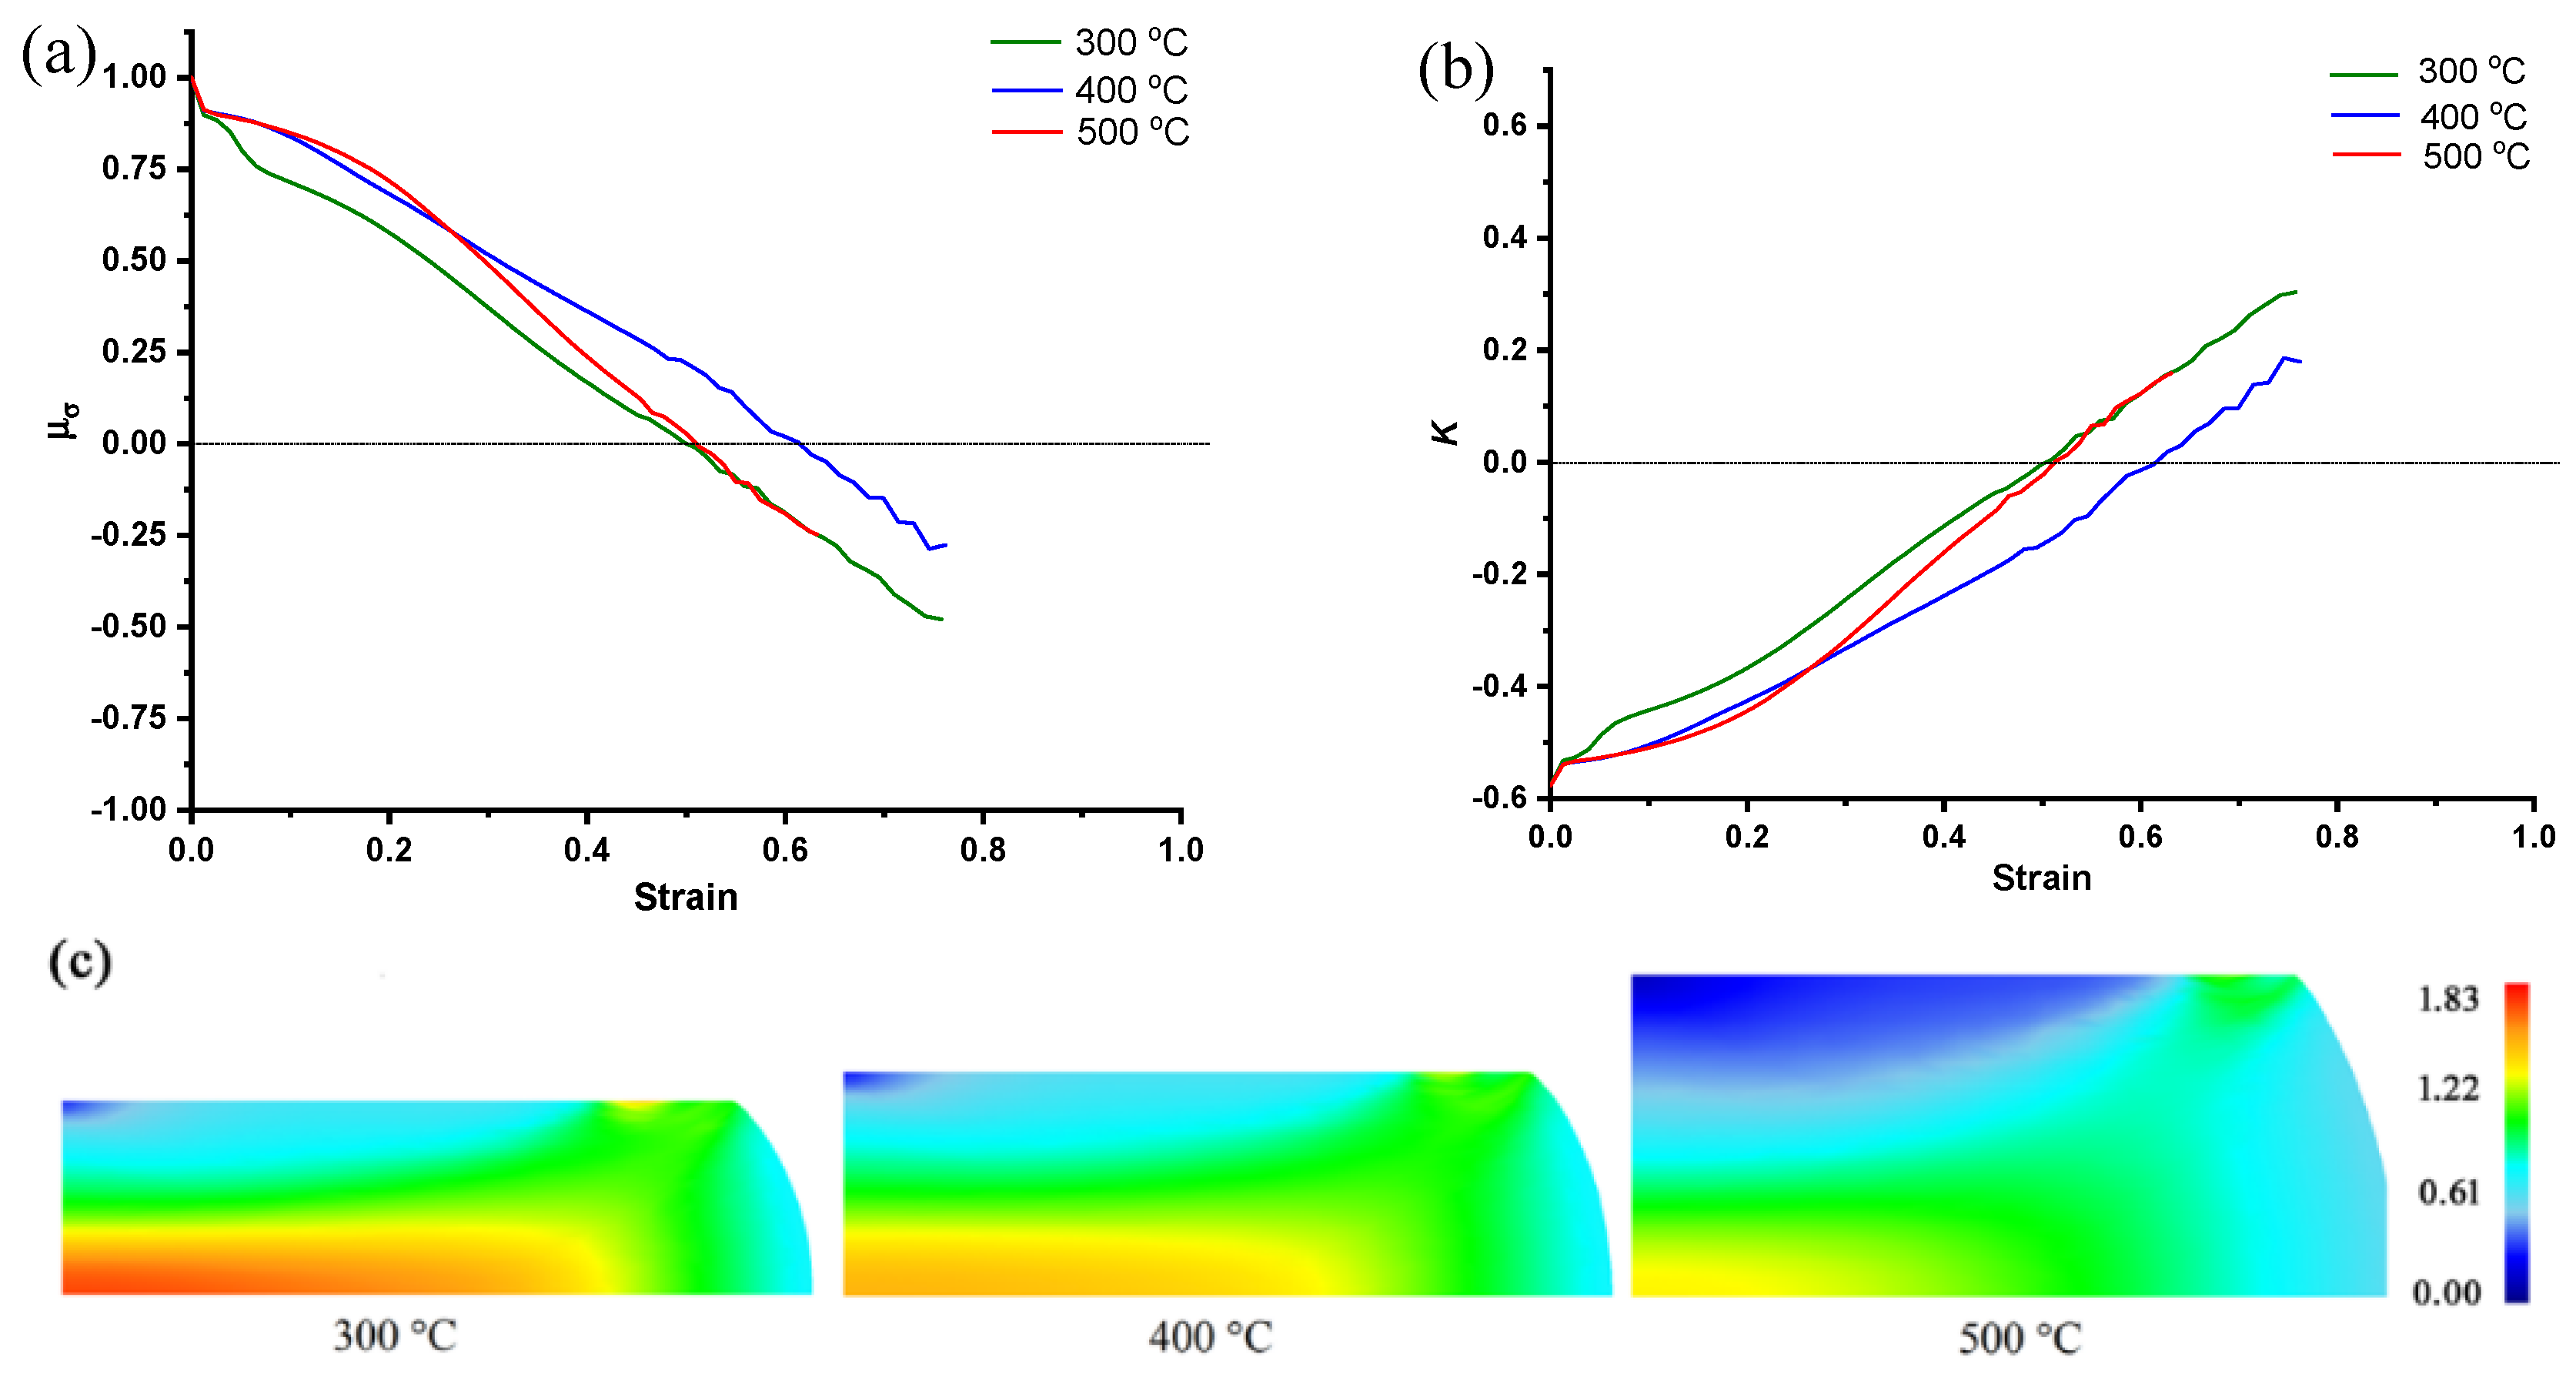
The strain dependences of damage for temperatures ranging from 300 to 500 °C have been obtained for the V95\10% SiC MMC. It has been shown that the best plasticity of the composite under compression conditions at the macro-level is observed at a temperature of 300 °C. At a deformation temperature of 500 °C, the plastic properties significantly decrease from those at 300 and 400 °C.

Author Contributions

Conceptualization, A.S.; Validation, E.S.; Project Administration, A.K.; investigation, A.S., E.S. and V.K. All authors have read and agreed to the published version of the manuscript.

Funding

The study was partially financially supported by the RFBR (project 19-08-00765) in the development of a damage measurement technique for metal matrix composites; the work on studying the rheological properties of the V95\10% SiC MMC was performed within the research conducted by the Institute of Engineering Science, Ural Branch of the Russian Academy of Sciences, project No. AAAA-A18-118020790140-5.

Acknowledgments

The facilities of the Plastometriya shared access center at the IES UB RAS and a shared access center at the B. N. Yeltsin Ural Federal University were used.

Conflicts of Interest

The authors declare no conflict of interest.

References

  1. Tang, B.; Wu, F.; Guo, N.; Liu, J.; Ge, H.; Bruschi, S.; Li, X. Numerical modeling of ductile fracture of hot stamped 22MnB5 boron steel parts in three-point bending. Int. J. Mech. Sci. 2020, 188, 105951. [Google Scholar] [CrossRef]
  2. Modanloo, V.; Alimirzaloo, V.; Elyasi, M. Optimal Design of Stamping Process for Fabrication of Titanium Bipolar Plates Using the Integration of Finite Element and Response Surface Methods. Arab. J. Sci. Eng. 2020, 45, 1097–1107. [Google Scholar] [CrossRef]
  3. Imran, M.; Afzal, M.J.; Buhl, J.; Bambach, M.; Dunlap, A.; Schwedt, A.; Aretz, A.; Wang, S.; Lohmar, J.; Hirt, G. Evaluation of process-induced damage based on dynamic recrystallization during hot caliber rolling. Prod. Eng. 2020, 14, 5–16. [Google Scholar] [CrossRef]
  4. Zhang, K.; Badreddine, H.; Hfaiedh, N.; Saanouni, K.; Liu, J. Enhanced CDM model accounting of stress triaxiality and Lode angle for ductile damage prediction in metal forming. Int. J. Damage Mech. 2021, 30, 260–282. [Google Scholar] [CrossRef]
  5. Smirnov, S.; Vichuzhanin, D.; Nesterenko, A.; Smirnov, A.; Pugacheva, N.; Konovalov, A. A fracture locus for a 50 volume-percent Al/SiC metal matrix composite at high temperature. Int. J. Mater. Form. 2017, 10, 831–843. [Google Scholar] [CrossRef]
  6. Meya, R.; Kusche, C.F.; Löbbe, C.; Al-Samman, T.; Kerzel, S.K.; Tekkaya, A.E. Global and high-resolution damage quantification in dual-phase steel bending samples with varying stress states. Metals 2019, 9, 319. [Google Scholar] [CrossRef] [Green Version]
  7. Schmitt, J.H.; Jalinier, J.M.; Baudelet, B. Analysis of damage and its influence on the plastic properties of copper. J. Mater. Sci. 1981, 16, 95–101. [Google Scholar] [CrossRef]
  8. Lemaitre, J.; Dufailly, J. Damage measurements. Eng. Fract. Mech. 1987, 28, 643–661. [Google Scholar] [CrossRef]
  9. Smirnov, S.V. Accumulation and healing of damage during plastic metal forming: Simulation and experiment. Key Eng. Mater. 2013, 528, 61–69. [Google Scholar] [CrossRef]
  10. Alves, M. Measurement of ductile material damage. Mech. Struct. Mach. 2001, 29, 451–476. [Google Scholar] [CrossRef]
  11. Tasan, C.C.; Hoefnagels, J.P.M.; Geers, M.G.D. A brittle-fracture methodology for three-dimensional visualization of ductile deformation micromechanisms. Scr. Mater. 2009, 61, 20–23. [Google Scholar] [CrossRef]
  12. Hild, F.; Bouterf, A.; Roux, S. Damage measurements via DIC. Int. J. Fract. 2015, 191, 77–105. [Google Scholar] [CrossRef]
  13. Tasan, C.C.; Hoefnagels, J.P.M.; Geers, M.G.D. A critical assessment of indentation-based ductile damage quantification. Acta Mater. 2009, 57, 4957–4966. [Google Scholar] [CrossRef]
  14. Mkaddem, A.; Gassara, F.; Hambli, R. A new procedure using the microhardness technique for sheet material damage characterisation. J. Mater. Process. Technol. 2006, 178, 111–118. [Google Scholar] [CrossRef]
  15. Saijun, Z.; Chi, Z.; Qinxiang, X.; Songmao, C. Measurement of full-field ductile damage based on resistance Method. Procedia Eng. 2014, 81, 1055–1060. [Google Scholar] [CrossRef] [Green Version]
  16. Harizi, W.; Anjoul, J.; Acosta Santamaría, V.A.; Aboura, Z.; Briand, V. Mechanical behavior of carbon-reinforced thermoplastic sandwich composites with several core types during three-point bending tests. Compos. Struct. 2021, 262, 113590. [Google Scholar] [CrossRef]
  17. Kumar, J.; Sundara Raman, S.G.; Kumar, V. Analysis and Modeling of Thermal Signatures for Fatigue Damage Characterization in Ti–6Al–4V Titanium Alloy. J. Nondestruct. Eval. 2016, 35, 1–10. [Google Scholar] [CrossRef]
  18. Sharkeev, Y.P.; Vavilov, V.P.; Skripnyak, V.A.; Klimenov, V.A.; Belyavskaya, O.A.; Nesteruk, D.A.; Kozulin, A.A.; Tolmachev, A.I. Evolution of the temperature field during deformation and fracture of specimens of coarse-grained and ultrafine-grained titanium. Russ. J. Nondestruct. Test. 2011, 47, 701–706. [Google Scholar] [CrossRef]
  19. Fedorova, A.Y.; Bannikov, M.V.; Plekhov, O.A. A study of the stored energy in titanium under deformation and failure using infrared data. Frat. ed Integrita Strutt. 2013, 24, 81–88. [Google Scholar] [CrossRef] [Green Version]
  20. Tasan, C.C.; Hoefnagels, J.P.M.; Geers, M.G.D. Identification of the continuum damage parameter: An experimental challenge in modeling damage evolution. Acta Mater. 2012, 60, 3581–3589. [Google Scholar] [CrossRef] [Green Version]
  21. Xu, Z.H.; Li, X. Effect of sample tilt on nanoindentation behaviour of materials. Philos. Mag. 2007, 87, 2299–2312. [Google Scholar] [CrossRef]
  22. Kim, H.S.; Bush, M.B. Effects of grain size and porosity on the elastic modulus of nanocrystalline materials. Nanostruct. Mater. 1999, 11, 361–367. [Google Scholar] [CrossRef]
  23. Shen, T.D.; Koch, C.C.; Tsui, T.Y.; Pharr, G.M. On the elastic moduli of nanocrystalline Fe, Cu, Ni, and Cu-Ni alloys prepared by mechanical milling/alloying. J. Mater. Res. 1995, 10, 2892–2896. [Google Scholar] [CrossRef]
  24. Tasan, C.C.; Hoefnagels, J.P.M.; Geers, M.G.D. Indentation-based damage quantification revisited. Scr. Mater. 2010, 63, 316–319. [Google Scholar] [CrossRef]
  25. Zapara, M.A.; Tutyshkin, N.D.; Müller, W.H.; Wille, R. Experimental study and modeling of damage of Al alloys using tensor theory. Contin. Mech. Thermodyn. 2010, 22, 99–120. [Google Scholar] [CrossRef]
  26. Degtyarev, M.V.; Chashchukhina, T.I.; Voronova, L.M. Grain growth in dynamically recrystallized copper during annealing above and below the temperature of thermally activated nucleation. Diagn. Resour. Mech. Mater. Struct. 2016, 5, 15–29. [Google Scholar] [CrossRef]
  27. Chaudhuri, A.; Sarkar, A.; Kapoor, R.; Chakravartty, J.K.; Ray, R.K.; Suwas, S. Understanding the Mechanism of Dynamic Recrystallization During High-Temperature Deformation in Nb-1Zr-0.1C Alloy. J. Mater. Eng. Perform. 2019, 28, 448–462. [Google Scholar] [CrossRef]
  28. Gourdet, S.; Montheillet, F. An experimental study of the recrystallization mechanism during hot deformation of aluminium. Mater. Sci. Eng. A 2000, 283, 274–288. [Google Scholar] [CrossRef]
  29. Rollett, A.D.; Rohrer, G.S.; Humphreys, F.J. Recrystallization and Related Annealing Phenomena; Elsevier: Oxford, UK, 2004; ISBN 9780080982359. [Google Scholar]
  30. Zamani, M.; Seifeddine, S.; Jarfors, A.E.W. High temperature tensile deformation behavior and failure mechanisms of an Al-Si-Cu-Mg cast alloy—The microstructural scale effect. Mater. Des. 2015, 86, 361–370. [Google Scholar] [CrossRef] [Green Version]
  31. Bannikov, M.; Bilalov, D.; Oborin, V.; Naimark, O. Damage evolution in the AlMg6 alloy during high and very high cycle fatigue. Frat. Integrita Strut. 2019, 13, 383–395. [Google Scholar] [CrossRef]
  32. Zhang, K.; Badreddine, H.; Yue, Z.; Hfaiedh, N.; Saanouni, K.; Liu, J. Failure prediction of magnesium alloys based on improved CDM model. Int. J. Solids Struct. 2021, 217–218, 155–177. [Google Scholar] [CrossRef]
  33. Saanouni, K.; Devalan, P. Damage Mechanics in Metal Forming: Advanced Modeling and Numerical Simulation; John Wiley & Sons Inc.: London, UK, 2012; ISBN 9781118562192. [Google Scholar]
  34. Karamyshev, A.P.; Nekrasov, I.I.; Nesterenko, A.V.; Parshin, V.S.; Smirnov, S.V.; Fedulov, A.A.; Shveikin, V.P. Studying the damage of ingots under plastic deformation on a lever-type radial forging machine. AIP Conf. Proc. 2016, 1785, 030010. [Google Scholar]
  35. Versteylen, C.D.; Sluiter, M.H.F.; van Dijk, N.H. Modelling the formation and self-healing of creep damage in iron-based alloys. J. Mater. Sci. 2018, 53, 14758–14773. [Google Scholar] [CrossRef] [Green Version]
  36. Junaedi, H.; Ibrahim, M.F.; Ammar, H.R.; Samuel, A.M.; Soliman, M.S.; Almajid, A.A.; Samuel, F.H. Effect of testing temperature on the strength and fracture behavior of Al-B4C composites. J. Compos. Mater. 2016, 50, 2871–2880. [Google Scholar] [CrossRef]
  37. Kurşun, A.; Bayraktar, E.; Enginsoy, H.M. Experimental and numerical study of alumina reinforced aluminum matrix composites: Processing, microstructural aspects and properties. Compos. Part B Eng. 2016, 90, 302–314. [Google Scholar] [CrossRef]
  38. Wang, H.; Zhang, H.; Cui, Z.; Chen, Z.; Chen, D.; Wang, H. Investigation on the high-temperature ductility and fracture mechanisms of an in-situ particle reinforced Al matrix composite 7075Al/TiB2. Mater. Sci. Eng. A 2019, 764, 138263. [Google Scholar] [CrossRef]
  39. Weck, A.; Wilkinson, D.S.; Maire, E. Observation of void nucleation, growth and coalescence in a model metal matrix composite using X-ray tomography. Mater. Sci. Eng. A 2008, 488, 435–445. [Google Scholar] [CrossRef]
  40. Tekkaya, A.E.; Bouchard, P.O.; Bruschi, S.; Tasan, C.C. Damage in metal forming. CIRP Ann. 2020, 69, 600–623. [Google Scholar] [CrossRef]
  41. Smirnov, A.S.; Shveikin, V.P.; Smirnova, E.O.; Belozerov, G.A.; Konovalov, A.V.; Vichuzhanin, D.I.; Muizemnek, O.Y. Effect of silicon carbide particles on the mechanical and plastic properties of the AlMg6/10% SiC metal matrix composite. J. Compos. Mater. 2018, 52, 3351–3363. [Google Scholar] [CrossRef]
  42. Konovalov, D.A.; Veretennikova, I.A.; Bykova, T.M.; Michurov, N.S. Development of an Approach to Determining the Representative Volume Element of the Al/SiC Metal Matrix Composite Material Fabricated by Squeeze Casting. Russ. Metall. 2020, 2020, 738–745. [Google Scholar] [CrossRef]
Figure 1. An SEM image of the microstructure of the V95\10% SiC metal matrix composite (a); An EBSD image of V95\10% SiC (b) and V95\0% SiC sintered powder (c).
Applsci 11 10590 g001
Figure 2. The longitudinal section of the cylindrical specimen after compression: orange—the indentation zone.
Applsci 11 10590 g002
Figure 3. The dependences of flow stresses on strain (a) for 300 °C (green curve), 400 °C (blue curve), 500 °C (red curve) and strain rates ranging between 0.1 and 10 s−1, as well as the finite element grid used for the simulations (b).
Applsci 11 10590 g003
Figure 4. The strain dependence of flow stress under tension at room temperature (a); the fracture surface after the tension of the V95\0% SiC sintered material (b) and the V95\10% SiC metal matrix composite (c): orange—the matrix; green—SiC particles.
Applsci 11 10590 g004
Figure 5. The strain dependence of flow stress under compression (a) and the fracture surface of the compressed V95\10% SiC metal matrix composite at room temperature (b): orange—the matrix; green—SiC particles.
Applsci 11 10590 g005
Figure 6. Schematic damage accumulation in the sintered metal matrix composite during plastic deformation.
Applsci 11 10590 g006
Figure 7. The fracture surface of the V95 alloy after specimen tension at room temperature.
Applsci 11 10590 g007
Figure 8. The initial state (a), the state after deformation at 300 (b), 400 (c), and 500 °C (d) for the V95\10% SiC metal matrix composite.
Applsci 11 10590 g008
Figure 9. The microstructure near the side surface of the sintered V95/10% SiC MMC specimen after compression at temperatures of 300 °C and D E = 0.28 (a), 400 °C and D E = 0.27 (b), 500 °C and D E = 0.28 (c,d). The images were obtained from a longitudinal thin section with a plane passing through the symmetry axis of the specimen (see Figure 2).
Applsci 11 10590 g009
Figure 10. The penetration depth dependence of the variation coefficient δ for the V95\10% SiC MMC (a) and a typical image of an indent on the specimens (b) at an indenter penetration depth of 15 µm.
Applsci 11 10590 g010
Figure 11. The strain ( ε ) dependence of the reduced elastic modulus E* for the V95\10% SiC MMC specimen at 300, 400 and 500 °C, the dependence being valid for the zone near the side surface of the specimen (see Figure 2).
Applsci 11 10590 g011
Figure 12. The strain ( ε ) dependence of accumulated damage D E for the V95\10% SiC MMC in the zone near the side surface at 300, 400, and 500 °C (see Figure 2).
Applsci 11 10590 g012
Figure 13. The strain ( ε ) dependence of the stress state indices μ σ (a) and k (b) in the zone near the side surface of the specimen (see Figure 2) for a temperature range of 300 to 500 °C; the accumulated strain field. ε (c) at the time of macrocracking on the side surface of the V95\10% SiC MMC specimens at temperatures ranging from 300 to 500 °C.
Applsci 11 10590 g013
Table 1. The density and porosity of the materials.
MaterialDensity, g/cm3Porosity, %
ExperimentalCalculated
V95\10% SiC2.852.860.30
V95\0% SiC2.81-0.12
V95 alloy2.82--
Publisher’s Note: MDPI stays neutral with regard to jurisdictional claims in published maps and institutional affiliations.

