Article

The Effect of Collagen-I Coatings of 3D Printed PCL Scaffolds for Bone Replacement on Three Different Cell Types

1
G.E.R.N. Center of Tissue Replacement, Regeneration & Neogenesis, Department of Orthopedics and Trauma Surgery, Medical Center—Albert-Ludwigs-University of Freiburg, Faculty of Medicine, Albert-Ludwigs-University of Freiburg, Hugstetter Straße 55, 79106 Freiburg, Germany
2
Institute for Applied Biomechanics, Offenburg University, Badstraße 24, 77652 Offenburg, Germany
*
Author to whom correspondence should be addressed.
Submission received: 9 November 2021 / Revised: 16 November 2021 / Accepted: 18 November 2021 / Published: 22 November 2021

Abstract

:
Introduction The use of scaffolds in tissue engineering is becoming increasingly important as solutions need to be found to preserve human tissues such as bone or cartilage. Various factors, including cells, biomaterials, cell and tissue culture conditions, play a crucial role in tissue engineering. The in vivo environment of the cells exerts complex stimuli on the cells, thereby directly influencing cell behavior, including proliferation and differentiation. Therefore, to create suitable replacement or regeneration procedures for human tissues, the conditions of the cells’ natural environment should be well mimicked. Therefore, current research is trying to develop 3-dimensional scaffolds (scaffolds) that can elicit appropriate cellular responses and thus help the body regenerate or replace tissues. In this work, scaffolds were printed from the biomaterial polycaprolactone (PCL) on a 3D bioplotter. Biocompatibility testing was used to determine whether the printed scaffolds were suitable for use in tissue engineering. Material and Methods An Envisiontec 3D bioplotter was used to fabricate the scaffolds. For better cell-scaffold interaction, the printed polycaprolactone scaffolds were coated with type-I collagen. Three different cell types were then cultured on the scaffolds and various tests were used to investigate the biocompatibility of the scaffolds. Results Reproducible scaffolds could be printed from polycaprolactone. In addition, a coating process with collagen was developed, which significantly improved the cell-scaffold interaction. Biocompatibility tests showed that the PCL-collagen scaffolds are suitable for use with cells. The cells adhered to the surface of the scaffolds and as a result extensive cell growth was observed on the scaffolds. The inner part of the scaffolds, however, remained largely uninhabited. In the cytotoxicity studies, it was found that toxicity below 20% was present in some experimental runs. The determination of the compressive strength by means of the universal testing machine Z005 by ZWICK according to DIN EN ISO 604 of the scaffolds resulted in a value of 68.49 ± 0.47 MPa.

1. Introduction

Due to demographic change, the average age of the population will continue to rise. According to the Federal Statistical Office of Germany, demographic change in Germany is becoming increasingly acute. Every second person in Germany today is over the age of 45 and every fifth person over the age of 66 [1]. The inhabitants of the EU are also not younger, here one of five inhabitants is older than 65 years [2]. Coupled with this, the number of cases of bone diseases and defects, such as osteoporosis, will also increase [3]. In 2019 alone, 239,204 arthroplasties were implanted in the hip and 190,427 in the knee [4]. According to a Eurostat study for 2019, Switzerland, Austria, Belgium, and Finland are at the same high level with 275 to 300 hip replacements per 100,000 inhabitants as Germany with 311 [5]. Open reductions of multiple fragment fractures of long tubular bones in the joint region with subsequent osteosynthesis also represent a large proportion of total operations (225,974 operations; 16,974,415; as of 2019 in Germany) [4]. The mentioned methods for the treatment of bone defects, however, have some weaknesses. In the case of implants in the knee and hip area, the phenomenon of stress shielding occurs again and again. It describes that due to a too high modulus of elasticity of the implant, the load that is normally distributed to the bone is now mostly transferred to the implant and the bone loses density due to lack of load. This greatly compromises the long-term stability of the implants [6]. Another disadvantage exists with the previous osteosynthesis material. Metal implants are often used in surgeries to fix fractures. Since these do not degrade on their own, they are removed in another operation. In 2018, the number of such cases was 176,768 [4]. This is one of the main reasons why interest in biodegradable replacements for metal implants continues to grow [7]. Another treatment method for bone defects is autogenous bone grafting. In this procedure, bone is harvested from a healthy part of the patient’s own body and placed in the defective site. This treatment has been the gold standard for bone replacement for many years. In addition, there is the option of an allogeneic bone graft in which the tissue is transplanted from one person to another [8,9]. While these treatments have been revolutionary and life-saving, complications can come with both allogeneic and autogenous bone grafting. Autogenous graft harvesting is expensive, painful, limited by anatomic constraints, and associated with donor site morbidity due to infection and hematoma. Similarly, allogeneic bone grafts have serious limitations because access to sufficient tissue is problematic for affected patients and there is a risk of rejection by the immune system. In addition, there is a possibility here of transmitting infection or disease from the donor to the patient [10]. A solution to these problems may lie in tissue engineering and 3D printing. Langer and Vacanti define tissue engineering as follows: “Tissue engineering is an interdisciplinary field of research that applies the principles of engineering and the life science toward the development of biological substitutes that restore, maintain, or improve tissue function” [11]. Scaffolds are used in tissue engineering. These are three-dimensional constructs with defined properties (e.g., porosity, mechanical strength, degradation behavior). Three-dimensional printing has become an important tool in the field of tissue engineering. The ability to print scaffolds of biomaterials with controllable properties, such as internal structure, porosity, and interconnectivity (all pores are interconnected), makes three-dimensional printing so superior to conventional techniques [12,13]. For example, custom constructs can be made to fit the exact needs of the patient and their injury [12,14]. The scaffolds provide a matrix for the cells to build new tissue [15]. In addition, the interconnectivity of the pores provides nutrient and metabolic waste transport. Therefore, the scaffolds have a suitable surface that is ideal for cell attachment, cell growth, and cell differentiation [8]. Thus, tissue engineering does not focus on the complete replacement of defective tissue, but rather on the regeneration of damaged tissue [10]. The scaffolds can either be implanted directly into the defect or the desired patient-specific cells are harvested by biopsy and cultured on the scaffold before being used [16]. The difficulty in creating such scaffolds is to provide the cells with an extracellular matrix in which they can proliferate and carry out their normal metabolic activity. Only in this way can new tissue be established in the scaffolds [17]. In addition, the mechanical properties of the scaffold should be similar to those of the recipient tissue so that the stress-shielding factor is as low as possible [18]. These biological and mechanical properties can be significantly influenced by means of a suitable scaffold geometry. The pore size plays the most important role [19]. The minimum pore size is about 100 µm due to cell size and transport and migration requirements [20]. Numerous studies have shown that the pore size should be between 100 µm and 300 µm to allow good cell-penetration, -migration and -growth properties [19]. Regarding the mechanical properties, there is still no clear consensus in the scientific community. Our aim was to investigate the influence of collagen-I coating on 3D printed PCL scaffolds on the growth of three different cell types: MG-63; MLO-Y4 and MSC. The geometries of the scaffolds were kept constant with strand widths of 200 µm and strand spacing of 250 µm. Because PCL scaffolds are very difficult to populate with cells and because the final constructs are to be used for bone regeneration, our scaffolds have been coated with collagen-I (a major component of bone).

2. Materials and Methods

2.1. Materials

PCL Mn 45,000 g/Mol, PBS, EDC (N-Ethyl-N′-(3dimethylaminopropyl) carbodiimide hydrochloride) and Triton X-100 were purchased by Sigma-Aldrich (now Merck, Darmstadt, Germany). Trypsin—EDTA, DMEM-F12, DMEM-12 phenol red free, Penicillin/Streptomycin, α-MEM Medium and Newborn Calf Serum were purchased by GIBCO (Amarillo, TX, USA). The Live/Dead Cell Staining Kit (Calcein, Ethidium dimer III) was purchased by PromoKine (Thermofisher Scientific, Waltham, MA, USA). Ethanol and GIEMSA solution were purchased from Merck (Darmstadt, Germany). Collagen-I (rat) was purchased from Corning (New York, NY, USA). The osteoblast-like cell line MG-63 (ATCC CRL 1427) and the osteoclast-like cell line MLO-Y4 (EKC 002) were used for all cell culture experiments. Additional MSC from human bone marrow were used (ethics vote FREEZE of the ethics commission of Freiburg University Medical Center). The primary antibody: anti-collagen I (ab6308) was purchased from abcam (Cambridge, UK) and the secondary antibody: goat anti-Mouse IgG Alexa Flour 488 was purchased from ThermoFisher Scientific (Waltham, MA, USA). LowCross Buffer was purchased from CANDOR (CANDOR Bioscience GmbH, Wangen, Germany).

2.2. Methods

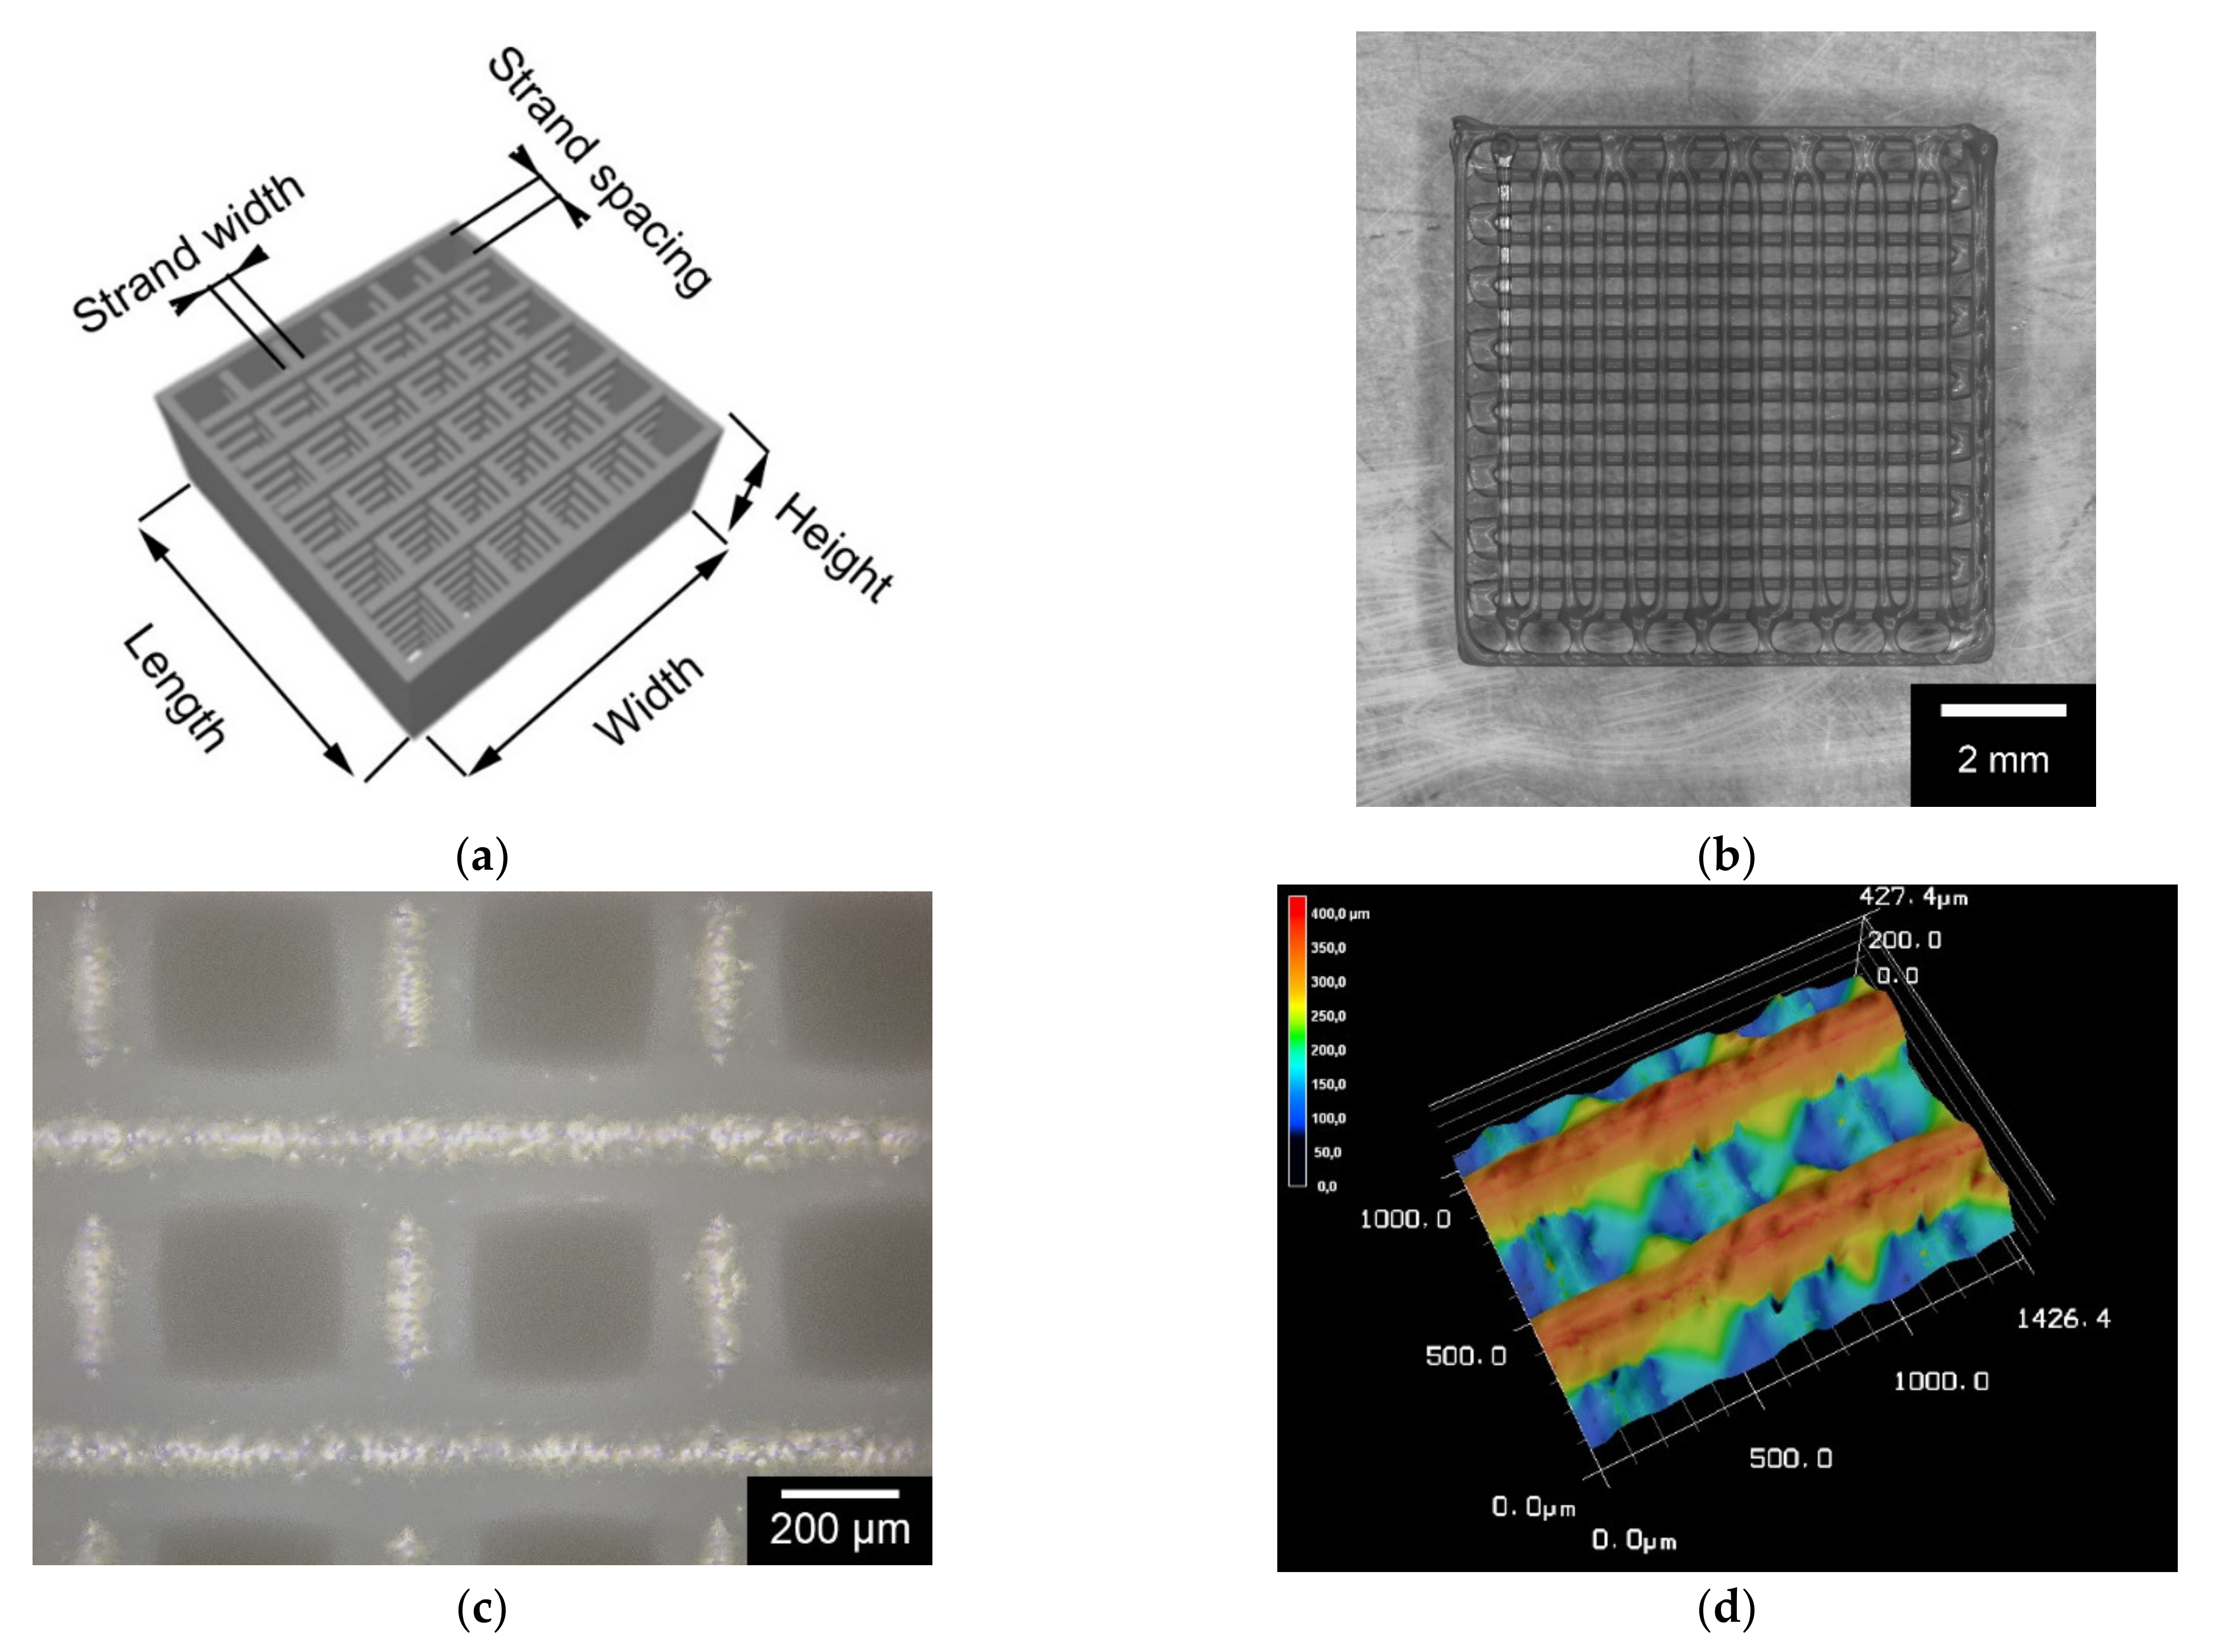
2.2.1. Manufacturing of the PCL Scaffolds

The PCL scaffolds were manufactured using a 3D bioplotter (ENVISIONTEC GmbH, Gladbeck, Germany). The manufacturing principle is based on the melt extrusion process. The PCL (Mn 45,000 g/mol) was heated to 80 °C in the printer cartridge and extruded at a pressure of 4.0 bar and a speed of 1 mm/s through a 24 g needle (inner diameter 550 µm). The extruded material was deposited in a polystyrene Petri dish. To ensure that the printed strands of the first layer had the optimum strand geometry, the platform under the Petri dish was kept at a constant 18 °C. For a uniform strand geometry, the parameters needle offset (Noff) and preflow or postflow were determined. The needle offset indicates the distance between the printer needle and the Petri dish during the first layer. The homogeneity of the first layer determines how evenly the overlying layers are printed. The preflow or postflow parameter determines how long the material is extruded before or after the ribbon is deposited. All printing parameters influence each other. The optimal parameters for the scaffolds in this work are summarized in Table 1. It was printed dynamically, with the resulting strand diameter smaller than the inner diameter of the needle used. The scaffolds should have a strand diameter of 250 µm and the strand spacing should also be 250 µm. A total of 12 layers were printed 90° layer-rotated on top of each other.

2.2.2. Collagen-I Coating of the PCL Scaffolds

The first step of the coating process is the cleaning of the scaffolds. For this purpose, the scaffolds were immersed in an ascending ethanol series (30%, 50%, 70% 80%, 96%, 100%) five times per concentration. In the next step, the scaffold surface was modified with the piezobrush PZ3 (relyon plasma GmbH, Regensburg, Germany). For this purpose, the scaffold was placed on a glass petri dish and the piezobrush was passed over the scaffold for 60 s (30 s, 10 s pause, 20 s) with uniform movements (please see Figure A1a in Appendix A). It should be noted that without the pause, the PCL will be re-melted by the laser. In advance, a 24-well plate was already prepared with 600 µL collagen I solution ([c] = 3.77 mg/mL) so that the scaffolds could be placed in the collagen bath immediately after treatment with the piezobrush. The corrugated plate was then placed in the refrigerator (approximately 5 °C) on a rocker table shaker (Rocker 2D Digital) for 72 h to ensure even distribution of collagen. After 72 h, the scaffolds were transferred to a new 24-well plate and dried for 24 h at approximately 37 °C. After drying, there is a layer of Collagen I on the scaffolds. This is cross-linked in a cross-linking solution in the final step. For this purpose, 1 mL of EDC (N-ethyl-N′-(3dimethylaminopropyl) carbodiimide hydrochloride) solution was added per well. For 100 mL of EDC solution, 958.5 mg of EDC powder was dissolved in 100 mL of 95% ethanol. After incubation in the EDC solution for 16 h (at room temperature), the scaffolds were cleaned with deionized water and sterilized with 70% ethanol.

2.2.3. Characterization of the Coated Scaffolds

The PCL scaffolds were measured and weighed for characterization. The strand width, strand height and pore size were determined using a VKX-210 3D laser scanning microscope (KEYENCE, Osaka, Japan). Scaffold dimensions were measured using a digital caliper (Burg-Wächter, Wetter-Volmarstein, Germany). The weight was determined using a Practum analytical balance from Satorius. A minimum of five scaffolds were measured by the different characterization methods. The surface roughness was measured for coated and pure PCL scaffolds. The 3D laser scanning microscope VKX-210 from KEYENCE was also used for this purpose. The images for evaluation were taken 400x magnification. The surface roughness was evaluated and calculated using the VK Analysis Module (V3.5.0.0). In order to be able to make a statistically significant statement, at least five scaffolds per group (coated/uncoated) were measured at five different locations. To analyze the microstructure of the PCL scaffolds, images were taken with an ESEM (FEI Quanta 250 FEG, Thermofisher Scientific, Waltham, MA, USA). For this purpose, the scaffolds were glued with a carbon conductive pad to the sample pin holder and examined with an excitation voltage of 10–20 kV. The magnifications HFW (Horizontal Field Width) were 746 µm and 373 µm.
To determine the integrity of the collagen coating, the collagen-I coated scaffolds were first washed with Phosphate Buffered Saline (PBS). After washing, they were incubated for 45 min at room temperature in a so-called blocking solution. The blocking solution consists of PBS, 1% BSA and 0.1% Triton X-100. Subsequently, the scaffolds are washed again 3 times with PBS. The primary antibody was then added, this was previously dissolved 1:1000 in a buffer (lowcross buffer). For the detection of collagen, the antibody “Mouse anti-human collagen 1 (ab6308)” at a concentration of 1.5 mg/mL was used as primary antibody. After addition of the primary antibody, the scaffolds are incubated at 4 °C overnight. Subsequently, the scaffolds were washed again 3 times with PBS. Now the scaffolds were incubated in the secondary antibody (dissolved 1:500 in lowcross buffer) for 60 min at room temperature. The secondary antibody is “Goat anti mouse Alexa 488” antibody from ThermoFisher Scientific. These antibodies are labeled with a fluoreschrome, allowing them to be examined later with a fluorescence microscope (Olympus BX-53, Olympus, Shinjuku, Japan) with 100–500 ms illumination time (excitation at 495 nm (blue), emission 519 nm (green)) [21]. The thickness of the collagen-I coating was examined with ESEM and image analysis with ImageJ (FIJI modification).

2.2.4. Biocompatibility Tests

In this work, the biocompatibility tests were performed with three different cell types (MG-63, MLO-Y4 and MSC). Each of these cell types required individual cultivation.
All three cell types were cultivated in 75 cm2 cell culture flasks from CELLSTAR in an incubator (37 °C, CO2 saturation 5%). The cell culture flasks for MLO-Y4 were coated with Rat Tail Collagen type I (0.15 mg/mL) in advance. The culture solutions for the cell types are listed below:
  • MG-63: DMEM-F12 medium with L-glutamine and 15 mM HEPES (2-(4-(2-hydroxyethyl)-1-piperazinyl)-ethanesulfonic acid) and the additions of 1% penicillin/streptomycin (P/S) and 10% fetal bovine serum (FBS).
  • MLO-Y4: Alpha-Mem medium with L-glutamine and deoxyribonucleosides and the additions 1% P/S, 2.5% FBS inactivated and 2.5% Newborn Calf Serum.
  • MSC: bmMSC expansion medium (GMP+); DMEM medium (500 mL), 1 M HEPES (12.5 mL), L-glutamine (5.0 mL), P/S (5.0 mL), heparin (1 mL), Human Plasma centrifuged, filtered (25 mL), Human Platelet Lysate (25 mL).

Live/Dead Assay

On each scaffold 100 µL of cell specific medium were pipetted with the following cell concentrations: MG-63: 25,000 cells/100 µL; MLO-Y4: 50,000 cells/100 µL; MSC: 50,000 cells/100 µL. The well plates were then incubated for 2 h at 37 °C and a CO2 saturation of 5% in an incubator. After two hours, 1 mL of the specific cell medium described previously was added to each well before incubating the well plates in the incubator for 3, 7 and 10 days. The staining solution was prepared by adding 2 mL DPBS (art. no. 14190-094, Gibco, Grand Island, NE, USA) to a Falcon tube (Greiner Bio-One International GmbH, Kremsmünster, Austria) and 4 µL ethidium homodimer III (Eth D-III) solution (together with calcein part of the Live/Dead Cell Staining Kit II (PromoCell, Heidelberg, Germany)) according to the manufacturer’s protocol (PromoCell). An amount of 1 µL of calcein dye was added after mixing the staining solution. All steps were performed in the dark to avoid photobleaching of staining solution and samples. To eliminate serum esterase activity, all samples at a time point had the medium removed and the cells washed. Staining was then performed according to a previously published protocol [19]. Evaluation was performed using an Olympus fluorescence microscope (BX51, Olympus, Osaka, Japan) at five different positions on the samples at 5× and 10× magnification.

LDH Assay

LDH measurements were performed after 24, 48 and 72 h. In addition to the scaffolds, positive control (Triton X, 100% toxicity) and negative controls (cells only, 0% toxicity) were used for the measurements at the different times. Both coated and uncoated scaffolds were also used. Cells were seeded onto the scaffolds and membranes in 100 µL of their medium (MG-63: 25,000 cells/100 µL, MLO-Y4: 50,000 cells/100 µL, MSC: 50,000 cells/100 µL). These were then incubated for 2 h in an incubator at 37 °C and 5% CO2 saturation. Following this, 1 mL of DMEM-F12 medium without phenol red was added to all wells with the additions of 1% P/S and 1% FBS. Since FBS in higher concentrations may induce background absorption, only 1% FBS was used. In the positive controls (C+), an additional 1% Triton X 100 was added to kill 100% of the cells. After 24 h incubation in the incubator, 100 µL from each well was transferred to three new wells of a 96-well plate. Thus, from one well, three wells of 100 µL each were obtained. To ensure that the “blank” had the same concentration of phenol red, 100 µL of DMEM-F12 medium containing phenol red was added to this well, prior to transfer. To evaluate the cytotoxicity, the Cytotoxity Detection Kit solution was prepared. For this, 111.1 µL of catalyst solution was mixed with 5 mL of staining solution. Of this, 100 µL was pipetted into each well before incubating the well plate in darkness for 30 min. At the end of the 30 min, the absorbance at 490 nm could be measured using a spectrometer. The experiment was performed a total of four times.

WST-I

Cells were again seeded on the scaffolds and as control on Thermanox cover slips in the same number and concentration as in the previous biocompatibility tests. After two hours of incubation in the incubator at 37 °C and 5% CO2 saturation, the cells adhered to the scaffolds and Thermanox cover slips (as control) so that the respective medium (1 mL) could be added. Plates were then incubated in the incubator for 3, 7 and 10 days. For this purpose, all medium was aspirated, and all wells were washed three times with PBS. Then, the scaffolds and Thermanox cover slips were transferred to a new 24-well plate. In the old well plate, 300 µL of DMEM medium without phenol red (additives: 1% FBP and 1% P/S) was added to each of the wells where the scaffolds and membranes were previously. In the new well plate, 600 µL of the same medium was added to each of the wells containing the scaffolds and membranes. The blank contains only DMEM medium without phenol red (same additives) and was measured to account for background absorbance. Finally, 10% WST was added to all samples of the respective measurement time point (3, 7, 10d) and incubated for 2 h in the incubator. After 2 h, the absorbance was measured using a spectrometer at 450 nm.

GIEMSA

Since Live/Dead staining could only visualize the cells on the surface of the scaffolds, Giemsa staining was applied to analyze the cell growth behavior inside the scaffolds. For this purpose, the cells were first fixed on the scaffolds after each live/dead experiment. For this purpose, the scaffolds were washed once with PBS in the first step and then incubated in a buffered 4% formaldehyde solution for ten minutes at room temperature. After ten minutes, the scaffolds were washed three times with PBS. Following this, Giemsa staining was performed. For the staining, the scaffolds were placed in a 1:10 Giemsa solution (azure-eosin-methylene blue solution) for ten minutes. The scaffolds were then washed with distilled water until no more purple dye came out. Before the scaffolds could be evaluated under a light microscope, they were cut in half with a sharp blade and air dried. Under the light microscope (Olympus SZ61 stereomicroscope), the nuclei were stained purple due to complexation of the dye with deoxyribonucleic acid.

2.3. Mechanical Tests

The compressive strength of the scaffolds was investigated using the Zwick Universal Testing Machine Z005 (Zwick/Roell, Ulm, Germany). First, a pre-load of 1 N was set to reach the surface of the specimen. The actual measurement was then carried out with a maximum force of 2000 N. The stop criterion was reaching the maximum force or a deformation of 80%. According to the DIN EN ISO 604-2003, at least 5 samples have been tested. The compressive strength was recorded by Test Xpert III v. 3.31 (Zwick/Roell).

2.4. Statistics

All values in this paper are expressed as mean ± standard deviation. The associated calculations were performed using Origin 2020 Professional SR1. ANOVA was used for significance testing (p < 0.05).

3. Results

3.1. Characterization of the Coated Scaffolds

3.1.1. Size and Weight

For characterization, the PCL scaffolds were weighed and measured. The length, width and height of the scaffold were measured, as well as the strand width and strand height (see Figure 1). At least five scaffolds were used in each case. The samples were approximately square with 8.55 × 8.53 mm base area. The scaffolds averaged 2.08 ± 0.02 mm in height and weighed approximately 75 mg. The strand widths were 234.7 ± 13.91 µm and the strand spacing 258.75 ± 9.62 (see Table 2).

3.1.2. Surface Roughness

The surface roughness was determined for the coated collagen scaffolds and the pure PCL scaffolds. For this purpose, five scaffolds each were examined at five different locations. The PCL scaffolds without coating showed a roughness of 4.11 ± 0.27 µm and the collagen-coated samples a roughness of 3.35 ± 0.3 µm (see Figure 2).

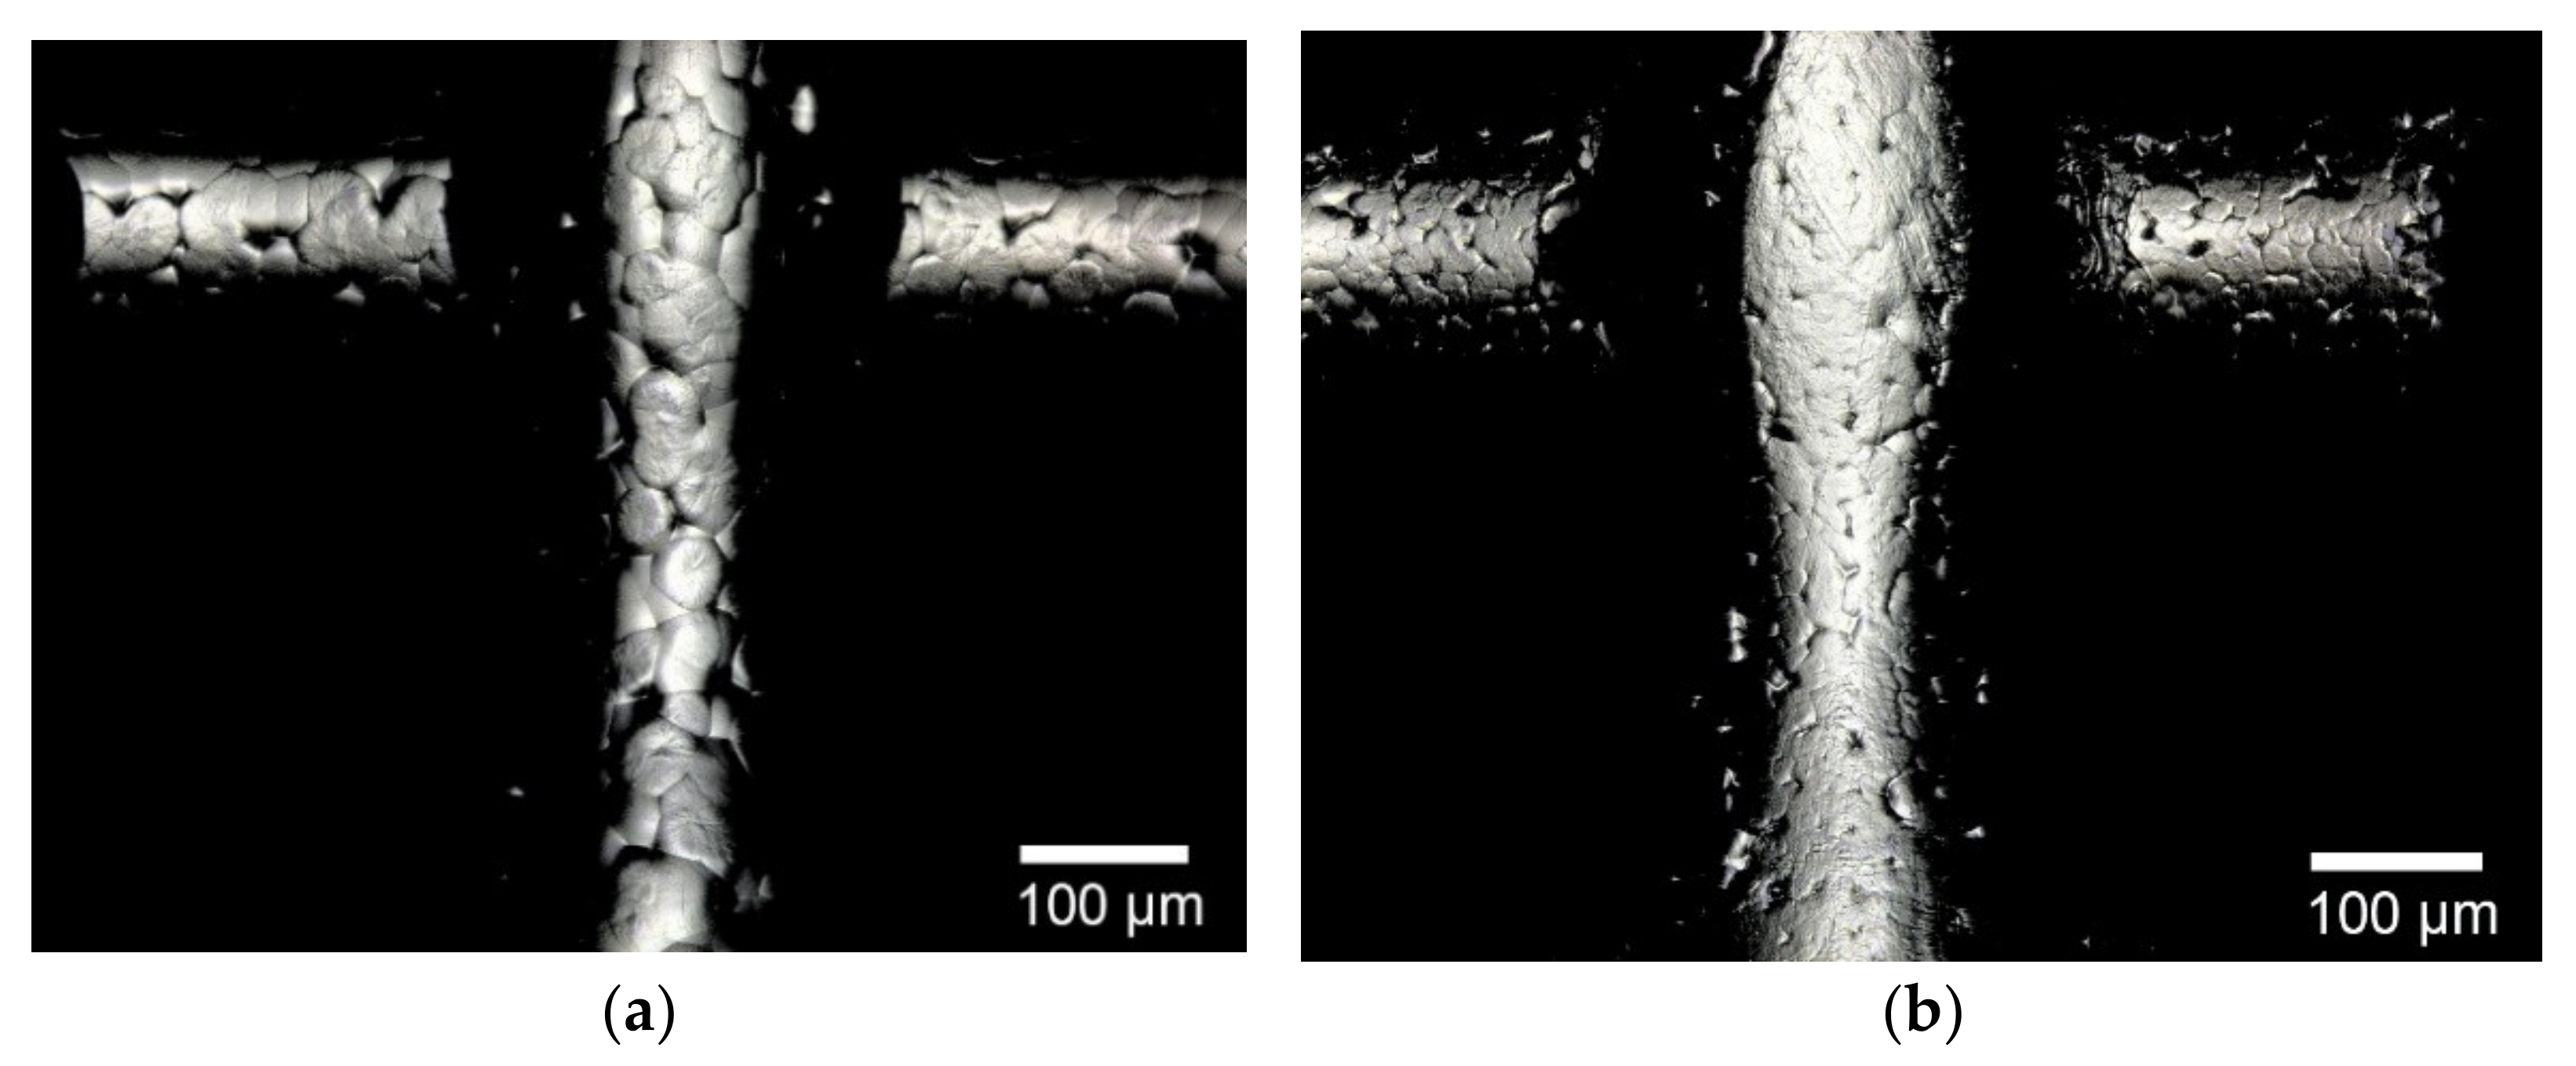
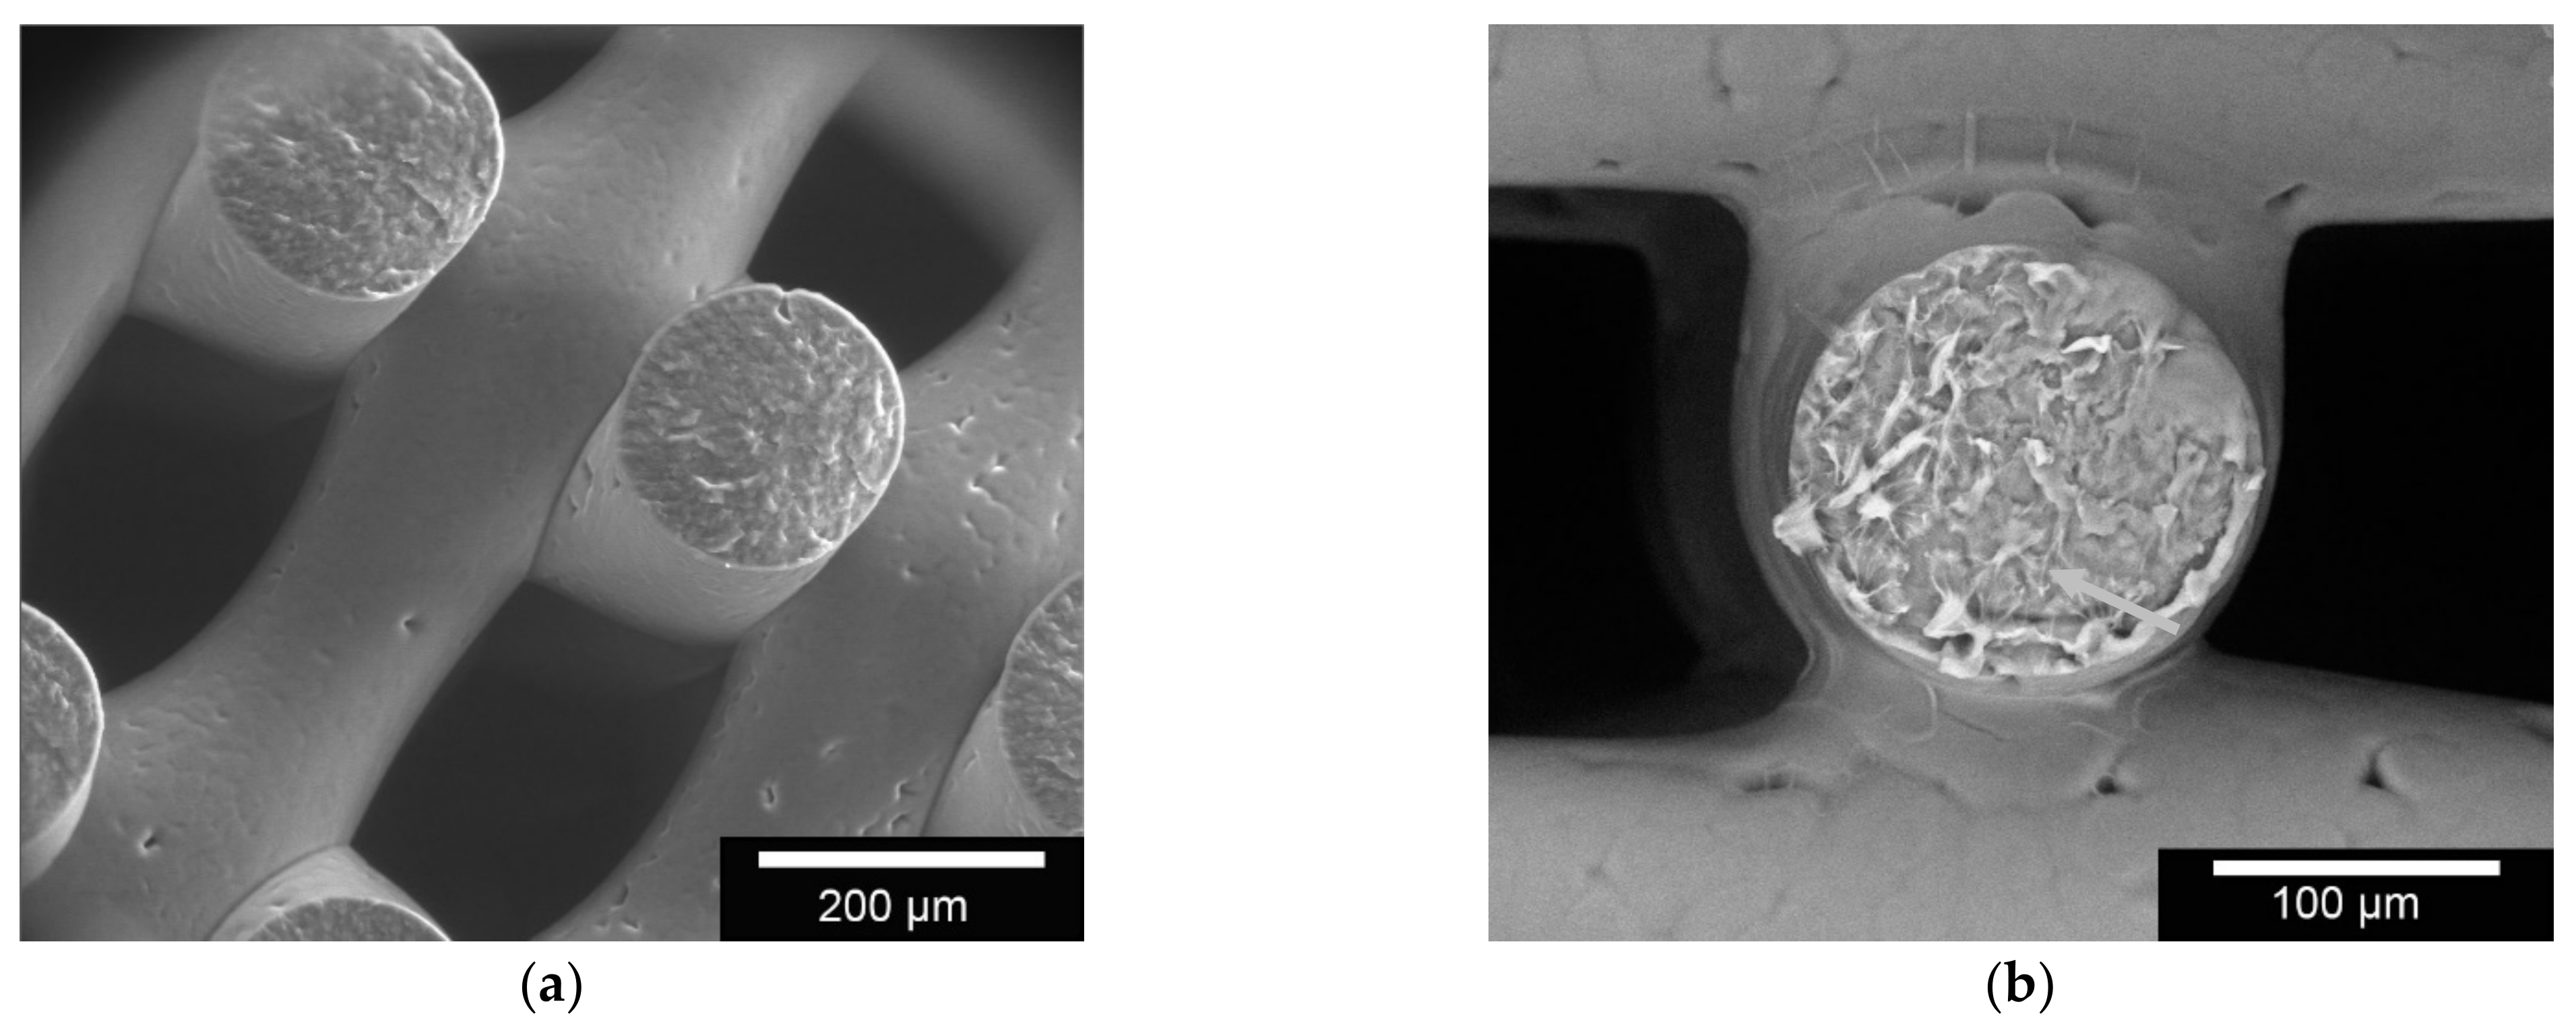
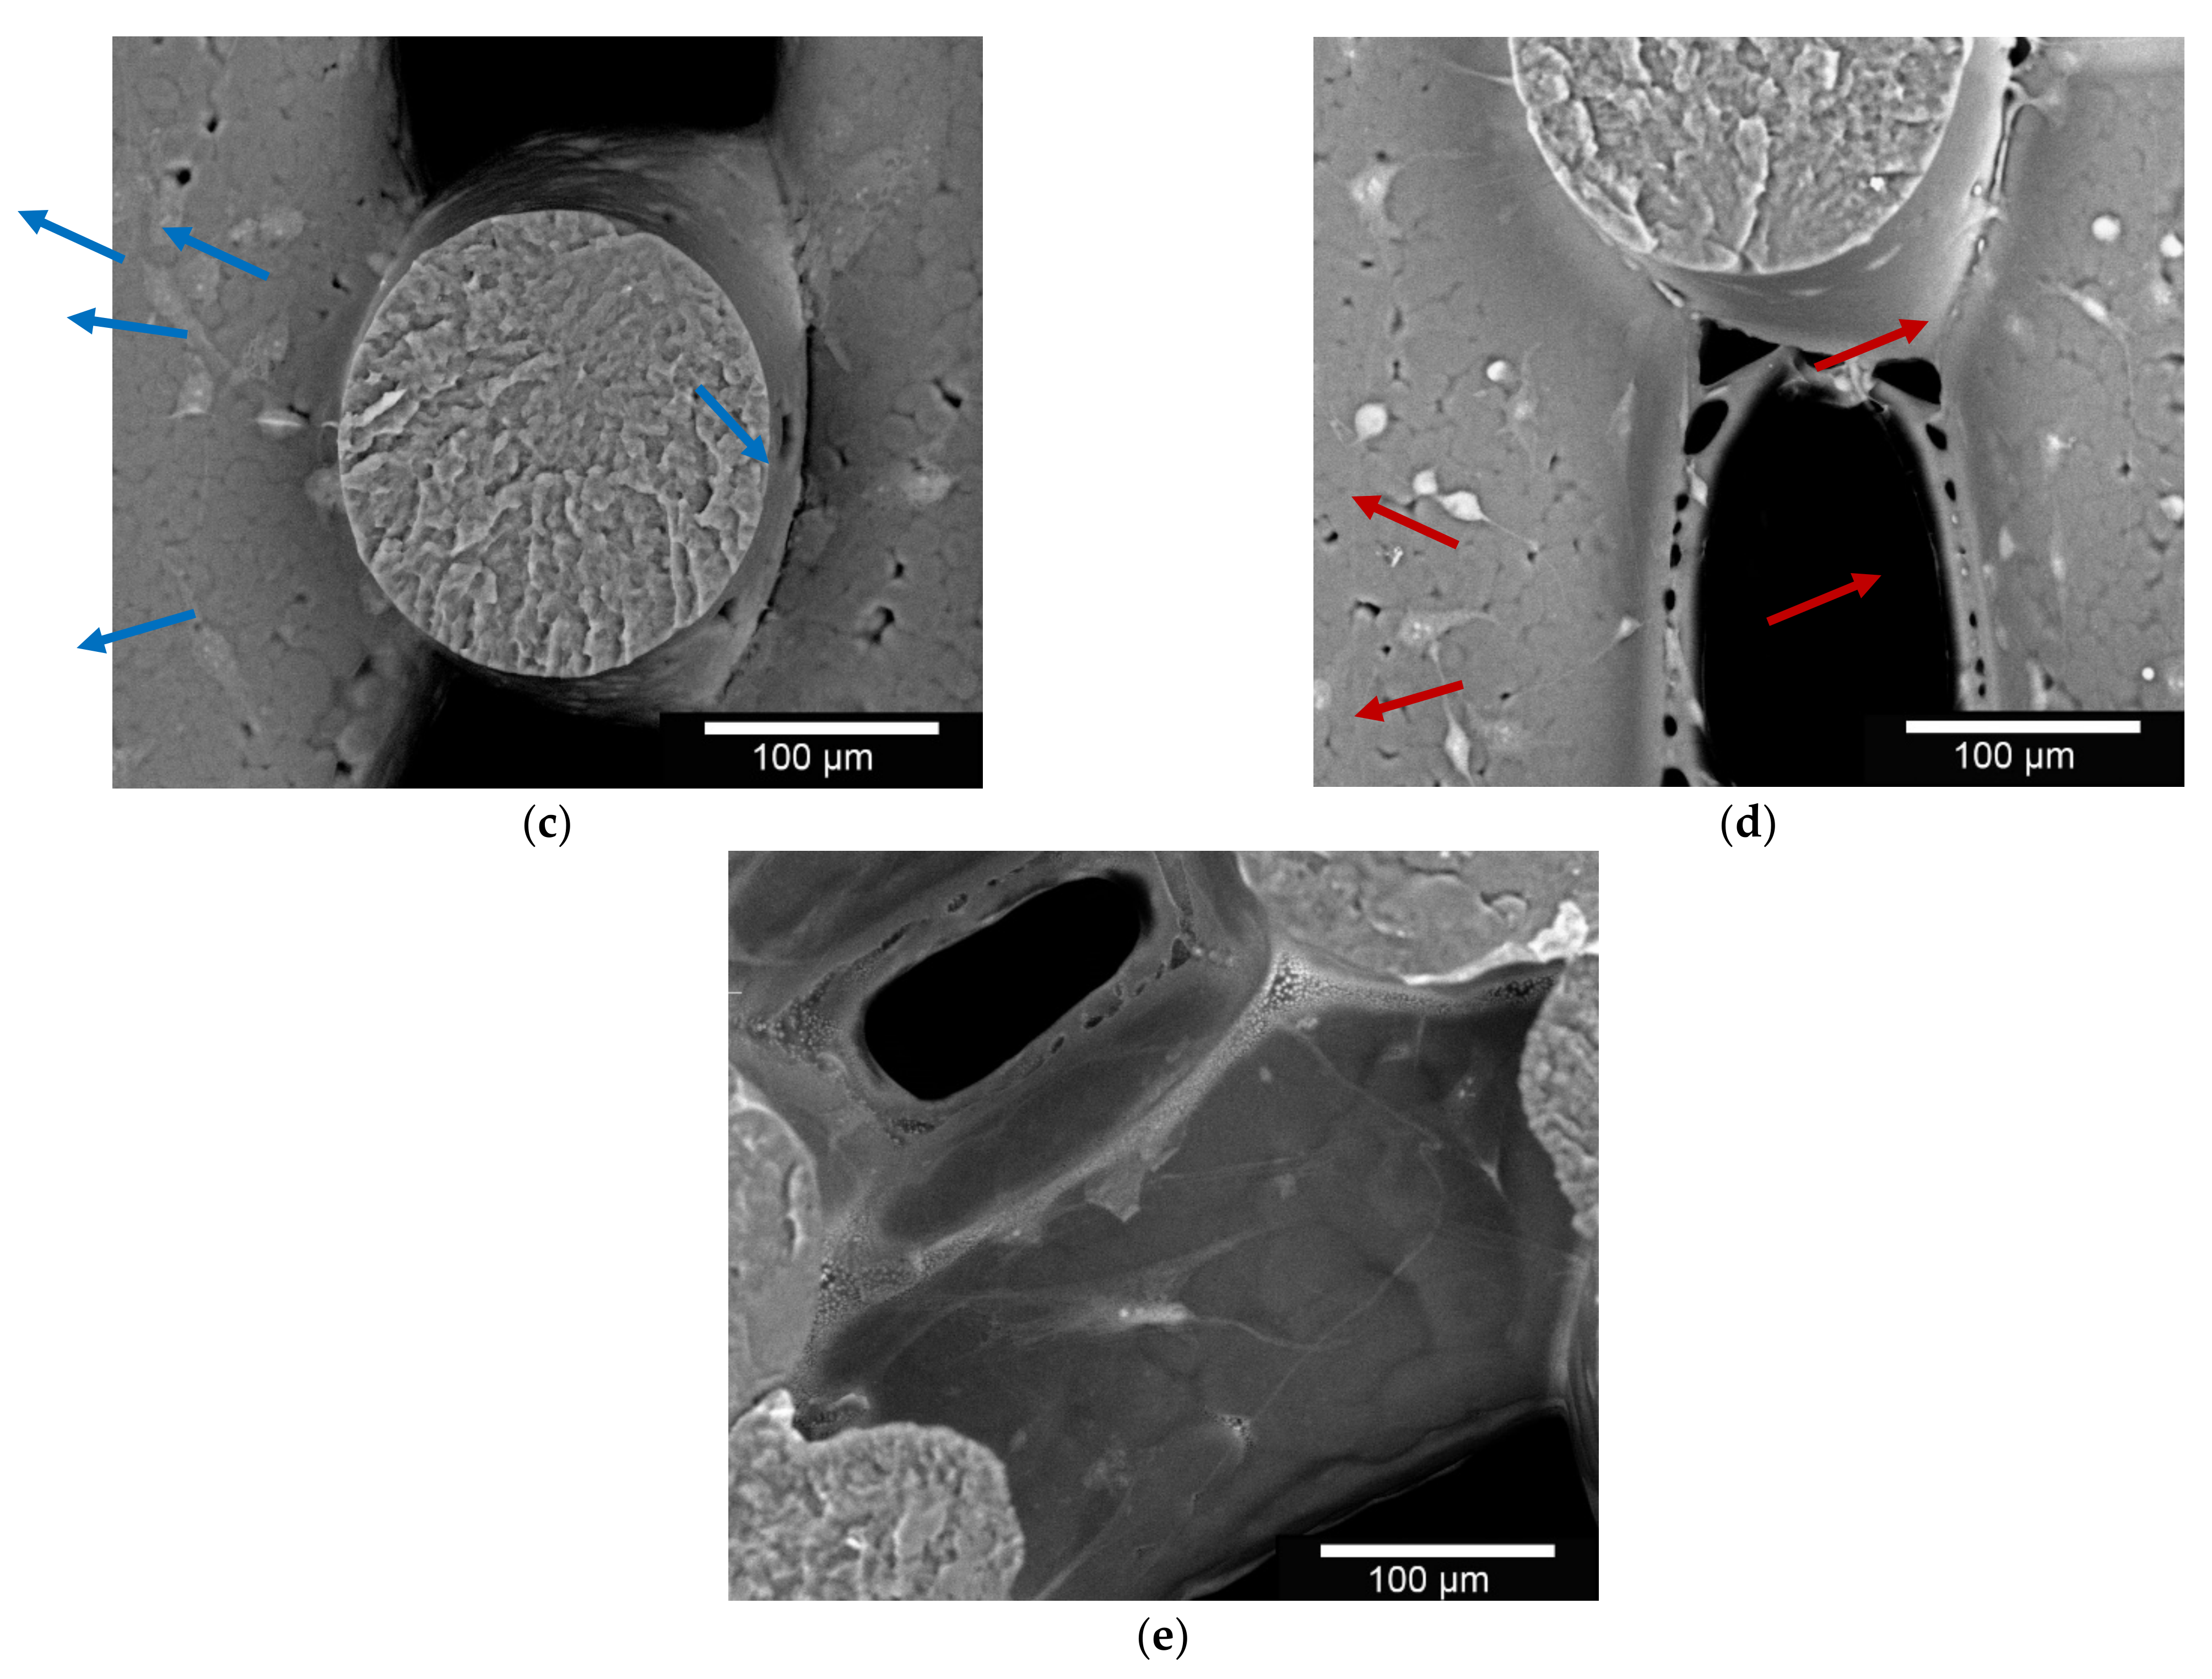
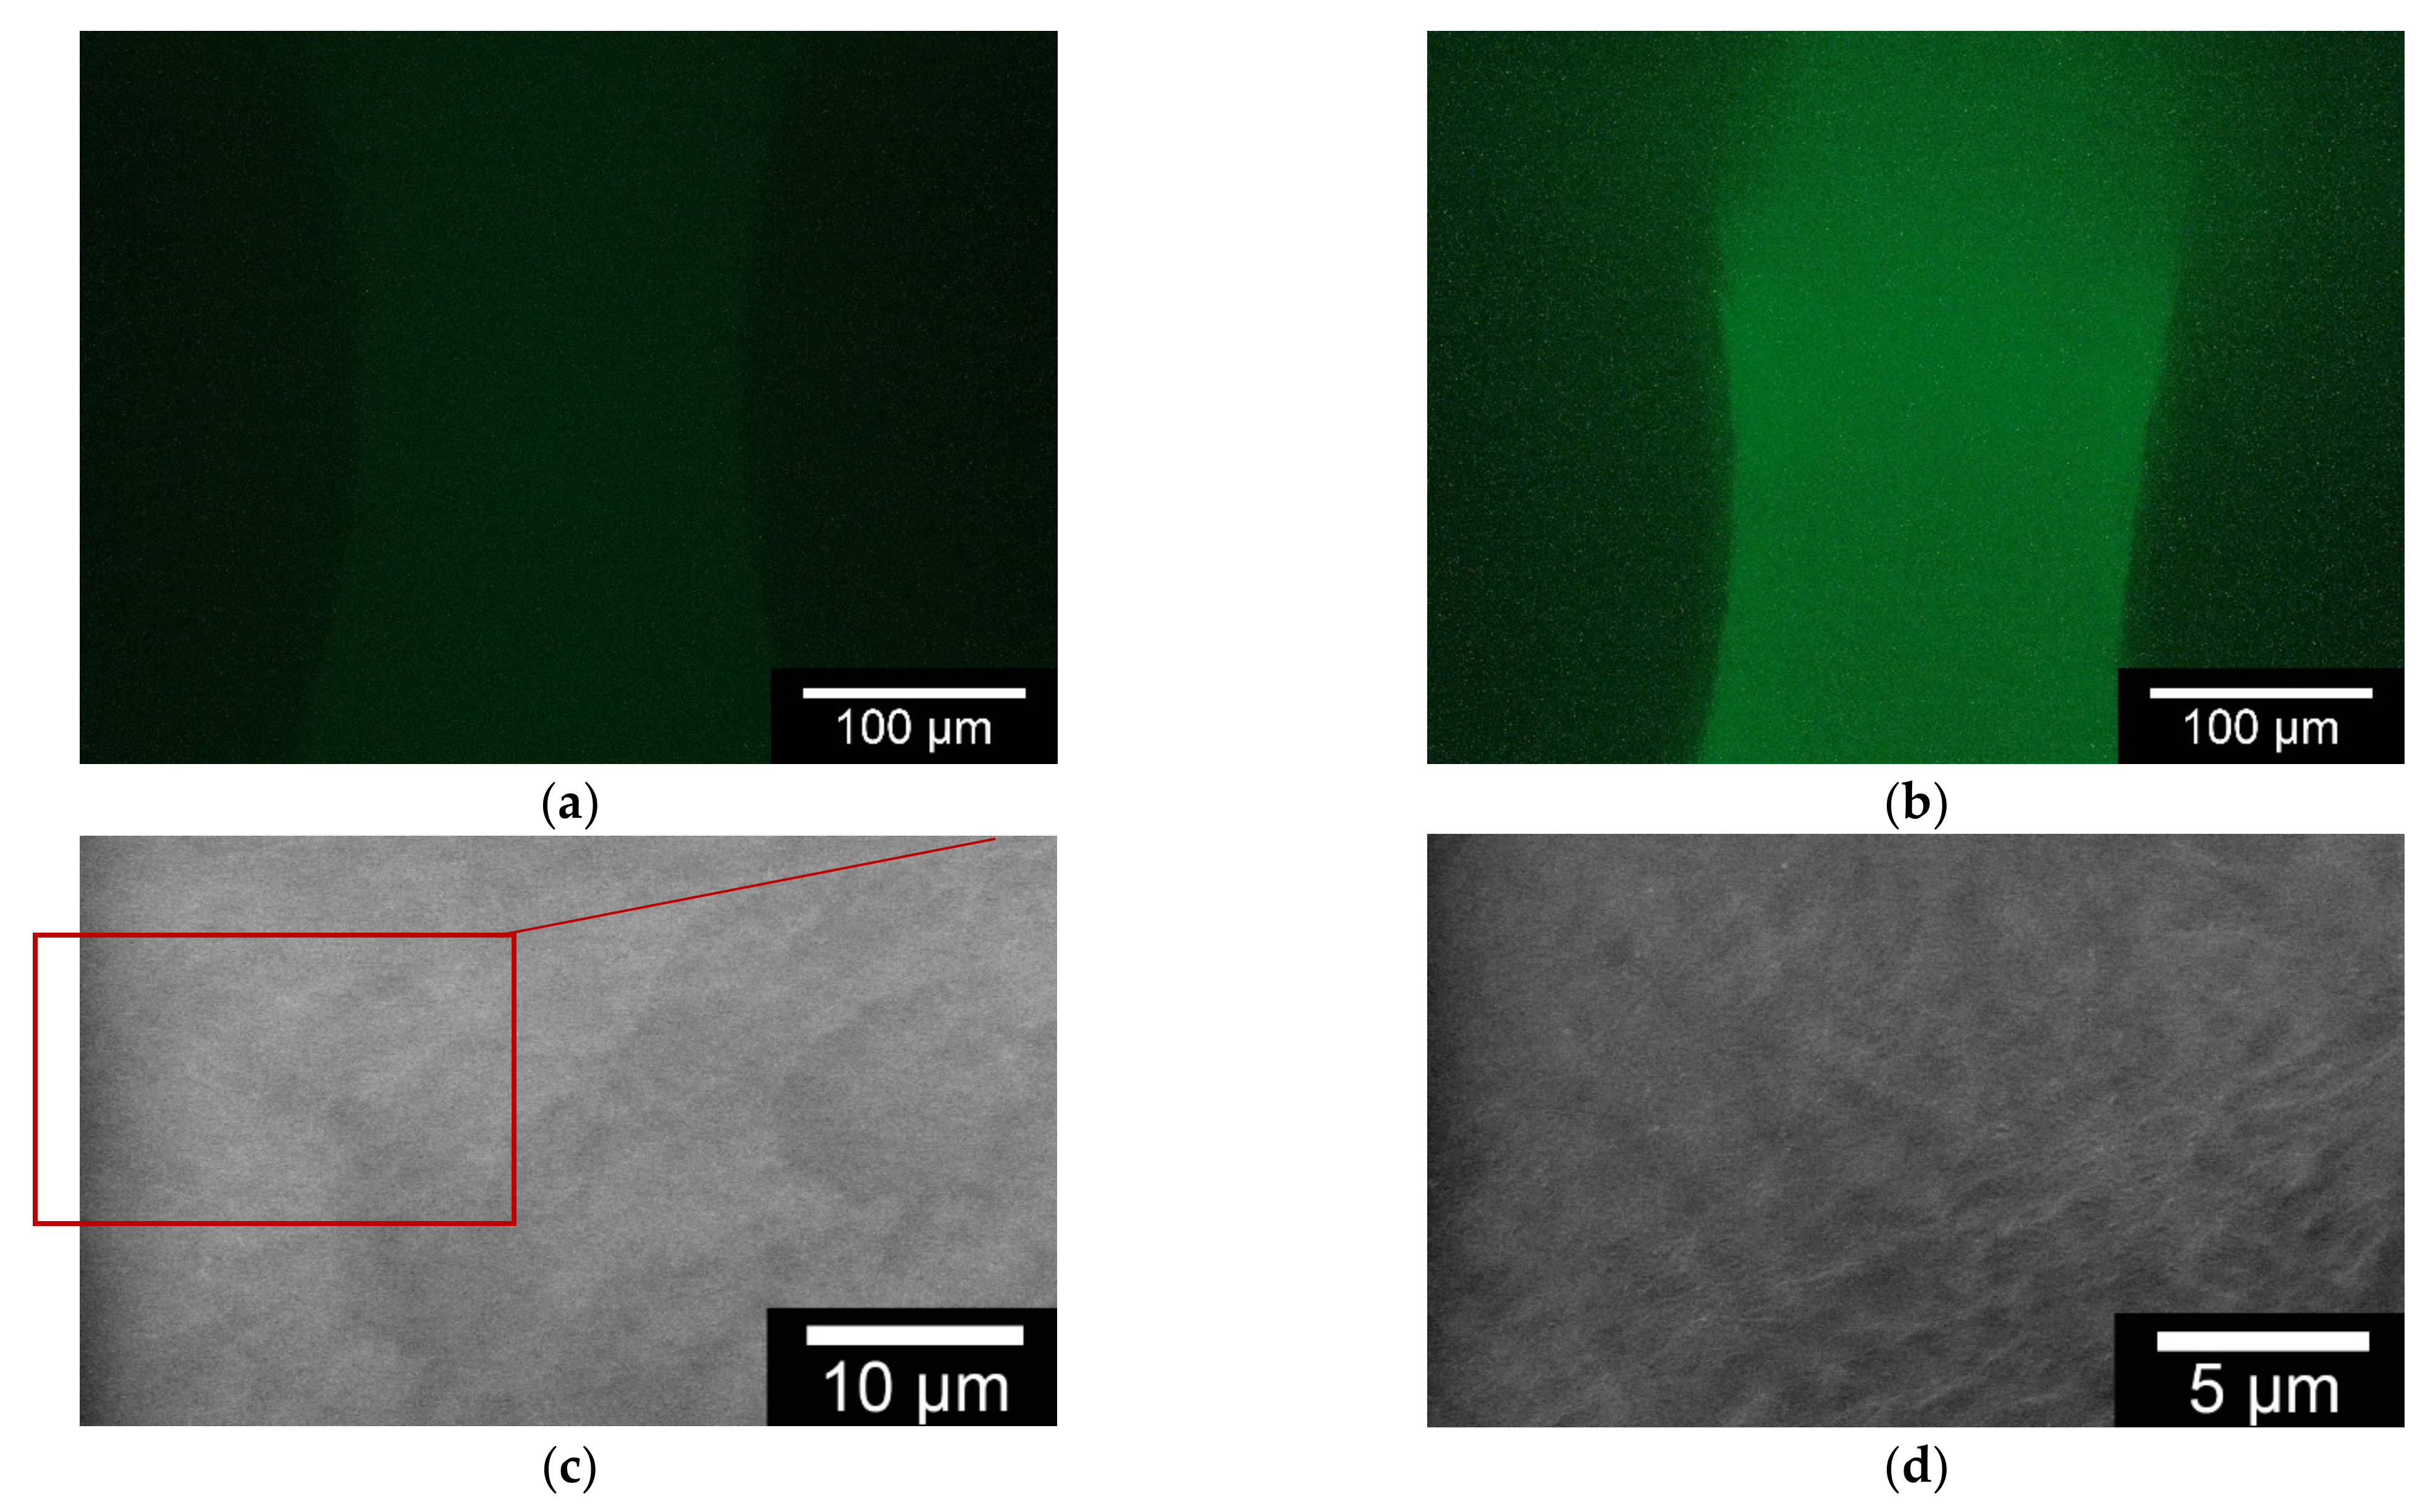
3.1.3. Microstructure by ESEM

For the detection of the collagen coating of the PCL scaffolds, they were cryo-broken before the ESEM investigations. Thus, cross-bracing from the center of the scaffold could be investigated. The collagen coating of the PCL scaffolds was made visible by the ESEM investigations.
The second goal of the ESEM investigations was to visualize the different cell types on the surface of the scaffolds.
Figure 3c shows the MG-63 cells on the surface of the PCL scaffold. It can be seen that the cells arrange themselves relatively regularly. Whereas the MLO-Y4 cells show a different behavior (especially on the right side of Figure 3d). The distance between the cells is larger and the cells partly migrate under the collagen coating. The MSCs also adhere well to the surface and even interact with the collagen coating (see Figure 3e white arrow). Using ESEM and image analysis with ImageJ (FIJI modification), a thickness of 2.088 + 0.39 µm was determined for the Collagen I coating. In addition, it was determined that the Collagen I coating has a uniform thickness over the entire scaffold.

3.1.4. Characterization of the Collagen-I Coating

For the detection of the collagen layer on the scaffolds, an immunoassay was performed on randomly selected scaffolds. Collagen-coated scaffolds and untreated scaffolds were stained using immunofluorescence and observed under the fluorescence microscope (Olympus BX53, Olympus, Shinjuku, Japan). As shown in Figure 4 below, the uncoated scaffold does not fluoresce at all, whereas the collagen-I coated scaffold fluoresces bright green (Figure A1b in Appendix A shows another position). The exposure time for the image of the uncoated sample was 5x longer at 500 ms than for the collagen-I coated sample at 100 ms. Additionally, the characterization of the collagen-I coatings was also carried out by means of ESEM (FEI Quanta 250 FEG).

3.2. Biocompatibility

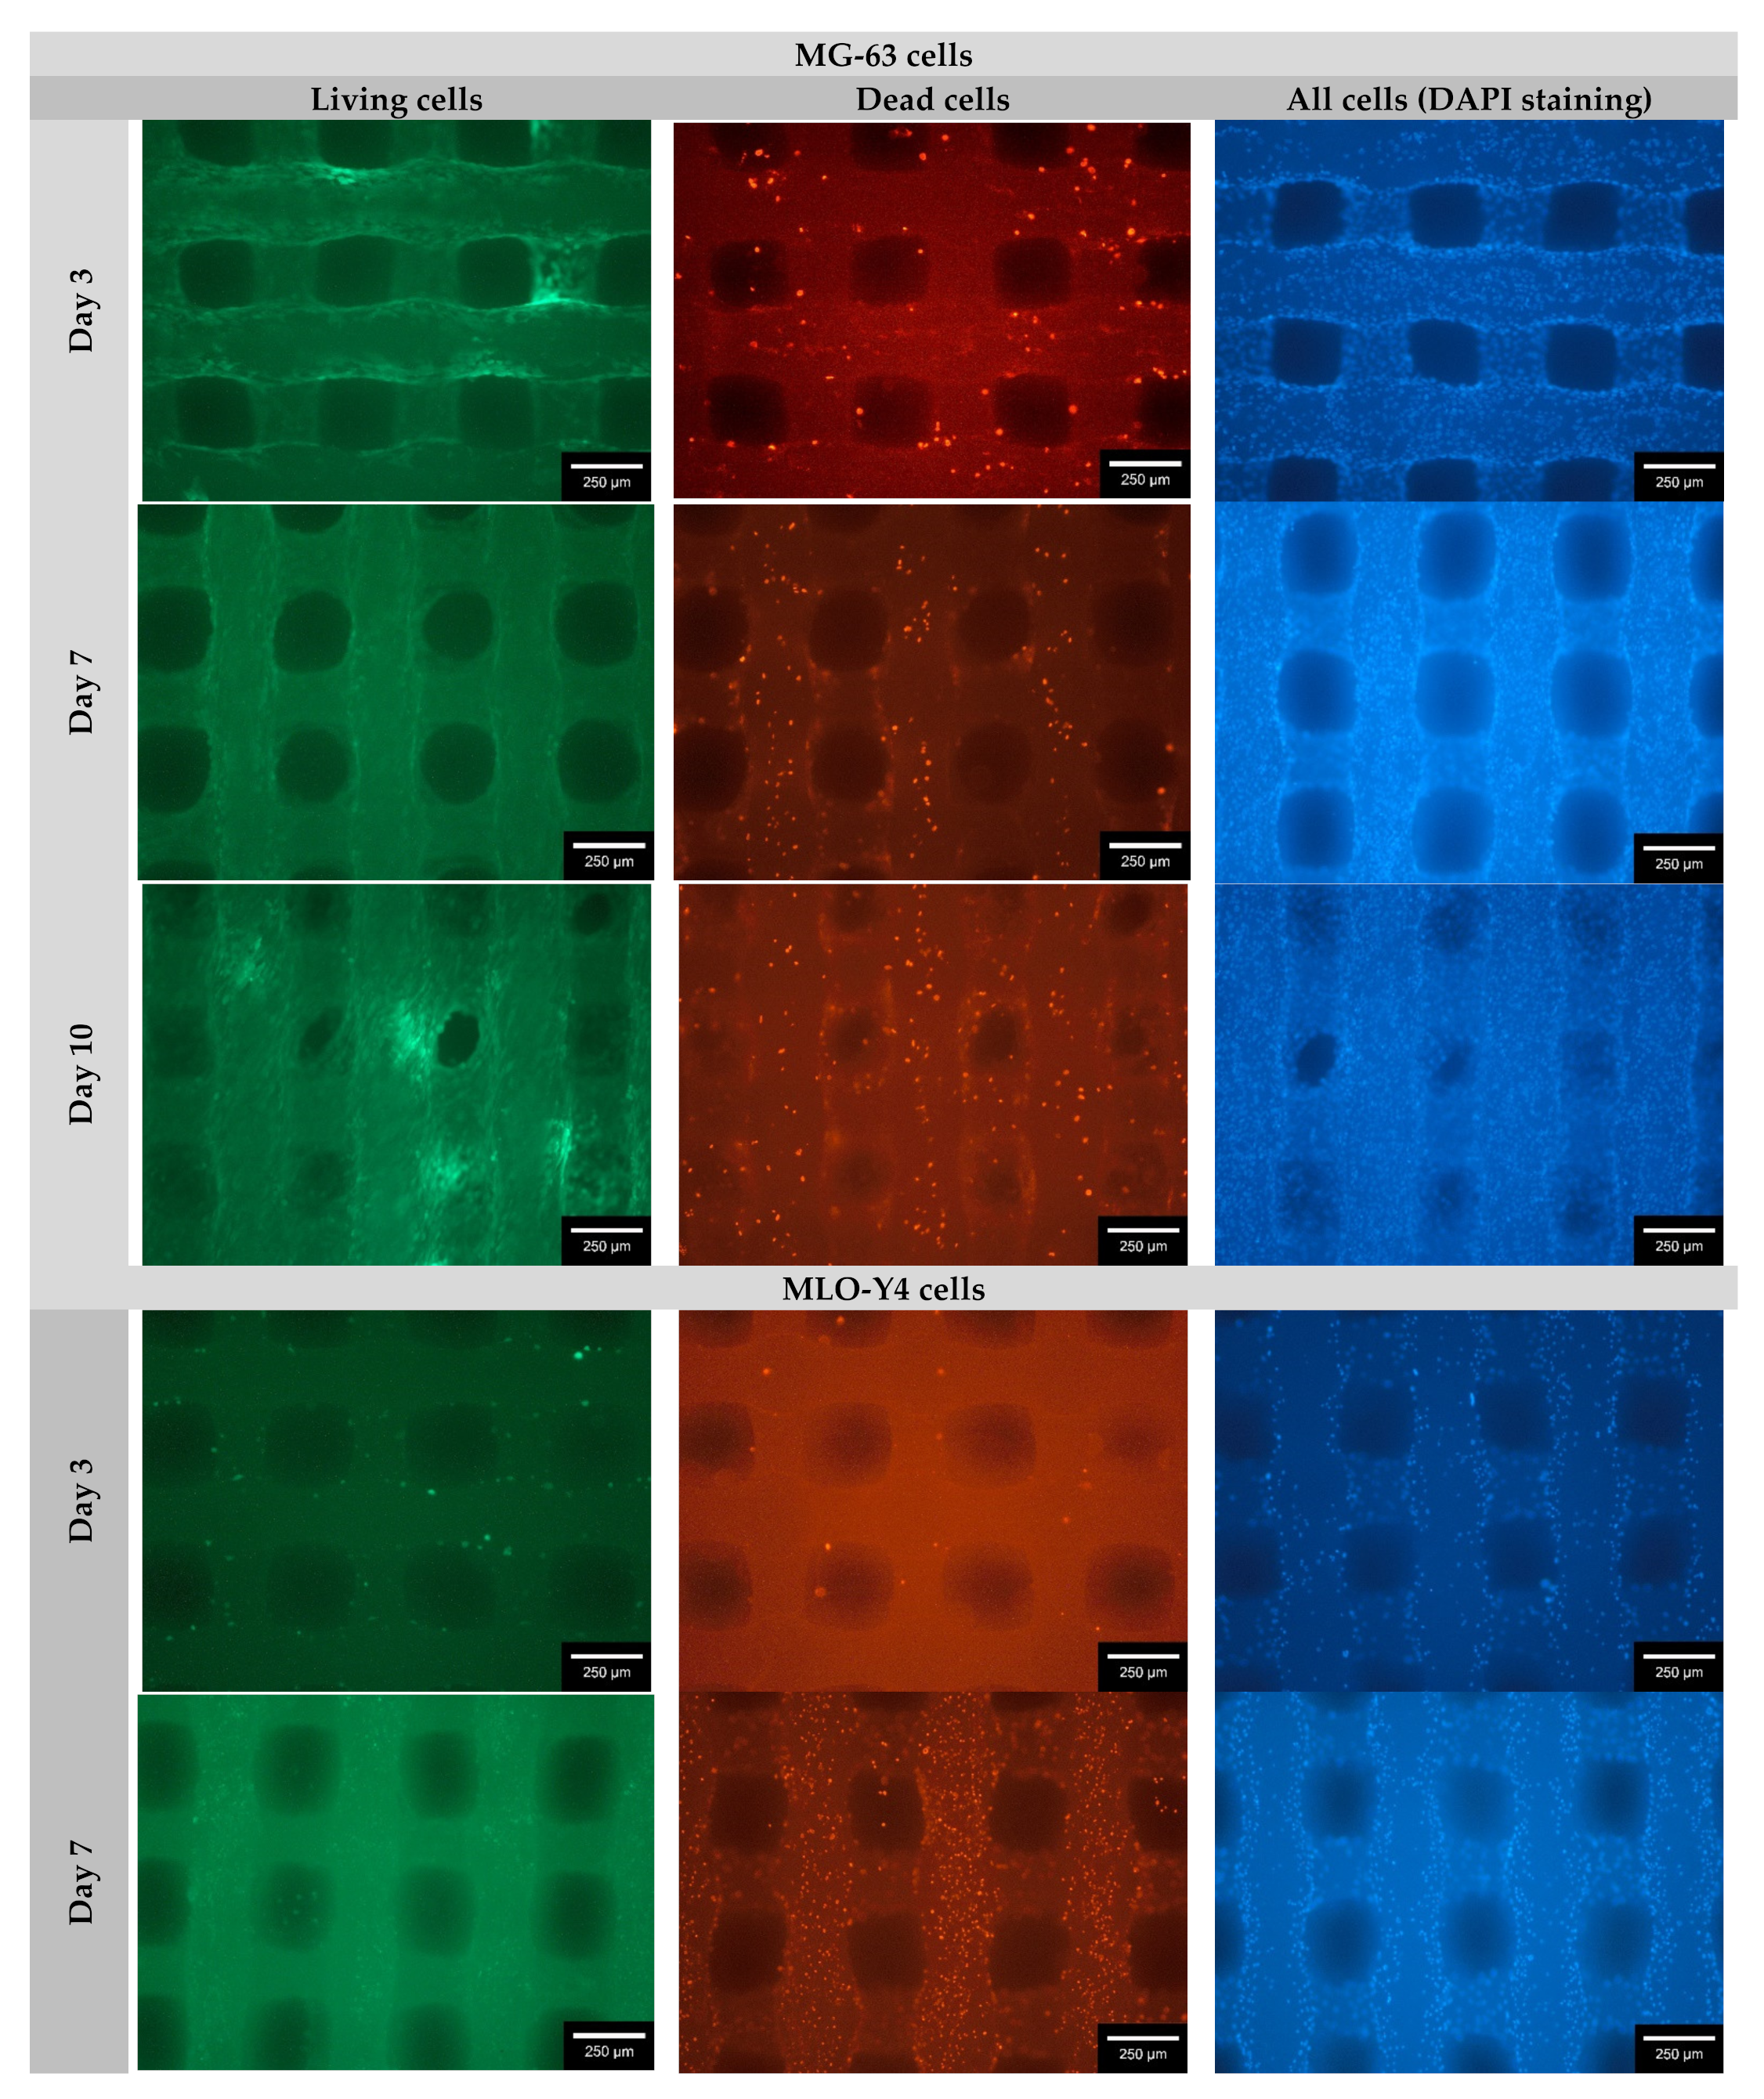
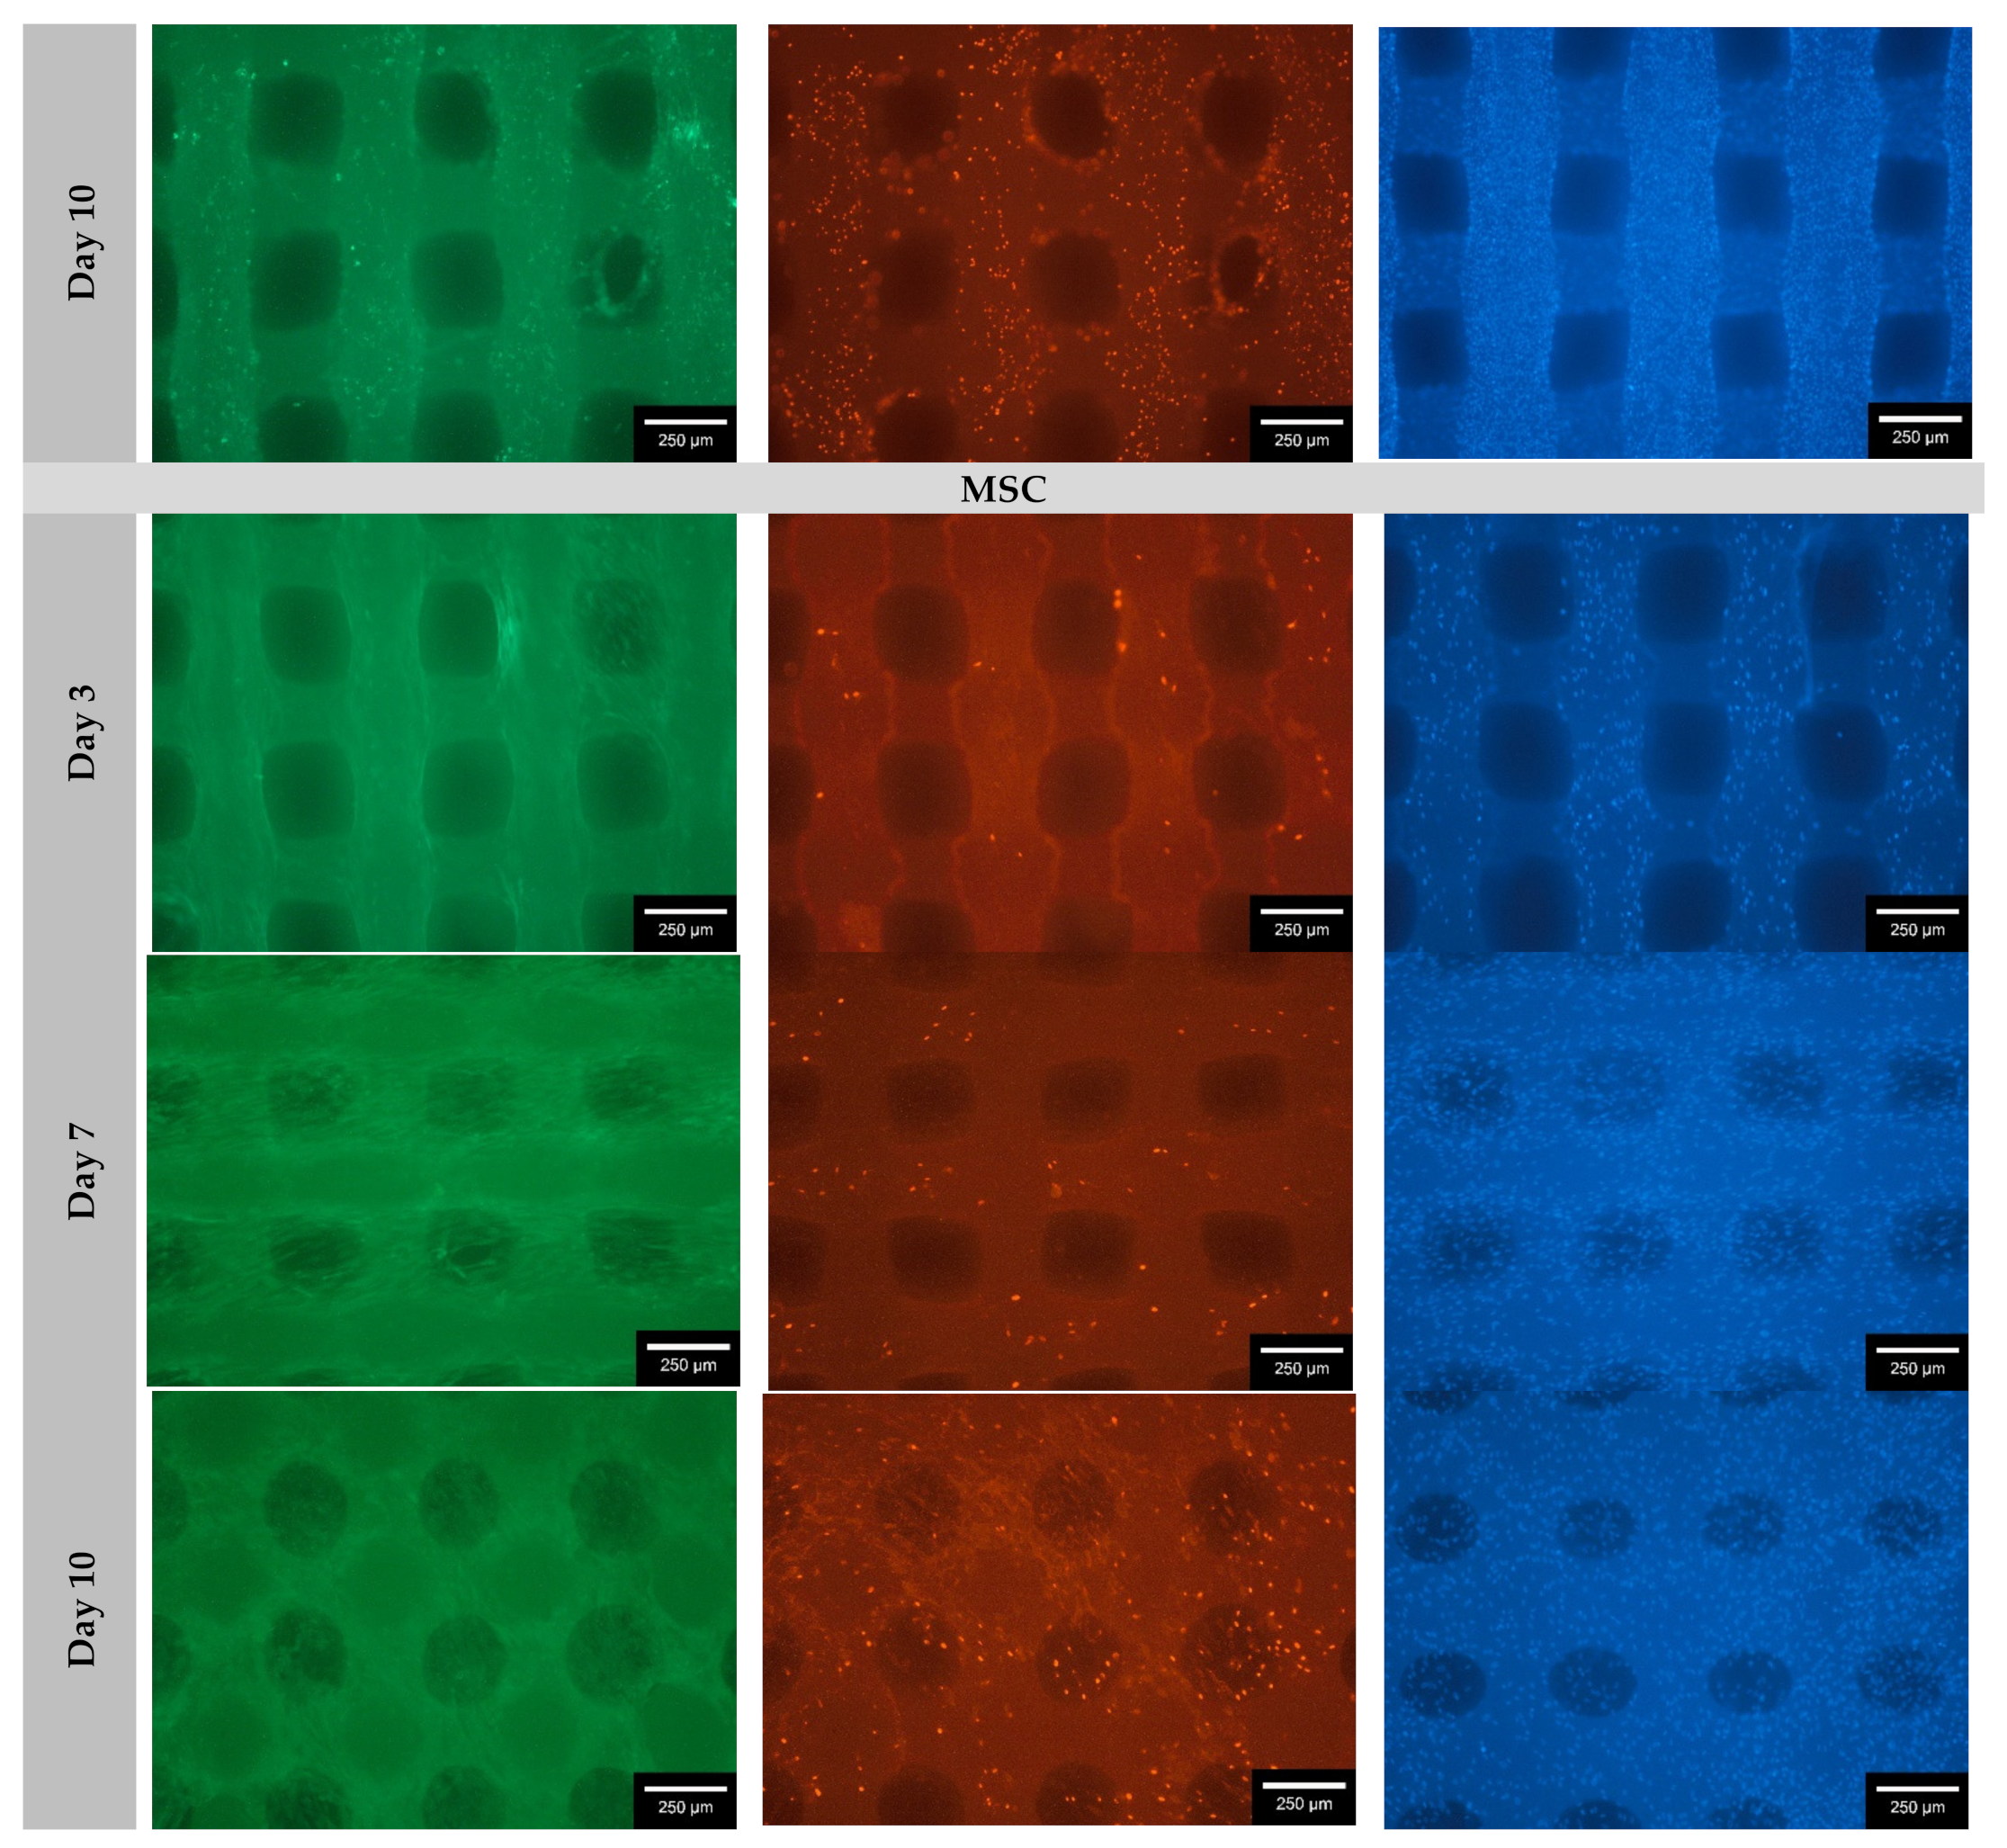
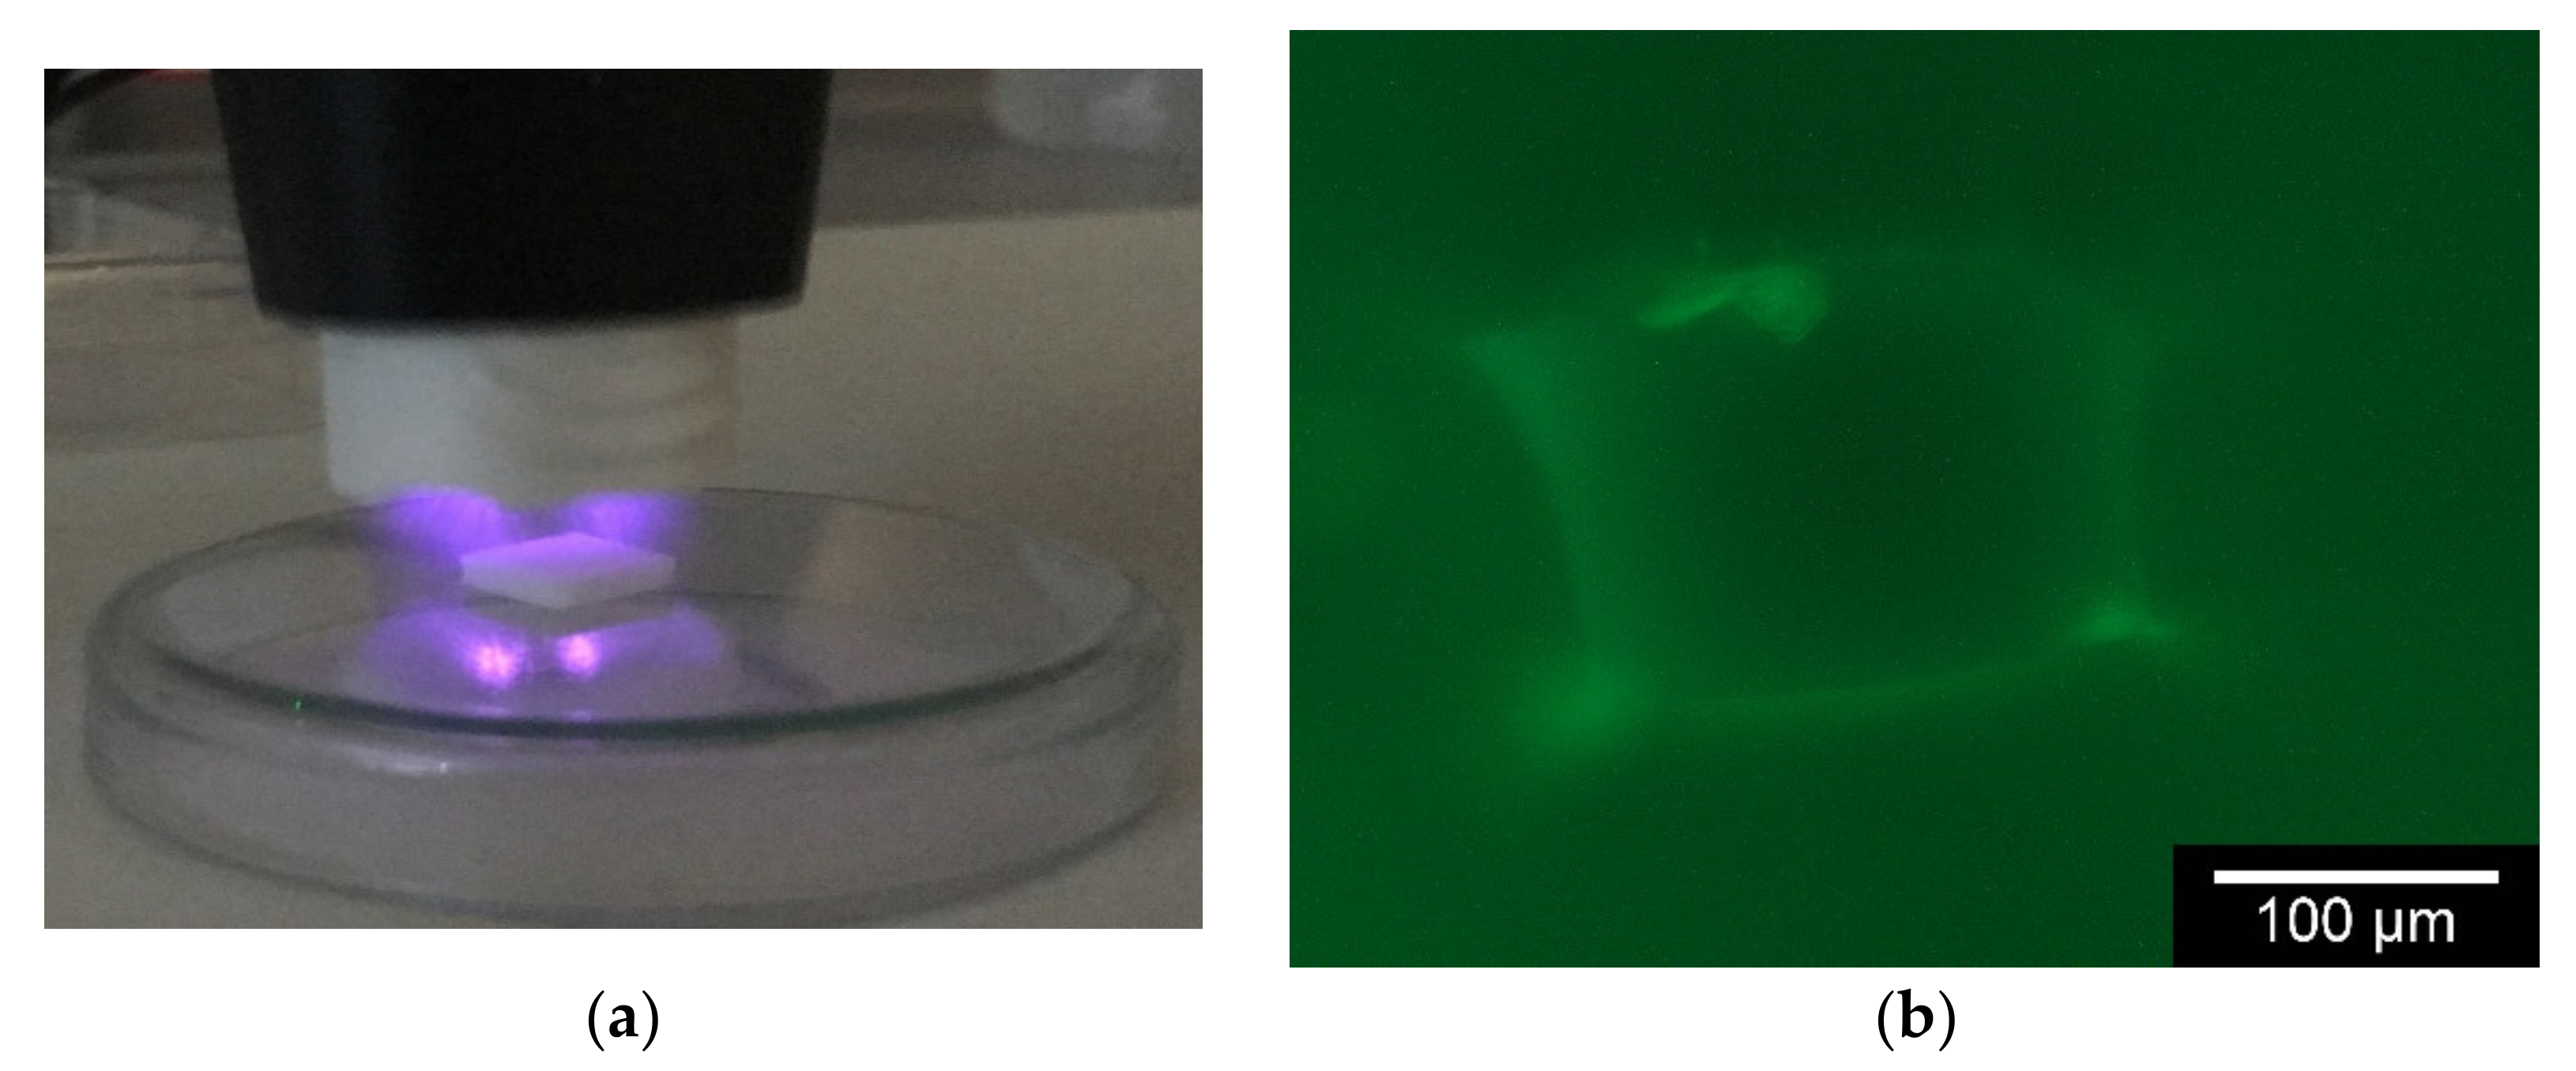
3.2.1. Live/Dead Assay
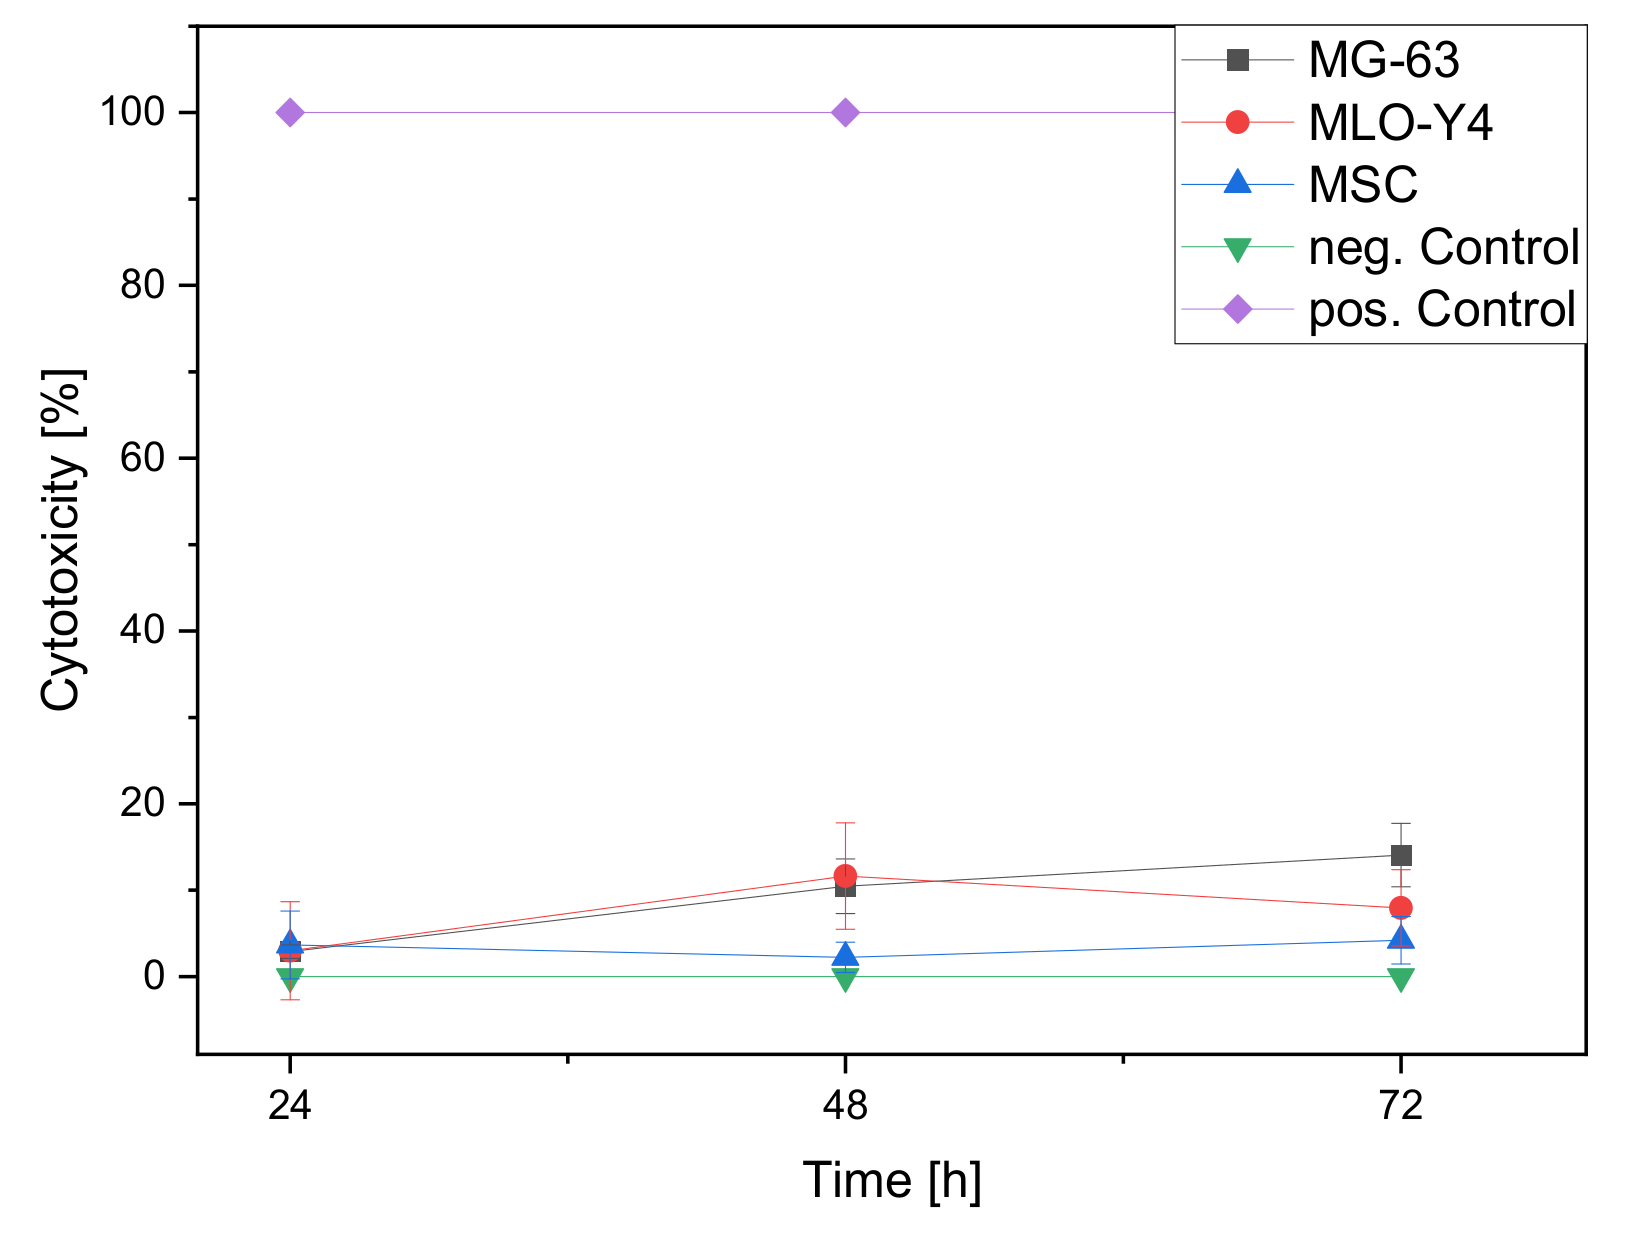
Figure 5 shows an increase in cell number for the MG-63 cells over the study period. On day 3, there are areas on the scaffold surface where only isolated cells can be seen, while on day 7 the surface is already confluently covered. In addition, by day 7, cells begin to colonize the pores by bridging the corners of the pores. By day 10, some of the pores are fully colonized and bridged. The number of dead cells also increases over the course of the experiment. However, the number of dead cells is significantly lower compared to the live cells. Table 3 shows the cell numbers per mm2 for the three different cell lines, sorted according to total cells, dead cells and percentage of dead cells (%). A continuous increase in cell number/mm2 can be seen during the course of the experiment. In addition, the proportion of dead cells is very low compared to the total number of cells. While the total number of cells increases fivefold from day 3 to day 10, the number of dead cells only increases by a factor of two. The proportion of dead cells was still about 17% on day 3 of the experiment, about 7% on day 7 and only about 6% on day 10.
The MLO-Y4 cells, like the MG-63 cells, showed an increase in live cells over the experimental days (Figure 5). However, a striking feature of the MLO-Y4 cells is that the live cells were difficult to identify under the microscope. Some cells were only slightly green in color and were barely distinguishable from the background. Therefore, it was difficult to quantify the percentage of live cells versus dead cells. DAPI staining was essential in this case. In contrast, the dead cells were easy to recognize. Their proportion also increased over the experimental days. Particularly from day 7 to day 10, there was a strong increase in dead cells. Table 3 illustrates the cell number progression on the scaffold surface over the experimental period of 10 days. It can be observed that the number of all cells per mm2 increases sharply from day 3 to day 7, before it starts to decrease from day 7 to day 10. The number of dead cells increases continuously throughout the experimental days. This increase is particularly strong from day 3 to day 7. In percentage terms, the percentage of dead cells on day 3 is about 10%. It also increases continuously with 16% on day 7 and 23% on day 10.
The number of living MSC increases rapidly from day 3 to day 7, so that already on day 7 the pores of the scaffolds are populated over a large area. On day 10, it can be seen how the cells span the pores. The number of dead cells also increases with the days, but their proportion is significantly lower (see Figure 5). The number of all cells increases from day 3 to day 7 and then starts to decrease. Compared to this, the number of dead cells is significantly lower, but increases steadily over the test days. After three days, their percentage is about 7%, after 7 days 8% and after 10 days 10% (see Table 3)

3.2.2. Cytotoxicity

After 24 h, no significant cytotoxicity is seen for all cell types. For the MG-63 and the MLO-Y4 this changes with the duration of the experiment, while for the MSC no cytotoxicity worth mentioning is seen even after 72 h. The cytotoxicity of the MG-63 and MLO increases somewhat after 24 h. For the MLO, the value decreases again after 48 h, while for the MG-63 it increases even more (Figure 6).

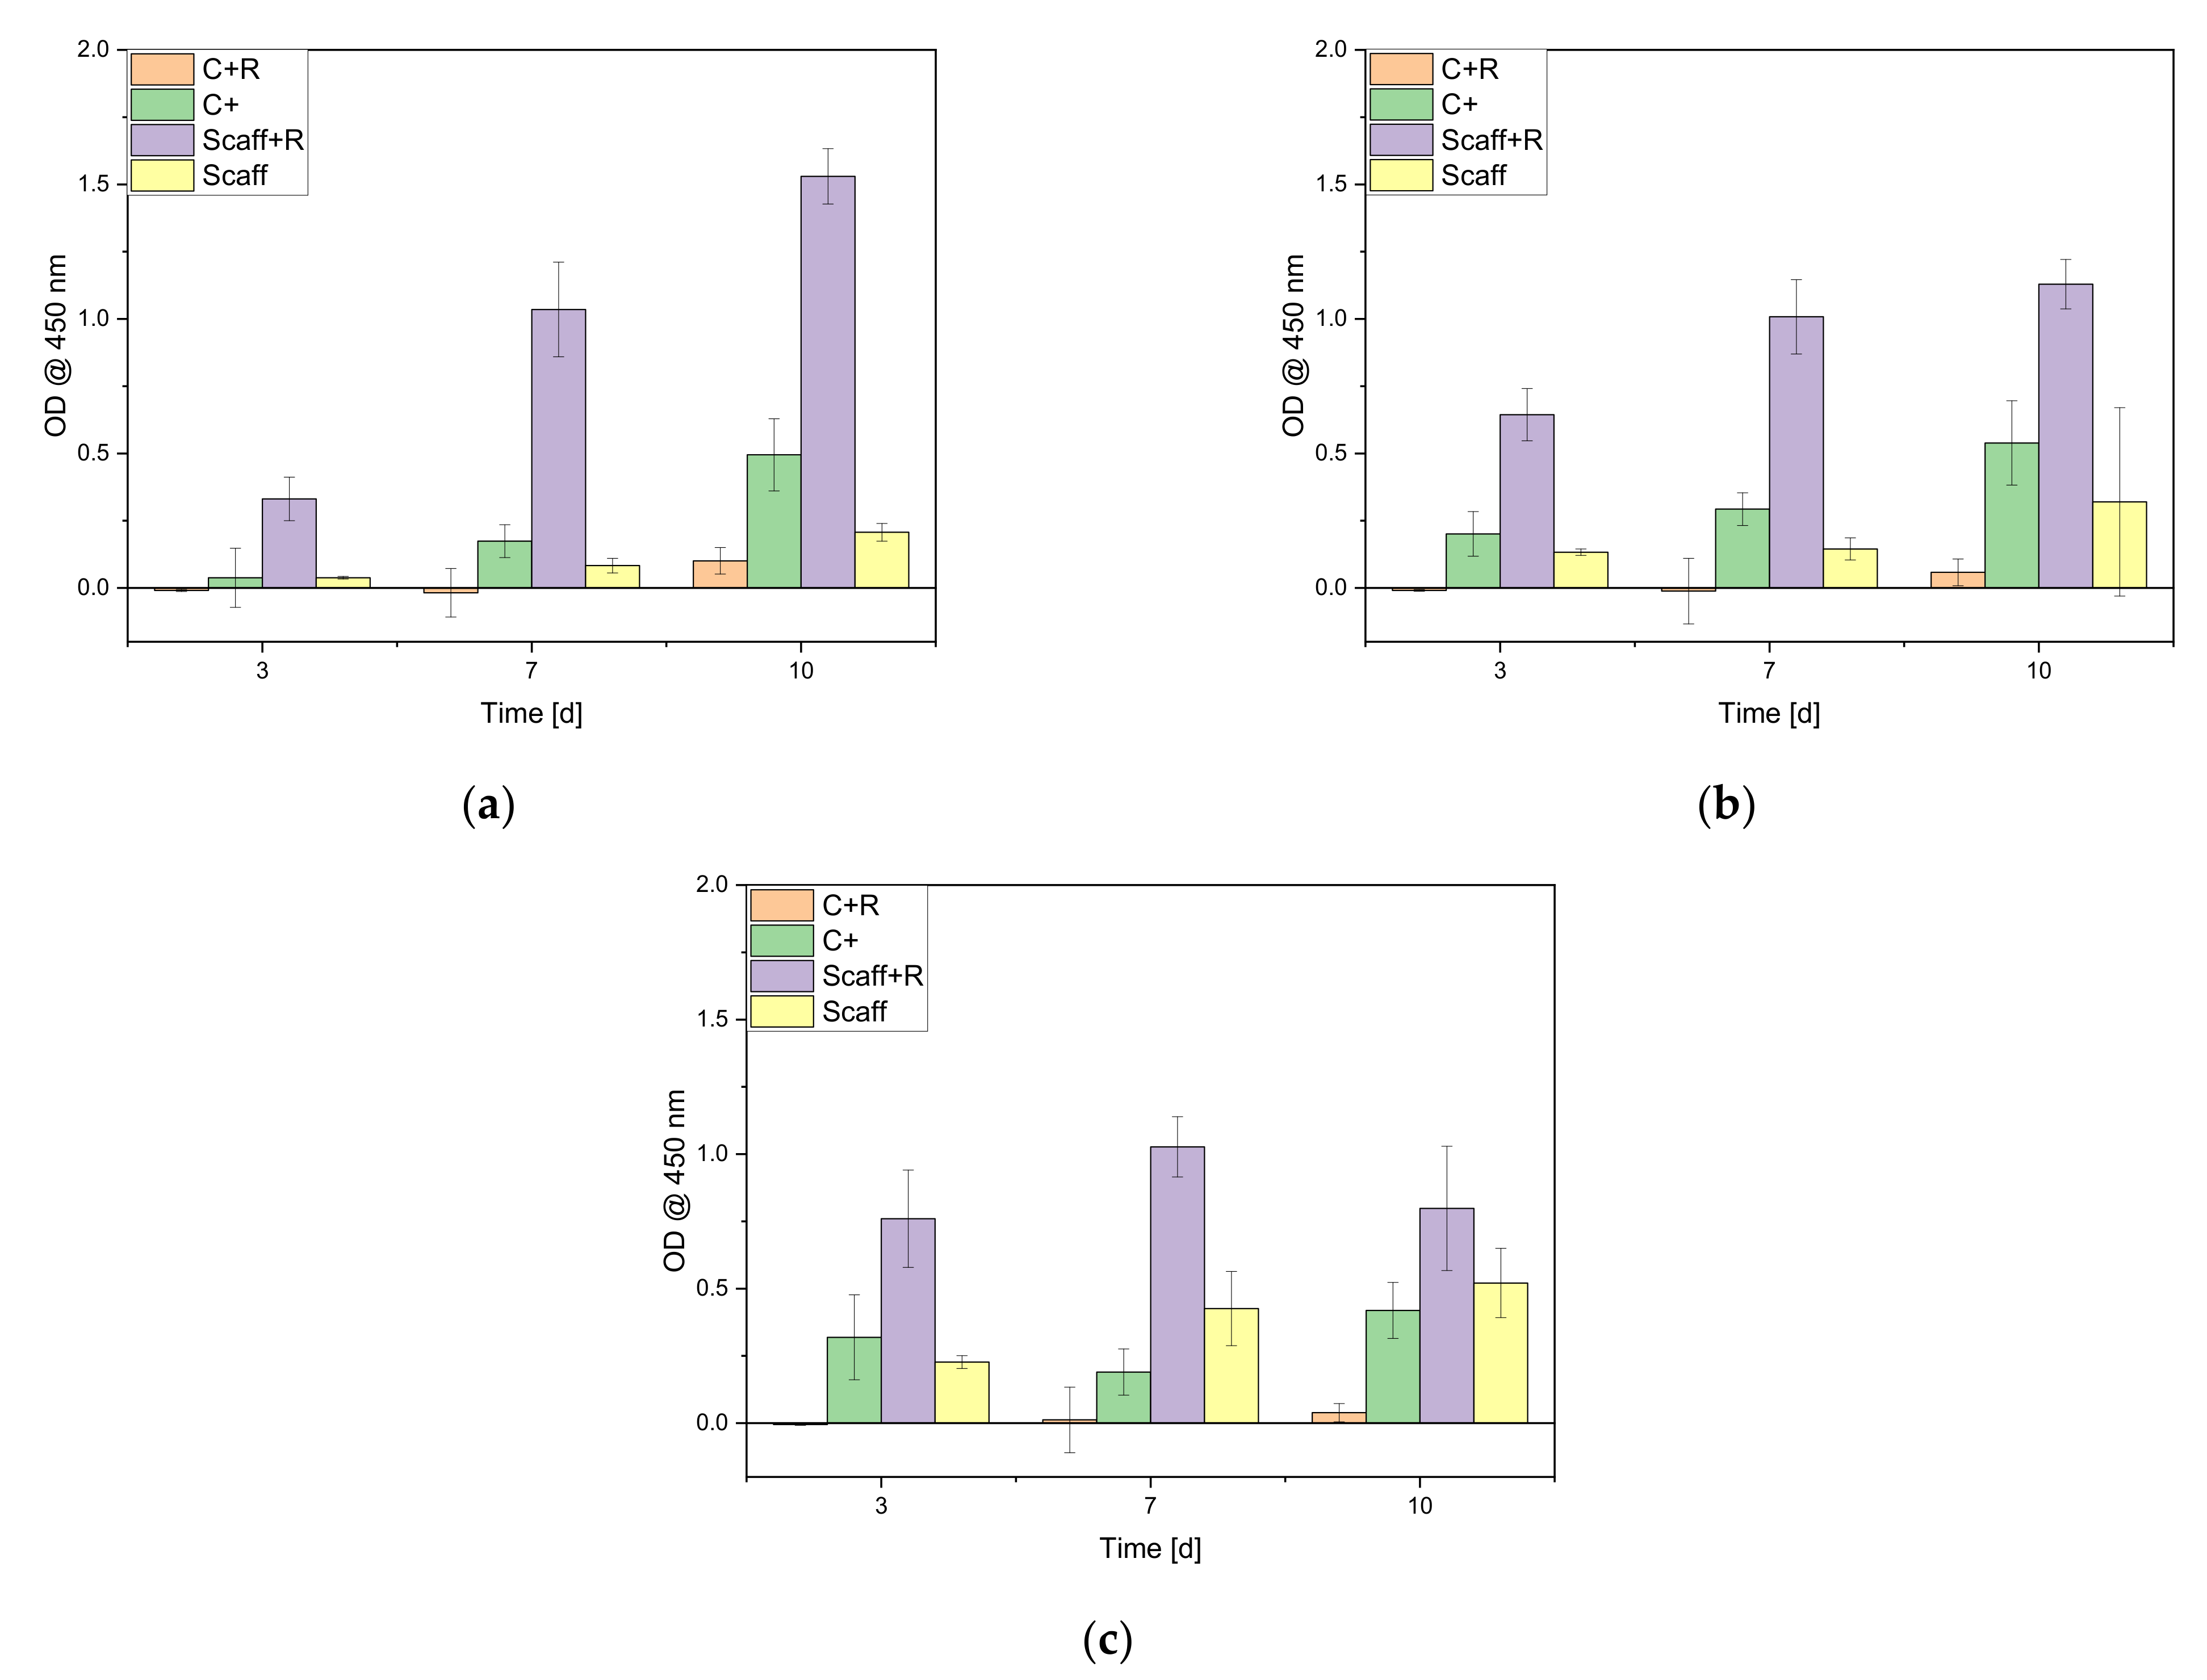
3.2.3. Cell Proliferation Assay

Figure 7 shows the course of proliferation during the ten days of the experiment. In the cell culture plate with the remaining cells (C + R), hardly any proliferation can be seen in all three cell types at any time. Consequently, all cells adhere to the Thermanox membrane (C+). The number of cells remaining in the cell culture plate with the scaffolds (Scaff + R) increases over the experimental period of 10 days. The proliferation rates of the cells on the scaffolds (Scaff) differ. In MG-63 (Figure 7a), proliferation increases steadily over the days, whereas in MLO-Y4 (Figure 7b) it hardly increases from day 7 onwards and even decreases in MSC (Figure 7c). With regard to proliferation on the scaffolds, it can be summarized that proliferation increases for all three cell types in both wells (Scaff and Scaff + R) during the course of the experiment. However, a higher number of cells seem to migrate through the scaffolds in MG-63 and MLO-Y4 than in MSC. Cell proliferation on the scaffolds is highest in the MSC, followed by the MLO-Y4 and the MG-63.

3.3. Mechanical Testings

The determination of the compressive strength of the PCL Scaffolds by means of the ZWICK universal testing machine Z005 according to DIN EN ISO 604 resulted in a value of 68.49 ± 0.47 MPa. As expected, the collagen-I coating had no effect on the compressive strength of the specimens.

4. Discussion

4.1. Sample Characterization

4.1.1. Dimensions

When measuring the strand width of different scaffolds, it was noticed that the width is not always constant (strand width: 234.7 ± 13.91 µm). As a result, there are always minor deviations in the pore size of the scaffolds. The deviations can have a variety of causes, such as the ambient temperature of the printer, an uneven printing substrate (Petri dish) or even a different temperature of the PCL during extrusion. The printer indicates when the printing temperature has been reached, but not whether the PCL has reached the set temperature everywhere in the cartridge. In this work, the minimum waiting time after the start of the heating process was at least 30 min.

4.1.2. Surface Roughness

When measuring the surface roughness, it was found that the crystal size of the cured PCL could have an influence on the roughness. When comparing the crystal sizes, it is noticeable that they are very different. This depends on the crystallization conditions. According to the classical crystallization theory, Koltzenburg et al. [22] describe crystallization in two stages: via nucleation and subsequent growth. The amount of nuclei formed determines how many crystals are formed. Since the polymer chains in the melt are interlocked, crystallization proceeds relatively slowly and can therefore be controlled primarily by the cooling rate. In the case of rapid cooling, a large number of crystallization nuclei form in the material, resulting in many small crystals. In addition, the amount of nuclei can be controlled by so-called nucleating agents. Nucleating agents are substances that can drive the formation of nuclei. The different crystal size in this work could therefore either be due to temperature changes (in the environment, cartridge or platform), or with the cleaning of the printing instruments with chloroform. Smallest residues in the cartridge could change the crystal formation.

4.1.3. Microstructure Analysis via ESEM

In the ESEM images, it became clear that the cells not only adhere to the collagen-PCL surface, but also interact with it. Thus, the MLO-Y4 cells were able to migrate under the collagen coating, while the other cell types remained on the collagen coating.

4.2. Biocompatibility

4.2.1. Live/Dead Assay

All three cell types (MG-63, MLO-Y4 and MSC) were able to adhere well to the scaffolds and proliferate. The proportion of dead cells was at all times significantly lower than the proportion of live cells. On closer inspection, it was noticeable in the MG-63 cells that the proportion of dead cells was highest at 17% on day 3 of the experiment. The days after that, the percentage decreased to about 6% (day 10) and the cells proliferated by leaps and bounds (day 3: 263 cells/mm2, day 10: 1518 cells/mm2). One reason for this could be that the switch (culture flask to scaffold) initially caused a negative reaction for the MG-63 cells [23]. However, after a few days, the cells adapted to the new environment and were thus able to proliferate strongly. The MLO-Y4 cells showed an opposite development. Here, the percentage of dead cells increased from 10% on day 3 to 23% on day 10. The number of MLO-Y4 first increased sharply from day 3 (354 cells/mm2) to day 7 (1174 cells/mm2), but then decreased to 984 cells on day 10. One possible explanation for this could be images of the MLO-Y4 displayed on the ESEM. Moreover, since the MLO-Y4 are able to migrate under the collagen, the area of the scaffold is limited and already completely colonized after 7 d. Fournier et al. [24] also reported MLO-Y4 cells in collagen scaffolds. They could not demonstrate a negative effect of collagen on MLO-Y4 cell number, but an influence of the initial cell number. Overall, the MSC show a similar cell growth behavior to the MLO-Y4. The number of MSC also increases from day 3 (398 cells/mm2) to day 7 (744 cells/mm2) and subsequently decreases to 630 cells/mm2 on day 10. Compared with MLO-Y4, the number of MSC does not increase as much from day 3 to day 7. The proportion of dead cells is very low in MSCs compared to the other two cell types. At day 3, the percentage of dead cells was only 7%, at day 7, 8%, and at day 10, 10%. The decreasing number of MSC may be based on the same cause as for MLO-Y4. Somaiah et al. [25] also report an increase in the MSC cell numbers on collagen coatings.

4.2.2. Cytotoxicity

The LDH test showed that the cells showed a very low LDH activity below 20%. Mondal et al. [26] also reported a low cytotoxicity of less than 5% with collagen hydroxyapatite scaffolds and MG-63 cells. However, they only used an MTT test for their work. Compared to their work, our value is significantly higher, but this may be due to the PCL used. In preliminary tests it was shown that both MG-63 and MLO-Y4 do not grow well on pure PCL. Kim et al. [27] combined PCL with PLGA. No significant cytotoxicity could be determined for them either. However, they were only examined over 48 h using a CCK-8 proliferation kit.

4.2.3. Cell Proliferation

The proliferation rate of the three cell types, with few exceptions, increases steadily over the experimental days. For MG-63, the proliferation rate on the scaffolds increases by approximately 447% from day 3 to day 10. This value correlates with the results from the Live/Dead experiment. Here, a strong increase in cell number was also observed. The proliferation rate on the scaffolds of MLO-Y4 also increased during the course of the experiment. The increase here is approximately 148% from day 3 to day 10. The MSCs have the smallest increase with a proliferation increase of about 130%. This is due to the fact that the proliferation rate, compared to the two other cell types, is already very high on day 3 (see Figure 7). The results from the wells in which the cells were allowed to proliferate under optimal conditions (C+) also correlate with the results from the Live/Dead assay (see Figure 5). A very strong increase in proliferation rate can be seen in MG-63. At day 3, the value was still about 0.3, at day 7 about 1, and at day 10 about 1.5. In comparison, the proliferation rate of MLO-Y4 at day 3 is already high at the beginning with about 0.6 and experiences a stagnation at about 1 from day 7. For MSCs, proliferation is highest at day 3 at 0.76. In the further course, the value increases to approx. 1 (day 7) and subsequently falls to approx. 0.8 on day 10. This trend is similar in the live/dead assay: From day 7 on, the total number of MSC and MLO-Y4 decreases. To provide an indication of whether most of the cells adhered to the scaffolds or “slipped” through the pores, the scaffolds were transferred to a new well after 3, 7 and 10 days. Thus, proliferation of cells on the scaffolds and at the bottom of the well could be measured. For MG-63, it was found that the proliferation rate at the bottom of the well was higher than on the scaffolds. Accordingly, the majority of MG-63s appear to “slip” through the scaffolds. The situation is similar for the MLO-Y4. Again, the proliferation rate at the bottom of the well is higher than on the scaffolds. However, the difference is not as large as in the MG-63 (see Figure 7). The MSC show the best result in the experiment. Here, proliferation on day 3 at the bottom of the well is only minimally higher than on the scaffolds. From day 7 onwards, the proliferation rate on the scaffolds is in some cases significantly higher than on the bottom. In comparison with the other two cell types, the proliferation rate of the MSC is also higher on the scaffolds and thus the adhesion of the MSC to the scaffolds is better (see Figure 7).

4.3. Mechanical Testings

Our scaffold, with a compressive strength of 68.49 ± 0.47 MPa, is slightly below the values for cortical bone obtained by Evans and Vincentelli [28] in regional dependence in Caucasian males in 1974 with values of 89–124 MPa. Auer et al. [29] even discuss a compressive strength of 150 MPa in regard to cortical bone. In an older paper, Evan et al. [30] reported a compressive strength of spongy bone of 11–40 MPa and cortical bone of 85–323 MPa. Compared to these values, the PCL scaffold is right in between—more compressive than cancellous bone, but not quite as compressive as cortical bone.

5. Conclusions

It was shown in this work that it is possible to print scaffolds from the biomaterial PCL using a 3D printer. In addition, it was shown that the scaffolds with a collagen coating are well suited for use in tissue engineering. The cell experiments proved that the cells adhere and proliferate very well to the scaffolds. In the MSC and MG-63, it was also observed that the cells colonize the entire available scaffold surface by spanning the pores. Cell growth within the scaffolds was also investigated. It was clear that the majority of cells colonize the scaffold surface. ESEM images also showed that MLO-Y4 in particular is able to interact with and migrate through the collagen coating. Biocompatibility testing also showed successful results. The cells of all three cell types were able to show an increasing proliferation rate on the scaffolds. For the MSC, the proliferation rate on the scaffolds was mostly higher than next to the scaffolds. Thus, it could be proven that the seeded MSC adhere excellently to the scaffolds. In the further course, the scaffolds were examined for their cytotoxicity. Little to no cytotoxicity was measured for the MLO-Y4 and MSC. For the MG-63, it needs to be clarified in the future what caused the cytotoxicity in the experiment. Despite this, the live/dead and WST experiments showed that the scaffolds are well suited for all three cell types. In conclusion, the collagen-PCL scaffolds are biocompatible and 3D printing with a bio plotter is a suitable method for use in tissue engineering.

Author Contributions

M.S., D.V. and A.B. conceived and designed the experiments; L.W., M.S. and S.H.L. performed the experiments; M.S., L.W. and A.B. analyzed the data; A.B. and H.S. contributed reagents/materials/analysis tools; M.S. and L.W. wrote the paper. All authors critically reviewed the content and approved final version for publication. All authors have read and agreed to the published version of the manuscript.

Funding

This research received no external funding.

Institutional Review Board Statement

Not applicable.

Informed Consent Statement

Not applicable.

Data Availability Statement

The data presented in this study are available on request from the corresponding author.

Acknowledgments

The article processing charge was funded by the Baden-Wuerttemberg Ministry of Science, Research and Art and the University of Freiburg in the funding program Open Access Publishing.

Conflicts of Interest

The authors declare no conflict of interest.

Appendix A

Figure A1. Additional Images: (a): Plasma treatment with Relyon Piezobrush PZ3; (b): fluorescence image of immunoassay on a different position of the scaffold, image taken with fluorescence microscope Olympus BX-53, 100 ms exposure time.
Applsci 11 11063 g0a1

References

  1. Destatis. Mitten im Demografischen Wandel. Available online: https://www.destatis.de/DE/Themen/Querschnitt/Demografischer-Wandel/demografie-mitten-im-wandel.html (accessed on 2 September 2020).
  2. Eurostat. European Union: Age Structure in the Member States in 2019. Available online: https://de.statista.com/statistik/daten/studie/248981/umfrage/altersstruktur-in-den-eu-laendern/ (accessed on 13 March 2020).
  3. Bose, S.; Roy, M.; Bandyopadhyay, A. Recent advances in bone tissue engineering scaffolds. Trends Biotechnol. 2012, 30, 546–554. [Google Scholar] [CrossRef] [PubMed] [Green Version]
  4. Destatis. Gesundheit—Fallpauschalenbezogene Krankenhausstatistik (Drg-Statistik) Operationen und Prozeduren der Vollstationären Patientinnen und Patienten in Krankenhäusern (4-Steller); Statistisches Bundesamt (Destatis): Wiesbaden, Germany, 2020. [Google Scholar]
  5. Eurostat. Surgical Operations and Procedures Statistics; Eurostat: Luxemburg, 2020. [Google Scholar]
  6. Moussa, A.A.; Fischer, J.; Yadav, R.; Khandaker, M. Minimizing Stress Shielding and Cement Damage in Cemented Femoral Component of a Hip Prosthesis through Computational Design Optimization. Adv. Orthop. 2017, 2017, 1–12. [Google Scholar] [CrossRef] [PubMed] [Green Version]
  7. Charles, L.F.; Shaw, M.T.; Olson, J.R.; Wei, M. Fabrication and mechanical properties of PLLA/PCL/HA composites via a biomimetic, dip coating, and hot compression procedure. J. Mater. Sci. Mater. Electron. 2010, 21, 1845–1854. [Google Scholar] [CrossRef] [PubMed]
  8. Li, J.; Chen, M.; Wei, X.; Hao, Y.; Wang, J. Evaluation of 3D-Printed Polycaprolactone Scaffolds Coated with Freeze-Dried Platelet-Rich Plasma for Bone Regeneration. Materials 2017, 10, 831. [Google Scholar] [CrossRef] [PubMed] [Green Version]
  9. Salgado, A.J.; Coutinho, O.; Reis, R.L. Bone Tissue Engineering: State of the Art and Future Trends. Macromol. Biosci. 2004, 4, 743–765. [Google Scholar] [CrossRef] [PubMed] [Green Version]
  10. O’Brien, F.J. Biomaterials & scaffolds for tissue engineering. Mater. Today 2011, 14, 88–95. [Google Scholar] [CrossRef]
  11. Langer, R.; Vacanti, J.P. Tissue Engineering. Science 1993, 260, 920–926. [Google Scholar] [CrossRef] [PubMed] [Green Version]
  12. Rider, P.; Kačarević, Ž.P.; Alkildani, S.; Retnasingh, S.; Schnettler, R.; Barbeck, M. Additive Manufacturing for Guided Bone Regeneration: A Perspective for Alveolar Ridge Augmentation. Int. J. Mol. Sci. 2018, 19, 3308. [Google Scholar] [CrossRef] [PubMed] [Green Version]
  13. Lu, L.; Zhang, Q.; Wootton, D.; Chiou, R.; Li, D.; Lu, B.; Lelkes, P.; Zhou, J. Biocompatibility and biodegradation studies of PCL/β-TCP bone tissue scaffold fabricated by structural porogen method. J. Mater. Sci. Mater. Med. 2012, 23, 2217–2226. [Google Scholar] [CrossRef] [PubMed]
  14. Wang, X.; Jiang, M.; Zhou, Z.; Gou, J.; Hui, D. 3D printing of polymer matrix composites: A review and prospective. Compos. Part B Eng. 2017, 110, 442–458. [Google Scholar] [CrossRef]
  15. Dong, L.; Wang, S.-J.; Zhao, X.-R.; Zhu, Y.-F.; Yu-Fang, Z. 3D- Printed Poly(ε-caprolactone) Scaffold Integrated with Cell-laden Chitosan Hydrogels for Bone Tissue Engineering. Sci. Rep. 2017, 7, 13412. [Google Scholar] [CrossRef] [PubMed] [Green Version]
  16. Rezwan, K.; Chen, Q.; Blaker, J.; Boccaccini, A.R. Biodegradable and bioactive porous polymer/inorganic composite scaffolds for bone tissue engineering. Biomaterials 2006, 27, 3413–3431. [Google Scholar] [CrossRef] [PubMed]
  17. Murphy, S.V.; Atala, A. 3D bioprinting of tissues and organs. Nat. Biotechnol. 2014, 32, 773–785. [Google Scholar] [CrossRef] [PubMed]
  18. Percoco, G.; Uva, A.E.; Fiorentino, M.; Gattullo, M.; Manghisi, V.M.; Boccaccio, A. Mechanobiological Approach to Design and Optimize Bone Tissue Scaffolds 3D Printed with Fused Deposition Modeling: A Feasibility Study. Materials 2020, 13, 648. [Google Scholar] [CrossRef] [PubMed] [Green Version]
  19. Zhang, L.; Yang, G.; Johnson, B.N.; Jia, X. Three-dimensional (3D) printed scaffold and material selection for bone repair. Acta Biomater. 2019, 84, 16–33. [Google Scholar] [CrossRef] [PubMed]
  20. Karageorgiou, V.; Kaplan, D. Porosity of 3D biomaterial scaffolds and osteogenesis. Biomaterials 2005, 26, 5474–5491. [Google Scholar] [CrossRef] [PubMed]
  21. Anderson, D.G.; Putnam, D.; Lavik, E.; Mahmood, T.A.; Langer, R. Biomaterial microarrays: Rapid, microscale screening of polymer–cell interaction. Biomaterials 2005, 26, 4892–4897. [Google Scholar] [CrossRef]
  22. Koltzenburg, S.; Maskos, M.; Nuyken, O. Polymere: Synthese, Eigenschaften und Anwendungen, 1st ed.; Springer Spektrum: Berlin/Heidelberg, Germany, 2014. [Google Scholar] [CrossRef]
  23. Huang, T.; Gong, W.; Li, X.; Zou, C.; Jiang, G.; Li, X.; Feng, D. Enhancement of osteosarcoma cell sensitivity to cisplatin using paclitaxel in the presence of hyperthermia. Int. J. Hyperth. 2013, 29, 248–255. [Google Scholar] [CrossRef]
  24. Fournier, R.; Harrison, R.E. Methods for studying mlo-y4 osteocytes in collagen-hydroxyapatite scaffolds in the rotary cell culture system. Connect. Tissue Res. 2020, 62, 436–453. [Google Scholar] [CrossRef]
  25. Somaiah, C.; Kumar, A.; Mawrie, D.; Sharma, A.; Patil, S.D.; Bhattacharyya, J.; Swaminathan, R.; Jaganathan, B.G. Collagen Promotes Higher Adhesion, Survival and Proliferation of Mesenchymal Stem Cells. PLoS ONE 2015, 10, e0145068. [Google Scholar] [CrossRef] [Green Version]
  26. Mondal, S.; Hoang, G.; Manivasagan, P.; Moorthy, M.S.; Phan, T.T.V.; Kim, H.H.; Nguyen, T.P.; Oh, J. Rapid microwave-assisted synthesis of gold loaded hydroxyapatite collagen nano-bio materials for drug delivery and tissue engineering application. Ceram. Int. 2019, 45, 2977–2988. [Google Scholar] [CrossRef]
  27. Kim, T.-H.; Yun, Y.-P.; Park, Y.-E.; Lee, S.-H.; Yong, W.; Kundu, J.; Jung, J.W.; Shim, J.-H.; Cho, D.-W.; Kim, S.E.; et al. In vitro and in vivo evaluation of bone formation using solid freeform fabrication-based bone morphogenic protein-2 releasing PCL/PLGA scaffolds. Biomed. Mater. 2014, 9, 25008. [Google Scholar] [CrossRef] [PubMed]
  28. Evans, F.; Vincentelli, R. Relations of the compressive properties of human cortical bone to histological structure and calcification. J. Biomech. 1974, 7, 1–10. [Google Scholar] [CrossRef] [Green Version]
  29. Auer, J.A.; von Rechenberg, B.; Bohner, M.; Hofmann-Amtenbrink, M. Chapter 77—Bone Grafts and Bone Replacements. In Equine Surgery, 4th ed.; Auer, J.A., Stick, J.A., Eds.; W.B. Saunders: Saint Louis, MO, USA, 2012; pp. 1081–1096. [Google Scholar] [CrossRef]
  30. Evans, F.G.; Lissner, H.R. Tensile and Compressive Strength of Human Parietal Bone. J. Appl. Physiol. 1957, 10, 493–497. [Google Scholar] [CrossRef] [PubMed]
Figure 1. Overview of the 3D printed Scaffolds; (a): CAD model; (b): two layers of the 3D printed scaffold, image taken directly while printing from the Envisiontec 3D Bioplotter; (c): 3D Laserscan Image of the scaffolds; (d): 3D reconstruction of the 3D lasaerscanning microscopy data.
Applsci 11 11063 g001
Figure 2. Comparison of surface roughness of (a): uncoated (b): collagen coated PCL scaffolds; images taken with KEYENCE VK-X210 3D Laserscanning microscope.
Applsci 11 11063 g002
Figure 3. ESEM Images of the PCL scaffolds; (a): uncoated PCL; (b): collagen coated PCL (arrow); (c): MG-63 cells (blue arrows) on collagen coated PCL scaffolds; (d): MLO cells (red arrows) on collagen coated PCL scaffolds and (e): MSC (white arrows) on collagen coated PCL scaffolds; the cells were cultivated for 3 days on the scaffolds prior to ESEM measurements; Images taken with ESEM FEI Quanta 250 FEG, Large Field Detector, 20 kV acceleration voltage; 130 Pa; HFW 373 µm (Figure 3a 746 µm).
Applsci 11 11063 g003aApplsci 11 11063 g003b
Figure 4. Fluorescense Images of (a): uncoated PCL scaffolds; (b): collagen-I coated PCL scaffolds; immunoassay with Alexa Fluor 488 (excitation at 495 nm (blue), emission 519 nm (green); Images taken with Olympus BX 53 Fluorescense Microscope, 10x magnification; (c): ESEM image of collagen-I coated scaffold Magnification 6400x (HFW 46.6 µm); (d):enlargement of a specific area of the ESEM image (red square in Figure 4c) of the collagen-I coating 12800x (HFW 23.3 µm), ESEM images taken with FEI Quanta 250 FEG with Large Field Detector, 10 kV acceleration voltage; 130 Pa.
Applsci 11 11063 g004
Figure 5. Comparison of total, living and dead cells of three different cell types (MG-63, MLO-4 and MSC) on the surface of the collagen coated PCL scaffolds at 3 different time points, images taken with Olympus BX-53 flourescense microscope.
Applsci 11 11063 g005aApplsci 11 11063 g005b
Figure 6. Cytotoxicity of the collagen-coated PCL scaffolds at defined times for the 3 different cell lines; neg. control = cells only; pos. control = Triton X.
Applsci 11 11063 g006
Figure 7. Overview over the cell proliferation assays for the 3 different cell types; (a): MG-63; (b): MLO-Y4; (c): MSC; C + = Positive control/cells on Thermanox, Scaff = Cells on scaffold; C + R = remaining cells in the control cell culture plate, Scaff + R = Remaining cells in the TCP sample cell culture plate.
Applsci 11 11063 g007
Table 1. Parameters for 3D Printing.
Needle Inner DiameterTemperaturePressureSpeedNoffPre-/PostflowPlatform Temperature
550 µm80 °C4.0 bar1.0 mm/s0.17 mm0.7 mm/s18 °C
Table 2. Size, weight and strand width of the 3D printed PCL scaffolds (n = 15).
Length [mm]Width [mm]Height [mm]Weight [mg]Strand Width [µm]Strand Spacing [µm]
8.53 ± 0.038.55 ± 0.032.08 ± 0.0274.27 ± 3.39234.7 ± 13.91258.75 ± 9.62
Table 3. Number of all cells or dead cells, and percentage of dead cells for three different cell lines (MG-63, MLO-Y4, MSC).
MG-63 Cells
Analysis Time [d]Total [Cells/mm2]Dead [Cells/mm2]Percentage Dead Cells [%]
3263 ± 21944 ± 2917
7881 ± 11863 ± 317
101518 ± 25890 ± 356
MLO-Y4 Cells
3354 ± 16937 ± 1010
71174 ± 754192 ± 14616
10984 ± 546223 ± 18923
MSC
3398 ± 14027 ± 67
7744 ± 8958 ± 188
10630 ± 8061 ± 710
Publisher’s Note: MDPI stays neutral with regard to jurisdictional claims in published maps and institutional affiliations.

