Article

CO2 Capture by Reduced Graphene Oxide Monoliths with Incorporated CeO2 Grafted with Functionalized Polymer Brushes

by
Nikolaos Politakos
1,*,
Luis Serrano Cantador
2,
Juan Antonio Cecilia
3,
Iranzu Barbarin
1 and
Radmila Tomovska
1,4
1
POLYMAT, Facultad de Ciencias Químicas, University of the Basque Country UPV/EHU, Joxe Mari Korta Zentroa, Tolosa Etorbidea 72, 20018 Donostia-San Sebastián, Spain
2
BioPren Group, Inorganic Chemistry and Chemical Engineering Department, Faculty of Sciences, University of Cordoba, 14014 Cordoba, Spain
3
Inorganic Chemistry, Crystallography and Mineralogy Department, University of Malaga, 29071 Malaga, Spain
4
Ikerbasque, The Basque Foundation for Science, Maria Diaz de Haro 3, 48013 Bilbao, Spain
*
Author to whom correspondence should be addressed.
Submission received: 21 October 2021 / Revised: 10 November 2021 / Accepted: 20 November 2021 / Published: 24 November 2021

Abstract

:
The monolithic materials of reduced graphene oxide (rGO) can be used successfully in CO2 adsorption. Here, the incorporation of CeO2 particles with and without polymer brushes grafted from the particles showed that the structural properties could be changed, affecting the adsorption of CO2. Polymer brushes of (1) poly(acrylic acid) (PAA), (2) poly(vinyl caprolactam) (PVCL) and (3) poly[(2-(methacryloyloxy)ethyl) trimethylammonium chloride] (PMETAC) were grafted from CeO2 via reversible addition−fragmentation chain transfer (RAFT) polymerization. The preparation of monoliths of rGO with different modified CeO2 particles led to different thermal properties (TGA), structural changes (BET isotherms) and CO2 adsorption. The responsive character of the CeO2@polymer was proven by the DLS and UV results. The responsive character of the particles incorporated into the rGO monolith affected not only the adsorption capacity but also the microstructure and values of the surface volume of the pores of the monolith. Monoliths with porosity values for better adsorption were affected by the responsive character of the polymer.

1. Introduction

In the last few decades, one of the critical primary issues that has remained a significant challenge is climate change. The use of fossil fuels in an excessive way leads to the increased production of greenhouse gasses (mainly CO2) that contribute to climate change. It is eminent that reducing CO2 coming from human activities is one of the most important factors that might contribute to decreasing this effect [1].
CO2 can be selectively captured at emission points (industries) and afterward either stored (Carbon Capture and Storage (CCS)) or reutilized as a raw material. The main approaches for reversible capture can be categorized as (1) the use of liquid adsorbents and (2) the use of solid adsorbents [2]. The reutilization of CO2 in a more useful raw material or for energy has been gaining ground in the last few decades. CO2 can be reduced with photocatalysis to CH3OH, CH4 and CO [1,3]. Even though other methods for conversion have been explored, the photocatalytic one is considered a promising one [4]. Other studies show that CO2 can also be used for the production of chemicals such as urea, ethylene carbonate, salicylic acid [5], carbonic acid diesters (contributing to the substitute for phosgene) [6], formic acid, formaldehyde, higher hydrocarbons and oxygenates [7].
Current technologies for CO2 are based on capturing CO2 from largely exhausted flue gasses by employing amine-based regenerative chemical absorption using aqueous amines. This process has high efficiency for CO2 capture. However, it is energy-intensive, complex and requires a high-energy input for regenerating and handling the corrosive solvents resulting from amine-based solutions’ oxidation. This separation technique utilizes certain temperatures. One of the challenges for the solvent-based system is to decrease its energy consumption for solvent heating. Thus, solid adsorbents appeared to be promising candidates. Solid adsorbents have a smaller specific heat capacity than liquid solvents, which can decrease the heat requirements and energy consumption for CO2 capture. Toward this direction, research in various porous materials with fine structural and chemical properties has been widely investigated. Some currently proposed materials are zeolites, activated carbon, amine-modified silica materials and metal organic frameworks [8]. Adsorbents such as zeolites and amine-modified mesoporous materials may not be the most suitable materials for capturing high concentrations of CO2 under high-pressure conditions [8,9]. All the previous materials are currently in use or under investigation for CO2 adsorption and photocatalysis. The development of stable, highly efficient and low-cost photocatalysts, especially for visible light application, is significant in bringing this technique to the market [4].
What is considered a good solution for catalytic reactions with a wide range of applications in catalysis is rare earth oxides. These oxides have unique catalytic and optical properties. Stable and nontoxic cerium oxide (CeO2) has been widely used as a photoactive material in solar cells and as a photocatalyst [1]. Cerium is the most abundant rare earth element (0.0046 wt% in the Earth’s crust) as a metal that has low toxicity, excellent chemical stability and a high surface-to-volume ratio. Moreover, it is used in many fields such as low-temperature oxidation, absorption, alcohol-to-oxygen conversion, solid fuel cells and wastewater treatment [4]. Furthermore, photocatalytic activity can be synergistically enhanced by doping cerium, as the redox couple Ce3+/Ce4+ can be transferred between Ce2O3 and CeO2 through either oxidation or reduction [4,10]. CeO2 is a material that can be used in various catalytic reactions [3]. One of its most important advantages is the rich oxygen vacancies that have been proven to display the superior photocatalytic activity used in the energy and environmental fields [3,4,11]. Numerous reports of different catalytic reactions exist in the literature where CeO2 can be a part of dehydration [12] or even in CO2 adsorption and catalysis. Specifically for CO2, it can be found that it can be reduced to CH3OH [13] and CH4 [4]. CeO2 can capture CO2 [5] similarly to other oxides (SiO2, Al2O3 and ZrO2) [14], and in the case of CeO2, it can also happen at room temperature, where CO2 can adopt different configurations [2]. Finally, CeO2 can participate in heterogeneous catalysis with alcohols or amines, showing selectivity to organic carbonates in the reaction of CO2 with alcohols but without the formation of ethers by the intermolecular dehydration of alcohols [7].
Even though CeO2 is a material with fascinating properties, it also has certain limitations, especially in catalysis. The CeO2 particles show low surface area ratios, quick deactivation during the catalytic reactions [12], rapid recombination of electron–hole pairs and low-efficiency utilization of photons [4]. It is quite understandable that for catalytic reactions with CeO2, the specific surface area must be increased. Furthermore, a material that can act as a supporting bed for the catalytic particles should be used with significant consideration. In the literature, many materials can be used in heterogeneous catalysis, and graphene is considered one of the most important. Graphene has a high surface area and can form monolithic structures via hydrothermal green techniques in a relatively straightforward manner [15,16]. Combining metallic catalysts with graphene-based materials, such as rGO, is promising and can support highly dispersed metallic catalysts [17]. These monolithic composite structures will add a high specific surface area, low pressure drops and excellent mechanical and thermal stability compared with those of the corresponding particulate catalysts [4,12].
There are some examples in the literature in which CeO2 particles were combined with reduced graphene oxide or graphene for different applications [3,10,18,19,20,21,22]. Even though it can be a potential composite for CO2 adsorption and a possible photocatalyst for its reuse, the synthesis of monolithic structures of rGO with CeO2 is not well studied, especially in terms of functionalization and its effect on the interactions with CO2. The study of monoliths with this type of particle is not present in the literature.
In this work, the objective is to prepare monolithic structures of rGO with CeO2 nanoparticles and polymer brushes grafted “from” the surface of the particles. The monolithic materials are studied in terms of porosity and structure to investigate the CO2 adsorption and how the capacity is affected by the initial particles of CeO2 compared with the ones with polymer brushes. The polymer brushes were synthesized from (1) poly(acrylic acid) (PAA), (2) poly(vinyl caprolactam) (PVCL), and (3) poly[(2-(methacryloyloxy)ethyl) trimethylammonium chloride] (PMETAC) (Scheme 1). A range of composite monoliths were synthesized—rGO monolith (G), rGO/CeO2 (GCe), rGO/CeO2/PAA (GCePA), rGO/CeO2/PVCL (GCePV), and rGO/CeO2/PMETAC (GCePM)—that offered the possibility to study the effect of different functional polymers inside a monolith on the CO2 adsorption. The use of polymer brushes with different responses in different environments, such as pH, can show other aggregations of the particles with the polymer brushes. Thus, it can also affect the preparation of the monolith with the addition of particles with different functionalities and responses.

2. Materials and Methods

2.1. Materials

Graphene oxide (GO) in an aqueous dispersion of 4 mg/mL with a monolayer content >95% was purchased from Graphenea (Spain). The elemental analysis of GO showed C: 49–56%, H: 0–1%, N: 0–1%, S: 2–4%, and O: 41–50%. To reduce the GO, L-ascorbic acid (AsA) or vitamin C (≥99.0%, Sigma-Aldrich) was used. Nanoceria was purchased from Evonik Degussa GmbH (Essen, Germany) and used without purification. For the polymer brushes, the reagents used were purchased all from Aldrich: acrylic acid (AA) 99%, [2-(Methacryloyloxy)ethyl] trimethylammonium chloride (METAC) solution (75 wt% in H2O), N-Vinylcaprolactam 98% (NVCL), (3-Aminopropyl)triethoxysilane (APTES) 99%, 4,4′-Azobis(4-cyanovaleric acid) ≥98.0% (CVA) (initiator), and Bis(carboxymethyl)trithiocarbonate 98% (change transfer agent (CTA)).

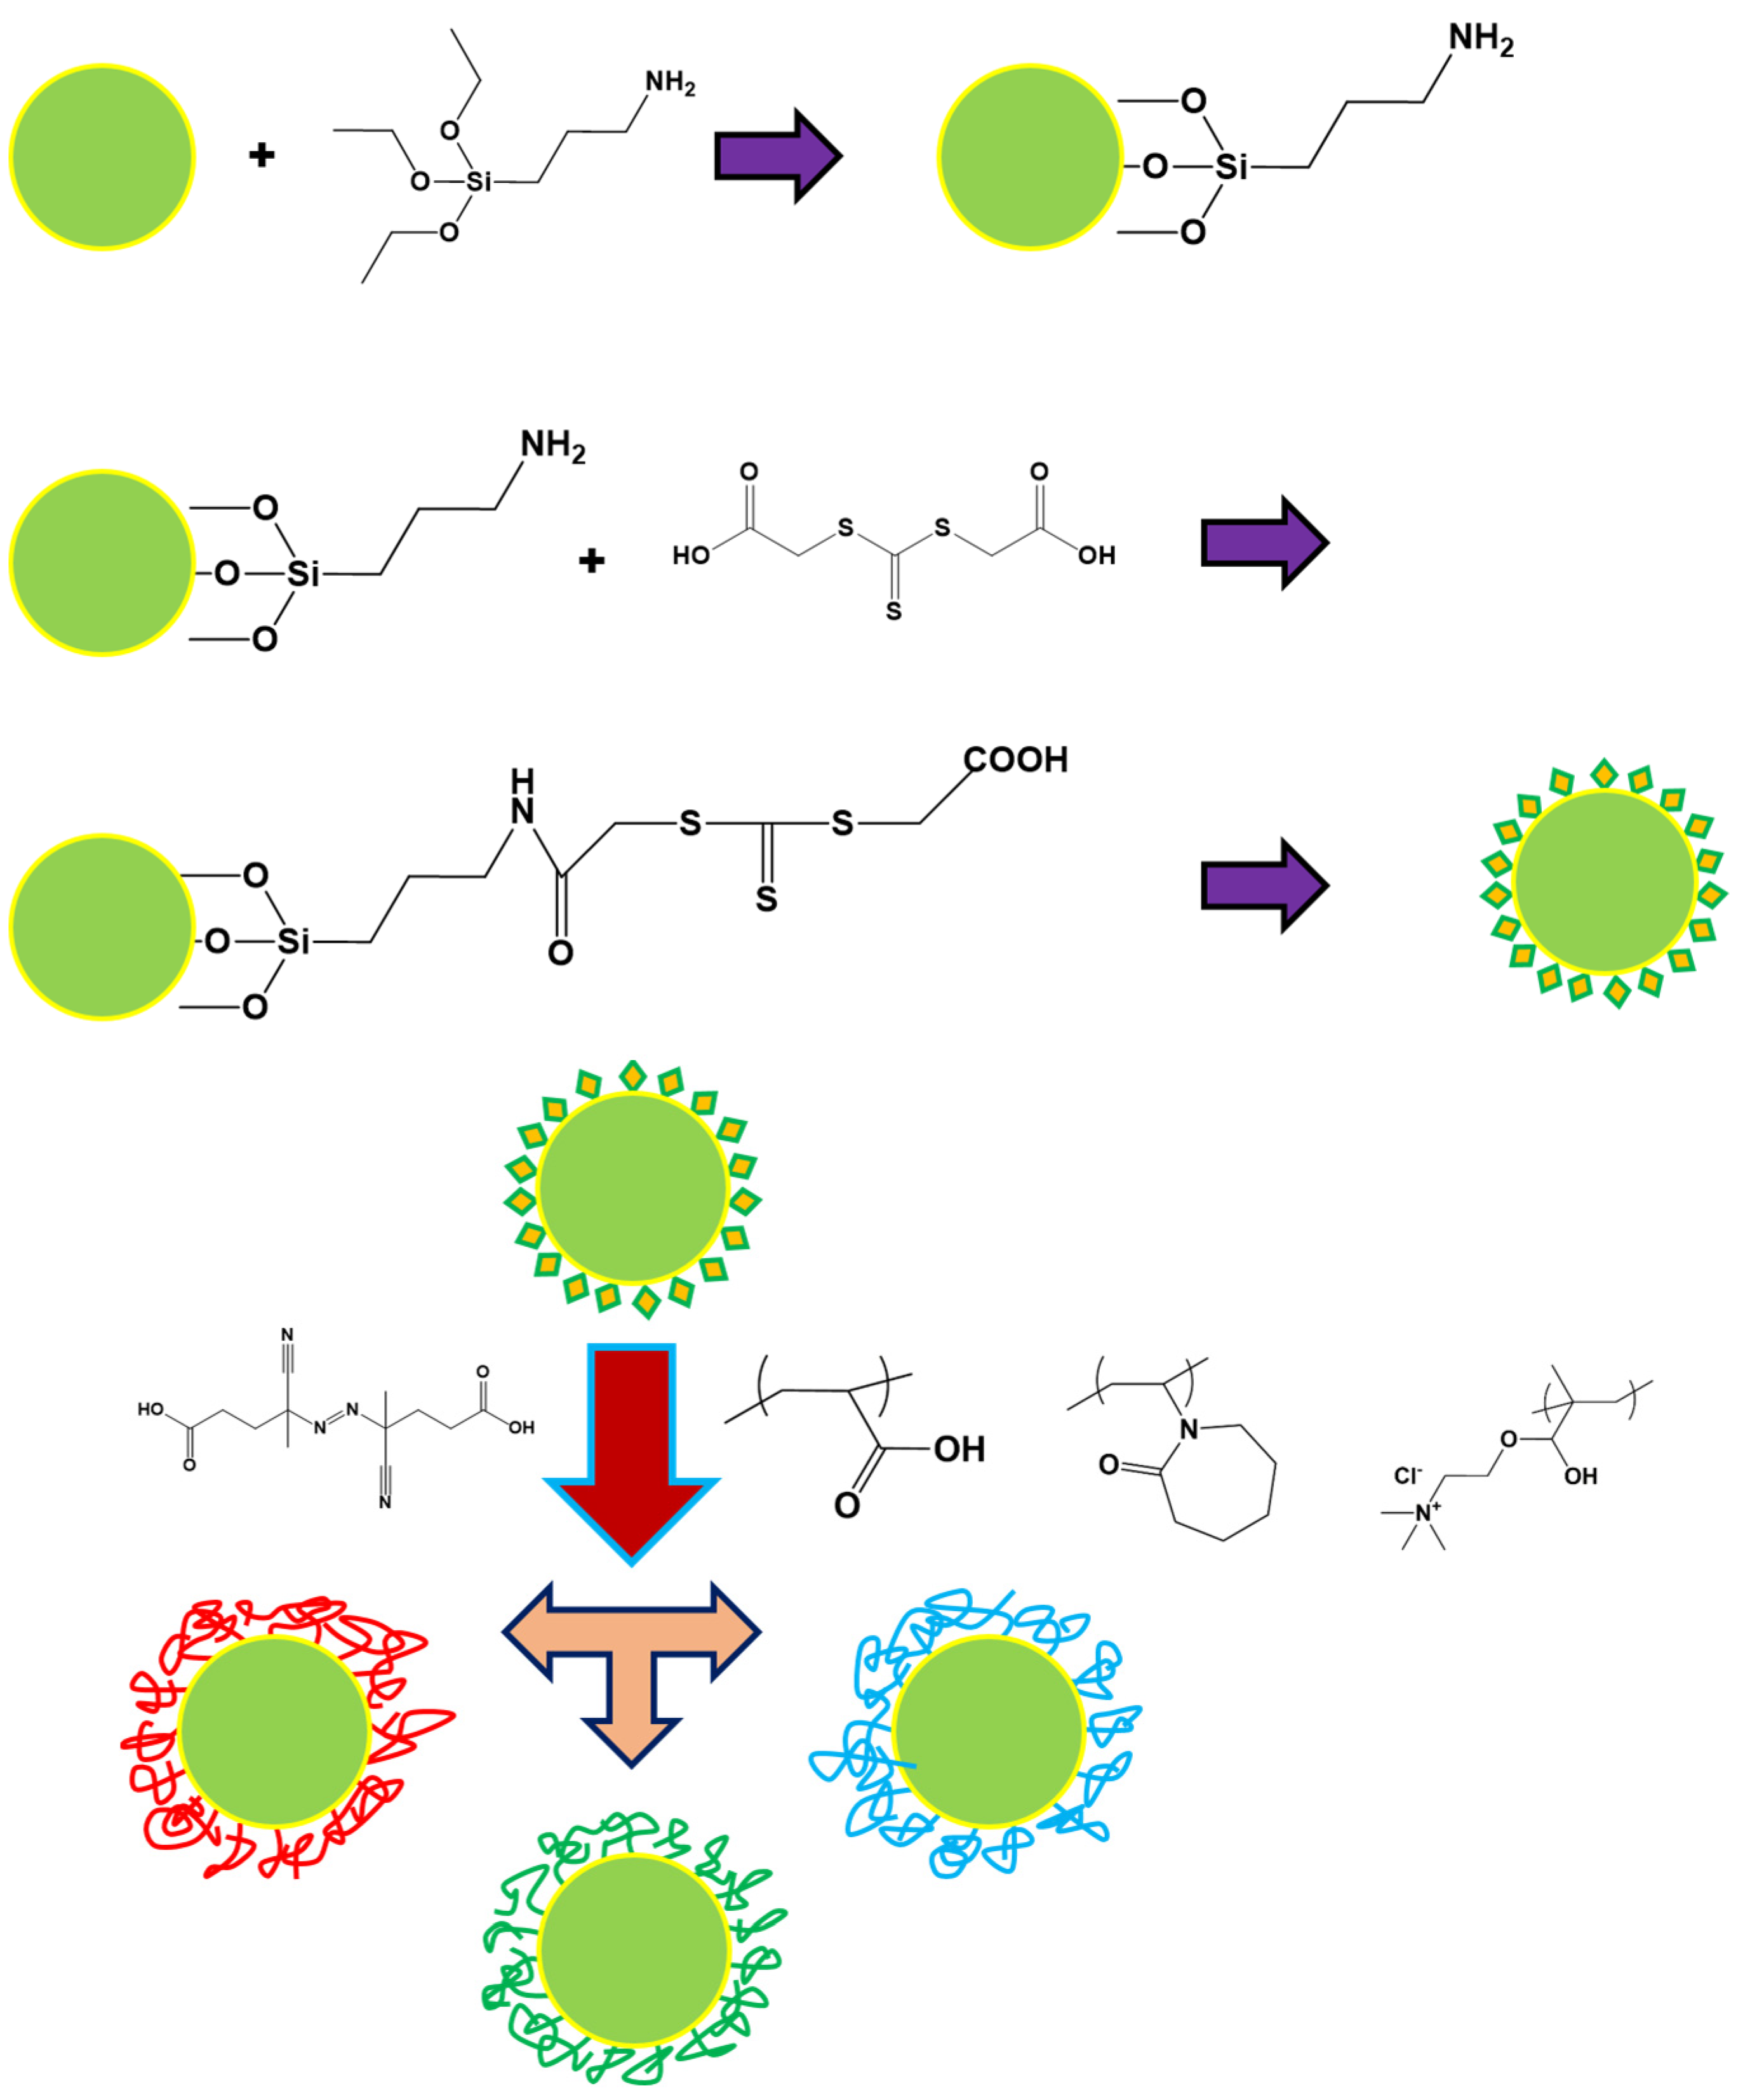
2.2. Synthesis of the Polymer Brushes from CeO2

The synthesis of polymer brushes from CeO2 is described elsewhere [23]. Briefly, APTES was used for the silanization of the particles. By this reaction, -NH2 groups were introduced to the particles. APTES in toluene at 70 °C in toluene for 12 h was used (2 g of nanoceria and 4.08 ml of APTES in 1% w/v of solvent). The introduced amino groups would serve as an anchoring point for the CTA. The polymer brushes were synthesized from the surface via the RAFT polymerization technique. After the anchoring of the CTA to the amino groups of the surface’s particles via carbodiimide chemistry, RAFT was conducted using each monomer with CVA as the initiator at 70 °C under an inert atmosphere. Dimethylformamide (DMF) used as a solvent (or DMF/water 60/40 in the case of METAC) for ~12 h of polymerization. The concentration of nanoceria used was ~1% w/v to the polymerization solvent. The steps of the RAFT polymerization can be found in Figure 1.

2.3. Synthesis of the Composite Monolith

The preparation of the monoliths is described elsewhere [24]. Briefly, the particles were left stirring in water overnight (1 wt%) and then were sonicated for 1 h. Inside the dispersion of the particles, an appropriate amount of GO was added and sonicated for another 1 h to establish strong interactions between the GO and CeO2. The analogy of GO:particles was kept at a ratio of 7:3 in terms of mass. After sonication, the mixture was left under stirring for 2.5 h at 80 °C. Then, the solution was left to come to room temperature, and the appropriate amount of AsA (the same quantity in weight as the GO, GO:AsA, 1:1) was added and left stirring at room temperature for 30 min. Then, the solution was placed in the oven at 60 °C for completing the reduction. The composite monoliths were cleaned by the dialysis process and dried by the freeze-drying process. A schematic of the preparation of the composite monoliths can be found in Figure 2.

2.4. Characterization

The surface morphology of the monolithic composites was examined using scanning electron microscopy (SEM) with a Hitachi TM3030 tabletop model (Krefeld, Germany) at an accelerating voltage of 15 kV after the samples were coated with a thin gold layer. The thermal stability of the samples was studied using a TGA500 (TA Instruments). Samples of approximately 2 mg were heated in the air with a range of 25–700 °C (heating rate of 10 °C/min). Transmission electron microscopy (TEM) was used to determine the formation of polymer brushes from CeO2. A dilute solution (4 wt%) in water was cast on 300-mesh copper grids. Characterization was performed using a Tecnai G220 Twin (FEI) microscope operating at an accelerating voltage of 200 keV in bright field image mode.
The N2 adsorption-desorption isotherms at −196 °C were measured by using an automatic ASAP 2020 system (Micromeritics) to determine the textural properties of the monoliths. Before the measurements, the samples were outgassed overnight at 110 °C and 10−4 mbar. The specific surface area was estimated using the BET equation and considering a N2 cross-section of 16.2 Å2. The microporosity of the samples was determined using de Boer’s t-plot method. The CO2 adsorption capacity of the materials was determined based on their CO2 isotherms, measured using a Micromeritics ASAP 2020 analyzer (i.e., volumetrically) at 25 °C. Before the measurements, the samples were outgassed at 110 °C and 10−4 mbar until complete outgassing was achieved.
FTIR measurements were conducted with a Thermo Scientific™ Nicolet™ iS20 FTIR spectrometer at room temperature, with a spectra resolution better than 0.25 cm−1 and 32 scans from 500 cm−1 to 4000 cm−1. The GPC-SEC was measured with a Shimadzu instrument with a PDA 190-nm detector with an OHpak SB-803 HQ column connected with an OHpak SB-G6B precolumn with a flow rate of 1 mL/min. PEG standards were used for analyzing the molecular weights. UV measurements were conducted in a plate reader from BioTek (Synergy Neo2 Hybrid multi-mode reader). The sizes of the CeO2 particles were measured using a DLS instrument (Zetasizer Nano S, Malvern Instruments, Malvern, UK) equipped with a laser beam (633 nm) scattered from a sample at an angle of 173°. The z-average was calculated by three measurements that were analyzed in 10 runs of 10 s each. All measurements were conducted at 25 °C.

3. Results

3.1. Characterization of Bare and Grafted CeO2 Particles

Initially, the characterization of the particles (CeO2) with the polymers was analyzed to verify the synthesis of the polymer brushes from the particles and their properties. In this section, the (1) morphological characterization (TEM and SEM/EDX), (2) spectroscopic characterization (FTIR and UV), and (3) molecular-thermal characterization (DLS, Z potential, TGA, and GPC) will be presented.

3.1.1. Morphological Characterization

TEM was used to see the differences of the modified nanoparticles, with the polymer brushes compared with the initial CeO2. In Figure S1, the images of all samples can be seen. Out of Figure S1, no clear image of the polymer brushes can be seen compared with the initial particles.
In Figure 3, the mapping of the elemental analysis of these precursors can be seen, where the Ce and O are marked with red and blue, respectively, and other organic elements such as C or N are marked with black.
As seen via the mapping images, the contrast for the samples with polymer brushes was quite different compared with the initial CeO2 particles. The darker patches found in the samples with polymer brushes indicate organic matter (in this case, polymer). Out of the EDX analysis, the percentage of Ce was calculated to be 80.9% for the initial particles, and then it changed to 70.3%–77.7%–81.5% (+PAA–+PNVCL–+PMETAC). The important parameter here is the increase in elemental oxygen, with a value 10.3% (initial CeO2) increasing to 15.6%–14.2%–11.3% (+PAA–+PNVCL–+PMETAC) because of the presence of O atoms in the polymer structures. This can also be seen as the blue color increases in the mapping of the samples with polymer brushes.

3.1.2. Spectroscopic Characterization

Here, the characterization via FTIR and UV will be presented to recognize specific chemical groups and evaluate the polymer shell from the particles. In Figure 4, the highlighted areas of all materials in comparison with the bare particles of CeO2 are presented. Moreover, the complete spectra can be found in Figure S2.
The FTIR results clearly demonstrate the successful synthesis of the polymer brushes. First, in the area of 3800–2800 cm−1 (Figure 4a), the stretching vibration of the OH groups can be seen (3400–3300 cm−1) (Figure 4a) [25,26,27]. In addition, the peak centered at 2985 cm−1 (Figure 4a) was assigned to C-N+ stretching vibration. In the same area, C-H symmetric and asymmetric stretching was found at 2950–2900 cm−1 (Figure 4a) [28,29,30]. The presence of C-H moieties in the composites, while they were absent in the bare CeO2, is the first indication of the presence of polymer brushes in the composite particles.
The second highlighted area is 2000–1000 cm−1 (Figure 4b), where most of the peaks can be found. The characteristic C=O of the polymers can be seen in the area of 1600–1650 cm−1 (Figure 4b), which is slightly different compared with other works [28,29,30,31]. At the area 1500–1600 cm−1 (Figure 4b), the bands found for the composite particles originated from the CTA grafted on the surface of the nanoparticles, since N-H (1570 cm−1), C(O)-NH (1580 cm−1), and C=O (1620 cm−1) were present in the structure (Figure 4b). For CeO2, some low-intensity peaks were also present in the area of 1700–1300 cm−1 (Figure 4b). Based on what can be seen in the literature, these bands were related to OH group (1630 cm−1) (Figure 4b) stretching vibrations, which were associated with the residual water molecules or physically adsorbed OH groups on the surfaces of the CeO2 [32]. Another explanation is that these bands (1295, 1386, 1471, and 1587 cm−1) were attributed to the surface adsorbed carbonates [33], arising out of the synthetic procedure of the particles. It can also be seen that these peaks did not have the same maximum as the ones in the same area for the composite samples with the polymers. In the same area, at 1464 cm−1 (Figure 4b), the -CH2- scissoring vibration for the sample with PAA was found [31], as well as the bending C-H (1470 cm−1) for the sample with PNVCL and the -CH2- (1476 cm−1) for the case of PMETAC (Figure 4b). In addition, an essential point for the presence of polymers was a broad band centered at 1390–1290 cm−1 (Figure 4b), since this band is absent in the spectra of bare particles. Furthermore, in the spectra of the composite particles, there was the presence of bands that were absent in the bare particles in the area of 1200–1100 cm−1, which was related to Si-O-Si (1180 cm−1, the APTES anchored to the surface of the particles), C-O (1169 cm−1, PMETAC), and C-N (1180 cm−1, PNVCL) (Figure 4b). The CeO2 had a characteristic peak found lower at around 1060 cm−1 (Figure 4b) for the Ce-O-Ce that was also present in the polymer samples [25,26,27].
Finally, in the last area highlighted (1000–600 cm−1) (Figure 4c), two crucial bands appear, with the first at 950–900 cm−1 only for composite particles with C-H bending vibrations (absent for the CeO2), whereas the peak centered at 700–680 cm−1, characteristic for Ce-O, was present in all samples.
Moreover, the UV technique was used to find the differences between the samples with polymer brushes and the initial CeO2 in different pHs (acidic at pH 4, neutral at pH 7, and basic at pH 10). The different functional polymers grafted on the bare particles can lead to different responses in different pH levels, which can be seen in Figure 5.
The CeO2 showed a maximum absorption of around 302–303 nm [34,35] or 350 nm [36]. The differences observed were because of the size of the particles obtained at different pH levels during synthesis. The environment can alter the absorbance maximum. It can lead to a bathochromic shift (red shift) when the maximum shifts to longer wavelengths or hypsochromic shift (blue shift) when the maximum shifts to shorter wavelengths. Many parameters can affect the shifting, like conjugation, steric hindrance, and changes in pH. In the case of acidic molecules, a change through acidic to basic conditions generally leads to red shifting, but the other parameters have to be taken into consideration. In addition, the red shift can be found in the presence of a high amount of hydrogen bonds [37].
From the UV absorbance results (Figure 5), it can be seen that the bare CeO2 particles showed a blue shift in the absorbance compared with the composite particles for all three different pHs. This was something that was expected, since the chemical environment of the particles changed from the presence of the polymers. When studying the case of the bare CeO2, the pH affected the nanoparticles, as a blue shift (from 340 nm to 306 nm) was observed when the synthesis was performed at neutral conditions with respect to the acidic one. Then, for the basic synthesis conditions, a small red shift was observed (from 306 nm to 310 nm). These changes were likely induced by the size alterations of the CeO2 particles because of the dominant presence of Ce4+ oxygen charge transfer occurring on the low-coordination Ce4+ ions [25,38]. Ce3+ tends to release into the solution if the pH is less than three, causing the particles to reductively dissolve and shrink but be retained in the nanoparticles if the solution is less acidic. For particles of any size, nearly every metal ion at the surface can be reduced [39].
In the case of CeO2@PAA, it can be seen that through acidic to neutral and basic pHs, the shift was also blue, meaning that the maximum decreased from 344 nm to 329 nm to 314 nm. This can be expected due to the lower amount of hydrogen bonding, which decreases for the PAA chains when the pH increases. At a low pH, the predominant forces have an associative behavior that changes to repulsive electrostatic at a high pH. The conformational changes of the PAA chains affect the size and aggregation of the particles with PAA, which has an impact on the maximum [40].
Similar behavior was observed for CeO2@PNVCL; the maximums were blue shifted from 345 nm to 330 nm to 314 nm, again arising from the hydrogen bonding and structural changes derived from the CeO2.
Moreover, for the case of CeO2@PMETAC, there was a blue shift again via acidic pH from 342 nm to 314 nm at a basic pH (the absorbance in the neutral pH was almost not detectable). The blue shift is connected with the interparticle distance that changes with the pH [41].
Finally, at all pH conditions, the maximum with polymer brushes was always at longer wavelengths, meaning a red shift occurred, which was related to the change of the chemical environment of the CeO2 due to the presence of the polymer brushes.

3.1.3. Molecular-Thermal Characterization

In this part, characterization of the size and z-potential of the samples with DLS and the z-potential was conducted. Moreover, the grafting density of the polymer brushes was investigated with TGA. GPC was used in order to study the molecular weight of the polymer brushes from the surface. In Figure 6, the TGA results can be found, and in Table 1, the results obtained from the techniques mentioned earlier can be seen.
From Figure 6, the grafting density of the polymer brushes was calculated, and it is presented in Table 1. It can be seen that the initial particles were pretty stable during the whole range of TGA until 800 °C, and they lost less than 0.15% of their initial mass. The samples with polymer brushes had similar behavior but were distinct from the initial particles. It can be seen that they lost between 0.6 and 1% of their mass until 100 °C (that is, the water molecules that were absorbed out of the hydrophilic polymers). At 800 °C, after removing the percentage that originated from the humidity, the grafting density of the polymer brushes could be calculated via TGA. It was found that PAA was grafted in 5.83%, PNVCL was grafted in 6.09%, and PMETAC was grafted in 6.08%.
From the DLS and z potential, interesting results could be found for the sizes of the particles in different pH levels. Moreover, the changes of the z potential could be seen when the particles were modified with polymer brushes. In Figure S3, the size distributions for the different samples can be seen.
From Table 1 and Figure S3, the alteration of the sizes by changing the pH can be seen, as well as the z potential of these samples. For the sizes, it can be seen that the samples with polymer brushes had a wider size distribution compared with the initial particles. Moreover, by changing the pH, the aggregation of the particles was different, showing different agglomeration. As expected, CeO2@PAA’s average size decreased when increasing the pH. The particles’ size was 50% lower. This can easily be explained because of the conformation of the PAA chains as they adopted a globular conformation at a low pH and tended to aggregate. In a basic pH, the conformation was extended, and the particles tended to not aggregate due to electrostatic repulsion. Thus, smaller populations were observed (Figure S3 for CeO2@PAA). The opposite effect was observed for the particles of CeO2@PMETAC, where at an acidic pH, the chains were extended and showed smaller populations (Table 2 and Figure S3). The particles of CeO2@PNVCL also showed changes in size when measured at different pH levels. These changes were attributed to further aggregation of the particles. From the TGA (Figure 6), a grafting of around 6% for all polymer brushes could be seen, and that means that the CeO2 particles would affect the aggregation and the z potential, since the coverage was not entirely on the surface.
For the z potential, the CeO2 showed negative potential as expected, as did the CeO2@PAA, with both at around −25.4 mV and −21.3 mV, respectively. For the CeO2@PNVCL and CeO2@PMETAC, the z potential became less negative, with values of −6.99 mV and −0.14 mV, respectively. In addition, the results were not as positive as expected for the sample with PMETAC. It is believed that this was related to the amount of polymer brushes covering the surface. The low grafting density found via TGA and the results from the z potential could help conclude that the polymer brushes on the surface of the particles created a type of patch, namely patches with polymer brushes and parts without, which were just the bare surface of the CeO2.

3.2. Characterization of rGO/CeO2/Polymer Monoliths

In this section, the results for the composite materials are presented for the rGO/CeO2-(GCe), rGO/CeO2/PAA-(GCePA), rGO/CeO2/PVCL-(GCePV), and rGO/CeO2/PMETAC (GCePM). The morphology (SEM/EDX), thermal stability (TGA), porosity (N2 adsorption), and CO2 adsorption of these materials are characterized.

3.2.1. SEM/EDX

In Figure 7, the images of all samples studied by SEM can be seen in two different magnifications: 2000× and 500×.
In Figure 7, it can be seen that all the materials exhibited a different porous morphology not only because of the CeO2 nanoparticles, but also because of the different polymer brushes. In the case of GCePV and GCePM, white particles dispersed in a gray rGO porous structure could be observed, likely representing the CeO2 particles. In the case of GCePA, the difference compared with the GCe was based on the edges of the self-assembled rGO sheets that seemed to have a different roughness and compactness. In order to depict these materials better, EDX mapping was performed, and their elemental percentages could be seen. These results are presented in Figure 8 and Table 2.
It can be seen (Figure 8 and Table 2) that the percentages of the elements changed when the particles with polymer brushes were added to the rGO monolith. The percentage of Ce was in the range of 3.7–6.7%. For the case of S, a small percentage was also detected (0.1–0.7%). The S was found due to synthetic reasons, namely the polymer brushes with the CTA agent grafted on the particles. A slight increase in N was also found for the samples that had N in their molecular formulas (samples with PNVCL and PMETAC). Most important was the increase in the O content, since all polymers had extra O atoms in their structures (PAA had two, PNVCL had one, and PMETAC had two). Therefore, 11.2% of the O at the initial monolith with CeO2 was almost tripled for the GCePA sample (31.8%) and doubled for the GCePM sample (21.7%), and it was also relatively higher in the GCePN sample (17.0%). This could also be verified by mapping these monoliths (Figure 8), where the GCePA and GCePM samples showed a greener color (the one attributed to O) in the mappings.

3.2.2. TGA

TGA was used for the thermal characterization of the monolithic materials, as can be seen in Figure 9.
Out of the TGA results, it can be seen that the composites with polymers had lower thermal stability than the samples with only CeO2, as was expected. All samples could maintain more than 80% of their mass until 350 °C. The samples with PAA and PMETAC degraded more, and in the end, they lost more of their mass (Figure 9). At 800 °C, the GCe lost 22.6%, the GCePN lost 24.6%, the GCePM lost 33.7% and the GCePA lost the most of its mass (45.1%). Small mass losses could be seen at around 100 °C, which were attributed to the water absorbed in the monolithic mass. The sample without any polymer just lost 2.2%, while the monoliths with PMETAC and PNVCL lost similar amounts (3.8% and 4.2%, respectively). Again, the higher water amount lost was for the sample with PAA, since it is quite hydrophilic, and this percentage was 7.4%, as can be found in Figure 9. In general, the sample with PNVCL was always more stable thermally in all the temperature ranges than the other two polymers. For the case of monoliths with PAA and PMETAC, from room temperature to 300 °C, the GCePM is more stable than the GCePA. Then, there was a shift, and the GCePA is more stable thermally and stabilized until there was a big drop in its mass at 750 °C. Finally, after the shift at 750 °C, the GCePM showed less mass lost at the end of the TGA.

3.2.3. N2 Adsorption-Desorption

To better understand the structural properties and porosity of these materials, experiments of N2 adsorption-desorption were conducted. In Table 3, these results can be found.
According to the adsorption isotherms (Figure 10), an increase in the N2 adsorbed at a high relative pressure could be observed, indicating a high microporosity. The morphologies found via SEM could be directly connected with the adsorptions. It seems that the GCe had a higher specific surface area (SSA) compared with the other monoliths. It is interesting to see that the addition of polymer brushes to CeO2 particles led to different SSAs. This could be expected since the polymers affect how particles are aggregated and thus dispersed inside the monolith. This is already something that can be extracted from the SEM images in Figure 7, where the monolithic structures are different. Based on the results presented, it can be found that the different polymeric brushes affected the structuring of the monoliths differently. The addition of PAA in CeO2 led to almost half of the SSA compared with the GCe. In addition, the total pore volume was affected, showing a lower total volume than the GCe. This can also be seen from the higher average pore size of the GCePA sample, which increased by 23%. We can hypothesize that the addition of PAA on the CeO2 led to monoliths that had less volume but with broader pore sizes. In the other two cases of GCePN and GCePM, the SSA was smaller but closer to that of the GCe. The pore volume among the monoliths with the other polymers of PNVCL and PMETAC have a very similar value and close to sample GCe The average pore size was relatively smaller for the GCePN than GCePA but still higher than that of the GCe. Interestingly, the GCePM monolith had very similar characteristics to the GCe. The SSA was very close to the total pore volume, and the average pore size was the same.
The other important part of these results is the micropore percentage (volume area) of these monoliths. The GCePM sample had the highest percentage in the volume of micropores (7.0%) but also one of the smallest percentages in the area (9.9%). The other three monoliths had very similar micropore percentages in terms of volume, ranging from 5.1 to 5.6%. Differences were observed when these percentages were calculated for the area of the micropores; GCe had 11.1%, and then the sample with GCePA had the highest at 13.2%. For the sample, GCePN had the smallest one at 7.4%. The combination of the micropore percentage (volume and area) and the total pore volume with the average pore size would create a different pore system that could influence CO2 adsorption. For sure, an impact would also have the different functionalities of the decorated CeO2 particles.
In Figure 10, the adsorption-desorption isotherms of all four monoliths can be found, where the hysteresis typical for mesoporous materials was obviated.
In Figure 10, it can be seen that the GCe, GCePN, and GCePM monoliths had an H3 hysteresis loop typical for slit-shaped pores. In contrast, for the GCePA monolith, the hysteresis loop was more similar to H4, which is typical for narrow, slit-shaped pores [42,43]. This difference could also affect the adsorption of CO2, since the pore structure was different among the monoliths. In Figure 11, the determination of the micro-mesopores out of the t-plots, determined as the incremental pore volume vs. pore width, can be seen.
From Figure 11, it can be seen that the incremental pore volume was quite similar for all monoliths. We determined the micro-mesoporous nature of the materials with the t-plot graph versus the quantity adsorbed out of the monolith (Figure 11a). For a non-porous material, the graph line was straight, while the microporous material had a downward deviation, and the mesoporous material deviated upward. In this study, the last case was the one for a micro-mesoporous material, where a straight line was actually cutting the graph in two [44].

3.2.4. CO2 Adsorption

The monoliths prepared were tested for CO2 adsorption. In Figure 12, the adsorption isotherms can be seen.
The adsorption capacities of all materials ranged from 0.50 mmol/g to 0.64 mmol/g. It can be seen that the highest adsorption was for the GCePN monolith (the one with PNVCL) and was 0.64 mmol/g, while the lower adsorption could be found for GCePM (0.50 mmol/g). The trend in the adsorption corresponded to the trend of the total pore volume, which in this case showed the most important factor affecting the adsorption capacity. The adsorption capacity of the pure monolith (rGO) had a value of 0.5 mmol/g (results not shown here), as has been studied in previous work [15]. It can be seen that almost all monoliths with CeO2 particles showed better adsorption than the pure monolith, except for GCePM.
The materials presented different adsorption capacities at a lower pressure, which is also crucial for applications with low CO2 pressure (Figure 12b).
Different parameters should be taken into account apart from their porous properties by analyzing the gas adsorption data. It is imperative to mention that CO2 is an acidic gas and that each monolith is inside an acidic environment. The monoliths with different polymer brushes will have different behavior inside the acidic CO2, since acidity affects the conformation of the brushes. These conformations will impact the CeO2, which has different polymers on its surface. Inside the monoliths, the particles can have its surface exposed less or more, due to the presence of the acidic gas and its effect on the brushes. Finally, the different functional groups of the polymer brushes and their affinity with the gas should be considered. The presence of polymer brushes will offer extra functionalities for the oxygen groups (of different chemical bonding) and extra heteroatoms.
The nature of the solid surface and the specific surface area strongly influences the adsorption capacity [45]. Depending on the character of the solid surface (alkaline or acidic), the specific surface area can have more or less influence, helping with the adsorption of CO2. Someone will expect that alkaline material will give an extra boost to the adsorption [45]. The presence of CeO2 inside the graphitic monolith and the level of exposure of the surface of the CeO2 is also noteworthy. These particles are used in catalysis, since they show a unique oxygen storage capacity and can store and release oxygen reversibly (switching the following Ce4+ to Ce3+). The degree of high oxygen ion mobility is strongly associated with the size, dispersion, and abundancy of oxygen vacancy defects [46]. Dispersion of particles is strongly connected with their aggregation, due to polymer brushes that also affect the abundance of the oxygen defects. The different densities of the polymer brushes on the ceria will lead to more or less active positions for catalysis. The CeO2 surface is known for adsorbing CO2 and creating different types of carbonates [47]. These carbonates are hydrogen carbonate, bidentate carbonate, monodentate carbonate, and bridged carbonate [48].
Another important aspect is the affinity of specific chemical groups toward CO2. In general, the introduction of oxygen atoms facilitates hydrogen bonding with the CO2 [49]. Moreover, groups like -COOH will improve the affinity toward CO2 significantly [50]. The different amines also offer different affinities, depending on their chemistry. Primary, secondary, and then final tertiary amines show a high affinity toward CO2 [51]. Finally, the capacity is also favored by the ester groups [52]. In PAA, the functional group is -COOH; for the PNVCL, it is R1-N-R2-R3 and the ketone R1-C(O)-R2; and for the PMETAC, it is the ester R1-C(O)-O-R2 and -N+R3.
By comparing the results for the CO2 adsorption, functionalities, and porosity values, it can be concluded that this is a complex procedure where many parameters can affect the final adsorption. For the GCePN monolith, it can be said that it had the highest total pore volume below 0.75 nm where CO2 was adsorbed. In addition, it had the highest percentage of N atoms and a relatively high SSA. The slight basic character of the ketone [53] present in the PNVCL also had a positive aspect for this material. The low oxygen functionality and the almost-zero value for the zeta potential show that the particles were not fully covered with the polymeric chains, which probably helped the particles become exposed and offer active sites for CO2 adsorption. The GCe monolith did not have relatively high elemental functionalities but did have a high SSA and the highest total pore volume, leading to an extensive porous network that helped CO2 be adsorbed. The GCePA sample had the highest O functionality and a relatively high total pore volume below 0.75 nm. This monolith probably had the highest coverage of the polymeric chains that would likely be affected more by the acidic nature of the CO2, leading to the possible globular conformation of the polymeric chains. All this combined led to relatively medium-to-high adsorption compared with the poor properties found in the N2 adsorption-desorption technique, the initial monolith (lowest total pore volume and SSA), and via the H4 hysteresis loop showing narrow, slit-shaped pores. Finally, the GCePM showed the lowest adsorption, which could explain the medium values in almost all the characterization techniques. These included a low total pore volume below 0.75 nm, medium O functionality, and the -N+R3 group that did not help the adsorption, since CO2 is practically neutral.

4. Conclusions

The preparation of different polymeric brushes from CeO2 particles was investigated as the first aim of this work. In particular, brushes of PAA, PNVCL, and PMETAC were grafted from CeO2. Different characterization methods showed the successful synthesis of the polymers (FTIR, GPC, Z potential, and TGA).
The materials mentioned above were used to prepare rGO monoliths for studying their adsorption capacities compared with monoliths with only CeO2 particles. The initial differences in the morphology of the SEM images revealed a different structure by changing the type of particles used. The adsorption-desorption with N2 showed that these materials had different microporosities, SSAs, and total pore volumes only by changing the introduced particle type. The differences in the average pore diameter and the other parameters related to pores showed that these particles aggregated differently during the preparation of the monoliths. This can also affect their porosity and subsequently the adsorption. The hysteresis type revealed an H3 hysteresis loop typical for slit-shaped pores for almost all materials, except the GCePA monolith. In the latter case, the hysteresis loop was similar to H4, typical for narrow, slit-shaped pores.
Finally, the adsorption of CO2 revealed that the monoliths with superior SSAs and total pore volumes did not show better adsorption. Instead, the samples with different functionalities (different chemical groups) could also significantly influence adsorption. The GCePN monolith showed higher adsorption, having a lower SSA than the monolith with the initial CeO2. Moreover, the GCePA monolith also showed similar results to GCe, with an SSA and total pore volume far lower than those for GCe. The acidity of the CO2 also played a role in the final adsorption, since it could probably affect the conformation of the particles covered with polymers that could have structural changes inside the acidic pH of the gas.

Supplementary Materials

The following are available online at https://0-www-mdpi-com.brum.beds.ac.uk/article/10.3390/app112311154/s1. Figure S1: TEM images of the initial CeO2 nanoparticles and with the different polymer brushes; Figure S2: FTIR of all spectra from top to bottom for (a) CeO2, (b) CeO2@PAA, (c) CeO2@PNVCL and (d) CeO2@PMETAC; Figure S3: DLS size distribution by intensity for all samples and in all three pHs (4, 7 and 10).

Author Contributions

Conceptualization, N.P.; methodology, N.P.; formal analysis, N.P., L.S.C., J.A.C. and R.T.; investigation, N.P., L.S.C., J.A.C. and I.B.; resources, R.T., L.S.C. and J.A.C.; data curation, N.P., L.S.C. and J.A.C.; writing—original draft preparation, N.P.; writing—review and editing, N.P., L.S.C., J.A.C. and R.T.; project administration, N.P. and R.T.; funding acquisition, R.T. All authors have read and agreed to the published version of the manuscript.

Funding

This research was funded by the Basque government, grant number GV IT999-16.

Institutional Review Board Statement

Not applicable.

Informed Consent Statement

Not applicable.

Data Availability Statement

Data are contained within the article or Supplementary Material.

Conflicts of Interest

The authors declare no conflict of interest.

References

  1. Ijaz, S.; Fahad Ehsan, M.; Naeem Ashiq, M.; Karamat, N.; He, T. Preparation of CdS@CeO2 core/shell composite for photocatalytic reduction of CO2 under visible-light irradiation. Appl. Surf. Sci. 2016, 390, 550–559. [Google Scholar] [CrossRef]
  2. Slostowski, C.; Marre, S.; Dagault, P.; Babot, O.; Toupance, T.; Aymonier, C. CeO2 nanopowders as solid sorbents for efficient CO2 capture/release processes. J. CO2 Util. 2017, 20, 52–58. [Google Scholar] [CrossRef] [Green Version]
  3. Liang, M.; Borjigin, T.; Zhang, Y.; Liu, B.; Liu, H.; Guo, H. Controlled assemble of hollow heterostructured g-C3N4@CeO2 with rich oxygen vacancies for enhanced photocatalytic CO2 reduction. Appl. Catal. B Environ. 2019, 243, 566–575. [Google Scholar] [CrossRef]
  4. Wang, H.; Guan, J.; Li, J.; Li, X.; Ma, C.; Huo, P.; Yan, Y. Fabricated g-C3N4/Ag/m-CeO2 composite photocatalyst for enhanced photoconversion of CO2. Appl. Surf. Sci. 2020, 506, 144931. [Google Scholar] [CrossRef]
  5. Yang, C.; Bebensee, F.; Chen, J.; Yu, X.; Nefedov, A.; Wöll, C. Carbon Dioxide Adsorption on CeO2(110): An XPS and NEXAFS Study. ChemPhysChem 2017, 18, 1874–1880. [Google Scholar] [CrossRef] [PubMed]
  6. Yoshida, Y.; Arai, Y.; Kado, S.; Kunimori, K.; Tomishige, K. Direct synthesis of organic carbonates from the reaction of CO2 with methanol and ethanol over CeO2 catalysts. Catal. Today 2006, 115, 95–101. [Google Scholar] [CrossRef]
  7. Tomishige, K.; Tamura, M.; Nakagawa, Y. CO2 Conversion with Alcohols and Amines into Carbonates, Ureas, and Carbamates over CeO2 Catalyst in the Presence and Absence of 2-Cyanopyridine. Chem. Rec. 2019, 19, 1354–1379. [Google Scholar] [CrossRef]
  8. Yoshikawa, K.; Kaneeda, M.; Nakamura, H. Development of Novel CeO2-based CO2 adsorbent and analysis on its CO2 adsorption and desorption mechanism. Energy Procedia 2017, 114, 2481–2487. [Google Scholar] [CrossRef]
  9. Liu, G.; Tatsuda, K.; Yoneyama, Y.; Tsubaki, N. Synthesis of mesoporous cerium compound for CO2 capture. E3S Web Conf. 2017, 22, 00106. [Google Scholar] [CrossRef] [Green Version]
  10. Liu, F.; Wang, X.; Zhang, L.; Persson, K.M.; Chen, B.-Y.; Hsu, Y.; Chang, C.T. Near-visible-light-driven noble metal-free of reduced graphene oxide nanosheets over CeO2 nanowires for hydrogen production. J. Taiwan Inst. Chem. Eng. 2020, 107, 139–151. [Google Scholar] [CrossRef]
  11. Yang, S.-C.; Su, W.-N.; Rick, J.; Lin, S.D.; Liu, J.-Y.; Pan, C.-J.; Lee, J.-F.; Hwang, B.-J. Oxygen Vacancy Engineering of Cerium Oxides for Carbon Dioxide Capture and Reduction. ChemSusChem 2013, 6, 1326–1329. [Google Scholar] [CrossRef] [PubMed]
  12. Chen, Y.; Wang, H.; Qin, Z.; Tian, S.; Ye, Z.; Ye, L.; Abroshan, H.; Li, G. TixCe1−xO2 nanocomposites: A monolithic catalyst for the direct conversion of carbon dioxide and methanol to dimethyl carbonate. Green Chem. 2019, 21, 4642–4649. [Google Scholar] [CrossRef]
  13. Kumari, N.; Sinha, N.; Haider, M.A.; Basu, S. CO2 Reduction to Methanol on CeO2 (110) Surface: A Density Functional Theory Study. Electrochim. Acta 2015, 177, 21–29. [Google Scholar] [CrossRef]
  14. Yoshikawa, K.; Sato, H.; Kaneeda, M.; Kondo, J.N. Synthesis and analysis of CO2 adsorbents based on cerium oxide. J. CO2 Util. 2014, 8, 34–38. [Google Scholar] [CrossRef]
  15. Politakos, N.; Barbarin, I.; Serrano Cantador, L.; Cecilia, J.A.; Mehravar, E.; Tomovska, R. Graphene-Based Monolithic Nanostructures for CO2 Capture. Ind. Eng. Chem. Res. 2020, 59, 8612–8621. [Google Scholar] [CrossRef]
  16. Politakos, N.; Barbarin, I.; Cordero-Lanzac, T.; Gonzalez, A.; Zangi, R.; Tomovska, R. Reduced Graphene Oxide/Polymer Monolithic Materials for Selective CO2 Capture. Polymers 2020, 12, 936. [Google Scholar] [CrossRef] [PubMed] [Green Version]
  17. Franchini, C.A.; Llorca, J.; Kuznetsov, A.; Silva, A.M. Outstanding dispersion of CeO2 on reduced graphene oxide. Implications for highly dispersed Pd catalysts. Diam. Relat. Mater. 2020, 109, 108061. [Google Scholar] [CrossRef]
  18. Radhakrishnan, S.; Kim, S.J. An enzymatic biosensor for hydrogen peroxide based on one-pot preparation of CeO2-reduced graphene oxide nanocomposite. RSC Adv. 2015, 5, 12937–12943. [Google Scholar] [CrossRef]
  19. Deng, D.; Chen, N.; Xiao, X.; Du, S.; Wang, Y. Electrochemical performance of CeO2 nanoparticle-decorated graphene oxide as an electrode material for supercapacitor. Ionics 2017, 23, 121–129. [Google Scholar] [CrossRef]
  20. Wang, S.; Gao, R.; Zhou, K. The influence of cerium dioxide functionalized reduced graphene oxide on reducing fire hazards of thermoplastic polyurethane nanocomposites. J. Colloid Interface Sci. 2019, 536, 127–134. [Google Scholar] [CrossRef] [PubMed]
  21. Peng, W.; Zhao, L.; Zhang, C.; Yan, Y.; Xian, Y. Controlled growth cerium oxide nanoparticles on reduced graphene oxide for oxygen catalytic reduction. Electrochim. Acta 2016, 191, 669–676. [Google Scholar] [CrossRef]
  22. Zhang, M.; Yuan, R.; Chai, Y.; Wang, C.; Wu, X. Cerium oxide–graphene as the matrix for cholesterol sensor. Anal. Biochem. 2013, 436, 69–74. [Google Scholar] [CrossRef]
  23. Catalán, J.; Fascineli, M.L.; Politakos, N.; Hartikainen, M.; Pereira Garcia, M.; Cáceres-Vélez, P.R.; Moreno, C.; Willian da Silva, S.; Morais, P.C.; Norppa, H.; et al. In vivo toxicological evaluation of polymer brush engineered nanoceria: Impact of brush charge. Nanotoxicology 2019, 13, 305–325. [Google Scholar] [CrossRef] [PubMed]
  24. Politakos, N.; Veloso, A.; González de San Román, E.; Cordero-Lanzac, T.; Qin, Z.; Leal, G.P.; Tomovska, R. Visible Light Photocatalysts Based on Manganese Doped TiO2 Integrated Within Monolithic Reduced Graphene Oxide/Polymer Porous Monolith. ChemistrySelect 2020, 5, 5873–5882. [Google Scholar]
  25. Portillo Moreno, O.; Gutiérrez Pérez, R.; Palomino Merino, R.; Chávez Portillo, M.; Hernandez Tellez, G.; Rubio Rosas, E.; Zamora Tototzintle, M. CeO2 nanoparticles growth by chemical bath and its thermal annealing treatment in air atmosphere. Optik 2017, 148, 142–150. [Google Scholar] [CrossRef]
  26. Latha, P.; Prakash, K.; Karuthapandian, S. Effective Photodegradation of CR & MO dyes by morphologically controlled Cerium oxide nanocubes under visible light Illumination. Optik 2018, 154, 242–250. [Google Scholar]
  27. Culica, M.E.; Chibac-Scutaru, A.L.; Melinte, V.; Coseri, S. Cellulose Acetate Incorporating Organically Functionalized CeO2 NPs: Efficient Materials for UV Filtering Applications. Materials 2020, 13, 2955. [Google Scholar] [CrossRef] [PubMed]
  28. Jing Yang, W.; Pranantyo, D.; Neoh, K.-G.; Kang, E.-T.; Lay-Ming Teo, S.; Rittschof, D. Layer-by-Layer Click Deposition of Functional Polymer Coatings for Combating Marine Biofouling. Biomacromolecules 2012, 13, 2769–2780. [Google Scholar] [CrossRef] [PubMed]
  29. Supeno, S.; Daik, R.; El-Sheikh, S.M. Cationic quaternization of cellulose with methacryloyloxy ethyl trimethyl ammonium chloride via ATRP method. AIP Conf. Proc. 2014, 1614, 178. [Google Scholar]
  30. Kavitha, T.; Kang, I.-K.; Park, S.-Y. Poly(N-vinyl caprolactam) grown on nanographene oxide as an effective nanocargo for drug delivery. Colloids Surf. B Biointerfaces 2014, 115, 37–45. [Google Scholar] [CrossRef]
  31. Hsiao, M.-H.; Lin, K.-H.; Liu, D.-M. Improved pH-responsive amphiphilic carboxymethyl-hexanoyl chitosan–poly(acrylic acid) macromolecules for biomedical applications. Soft Matter 2013, 9, 2458–2466. [Google Scholar] [CrossRef]
  32. Mueen, R.; Morlando, A.; Qutaish, H.; Lerch, M.; Cheng, Z.; Konstantinov, K. ZnO/CeO2 nanocomposite with low photocatalytic activity as efficient UV filters. J. Mater. Sci. 2020, 55, 6834–6847. [Google Scholar] [CrossRef]
  33. Ren, Z.; Peng, F.; Li, J.; Liang, X.; Chen, B. Morphology-Dependent Properties of Cu/CeO2 Catalysts for the Water-Gas Shift Reaction. Catalysts 2017, 7, 48. [Google Scholar] [CrossRef] [Green Version]
  34. Sagadevan, S.; Johan, M.R.; Lett, J.A. Fabrication of reduced graphene oxide/CeO2 nanocomposite for enhanced electrochemical performance. Appl. Phys. A 2019, 125, 315. [Google Scholar] [CrossRef]
  35. Nurhasanah, I.; Safitri, W.; Arifin, Z.; Subagio, A.; Windarti, T. Antioxidant activity and dose enhancement factor of CeO2 nanoparticles synthesized by precipitation method. IOP Conf. Ser. Mater. Sci. Eng. 2018, 432, 012031. [Google Scholar] [CrossRef]
  36. Pop, O.L.; Mesaros, A.; Vodnar, D.C.; Suharoschi, R.; Tăbăran, F.; Magerușan, L.; Tódor, I.S.; Diaconeasa, Z.; Balint, A.; Ciontea, L.; et al. Cerium Oxide Nanoparticles and Their Efficient Antibacterial Application In Vitro against Gram-Positive and Gram-Negative Pathogens. Nanomaterials 2020, 10, 1614. [Google Scholar] [CrossRef]
  37. Hobza, P.; Havlas, Z. Blue-Shifting Hydrogen Bonds. Chem. Rev. 2000, 100, 4253–4264. [Google Scholar] [CrossRef] [PubMed]
  38. Sahoo, S.K.; Mohapatra, M.; Singh, A.K.; Anand, S. Hydrothermal Synthesis of Single Crystalline Nano CeO2 and Its Structural, Optical, and Electronic Characterization. Mater. Manuf. Process. 2010, 25, 982–989. [Google Scholar] [CrossRef]
  39. Pettinger, N.W.; Empey, J.M.; Fröbel, S.; Kohler, B. Photoreductive dissolution of cerium oxide nanoparticles and their size-dependent absorption properties. Phys. Chem. Chem. Phys. 2020, 22, 5756–5764. [Google Scholar] [CrossRef]
  40. Seixas de Melo, J.; Costa, T.; Francisco, A.; Maçanita, A.L.; Gago, S.; Gonçalves, I.S. Dynamics of short as compared with long poly(acrylic acid) chains hydrophobically modified with pyrene, as followed by fluorescence techniques. Phys. Chem. Chem. Phys. 2007, 9, 1370–1385. [Google Scholar] [CrossRef]
  41. Kesal, D.; Christau, S.; Krause, P.; Möller, T.; Von Klitzing, R. Uptake of pH-Sensitive Gold Nanoparticles in Strong Polyelectrolyte Brushes. Polymers 2016, 8, 134. [Google Scholar] [CrossRef] [PubMed] [Green Version]
  42. Yurdakal, S.; Garlisi, C.; Özcan, L.; Bellardita, M.; Palmisano, G. Chapter 4—(Photo) catalyst Characterization Techniques: Adsorption Isotherms and BET, SEM, FTIR, UV–Vis, Photoluminescence, and Electrochemical Characterizations. In Heterogeneous Photocatalysis Relationships with Heterogeneous Catalysis and Perspectives; Elsevier Science: Amsterdam, The Netherlands, 2019; pp. 87–152. [Google Scholar]
  43. Wang, P.; Jiang, Z.; Chen, L.; Yin, L.; Li, Z.; Zhang, C.; Tang, X.; Wang, G. Pore structure characterization for the Longmaxi and Niutitang shales in the Upper Yangtze Platform, South China: Evidence from focused ion beam–He ion microscopy, nano-computerized tomography and gas adsorption analysis. Mar. Pet. Geol. 2016, 77, 1323–1337. [Google Scholar] [CrossRef]
  44. Storck, S.; Bretinger, H.; Maier, W.F. Characterization of micro- and mesoporous solids by physisorption methods and pore-size analysis. Appl. Catal. A Gen. 1998, 174, 137–146. [Google Scholar] [CrossRef] [Green Version]
  45. Teixeira Gouveia, L.G.; Borges Agustini, C.; Perez-Lopez, O.W.; Gutterres, M. CO2 adsorption using solids with different surface and acid-base properties. J. Environ. Chem. Eng. 2020, 8, 103823. [Google Scholar] [CrossRef]
  46. Kovacevic, M.; Mojet, B.L.; van Ommen, G.J.; Lefferts, L. Effects of Morphology of Cerium Oxide Catalysts for Reverse Water Gas Shift Reaction. Catal. Lett. 2016, 146, 770–777. [Google Scholar] [CrossRef] [Green Version]
  47. Ju, T.-J.; Wang, C.-H.; Lin, S.D. Insights into the CO2 deoxygenation to CO over oxygen vacancies of CeO2. Catal. Sci. Technol. 2019, 9, 2118–2124. [Google Scholar] [CrossRef]
  48. Lee, S.M.; Lee, Y.H.; Moon, D.H.; Ahn, J.Y.; Nguyen, D.D.; Chang, S.W.; Kim, S.S. Reaction Mechanism and Catalytic Impact of Ni/CeO2–x Catalyst for Low-Temperature CO2 Methanation. Ind. Eng. Chem. Res. 2019, 58, 8656–8662. [Google Scholar] [CrossRef]
  49. Xing, W.; Liu, C.; Zhou, Z.; Zhou, J.; Wang, G.; Zhuo, S.; Xue, Q.; Song, L.; Yan, Z. Oxygen-containing functional group-facilitated CO2 capture by carbide-derived carbons. Nanoscale Res. Lett. 2014, 9, 189. [Google Scholar] [CrossRef] [Green Version]
  50. Singh, G.; Lee, J.; Karakoti, A.; Bahadur, R.; Yi, J.; Zhao, D.; AlBahily, K.; Vinu, A. Emerging trends in porous materials for CO2 capture and conversion. Chem. Soc. Rev. 2020, 49, 4360–4404. [Google Scholar] [CrossRef]
  51. Ko, Y.G.; Shin, S.S.; Choi, U.S. Primary, secondary, and tertiary amines for CO2 capture: Designing for mesoporous CO2 adsorbents. J. Colloid Interface Sci. 2011, 361, 594–602. [Google Scholar] [CrossRef]
  52. Molavi, H.; Eskandari, A.; Shojaei, A.; Mousavi, S.A. Enhancing CO2/N2 adsorption selectivity via post-synthetic modification of NH2-UiO-66(Zr). Microporous Mesoporous Mater. 2018, 257, 193–201. [Google Scholar] [CrossRef]
  53. Saka, C. Overview on the Surface Functionalization Mechanism and Determination of Surface Functional Groups of Plasma Treated Carbon Nanotubes. Crit. Rev. Anal. Chem. 2018, 48, 1–14. [Google Scholar] [CrossRef] [PubMed]
Scheme 1. Chemical structures of (a) poly(acrylic acid) (PAA), (b) poly(vinyl caprolactam) (PVCL), and (c) poly[(2-(methacryloyloxy)ethyl) trimethylammonium chloride] (PMETAC).
Applsci 11 11154 sch001
Figure 1. Anchoring CTA to CeO2 particles and polymerization via RAFT for the preparation of polymer brushes from the surface.
Applsci 11 11154 g001
Figure 2. Preparation of the composite monolith of rGO/CeO2/polymer brushes.
Applsci 11 11154 g002
Figure 3. EDX mapping results for the initial CeO2 nanoparticles and the ones with the different polymer brushes (C, N, Cl, and S: black; Ce: red; and O: blue).
Applsci 11 11154 g003
Figure 4. FTIR zooms of all samples in 3 different areas: (a) top, 3800–2800 cm−1; (b) middle, 2000–1000 cm−1; and (c) bottom, 1000–600 cm−1.
Applsci 11 11154 g004
Figure 5. UV results of the CeO2 and CeO2@polymers for three different pH synthesis conditions: acidic, neutral, and basic.
Applsci 11 11154 g005
Figure 6. TGA results of the CeO2 and CeO2@polymers.
Applsci 11 11154 g006
Figure 7. SEM images of monolithic samples at 2000× magnification (left images) and 500× magnification (right images).
Applsci 11 11154 g007
Figure 8. EDX mapping of all composite monoliths for C, Ce, O, N, and S.
Applsci 11 11154 g008
Figure 9. TGA results for the monolithic rGO composites with CeO2 and CeO2@polymers.
Applsci 11 11154 g009
Figure 10. Adsorption-desorption isotherms of all monoliths: GCe (black), GCePA (red), GCePN (blue), and GCePM (green).
Applsci 11 11154 g010
Figure 11. (a) Determination of the microporous and mesoporous material based on t-plots for GCe (black), GCePA (red), GCePN (blue), and GCePM (green). (b) Incremental pore volume vs. pore width for GCe (black), GCePA (red), GCePN (blue) and GCePM (green).
Applsci 11 11154 g011
Figure 12. (a) Adsorption of CO2 for all monoliths at room temperature and (b) comparison of CO2 adsorption values for 760- (1 atm) and 100-mm Hg pressure, as long as the total pore volume is less than 7.5 Å in diameter at P/Po = 0.016.
Applsci 11 11154 g012
Table 1. Results for the z-potential, GPC, and TGA for the initial particles and the ones with the polymer brushes.
SamplesGrafting Density
(%) a
Mw bZ−Potential c
(mV)
CeO2−25.4
CeO2@PAA5.8336,500
44,500
−21.3
CeO2@PNVCL6.0927,000
46,500
−6.99
CeO2@PMETAC6.0826,000
43,500
−0.14
a Calculated with TGA. b Calculated with GPC-SEC, based on poly(ethylene glycol) standards. c Calculated with DLS and z-potential.
Table 2. EDX elemental percentages (C-O-N-Ce-S) for all samples.
SchemeCONCeS
rGO71.222.36.4-0.1
GCe84.511.20.53.70.1
GCePA60.131.80.76.70.7
GCePN78.217.00.93.80.1
GCePM71.721.70.65.80.2
Table 3. Textural properties of the monoliths with different polymers.
SamplesSSA a
(m2/g)
Total Pore
Volume b
(cm3/g)
Average Pore
Size c
(nm)
Percentage of Micropores d
(Volume)
Percentage of Micropores e
(Area)
GCe95.10.1757.45.111.1
GCePA52.60.1209.15.613.2
GCePN77.50.1668.65.57.4
GCePM89.70.1657.47.09.9
a Calculated with BET. b Calculated with single-point adsorption. c Calculated with 4 V/A by BET. d Calculated with Density Functional Theory (DFT). e Calculated from a t-plot.
Publisher’s Note: MDPI stays neutral with regard to jurisdictional claims in published maps and institutional affiliations.

