Article

Automated Detection of Gastric Cancer by Retrospective Endoscopic Image Dataset Using U-Net R-CNN

1
School of Medical Sciences, Fujita Health University, Toyoake 470-1192, Japan
2
Department of Gastroenterology and Hepatology, Fujita Health University, Toyoake 470-1192, Japan
3
Faculty of Engineering, Gifu University, Gifu 501-1194, Japan
*
Author to whom correspondence should be addressed.
These authors contributed equally to this work.
Submission received: 3 November 2021 / Revised: 18 November 2021 / Accepted: 26 November 2021 / Published: 28 November 2021
(This article belongs to the Special Issue Applications of Artificial Intelligence in Medicine Practice)

Abstract

:
Upper gastrointestinal endoscopy is widely performed to detect early gastric cancers. As an automated detection method for early gastric cancer from endoscopic images, a method involving an object detection model, which is a deep learning technique, was proposed. However, there were challenges regarding the reduction in false positives in the detected results. In this study, we proposed a novel object detection model, U-Net R-CNN, based on a semantic segmentation technique that extracts target objects by performing a local analysis of the images. U-Net was introduced as a semantic segmentation method to detect early candidates for gastric cancer. These candidates were classified as gastric cancer cases or false positives based on box classification using a convolutional neural network. In the experiments, the detection performance was evaluated via the 5-fold cross-validation method using 1208 images of healthy subjects and 533 images of gastric cancer patients. When DenseNet169 was used as the convolutional neural network for box classification, the detection sensitivity and the number of false positives evaluated on a lesion basis were 98% and 0.01 per image, respectively, which improved the detection performance compared to the previous method. These results indicate that the proposed method will be useful for the automated detection of early gastric cancer from endoscopic images.

1. Introduction

1.1. Background

Gastric cancer (GC) is one of the most common malignant tumors of the stomach mucosa. According to global statistics, GC is the second leading cause of cancer deaths, and the number of patients with GC is increasing due to changes in dietary habits and longer life expectancy [1,2]. GC may be effectively treated if detected early. Therefore, early detection and treatment of gastric cancer are essential.
Radiography and endoscopy are used to screen for GC. During endoscopy, a specialist inserts an endoscope through the patient’s mouth or nose and directly observes the mucous membrane of the digestive tract to detect abnormalities. The detection sensitivity of GC by endoscopy is high, and if lesions are found during the examination then tissue may be collected and simple treatment can be given [3].
However, specialists who perform the procedure need to detect abnormalities while operating the endoscope, making the examination process sophisticated and complicated. This results in widely varying diagnostic accuracy, and some studies have reported that lesions were missed in 22.2% of cases [4]. If physicians could use the results of computerized image analysis and detect abnormalities during the examination, they could solve some of these problems and detect GC at an early stage. Deep learning, an artificial intelligence technology, has recently been confirmed to have high capability for image recognition by several studies that were conducted in the medical field [5,6,7,8,9,10]. Therefore, we focused on the automated detection of GC in endoscopic images using a computer-aided diagnostic method based on deep learning technology.

1.2. Related Works

There are many studies on deep learning for the diagnosis of GC using endoscopic images, including studies on the classifications between GC and healthy subjects and the automated recognition of GC regions.
Shichijo et al. investigated the prediction of Helicobacter pylori infection using a convolutional neural network (CNN) and obtained a sensitivity of 88.9% and specificity of 87.4% [11]. Li et al. developed a method to discriminate between GC and normal tissue using magnified narrow-band imaging (NBI) [12]. They used Inception-v3 as the CNN model for classification and obtained a sensitivity of 91.18% and specificity of 90.64%. Zhang et al. developed a method to classify precancerous diseases (polyp, ulcer, and erosion) using CNN and obtained a classification accuracy of 88.9% [13].
Hirasawa et al. developed a single-shot multi-box detector (SSD), an object detection model, for the automated detection of early-stage GC [14]. The sensitivity of detection was 92.2% and the positive predictive value was 30.6%. Sakai et al. also developed a method for object detection of GC by classifying GC regions and normal regions using micropatch endoscopic images [15]. The detection sensitivity and specificity of the method were 80.0% and 94.8%, respectively.
We proposed a method for extracting the presence and invasive regions of early GC using Mask R-CNN, which can perform both object detection and segmentation [16]. We showed that the automated detection sensitivity for early GC was 96.0% and that the segmentation concordance was 71%. Although the method had sufficient detection sensitivity, the average number of false positives (FP) was 0.10 per image (3.0 per patient). The Mask R-CNN used in this study introduced an object detection model for common natural images. It captured the clear contour of the object in the image, so that lesions with a relatively clear shape that caused unevenness were detected correctly. On the other hand, many lesions of early GC, in which only the surface of the gastric mucosa was cancerous, were not detected correctly by the object detection model because contours were unclear.
A CNN used for segmentation rather than object detection analyzes patterns in the local regions of the image and divides the entire image into regions by determining whether they match the patterns to be extracted. This behavior involved in determining individual regions while observing details is similar to that used by an expert physician when observing the gastric cavity, and segmentation techniques may be able to improve the accuracy of automated lesion detection. On the other hand, many small regions are often observed in the segmentation output by CNNs. Excluding these using the FP reduction technique may greatly reduce the number of FPs and improve detection performance. Therefore, segmentation techniques that exclude small excess regions are effective for the automated detection of GC and identification of the extent of invasion.

1.3. Objective

In this study, we develop a deep learning model that may accurately detect the presence of GC and its extent of invasion using endoscopic images. We propose a novel deep learning model, U-Net R-CNN, which is a combination of the U-Net segmentation process and CNN for image classification to eliminate FPs. The efficacy of this method is confirmed using endoscopic images of early GC and healthy subjects.

2. Methods

2.1. Outline

The outline of the GC detection by U-Net R-CNN proposed in this study is shown in Figure 1. The endoscopic images were given to the U-Net, the initial candidate regions of the GC were extracted, and the bounding box of each extracted region was obtained. The obtained image patterns in the bounding boxes were subjected to a CNN to classify FPs and the final candidates (box classification). The final candidate regions where FPs are excluded were outputs used for diagnosis.

2.2. Image Dataset

The image dataset used in this study was same as that used in our previous study. Patient details and other information may be found in our previous study [16]. For this study, 42 healthy and 93 cases (94 lesions) of GC for preoperative examinations were collected between 16 July 2013 and 30 August 2017 at the Fujita Health University Hospital. The numbers of images for the above two categories were 1208 and 533, respectively. The endoscopic images were obtained from multiple directions if a lesion was found during the examination. Table 1 shows the characteristics of gastric cancer patients and lesions [16]. Regarding the healthy subjects, we reassessed the cases endoscopists diagnosed without any abnormalities. When we did not find a specific lesion, such as a tumor, polyps, or gastritis, and a regular arrangement of collecting venules was observed in the mucosa, we considered this as “healthy” [17].
We obtained images using upper endoscope units (EG-L600ZW7; Fujifilm Corp., Tokyo, Japan; GIF-290Z, GIF-HQ290, GIF-XP290N, GIF-260Z; Olympus Medical Systems, Co., Ltd., Tokyo, Japan) and standard endoscopic video systems (VP-4450HD/LL-4450, Fujifilm Corp., Tokyo, Japan; and EVIS LUCERA CV-260/CLV-260; EVIS LUCERA ELITE CV-290/CLV-290SL; Olympus Medical Systems, Tokyo, Japan).
All images were captured using standard white light and stored in JPEG file format. The matrix size of the images ranged from 640 × 480 to 1440 × 1080 pixels. To make the matrix size consistent, we resized all images to 512 × 512 pixels. The circular field of view was adopted to avoid differences among the endoscopic instruments and to facilitate data augmentation, before being trimmed as a circle.
The expert endoscopist (TS), who was certified by the Japan Gastroenterological Endoscopy Society, made the ground truth of a label image. To make the label images, we used the original Python software.

2.3. Data Augmentation

Rotation and inversion invariance can be established because the endoscope may capture images of the gastric condition from various angles. Therefore, various images may be created by rotating or flipping each of the collected images. In this study, to ensure stable deep learning performance, we prepared, rotated, and flipped original images for data augmentation and used them for training. Using our in-house software, we generated images by setting the rotation pitch of the images of GC and healthy subjects to 6° and 10°, respectively, so that the numbers of images of GC and healthy subjects were equal [16].

2.4. Initial Detection

We extracted the candidate regions for early GC from endoscopic images. For this task, we employed U-Net, a semantic segmentation technique [18], which was first proposed in 2015 as a method for extracting cell regions in microscopic images and widely used in fields other than medical imaging since. The network structure is shown in Figure 2. U-Net consists of five convolutional and pooling layers, followed by five encoder layers (upscaling layers). When an image is given to the input layer, the encoder layer in the first half extracts the features of the image. Then, the decoder layer in the second half outputs a segmented label image based on the extracted features. In addition, the encoder and decoder layers are connected to each other and the high-resolution information from the encoder layer is delivered directly to the decoder layer on the other side, thereby increasing the resolution of the label image. U-Net provides an initial candidate region for early GC corresponding to the input image. As for the U-Net parameters, the Dice coefficient was used as the loss function (the definition of the Dice index is described in Section 2.6), with the Adam algorithm [19] as the optimization algorithm, 0.0001 as the learning coefficient, 100 as the number of training sessions, and 8 as the batch size.

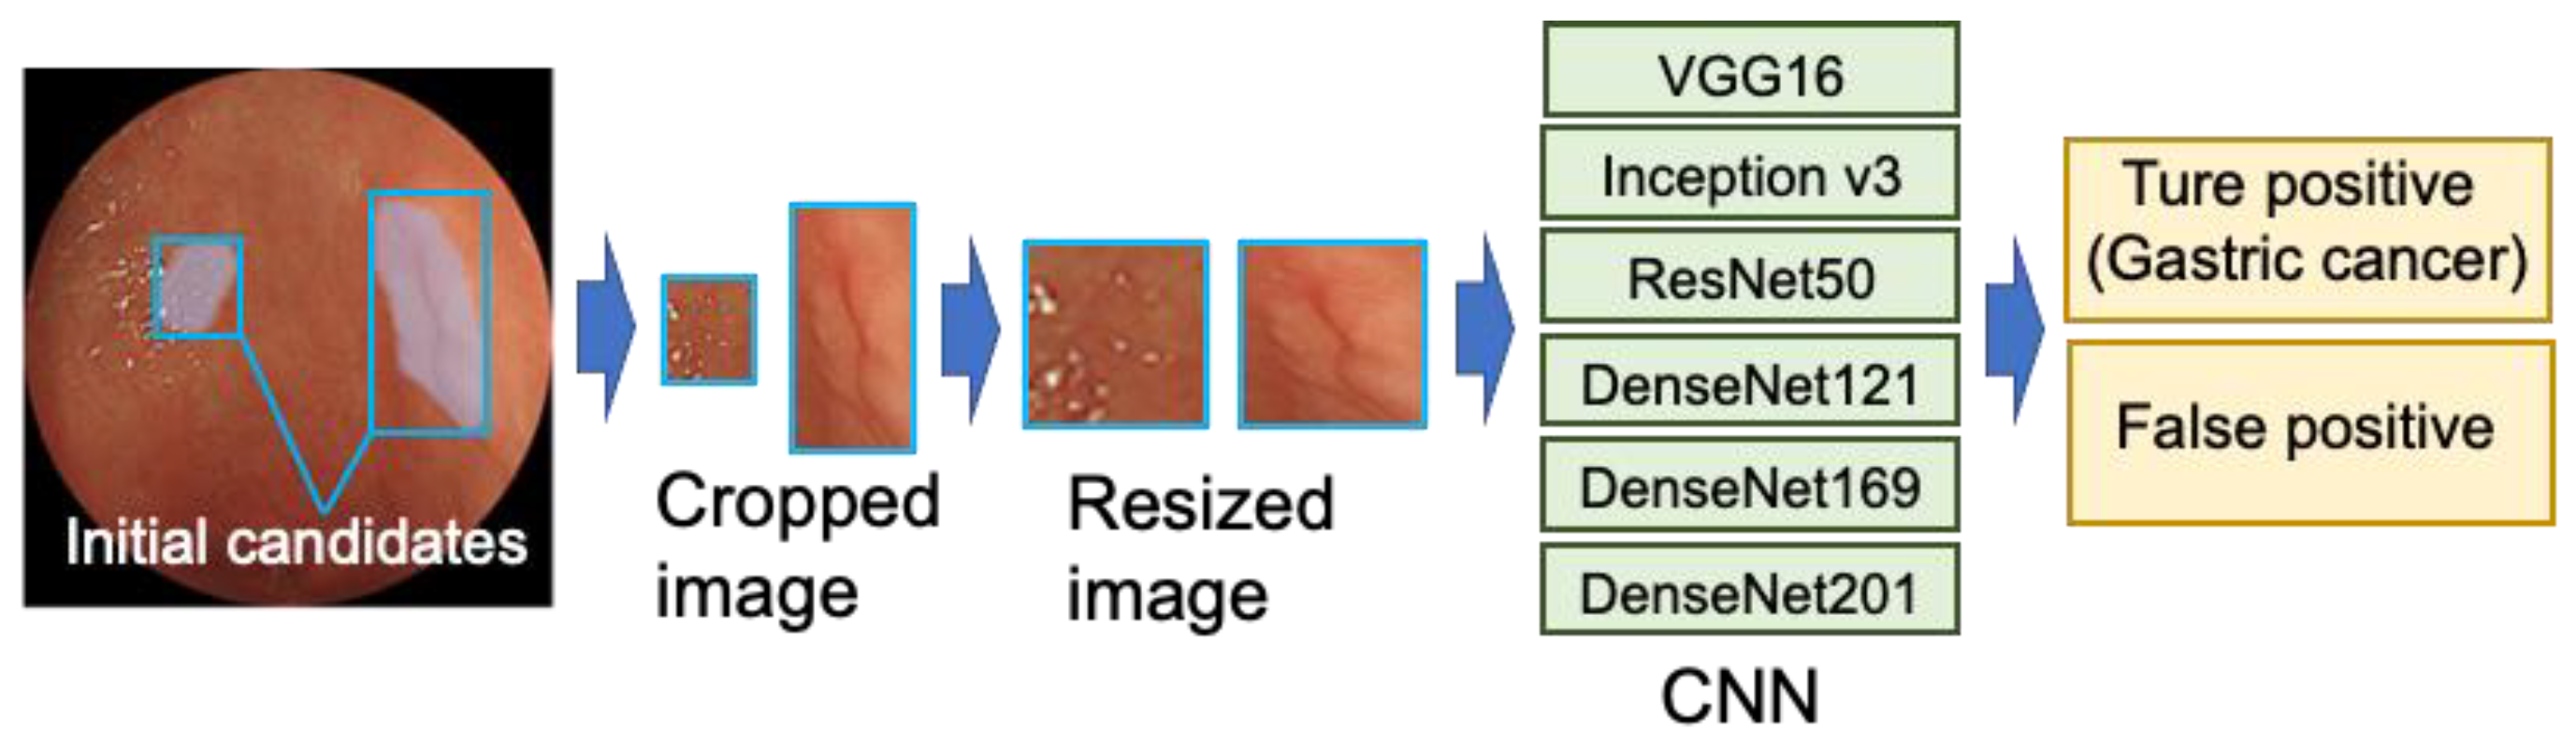
2.5. Box Classification

The detected candidate regions included many over-detected regions (FPs). These FPs may be recognized and reduced using a different approach from the segmented U-Net for segmentation. In the box classification part of the proposed U-Net R-CNN, FPs are eliminated from the candidate regions by another CNN (Figure 3).
First, the input image was provided to U-Net and the output labeled image of U-Net was automatically binarized by Otsu’s method [20], followed by the labeling process to pick up individual candidate regions. The bounding box of the candidate region was then cut out and input to the CNN to classify the candidate region as GC or false positive. Finally, the regions that the CNN identified as GC were used as the final detection results.
For the CNN architecture, we introduced VGG-16 [21], Inception v3 [22], and ResNet50 [23], as well as DenseNet121, 169, and 201 [24], then selected the best model by comparing them. These CNN models were pretrained using the ImageNet dataset, which has a much larger number of training image samples than our original dataset. For the classification of GC and FPs, we replaced the fully connected layers of the original CNN models with three layers having 1024, 256, and 2 units.
For the input of the CNN, the image of the candidate region was resized to 224 × 224 pixels and the optimization algorithm was the Adam algorithm with a learning rate of 0.0001 and 200 training epochs. For data augmentation, vertical and horizontal image flipping were performed randomly.

2.6. Evaluation Metrics

We defined the evaluation metrics to assess the detection and segmentation performance of the proposed method. As for the detection sensitivity, when the GC region obtained by the proposed method and the ground truth region specified by a gastrointestinal specialist overlapped, we evaluated that the target GC was detected correctly. In the endoscopic examination, the same GC region was often observed in a number of images because images were taken from many angles. Among these images, some images may have subtle patterns that are difficult to identify. Therefore, we evaluated the performance of two counting methods. The first method involved simply counting the number of images for which GC was detected correctly (image-based sensitivity), while second method determined whether one lesion was correctly detected in at least one image (lesion-based sensitivity). Regarding the FPs, the total number of detected healthy regions in healthy cases were counted; we calculated FPs per case by dividing them by the total number of healthy subjects.
Although the main task of this study was to detect objects to recognize the presence of GC, U-Net may extract object regions. Therefore, we evaluated the accuracy of region extraction using Dice and Jaccard coefficients.
Di and Ji were calculated using the following formulas to evaluate the similarity between the detected region and the ground truth created by a gastrointestinal specialist:
Di = 2|A∩B|/(|A| + |B|) × 100 [%]
Ji = |A∩B|/|A∪B| × 100 [%]
where A and B are two sets. Here, A indicates the ground truth GC region specified by a specialist and B indicates the detected region identified by the proposed method.
Di and Ji were evaluated in the two groups. First, all images containing GC areas were used to evaluate the overall extraction accuracy. In the second method, only the regions detected by the method were evaluated to confirm the accuracy of the invasion area when GC was detected.
In the evaluation, we used a cross-validation method [25]. In this method, the dataset was split into k groups (called k-fold cross-validation). The network was trained using the k-1 subset; the remaining subset was used for the test. By repeating the above process k times, the test results for all data can be obtained. The overall model accuracy can be calculated by summarizing all test results. In our evaluation, five-fold cross-validation (k = 5) was introduced; 137 cases were randomly divided into five groups. Here, the images of the same case were not assigned to both training and test data.
This study was approved by the institutional review board of Fujita Health University, informed consent was obtained from the patients in the form of an opt-out in the endoscopic center of Fujita Health University Hospital, and all data were anonymized (No. HM17-226). This study was conducted in accordance with the World Medical Association Declaration of Helsinki.
The calculations of the initial detection and FP reduction were performed using original Python software using an AMD Ryzen9 3950X processor (16 CPU cores, 4.7 GHz) with 128 GB of DDR4 memory. Trainings of CNN phases were accelerated by NVIDIA Quadro RTX 8000 GPU (48 GB memory).

3. Results

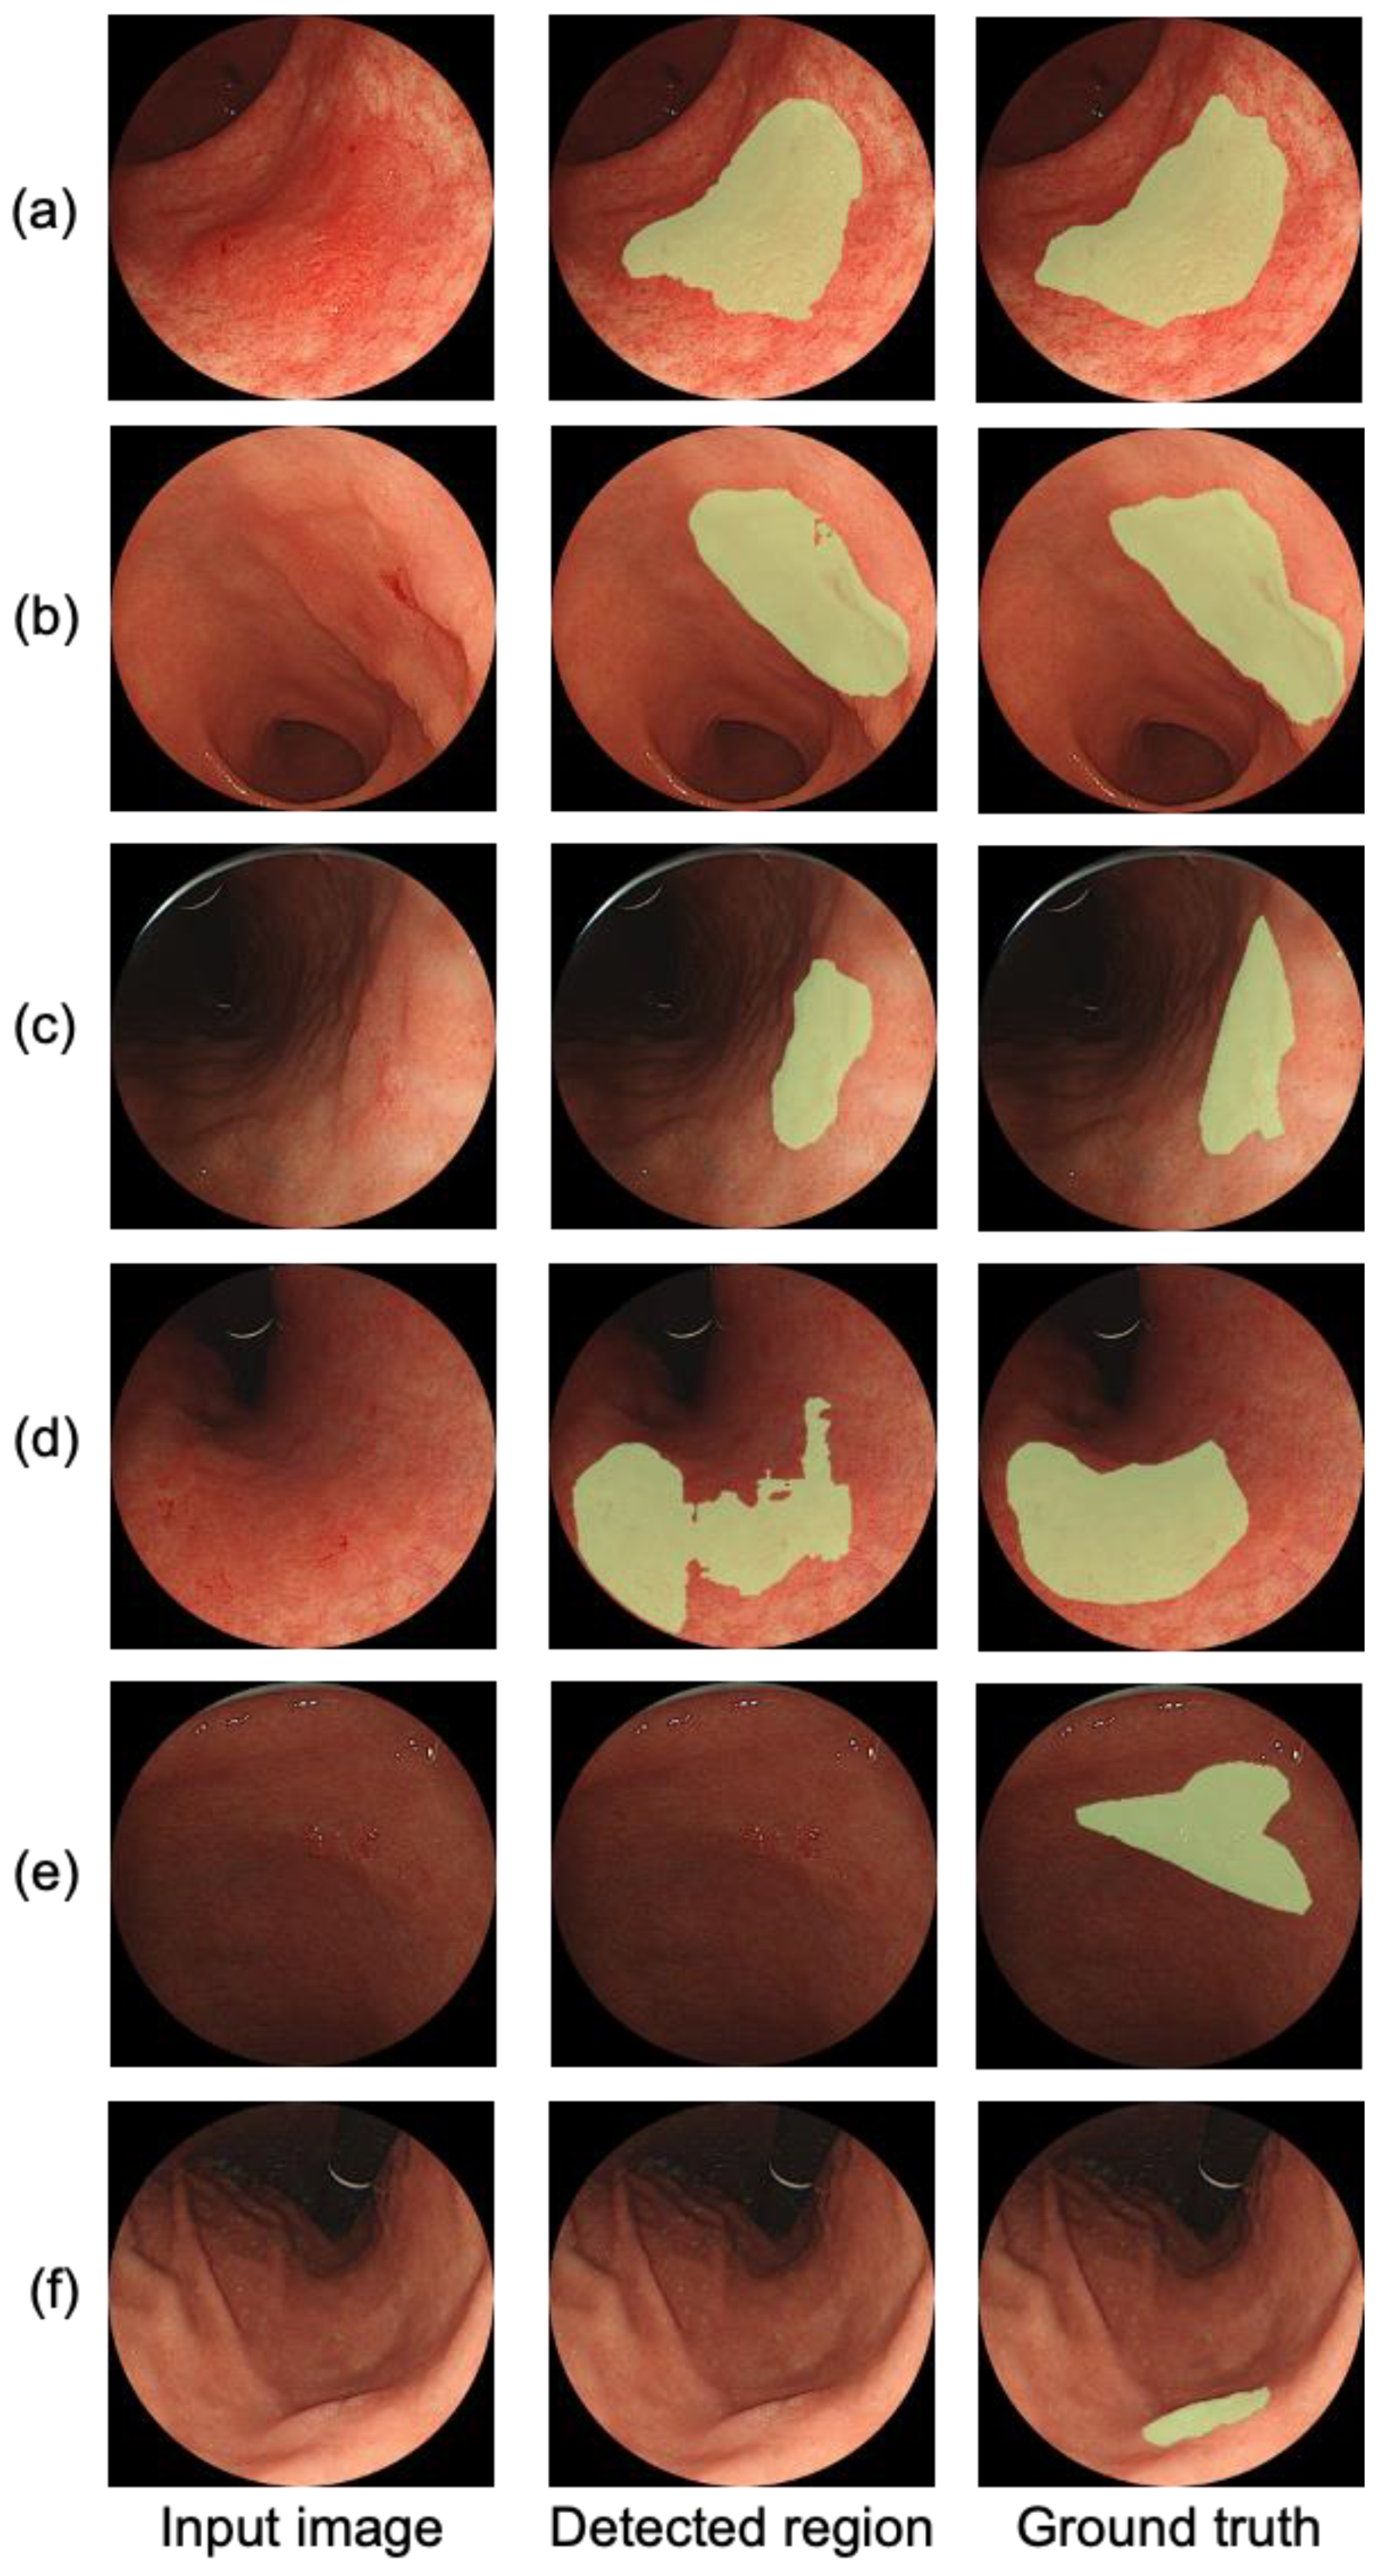
3.1. Initial Detection

Using the proposed method, we obtained the results for the initial detection before performing FP elimination. Figure 4 shows a lesion detected in the initial detection process (a−d) and an example of a missed lesion (e,f). The right image in Figure 4c,d shows those lesions that were missed by our previous technique but detected by the proposed method. As a result of the automated detection of all 1741 images using the cross-validation method, lesions were detected in 491 out of 533 images that contained lesions, while no lesions were detected in 42 images. When the detection sensitivity was evaluated on a lesion basis, the presence of GC was detected in at least one image in 98.9% (93/94) of patients, while 1.1% (1/94) of GCs were not detected in any patient. FPs were detected in 42 of 1208 images in the healthy group, resulting in an FP count of 0.035 per image.

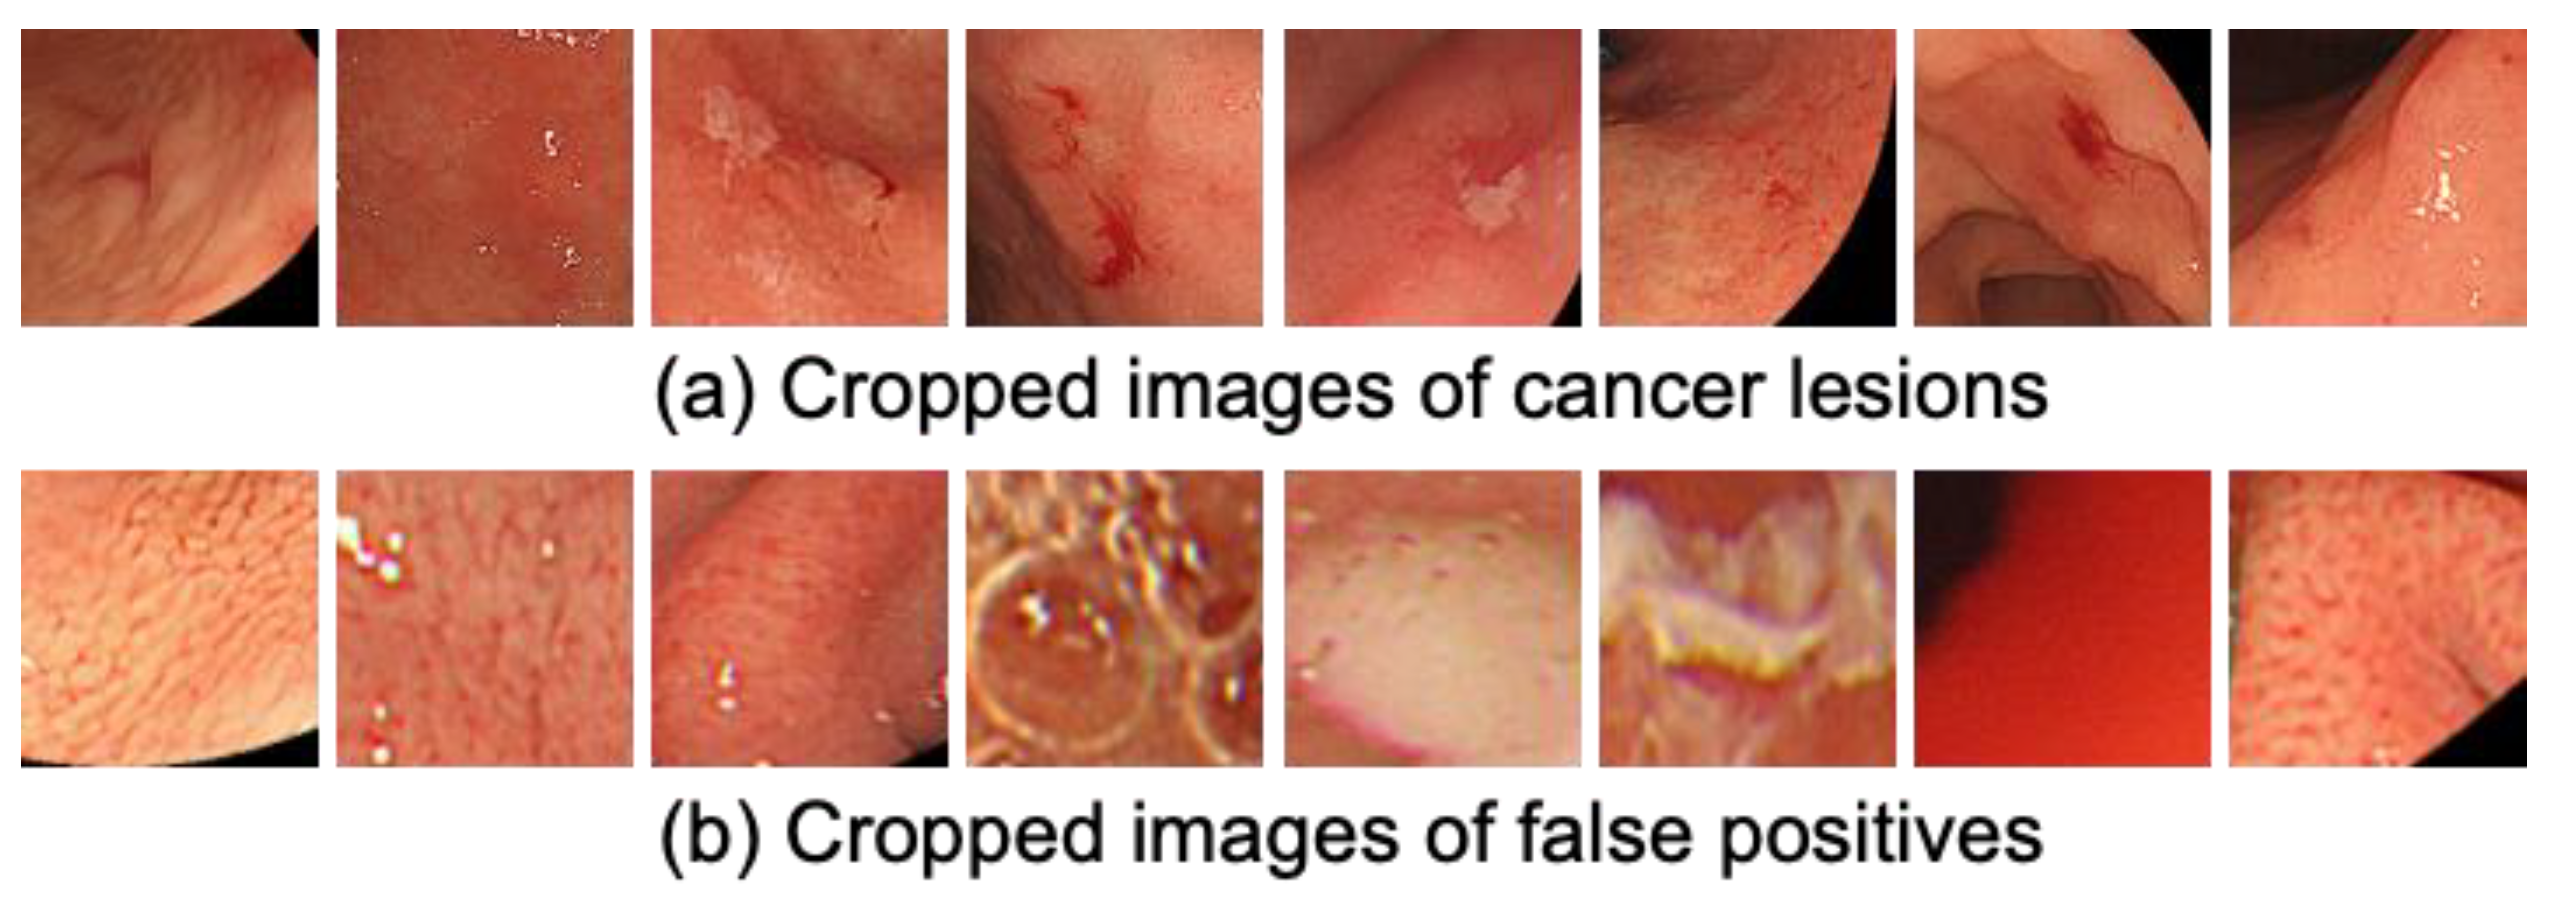
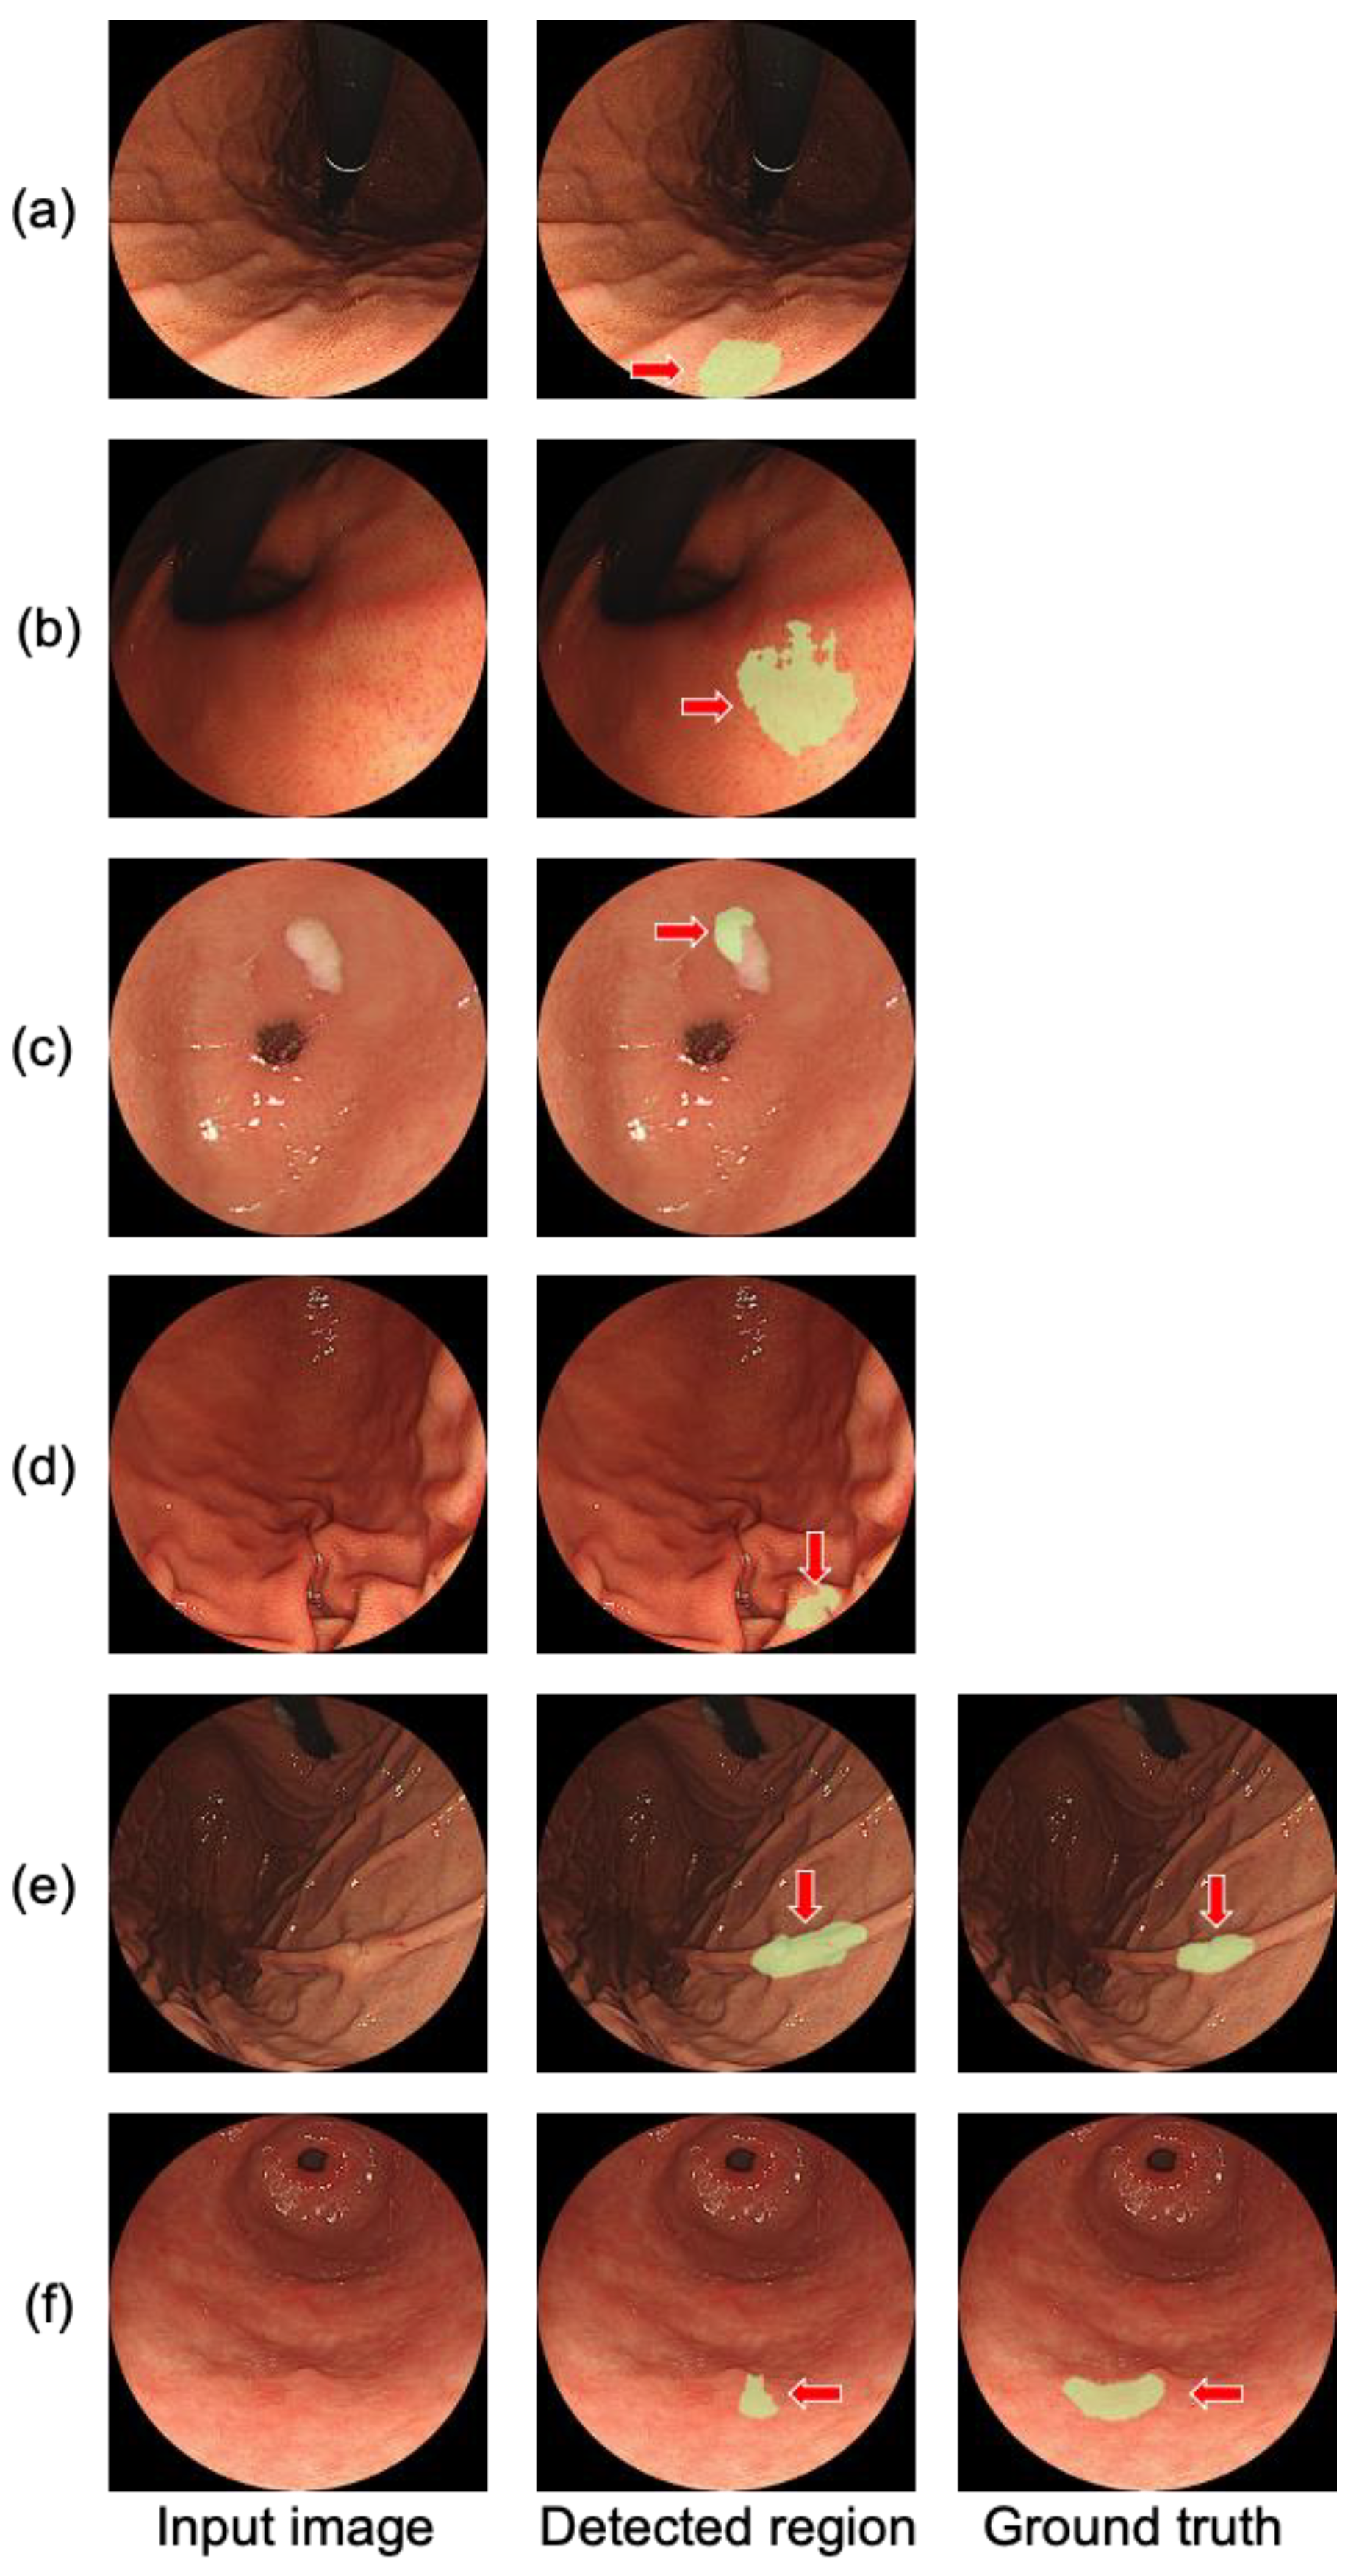
3.2. False Positive Reduction

Box classification was performed on 533 images (491 true positives and 42 FPs) detected in the initial detection to eliminate the FPs. Figure 5 shows an example of a cropped image to be given to the CNN for FP reduction. Table 2 shows the detection sensitivity and the numbers of FPs per image and per lesion when an FP reduction was performed with six different CNN architectures. DenseNet169 showed the highest ability to eliminate FPs. Examples of FPs that could be removed by DenseNet169 and those that could not are shown in Figure 6. The results of the calculation of Di and Ji for GC cases are shown in Table 3.

4. Discussion

In this study, we proposed a U-Net RCNN that combines U-Net and an FP reduction method for object detection and performs automatic detection of GC cases. Using the output images of U-Net, individual candidate regions were recognized by conventional thresholding and labeling techniques and bounding boxes were obtained. To eliminate FPs, candidate regions were classified as true GC cases and FPs by CNN.
The lesion-based sensitivity for initial detection by this method was 0.989, while the number of FPs per image was 0.035, which was much better than the previous study (sensitivity, 0.957; number of FPs per image, 0.105). The Mask R-CNN introduced in our previous method was able to accurately detect visually distinct objects such as unevenness due to the principles of the object detection model; however, it was difficult to detect subtle changes in the mucosal surface. On the other hand, U-Net, which was employed in this study, could analyze local regions in an image. A detailed analysis of the gastric mucosa in endoscopic images was performed and patterns that differed from normal were accurately recognized.
In the second stage, we compared the performance of six different CNN architectures and found that DenseNet169 showed the best performance, reducing FPs by approximately 30% to 0.011, while maintaining a lesion-based detection sensitivity of 0.989.
When evaluated in an image-based manner, the detection sensitivity dropped by approximately 4% from 0.942 to 0.897. As shown in Figure 5e,f, most of the images that remained undetected were taken from angles and distances that were difficult to see, and other images in the case were able to compensate for the detection.
The accuracy of extracting the invasive region of GC was evaluated by Di and Ji and the results were 0.55 and 0.42, respectively, for all GC images; and 0.60 and 0.46, respectively, when the evaluation was limited to the correctly detected images. The proposed method was more accurate than the previous study using Mask R-CNN when evaluating all GC images, while the previous study was more accurate when evaluating only the detected regions. This indicates that our method may detect subtle lesions but is not able to extract the exact shapes. To improve the extraction accuracy, it is necessary to improve the CNN model used for the initial detection and to add post-processing, such as region growing, to the extracted images.
Because the proposed method provides a sensitivity of 98% in detecting GC while keeping FPs at an acceptable level, it may be useful for maintaining high examination accuracy in screening for GC by covering differences in the experience of physicians.
Although we could not compare our results accurately because a different dataset was used, the proposed method using U-Net and FP reduction techniques had a better detection sensitivity than those in previous studies using a SSD [14] and Mask R-CNN [16]. Furthermore, a previous study using SSD detected lesions with a bounding box, whereas the proposed method segments the GC regions. The detection and segmentation capabilities of the proposed method are significantly improved compared to the previous methods.
The major limitation of the proposed method is the small number of images. Training and evaluation of the proposed method were carried out using the data collected at a single facility only for comparison with our previous method. We plan to expand the dataset by including data from external facilities.

5. Conclusions

In this study, we developed a deep learning model that can accurately detect the presence of GC and its invasive area using endoscopic images. In this paper, as a deep learning model, we proposed a novel U-Net R-CNN that combines the U-Net segmentation process with a CNN for image classification to eliminate FPs. As a result of the evaluation using the endoscopic images of early-stage GC and healthy subjects, the proposed method showed a higher detection ability than the previous techniques. These results indicate that our method is effective for the automated detection of early GC in endoscopy.

Author Contributions

Conceptualization, A.T., T.S., Y.H., K.S. and H.F.; data curation, T.S. and H.Y.; methodology, A.T.; software, A.T.; validation, T.S., A.T., and H.Y.; investigation, A.T., T.S., and H.Y.; writing—original draft preparation, A.T. and T.S.; writing—review and editing, Y.H., K.S. and H.F.; visualization, A.T.; project administration, A.T. and T.S. All authors have read and agreed to the published version of the manuscript.

Funding

This research received no external funding.

Institutional Review Board Statement

This study was approved by the Ethical Review Committee of Fujita Health University (HM17-226) and carried out in accordance with the World Medical Association’s Declaration of Helsinki.

Informed Consent Statement

Patients’ informed consent was obtained in the form of opt-out in the endoscopic center of Fujita Health University Hospital and all data were anonymized.

Data Availability Statement

The source code and additional information used to support the findings of this study will be available from the corresponding author upon request.

Conflicts of Interest

The authors declare no conflict of interest.

References

  1. Fitzmaurice, C.; Akinyemiju, T.F.; Al Lami, F.H.; Alam, T.; Alizadeh-Navaei, R.; Allen, C.; Alsharif, U.; Alvis-Guzman, N.; Amini, E.; Anderson, B.O.; et al. Global, regional, and national cancer incidence, mortality, years of life lost, years lived with disability, and disability-adjusted life-years for 29 cancer groups, 1990 to 2016: A systematic analysis for the global burden of disease study global burden of disease cancer collaboration. JAMA Oncol. 2018, 4, 1553–1568. [Google Scholar] [PubMed]
  2. Karger Publishers [Internet]. GLOBOCAN 2012: Estimated Cancer Incidence, Mortality, and Prevalence Worldwide in 2012. Available online: http://globocan.iarc.fr/Pages/fact_sheets_cancer.aspx (accessed on 31 October 2021).
  3. Tashiro, A.; Sano, M.; Kinameri, K.; Fujita, K.; Takeuchi, Y. Comparing mass screening techniques for gastric cancer in Japan. World J. Gastroenterol. 2006, 12, 4873–4874. [Google Scholar] [PubMed]
  4. Toyoizumi, H.; Kaise, M.; Arakawa, H.; Yonezawa, J.; Yoshida, Y.; Kato, M.; Yoshimura, N.; Goda, K.; Tajiri, H. Ultrathin endoscopy versus high-resolution endoscopy for diagnosing superficial gastric neoplasia. Gastrointest. Endosc. 2009, 70, 240–245. [Google Scholar] [CrossRef] [PubMed]
  5. Teramoto, A.; Tsukamoto, T.; Yamada, A.; Kiriyama, Y.; Imaizumi, K.; Saito, K.; Fujita, H. Deep learning approach to classification of lung cytological images: Two-step training using actual and synthesized images by progressive growing of generative adversarial networks. PLoS ONE 2020, 15, e0229951. [Google Scholar] [CrossRef] [PubMed]
  6. Yan, K.; Cai, J.; Zheng, Y.; Harrison, A.P.; Jin, D.; Tang, Y.B.; Tang, Y.X.; Huang, L.; Xiao, J.; Lu, L. Learning from Multiple Datasets with Heterogeneous and Partial Labels for Universal Lesion Detection in CT. arXiv 2020, arXiv:2009.02577. [Google Scholar] [CrossRef] [PubMed]
  7. Sahiner, B.; Pezeshk, A.; Hadjiiski, L.M.; Wang, X.; Drukker, K.; Cha, K.H.; Summers, R.M.; Giger, M.L. Deep learning in medical imaging and radiation therapy. Med. Phys. 2019, 46, e1–e36. [Google Scholar] [CrossRef] [PubMed] [Green Version]
  8. Toda, R.; Teramoto, A.; Tsujimoto, M.; Toyama, H.; Imaizumi, K.; Saito, K.; Fujita, H. Synthetic CT Image Generation of Shape-Controlled Lung Cancer using Semi-Conditional InfoGAN and Its Applicability for Type Classification. Int. J. Comput. Assist. Rad. Surg. 2021, 16, 241–251. [Google Scholar] [CrossRef] [PubMed]
  9. Tsujimoto, M.; Teramoto, A.; Dosho, M.; Tanahashi, S.; Fukushima, A.; Ota, S.; Inui, Y.; Matsukiyo, R.; Obama, Y.; Toyama, H. Automated classification of increased uptake regions in bone SPECT/CT images using three-dimensional deep convolutional neural network. Nucl. Med. Commun. 2021, 42, 877–883. [Google Scholar] [PubMed]
  10. Teramoto, A.; Fujita, H.; Yamamuro, O.; Tamaki, T. Automated detection of pulmonary nodules in PET/CT images: Ensemble false-positive reduction using a convolutional neural network technique. Med. Phys. 2016, 43, 2821–2827. [Google Scholar] [CrossRef] [PubMed]
  11. Shichijo, S.; Endo, Y.; Aoyama, K.; Takeuchi, Y.; Ozawa, T.; Takiyama, H.; Matsuo, K.; Fujishiro, M.; Ishihara, S.; Ishihara, R.; et al. Application of convolutional neural networks for evaluating Helicobacter pylori infection status on the basis of endoscopic images. Scand. J. Gastroenterol. 2019, 54, 158–163. [Google Scholar] [CrossRef] [PubMed]
  12. Li, L.; Chen, Y.; Shen, Z.; Zhang, X.; Sang, J.; Ding, Y.; Yang, X.; Li, J.; Chen, M.; Jin, C.; et al. Convolutional neural network for the diagnosis of early gastric cancer based on magnifying narrow band imaging. Gastric Cancer. 2020, 23, 126–132. [Google Scholar] [CrossRef] [PubMed] [Green Version]
  13. Zhang, X.; Hu, W.; Chen, F.; Liu, J.; Yang, Y.; Wang, L.; Duan, H.; Si, J. Gastric precancerous diseases classification using CNN with a concise model. PLoS ONE 2017, 12, e0185508. [Google Scholar] [CrossRef] [PubMed]
  14. Hirasawa, T.; Aoyama, K.; Tanimoto, T.; Ishihara, S.; Shichijo, S.; Ozawa, T.; Ohnishi, T.; Fujishiro, M.; Matsuo, K.; Fujisaki, J.; et al. Application of artificial intelligence using a convolutional neural network for detecting gastric cancer in endoscopic images. Gastric Cancer 2018, 21, 653–660. [Google Scholar] [CrossRef] [PubMed] [Green Version]
  15. Sakai, Y.; Takemoto, S.; Hori, K.; Nishimura, M.; Ikematsu, H.; Yano, T.; Yokota, H. Automatic detection of early gastric cancer in endoscopic images using a transferring convolutional neural network. In Proceedings of the 2018 40th Annual International Conference of the IEEE Engineering in Medicine and Biology Society (EMBC), Honolulu, HI, USA, 18–21 July 2018; pp. 4138–4141. [Google Scholar]
  16. Shibata, T.; Teramoto, A.; Yamada, H.; Ohmiya, N.; Saito, K.; Fujita, H. Automated Detection and Segmentation of Early Gastric Cancer from Endoscopic Images Using Mask R-CNN. Appl. Sci. 2020, 10, 3842. [Google Scholar] [CrossRef]
  17. Yagi, K.; Nakamura, A.; Sekine, A. Characteristic endoscopic and magnified endoscopic findings in the normal stomach without Helicobacter pylori infection. J. Gastroenterol. Hepatol. 2002, 17, 39–45. [Google Scholar] [CrossRef] [PubMed]
  18. Ronneberger, O.; Fischer, P.; Brox, T. U-Net: Convolutional Networks for Biomedical Image Segmentation. Lect. Notes. Comput. Sci. 2015, 9351, 234–241. [Google Scholar]
  19. Kingma, D.P.; Ba, J. Adam: A Method for Stochastic Optimization. arXiv 2017, arXiv:1412.6980. [Google Scholar]
  20. Otsu, N. A threshold selection method from gray-level histograms. IEEE Trans. Syst. Man Cybern. 1979, 9, 62–66. [Google Scholar] [CrossRef] [Green Version]
  21. Simonyan, K.; Zisserman, A. Very deep convolutional networks for large-scale image recognition. arXiv 2015, arXiv:1409.1556. [Google Scholar]
  22. Szegedy, C.; Liu, W.; Jia, Y.; Sermanet, P.; Reed, S.; Anguelov, D.; Erhan, D.; Vanhoucke, V.; Rabinovich, A. Going deeper with convolutions. In Proceedings of the IEEE Conference on Computer Vision and Pattern Recognition (CVPR), Boston, MA, USA, 7–12 June 2015; pp. 1–9. [Google Scholar]
  23. He, K.; Zhang, X.; Ren, S.; Sun, J. Deep residual learning for image recognition. In Proceedings of the IEEE Conference on Computer Vision and Pattern Recognition (CVPR), Las Vegas, NV, USA, 27–30 June 2016; pp. 770–778. [Google Scholar]
  24. Huang, G.; Liu, Z.; van der Maaten, L.; Weinberger, K.Q. Densely connected convolutional networks. In Proceedings of the IEEE Conference on Computer Vision and Pattern Recognition (CVPR), Honolulu, HI, USA, 21–26 July 2017; pp. 4700–4708. [Google Scholar]
  25. Efron, B. Estimating the error rate of a prediction rule: Improvement on cross-validation. J. Am. Stat. Assoc. 1983, 78, 316–331. [Google Scholar] [CrossRef]
Figure 1. Outline of the proposed method.
Applsci 11 11275 g001
Figure 2. Architecture of U-Net.
Applsci 11 11275 g002
Figure 3. Architecture of the box classification.
Applsci 11 11275 g003
Figure 4. Lesions detected and missed in the initial detection process: (a,b) correctly detected by both the previous and the proposed method; (c,d) correctly detected only by the proposed method; (e,f) missed by the proposed method.
Applsci 11 11275 g004
Figure 5. Example of the cropped images for false positive reduction: (a) Cropped images of cancer lesions; (b) Cropped images of false positives.
Applsci 11 11275 g005
Figure 6. Examples of false positive reduction: (a,b) false positives correctly eliminated by the proposed method; (c,d) FPs that were not eliminated by the proposed method; (e,f) gastric cancer lesions eliminated by false positive reduction. Arrows indicate the labeled regions.
Applsci 11 11275 g006
Table 1. Clinical characteristics of gastric cancer lesions in the dataset.
CharacteristicsNumber of Cases
Tumor position
Lower third33
Middle third52
Upper third9
Macroscopic classification
Type 0-I0
Type 0-IIa10
Type 0-IIb0
Type 0-IIc63
Type 0-III0
Type 0 mixed (0-IIa + IIc and IIc + III)21
Depth of tumor invasion
T1a (mucosa)71
T1b (submucosa)23
Histopathological classification
Undifferentiated13
Differentiated75
Mixed6
Table 2. Comparison of CNN architectures for false positive reduction.
ClassifierDetection SensitivityFalse Positives/Image
Lesion-BasedImage-Based
None0.9890.9420.0348
VGG160.9890.9420.0348
ResNet500.9890.9320.0281
DenseNet1210.9780.9160.0273
DenseNet1690.9890.8970.0108
DenseNet2010.9890.9010.0240
Table 3. Evaluation results of Di and Ji for cancer segmentation.
Evaluation Using All Gastric Cancer CasesEvaluation Using the Detected Gastric Cancer Cases
DiJiDiJi
Previous method [16]0.5420.3710.7200.494
Proposed method0.5550.4270.6020.463
Publisher’s Note: MDPI stays neutral with regard to jurisdictional claims in published maps and institutional affiliations.

