1. Introduction
All sensory perceptions, thoughts and ideas can be understood as cerebral electrical excitation patterns. However, to date, it has not been clarified in detail which excitation pattern corresponds to which sensory perception. Several approaches in brain research are used to identify which areas of the cortex are particularly activated during certain sensory perceptions or activities. One of them is the acquisition of evoked potentials (EPs), which means to measure and evaluate the response of the brain to a specific stimulus. Depending on the type of the stimulus, there exist well-known techniques, such as capturing visually evoked potentials (VEPs), auditory evoked potentials (AEPs), and somatosensory evoked potentials (SSEPs), and more uncommon ones, such as EPs, based on gustatory, olfactory, and pain stimulation [
1]. The field of application is very broad, for instance, early diagnosis and monitoring of a specific disease, usage within a brain computer interface (BCI) [
2,
3], and prediction of a long-term disability [
4], etc. Although imaging methods, such as magnetic resonance imaging (MRI), have replaced EPs in some applications, for instance, in diagnosis of multiple sclerosis (MS), EPs still have crucial advantages. First, the measurement setup is non-invasive and at low cost; second, the temporal resolution is very high (i.e., in the range of ms) and the stimulus may be repeated several times to increase the signal quality; and third, the subject does not necessarily need to be conscious. In particular, the use of EPs during general anesthesia has increased their impact in clinical studies. Predicting post-operative visual output [
5,
6] or estimating the depth of anesthesia based on AEPs are only two examples [
7,
8]. Additionally, EPs are useful in follow-up and for monitoring the effect of a therapy or the disease course.
Despite the fact, that several scientific issues concerning EPs have been investigated and (partly) answered, surprisingly in the case of VEPs, there are only a few studies about the impact of the stimulus color onto the recorded response [
9,
10,
11,
12,
13,
14,
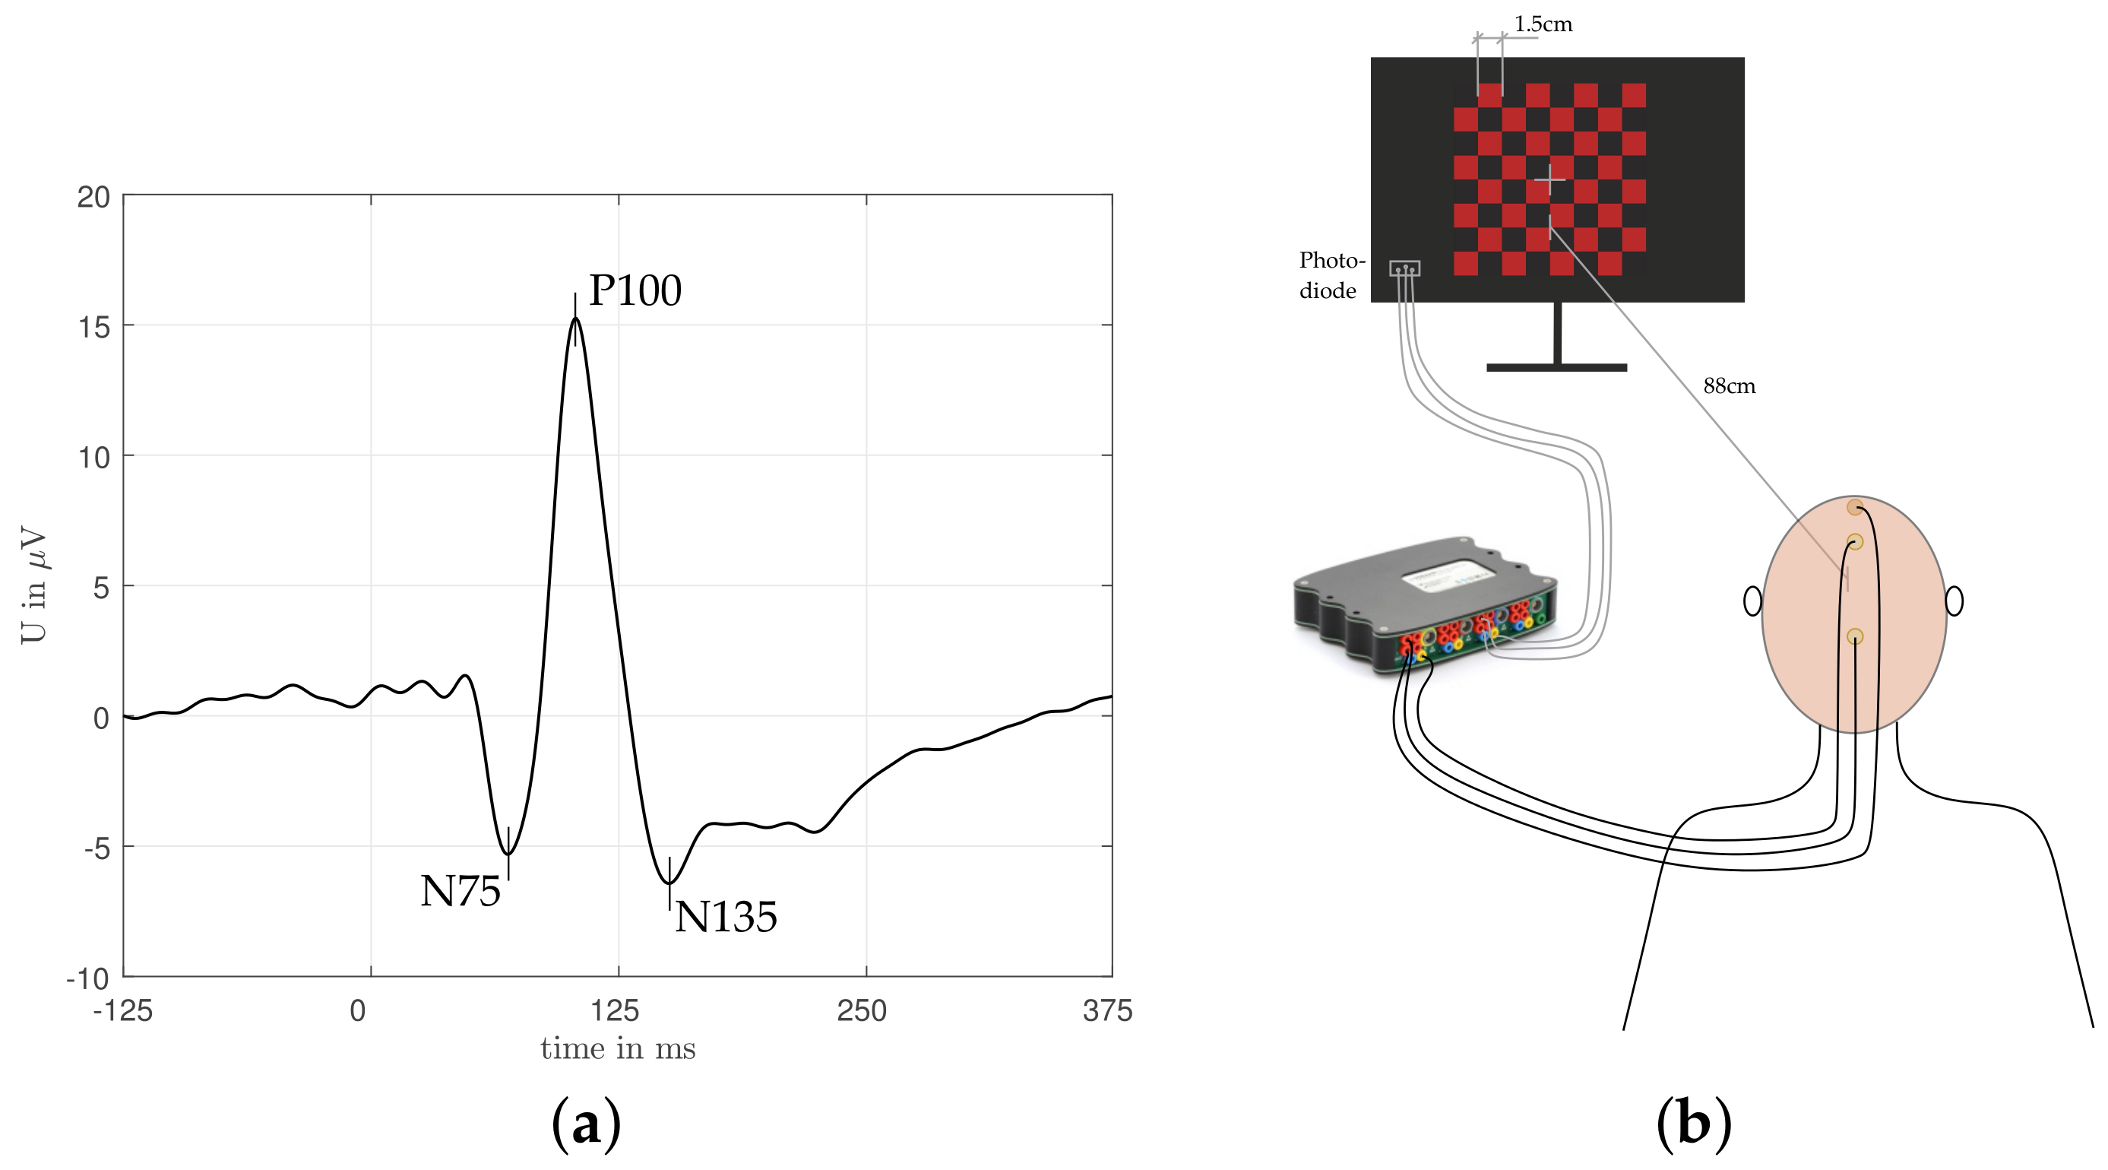
15]. In these studies, either event related transient VEPs or steady-state visually evoked potentials (SSVEPs) were investigated. The first type of stimulation results in a series of well-known deflections, illustrated in
Figure 1a, triggered by a not-necessarily periodic stimulus, for instance checkerboard inversion, with a long enough pause between the single stimuli. In contrast to that, SSVEPs are induced by a higher frequent change of a specific stimulus leading to a sinusoidal-like brain response. The main findings of [
9,
10,
11] showed that different colors lead to different brain responses, which was determined by investigating several frequency ranges of the steady-state visually evoked potentials (SSVEP)s. The authors of [
10] found a relationship between the wavelength of the color and the impact onto the SSVEP, where colors with higher wavelength (e.g., red) tended to have a higher impact compared to colors with low wavelength (e.g., violet). Similar observations were made by [
11], who investigated the brain responses to red/black, yellow/black, and green/black checkerboard patterns, as well as to the achromatic stimulus. Their study showed that, depending on the color and the intensity, the VEPs differ in latency and shape when averaging across 100 single trials. Going one step further, in our study we investigate whether it is possible to automatically classify the color based only on a few repetitions for which machine learning is well suited for. Machine learning has shown to be advantageous in several related fields. Impressive results in BCI research [
16] or heartbeat classification for arrhythmia detection [
17] are only two examples of many. Architectures, such as an artificial neural network (ANN), allow to find crucial patterns and information in data, which could stay undetected when using traditional methods and statistical testing. Hence, in the best case, it could even be possible to train a classifier onto a specific number of volunteers and subsequently apply the trained classifier to unknown test subjects in order to determine their ability to distinguish between two colors. This approach would allow online monitoring of a person’s color discrimination ability, which possibly varies in specific situations.
Hence, we believe that this approach could be beneficial in several cases. First, it may provide a better insight into the cognitive processing of different colors or help to identify a possible color blindness at a very early stage—that is, for infants. Second, in case of BCIs, different colors may be used as additional discriminating possibility or as suggested by [
10], the performance in terms of VEP detection can be increased by selecting the best suited color. Third, studies have revealed that anesthesia influences latency and the peak-to-peak amplitude of the induced VEPs [
6,
18]. In that context, a further scientific question would be whether the ability to discriminate colors is influenced by anesthesia or even vanishes at a specific state of anesthesia. Clearly, this question is not limited to color discrimination or VEPs particularly. Moreover, the (possibly vanishing) ability to distinguish between different auditory or somatosensory stimuli may be investigated. Those future studies could subsequently be helpful in estimating the state of anesthesia more accurately and allow better interpretation in terms of the functionality of the different sensing organs.
Consequently, in our study, we show that up to a certain degree it is possible to automatically classify the stimulus color by investigating the shape of the VEPs in an intra-subject and even inter-subject setting. For that, we evaluate the classification performance of an ANN for red/black and green/black checkerboard patterns, respectively. Note that the pattern reversal method requires the subjects to be conscious and stare at the stimulus. Addressing online monitoring of the color discrimination ability during anesthesia, this is clearly not provided. However, alternatively, a flash stimulus applied on the closed eye could be generated by light-emitting diode (LED) goggles. Thus, this study should be seen as proof-of-concept to perform automated color classification using VEPs, which allow to answer further interesting aspects in research.
2. Materials and Methods
Many different methods, such as the onset/offset, flash, and pattern reversal methods were proposed for the measurement of VEPs, resulting in different characteristic VEP signal shapes. For our study, we used the pattern reversal stimulus because of its high validity in inducing human VEPs, simplicity of implementation, lower intra- and inter-subject variability, and its major effects on the magnitude of the VEP [
1].
Nine healthy subjects with normal or corrected to normal vision, and no known color deficiencies, were tested. The participants with a median age of
years were all white, six of them were male and three were female. Subjects were informed about the experiment and consented. Care was taken to have the subject in a comfortable well-supported position to minimize eye movements and other artifacts. The checkerboard stimuli were generated on a DELL U2412Mc monitor. According to [
19], the visual angle was set to
(60 min of arc) leading together with the check size
cm to a visual distance of
cm (
Figure 1b). Two colors (red and green) were tested in addition to the achromatic stimulus, which was recorded in beginning of the experiment for ensuring the general functionality of the setup. For the experiment itself the checkerboard was designed as black/colored checks and the reverse frequency was
Hz. Intensities of the checkerboard colors were adjusted to have both the same value; that is 15 cd/m
, calibrated by using a light-meter (Gossen Mavolux 5032C) in a darkened room.
VEPs were recorded using a biomedical signal amplifier (gtec USBAMP research, 16 channel EEG amplifier) at a sampling rate of
Hz. Gold cup electrodes were fixed following the 10–20 international system along the mid-line at the occipital (OZ), central (CZ), and frontal lobe (FZ), measuring the voltage difference between OZ and FZ and setting CZ to ground [
19]. Electrode placement was modified, until the electrode impedance was constantly below 5 k
for any electrode.
2.1. Experiment Procedure
After electrode fixation subjects were told to focus on the fixation point in the middle of the checkerboard (
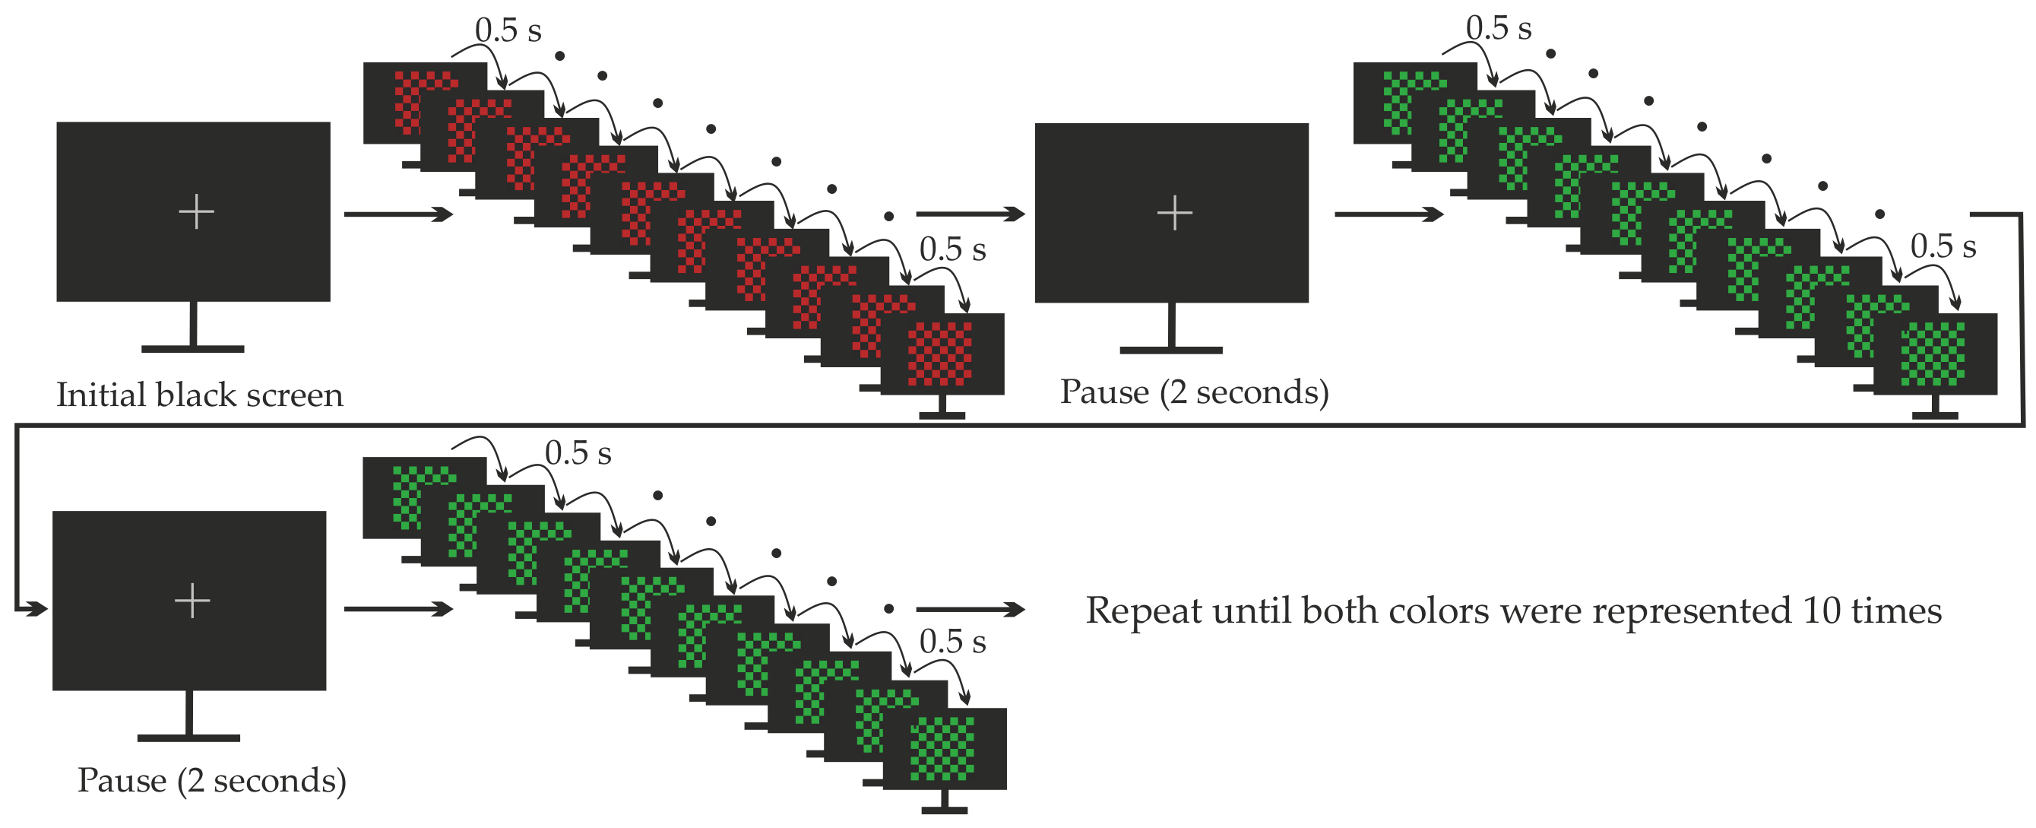
Figure 1b). As illustrated in
Figure 2, as soon as the initial black screen disappeared, either the red/black or the green/black checkerboard (chosen randomly) started to flicker for nine inversions at a rate of 2 Hz. This was followed by a two seconds pause, during which the subjects were instructed to swallow or blink their eyes if necessary, allowing to eliminate physiological noises as far as possible in advance. After this two second pause, another episode of nine checkerboard inversions started, again selecting the presented color randomly. This procedure was repeated until both colors were represented 10 times, which is considered in the following as one experimental run. Such an experimental run was carried out eight times for each subject, allowing the test person to take a break after each run. The whole experiment lasted about an hour per person. Standard preprocessing was applied, that means a 50 Hz notch filter for suppressing power line interference and a bandpass filter with cut-off frequencies 0.1 Hz and 100 Hz, respectively, to cancel baseline drift and high frequency noise. Subsequently, the recordings were sliced and aligned based on the recorded switching points (checkerboard inversion), which were captured using a photo diode placed on the screen (
Figure 1b). In total, we received 1440 single trials per subject, 720 for the red/black stimulus, and 720 for the green/black one. However, in order to increase the signal quality, the single trials were averaged across nine consecutive checkerboard inversions. Consequently we obtained 20 averaged VEPs per experimental run (10 with a red/black stimulus and 10 green/black one), or in total 160 VEPs per subject.
2.2. Model Training and Performance Evaluation
We received a data set consisting of 160 averaged VEPs per subject or in total 1440 for all subjects. Since ANNs have shown to be effective in the analysis of time series we chose a fully connected ANN with one hidden layer and logistic activation functions to test the general possibility of classifying VEPs caused by two different colors. For that, we considered three different scenarios: training and prediction individually for each participant, for all participants together, and training for all but one participant whose data were then used as the test set. In order to avoid a too optimistic estimate of the ANN to correctly classify the color, we performed nested cross-validation [
20]. For the first two scenarios, we randomly split the cohort of measurements into ten equally large groups, so-called folds. Nine of these groups are subsequently used as training set and one as withheld test set. Hence, for the first scenario, the training set consisted of 144 averaged VEPs per subject, while for the second scenario we obtained 1296 averaged trials. For the training set an (inner-loop) five-fold cross-validation was carried out for model training and hyperparameter tuning; that means, selecting the size and the weight decay of the ANN by performing a grid search. The optimized model with the best hyperparameters was then applied to the withheld test set to obtain the performance measures accuracy (ACC), area under the curve (AUC), and the F1-score. We determined the AUC by evaluating the receiver operating characteristic (ROC) curve, which was generated for the according withheld test sets after each outer loop run of the cross-validation. Clearly, the whole procedure was repeated 10 times for the outer 10-fold cross-validation leading to a reliable estimate of the model performance. For the third scenario, the procedure was similar, however the training and test set were not selected randomly, but according to the subjects. Hence, in this case, we actually carried out a 9-fold cross-validation using eight subjects as the training set and one as an independent, withheld test set. For the inner cross-validation, again, the training set was split into five folds.
3. Results
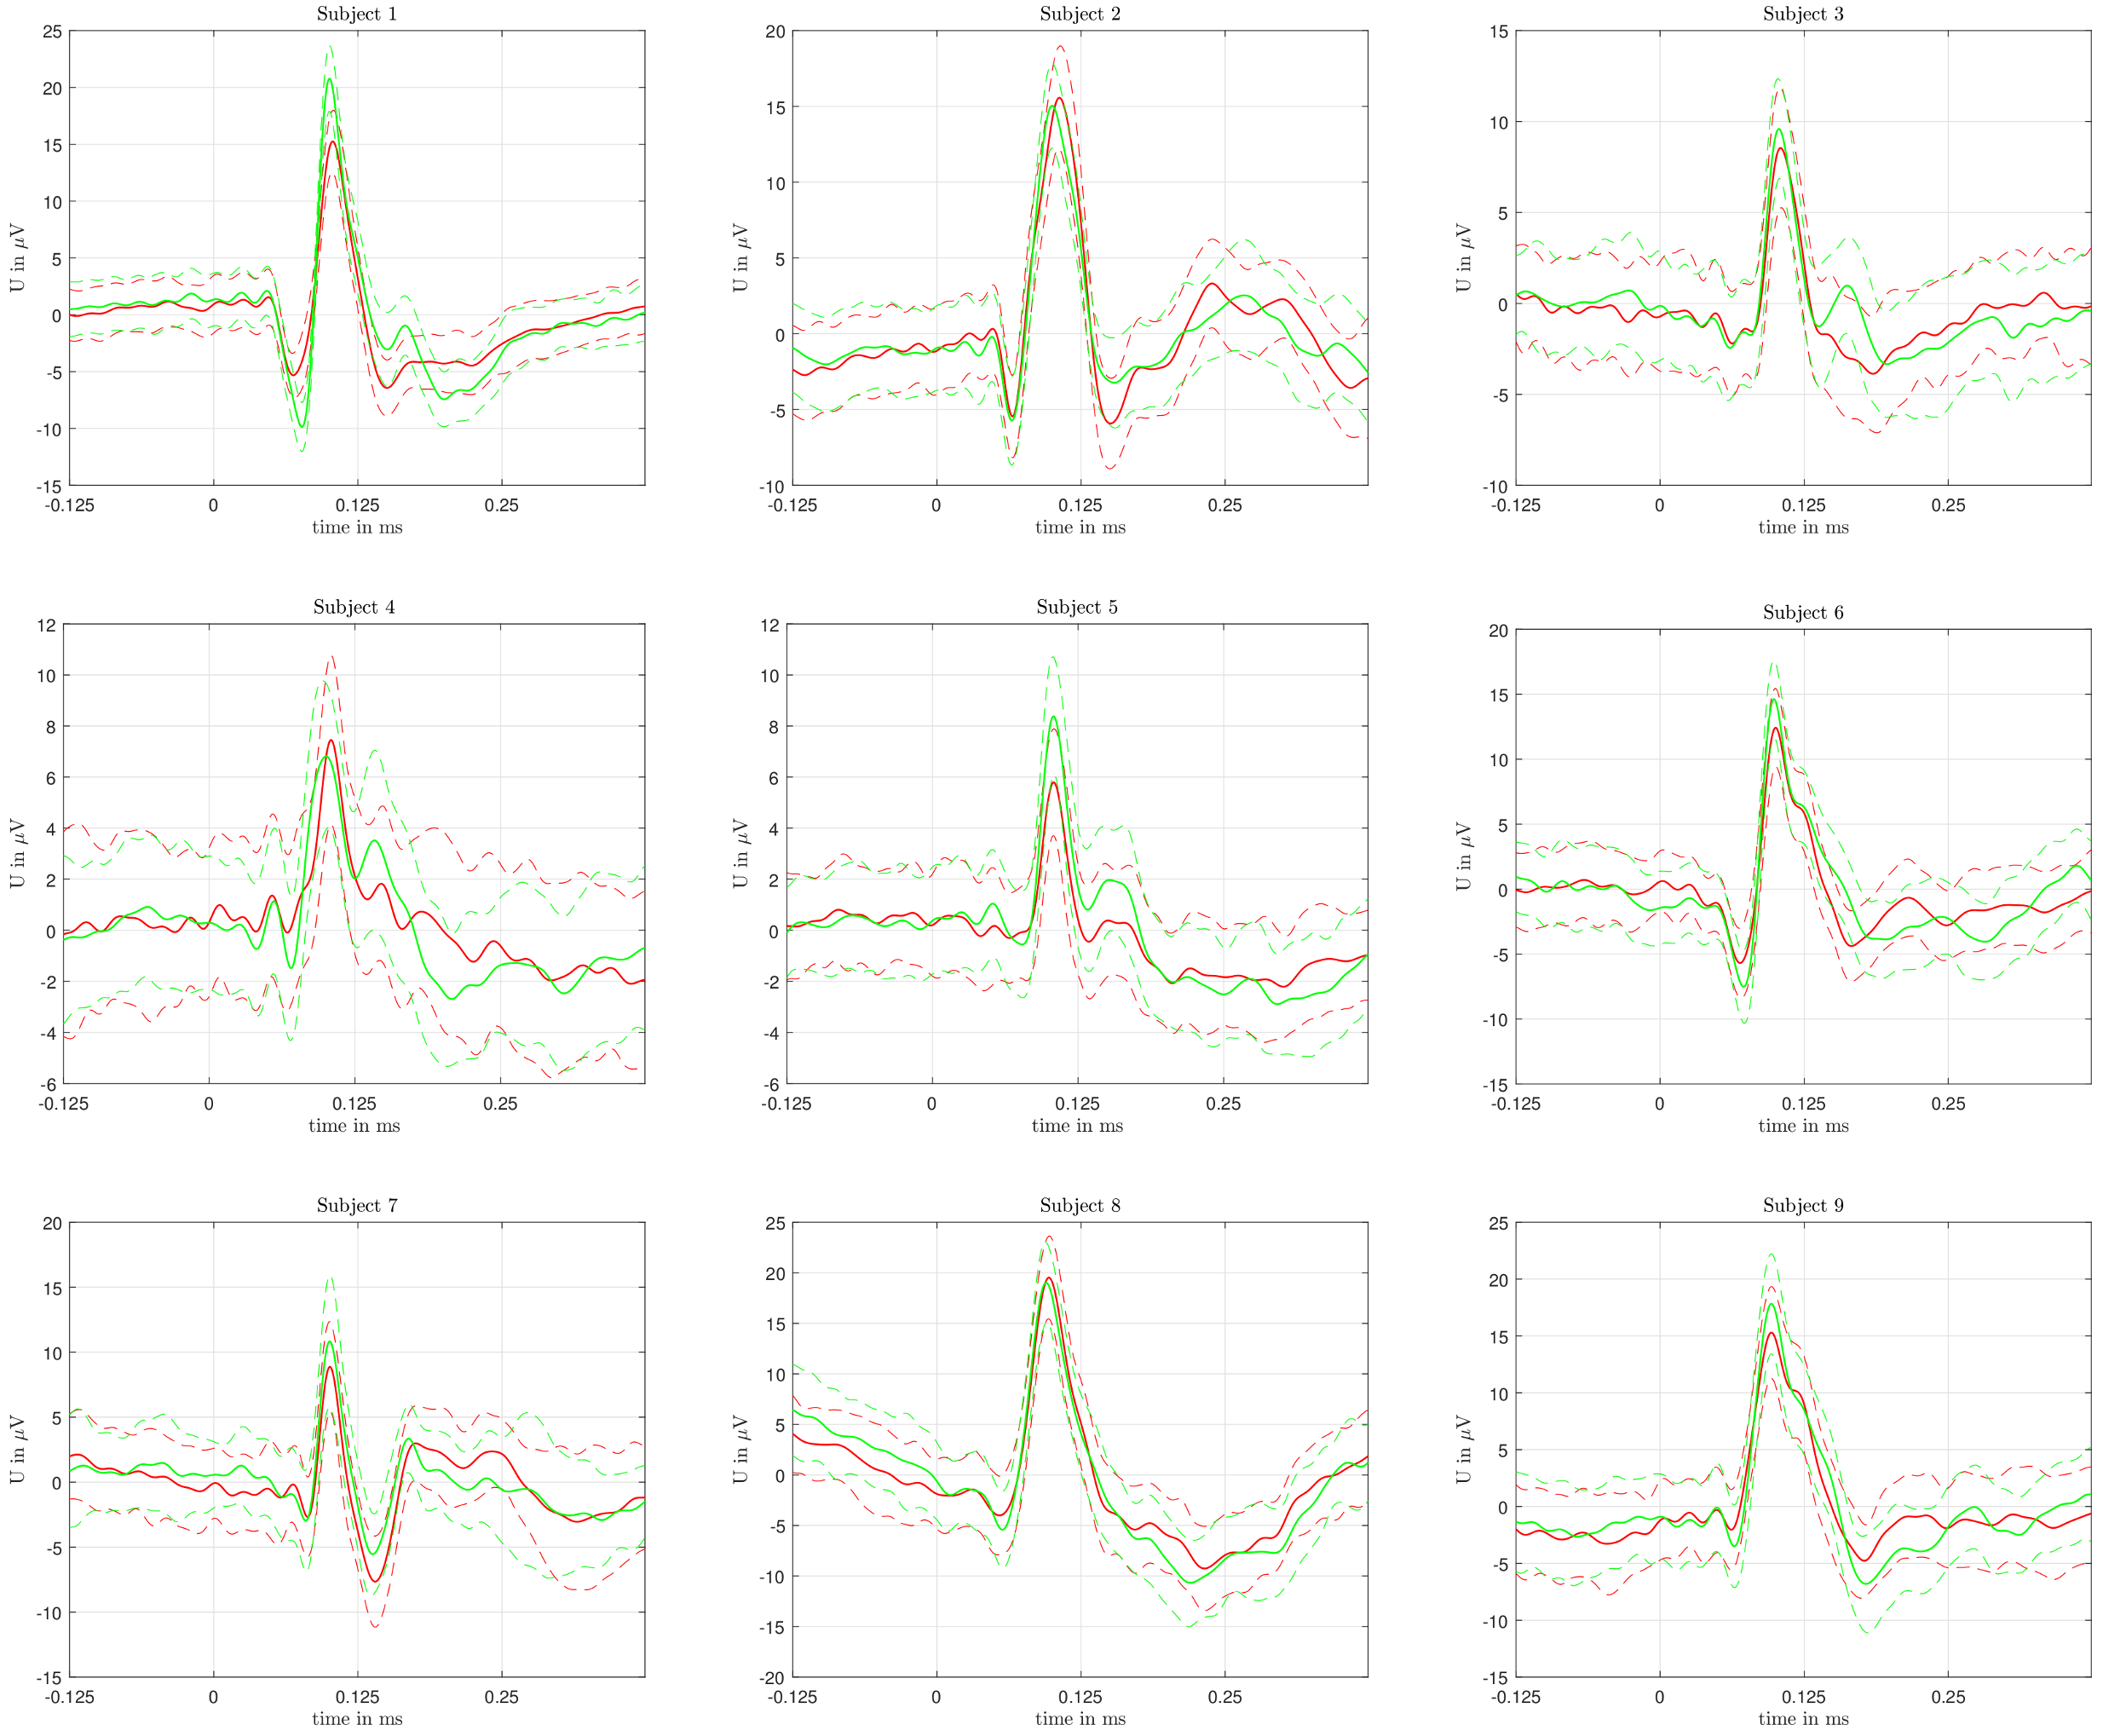
Each volunteer went through the complete test protocol; none had to interrupt the study, for technical reasons, and as a consequence, all measurements of all participants were obtained within one session. A total of 1440 checkerboard flickers were recorded for every volunteer, resulting in 160 labeled averaged sweeps for each of them.
Figure 3 shows a color-coded depiction of the averaged VEPs for every volunteer. In all subjects, the mean VEPs (across all single trials) differ. However, we also notice that the standard deviations of the VEPs are very high.
Table 1 illustrates accuracy, AUC, and F1-score for three different classification experiments; that is, color classification in each individual volunteer with an individual model, color classification in all individuals with a common model, and color classification in each individual volunteer with a model trained on the data of all others. As expected, the mean results were the best for creating an individual model for each participant. However, although the performance measures are downgraded in the other two cases, we still observe a reasonable predictive accuracy across all subjects. Note that, for the first and the third scenarios, the performance values strongly depend on the subject.
As indicated in
Figure 3, different areas of the raw signal were responsible for the successful classification of the two colors. In particular, the characteristic deflections (N75, P100, N135—cmp. to
Figure 1a) seem to have a bigger influence on the correct classification.
4. Discussion
Our results clearly demonstrate that—after model training and up to a reasonable accuracy—it is possible to distinguish colors by analyzing a low number (<10) of VEPs using an ANN with one hidden layer, a standard method of machine learning. The main result of this study was that this differentiation is generally possible, although it has to be pointed out that there are some individual differences in the quality of the prediction for different volunteers (
Table 1). Nevertheless, color classification was even possible if models were trained with data of other individuals, indicating robust inter-individual differences of VEPs induced by different colors.
4.1. Study Design and Measurement Setup
The colors were chosen to be red and green in order to be classified in this study. From theoretical considerations, it was assumed that these two complementary colors could show a large difference in the range of VEPs. However, other color combinations may even perform better in terms of color classification, while red and green have the lowest discrimination threshold for this specific type of color classification. Additionally, it is not clear whether the observed differences are caused by the two colors or by (subjectively felt) intensity differences. Although the light density of the two colors was adjusted to have the same value; that is 15 cd/m, the subjective sensation of the test subjects may have differed for the two colors. Interestingly, the subjects described the green/black checkerboard to be brighter than the red/black one. In this context, further investigations could be carried out, dealing with different intensities and colors.
Furthermore, one may argue that the observed small differences in latency, steepness, and area of the VEPs could be explained by varying attention or vigilance and, consequently, would not be caused by the different colors. However, due to the selected order of the stimulus presentation, it is very unlikely that varying attention and vigilance cause the differences. As stated in
Section 2 and depicted in
Figure 2, the colors were represented in a random order (e.g., red, red, green, red, green, green, red, ...) and not block-wise (e.g., red, red, red, ..., red, green, green, green, ..., green). Therefore, fading attention should equally impact the VEPs of both colors.
Moreover, we derived VEPs only from the occipital lobe (OZ), since it was not the aim of our study to diagnose any malfunction of visual signal processing in the brain, but only on the terminal processing of the optical signal. It is known that processing of optical impressions takes place in the area of the occipital lobe, which is why this brain region was used for the measurements. However, it cannot be ruled out that an even better classification might be possible using other brain regions, which should be investigated in the future.
4.2. Pre-Processing and Analysis
In order not to lose possibly crucial discriminate attributes, we only performed standard denoising as described in
Section 2. Applying more sophisticated techniques for this task, such as wavelet denoising [
21] or low-dimensional waveform representation [
22], might even improve the results. Additionally, the alignment of the single-trial VEPs before averaging could be investigated in more detail. Although we used a photodiode to detect the exact switching point of the monitor, the specific response might still be slightly premature or delayed, which leads to an undesired smoothing effect of the averaged evoked potentials. Investigating these factors in more detail, could help to further improve the classification performance; however, it was not the aim of this work to optimize the classification results, but to illustrate the basic possibility to classify colors.
For that reason, we also decided to carry out the classification with a rather simple standard method of machine learning; that is an ANN with one hidden layer. Theoretically, other algorithms can also be used for this classification task, but most of these methods require a somewhat more complex selection of hyperparameters, which significantly influences their results. Since the aim of this work was to generally investigate automatic color classification using VEPs rather than comparing machine learning approaches, we limited our work to the ANN. Nevertheless, more sophisticated algorithms, for example a model driven neural network architecture [
23], might even result in an improvement of classification, and should therefore be investigated in the future.
4.3. Interpretation of the Results
In all subjects, it was possible to detect the color with which a visually evoked potential was triggered using the methods described above. This is shown by the reasonable values for ACC, AUC, and F1-Score. It can therefore be assumed that it will generally be possible to predict the color with which a visually evoked potential was triggered in a test person after prior training. Surprisingly, the scenario without training on the data from an individual patient resulted in comparable performance, indicating that the pattern of color-induced VEPs is somewhat similar between individual patients.
However, we should note that the accuracy of this prediction was not equally high in all subjects (see
Table 1). It is not completely clear why the classification performed better in some subjects than in others. Differences in the classification performance could be explained by different signal qualities and, thus, differences in signal purity. Variations in the fixation of electrodes could also play a role here, although strict care was taken to always place the electrodes to the same defined locations on the orbital skull. Nevertheless, conductivity between the electrodes and the skin possibly decreased during the measurement due to unintentional body/electrode movement. Unfortunately, electrode impedance was only checked in the beginning of the experiment; hence, a decreasing signal quality due to worse electrode impedance values is a possible reason, but cannot be verified. Therefore, for future studies, we suggest to regularly measure resistance during the experiment.
In addition, different degrees of attention of the test persons could have influenced the results. Although all test persons were asked to focus on the stimuli as much as possible, it cannot be assumed that this was the case for all test persons to the same extent at all times during the measurement. Accordingly, any distraction by external stimuli could falsify the results.
However, it could equally be true that there are subtle differences in the brain structures or in information processing of the individual participants caused by differences in experiences. In that context, a possible color blindness or red/green deficiency may also cause worse classification results. Although we defined such a deficiency as an exclusion criterion and included only participants with no known color deficiency, theoretically it may have happened that participants with a (minor) red/green weakness were included. To avoid this in future studies on this topic, it has to be assured that the subjects are color fit, either by examining the color fitness by an Anomaloskop or at least by carrying out a color vision test, such as the Ishihara or the Richmond Hardy Rand--Rittler pseudoisochromatic test [
24].
In general, it can be stated that characteristic times in the VEPs of all subjects were responsible for the classification. In particular, the steep rise of the N75 wave, as well as the areas around the P100 and N135 waves seem to play a major role (see
Figure 3). The physiological/anatomical background of the VEPs with regard to color recognition is not yet known and should also be investigated in the future.


 ,
, 


