Article

Field Tests on Bearing Characteristics of Large-Diameter Combined Tip-and-Side Post Grouted Drilled Shafts

1
Key Laboratory of Concrete and Prestressed Concrete Structures of Ministry of Education, Southeast University, Nanjing 210096, China
2
School of Civil Engineering, Southeast University, Nanjing 210096, China
3
Anhui Transport Consulting & Design Institute Co., Ltd., Hefei 230088, China
*
Author to whom correspondence should be addressed.
Submission received: 9 November 2021 / Revised: 25 November 2021 / Accepted: 9 December 2021 / Published: 14 December 2021
(This article belongs to the Special Issue Recent Progress on Advanced Foundation Engineering)

Abstract

:
This paper presents a field study on the axial behavior of four large-diameter drilled shafts embedded in coarse sand. The grouting and loading test procedures were reported. The bearing capacity of shafts (TS1 and TS2) and grouted drilled shafts (TS3 and TS4) were herein determined by the bi-directional static test and top-down load test, respectively. The enhancement mechanism of bearing characteristics of the grouted shafts was discussed in detail. The test results indicate that the bearing characteristics and load transfer mechanisms of the test shafts were significantly affected by the quantity of pressurized cement slurry and the mechanical properties of the soil surrounding the shafts. Furthermore, the tip resistance of shaft can be mobilized more rapidly and fully after grouting, the side and tip resistance are mobilized in a more synchronized and coordinated manner due to the pre-mobilization of the grouted cement. Additionally, the standard penetration test (SPT) prediction model was introduced to calculate and predict the SPT blow counts of soil after grouting. The results show that the post grouting has a more obvious improvement on the strength of cohesionless soil.

1. Introduction

Drilled shafts have a long history of use where soil strata immediately below the shallow ground are not strong enough to prevent bearing failures or excessive settlements. Drilled shafts develop loading resistance from a combination of tip and side resistances that are mobilized as the shafts are loaded. Unfortunately, a significant portion of a drilled shaft’s tip resistance is unusable due to the vertical displacement required for mobilization [1,2,3]. This leads to larger diameter and deeper shafts or more numbers of shafts to be utilized than would be needed if the shaft tip capacity were also incorporated into the design. However, due to factors related to construction difficulties and higher costs, continuous attempts are being made to improve the performance of drilled shafts without increasing the diameter of the shafts [4,5].
Post grouting techniques have gradually become a trend to be used as a method to improve shaft performance. In this procedure, the compaction grout is pumped into the soil around the shaft; then, the mud around the shaft and the sediments at the tip of the shaft are penetrated, compacted and separated by the cement slurry. As a result, the mechanical properties of the soil around the shaft are improved and the bearing performance of the shaft is further enhanced [6,7,8,9,10].
Full scale field tests have been carried out to study the reinforcement mechanism of post-grouting for drilled shaft by many researchers. Sinnreich and Simpson [11] presented fourteen full-scale load tests (including nine grouted and five ungrouted shafts) conducted in various parts of the United States. They found that the improvement of tip grouting on the stiffness and/or overall capacity could not be shown in all circumstances. This could be due to differences in factors such as geological conditions, grouting equipment, grout properties and grouting pressure. Thus, further research into the enhancement mechanism of bearing characteristics of the grouted shafts is needed. Frizzi et al. [12] discussed the effects of construction methods and drilling slurries on observed side shear and end bearing load transfer. Ruiz and Pando [13] investigated the load transfer mechanisms of drilled shafts installed in sandy soils after grouting. Thiyyakkandi et al. [14] analyzed the axial loading performance on various sized grouted piles by experiment and FEM method. Dai et al. [15] conducted in situ static load test to illustrate the grouting effect of a large diameter grouted drilled shaft. The test results of drilling and coring showed that the return height of grout reached 15 m, and the number of standard penetration test (SPT) blows with grouting was generally increased. Day et al. [16] described a method for quantifying improvements due to pre-mobilization and ground improvement performed on grouted drilled shafts. Subsequently, Wen et al. [17] clarified that the bearing capacity of steel pipe micropiles embedded in marine soft clay soils can be significantly influenced by post-grouting craftwork.
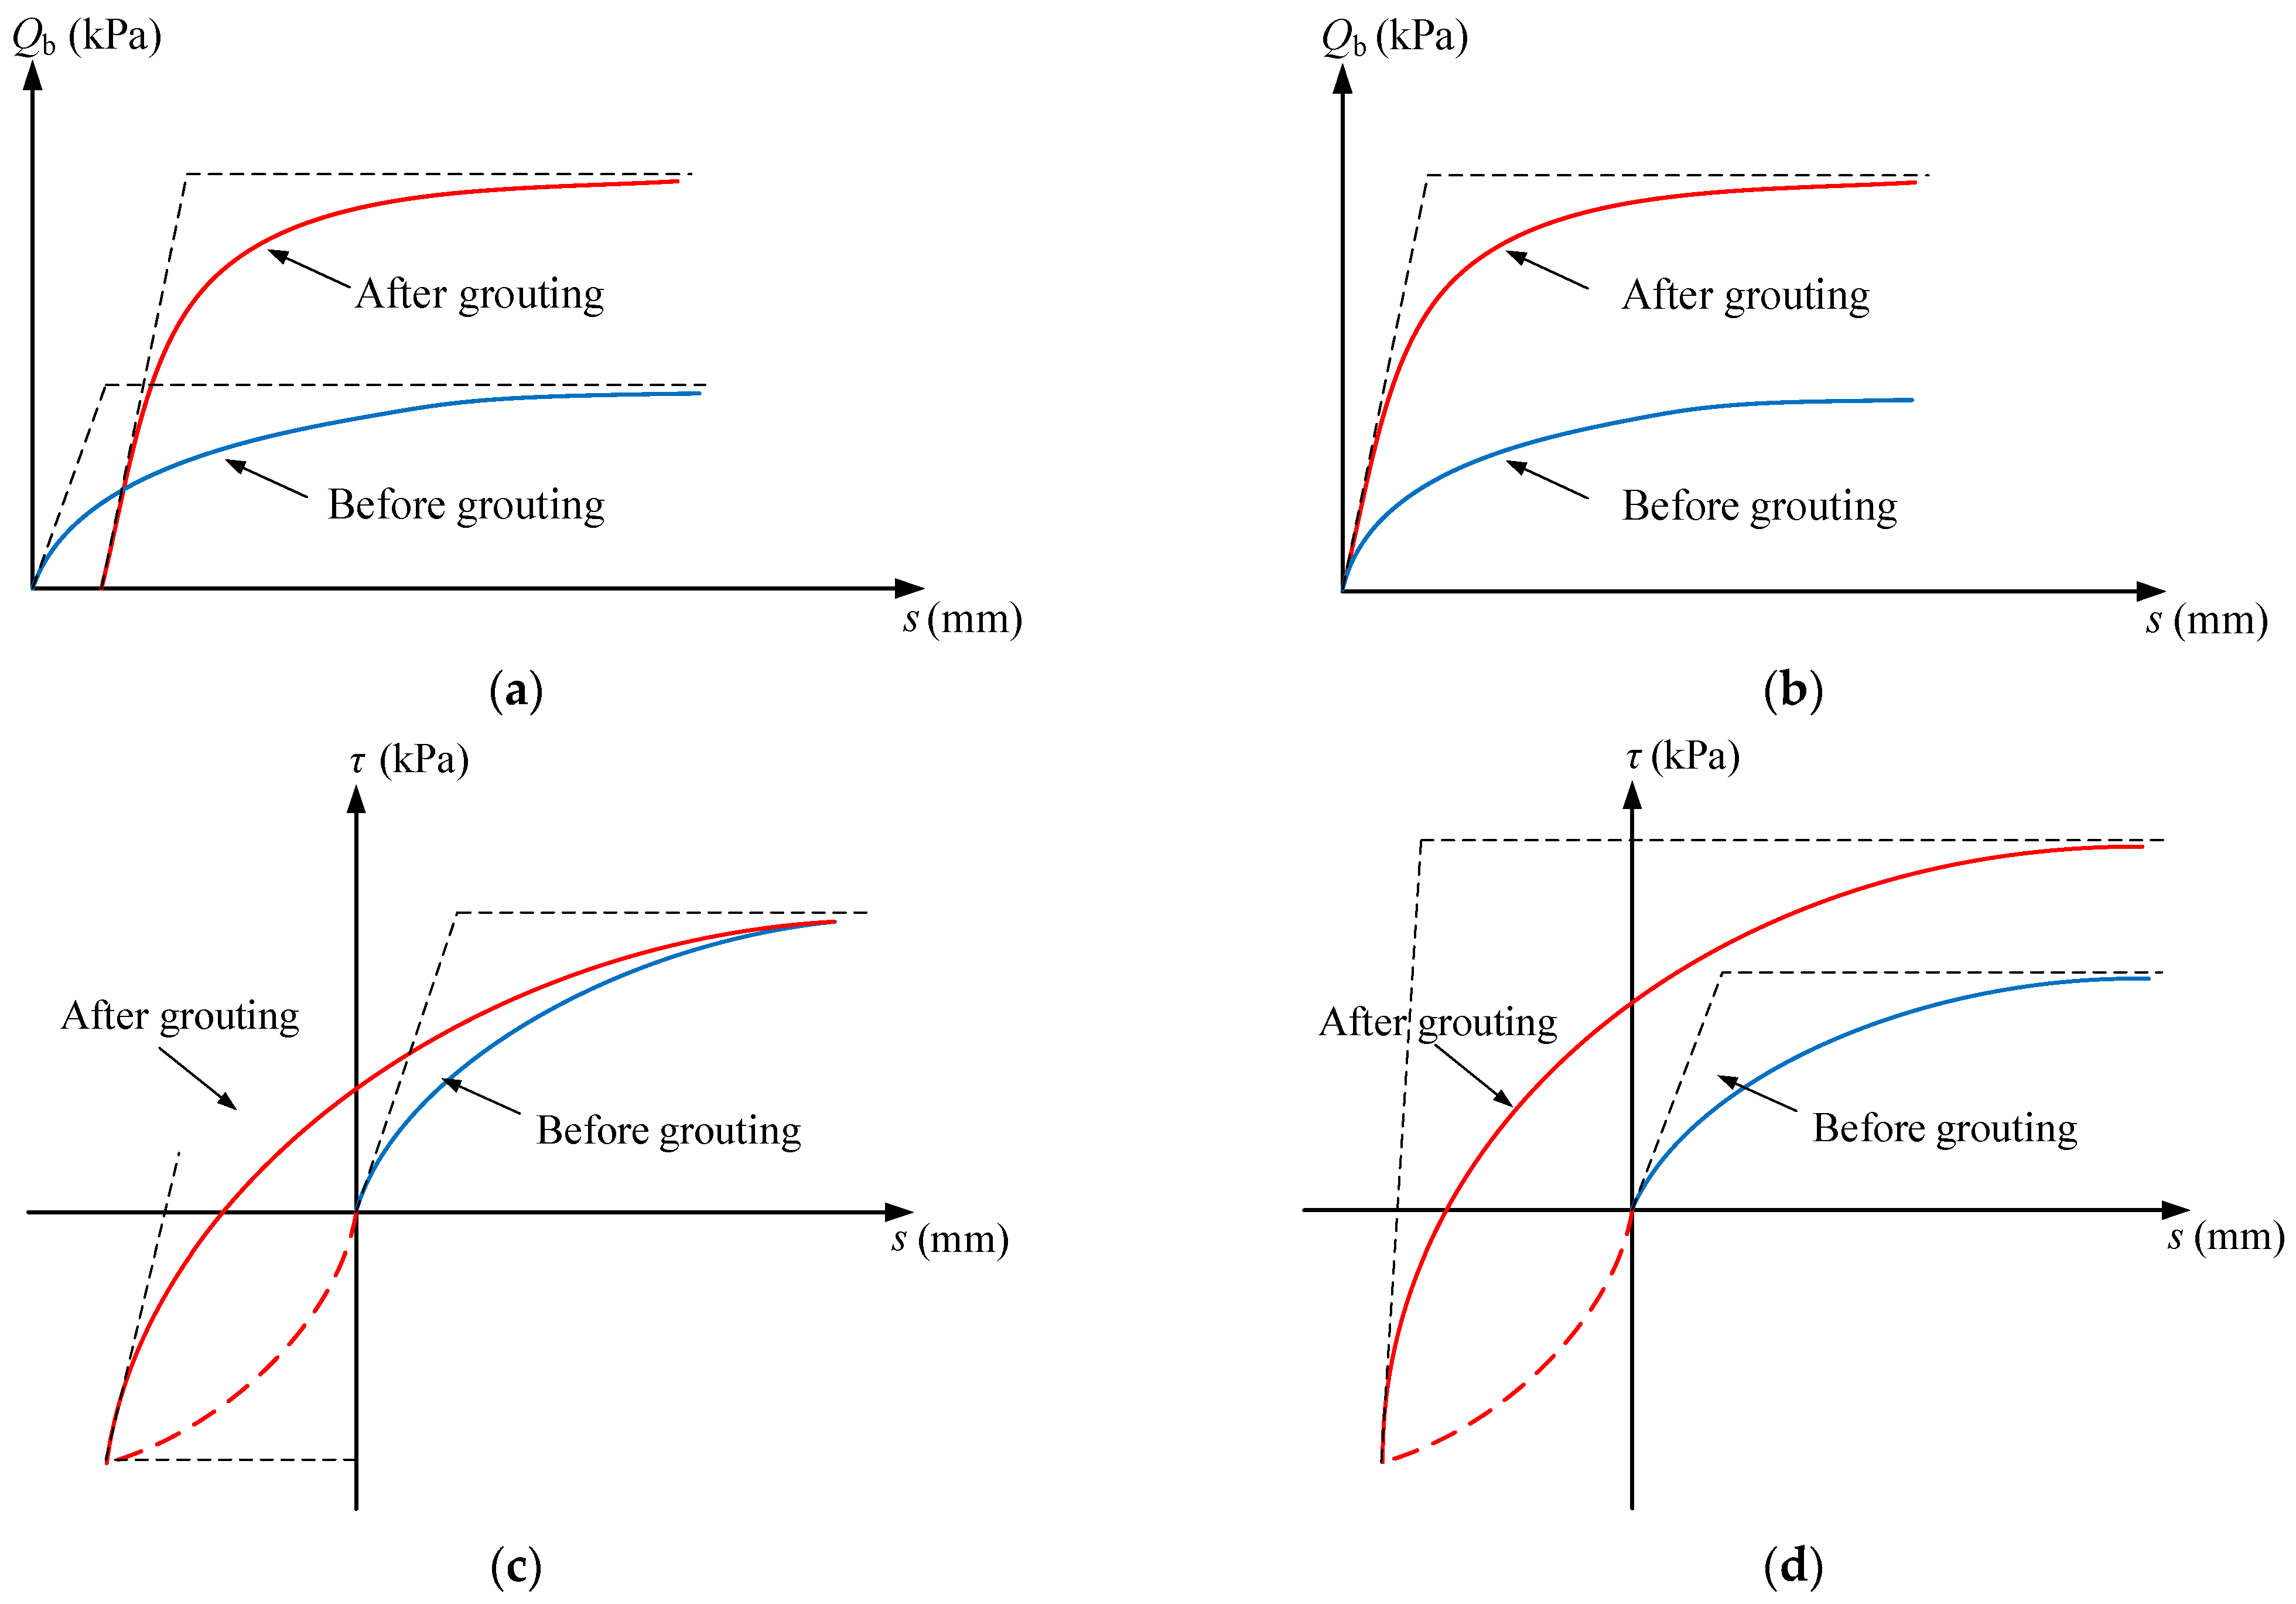
In conclusion, the mechanism of post-grouting technique to improve the bearing performance of drilled shafts has been summarized into four factors [5,15,18,19,20,21,22]: (1) compression of the soil under the shaft tip, (2) increase of the shaft tip area due to the formation of the grout bulb, (3) redistribution of residual stresses along the shaft due to the prestressing of the tip, and (4) grout is migrated and infiltrated along the axis by pressurization so that the soil mechanical properties on the shaft side are strengthened. These effects are summarized on Figure 1.
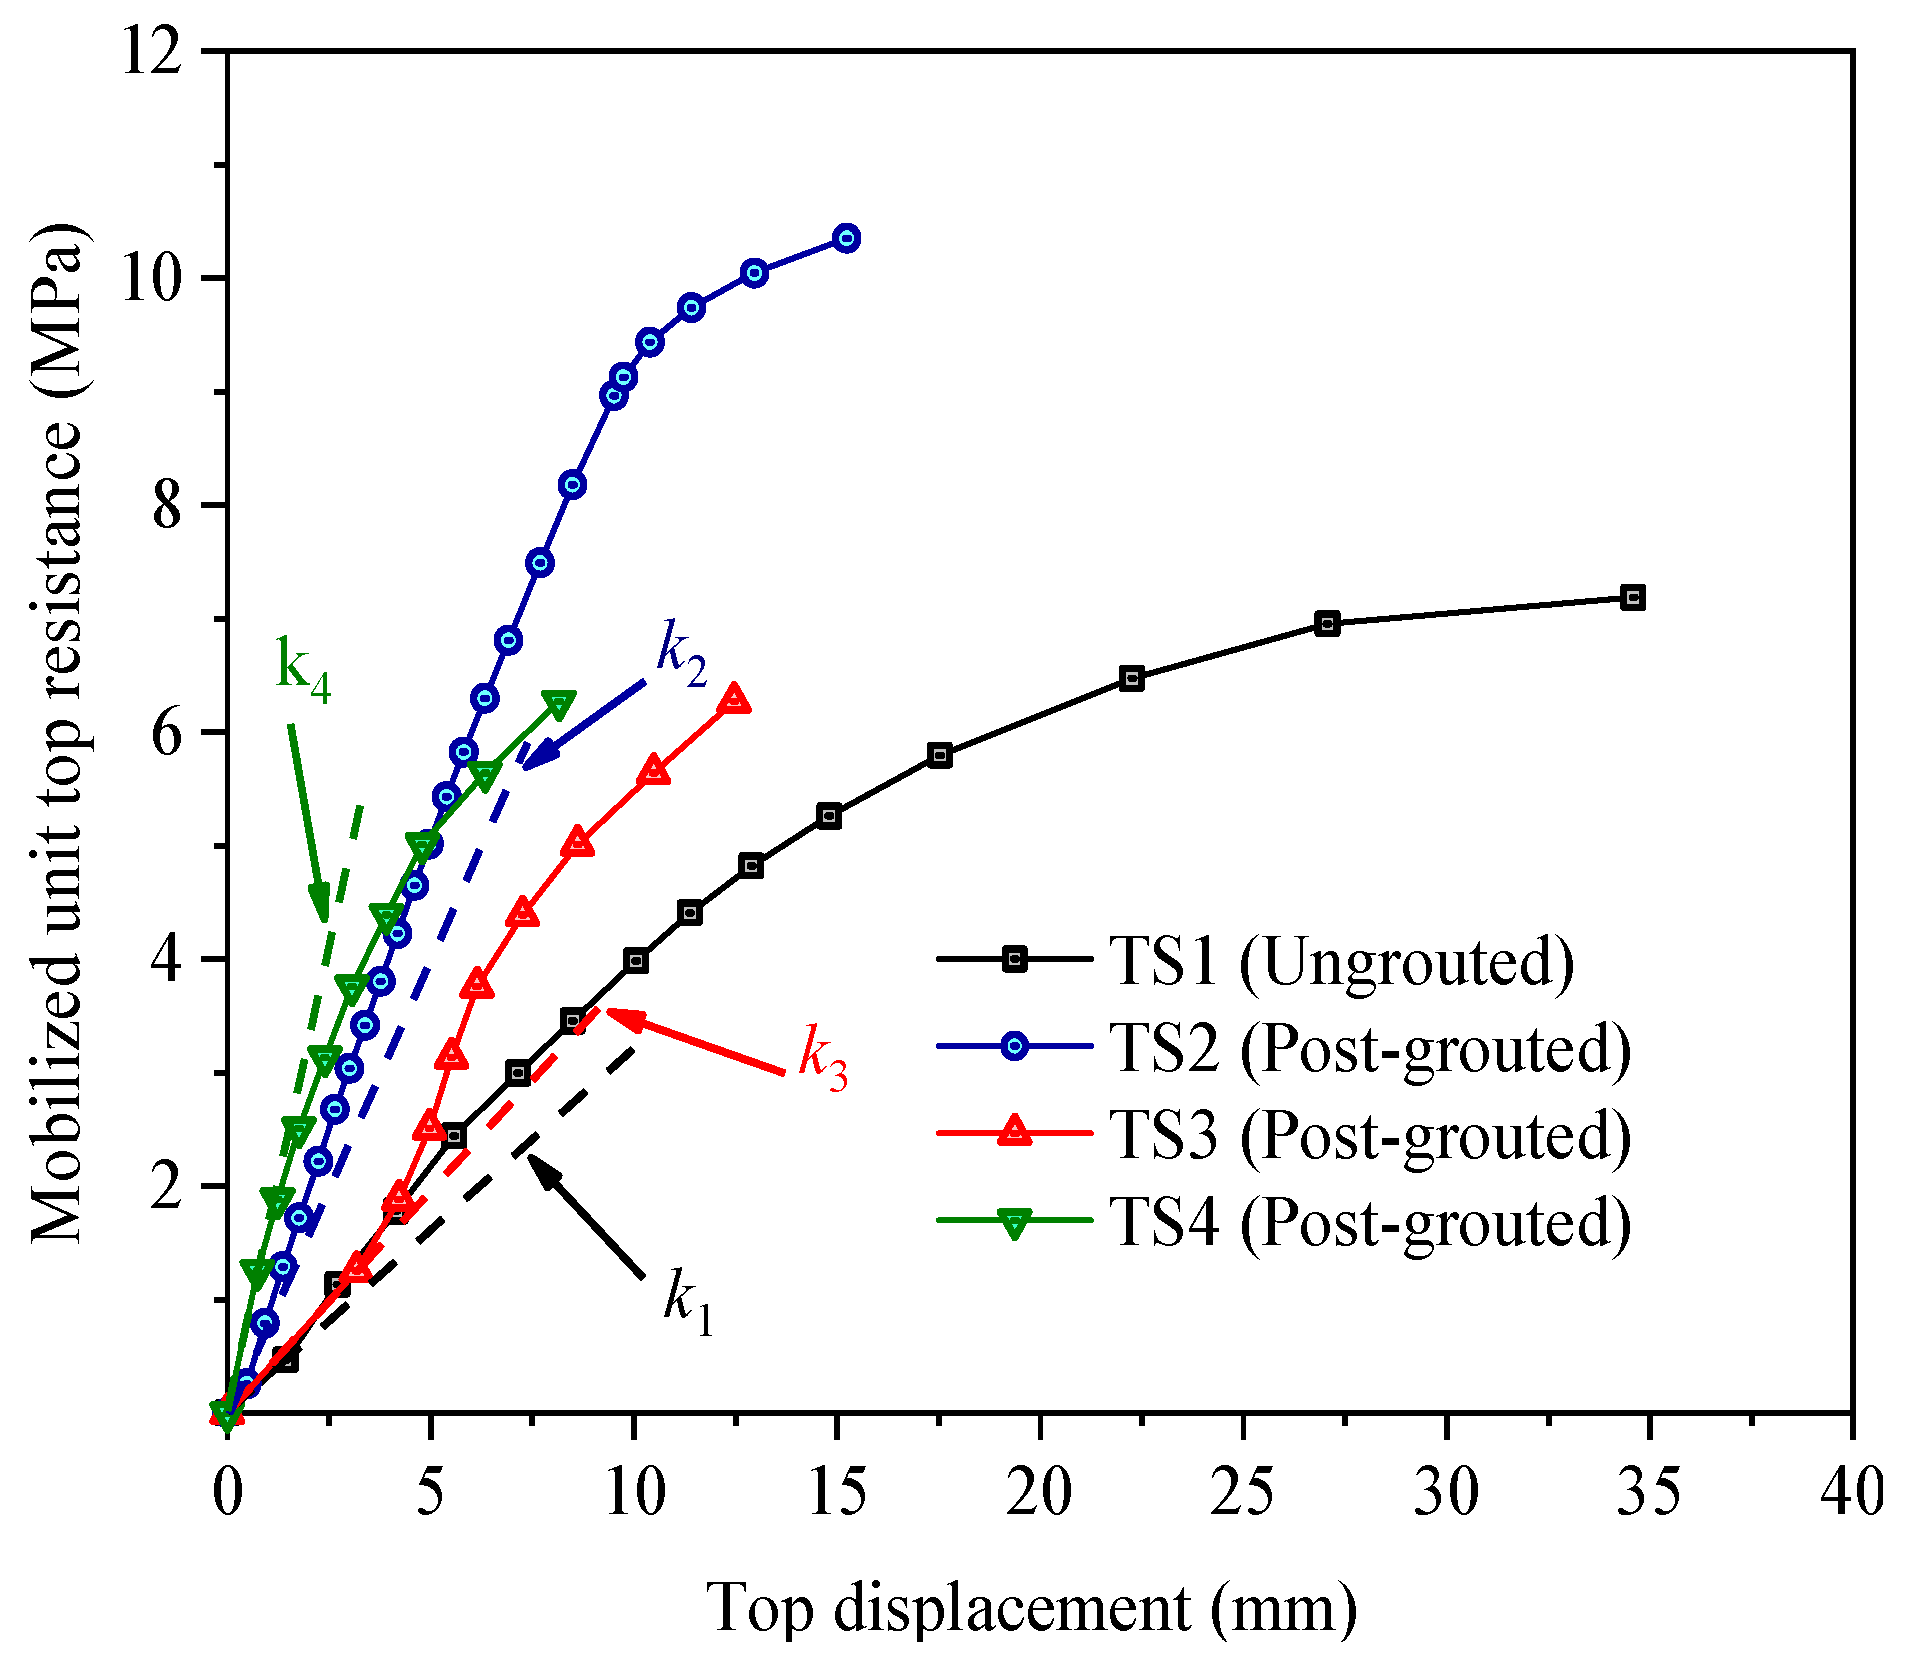
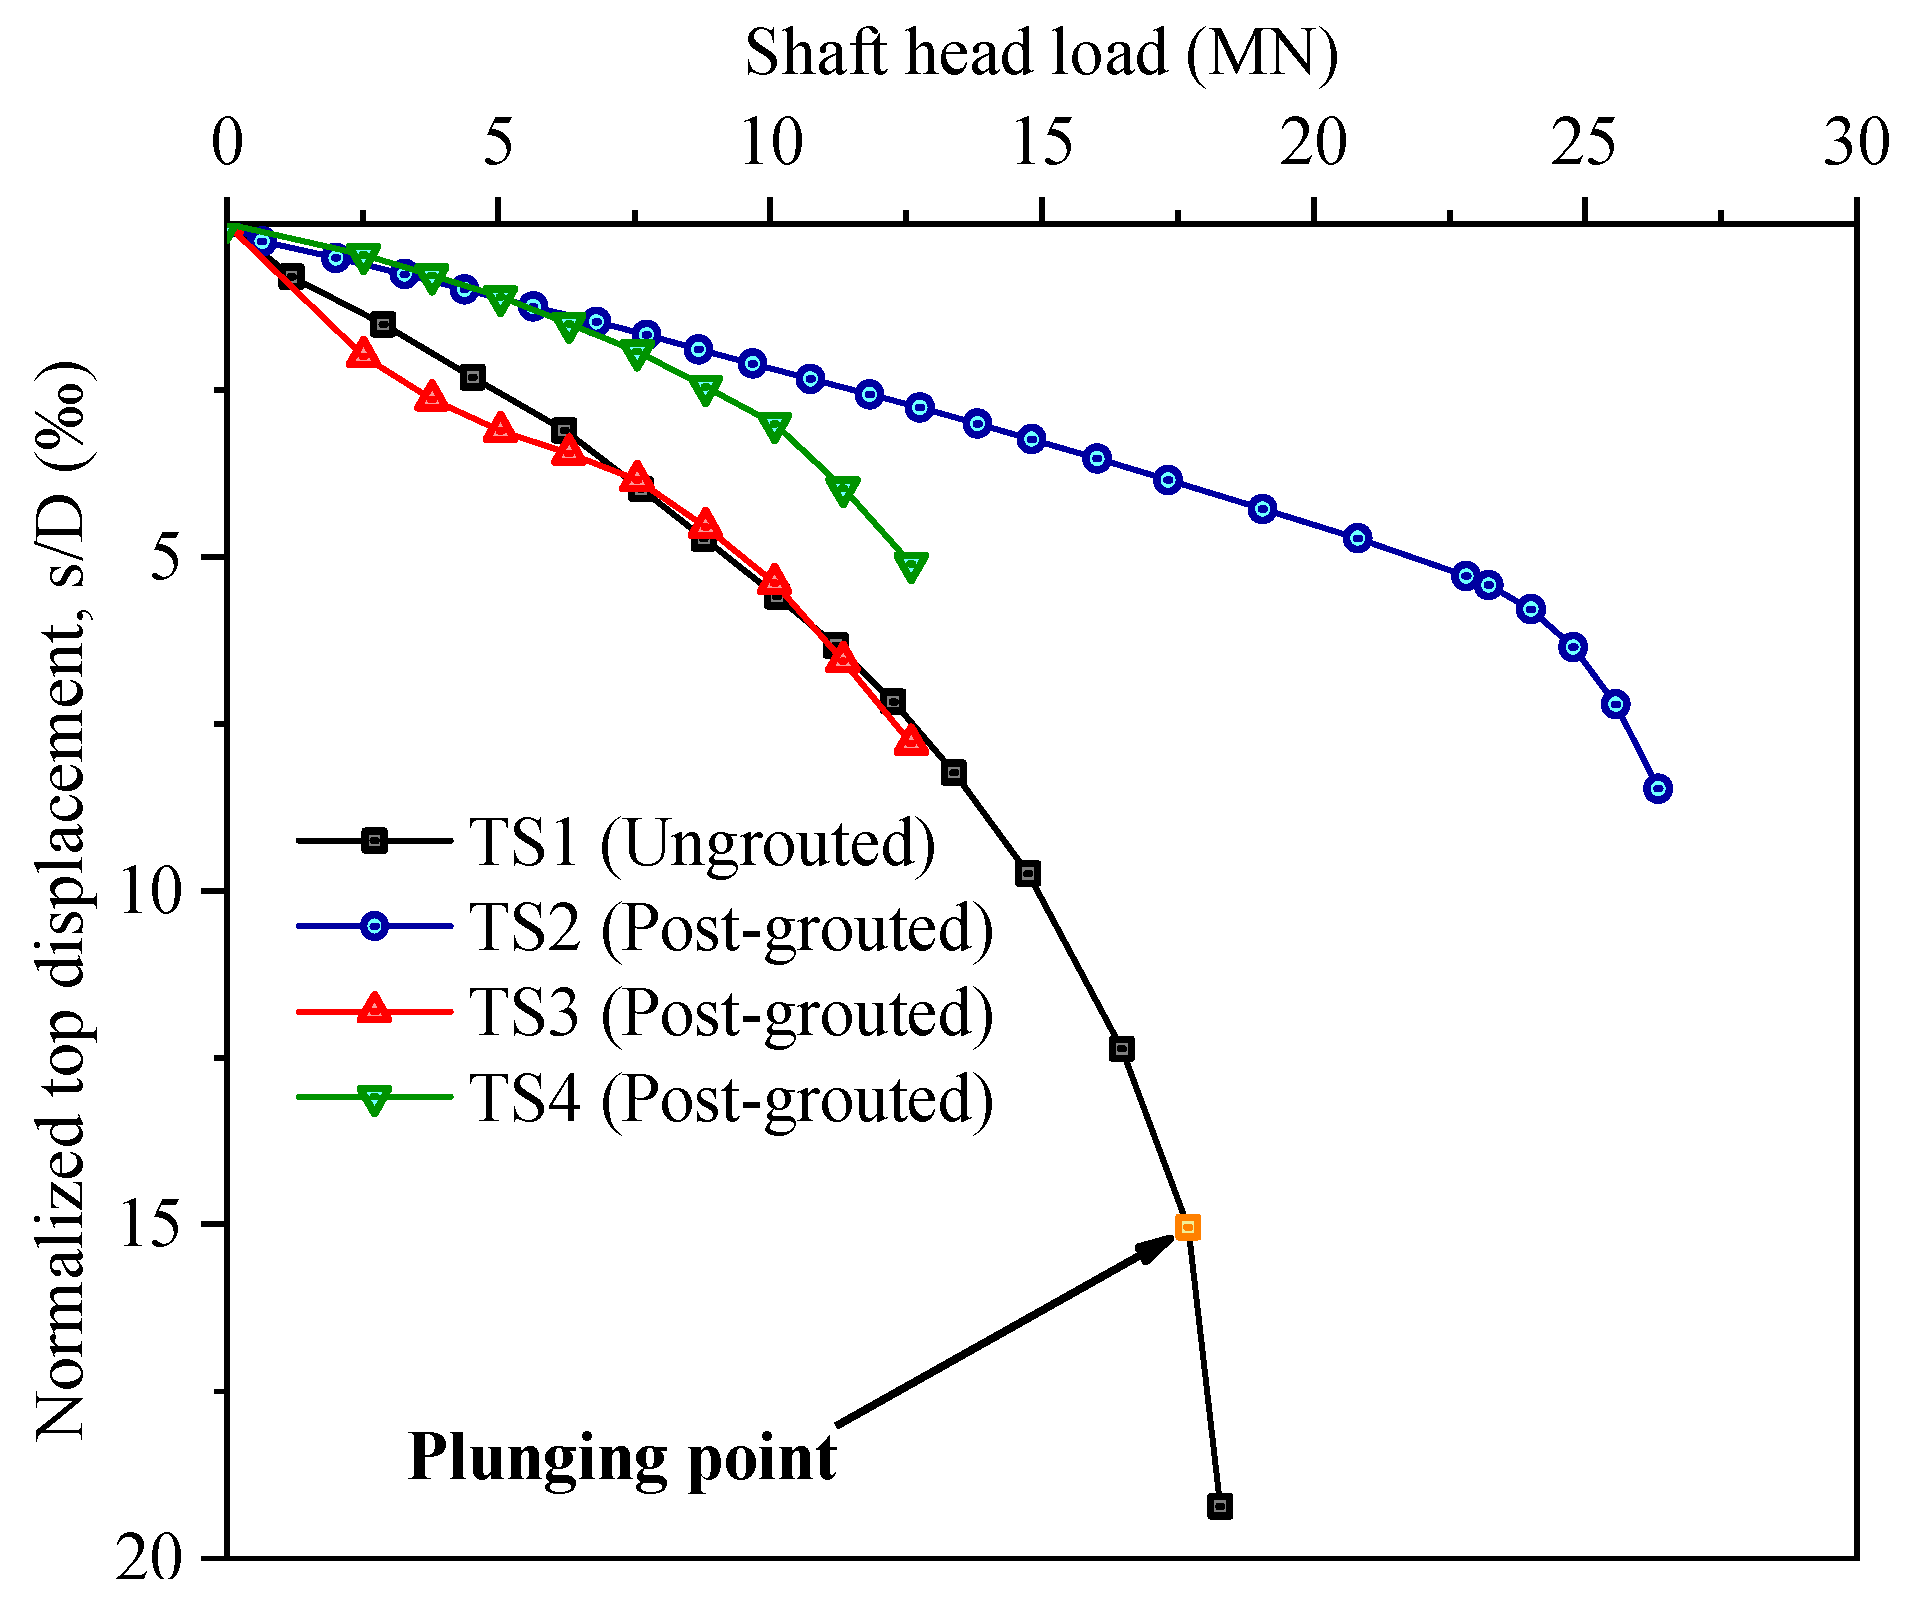
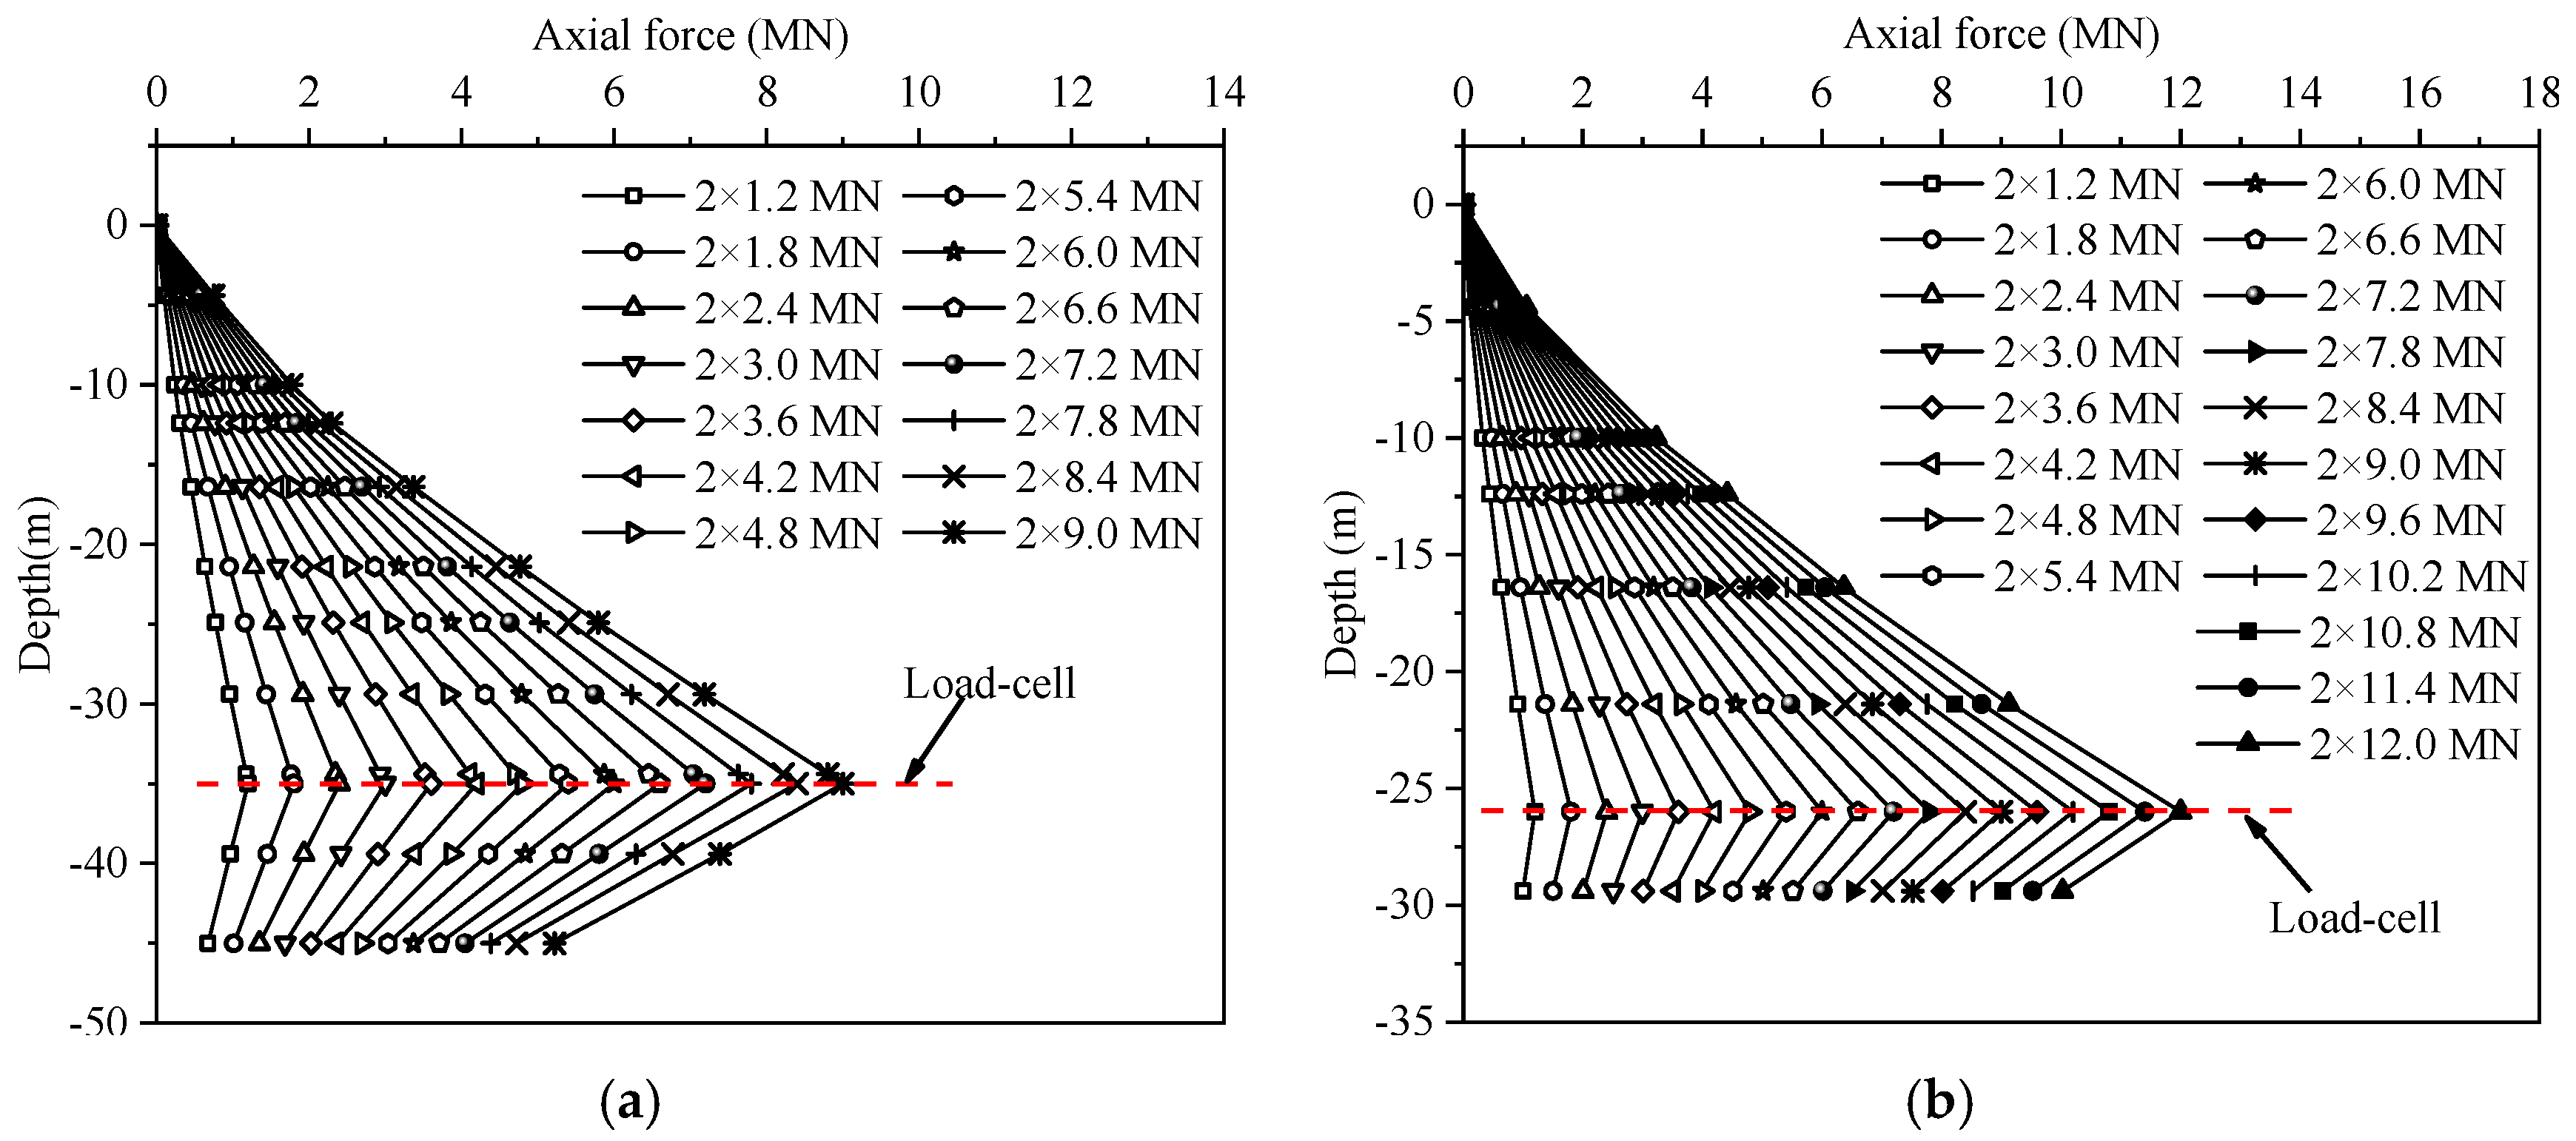
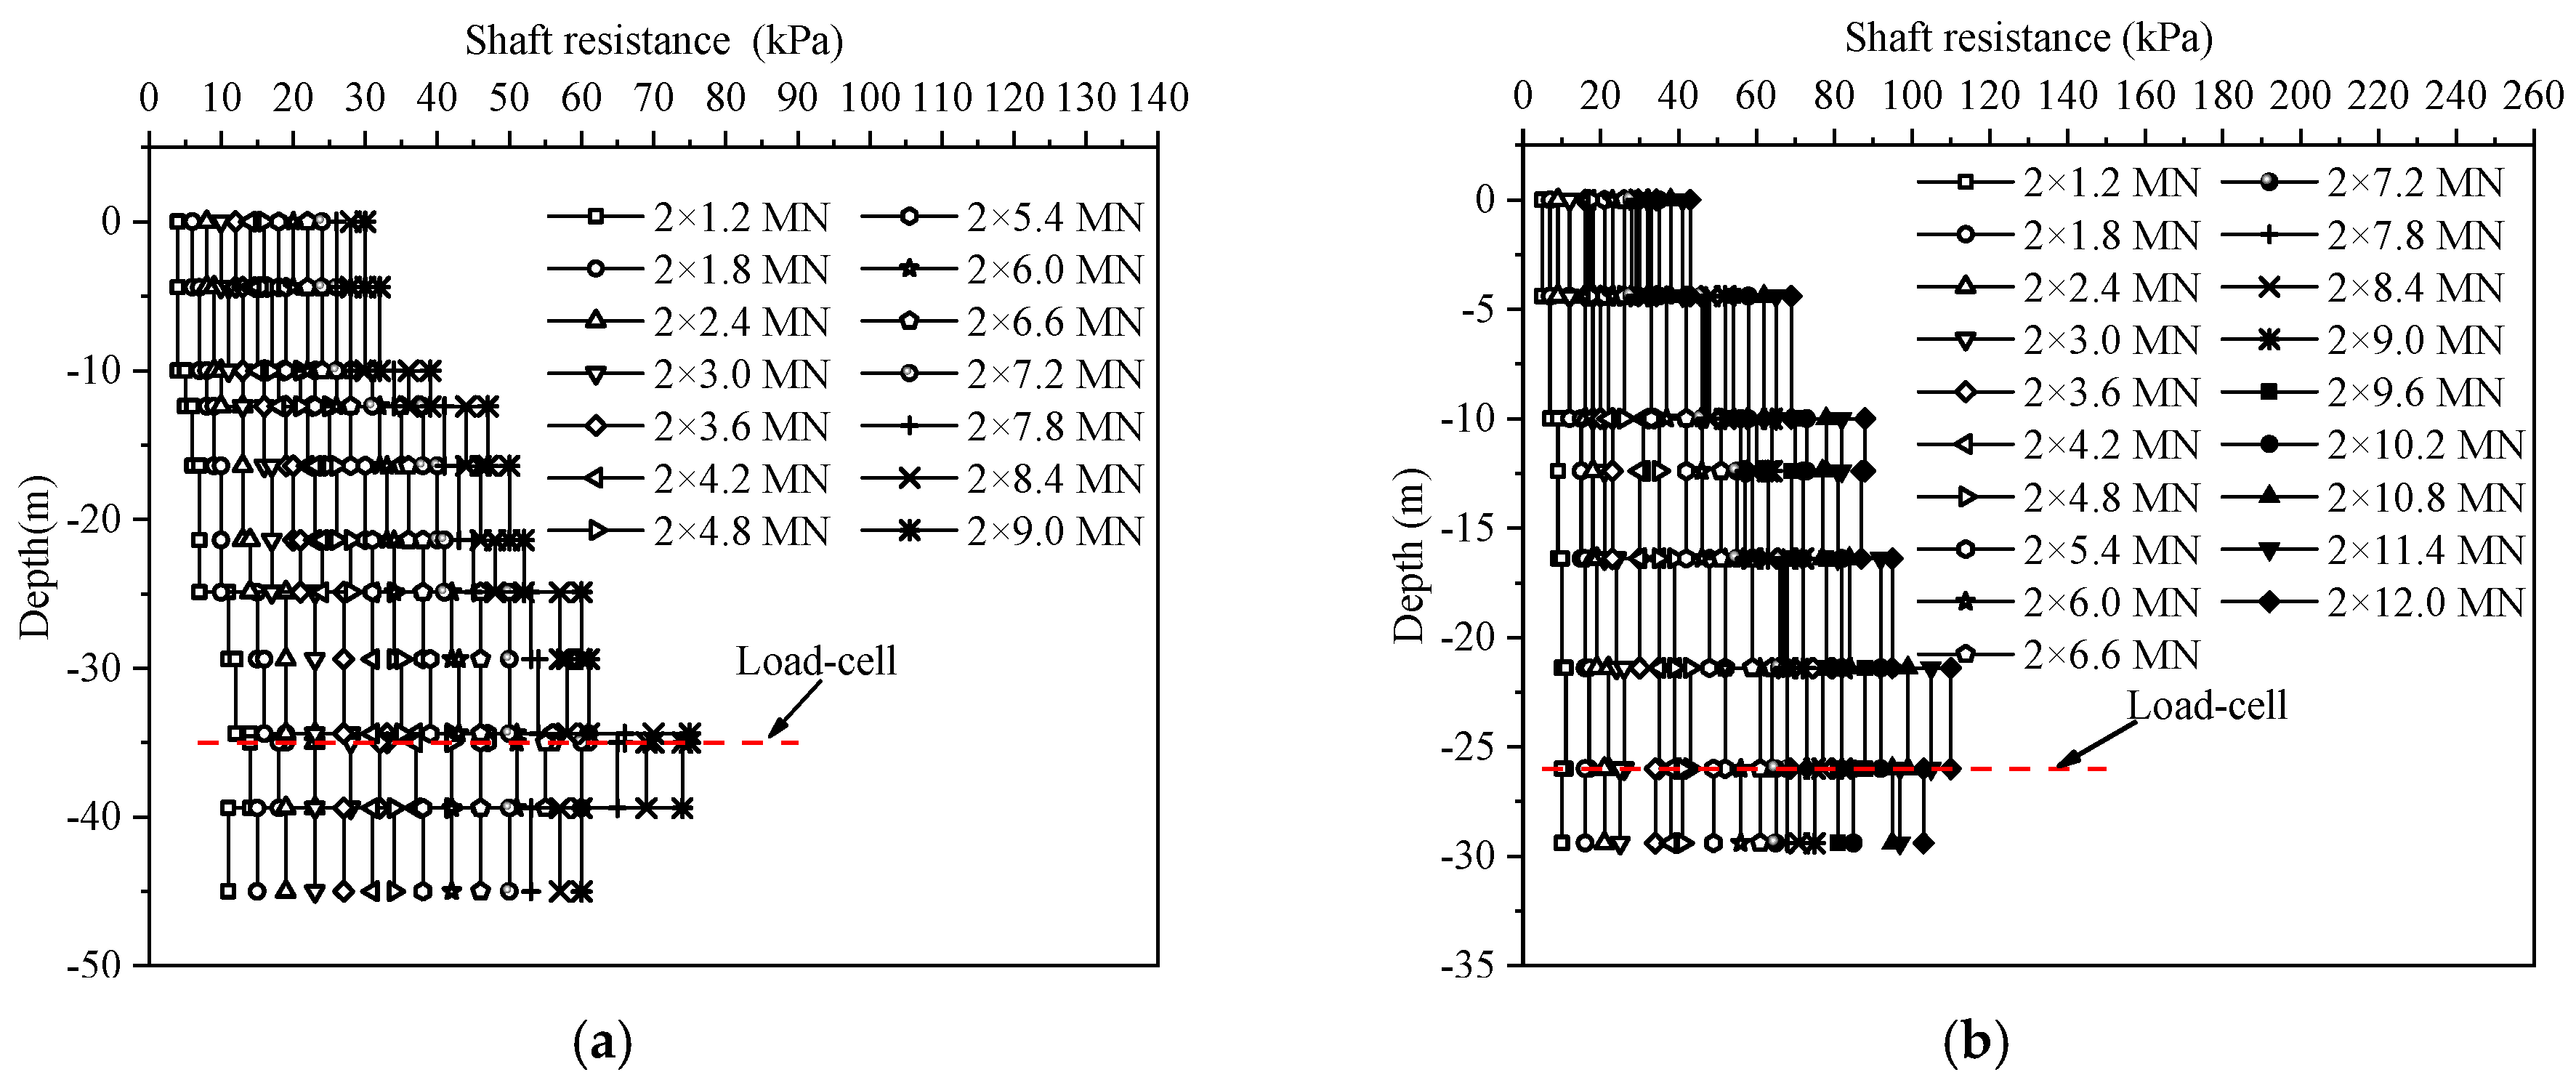
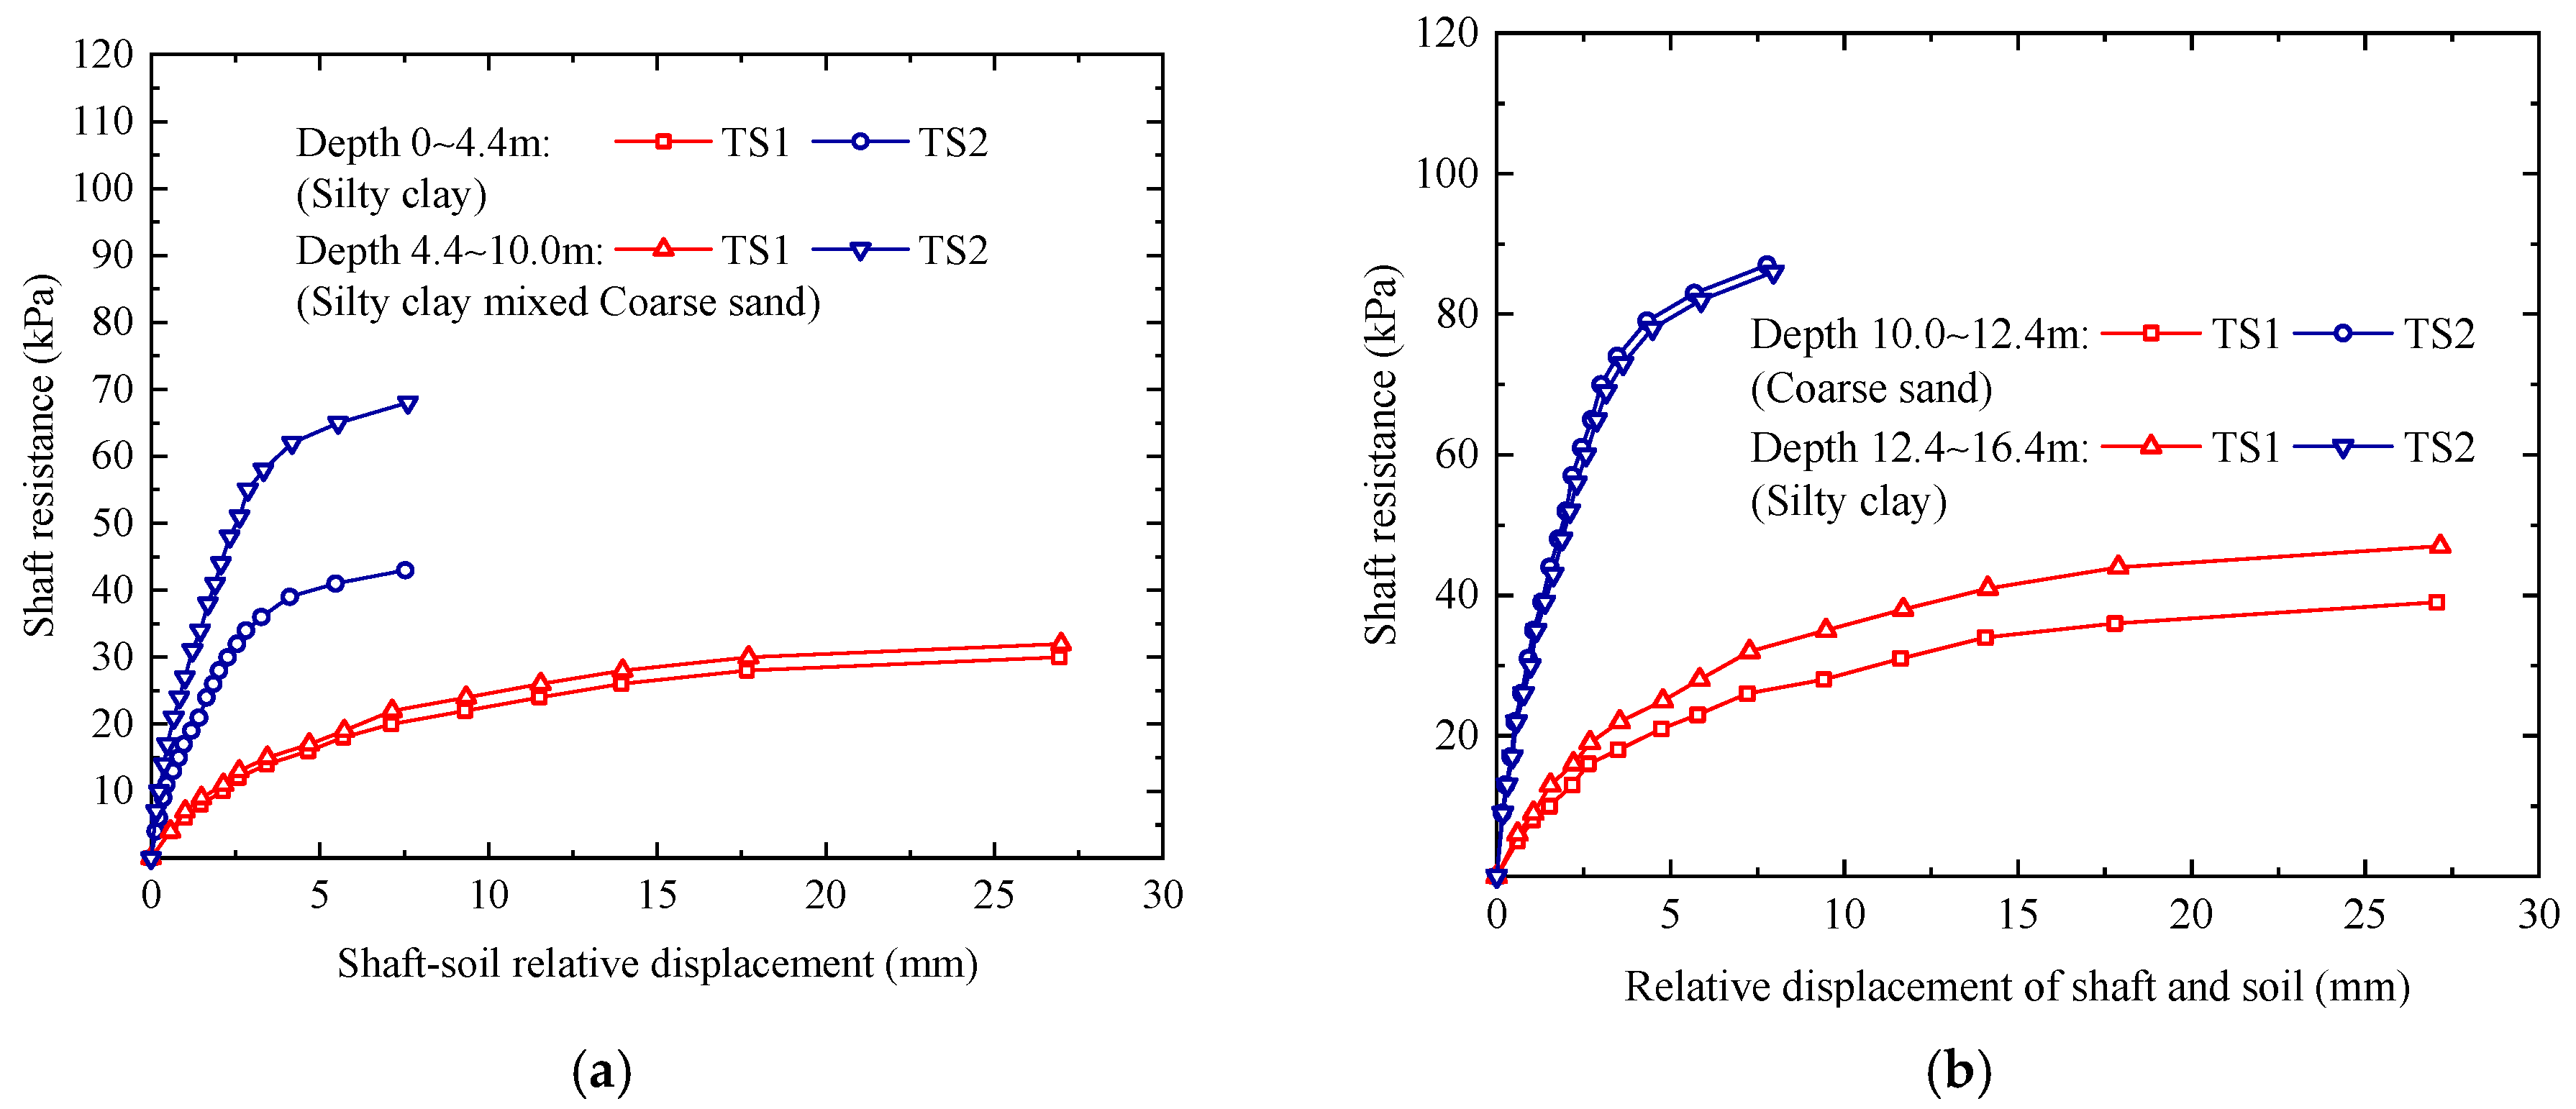
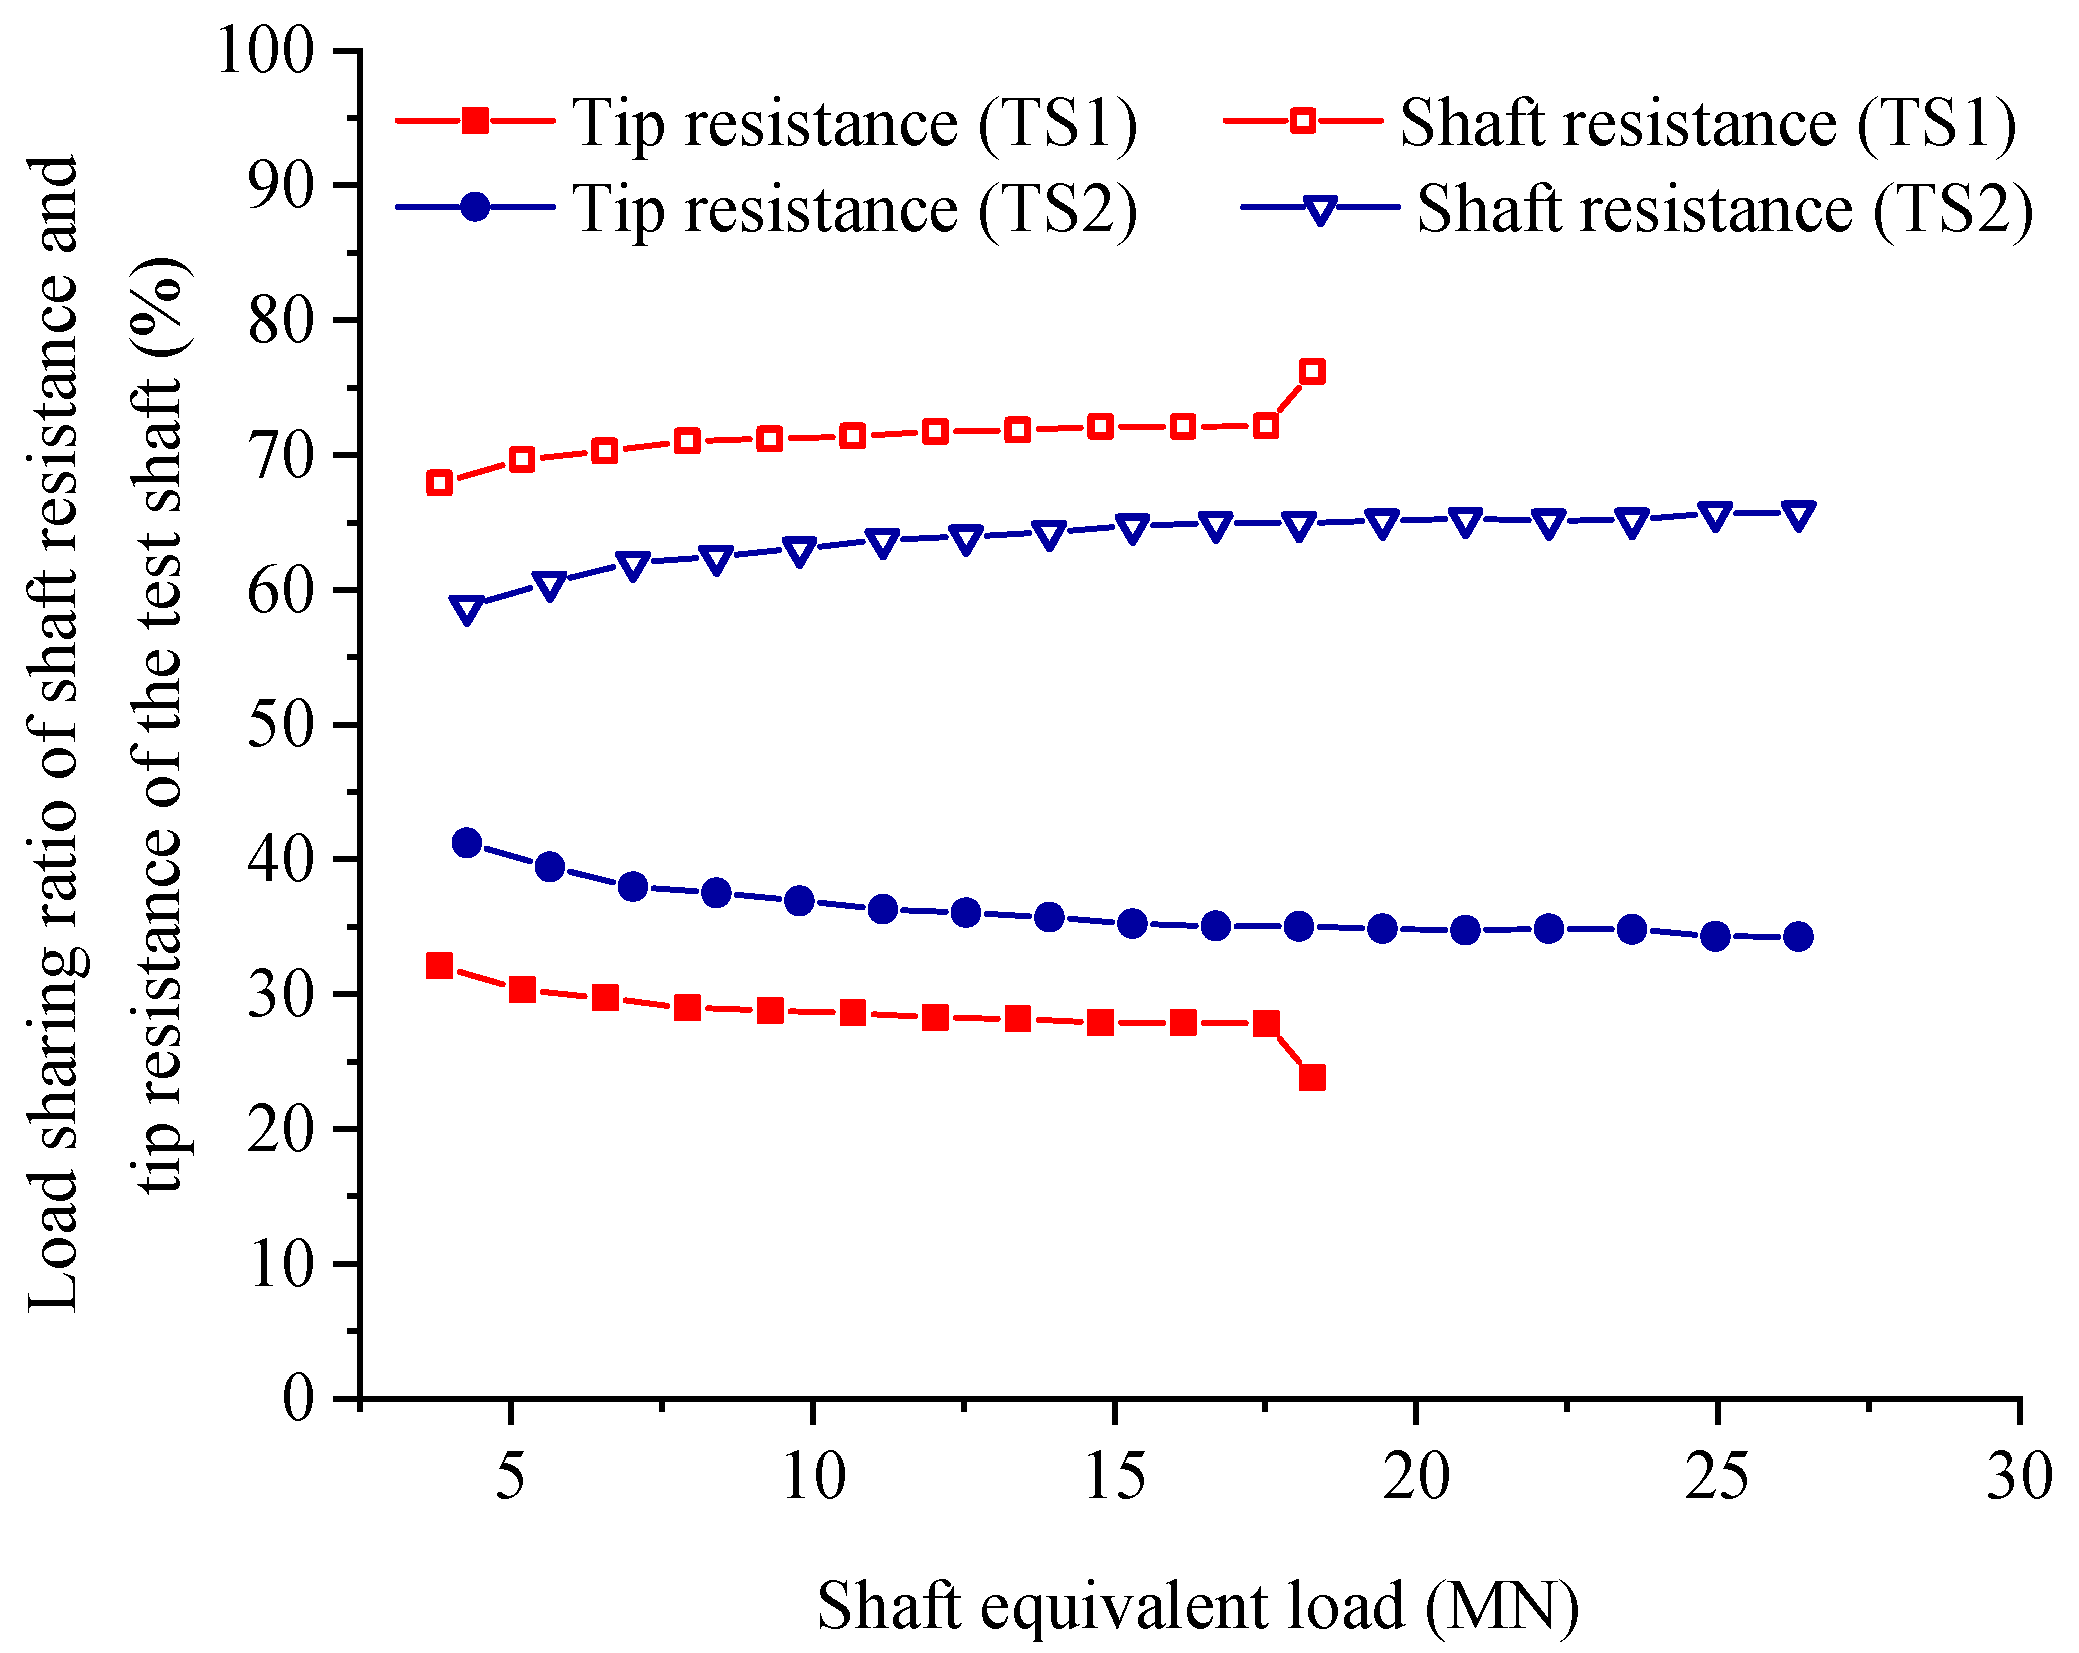
Unfortunately, the aforementioned research mainly focuses on the drilled shaft in which only the shaft tip was grouted. However, there are few reports on the field test of large diameter tip and side combined grouting shaft. Therefore, full-scale load tests were reported herein to compare and discuss the bearing performance of four drilled shafts (three shafts were post-grouted and one shaft as control). Subsequently, the load-displacement response, load transfer mechanisms and mobilization of shaft resistance in large diameter drilled shafts after combined tip and side grouting are further explored through detailed measurement data of the shafts.

2. Site Description and Test Shafts Details

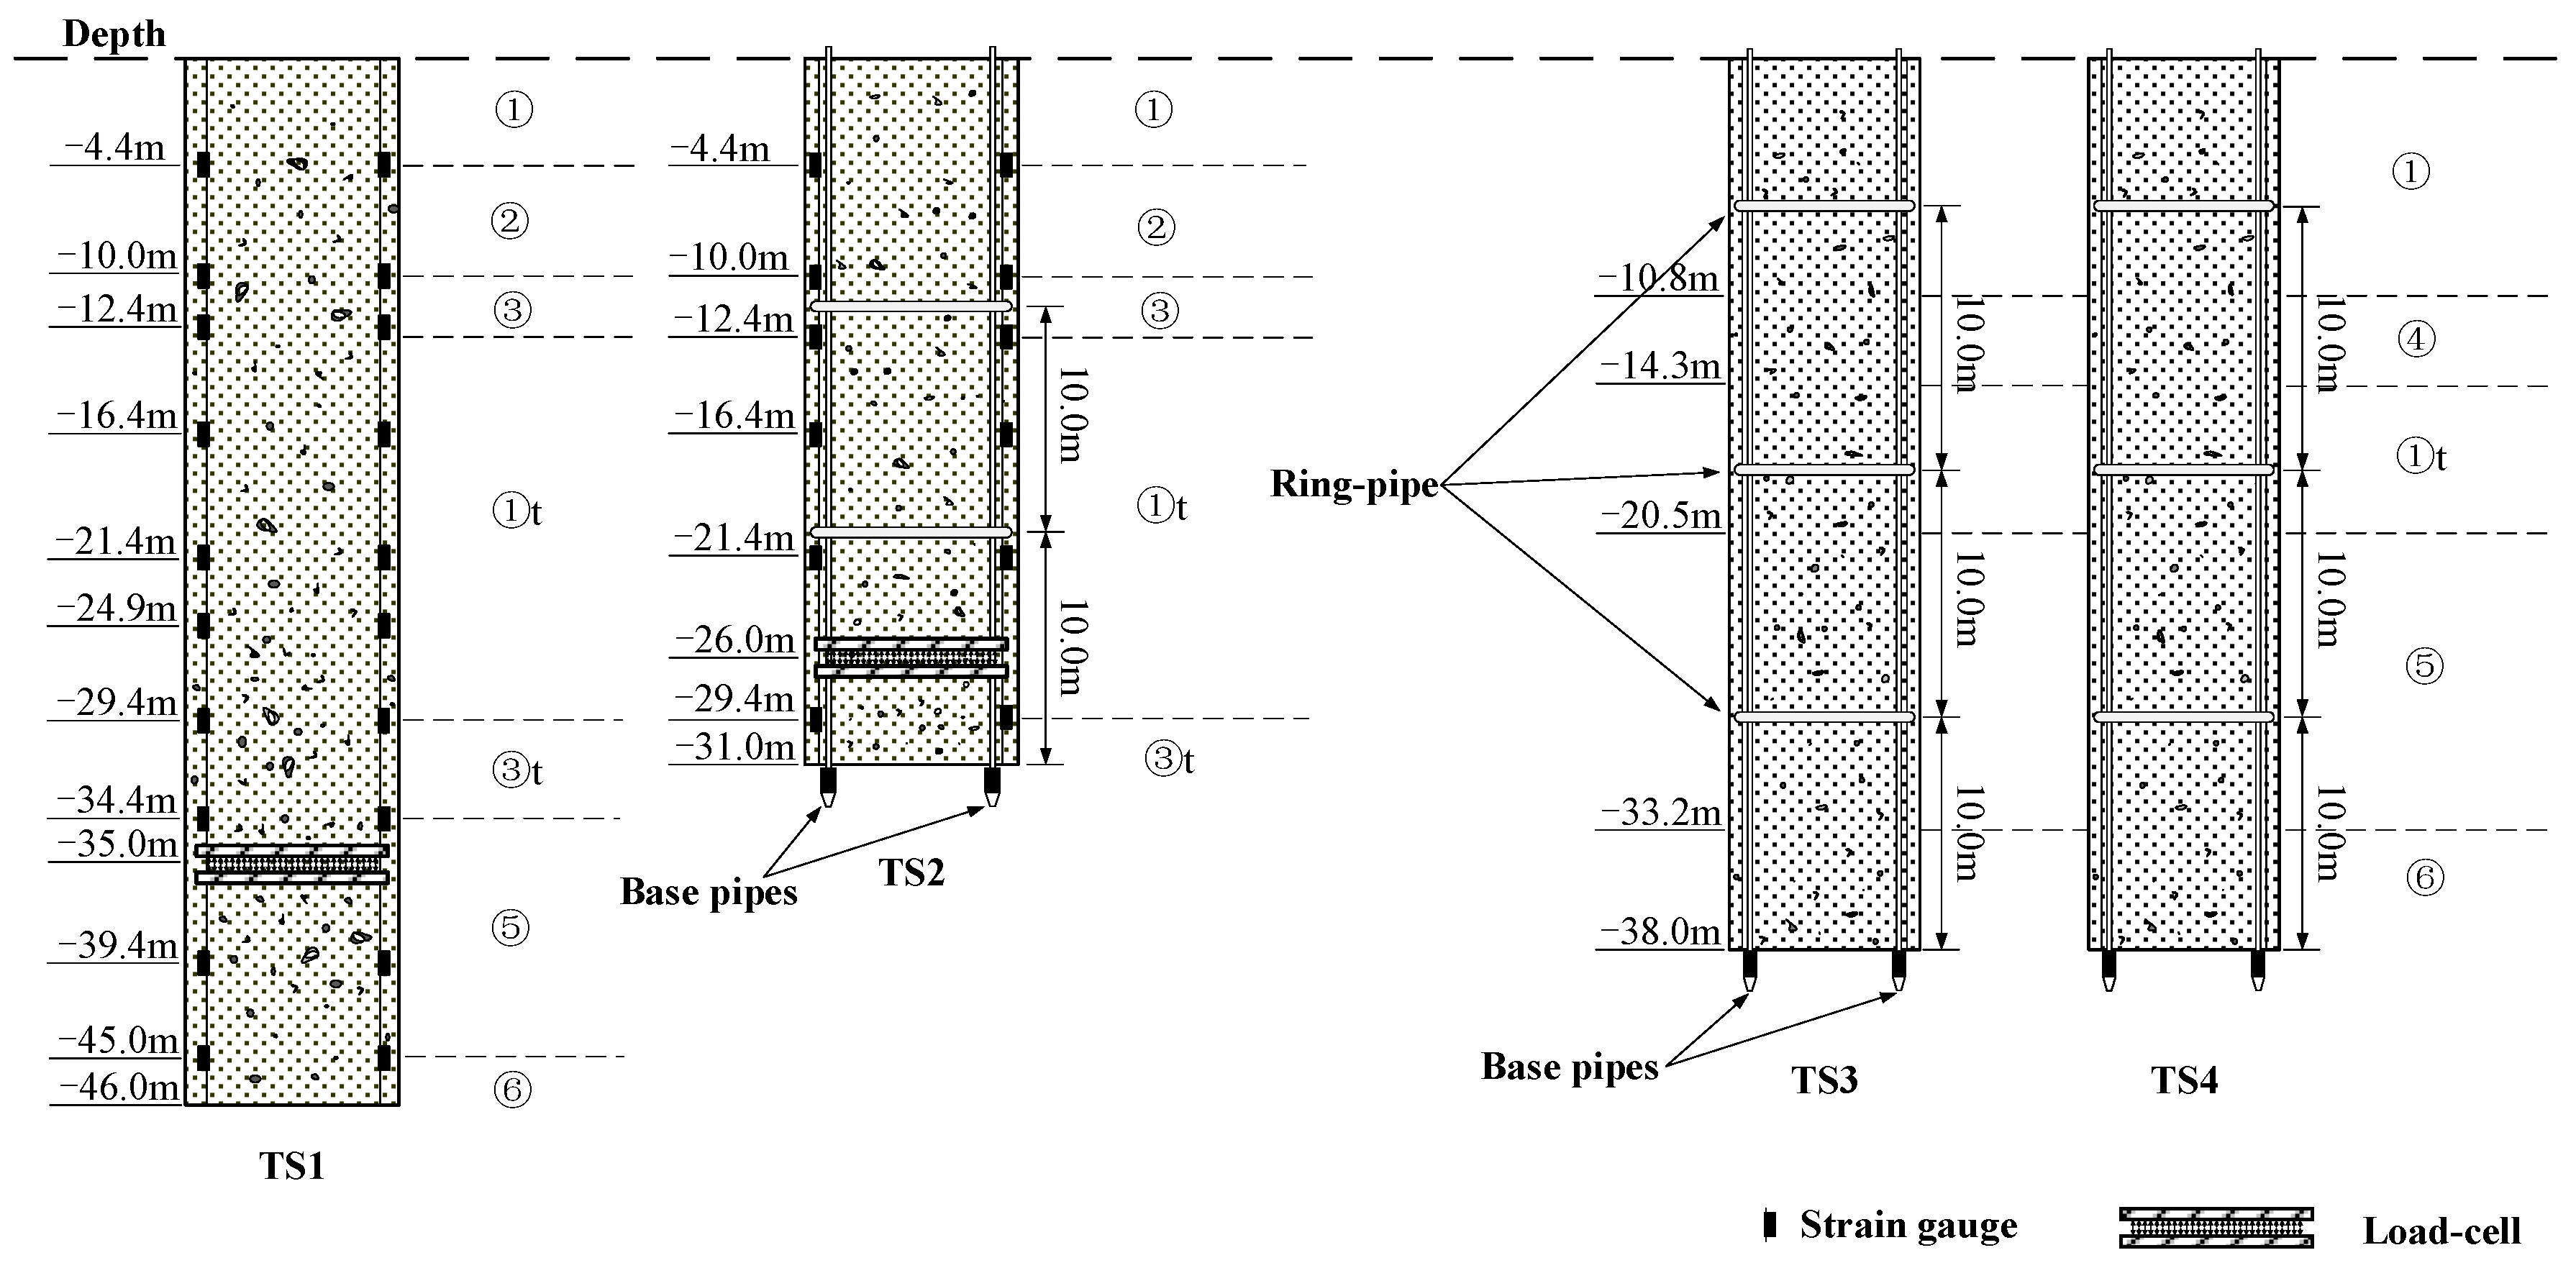
The field tests were conducted in Tai’an, China. All load tests were carried out at the same location. The geology of this area mainly consists of silty clay and coarse sand layers. Sufficient boreholes were sunk to obtain details of the soil layers distributions. Detailed soil profiles and corresponding physical characteristics along the axis of each test shaft can be obtained from Figure 2 and Table 1, respectively. As shown in Table 1, ω is the moisture content, γ is the unit weight of soil, c and φ are cohesion and internal friction angle of soil, respectively. Sample preparation, test equipment, and test methods were all in accordance with Chinese standard GB/T 50123-1999 [24].
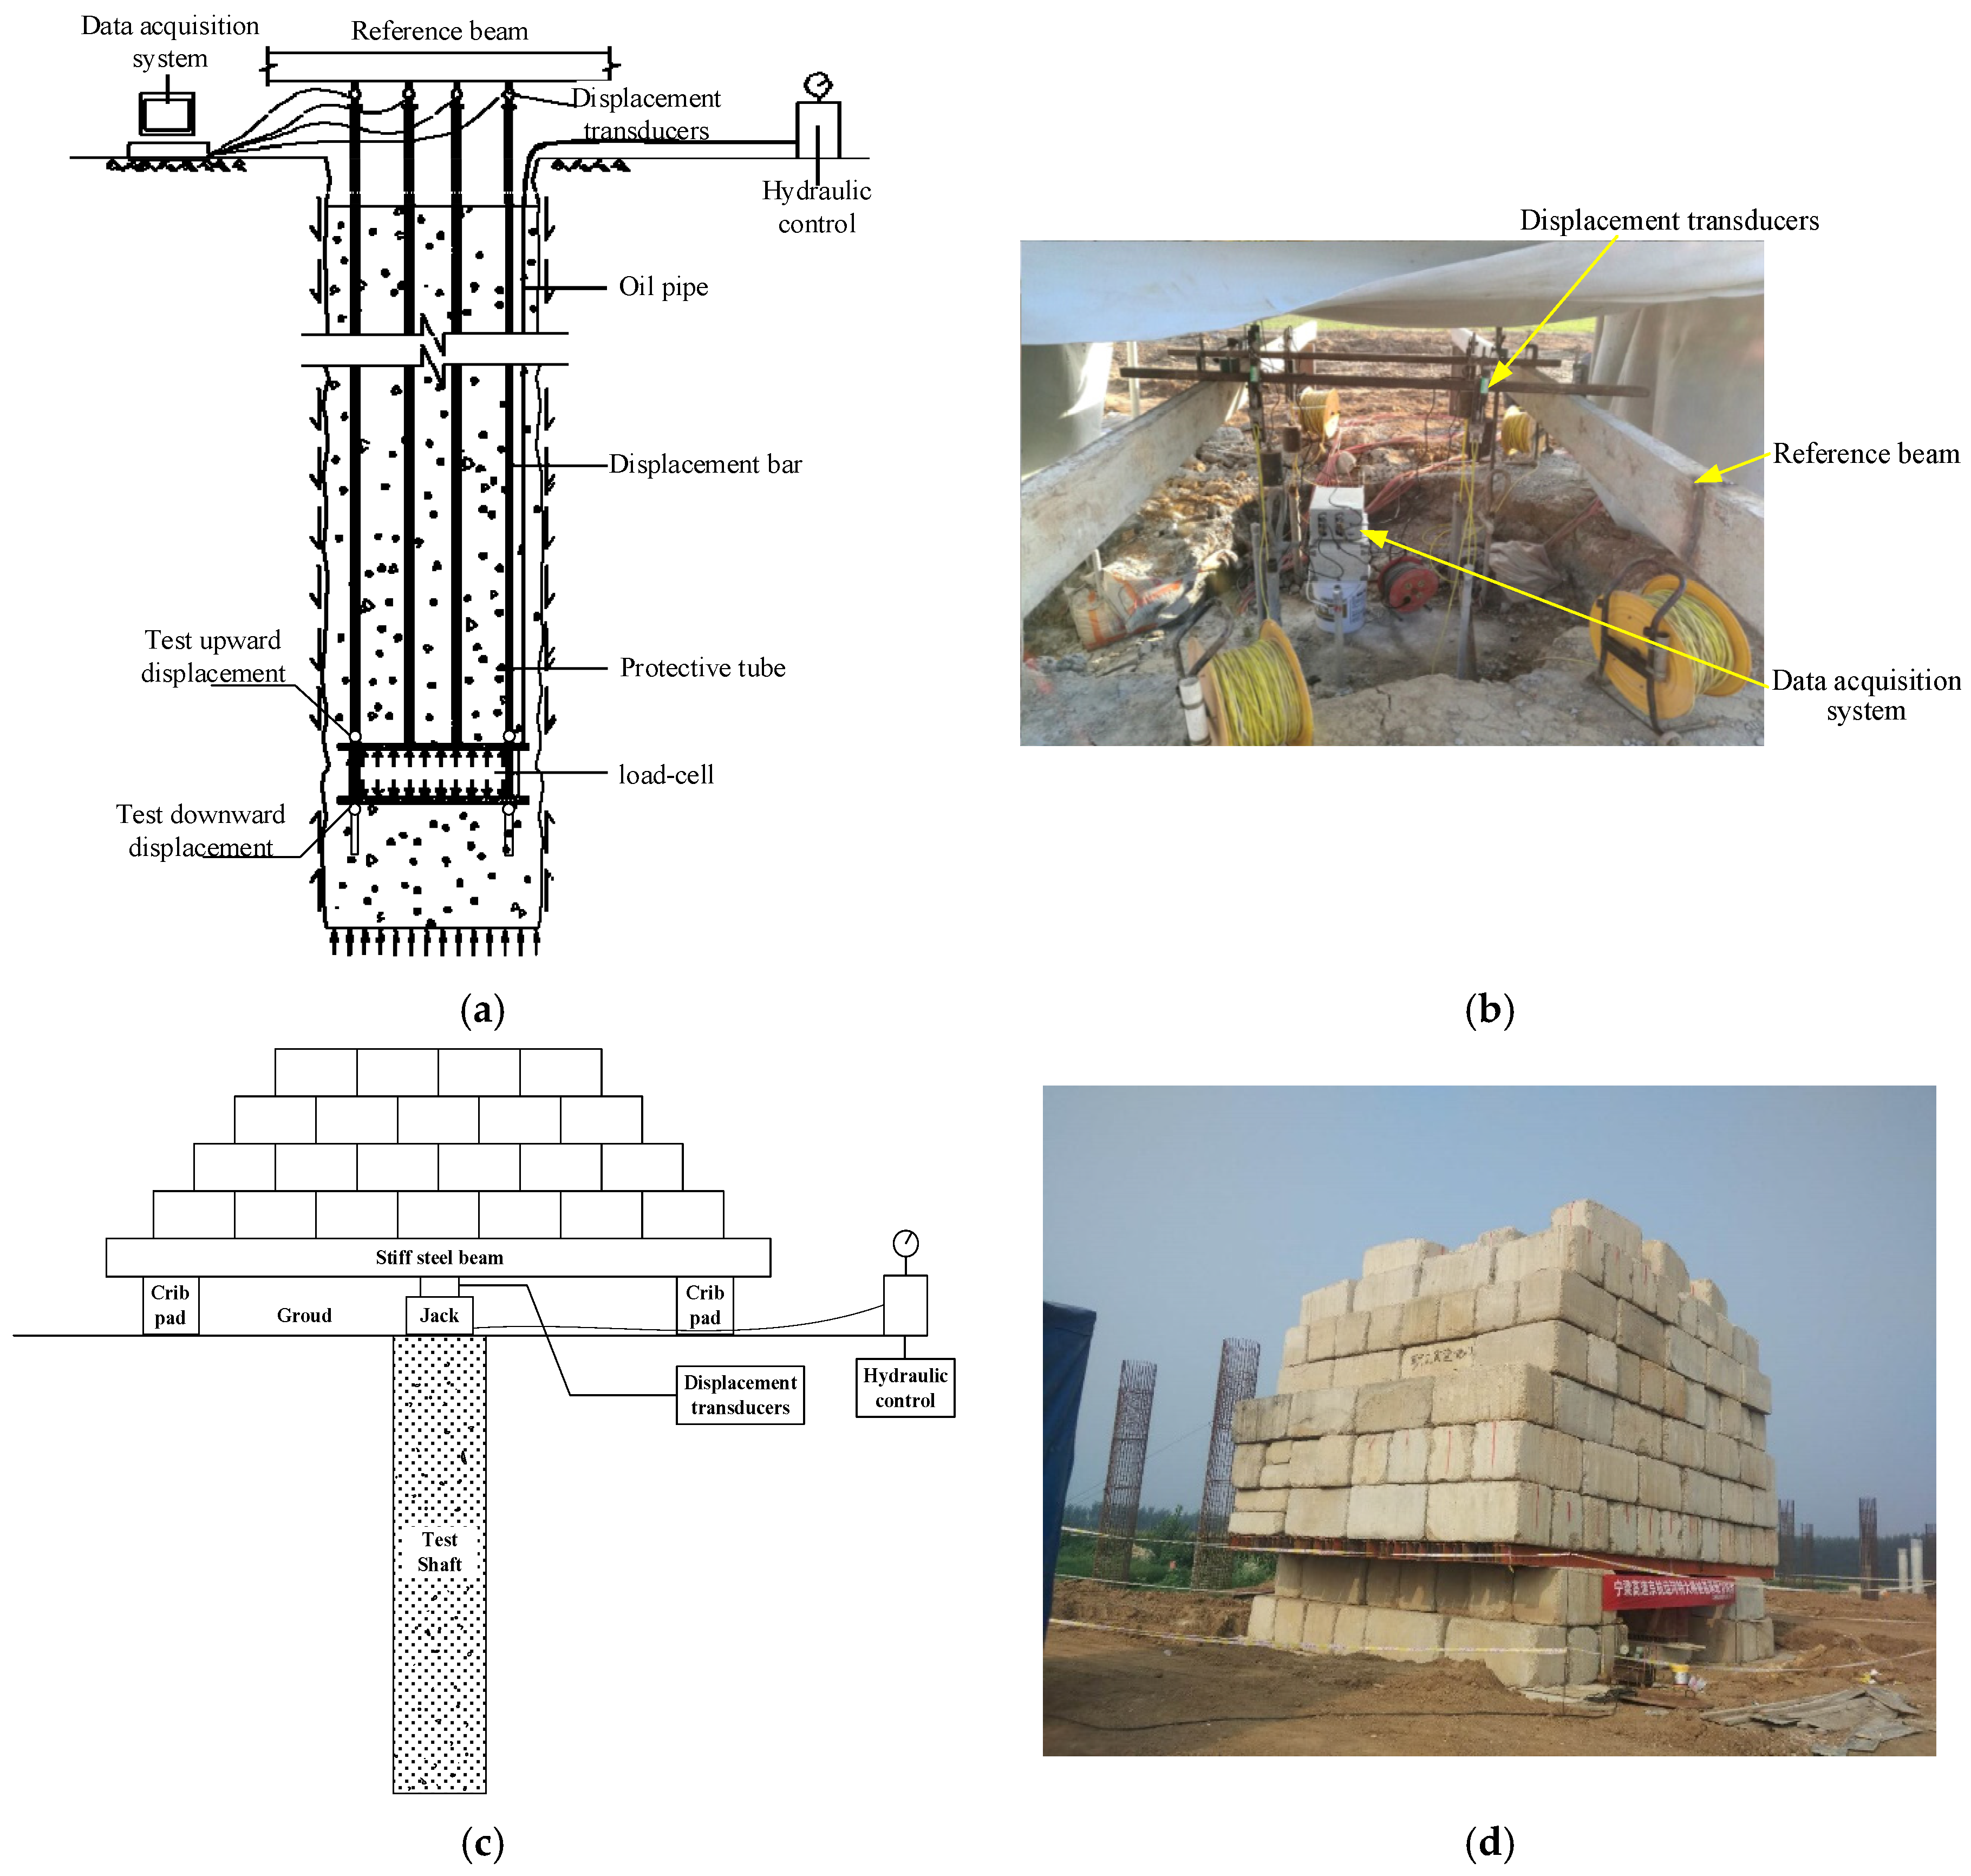
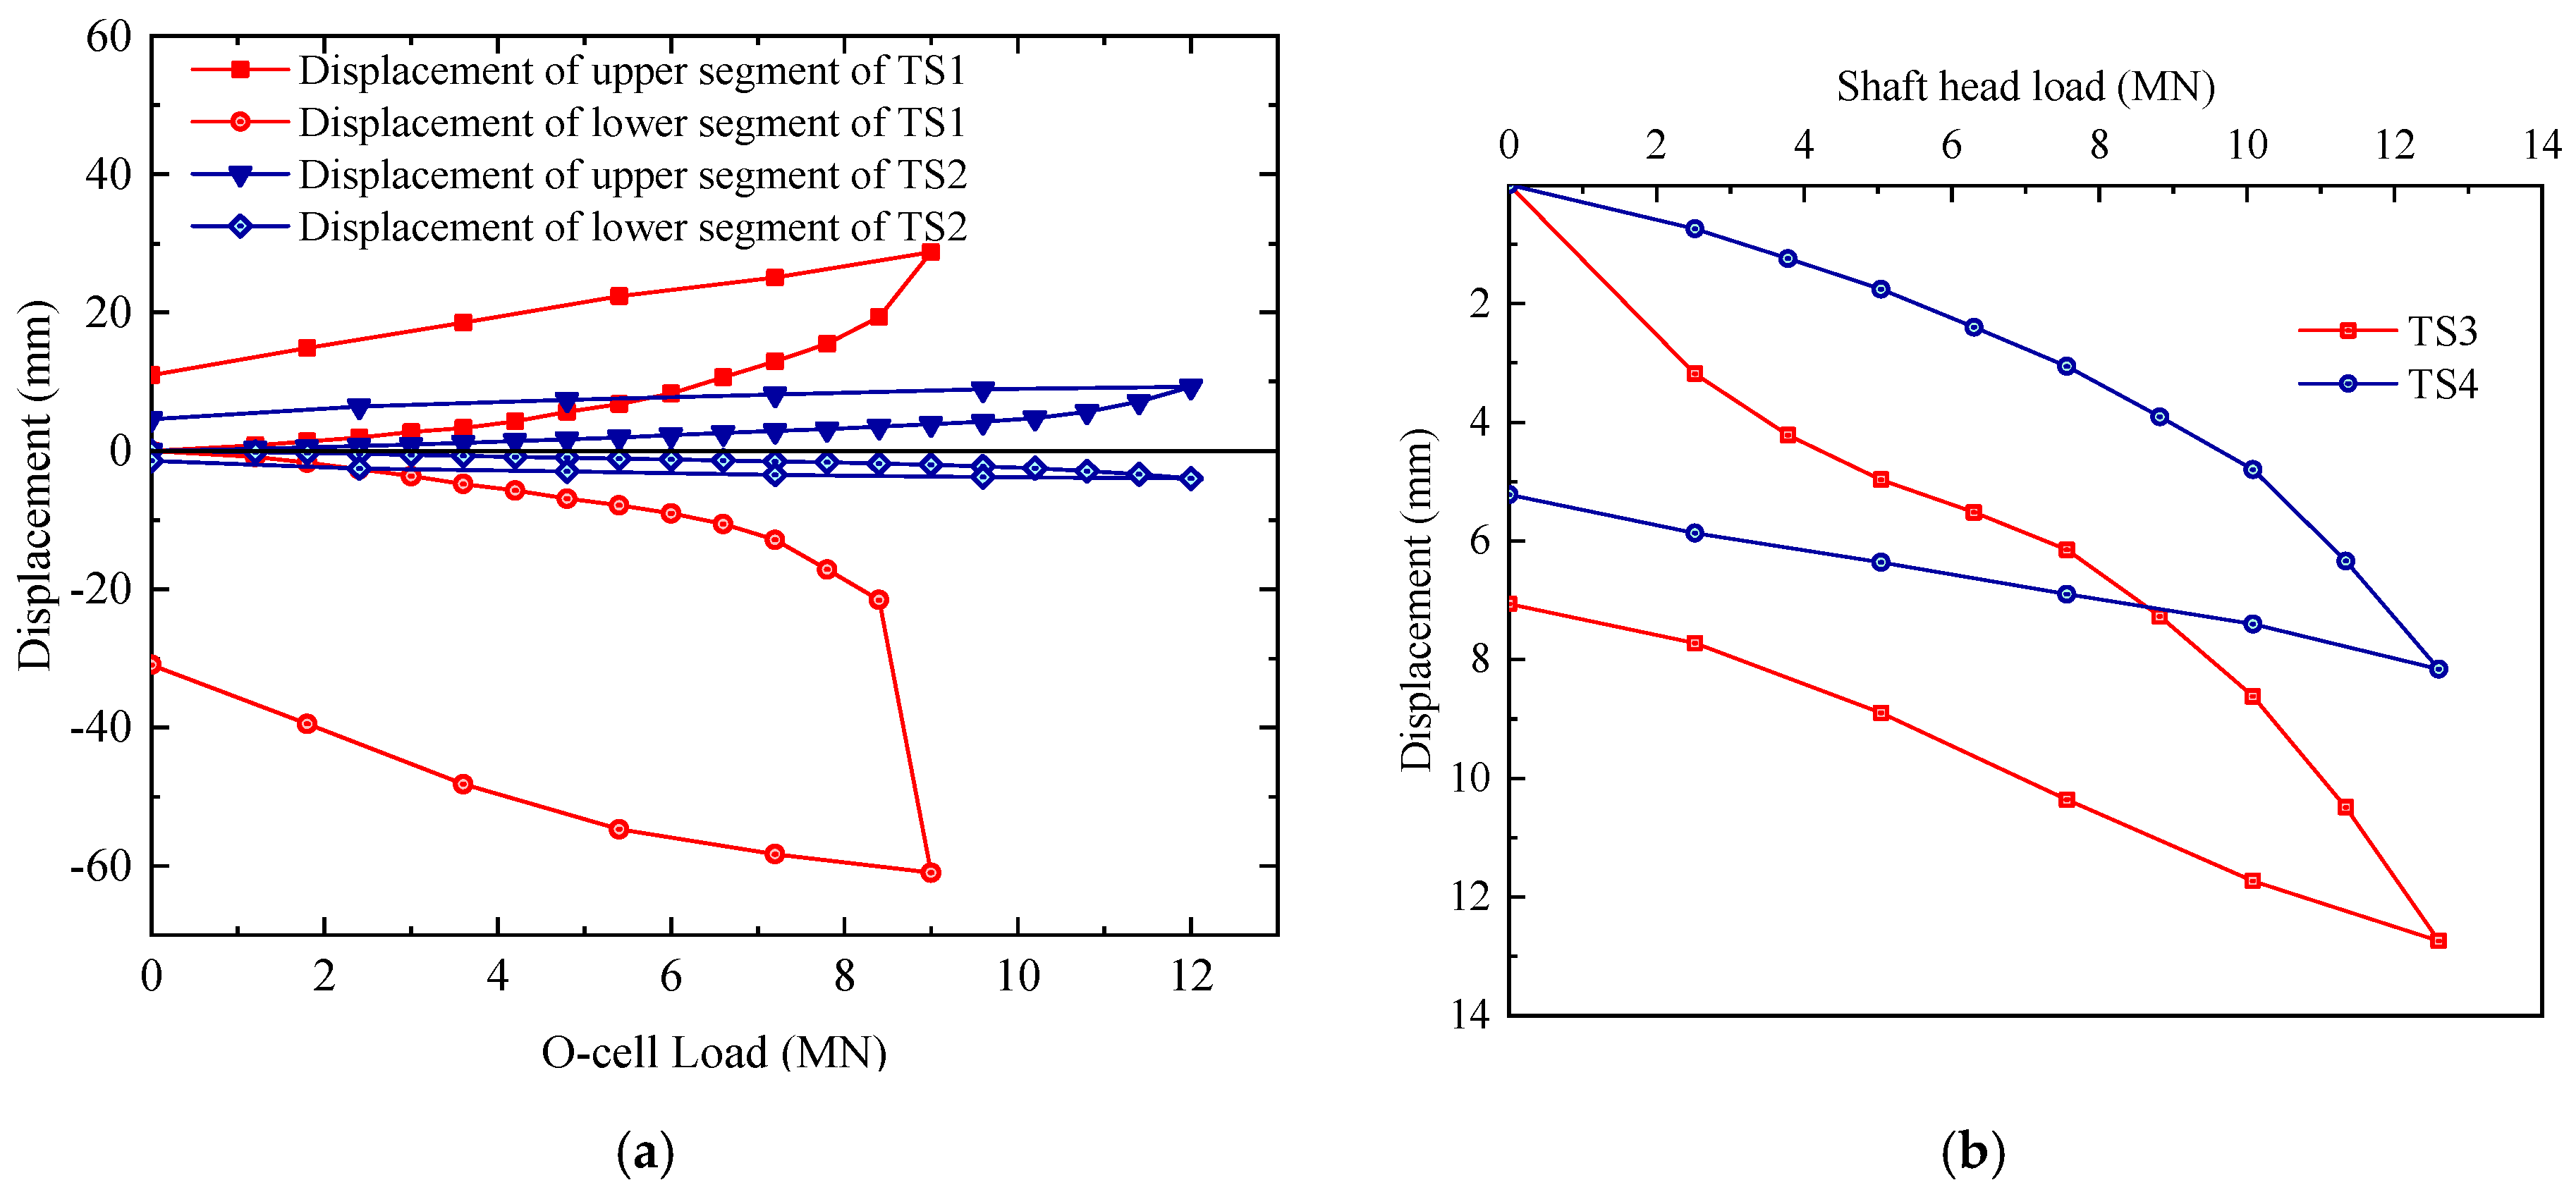
Test shafts TS2, TS3 and TS4 were combined tip-and-side post grouted shafts, the ungrouted drilled shaft (TS1) was load-tested in the same site to quantify the improvement of shaft capacity after grouting. The bi-directional static test and top-down load test methods were adopted to determine the bearing capacity of shafts TS1, TS2 and TS3, TS4, respectively. The details of the four test shafts can be obtained by Table 2. The elastic modulus of the concrete for the four test shafts Ec is 31 GPa. Furthermore, the elevations of the strain gauges for test shafts TS1 and TS2, the ring-shaped grouting pipes along shafts TS2, TS3 and TS4 are all presented in 
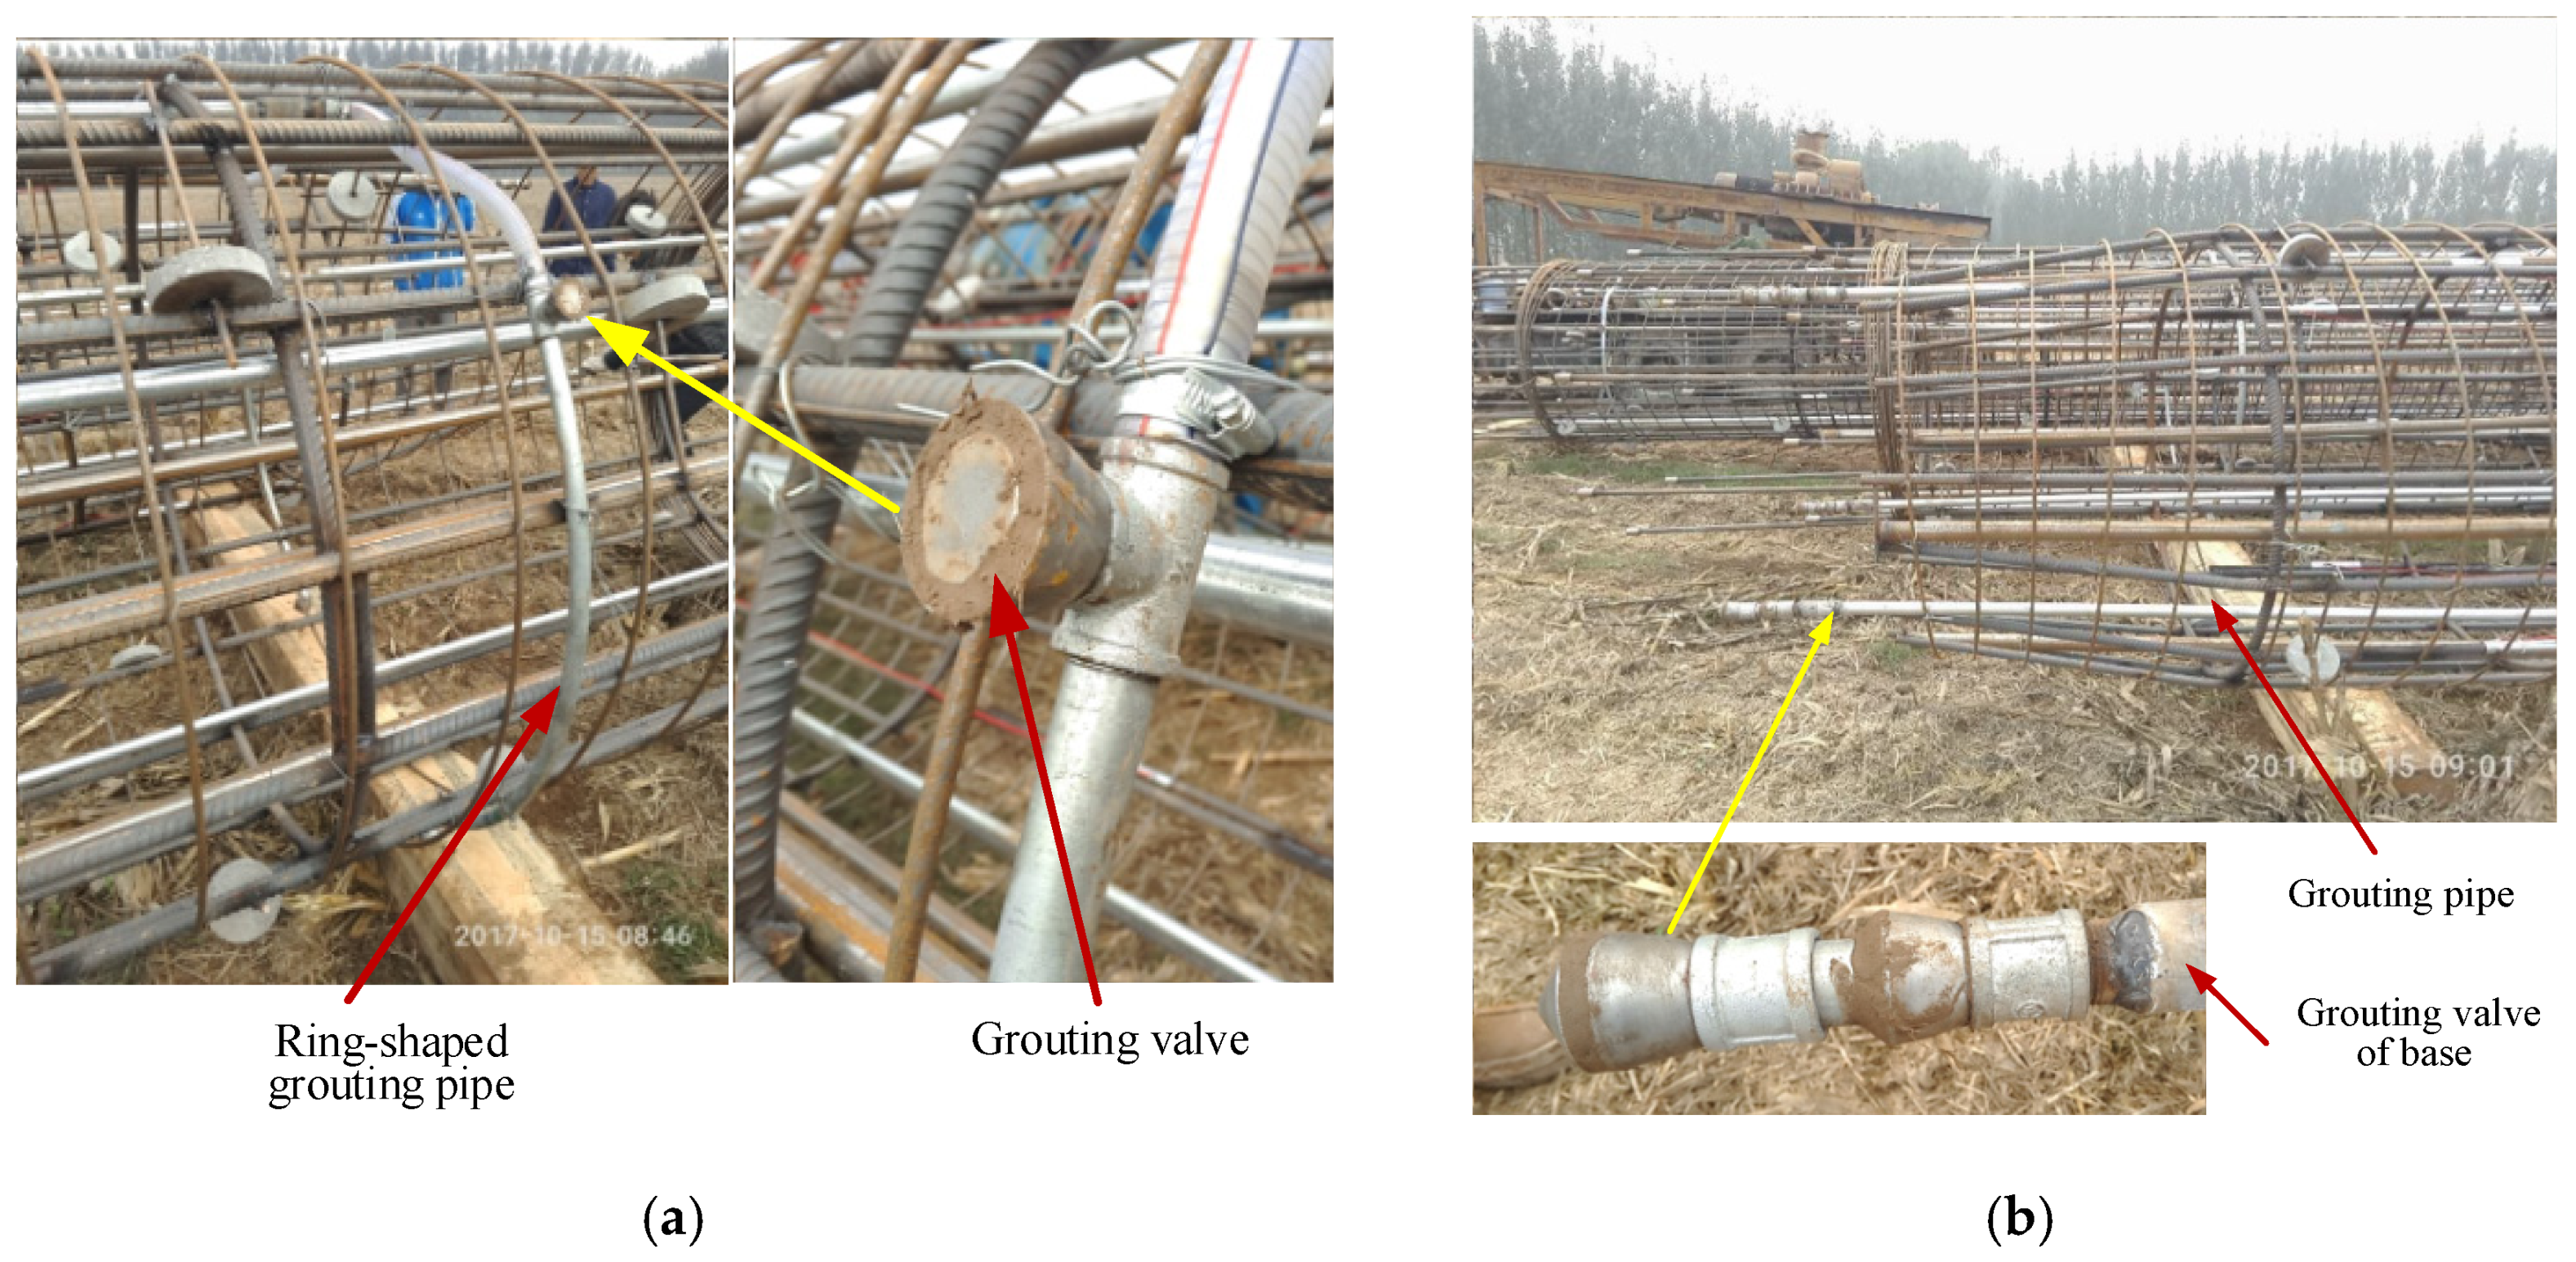
Figure 2. It should be noted that the grouting devices arranged for test shafts TS2, TS3 and TS4 are different. As shown in Figure 2, two ring-shaped grouting pipes were fixed at the side of test shaft TS2, while three for test shafts TS3 and TS4, the spacing between the ring-shaped grouting pipes of grouted shafts are all 10 m. Moreover, three straight grouting pipes were fixed to the bottom of test shaft TS2, while four straight grouting pipes were fixed to the bottom of test shafts TS3 and TS4, respectively, and the bearing layers of the four test shafts were all sand layers with similar properties.

3. Grouting and Loading Test

3.1. Post-Grouting Operation

Post-grouting was conducted 3 days after pouring the concrete. In this study, 0.5 was chosen for the water–cement ratio. The grouting pipes are shown in Figure 3. Then, the grouting parameters for three post grouted drilled shafts are listed in Table 3. As shown in Table 3, the test shafts TS3 and TS4 achieved the design requirements for the quantity of pressurized cement slurry. Nevertheless, the shaft tip grouting quantity of shaft TS3 was only 65% of its design value, and the design requirements were not met. To evaluate the field performance of the post grouted drilled shafts and ensure the construction quality of the project, and the test shafts TS3 and TS4 must be tested for vertical compressive static load test.

3.2. Test Methods

The field load tests were conducted 28 days after the combined grouting. the bi-directional tests were adopted to determine the bearing capacity of test shafts TS1 and TS2. The sketch of bi-directional test method for test shafts are presented in Figure 4a. With the increase of the pressure in the load cell, the shaft side resistance and tip resistance were mobilized due to its upward and downward displacements. The pressure in the load cell was further measured with a pressure gauge. The displacements of the test shaft top, upper shaft segment and lower segment are obtained by displacement transducers installed in advance at the shaft top, the upper and lower level of load cell, respectively. Moreover, photos of the bi-directional test are presented in Figure 4b.
Meanwhile, the bearing capacity of test shafts TS3 and TS4 was determined by a top-down test method. It can be found from Figure 4c that the load was applied and measured by the reaction of jacks at the shaft top and a hydraulic gauge parallel to the jacks, respectively. The settlement of the shaft top was automatically measured by four pre-installed displacement sensors. Then, the field test is presented in Figure 4d.
The slow speed maintenance loading method was adopted in both test methods. During the test, both loading and reloading were completed automatically, and the reading time and termination conditions of the bi-directional static testing method and top-down test method were implemented in accordance with the Chinese standard JT/T 738–2009 [25] and the Chinese standard JGJ 106-2014 [26] respectively.

3.3. Test Procedures

The loads applied on the test shafts were increased incrementally by the hydraulic jacks, and the load cells used in the bi-directional tests have a capacity of 2 × 12 MN. The loading parameters of each shaft are listed in Table 4. The ultimate loading value of the load cell for the test shaft TS1 was 2 × 9.0 MN. The loading was terminated due to the large change in downward displacement and the fact that the design requirements were achieved. Therefore, the limit value of the lower shaft segment was taken as the previous level load, which is 8.4 MN. Since the loading value of the test shaft TS2 reached the capacity of the load cell, the ultimate loading value for the test shaft TS2 was determined as 2 × 12.0 MN. Similarly, the loading for test shafts TS3 and TS4 were terminated owing to the shafts shown no damaged and the settlements did not reach 40 mm during the maximum test load holding time, and the limit loads of test shafts TS3 and TS4 were both 12.6 MN.
The calculation method of converting the maximum test load into the ultimate bearing capacity of the test shaft followed the Chinese standard JT/T 738–2009 [25]. Furthermore, the values of required parameters and the conversion ultimate bearing capacities calculated based on Equation (1) are listed in Table 5.
P u = Q u u W γ c + Q l u
where Pu represents the ultimate bearing capacity of the test shaft (kN); Quu and Qlu represent the maximum load of the upper shaft segment and the lower shaft segment, respectively (kN); W represents the weight of the upper section of the test shaft (kN); and γc represents a correction factor for the test shaft.

4. Prediction of SPT Blow Counts

4.1. Prediction Model

Many scholars have done a lot of research on the relationship between SPT blow count and side resistance, tip resistance or shear wave velocity to predict the bearing capacity of drilled shaft, and achieved a series of meaningful results. Meyerhof [27] proposed the correlation between SPT blow counts and the ultimate side resistance or ultimate tip resistance for silt and sand. The strength parameters of soil given by the calculation model increase linearly with the increase of the SPT blow count. However, the engineering practice shows that the strength parameters of soil estimated by the calculation model could not converge when the SPT blow count is determined as a large value. According to the elastic-plastic theory, the stress–strain relationship of soil has nonlinear characteristics; thus, it can also be considered that the strength of soil changes nonlinearly with the increase of SPT blow counts. To reflect the nonlinear characteristics of soil strength parameters, the hyperbolic tangent function is used to fit the relationship between SPT blow counts and the ultimate side resistance. The asymptote of the function represents the limit value of soil strength, and the ultimate side resistance is determined as follows [28,29]:
q s i k = α tan ( N / ξ + μ )
where qsik represents the ultimate side resistance at section i (kPa); n represents the SPT blow counts; α, ξ and μ are undetermined coefficients. α represents the limit value of soil strength, ξ and μ represent the variation trend of soil strength parameters with SPT blow counts.
In situ SPT were conducted before the installation of the test shafts. Then the values of α, ξ and μ are calculated according to the geological exploration data of the site and the results of static load test of test shafts, as shown in Table 6.

4.2. Prediction and Analysis of SPT Blow Counts

In this paper, the strength parameters of soil before and after grouting are obtained by testing. Based on Equation (2) and corresponding parameters, the predicted SPT blow counts of various soil layers after grouting can be calculated, as shown in Table 7.
It can be obtained from Table 7 that the SPT blow count variation characteristics with the ultimate side resistance are nonlinear. The SPT blow counts of cohesive soil increased by about 12.5~160%, and the SPT blow counts of cohesionless soil increased by about 69.2~200%. It can also be concluded that the post grouting technique has a more obvious improvement on the strength of cohesionless soil.

5. Results and Discussion

5.1. Load-Displacement Responses

Table 8 lists the displacements measured by the displacement sensors installed on the test shafts in advance. Hence, the load versus displacement curves for the four shafts are plotted in Figure 5 from the static load test data. Figure 5a shows the upper and lower shaft segment displacements during the bi-directional static tests. It can be observed from Figure 5a that the load-displacement curves of the upper and lower shaft segments of TS1 and TS2 have similar trends. Additionally, an inflection point can be found in the curve of the load-displacement of the lower segment of TS1. Nevertheless, the curve of the load-displacement of the upper segment of TS1 and the two curves of TS2 are all in the stage of elastic change. As mentioned above, the test process of test shaft TS2 was stopped due to the loading value reached the limit range of the load cell. Therefore, the ultimate bearing capacity of the test shaft TS2 was not obtained in this test. It can also be observed from Figure 5a that the required displacements to mobilize the shaft resistance can be significantly reduced by post-grouting craftwork. This result that the performance of the shaft can be effectively improved by grouting technique is further strongly demonstrated.
Meanwhile, the load-displacement curves for shafts TS3 and TS4 can be found in Figure 5b. As shown in Figure 5b, the types of Q-s curves of test shafts TS3 and TS4 are both slowly-varying, and there is no obvious proportional limit, so the ultimate bearing capacity cannot be determined. However, with the same soils along the shaft, the bearing characteristics of the test shaft TS3 are obviously weaker than that of the shaft TS4. In the initial stage of loading, the soil at the tip of the test shaft TS3 was not completely reinforced by the cement slurry. Conversely, with the increase of soil compression, the shaft tip and the soil were in full contact, and the curve begins to show the characteristics of slow-varying. From the change trend of the curve, it can be concluded that the index of shaft tip grouting has a significant influence on the performance of the test shaft. Furthermore, it can be proved that the improvement effect of the bearing performance of the test shafts by ground improvement and increasing the shaft tip area due to the formation of the grout bulb is significantly influenced by the amount of shaft tip grouting.
The results of the bi-direction static tests were converted into the equivalent unit shaft head resistance–displacement curves for the top-down load-test method [25], as shown in Figure 6. The initial shaft head stiffnesses of the aforementioned shafts are further obtained and presented in Figure 6, i.e., k1, k2, k3 and k4, respectively. Then, it can be found from Figure 6 that the order of k4 > k2 > k3 > k1. The order indicates that the stiffness of shaft top can be significantly enhanced by the combined tip-and-side post grouting craftwork. In addition, the fact that tip grouting has a significant effect on the bearing and load transfer characteristics of the test shafts can be further clarified by the order of k4 > k2 > k3.

5.2. Responses of Shaft Top Load Versus Normalized Displacement

Figure 7 presents the shaft top load versus normalized displacement curves for the four test shafts. The normalized displacement is defined that the ratio of the measured displacement to shaft diameter (D).
As shown in Figure 7, an inflection point can be found in the curve of TS1, which does not appear in curves of the other three test shafts. Thus, the slow-varying curves are applicable to the TS2, TS3 and TS4, while the slowly varying linear characteristics of the Q-s/D curves of the TS2 and TS4 are more remarkable. In addition, the Q-s/D curves of the test shafts TS1 and TS3 are basically coincident. In addition, the Q-s/D curves of the test shafts TS1 and TS3 are basically coincident. It can also be obtained that the grouted shafts (TS2 and TS4) require less displacements to mobilize the same shaft resistance compared to the ungrouted shafts (TS1). For example, the load value was determined as 10.08 MN, the corresponding normalized displacements of test shafts TS1, TS2, TS3 and TS4 were 5.56‰ D, 2.18‰ D, 5.39‰ D and 3.00‰ D, respectively. Compared with the ungrouting drilled shaft TS1, although the post-grouting drilled shaft TS3 has a shorter length, smaller diameter, and the amount of grouting does not meet the design requirements, it can exert a similar performance of the test shaft TS1, which further reflects the advantages of post-grouting drilled shaft in terms of economy and safety.

5.3. Distribution of Axial Force on Test Shafts

It is assumed that the steel bars and the concrete deformed consistently under load. Axial forces in each section of the shaft were determined by data measured with strain gauges installed in advance on the reinforcement cage. The shaft resistance and the relative displacement of the soil and the shaft are further calculated and analyzed [30]. Hence, the distributions of the axial forces in TS1 and TS2 under different levels of load are shown in Figure 8.
It can be observed from Figure 8 that the axial forces on the two test shafts are almost the same at the shaft tip at light loading levels. Then, the axial force on the shaft increases gradually with the increase of the load, and the resistance of the soil around the shaft continues to be mobilized. Note the axial force on the test shaft decreases with depth. Since the slope of the axial force curve is inversely related to the shaft resistance, the slope of the curves for the shaft TS2 are shallower than for the shaft TS1, which indicates that the resistance of the shaft after grouting is higher than that of the shaft without grouting. This also shows that pressurized cement grout can improve the physical and mechanical properties of the soil layers around the shaft and the shaft–soil interface.

5.4. Mobilized Shaft Resistance

The mobilized shaft resistance was further calculated, Figure 9 presents the distribution of shaft resistance for shafts TS1 and TS2.
It can be observed from Figure 9 that the shaft resistance at various depths after grouting is greater than that without grouting under the same load. For example, ①t silty clay at depths between 21.4 and 29.4 m, the maximum shaft resistance values for shafts TS1 and TS2 were 52 kPa and 82 kPa, respectively, when the load was determined to be 2 × 9.0 MN.
In addition, the shaft–soil relative displacement was calculated based on the axial force. It should be noted that the relative displacement of shaft and soil at a specific depth is considered to be equal to the displacement of shaft. Hence, Figure 10 presents the curves of shaft resistance and relative displacement for the shaft and soil at various depths. It can be seen from Figure 10 that the grouted shaft (TS2) can be mobilized with significantly higher shaft resistance than the control shaft (TS1) for the same relative displacement. Furthermore, Figure 10a, c shows that the shaft resistance at the specific soil and depth can be more fully developed due to its adjacent to the grouting pipe. For instance, the shaft resistance of the soil layer within the depth of 4.4~10.0 m of test shaft TS2 was more fully exerted than that in the depth of 0~4.4 m. Moreover, the shaft resistance at sections farther away from the grouting pipes was also enhanced, which indicates that the cement slurry was driven by pressure to migrate along the axis. For example, the shaft resistance of grouted shaft TS2 in the soil layer within the depth range of 0~4.4 m has an increase compared with ungrouted shaft TS1. It can also be seen in Figure 10b that the enhancement effect of the post-grouting craftwork on the resistance of the shaft is related to the type of soil along the shaft. For instance, the shaft resistance in the soil layer ③ Coarse sand is more significantly mobilized after grouting than that in the deeper layer ①t Silty clay. Additionally, Figure 10c shows that the soil layer close to the shaft tip of grouted shaft TS2 has a higher strength and stiffness than soil layers of the same type and different depths. Figure 10c shows that for ①t Silty clay, the soil at the tip of shaft TS2 has higher strength and stiffness than the other depths after grouting.
As a conclusion, the soil surrounding the shaft can be stronger and stiffer through the post-grouting technique. The shaft resistance can further be mobilized at a smaller shaft–soil relative displacement. The effect of post grouting to improve the mechanical properties of the soil around the shaft is related to the type of soil, and the enhancement effect is more significant for cohesionless soil.

5.5. Mobilized Tip Resistance

The tip resistance of the test shafts TS1 and TS2 was obtained by subtracting the side resistance of lower shaft segments from the O-cell load. The percentage of the tip resistance and side resistance of shafts TS1 and TS2 in the total equivalent top load at various loads is demonstrated by Figure 11.
As shown in Figure 11, the grouted shaft TS2 has a higher percentage of tip resistance compared to the control shaft TS1 under various loads. Furthermore, the ratio of tip resistance to total load for test shafts TS1 and TS2, which reached ultimate bearing capacity, was 23.83% and 34.26%, respectively. This result shows that the tip resistance of the shaft can be mobilized more rapidly and fully after grouting, and the side and tip resistance are mobilized in a more synchronized and coordinated manner due to the pre-mobilization of the grouted cement.
Pre-mobilization refers to mobilization of “negative” side resistance along the length of the shafts in proportion to the magnitude of the bi-directional force induced during grouting, with simultaneous consumption of an equal magnitude of tip resistance. The net effect of pre-mobilization is to improve the “stiffness” of the load-displacement response at intermediate loads without changing the ultimate resistance for the post grouted drilled shafts. In order to maximize pre-mobilization, it is advantageous to maximize the bi-directional force due to the grout pressure. Nevertheless, ground improvement at the shaft tip and enlargement of the shaft tip could increase the ultimate tip resistance [21,30].
As shown in Figure 7, due to the insufficient grouting pressure, the preloading failed to fully mobilize the negative friction along the shaft TS3. Since the formation of the grout bulb at the tip of shaft TS3 was smaller than that of test shafts TS2 and TS4, resulting in lower stiffness and bearing capacity of test shaft TS3 compared to that of the other grouted test shafts.

6. Conclusions

Four full-scale load tests on large-diameter drilled shafts are reported in this paper to investigate the differences in axial behavior of shafts with and without grouting under compressive loading. Based on the test results and discussions, the following conclusions can be summarized.
  • Post-grouting drilled shaft has great advantages in terms of economy and safety. The bearing characteristics of the shaft can be effectively enhanced by using the combined tip and side post grouting technique. The load was determined to be 10.08 MN, the corresponding normalized displacements of control shaft (TS1) and grouted shaft (TS2, TS3 and TS4) were 5.56‰ D, 2.18‰ D, 5.39‰ D and 3.00‰ D, respectively.
  • The index of shaft tip grouting has a significant influence on the performance of the test shaft. Pre-mobilization that tends to stiffen the response of post grouted drilled shaft but not increase the ultimate tip resistance, whereas ground improvement at the shaft tip and enlargement of the shaft tip would increase the ultimate tip resistance.
  • The SPT blow counts of soil increased after grouting, and it is nonlinear with the increase of soil strength parameters. The SPT blow counts of cohesive soil increased by about 12.5~160%, and the SPT blow counts of cohesionless soil increased by about 69.2~200%.
  • The pressurized cement grout can improve the physical and mechanical properties of the soil layers surround the shaft and the shaft–soil interface, and the enhancement effect is more significant for cohesionless soil.
  • Tip resistance of shaft can be mobilized more rapidly and fully after grouting, and the side and tip resistance are mobilized in a more synchronized and coordinated manner due to the pre-mobilization of the grouted cement.
  • Although the designed tip grouting quantity of test shaft TS3 was not reached, the bearing capacity required for the design load of shaft TS3 was fully met.

Author Contributions

Data curation, Z.Z.; Funding acquisition, W.G. and G.D.; Investigation, Z.Z. and G.D.; Project administration, W.G.; Software, X.C.; Writing—review & editing, Z.Z., G.D., Y.Z. and H.H. All authors have read and agreed to the published version of the manuscript.

Funding

This research was funded by National Natural Science Foundation of China (Nos. 51878160; 52008100), Natural Science Foundation of Jiangsu Province (No. BK20200400), and Six Talent Peaks Project in Jiangsu Province (No. XNY-047). The authors are grateful for their support.

Institutional Review Board Statement

Not applicable.

Informed Consent Statement

Not applicable.

Data Availability Statement

Not applicable.

Acknowledgments

The authors’ gratitude goes to the reviewers for their helpful comments and constructive suggestions in improving this paper.

Conflicts of Interest

The authors declare that there is no conflict of interest. They have no known competing financial interests or personal relationships that could have appeared to influence the work reported in this paper.

References

  1. Bruce, D.A. Enhancing the performance of large diameter piles by grouting. Ground Eng. 1986, 19, 9–15. [Google Scholar]
  2. Majano, R.E.; O’Neill, M.W.; Hassan, K.M. Perimeter load transfer in model drilled shafts formed under slurry. J. Geotech. Eng. 1994, 120, 2136–2154. [Google Scholar] [CrossRef]
  3. Sliwinski, Z.J.; Fleming, W.G.K. The integrity and performance of bored piles. In Piling and Ground Treatment; Thomas Telford Publishing: London, UK, 1984; pp. 211–223. [Google Scholar]
  4. Stocker, M.F. Influence of post-grouting on the load-bearing capacity of bored piles. In Proceedings of the 8th European Conference on Soil Mechanics and Foundation Engineering, Helsinki, Finland, 23–26 May 1983; pp. 167–170. [Google Scholar]
  5. Zhang, Z.M.; Yu, J.; Zhang, G.X.; Zhou, X.M. Test study on the characteristics of mudcakes and in situ soils around bored piles. Can. Geotech. J. 2009, 46, 241–255. [Google Scholar] [CrossRef]
  6. Wan, Z.H.; Dai, G.L.; Gong, W.M. Field study on post-grouting effects of cast-in-place bored piles in extra-thick fine sand layers. Acta Geotech. 2019, 14, 1357–1377. [Google Scholar] [CrossRef]
  7. Zhang, Z.T.; Gong, W.M.; Dai, G.L.; Xu, J. Enhancement of load bearing of post-grouted drilled shafts based on in situ tests. Arab. J. Geosci. 2021, 14, 1–13. [Google Scholar] [CrossRef]
  8. El-Kelesh, A.M.; Matsui, T.; Tokida, K. Field investigation into effectiveness of compaction grouting. J. Geotech. Geoenviron. Eng. 2012, 138, 451–460. [Google Scholar] [CrossRef] [Green Version]
  9. Wan, Z.H.; Dai, G.L.; Gong, W.M. Field and theoretical analysis of response of axially loaded grouted drilled shafts in extra-thick fine sand. Can. Geotech. J. 2020, 57, 391–407. [Google Scholar] [CrossRef]
  10. Fiscina, L.F.G.; Barbosa, Y.; Albuquerque, P.J.R.D.; Carvalho, D.D. Field study on axial behavior of instrumented post-grouted steel pipe micropiles in tropical lateritic soil. Innov. Infrastruct. Solut. 2021, 6, 1–17. [Google Scholar] [CrossRef]
  11. Sinnreich, J.; Simpson, R.C. Case histories of full-scale comparative load testing of base grouted and Ungrouted test shaft pairs. In Proceedings of the IFCEE 2015, San Antonio, TX, USA, 17–21 March 2015; pp. 486–499. [Google Scholar]
  12. Frizzi, R.P.; Meyer, M.E.; Zhou, L.J. Full Scale Field Performance of Drilled Shafts Constructed Utilizing Bentonite and Polymer Slurries. In GeoSupport 2004: Drilled Shafts, Micropiling, Deep Mixing, Remedial Methods, and Specialty Foundation Systems; Geotechnical Special Publication: Orlando, FL, USA, 2004; pp. 573–586. [Google Scholar]
  13. Ruiz, M.E.; Pando, M.A. Load transfer mechanisms of tip post-grouted drilled shafts in sand. In Proceedings of the International Foundation Congress and Equipment Expo 2009, Orlando, FL, USA, 15–19 March 2009; pp. 23–30. [Google Scholar]
  14. Thiyyakkandi, S.; McVay, M.; Bloomquist, D.; Lai, P. Measured and predicted response of a new jetted and grouted precast pile with membranes in cohesionless soils. J. Geotech. Geoenviron. Eng. 2013, 139, 1334–1345. [Google Scholar] [CrossRef]
  15. Dai, G.L.; Gong, W.M.; Xue, G.Y.; Tong, X.D. Effect examination for a base post-grouted overlength drilling pile. Rock Soil Mech. 2006, 27, 849–852. [Google Scholar]
  16. Day, T.J.; Boeckmann, A.Z.; Loehr, J.E. Separating contributions from pre-mobilization and ground improvement for post-grouted drilled shafts. In Proceedings of the IFCEE 2015, San Antonio, TX, USA, 17–21 March 2015; pp. 951–960. [Google Scholar]
  17. Wen, L.; Kong, G.Q.; Li, Q.S.; Zhang, Z.D. Field Tests on Axial Behavior of Grouted Steel Pipe Micropiles in Marine Soft Clay. Int. J. Geomech. 2020, 20, 06020006. [Google Scholar] [CrossRef]
  18. Mullins, G.; Winters, D.; Dapp, S. Predicting end bearing capacity of post-grouted drilled shaft in cohesionless soils. J. Geotech. Geoenviron. Eng. 2006, 132, 478–487. [Google Scholar] [CrossRef] [Green Version]
  19. Thompson, P.A. Base and shaft grouted piles. Proc. Inst. Civ. Eng. Geotech. Eng. 1996, 119, 186–192. [Google Scholar] [CrossRef]
  20. Duan, X.S.; Kulhawy, F.H. Tip Post-Grouting of Slurry-Drilled Shafts in Soil: Chinese Experiences; Contemporary Topics in Deep Foundations: Orlando, FL, USA, 2009; pp. 47–54. [Google Scholar]
  21. Fang, K.; Zhang, Z.M.; Zhang, Q.Q.; Liu, X.W. Prestressing effect evaluation for a grouted shaft: A case study. Proc. Inst. Civ. Eng.-Geotech. Eng. 2014, 167, 253–261. [Google Scholar] [CrossRef]
  22. Tan, Y.; Lu, Y.; Peng, F.; Liao, S.M. Post-Grouting of long bored piles in clay. In Proceedings of the Grouting 2017, Honolulu, HI, USA, 9–12 July 2017; pp. 338–347. [Google Scholar]
  23. Fernandez, A.L.; Pando, M.A.; King, P.G. Load test program to validate model for post grouted drilled shafts. In Proceedings of the Geo-Denver 2007, Denver, CO, USA, 18–21 February 2007; pp. 1–11. [Google Scholar]
  24. Ministry of Water Resources of the People’s Republic of China. GB/T 50123-1999 Standard for Soil Test Method; China Planning Press: Beijing, China, 1999. (In Chinese)
  25. The Traffic Professional Standards Compilation Group of People’s Republic of China. JT/T 738-2009 Static Loading Test of Foundation Pile-Self-Balanced Method; China Communications Press: Beijing, China, 2009. (In Chinese)
  26. People’s Republic of China Industry Standards Writing Group. JGJ 106-2014 Technical Specifications for Building Pile Testing; China Building Industry Press: Beijing, China, 2014. (In Chinese)
  27. Meyerhof, G.G. Bearing capacity and settlement of pile foundations. J. Geotech. Eng. Div. 1976, 102, 197–228. [Google Scholar] [CrossRef]
  28. Zhang, X.M.; Wang, J.H.; Li, S.B.; Du, Q. New method for estimation of ultimate bearing capacity of friction pile. Chin. J. Rock Mech. Eng. 2004, 23, 2305–2311. [Google Scholar]
  29. Liu, J.L. Estimation of ultimate bearing capacity of pile with SPT blow count. Geotech. Eng. Tech. 2002, 2, 88–91. [Google Scholar]
  30. Wan, Z.H.; Dai, G.L.; Gong, W.M. Full-scale load testing of two large-diameter drilled shafts in coral-reef limestone formations. Bull. Eng. Geol. Environ. 2018, 77, 1127–1143. [Google Scholar] [CrossRef]
Figure 1. Drilled shaft load transfer after grouting [23]. (a) Factor 1. (b) Factor 2. (c) Factor 3. (d) Factor 4.
Applsci 11 11883 g001
Figure 2. Soil distribution and details of test shafts.
Applsci 11 11883 g002
Figure 3. Grouting pipes. (a) Ring-shaped grouting pipes of test shafts. (b) Straight grouting pipes of test shafts.
Applsci 11 11883 g003
Figure 4. Field test. (a) Schematic diagram fo bi-directional static test. (b) Monitoring device of the bi-directional static test. (c) Schematic diagram for static load test. (d) Static load test site.
Applsci 11 11883 g004
Figure 5. Load versus displacement curves of the test shafts. (a) TS1 vs. TS2. (b) TS3 vs. TS4.
Applsci 11 11883 g005
Figure 6. Unit top resistance versus displacement curves of the test shafts.
Applsci 11 11883 g006
Figure 7. Load of shaft top versus normalized settlement.
Applsci 11 11883 g007
Figure 8. Axial force distributions of the two test shafts for different loads. (a) TS1. (b) TS2.
Applsci 11 11883 g008
Figure 9. Distributions of shaft resistance. (a) TS1. (b) TS2.
Applsci 11 11883 g009
Figure 10. Shaft resistance and shaft–soil relative displacement response in different depth soil layers. (a) Depth of 0~4.4 m. (b) Depth of 10~16.4 m. (c) Depth of 16.4~29.4 m.
Applsci 11 11883 g010aApplsci 11 11883 g010b
Figure 11. The percentage of the tip resistance and side resistance of the shaft.
Applsci 11 11883 g011
Table 1. Parameters of physical properties of soil.
LayerStratum DescriptionThickness of Each Soil Layer/mω (%)γ (kN/m3)c (kPa)φ (°)
TS1TS2TS3TS4
Silty clay4.44.410.810.825.719.041.111.7
Silty clay mixed Coarse sand5.65.6 24.519.431.725.3
Coarse sand2.42.4 3018.418.56.1
Fine sand 3.53.526.319.121.39.4
①tSilty clay17.017.06.26.225.719.211.74.9
③tCoarse sand5.01.6 26.218.43.718.9
Silty clay10.6 12.712.723.719.244.315.8
Coarse sand1.0 4.84.822.018.54.325.9
Table 2. Details of the shafts.
Shaft No.Diameter (m)Length (m)Concrete GradeO-Cell above Shaft Tip (m)
TS11.846C3011
TS21.831C305
TS31.638C30-
TS41.638C30-
Table 3. Grouting parameters of grouted shafts.
Shaft
No.
Design Quantity (kg)Actual Quantity (kg)Number of Grouting PipesGrouting Pressure (MPa)
Straight Pipes, Side PipesC1, C2, C3D1, D2, D3, D4
TS2738084003, 21.711, 0.461, _2.2–2.5
TS310,30083754, 31.689, 1.212, 0.5212.0–2.8
TS410,30010,4604, 31.727, 1.182, 0.6422.2–3.4
Table 4. Loading parameters of the field test.
Shaft No.Limit Load (MN)Loading IncrementsLoad Per Level (kN)Initial Load (kN)
TS12 × 9.0142 × 6002 × 1200
TS22 × 12.0192 × 6002 × 1200
TS312.6912602520
TS412.6912602520
Table 5. Calculated ultimate bearing capacities of the test shafts.
Shaft No.Quu (kN)Qlu (kN)Length of Upper
Shaft Segment (m)
W (kN)γcPu (kN)
TS1900084003512910.7818,283
TS212,00012,000269590.7726,339
Table 6. The values of α, ξ, and μ.
Layerαξμ
100.001037.03700.1207
100.0105136.88770.2782
100.010436.08320.0479
100.016862.82780.1138
①t99.991094.50840.2309
③t99.995651.02610.1501
100.001140.79860.1842
99.993158.22290.2329
Table 7. The Predicted SPT blow count after grouting.
LayerBefore GroutingAfter GroutingImprovement of SPT Blow Counts (%)
the Ultimate Side Resistance (kPa)Tested SPT Blow Countthe Ultimate Side Resistance (kPa)Predicted SPT Blow Counts
35837912.5
40145531121.4
4513762269.2
3514
①t5022753977.3
③t60199045136.8
60159839160.0
652010060200.0
Table 8. Loads and displacements of the test shafts.
Shaft No.Maximum Load (MN)Maximum Displacement (mm)Maximum Rebound (mm)Rebound Rate (%)
UpwardDownwardUpwardDownwardUpwardDownwardUpwardDownward
TS19.09.028.7360.9717.7630.0361.8249.25
TS212.012.09.274.014.611.4450.2764.09
TS312.612.745.6844.58
TS412.68.162.9436.03
Publisher’s Note: MDPI stays neutral with regard to jurisdictional claims in published maps and institutional affiliations.

