
Radiological Investigation on Sediments: A Case Study of Wadi Rod Elsayalla the Southeastern Desert of Egypt


 ,
,  ,
,  ,
,
Abstract
:1. Introduction
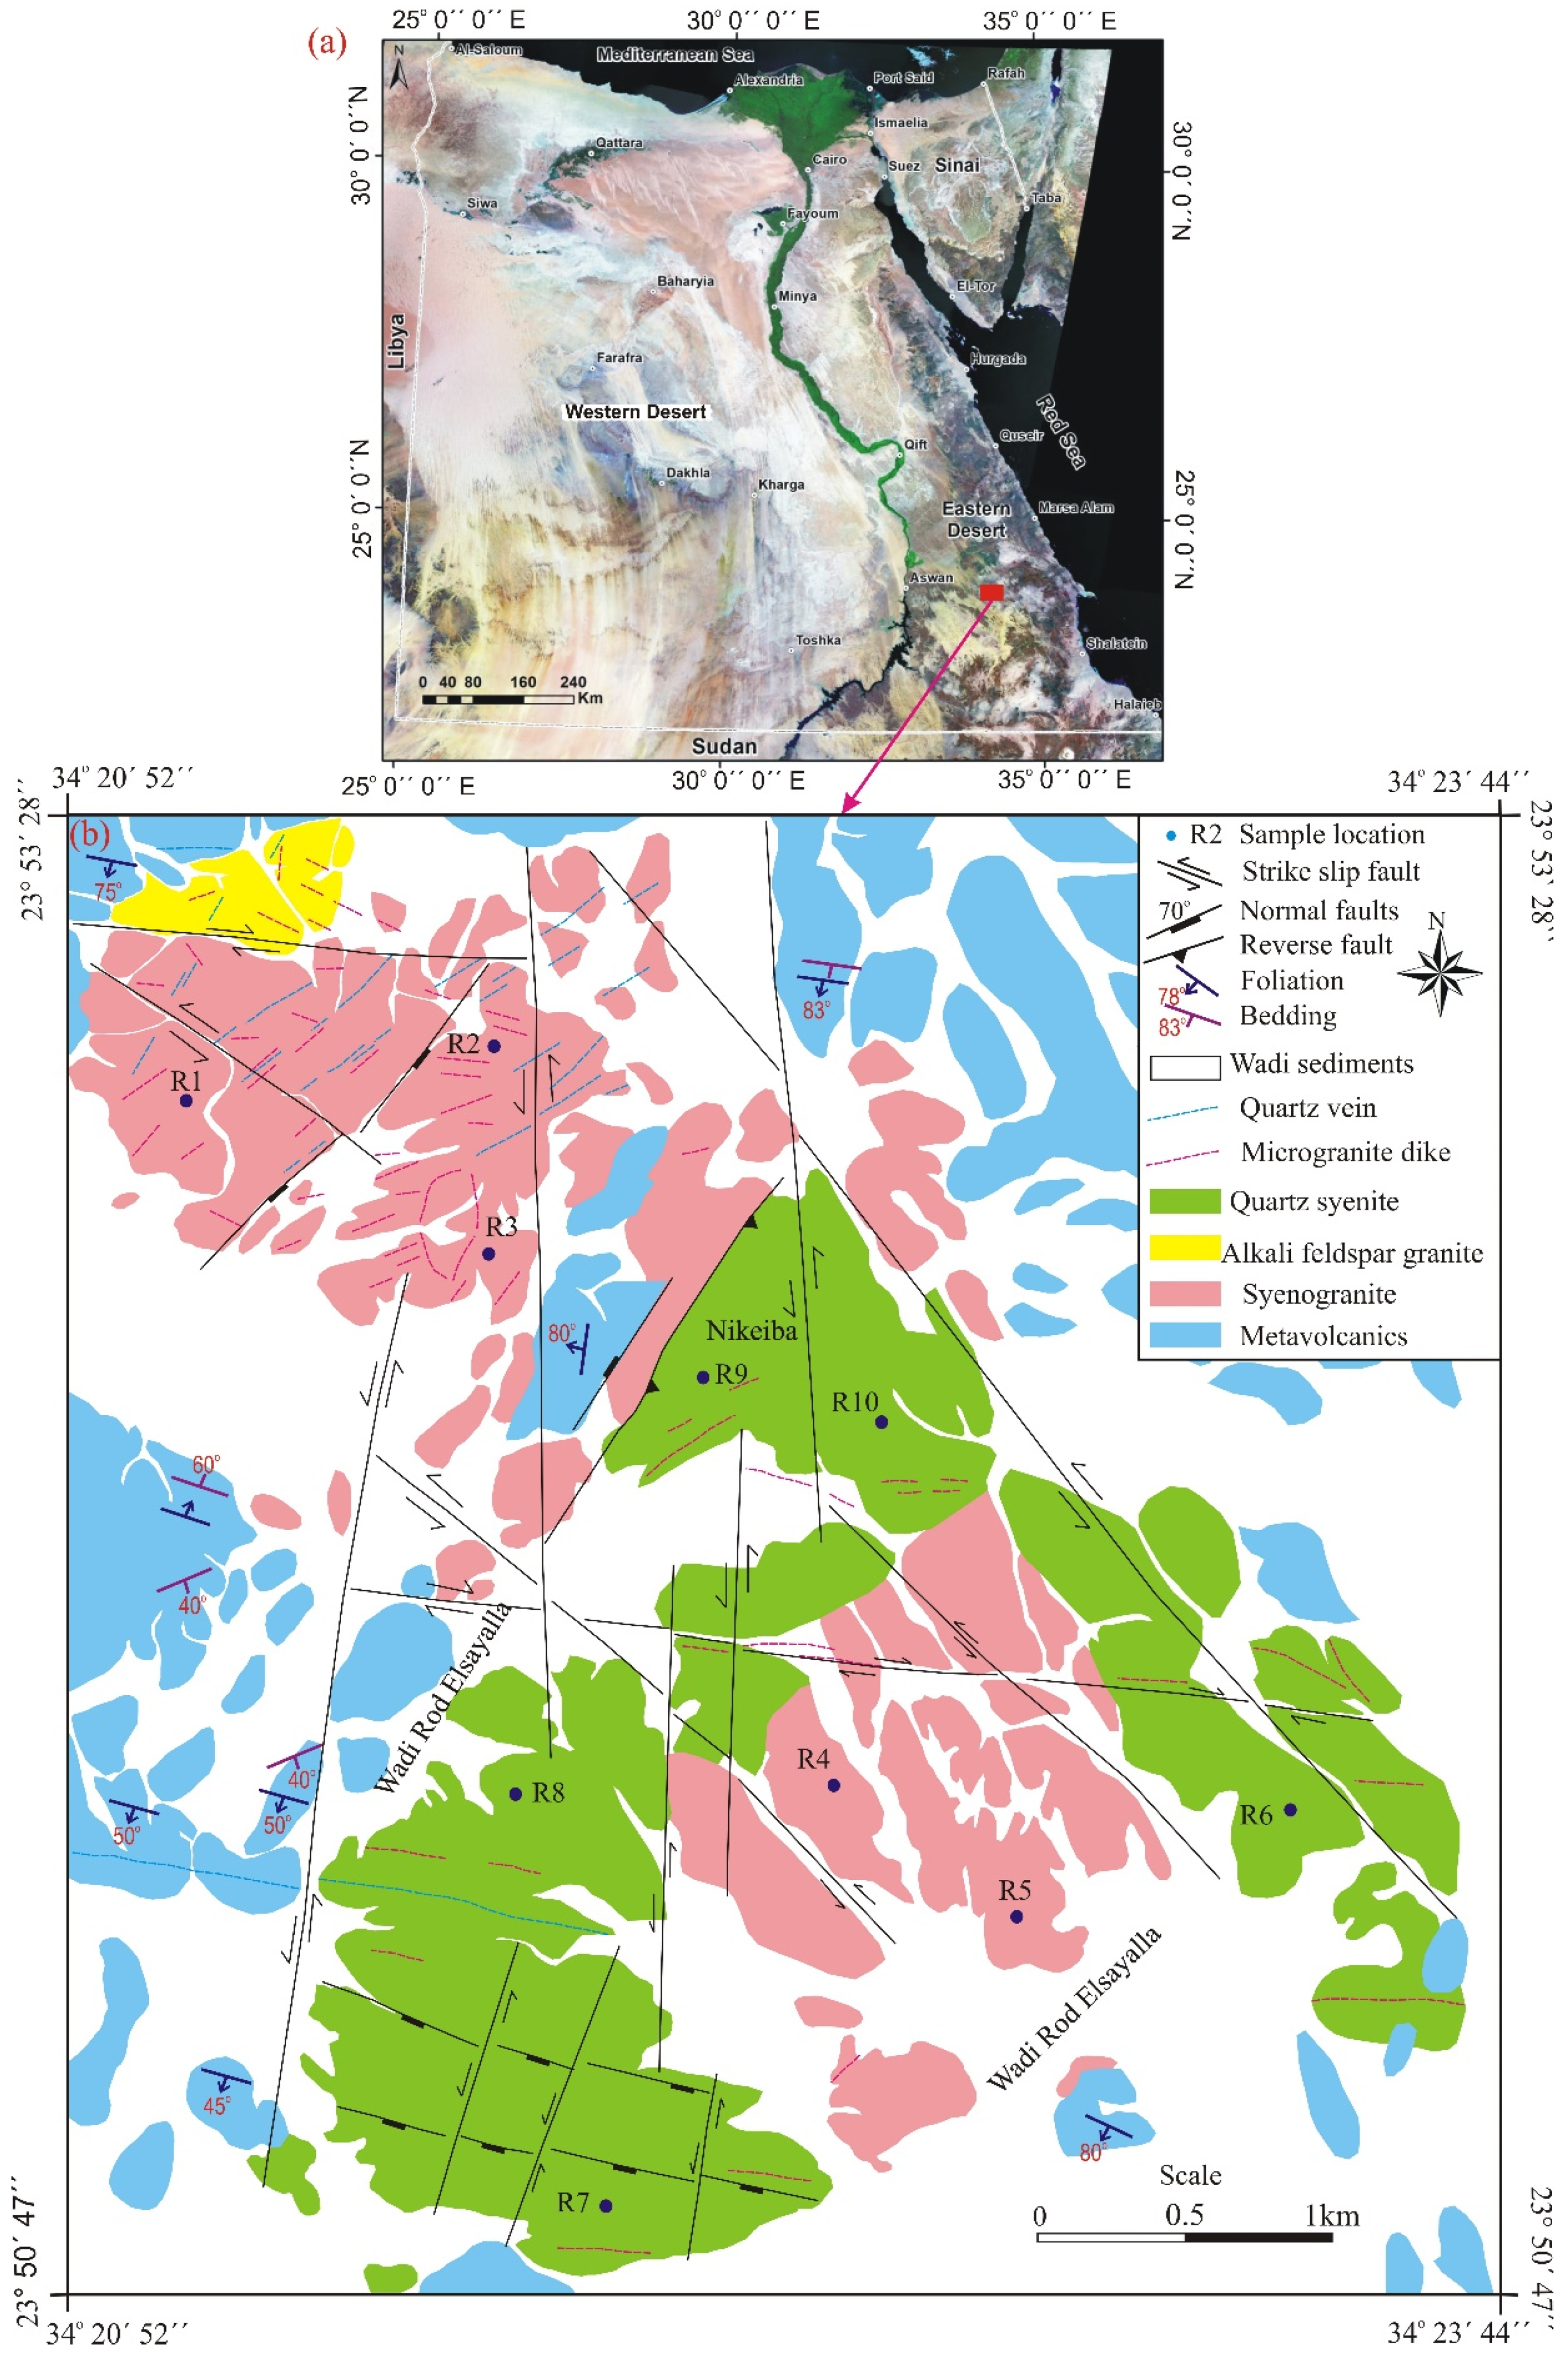
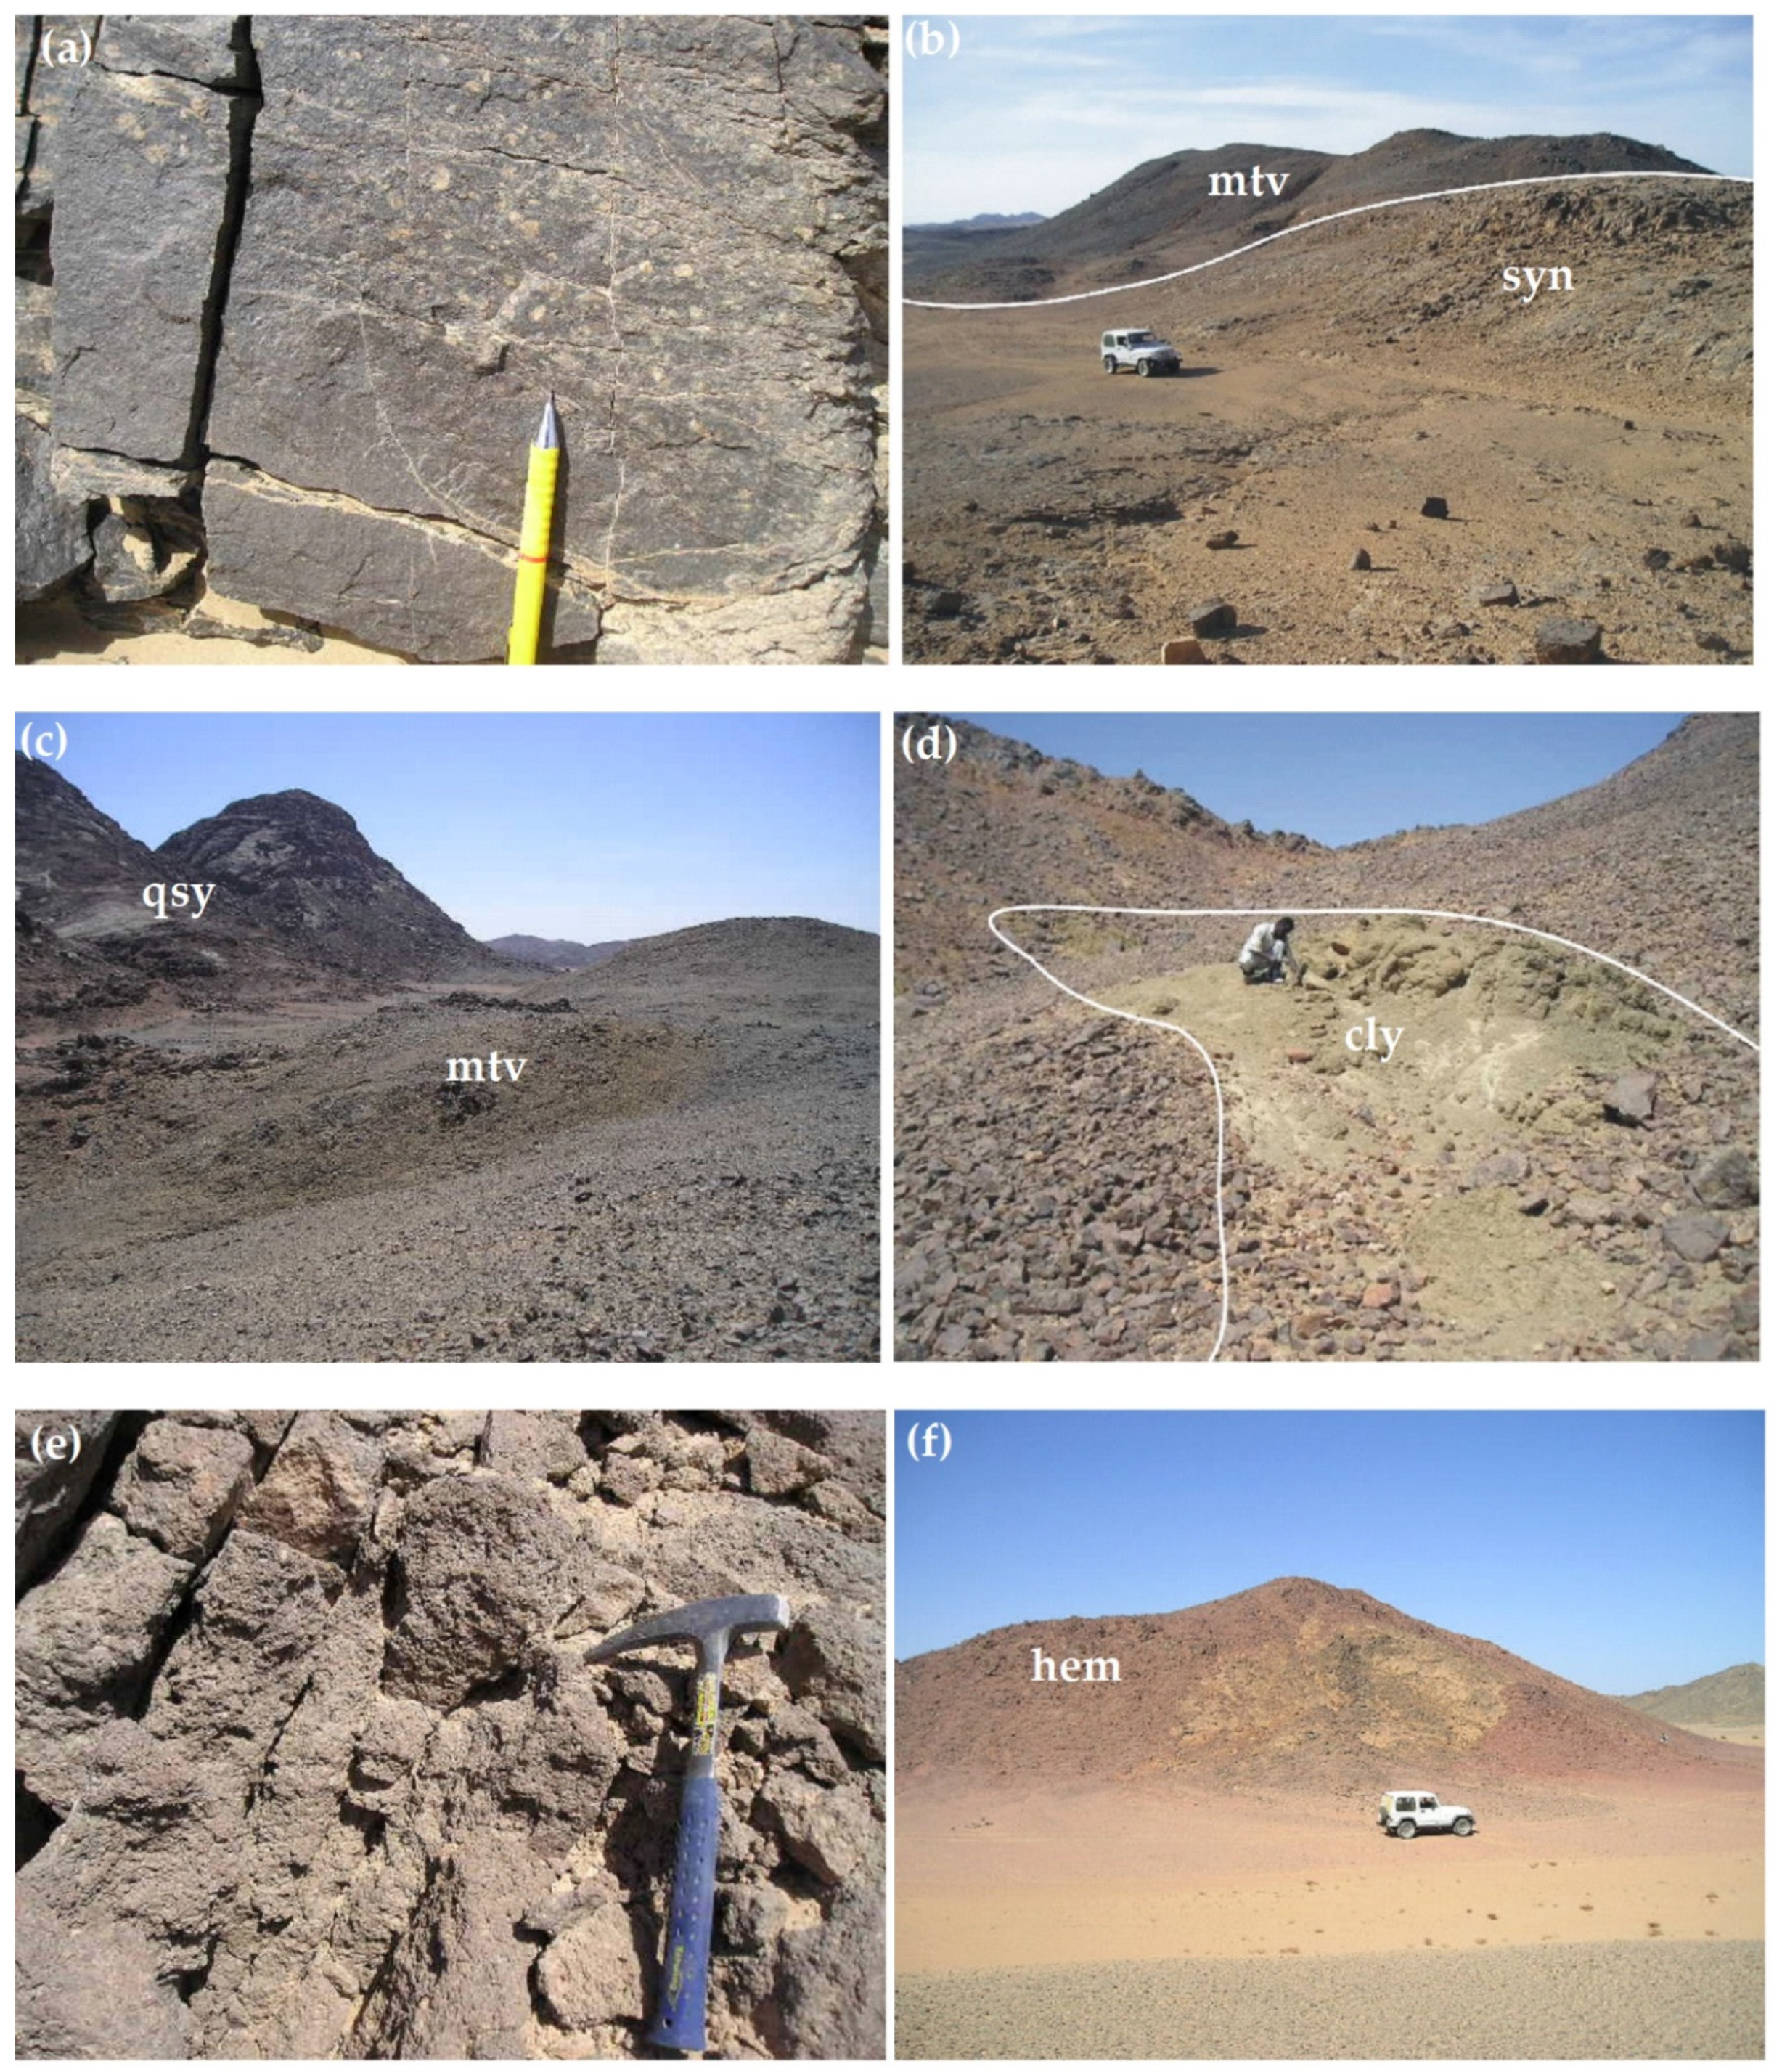
2. Geologic Setting
3. Materials and Methods
3.1. GS-256 Spectrometer
3.2. Heavy Minerals
3.3. Methods of Separation
4. Results and Discussion
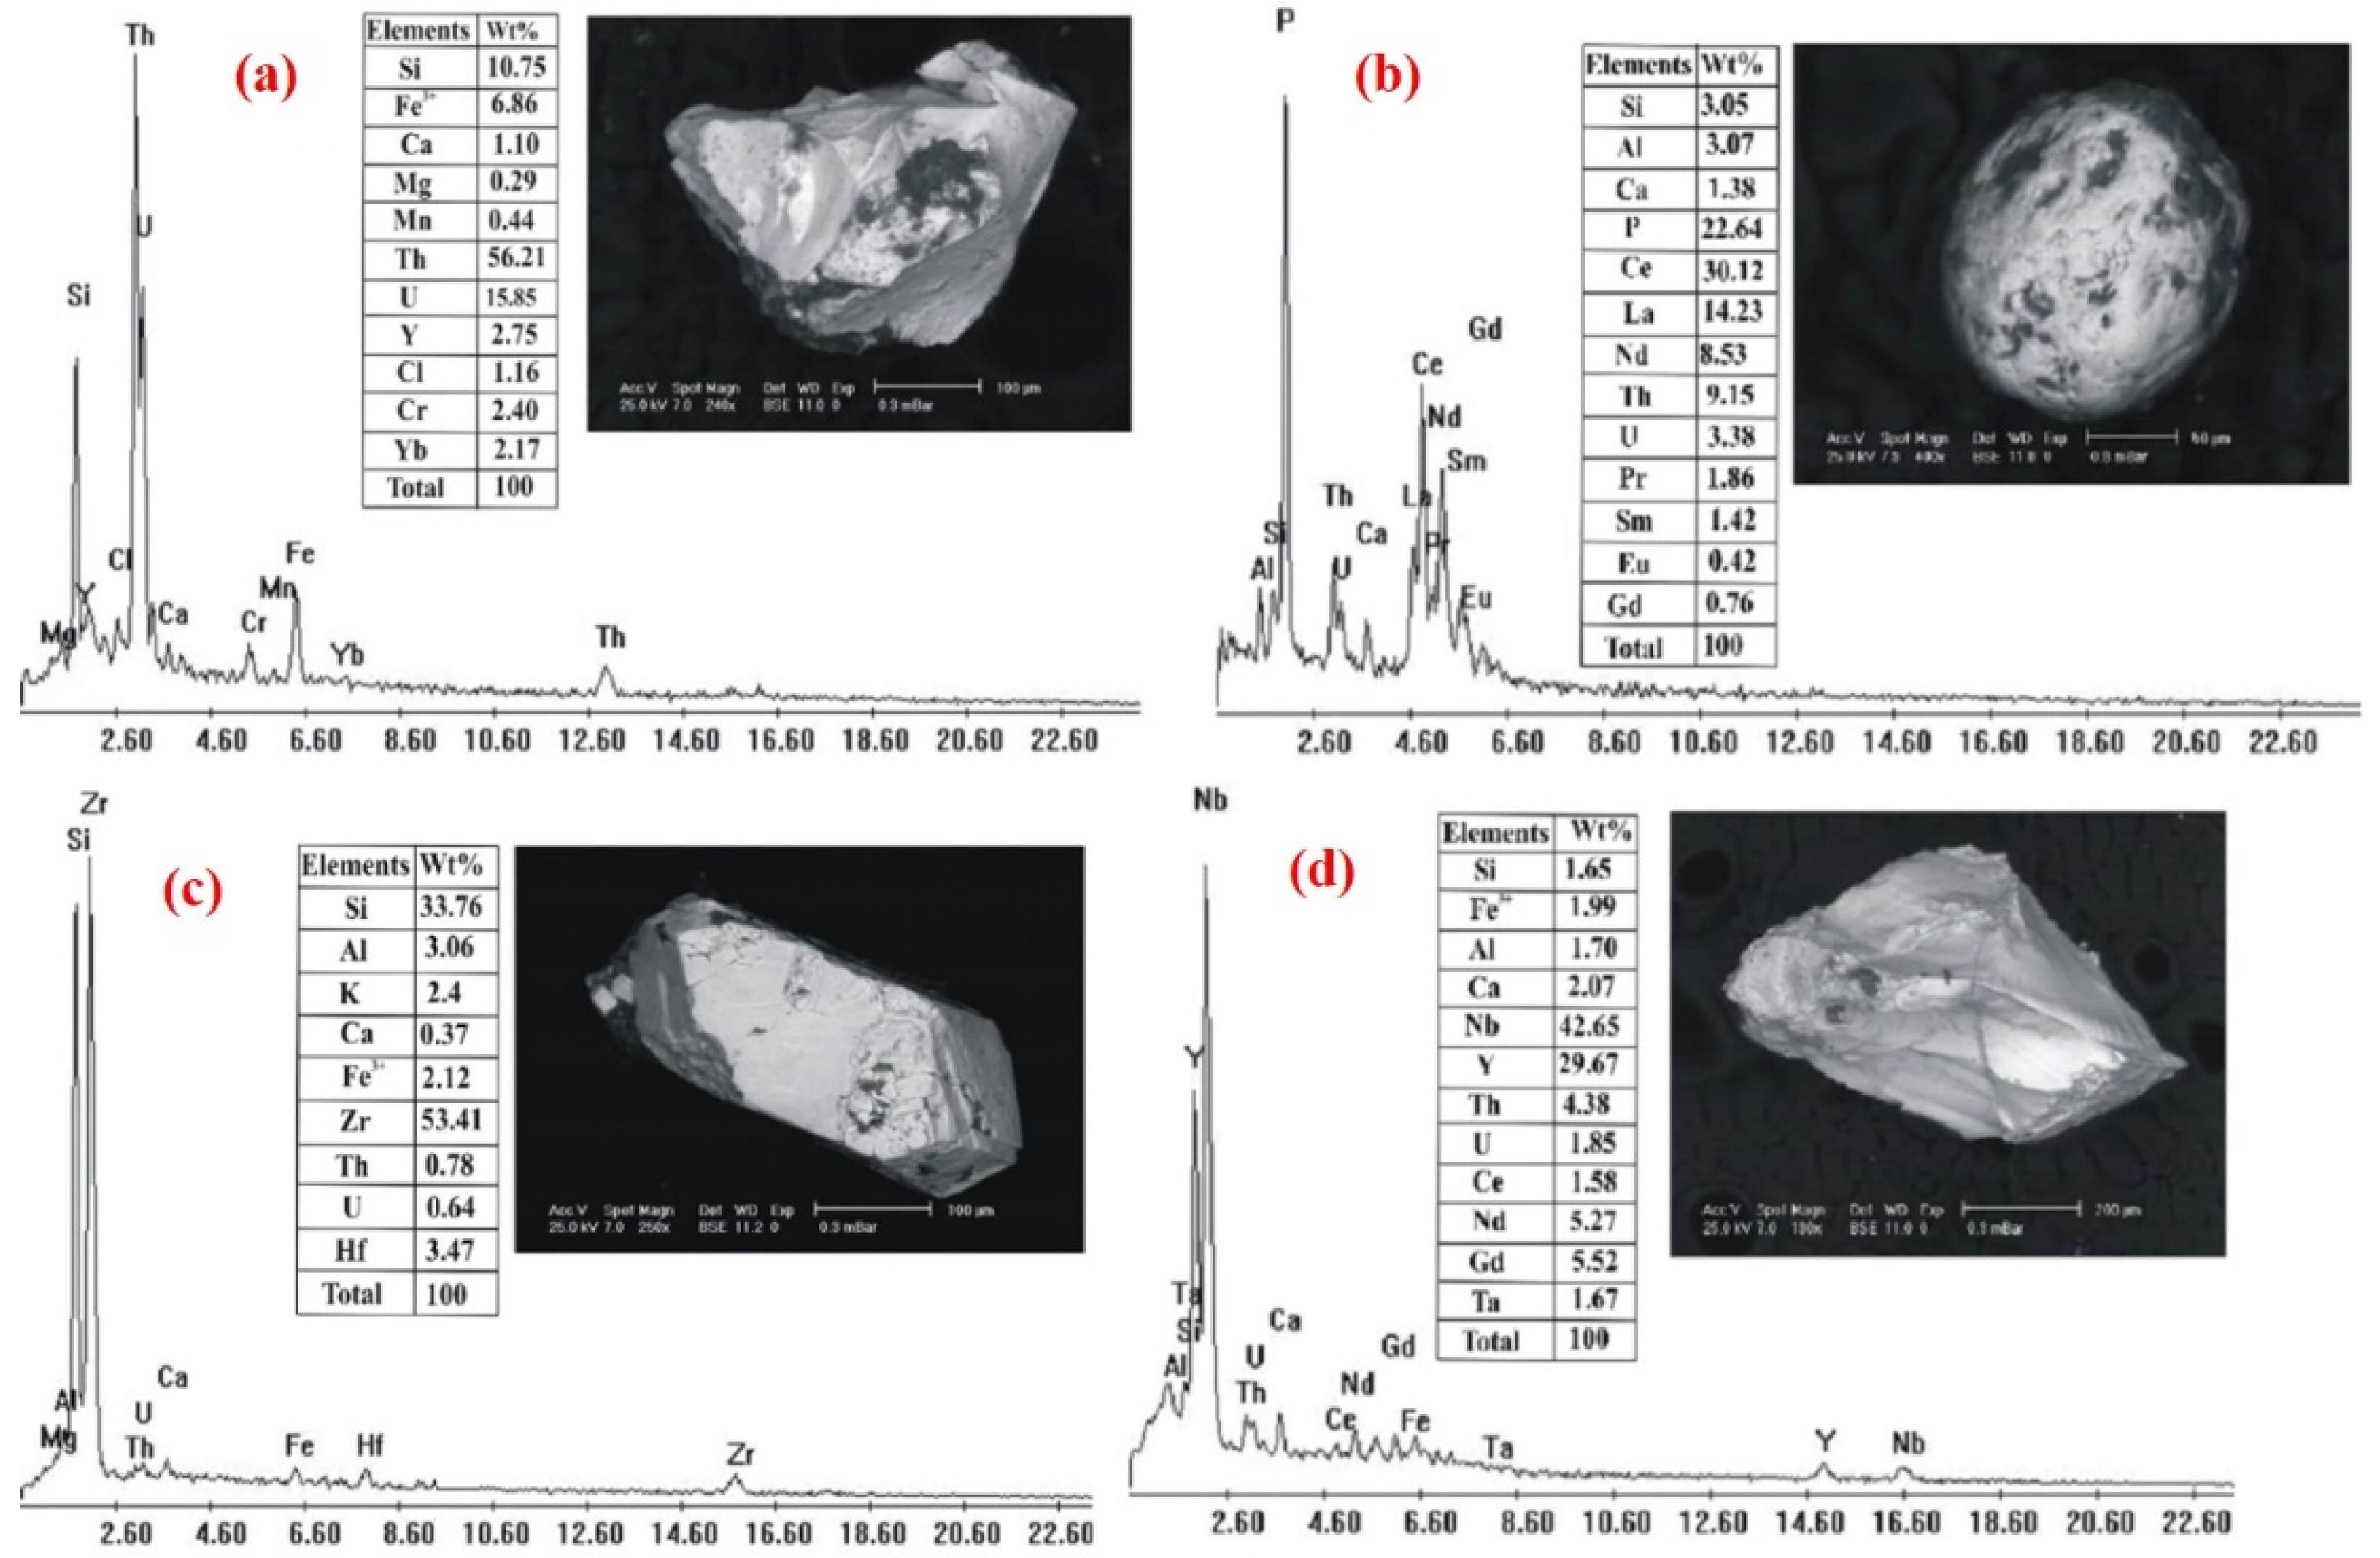
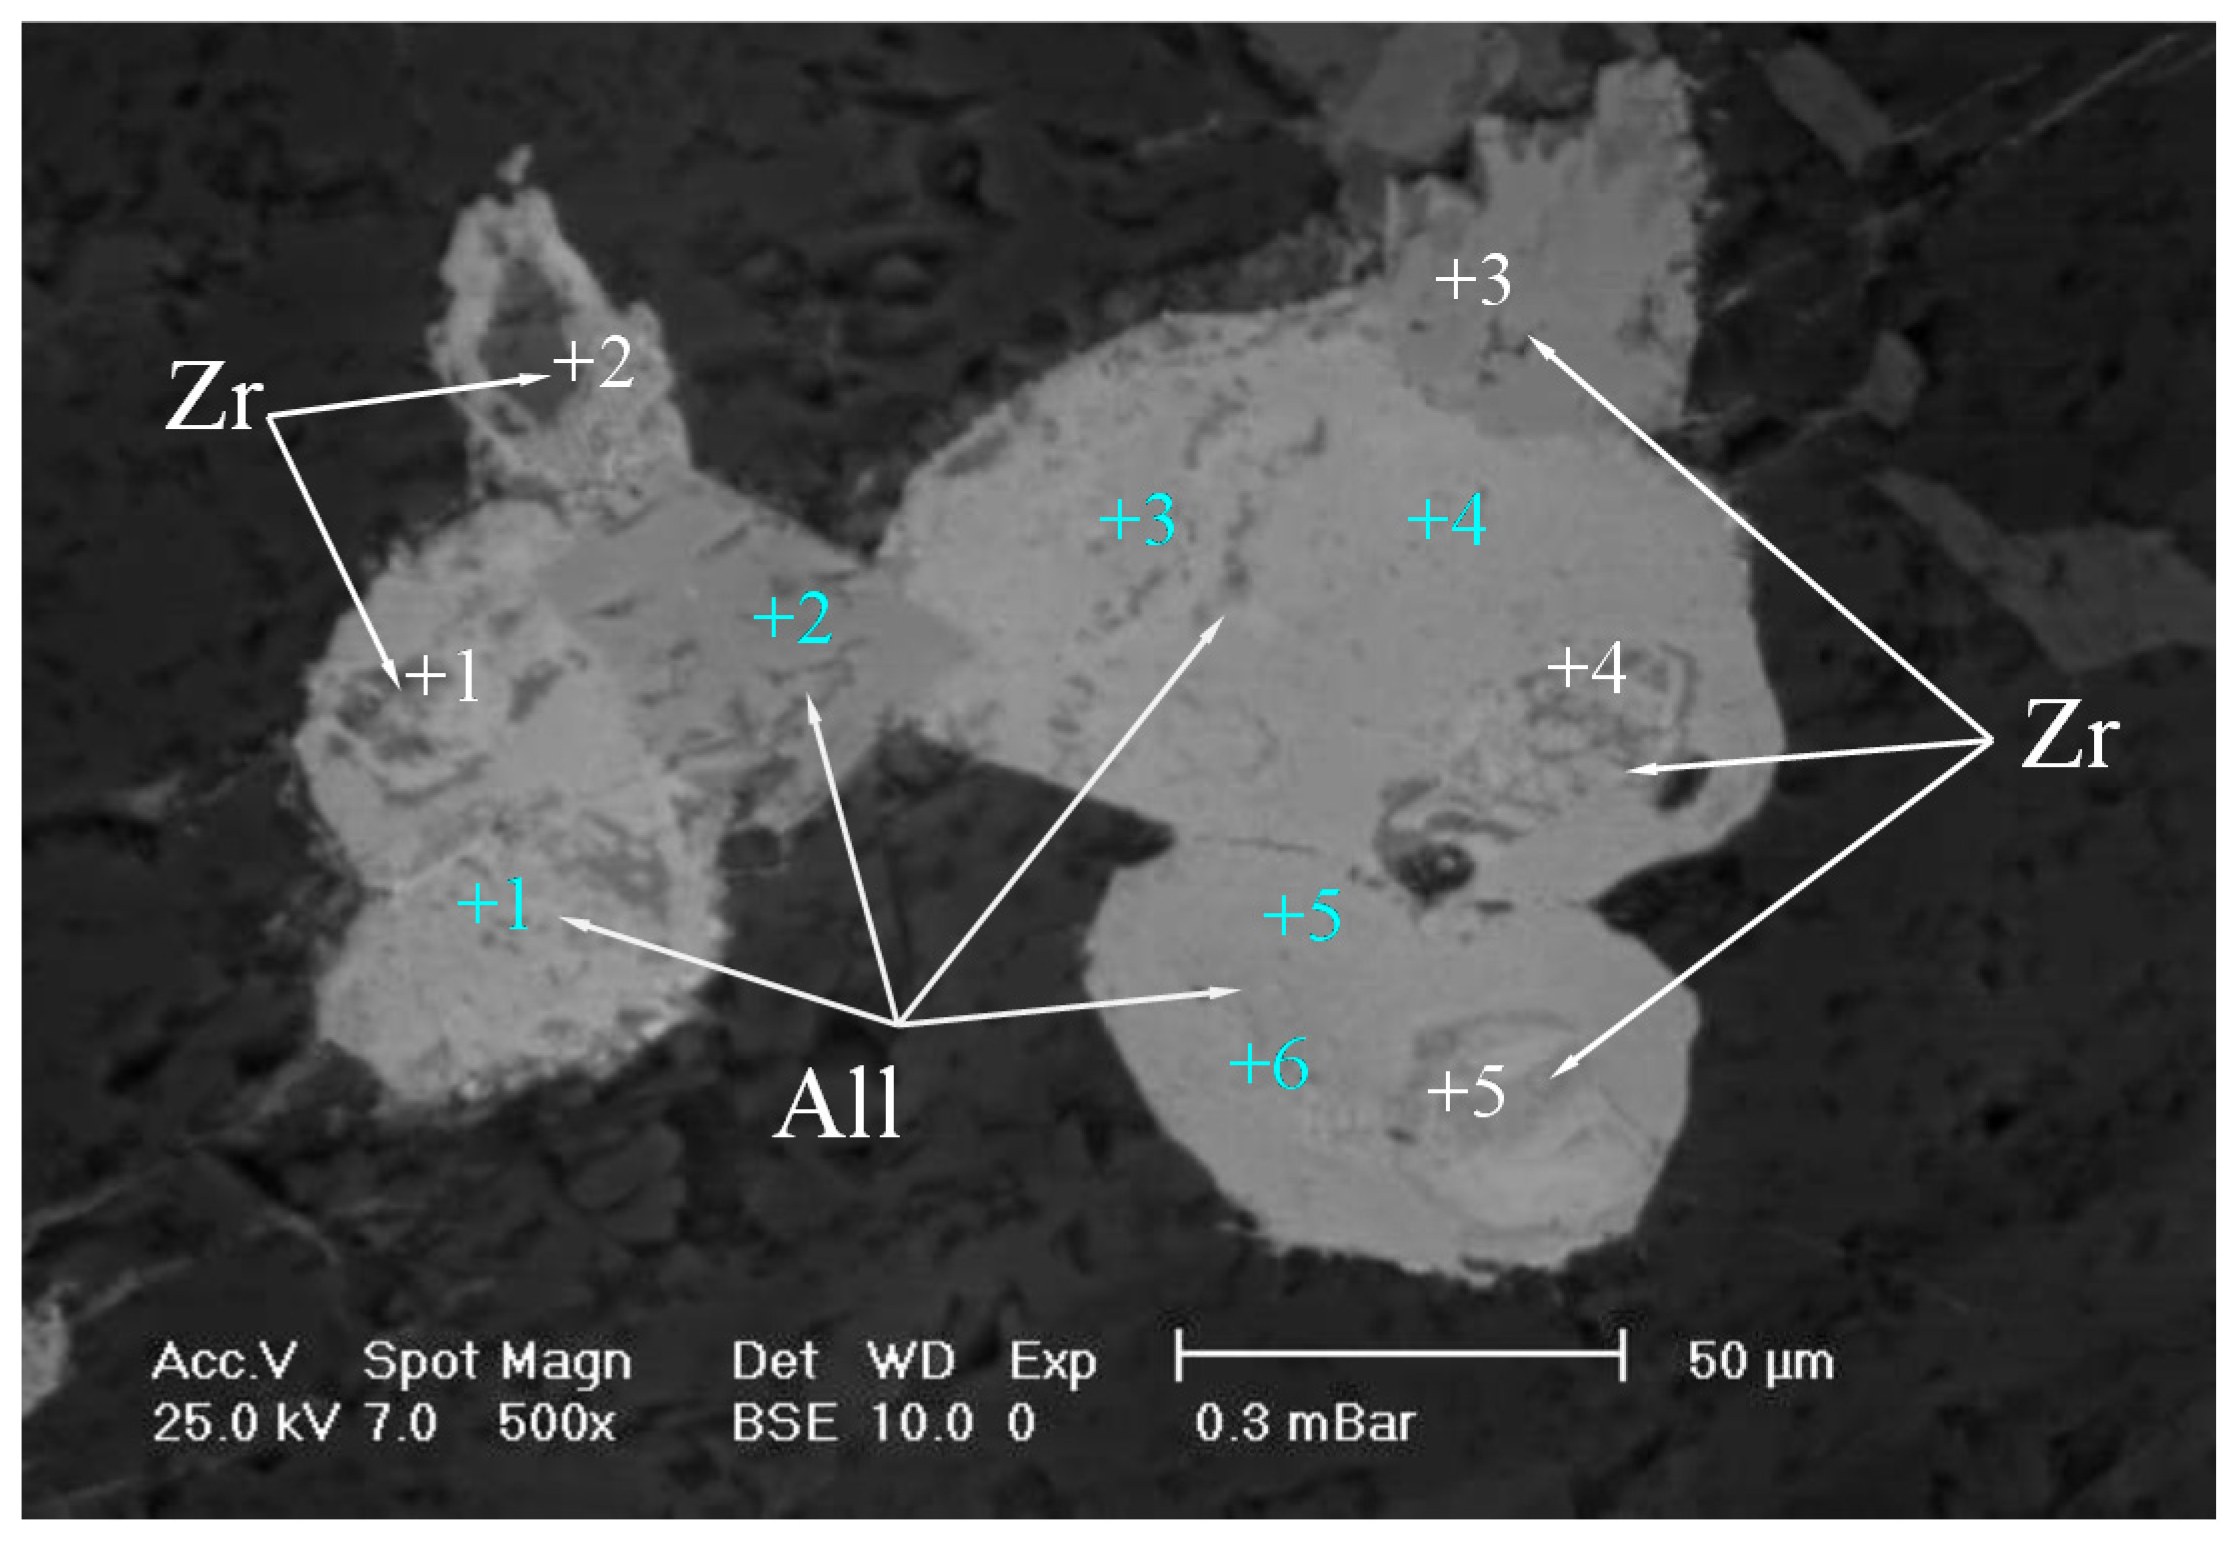
4.1. Mineralogical Features
4.2. Radionuclide Activity Concentrations
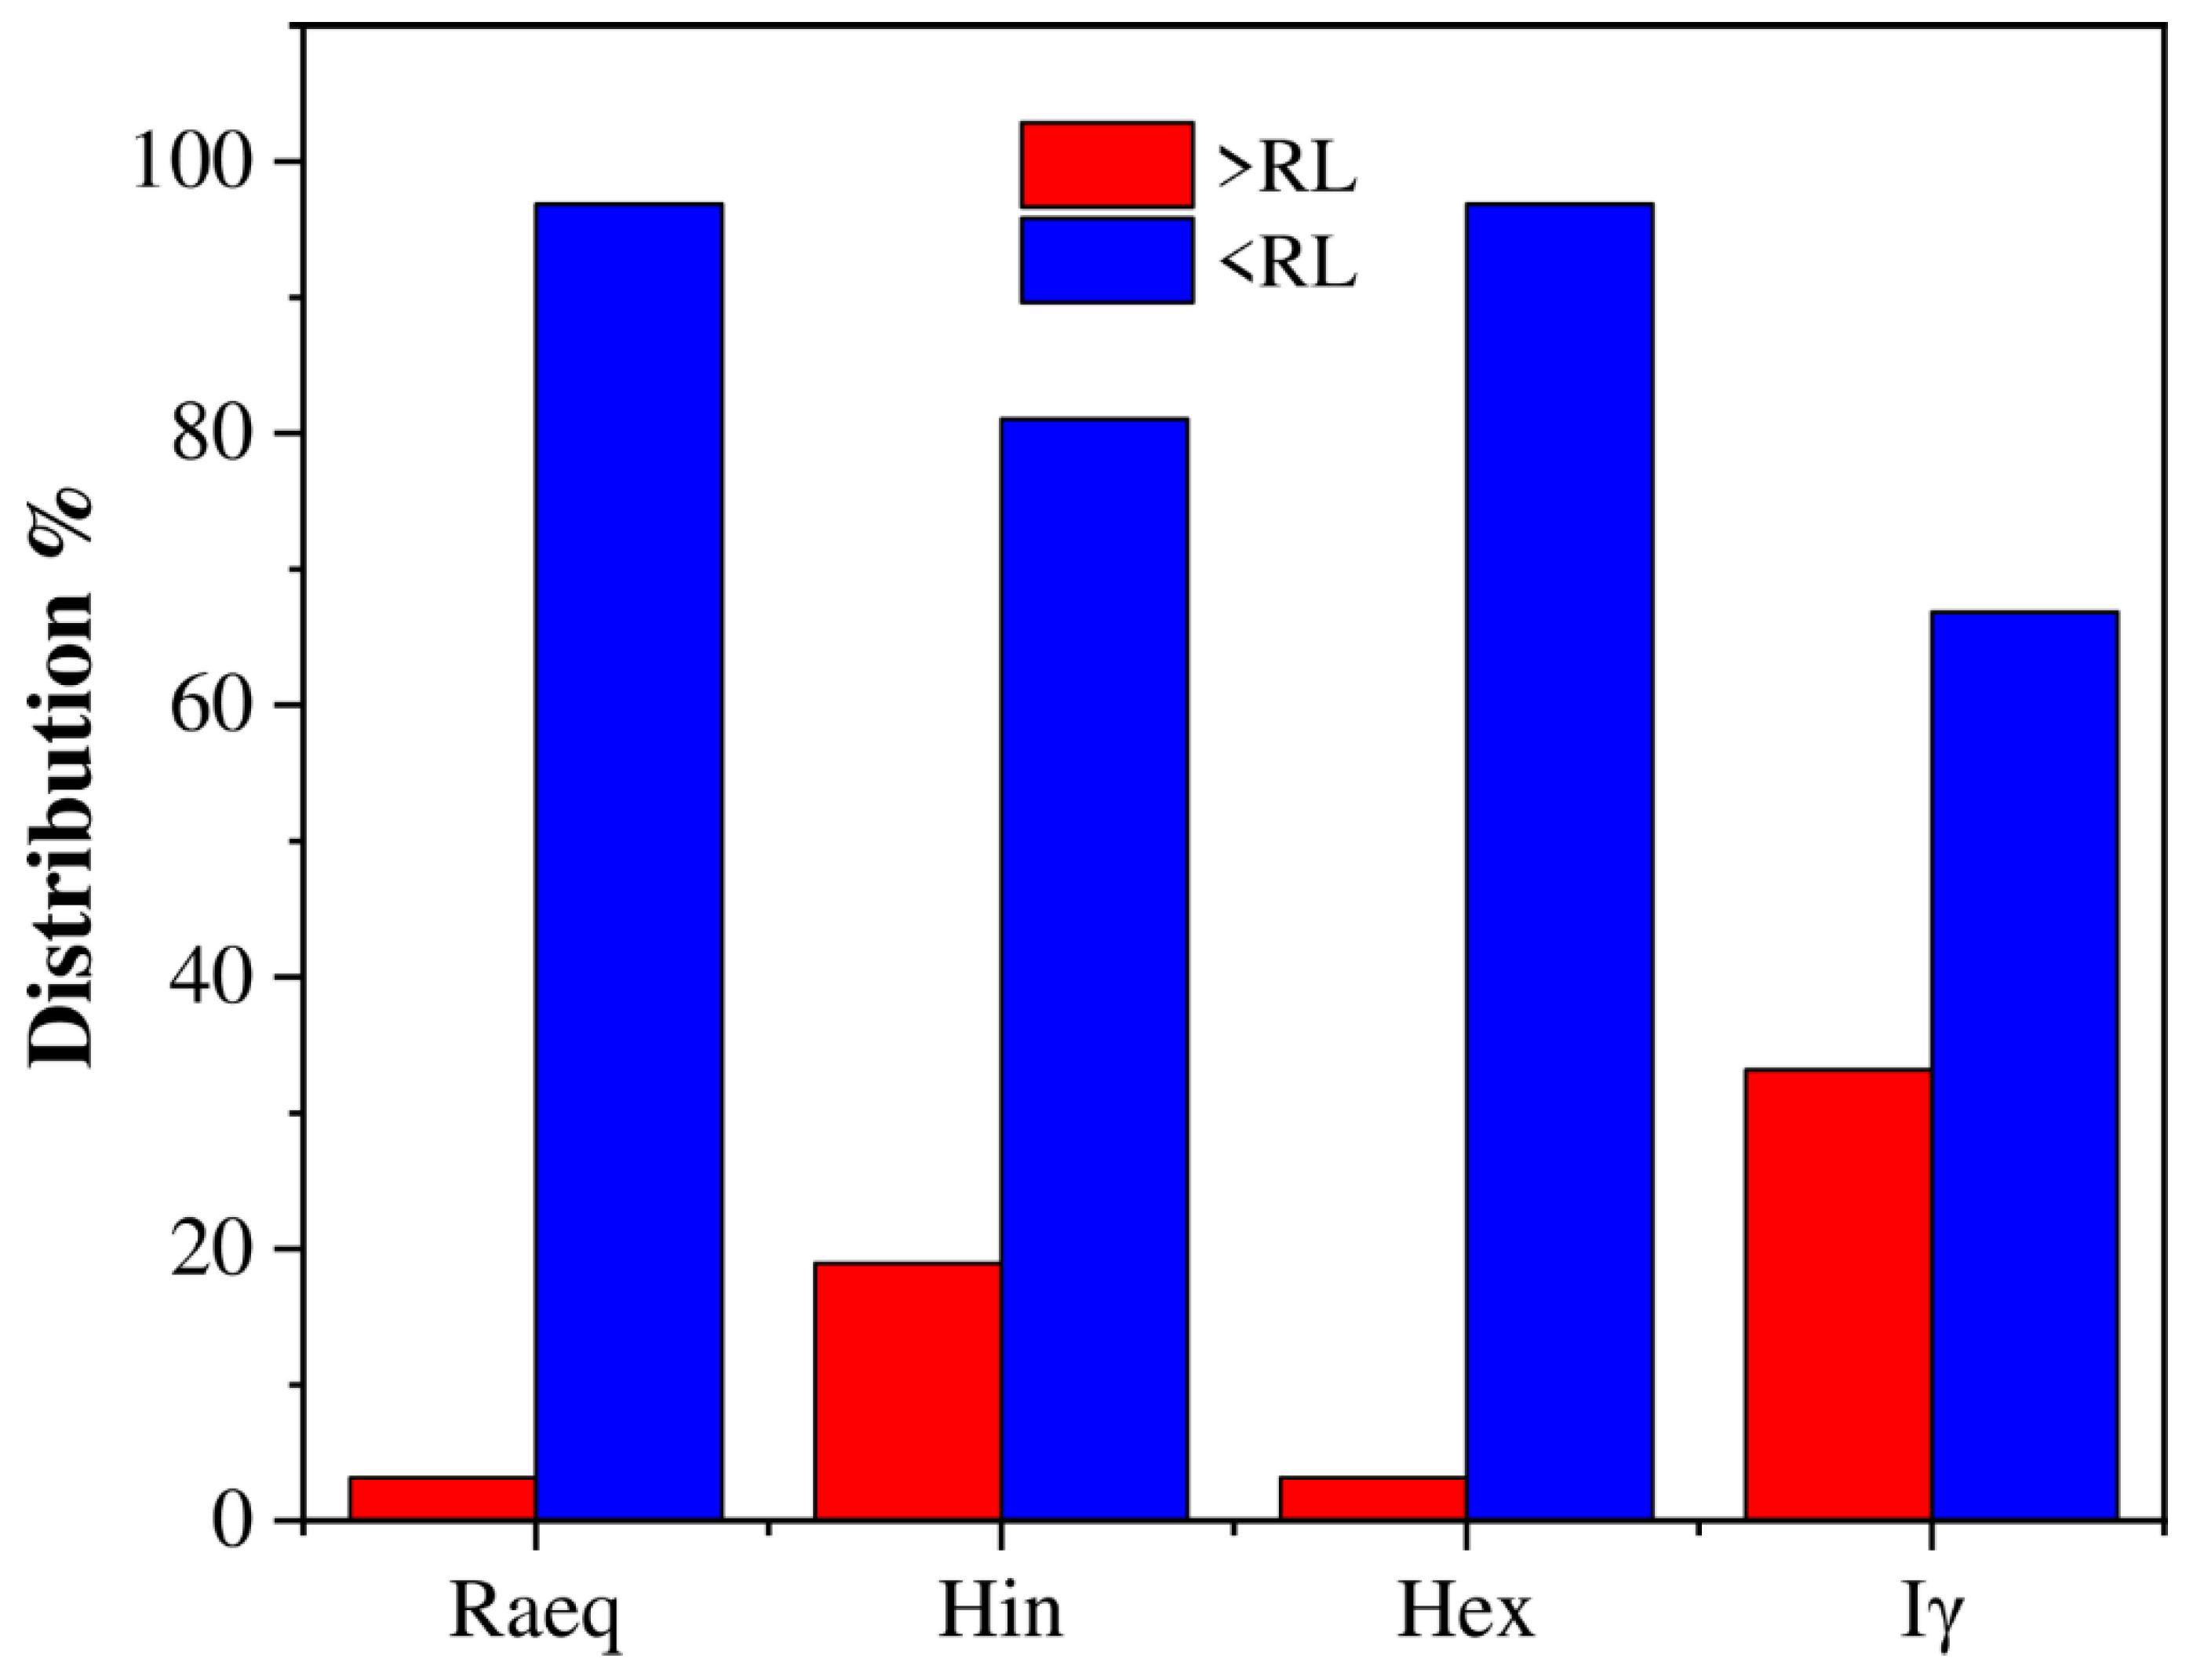
4.3. Radiological Hazards Parameters
4.3.1. Radium Equivalent Activity (Raeq)
4.3.2. External and Internal Hazard Indices (Hin and Hex)
4.3.3. Representative Gamma Level Index (Iγ)
4.3.4. Absorbed Dose Rate (Dair) and Annual Effective Dose (AED)
4.3.5. Annual Gonadal Dose Equivalent (AGDE)
4.3.6. Excess Lifetime Cancer Risk (ELCR)
5. Multivariate Statistical Analysis
5.1. Pearson’s Correlation Analysis
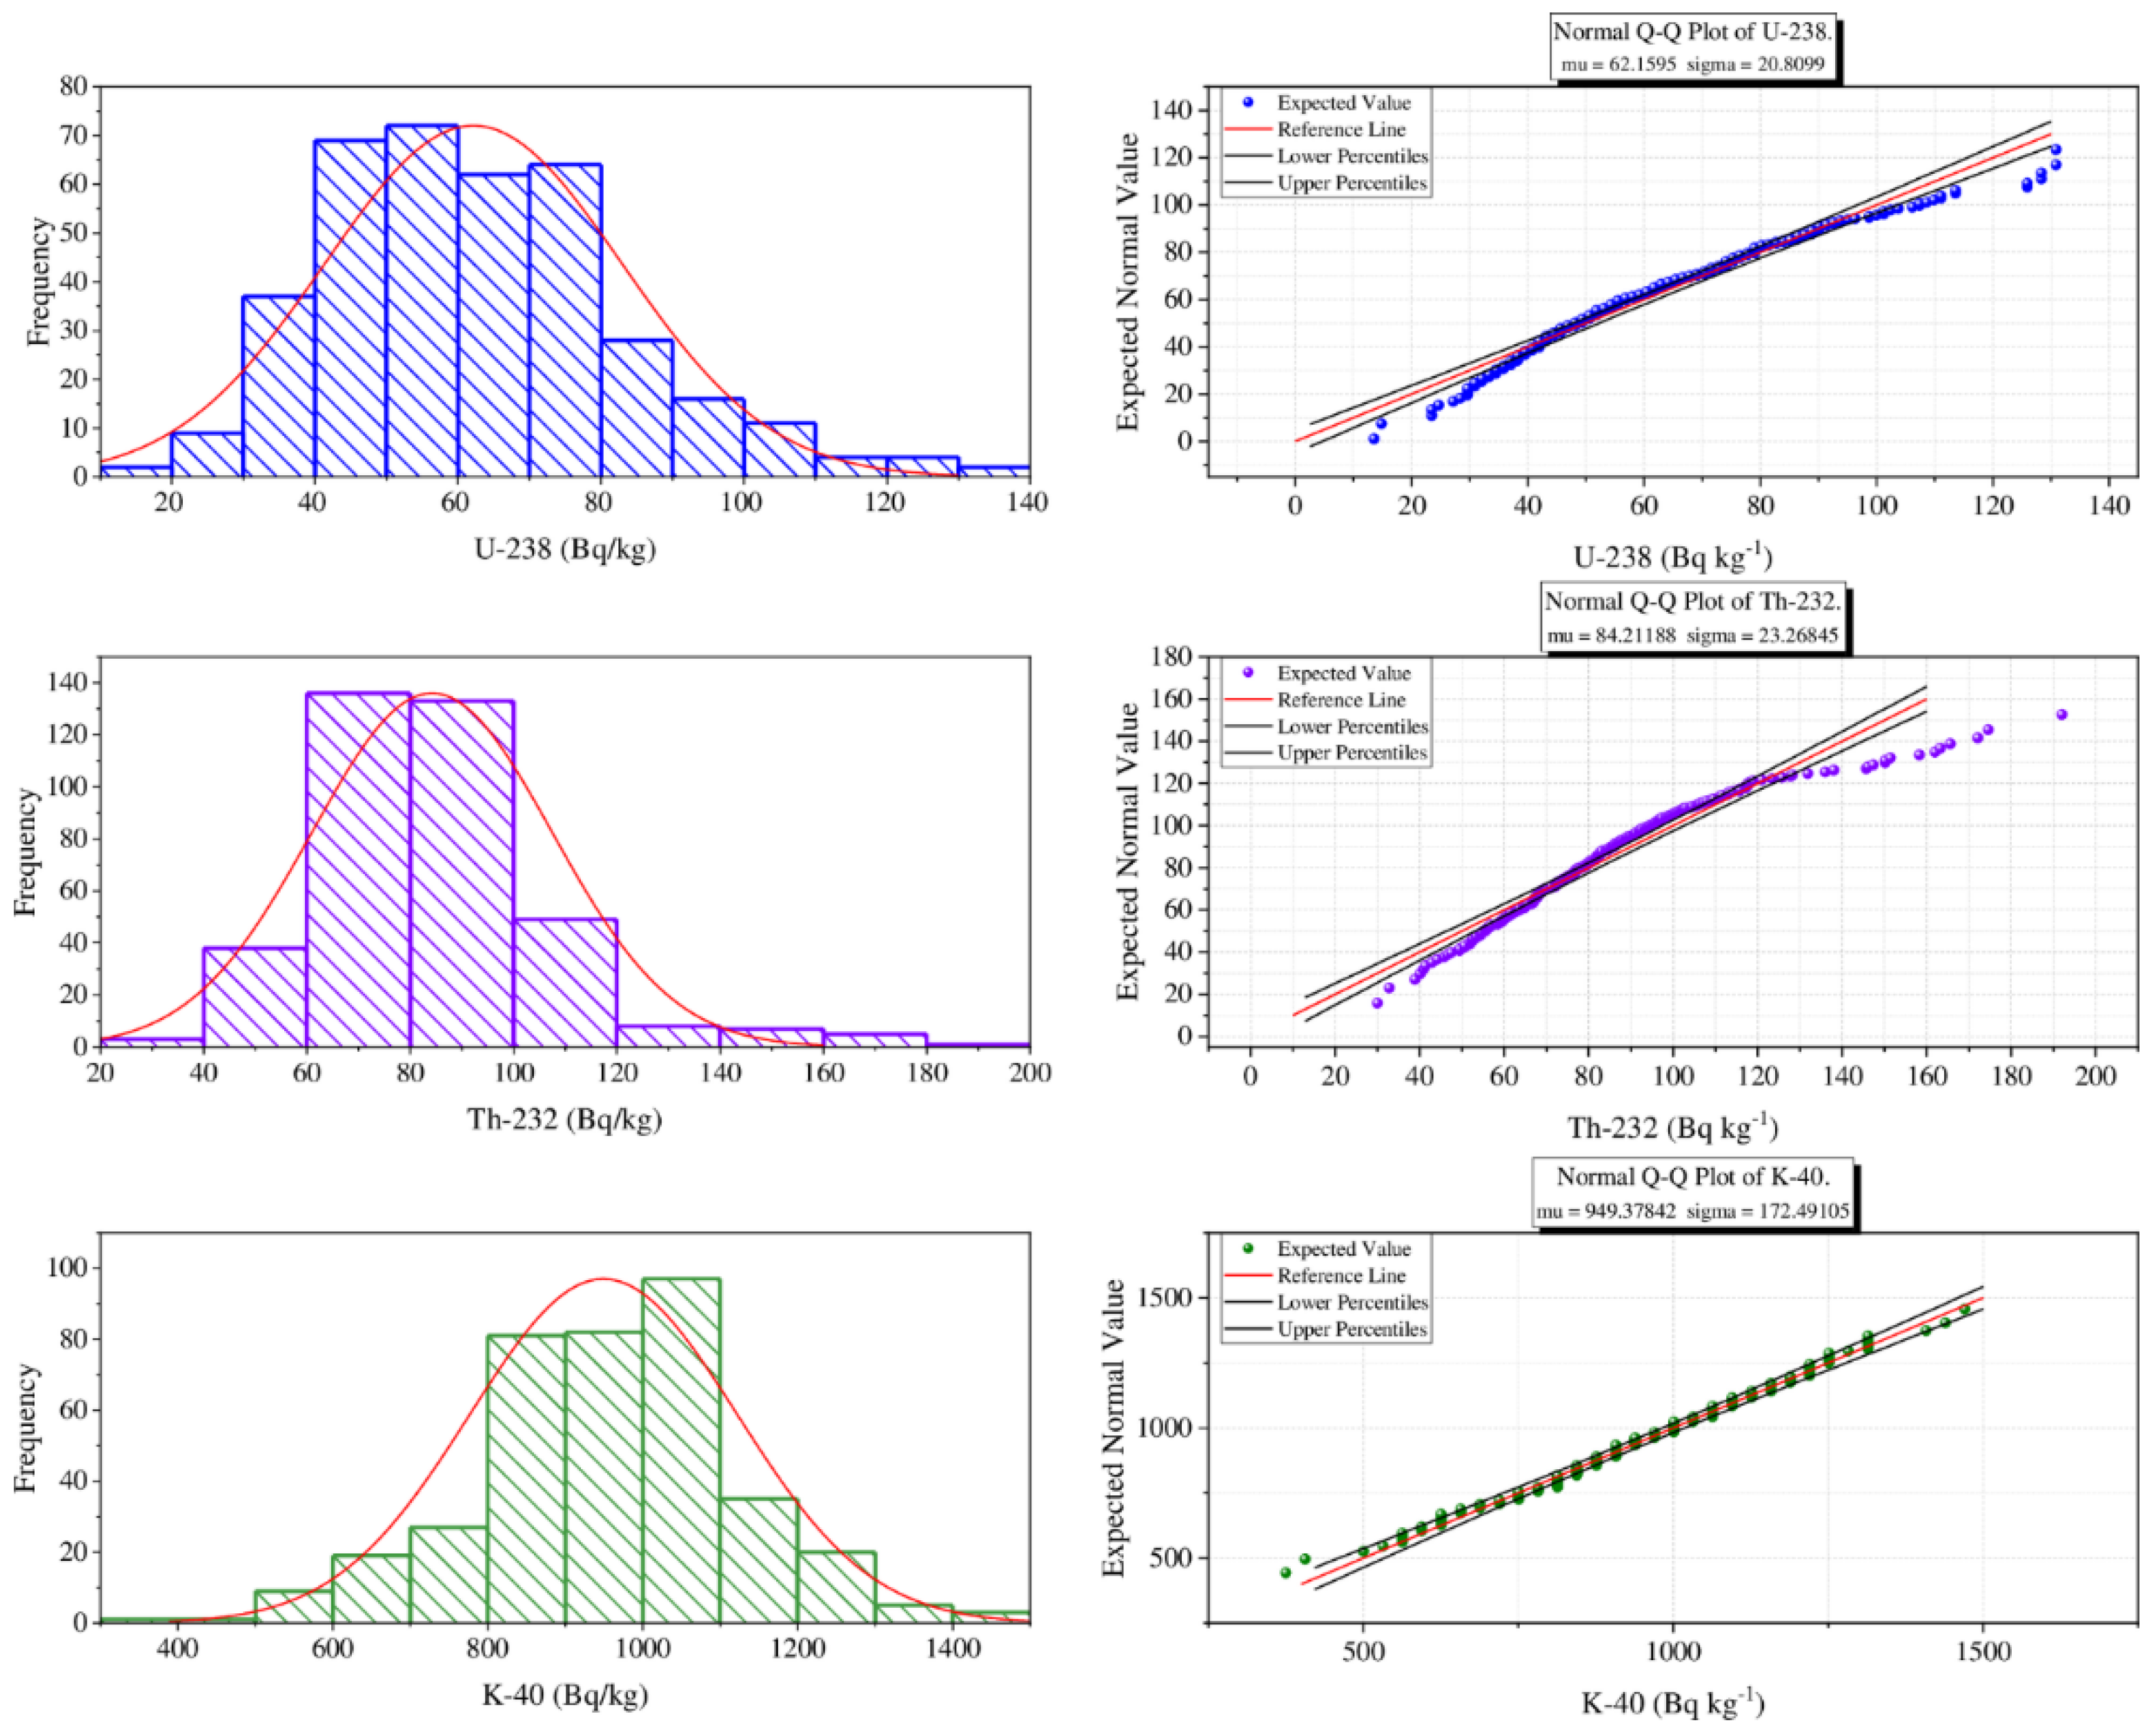
5.2. Frequency Distribution and Q-Q Plot
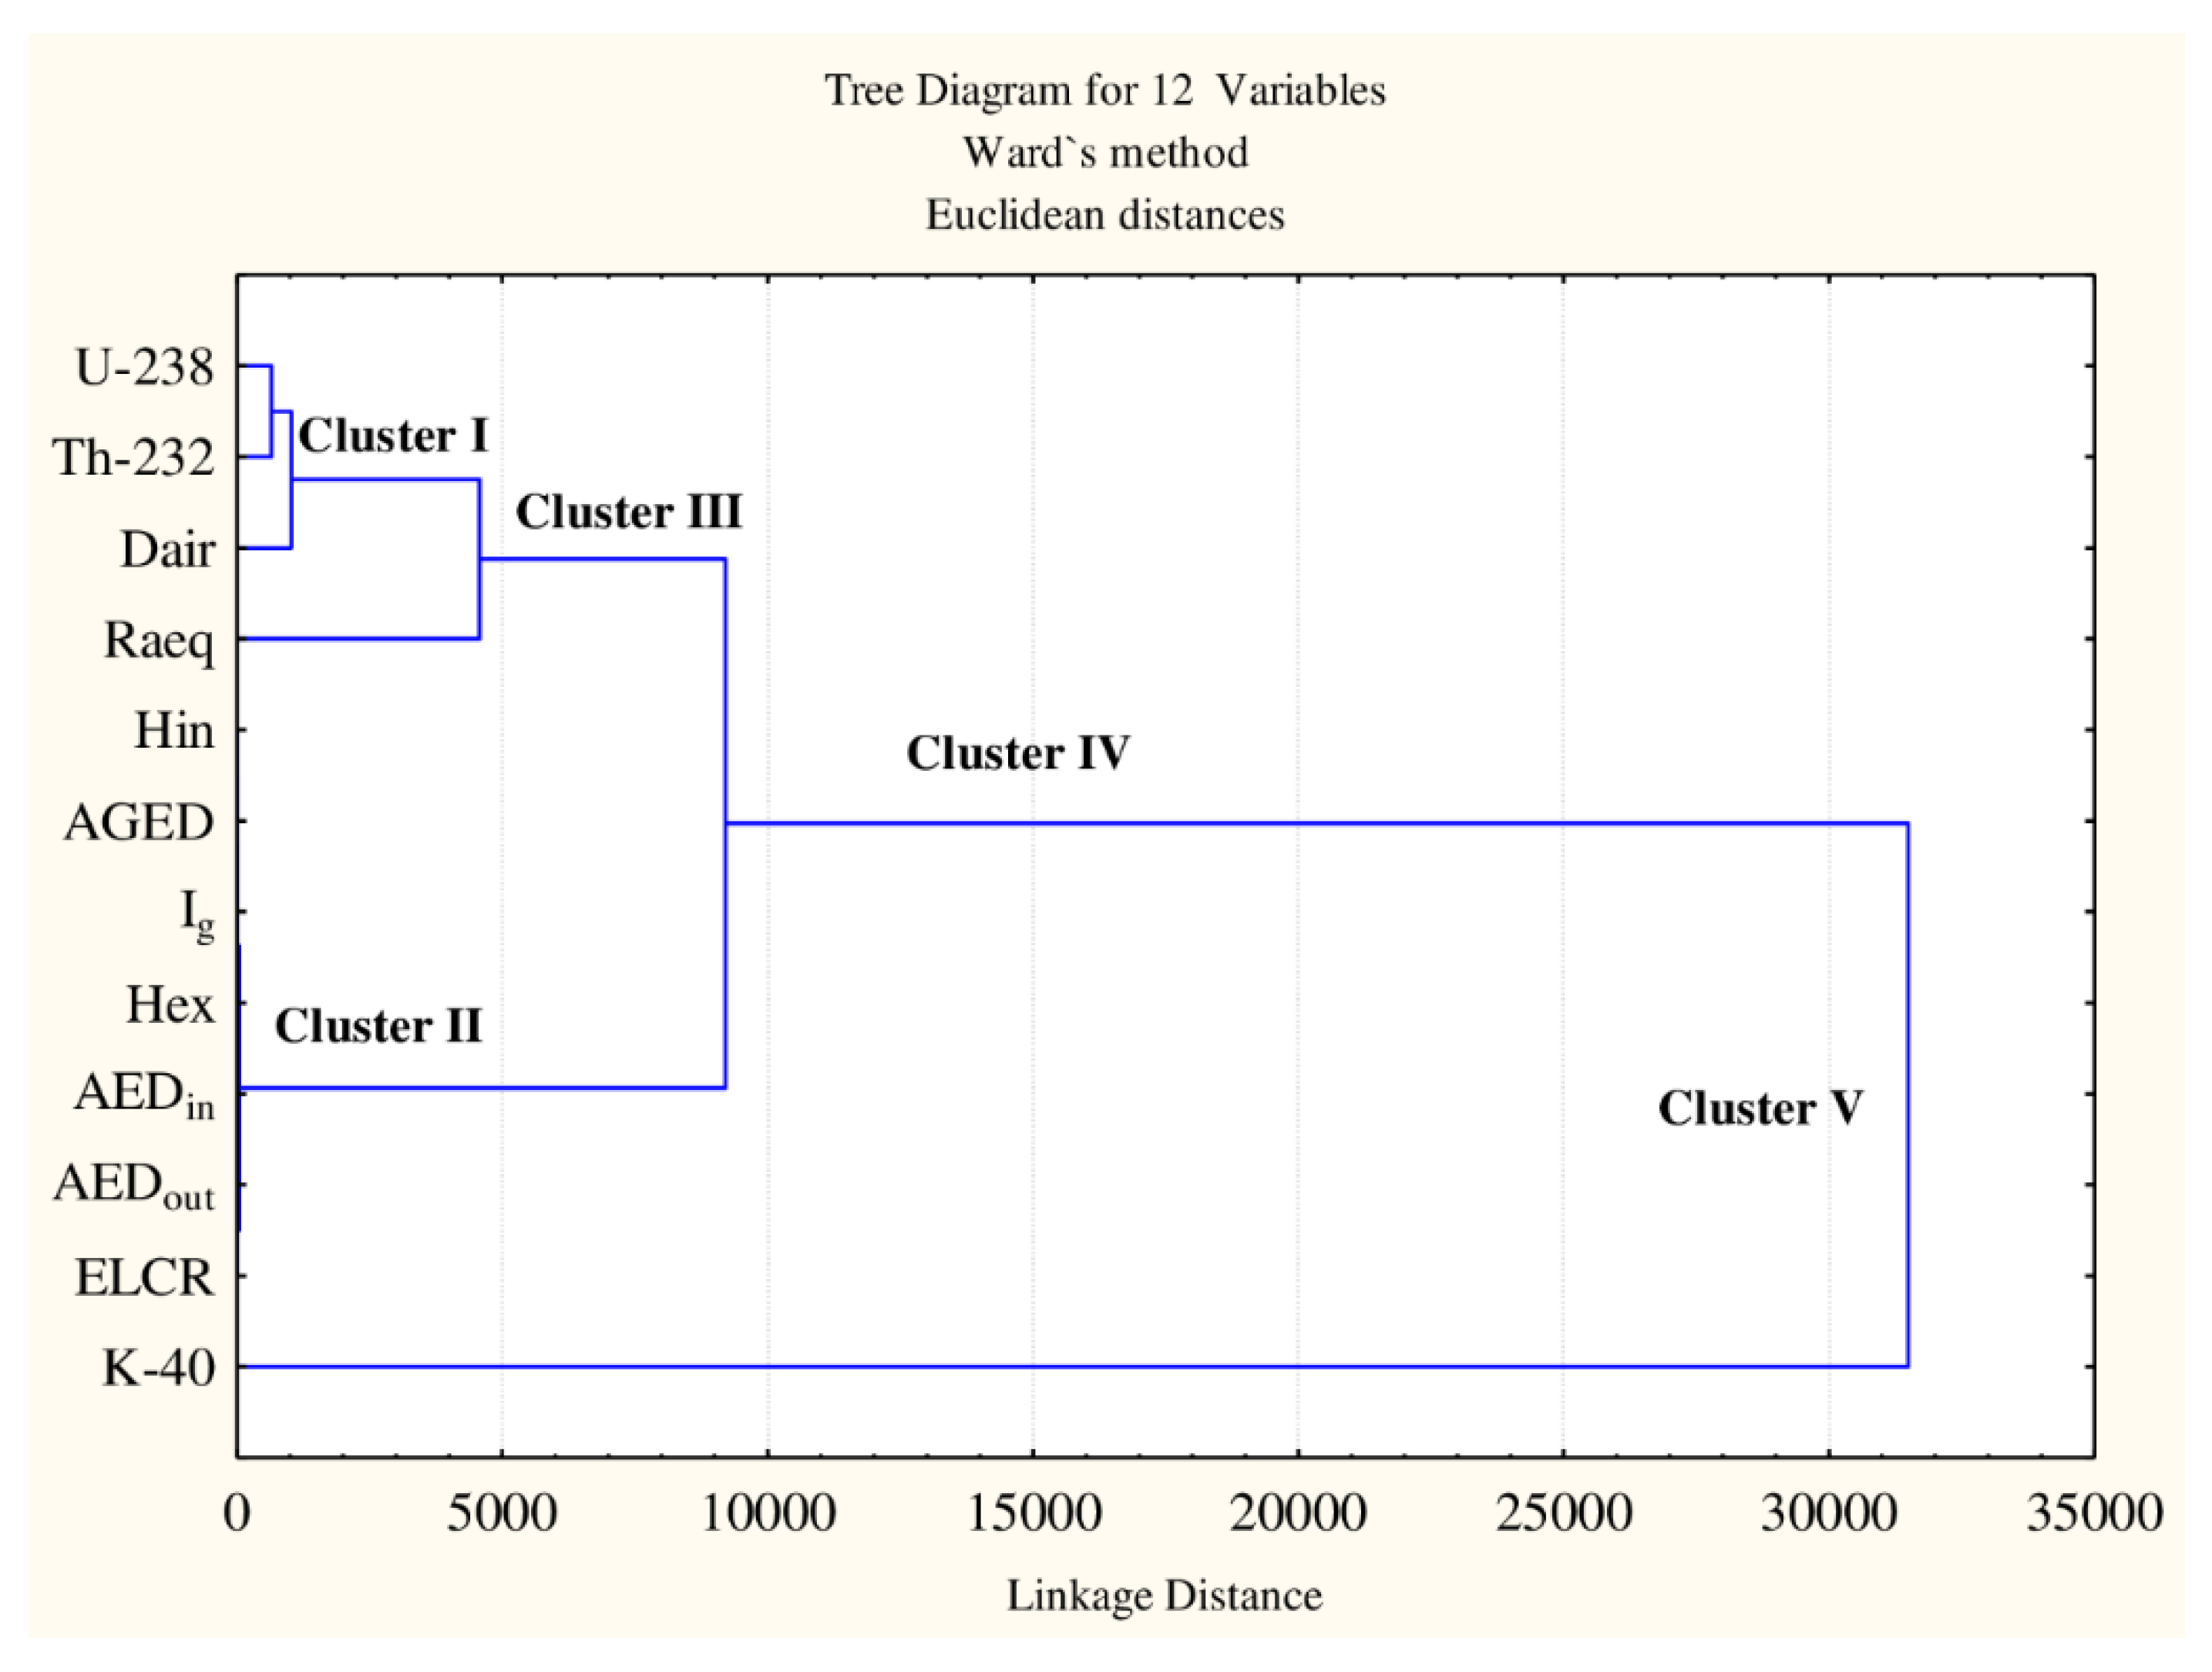
5.3. Hierarchical Cluster Analysis
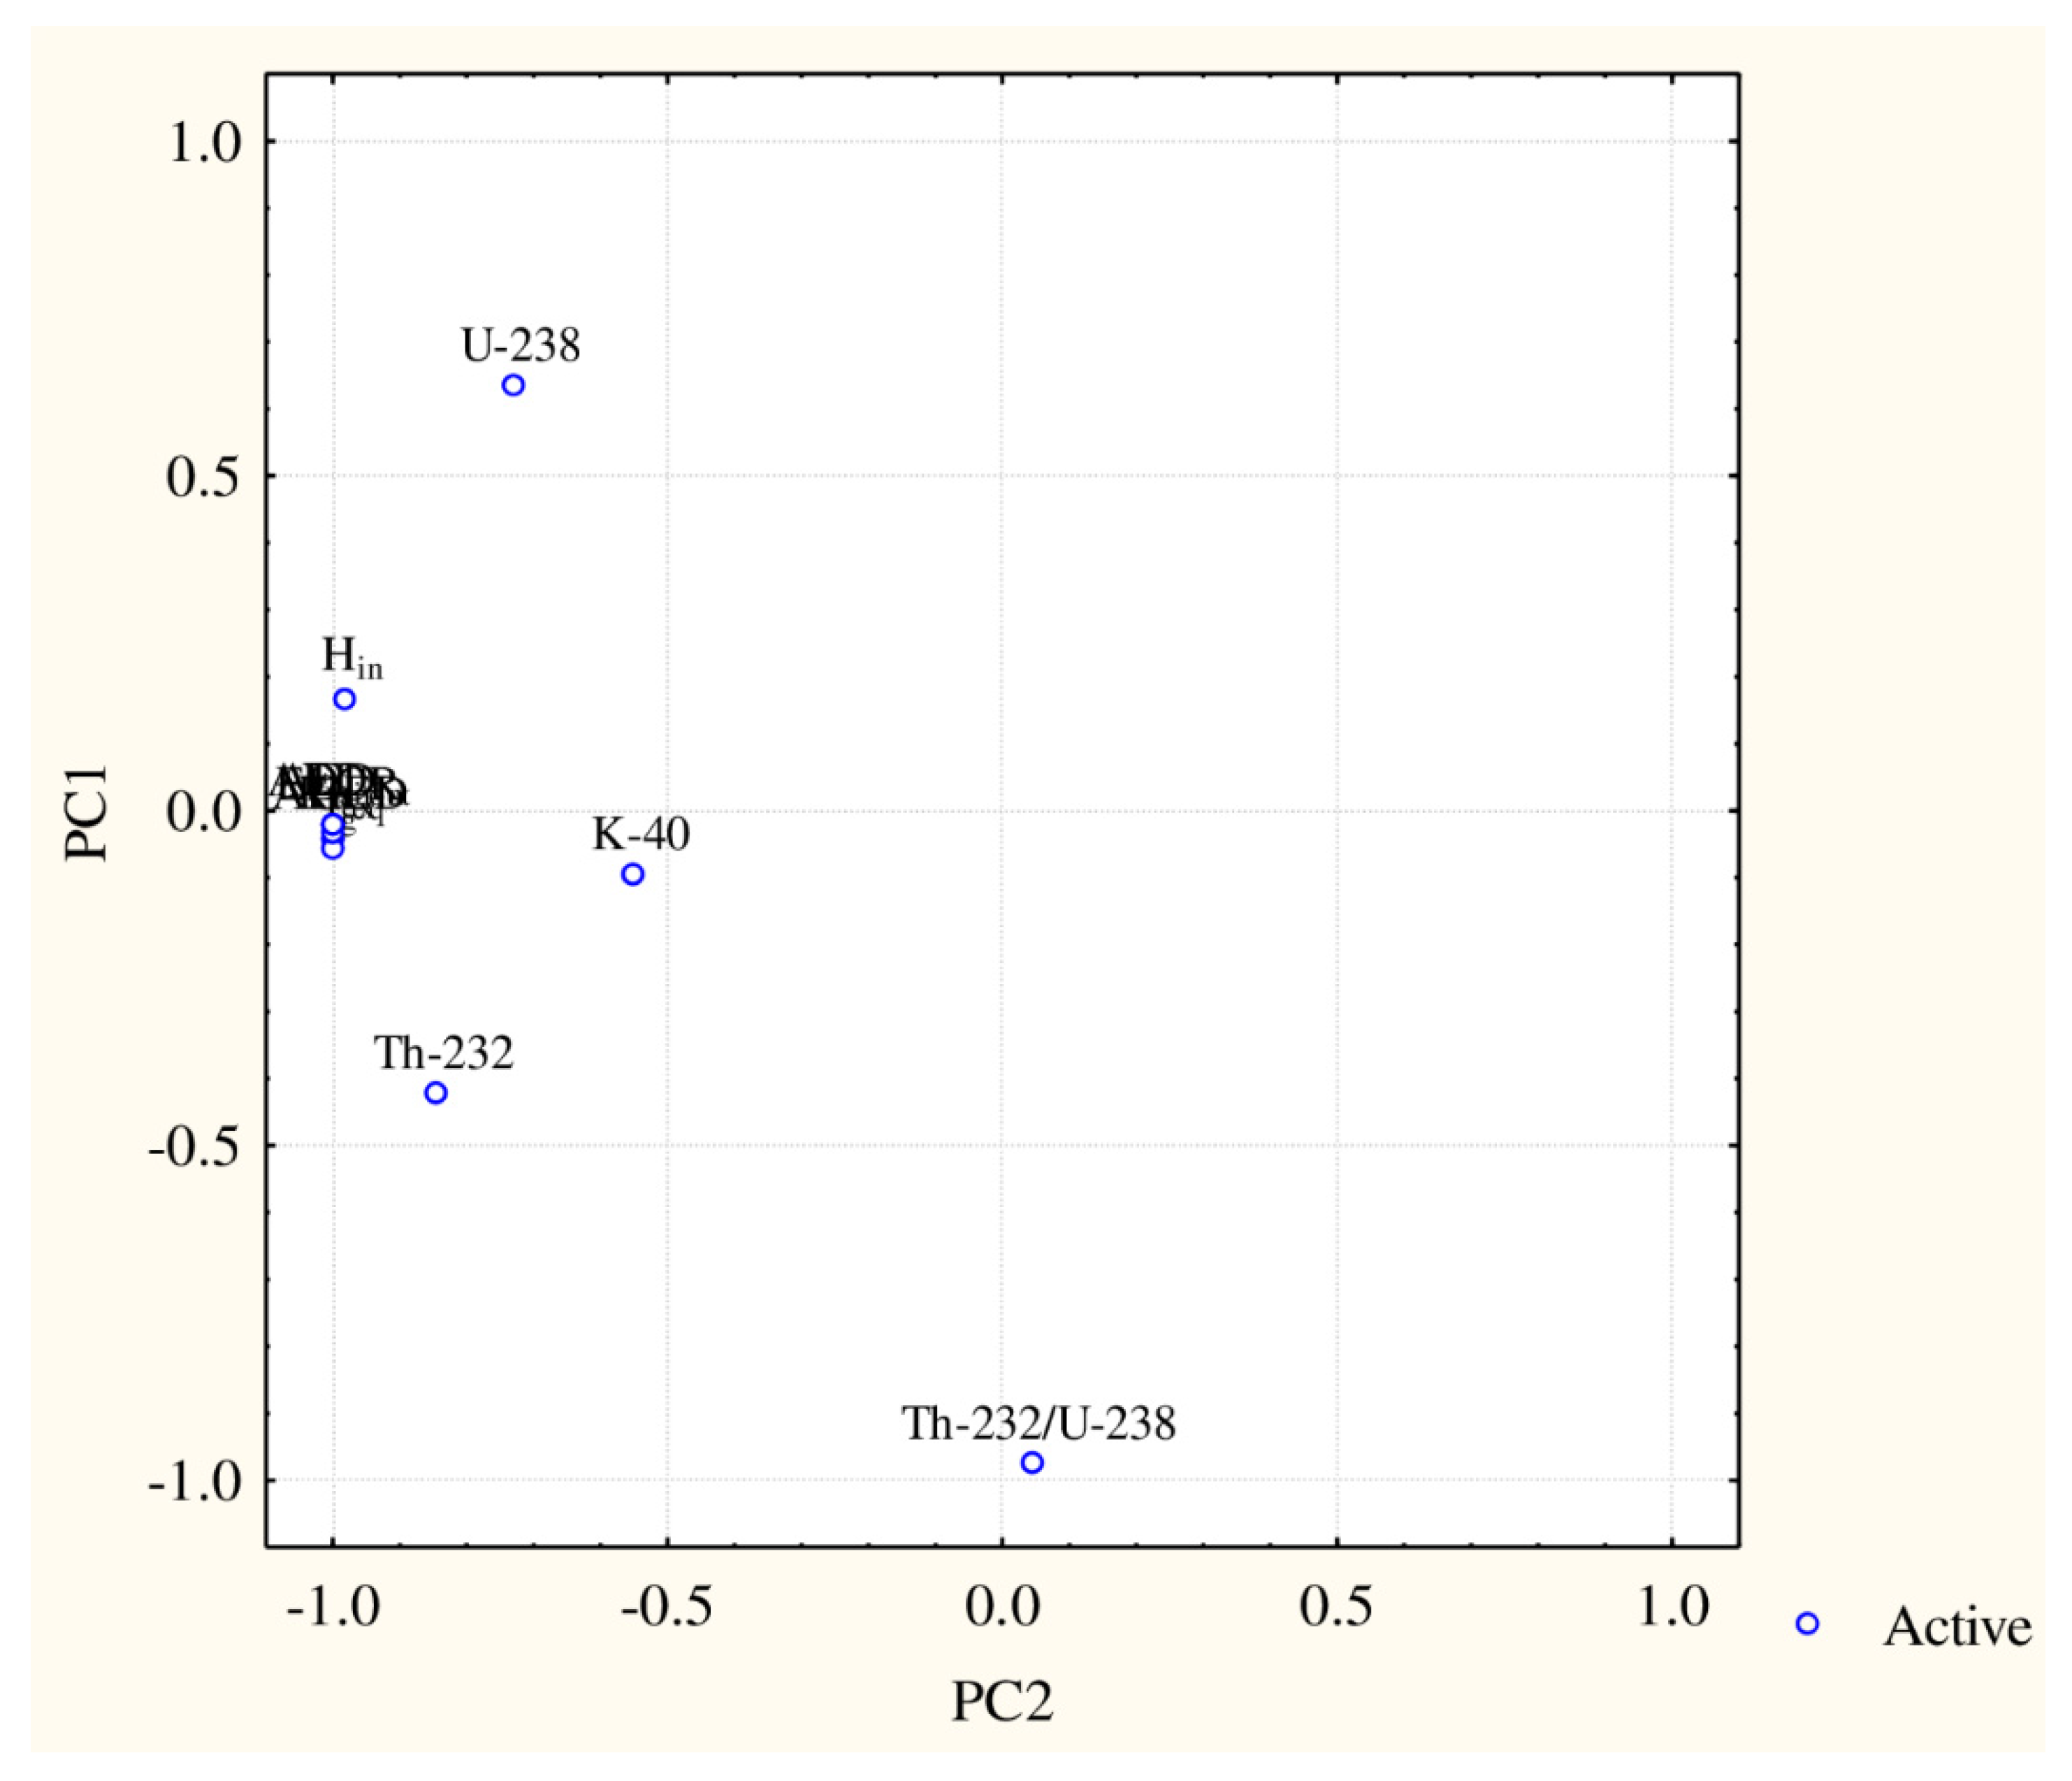
5.4. Principal Component Analysis (PCA)
6. Conclusions
Supplementary Materials
Author Contributions
Funding
Institutional Review Board Statement
Informed Consent Statement
Data Availability Statement
Acknowledgments
Conflicts of Interest
References
- UNSCEAR. Sources and Effects of Ionizing Radiation—Exposures of the Public and Workers from Various Sources of Radiation—UNSCEAR 2008 Report; United Nations Publication: New York, NY, USA, 2010. [Google Scholar]
- Ravisankar, R.; Chandramohan, J.; Chandrasekaran, A.; Jebakumar, J.P.P.; Vijayalakshmi, I.; Vijayagopal, P.; Venkatraman, B. Assessments of radioactivity concentration of natural radionuclides and radiological hazard indices in sediment samples from the East coast of Tamilnadu, India with statistical approach. Mar. Pollut. Bull. 2015, 97, 419–430. [Google Scholar] [CrossRef]
- Hanfi, M.Y.; Yarmoshenko, I.; Seleznev, A.A.; Onishchenko, A.D.; Zhukovsky, M.V. Development of an appropriate method for measuring gross alpha activity concentration in low-mass size-fractionated samples of sediment using solid-state nuclear track detectors. Radioanal. Nucl. Chem. 2020, 323, 1047–1053. [Google Scholar] [CrossRef]
- Svoukis, E.; Tsertos, H. Indoor and outdoor in situ high-resolution gamma radiation measurements in urban areas of Cyprus. Radiat. Prot. Dosim. 2007, 123, 384–390. [Google Scholar] [CrossRef] [PubMed] [Green Version]
- Hanfi, M.Y.; Emad, B.M.; Sayyed, M.I.; Khandaker, M.U.; Bradley, D.A. Natural radioactivity in the prospecting tunnel in Egypt: Dose rate and risk assessment. Radiat. Phys. Chem. 2021, 187, 109555. [Google Scholar] [CrossRef]
- Agbalagba, E.; Osakwe, R.; Olarinoye, I. Comparative assessment of natural radionuclide content of cement brands used within Nigeria and some countries in the world. J. Geochem. Explor. 2014, 142, 21–28. [Google Scholar] [CrossRef]
- Tzortzis, M.; Tsertos, H.; Christofides, S.; Christodoulides, G. Gamma-ray measurements of naturally occurring radioactive samples from Cyprus characteristic geological rocks. Radiat. Meas. 2003, 37, 221–229. [Google Scholar] [CrossRef] [Green Version]
- UNSCEAR. Exposures from natural radiation sources (Annex B). In Sources and Effects of Ionizing Radiation; UNSCEAR: New York, NY, USA, 2000; pp. 84–141. [Google Scholar]
- Paschoa, A.; Steinhäusler, F. Terrestrial, Atmospheric, and Aquatic Natural Radioactivity. Radioact. Environ. 2010, 17, 29–85. [Google Scholar] [CrossRef]
- Belyaeva, O.; Pyuskyulyan, K.; Movsisyan, N.; Saghatelyan, A.; Carvalho, F.P. Natural radioactivity in urban soils of mining centers in Armenia: Dose rate and risk assessment. Chemosphere 2019, 225, 859–870. [Google Scholar] [CrossRef]
- Abdel Gawad, A.E. Mineral chemistry (U, Th, Zr, REE) in accessory minerals from Wadi Rod Elsayalla granitoids, South Eastern Desert, Egypt. Arab. J. Geosci. 2021, 14, 1996. [Google Scholar] [CrossRef]
- Hanfi, M.Y.M.; Masoud, M.S.; Sayyed, M.I.; Khandaker, M.U.; Faruque, M.R.I.; Bradley, D.A.; Mostafa, M.Y.A. The presence of radioactive heavy minerals in prospecting trenches and concomitant occupational exposure. PLoS ONE 2021, 16, e0249329. [Google Scholar] [CrossRef]
- Saleh, G.M.; Dawoud, M.I.; Shahin, H.A.; Khaleal, F.M.; Bahaa, M. Gabal El Fereyid—Wadi Rahaba Area, South Eastern Desert, Egypt: Mineralization and Spectrometric Prospecting. Int. J. Min. Sci. 2019, 4, 1–15. [Google Scholar] [CrossRef]
- Abdel Gawad, A.E.; Ibrahim, E.M. Activity ratios as a tool for studying uranium mobility at El Sela shear zone, southeastern Desert, Egypt. J. Radioanal. Nucl. Chem. 2016, 308, 129–142. [Google Scholar] [CrossRef]
- Amin, Y.; Khandaker, M.U.; Shyen, A.; Mahat, R.; Nor, R.; Bradley, D. Radionuclide emissions from a coal-fired power plant. Appl. Radiat. Isot. 2013, 80, 109–116. [Google Scholar] [CrossRef] [PubMed]
- Abdel-Razek, Y.A.; Masoud, M.S.; El-Nagdy, M.S.; Hanfi, M. Effective radiation doses from natural sources at Seila area South Eastern Desert, Egypt. J. Taibah Univ. Sci. 2016, 10, 271–280. [Google Scholar] [CrossRef] [Green Version]
- ATSDR. Toxicological Profile for Uranium; U.S. Department of Health and Human Services: Atlanta, GA, USA, 1999; pp. 1–145.
- ATSDR. Draft Toxicological Profile for Radon: Agency for Toxic Substances and Disease Registry; ATSDR: Atlanta, GA, USA, 2012; Volume 9–11, pp. 161–167. [Google Scholar]
- ATSDR. Case studies in Environmental Medicine; U.S. Department of Health and Human Services, ATSDR: Atlanta, GA, USA, 1992; pp. 1–28.
- Hilal, M.; Attallah, M.; Mohamed, G.Y.; Fayez-Hassan, M. Evaluation of radiation hazard potential of TENORM waste from oil and natural gas production. J. Environ. Radioact. 2014, 136, 121–126. [Google Scholar] [CrossRef] [PubMed]
- Eliwa, H.A.; Ali, K.G.; Masoud, S.M.; Murata, M.; Abdel Gawad, A.E. Geochemical Features of Granitoids at Nikeiba Area, Eastern Desert, Egypt. Available online: https://www.researchgate.net/profile/Khaled-Ali-11/publication/335526737_Geochemical_features_of_granitoids_at_Nikeiba_area_Eastern_Desert_Egypt/links/5d6ac4fd45851508860450ac/Geochemical-features-of-granitoids-at-Nikeiba-area-Eastern-Desert-Egypt.pdf (accessed on 1 December 2021).
- Eliwa, H.A.; Ali, K.G.; Masoud, S.M.; Murata, M.; Abdel Gawad, A.E. Structural Evolution of Wadi Road El-Sayalla Area, Eastern Desert, Egypt. News Ural. State Min. Univ. 2018, 4, 7–17. [Google Scholar] [CrossRef]
- El-Shazly, E.M.; Hashad, A.M.; Sayyah, Y.A.; Bassyuni, F.A. Geochronology of Abu Swayel area, South Eastern Desert Egypt. Egypt J Geol. 1973, 17, 1–18. [Google Scholar]
- Ali, B.H. SHRIMP U–Pb zircon geochronology: Evidence for emplacement time of some granitoids north Eastern Desert, Egypt. Arab. J. Geosci. 2014, 8, 5465–5474. [Google Scholar] [CrossRef]
- Eliwa, H.A.; Breitkreuz, C.; Murata, M.; Khalaf, I.M.; Bühler, B.; Itaya, T.; Takahashi, T.; Hirahara, Y.; Miyazaki, T.; Kimura, J.-I.; et al. SIMS zircon U–Pb and mica K–Ar geochronology, and Sr–Nd isotope geochemistry of Neoproterozoic granitoids and their bearing on the evolution of the north Eastern Desert, Egypt. Gondwana Res. 2014, 25, 1570–1598. [Google Scholar] [CrossRef]
- Skublov, S.G.; Abdel Gawad, A.E.; Levashova, E.V.; Ghoneim, M.M. U–Pb geochronology, REE and trace element geochemistry of zircon from El Fereyid monzogranite, south Eastern Desert, Egypt. J. Miner. Pet. Sci. 2021, 116, 220–233. [Google Scholar] [CrossRef]
- Abdel Gawad, A.E.; Skublov, S.G.; Levashova, E.V.; Ghoneim, M.M. Geochemistry and U–Pb Age Dating of Zircon as a Petrogenetic Tool for Magmatic and Hydrothermal Processes in Wadi Ras Abda Syenogranite, Eastern Desert, Egypt. Arab. J. Sci. Eng. 2021, 119, 1–15. [Google Scholar] [CrossRef]
- Moghazi, A.; Hassanen, M.A.; Mohamed, F.H.; Ali, S. Late Neoproterozoic strongly peraluminous leucogranites, South Eastern Desert, Egypt petrogenesis and geodynamic significance. Miner. Pet. 2004, 81, 19–41. [Google Scholar] [CrossRef]
- Grasty, R.L.; Holman, P.B.; Blanchard, Y.B. Transportable Calibration Pads for Ground and Airborne Gamma-Ray Spectrometers; Geological Survey of Canada: Ottawa, ON, Canada, 1991; Volume 75, pp. 9–23. [Google Scholar]
- Ali, M.A.; Abdel Gawad, A.E.; Ghoneim, M.M. Geology and Mineral Chemistry of Uranium- and Thorium-bearing Minerals in Rare-Metal (NYF) Pegmatites of Um Solimate, South Eastern Desert, Egypt. Acta Geol. Sin. 2021, 95, 1568–1582. [Google Scholar] [CrossRef]
- Abdel Gawad, A.E.; Ghoneim, M.M.; El-Taher, A.; Ramadan, A.A. Mineral chemistry aspects of U-, Th-, REE-, Cu-bearing minerals at El-Regeita shear zone, South Central Sinai, Egypt. Arab. J. Geosci. 2021, 14, 1–13. [Google Scholar] [CrossRef]
- Heckman, J.J.; Pinto, R.; Savelyev, P.A. Natural Elemental Concentrations and Fluxes: Their Use as Indicators of Repository Safety. Ski Rep. 2002, 97, 29. [Google Scholar]
- Amin, R.M. Gamma radiation measurements of naturally occurring radioactive samples from commercial Egyptian granites. Environ. Earth Sci. 2012, 67, 771–775. [Google Scholar] [CrossRef]
- Akpanowo, M.; Umaru, I.; Iyakwari, S.; Joshua, E.O.; Yusuf, S.; Ekong, G.B. Determination of natural radioactivity levels and radiological hazards in environmental samples from artisanal mining sites of Anka, North-West Nigeria. Sci. Afr. 2020, 10, e00561. [Google Scholar] [CrossRef]
- AlZahrani, J.H.; Alharbi, W.R.; Abbady, A.G.E. Radiological impacts of natural radioactivity and heat generation by radioactive decay of phosphorite deposits from Northwestern Saudi Arabia. Aust. J. Basic Appl. 2011, 5, 683–690. [Google Scholar]
- Al-Trabulsy, H.; Khater, A.; Habbani, F. Radioactivity levels and radiological hazard indices at the Saudi coastline of the Gulf of Aqaba. Radiat. Phys. Chem. 2011, 80, 343–348. [Google Scholar] [CrossRef]
- Thabayneh, K.M. Measurement of Natural Radioactivity and Radon Exhalation Rate in Granite Samples Used in Palestinian Buildings. Arab. J. Sci. Eng. 2012, 38, 201–207. [Google Scholar] [CrossRef]
- Sharaf, J.; Hamideen, M. Measurement of natural radioactivity in Jordanian building materials and their contribution to the public indoor gamma dose rate. Appl. Radiat. Isot. 2013, 80, 61–66. [Google Scholar] [CrossRef] [PubMed]
- Zare, M.R.; Mostajaboddavati, M.; Kamali, M.; Abdi, M.R.; Mortazavi, M.S. 235U, 238U, 232Th, 40K and 137Cs activity concentrations in marine sediments along the northern coast of Oman Sea using high-resolution gamma-ray spectrometry. Mar. Pollut. Bull. 2012, 64, 1956–1961. [Google Scholar] [CrossRef]
- Abbasi, A. Calculation of gamma radiation dose rate and radon concentration due to granites used as building materials in Iran. Radiat. Prot. Dosim. 2013, 155, 335–342. [Google Scholar] [CrossRef] [PubMed]
- Almayahi, B.; Tajuddin, A.; Jaafar, M. Effect of the natural radioactivity concentrations and 226Ra/238U disequilibrium on cancer diseases in Penang, Malaysia. Radiat. Phys. Chem. 2012, 81, 1547–1558. [Google Scholar] [CrossRef]
- Senthilkumar, G.; Raghu, Y.; Sivakumar, S.; Chandrasekaran, A.; Anand, D.P.; Ravisankar, R. Natural radioactivity measurement and evaluation of radiological hazards in some commercial flooring materials used in Thiruvannamalai, Tamilnadu, India. J. Radiat. Res. Appl. Sci. 2014, 7, 116–122. [Google Scholar] [CrossRef]
- Yang, Y.-X.; Wu, X.-M.; Jiang, Z.-Y.; Wang, W.-X.; Lu, J.-G.; Lin, J.; Wang, L.-M.; Hsia, Y.-F. Radioactivity concentrations in soils of the Xiazhuang granite area, China. Appl. Radiat. Isot. 2005, 63, 255–259. [Google Scholar] [CrossRef]
- Guillén, J.; Tejado, J.; Baeza, A.; Corbacho, J.; Muñoz, J. Assessment of radiological hazard of commercial granites from Extremadura (Spain). J. Environ. Radioact. 2014, 132, 81–88. [Google Scholar] [CrossRef]
- Papadopoulos, A.; Christofides, G.; Koroneos, A.; Papadopoulou, L.; Papastefanou, C.; Stoulos, S. Natural radioactivity and radiation index of the major plutonic bodies in Greece. J. Environ. Radioact. 2013, 124, 227–238. [Google Scholar] [CrossRef]
- Kolo, M.T.; Aziz, S.A.B.A.; Khandaker, M.U.; Asaduzzaman, K.; Amin, Y.M. Evaluation of radiological risks due to natural radioactivity around Lynas Advanced Material Plant environment, Kuantan, Pahang, Malaysia. Environ. Sci. Pollut. Res. 2015, 22, 13127–13136. [Google Scholar] [CrossRef]
- Sivakumar, S.; Chandrasekaran, A.; Senthilkumar, G.; Gandhi, M.S.; Ravisankar, R. Determination of radioactivity levels and associated hazards of coastal sediment from south east coast of Tamil Nadu with statistical approach. Iran. J. Sci. Technol. Trans. A Sci. 2017, 42, 601–614. [Google Scholar] [CrossRef]
- UNSCEAR. Sources and Effects of Ionizing Radiation; UNSCEAR: New York, NY, USA, 1993; p. 920. [Google Scholar]
- Yasmin, S.; Barua, B.S.; Khandaker, M.U.; Kamal, M.; Rashid, A.; Sani, S.A.; Ahmed, H.; Nikouravan, B.; Bradley, D. The presence of radioactive materials in soil, sand and sediment samples of Potenga sea beach area, Chittagong, Bangladesh: Geological characteristics and environmental implication. Results Phys. 2018, 8, 1268–1274. [Google Scholar] [CrossRef]
- Yalcin, S.; Gurler, O. The radioactivity measurements in soil, coal and water in south Marmara region of Turkey. Radiat. Meas. 2007, 42, 281–285. [Google Scholar] [CrossRef]
- Hanfi, M.Y.; Masoud, M.S.; Ambrosino, F.; Mostafa, M.Y. Natural radiological characterization at the Gabal El Seila region (Egypt). Appl. Radiat. Isot. 2021, 173, 109705. [Google Scholar] [CrossRef] [PubMed]
- Asaduzzaman, K.; Mannan, F.; Khandaker, M.U.; Farook, M.S.; Elkezza, A.; Amin, Y.B.M.; Sharma, S.; Bin Abu Kassim, H. Assessment of Natural Radioactivity Levels and Potential Radiological Risks of Common Building Materials Used in Bangladeshi Dwellings. PLoS ONE 2015, 10, e0140667. [Google Scholar] [CrossRef] [Green Version]
- USEPA. EPA Radiogenic Cancer Risk Models and Projections for the U.S. Population; U.S. Environmental Protection Agency Office of Radiation and Indoor Air: Washington, DC, USA, 2011.
- Qureshi, A.A.; Tariq, S.; Din, K.U.; Manzoor, S.; Calligaris, C.; Waheed, A. Evaluation of excessive lifetime cancer risk due to natural radioactivity in the rivers sediments of Northern Pakistan. J. Radiat. Res. Appl. Sci. 2014, 7, 438–447. [Google Scholar] [CrossRef] [Green Version]
- Abedin, M.; Karim, M.; Khandaker, M.U.; Kamal, M.; Hossain, S.; Miah, M.; Bradley, D.; Faruque, M.; Sayyed, M. Dispersion of radionuclides from coal-fired brick kilns and concomitant impact on human health and the environment. Radiat. Phys. Chem. 2020, 177, 109165. [Google Scholar] [CrossRef]
- Adam, A.M.A.; Eltayeb, M.A.H. Multivariate statistical analysis of radioactive variables in two phosphate ores from Sudan. J. Environ. Radioact. 2012, 107, 23–43. [Google Scholar] [CrossRef] [PubMed]


| Elements | Zr1 | Zr2 | Zr3 | Zr4 | Zr5 |
|---|---|---|---|---|---|
| Si | 28.04 | 24.72 | 32.75 | 35.23 | 24.93 |
| Al | 3.04 | 1.37 | 3.49 | 1.92 | 1.94 |
| K | 2.04 | 0.69 | 1.65 | 1.17 | n.d. |
| Ca | 0.66 | 1.18 | 1.23 | 0.29 | 1.34 |
| Fe3+ | 6.71 | 9.57 | 4.55 | 4.54 | 1.97 |
| Zr | 50.2 | 54.62 | 48.68 | 53.01 | 56.78 |
| Th | 1.0 | 1.06 | 1.30 | 0.4 | 1.90 |
| U | 1.49 | 0.65 | n.d. | n.d. | 1.85 |
| Hf | n.d. | 6.14 | 1.8 | 3.44 | 8.54 |
| Y | 6.82 | n.d. | n.d. | n.d. | n.d. |
| La | n.d. | n.d. | 1.23 | n.d. | n.d. |
| Ce | n.d. | n.d. | 2.18 | n.d. | n.d. |
| Nd | n.d. | n.d. | 1.15 | n.d. | n.d. |
| Total | 100 | ||||
| Elements | A1 | A2 | A3 | A4 | A5 | A6 |
|---|---|---|---|---|---|---|
| Si | 16.79 | 23.23 | 12.94 | 18.27 | 14.55 | 10.15 |
| Al | 4.64 | 13.04 | 6.12 | 9.39 | 4.95 | 3.03 |
| Ca | 3.32 | 3.2 | 6.5 | 3.25 | 3.24 | 3.98 |
| Fe3+ | 3.67 | 7.41 | 3.27 | 5.73 | 4.06 | 3.31 |
| K | 0.81 | 2.1 | 1.41 | 3.01 | 1.14 | 0.98 |
| Na | n.d. | n.d. | n.d. | n.d. | 1.99 | 1.79 |
| Ti | n.d. | n.d. | n.d. | n.d. | 11.7 | 14.6 |
| Ce | 32.16 | 21.62 | 33.32 | 26.09 | 22.6 | 24.61 |
| La | 18.73 | 9.35 | 18.67 | 15.28 | 12.91 | 12.62 |
| Nd | 8.29 | 7.41 | 7.06 | 6.76 | 7.66 | 7.23 |
| Pr | 2.28 | 2.51 | 2.26 | 2.25 | 1.30 | 2.40 |
| Y | 4.20 | 4.03 | 4.69 | 6.47 | 4.99 | 5.0 |
| Th | 2.18 | 2.78 | 0.64 | 1.67 | 2.51 | 2.52 |
| U | 0.81 | 1.09 | 0.46 | 0.86 | 1.16 | 1.13 |
| S | 0.34 | 0.29 | 0.39 | 0.48 | n.d. | n.d. |
| Sm | 0.24 | 0.51 | n.d. | n.d. | 1.52 | 1.36 |
| Eu | 0.26 | 0.31 | 0.56 | n.d. | 0.27 | 0.32 |
| Gd | 1.27 | 1.12 | 1.71 | 0.51 | 0.82 | 1.17 |
| Nb | n.d. | n.d. | n.d. | n.d. | 2.63 | 3.8 |
| Total | 100 | |||||
| N | Mean | SD | Min | Max | Lower 95% CI of Mean | Upper 95% CI of Mean | Variance | Skewness | Kurtosis | CV | |
|---|---|---|---|---|---|---|---|---|---|---|---|
| U-238 | 380 | 62.2 | 20.8 | 13.6 | 130.9 | 60.1 | 64.3 | 433 | 0.70 | 0.60 | 0.33 |
| Th-232 | 380 | 84.2 | 23.3 | 30.0 | 192.0 | 81.9 | 86.6 | 541 | 1.20 | 2.91 | 0.28 |
| K-40 | 380 | 949.4 | 172.5 | 375.6 | 1471.1 | 932.0 | 966.8 | 29,753 | −0.11 | 0.31 | 0.18 |
| Raeq | 380 | 255.7 | 50.6 | 107.6 | 433.8 | 250.6 | 260.8 | 2563 | 0.70 | 1.10 | 0.20 |
| Hin | 380 | 0.9 | 0.2 | 0.4 | 1.5 | 0.84 | 0.88 | 0.033 | 0.72 | 0.83 | 0.21 |
| Hex | 380 | 0.7 | 0.1 | 0.3 | 1.2 | 0.68 | 0.70 | 0.019 | 0.70 | 1.10 | 0.20 |
| Iγ | 380 | 0.9 | 0.2 | 0.4 | 1.6 | 0.93 | 0.96 | 0.033 | 0.64 | 1.04 | 0.19 |
| Dair | 380 | 118.5 | 22.8 | 50.2 | 197.3 | 116.2 | 120.8 | 518 | 0.64 | 1.00 | 0.19 |
| AEDout | 380 | 0.1 | 0.0 | 0.1 | 0.2 | 0.1425 | 0.15 | 0.001 | 0.64 | 1.00 | 0.19 |
| AEDin | 380 | 0.6 | 0.1 | 0.2 | 1.0 | 0.5701 | 0.59 | 0.012 | 0.64 | 1.00 | 0.19 |
| AGDE | 380 | 0.8 | 0.2 | 0.4 | 1.4 | 0.8 | 0.86 | 0.025 | 0.61 | 0.97 | 0.19 |
| ELCR | 380 | 0.0005 | 9.8 × 10⁻⁵ | 2.2 × 10⁻⁴ | 8.5 × 10⁻⁴ | 0.0005 | 0.0005 | 9.54 × 10⁻⁹ | 0.64 | 1.00 | 0.19 |
| Country | 238U | 232Th | 40K | References |
|---|---|---|---|---|
| Egypt | 62 | 84 | 949 | Present study |
| Egypt | 137 | 82 | 1082 | [33] |
| Nigeria | 63.29 | 226.67 | 832.59 | [34] |
| Saudi Arabia | 28.82 | 34.83 | 665.08 | [35] |
| Saudi Arabia | 11 | 22 | 641 | [36] |
| Palestine | 71 | 82 | 780 | [37] |
| Jordan | 41.52 | 58.42 | 897 | [38] |
| Oman | 17 | 18 | 379 | [39] |
| Iran | 77.4 | 44.5 | 1017.2 | [40] |
| Malaysia | 184 | 165 | 835 | [41] |
| India | 25.88 | 42.82 | 560.6 | [42] |
| China | 112 | 72 | 672 | [43] |
| Spain | 84 | 42 | 1138 | [44] |
| Greece | 74 | 85 | 881 | [45] |
| U-238 | Th-232 | K-40 | Raeq | Hin | Hex | Iγ | Dair | AEDout | AEDin | AGDE | ELCR | |
|---|---|---|---|---|---|---|---|---|---|---|---|---|
| U-238 | 1 | 0.36 | 0.21 | 0.71 | 0.84 | 0.71 | 0.69 | 0.71 | 0.71 | 0.71 | 0.70 | 0.71 |
| Th-232 | 1 | 0.26 | 0.87 | 0.77 | 0.87 | 0.87 | 0.85 | 0.85 | 0.85 | 0.85 | 0.85 | |
| K-40 | 1 | 0.52 | 0.45 | 0.52 | 0.56 | 0.56 | 0.56 | 0.56 | 0.58 | 0.56 | ||
| Raeq | 1 | 0.98 | 0.99 | 0.99 | 0.99 | 0.99 | 0.99 | 0.99 | 0.99 | |||
| Hin | 1 | 0.98 | 0.97 | 0.98 | 0.98 | 0.98 | 0.97 | 0.98 | ||||
| Hex | 1 | 0.99 | 0.99 | 0.99 | 0.99 | 0.99 | 0.99 | |||||
| Iγ | 1 | 0.99 | 0.99 | 0.99 | 0.99 | 0.99 | ||||||
| Dair | 1 | 1 | 1 | 0.99 | 1 | |||||||
| AEDout | 1 | 1 | 0.99 | 1 | ||||||||
| AEDin | 1 | 0.99 | 1 | |||||||||
| AGDE | 1 | 0.99 | ||||||||||
| ELCR | 1 |
| Radiological Parameters | Principal Component Analysis | ||
|---|---|---|---|
| PC1 | PC2 | Communalities | |
| U-238 | 0.62 | 0.74 | 0.38 |
| Th-232 | 0.90 | −0.28 | 0.81 |
| K-40 | 0.56 | −0.01 | 0.31 |
| Raeq | 0.99 | 0.12 | 0.98 |
| Hin | 0.94 | 0.32 | 0.89 |
| Hex | 0.99 | 0.12 | 0.98 |
| Ig | 0.99 | 0.10 | 0.99 |
| Dair | 0.99 | 0.14 | 0.98 |
| AEDout | 0.99 | 0.14 | 0.98 |
| AEDin | 0.99 | 0.14 | 0.98 |
| AGED | 0.99 | 0.12 | 0.98 |
| ELCR | 0.99 | 0.14 | 0.98 |
| Th-232/U-238 | 0.11 | −0.97 | 0.01 |
| Eigen value | 10.49 | 1.58 | |
| % Total variance | 80.72 | 12.14 | |
| Communalities % | 80.72 | 92.86 | |
Publisher’s Note: MDPI stays neutral with regard to jurisdictional claims in published maps and institutional affiliations. |
© 2021 by the authors. Licensee MDPI, Basel, Switzerland. This article is an open access article distributed under the terms and conditions of the Creative Commons Attribution (CC BY) license (https://creativecommons.org/licenses/by/4.0/).
Share and Cite
Abdel Gawad, A.E.; Ali, K.; Eliwa, H.; Sayyed, M.I.; Khandaker, M.U.; Bradley, D.A.; Osman, H.; Elesawy, B.H.; Hanfi, M.Y. Radiological Investigation on Sediments: A Case Study of Wadi Rod Elsayalla the Southeastern Desert of Egypt. Appl. Sci. 2021, 11, 11884. https://0-doi-org.brum.beds.ac.uk/10.3390/app112411884
Abdel Gawad AE, Ali K, Eliwa H, Sayyed MI, Khandaker MU, Bradley DA, Osman H, Elesawy BH, Hanfi MY. Radiological Investigation on Sediments: A Case Study of Wadi Rod Elsayalla the Southeastern Desert of Egypt. Applied Sciences. 2021; 11(24):11884. https://0-doi-org.brum.beds.ac.uk/10.3390/app112411884
Chicago/Turabian StyleAbdel Gawad, Ahmed E., Khaled Ali, Hassan Eliwa, M. I. Sayyed, Mayeen Uddin Khandaker, David A. Bradley, Hamid Osman, Basem H. Elesawy, and Mohamed Y. Hanfi. 2021. "Radiological Investigation on Sediments: A Case Study of Wadi Rod Elsayalla the Southeastern Desert of Egypt" Applied Sciences 11, no. 24: 11884. https://0-doi-org.brum.beds.ac.uk/10.3390/app112411884