
The Spatial Optimization of Emergency Shelters Based on an Urban-Scale Evacuation Simulation


1
School of Geographic and Biologic Information, Nanjing University of Posts and Telecommunications, Nanjing 210023, China
2
School of Landscape Architecture, Zhejiang A&F University, Hangzhou 311300, China
3
School of Business, Anhui University, Hefei 230601, China
*
Authors to whom correspondence should be addressed.
Appl. Sci. 2021, 11(24), 11909; https://0-doi-org.brum.beds.ac.uk/10.3390/app112411909
Submission received: 26 October 2021
/
Revised: 10 December 2021
/
Accepted: 13 December 2021
/
Published: 14 December 2021
(This article belongs to the Special Issue New Directions in Hazard and Disaster Science: Advances in Applied Sciences II)
Abstract
:As an important space for disaster prevention, the construction of emergency shelters is crucial for the creation of a complete disaster relief facility network. Based on the goal of the prevention of day and night disaster, short-term fixed shelters are taken as the study object of the present work, and models are designed for evacuation simulation and the spatial optimization of shelters. According to the simulation, 680 of the 2334 demand points were found to be incompletely evacuated, and the average time for everyone to be evacuated was 10.3 min. Moreover, of the 888 short-term fixed shelters, only 218 did not reach their maximum capacity. In the context of short-term fixed sheltering, Haizhu was found to have the largest number of non-evacuated people (1.11 million), and the average number of non-evacuated people in Yuexiu was the largest (2184). According to the spatial optimization data of the shelters, the numbers of target plots for new shelter resources that must be added in Haizhu, Yuexiu, Liwa, and Tianhe are 406, 164, 141, and 136, respectively, the effective shelter areas of which are 2,621,100, 2,175,300, 812,100, and 1,344,600 m2, respectively. A total of 487 short-term fixed shelters and 360 temporary shelters were newly added, and the recommended scales for Haizhu, Liwan, Tianhe, and Yuexiu were 243, 70, 58, and 116, respectively, with average effective areas of 6169 m2, 5577 m2, 8707 m2, and 12,931 m2, respectively. Additionally, the recommended scales of newly added temporary shelters in Haizhu, Liwan, Tianhe, and Yuexiu are 163, 71, 78, and 48, with an average effective area of 2706, 2581, 4017, and 6234 m2, respectively. These findings provide a direct quantitative basis for the spatial optimization of various types of emergency shelters, and the method proposed in this paper supports the planning and layout of emergency shelters, as well as the improvement of the efficiency of urban resource allocation.
1. Introduction
In the 20 years between 2000 and 2019, (the international disasters database) EM-DAT recorded 7348 disaster events, which claimed a total of approximately 1.2 million lives and affected more than 4.03 billion people. On average, there were 367 disaster events each year, the majority of which were floods and storms [1]. In 2020, 416 natural disaster events worldwide caused approximately 8100 fatalities and USD 210 billion in losses, as several countries, including the U.S. and China, battled hurricanes, floods, and wildfires [2]. In the process of disaster relief, emergency shelters play an important role in post-disaster rescue and reducing casualties [3]. Therefore, the construction of a complete network of refuge facilities will help to improve disaster prevention capabilities. In planning practice, the geographic information system (GIS) has become the most widely used technology platform in refuge site selection [4]. Numerous studies have yielded rich results, which can be summarized into the following three main categories: shelter location selection and allocation [5,6,7], sheltering behavior and psychology from the perspective of sociology [8], and planning tools [9,10]. In any case, what scholars are most inter9ested in are the spatial layout and optimization of emergency shelters, which are directly related to whether the city can quickly provide nearby refuge services to evacuees after a disaster [11]. In the current practices of shelter planning and construction in China, the general spatial layout method is based on the existing available resources in the city; according to the effective area that the resources can cover and considering a balanced layout, the service area of shelters is divided by a certain service radius [12]. The spatial layout method has a certain degree of operability in the master plan of shelters, because the master planning level is mainly used for the layout of the central shelter and other mid- or long-term shelters. A crucial problem is that shelter planning based on the selection and layout of the existing resources in the city causes shelter planning to lag behind urban planning, and it is unclear which plots or areas should increase their shelter resources in the future [13]. The scale is mostly based on qualitative (or semi-quantitative) analysis guidance, which cannot provide effective feedback on the land use layout in urban planning, meaning that the shelters can never provide reasonable coverage for the surrounding residents. It is a significant and practical challenge to optimize the spatial layout of emergency shelters on a sufficient basis.
This study aims to address the challenge of how to optimize the spatial distribution of emergency shelters by an urban-scale evacuation simulation. Based on (point of interest) POI data, the scale and distribution of shelter demand were analyzed, the supply and demand status of emergency shelters was explored via evacuation simulations, and a spatial optimization strategy for shelters is provided. The remainder of this paper is organized as follows. The next section provides a review of relevant literature regarding spatial distribution of emergency shelter demand, emergency evacuation simulation, and spatial optimization of emergency shelters. Section 3 describes the theoretical framework, including the overall research framework, evacuation simulation using network analysis in GIS and Python, and spatial optimization of shelters based on the redistribution of remaining non-evacuated evacuees. Section 4 presents the study area, the types of data, and the construction of evacuation simulation model. Section 5 provides an analysis of the status of evacuees and refugees after evacuation, along with the scale and type of shelter optimization. Section 6 discusses the deficiencies and limitations of this study. Finally, conclusions and directions for future work are presented in Section 7. It is the hope of the authors that this work can provide a quantitative basis and inspiration for the construction of urban emergency shelters and the continuous optimization of disaster prevention facility networks.
2. Literature Review
2.1. Assessment of Emergency Shelter Demand
The first step to understanding the location selection of emergency shelters is to analyze the temporal and spatial distributions of shelter demand; here, the difficulty lies in figuring out the size and distribution of the urban population [12,13]. Traditional geospatial data, such as land cover data, land use data, and light emission data, have been widely used to describe the population distribution [14,15]. With the in-depth development of big data applications, new methods for the determination of the population distribution have been applied in some studies. Chen et al. [12] proposed an approach for the examination of the distributions of daytime and nighttime populations at the plot scale via the use of point-of-interest (POI) data. A common method used in earthquake shelter demand forecasting is to set input parameters (such as risk, vulnerability, and exposure) in combination with different variables to estimate demand [16]. For a tsunami disaster, the time that is required for residents to seek shelter, the inundation depth and flow velocity, and the evacuation speed are the main factors that are used for the estimation of the scale and spatial distribution of the affected population [17]. In fact, the analysis of shelter demand and capacity is very complicated and is easily affected by external conditions. For example, the instability of the evacuation network and the restriction of the path capacity will lead to changes in both the demand capacity and the ideal shelter location [18]. In addition, the mobility of the population within the city also causes greater uncertainty for the assessment of emergency shelter demand, and the different functions between the districts of (mega) cities have also caused large differences in the number and distributions of daytime and nighttime populations. To obtain the most accurate population distribution information for the assessment of casualties and shelter demand and the formulation of evacuation plans, Tenerelli et al. [19] used city maps as auxiliary information. Based on different downscaling techniques, they constructed a population vulnerability analysis method for night disaster scenarios. To meet the needs of all-weather disaster prevention, Yu and Wen [20] used high-resolution aerial images, census data, and high-precision land use data to evaluate day and night disaster scenes and to analyze the supply and demand of shelters. Some studies have highlighted that needs should be differentiated according to different situations. In an emergency evacuation scenario, considering the complexity of the evacuation behavior and nearby sheltering, the demand can be the maximum number of people during the day and night. In short-term to long-term evacuation scenarios, the demand can be the number of people that are present at night, because sufficient disaster relief operations can be carried out at this time [12,21].
2.2. Emergency Evacuation Simulation
The prerequisite for the effective functioning of emergency shelters is that their supply and demand should be balanced in each district of the city [22]. A practical and effective method is to perform an evacuation simulation after the analysis of shelter demand [12]. The key to evacuation simulation is to establish the connection between evacuation activities and the urban environment, then to process complex space, facility, and road network data, and finally to establish a model under objective functions, such as the shortest-path and minimum-cost functions [23,24]. From the perspective of the evacuation plan, evacuation simulation can be regarded as a two-stage process; the first stage is to find suitable locations, and the second stage is to use an algorithm to determine the best evacuation route in an emergency [13,25]. The results are related to various traffic scenarios and speed assumptions. Lee and Hong [26] tried to derive an evacuation speed formula based on the slope, which is used to calculate the possible speed and evacuation distance of evacuees when deciding on the shelter location. Due to the different evacuation behaviors and speeds of different age groups, actual evacuation activities are very complicated, and the results will also exhibit diversity. Based on these considerations, agent technology can be used to realize evacuation simulation, and evacuation activities can be determined by various existing behavior models. This method can be used to evaluate the dynamic space allocation of urban emergency shelters, simulate the evacuation process of residents evacuating to the shelters, obtain the evacuation times of all evacuees in an area, and employ the flexible combination of existing behavior and decision-making models to generate the best evacuation plan [27,28]. Based on specific disaster scenarios, Wang [29] assumed the travel time and capacity to be random variables, and focused on the disaster response of the evacuation of residents to safe locations in a two-stage stochastic planning model to describe the urban transportation network during the evacuation process. From the perspective of evacuation decision making, some studies start from the crowds themselves and focus on how evacuees obtain evacuation information as an entry point to evaluate the impact of various social factors (resident psychology, individual differences, social networks, etc.) on residents’ evacuation choices [30,31,32].
2.3. Spatial Optimization of Emergency Shelters
The analysis of the supply and demand of shelters is helpful for finding areas where there are gaps in post-disaster sheltering services, and for carrying out the targeting of the spatial layout and the optimization of shelters in the process of urban planning and renewal [12]. In the current studies on spatial optimization, focus is largely placed on the construction of various shelter location and allocation models, which usually include considerations such as minimizing the evacuation time or distance, the construction cost or the number of shelters, and the risk during the evacuation, and maximizing the capacity of the demand points and shelters within the service radius [33,34,35,36]. Celik [37] proposed an active decision-making tool that combines the experimental evaluation method with interval type-2 fuzzy sets, which is used to determine the need for a location to set up shelters or make evacuation plans in disaster emergency management. Trivedi and Singh [5] used a hybrid multi-objective decision-making model based on the analytic hierarchy process (AHP), fuzzy set theory, and the goal-planning method, and converted all the goals into a single goal to allocate and redistribute the location of the refuge area. This method also considers demand, capacity, utilization, and budget constraints, and can achieve a compromise solution for multiple goals in the decision-making process. Sabouhia et al. [38] proposed a linear mixed-integer programming model that takes evacuation demand as an uncertain parameter. To solve the uncertainty problem, a robust possibility planning method was adopted to provide relief services (transportation of the wounded, supply of relief goods, etc.) to locate the transmission points and shelters. Existing optimization algorithms are usually used to solve the location problem in small areas. In the case of complex and high-dimensional problems related to large areas, the current algorithms may require excessive amounts of time and computing power, and it is difficult to find the global optimal solution [39,40]. Some studies have proposed methods for spatial optimization from other perspectives, such as cost-effectiveness, accessibility, and service coverage [20,41,42]. To evaluate the feasibility of the construction of shelters in areas with hurricane hazards, Whalen et al. [43] developed and tested a cost-effectiveness model with the consideration of occurrence probability, historical death and injury rates, economic incentives, local construction, and maintenance costs. Wei et al. [44] integrated and compared the location set coverage problem with the maximum coverage location problem to maximize the shelter for the affected population, and combined cost and benefit factors to provide a feasible way for developing cities with insufficient budgets to make decisions.
In summary, carrying out an urban-scale evacuation simulation and use it as a quantitative basis to continuously optimize the spatial distribution of emergency shelters is a substantial research challenge. It was found that shelter demand analysis is mainly based on demographic data, which are characterized by disadvantages such as poor timeliness and large spatial statistical units, meaning that these data cannot meet the evacuation needs in diurnal disaster scenarios. In addition, the distribution of emergency shelters in many regions is uneven (leading to widespread service gaps), and the supply and demand of shelters are imbalanced. Although some studies have considered related issues and achieved certain results, continuous exploration is still required. In general, the current research on evacuation is primarily focused on evacuation plans, decision-making methods, transportation methods, influencing factors, and route selection. In terms of scale, focus is largely placed on traffic evacuation and movement simulations of specific urban areas (central areas, industrial areas, etc.) and individual buildings. However, few evacuation simulation studies have focused on the spatial optimization of emergency shelters. The in-depth application of big data technology offers the possibility of solving the problems.
3. Theoretical Framework
3.1. Overall Research Framework
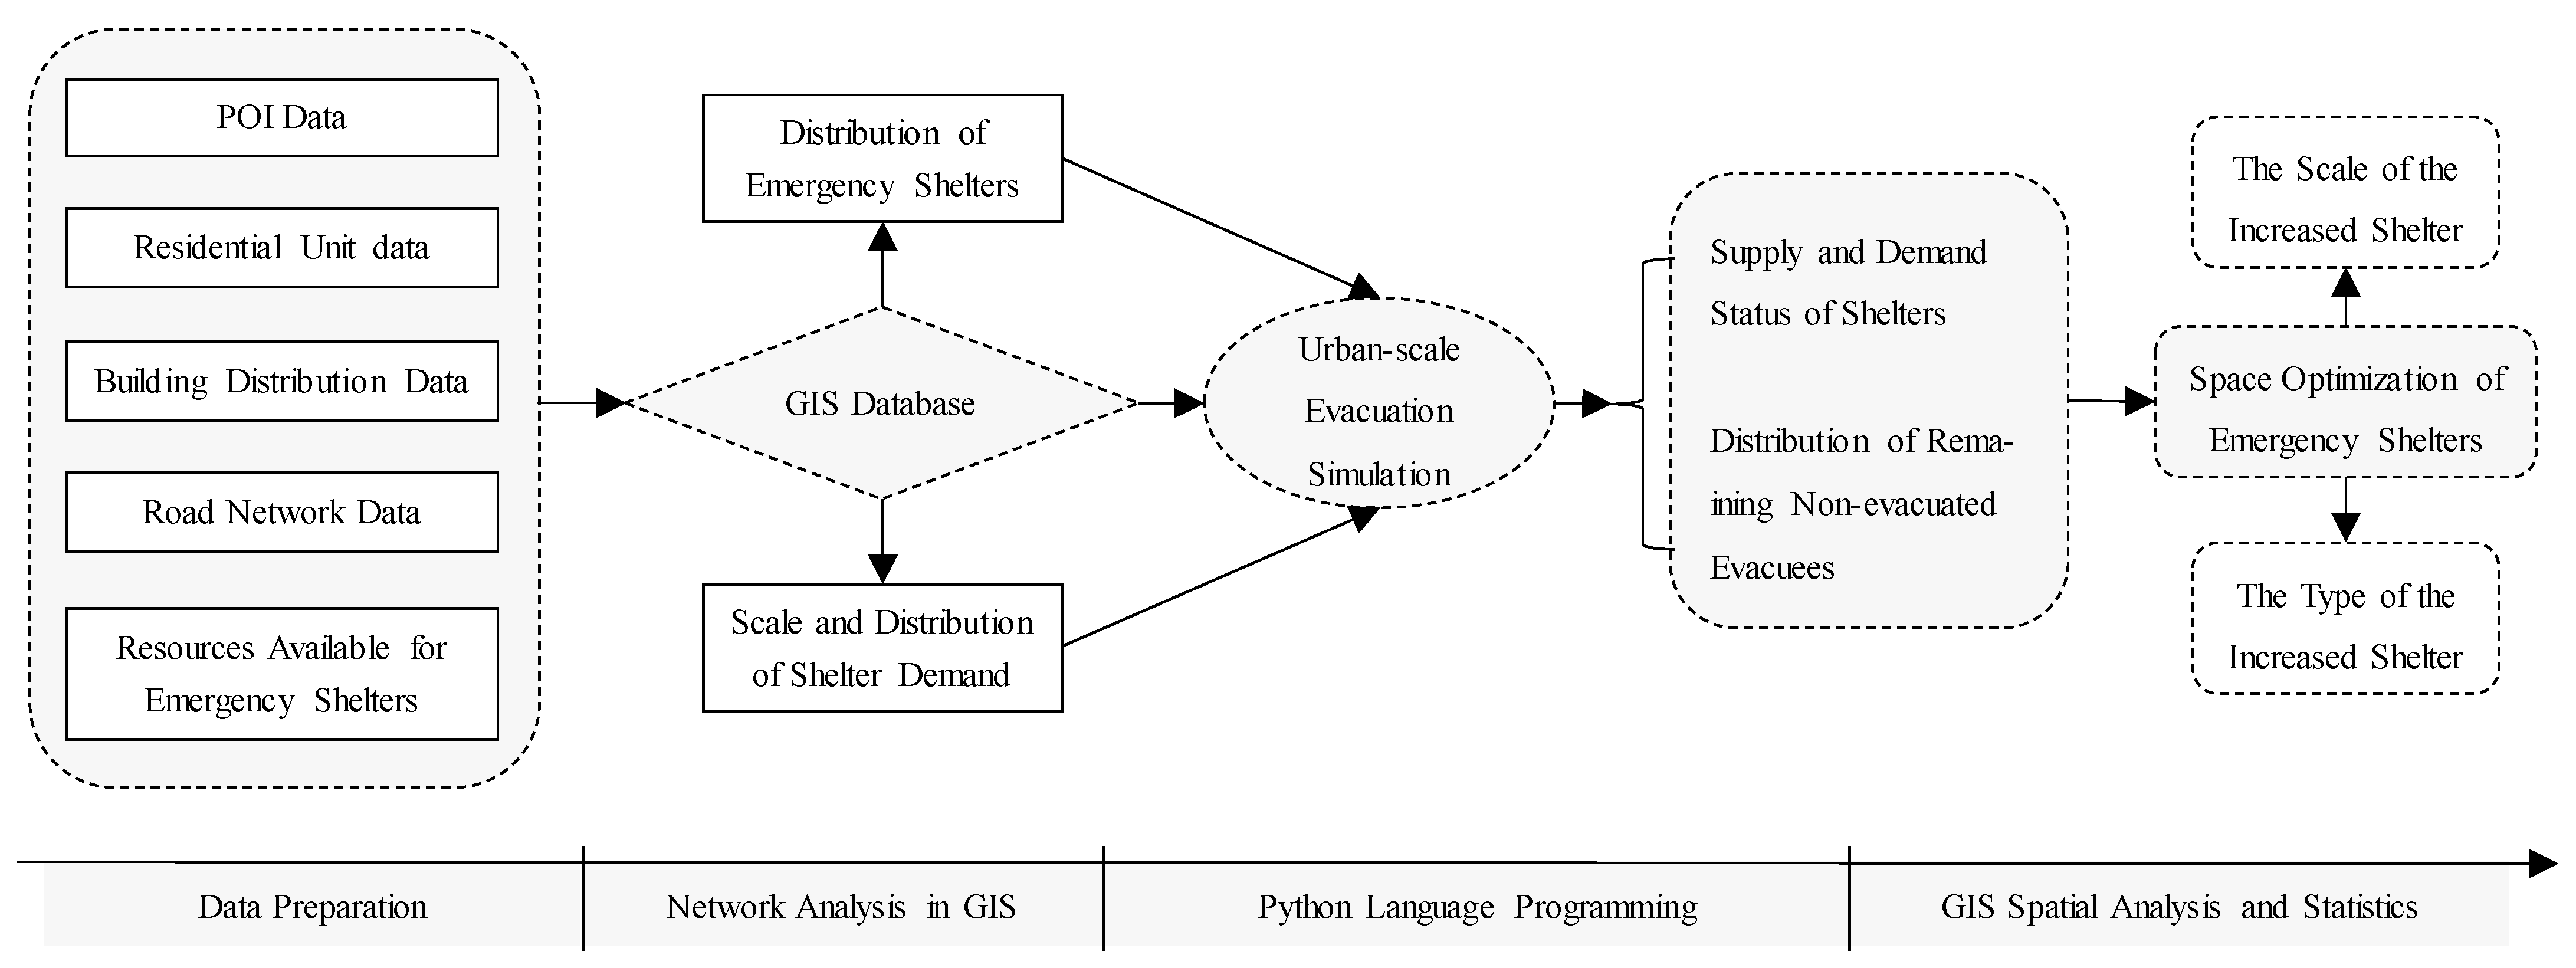
This study was based on a detailed evacuation demand forecast via the use of an evacuation simulation model to analyze the supply and demand status of the site, and to obtain data regarding the remaining non-evacuated people at the plot scale, which can be used as a breakthrough point to construct a spatial optimization model. From the perspective of technical flow (Figure 1), it is mainly composed of the following three steps.
Shelter demand analysis was the first step in the spatial layout evaluation and the key to the assessment of the supply and demand status of shelters. The POI data and residential unit data were mainly used to analyze daytime and nighttime shelter demand. The detailed methods and steps have been described in another study carried out by the present research team [12]. To avoid the duplication of work, the results of the previous demand analysis were directly used in the present study. Therefore, the main purpose of this article is to explore a method for evacuation simulation under the restriction of shelter capacity, as well as the spatial optimization of shelters.
After obtaining the scale and spatial distribution of the shelter demand, an urban-scale evacuation simulation was carried out to obtain the supply and demand status of shelters, which can provide a data basis for the next step of spatial optimization. The balance of supply and demand in emergency shelters is important for effective disaster mitigation functions during disasters and in the evaluation of shelter service capacity. In the traditional practices of shelter planning, supply and demand are generally balanced by districts, rarely seen on streets. A problem that arises is that the probability is high that the supply and demand of certain small areas within the city may be unbalanced, and the service gap could be large. Therefore, we aimed to establish an evacuation simulation model between evacuees and shelters, and tried to simplify and implement complex and dynamic evacuation activities.
Based on the results of the evacuation simulation, the scale and spatial distribution of the shelters were optimized. Because the core of the spatial optimization model is the realization of the redistribution of the remaining non-evacuated people at the demand point to the surrounding target plots, the parameters, functions, construction process, and solution of the model are similar to those of the evacuation simulation model. In other words, the evacuation simulation provides the necessary database for spatial optimization. Therefore, there is no need to describe the construction of the model in detail. Finally, the model calculation can yield the following information: the number of people allocated and the time spent on each route from each incomplete evacuation demand point to the nearby target plots; the number of remaining non-evacuated people from an incomplete evacuation demand point that are received in each target plot, and the time it takes for all people assigned to the target plot to complete their reallocation; the final state of each target plot, i.e., the number of non-evacuated people that are received.
3.2. Evacuation Simulation Using Network Analysis in GIS and Python
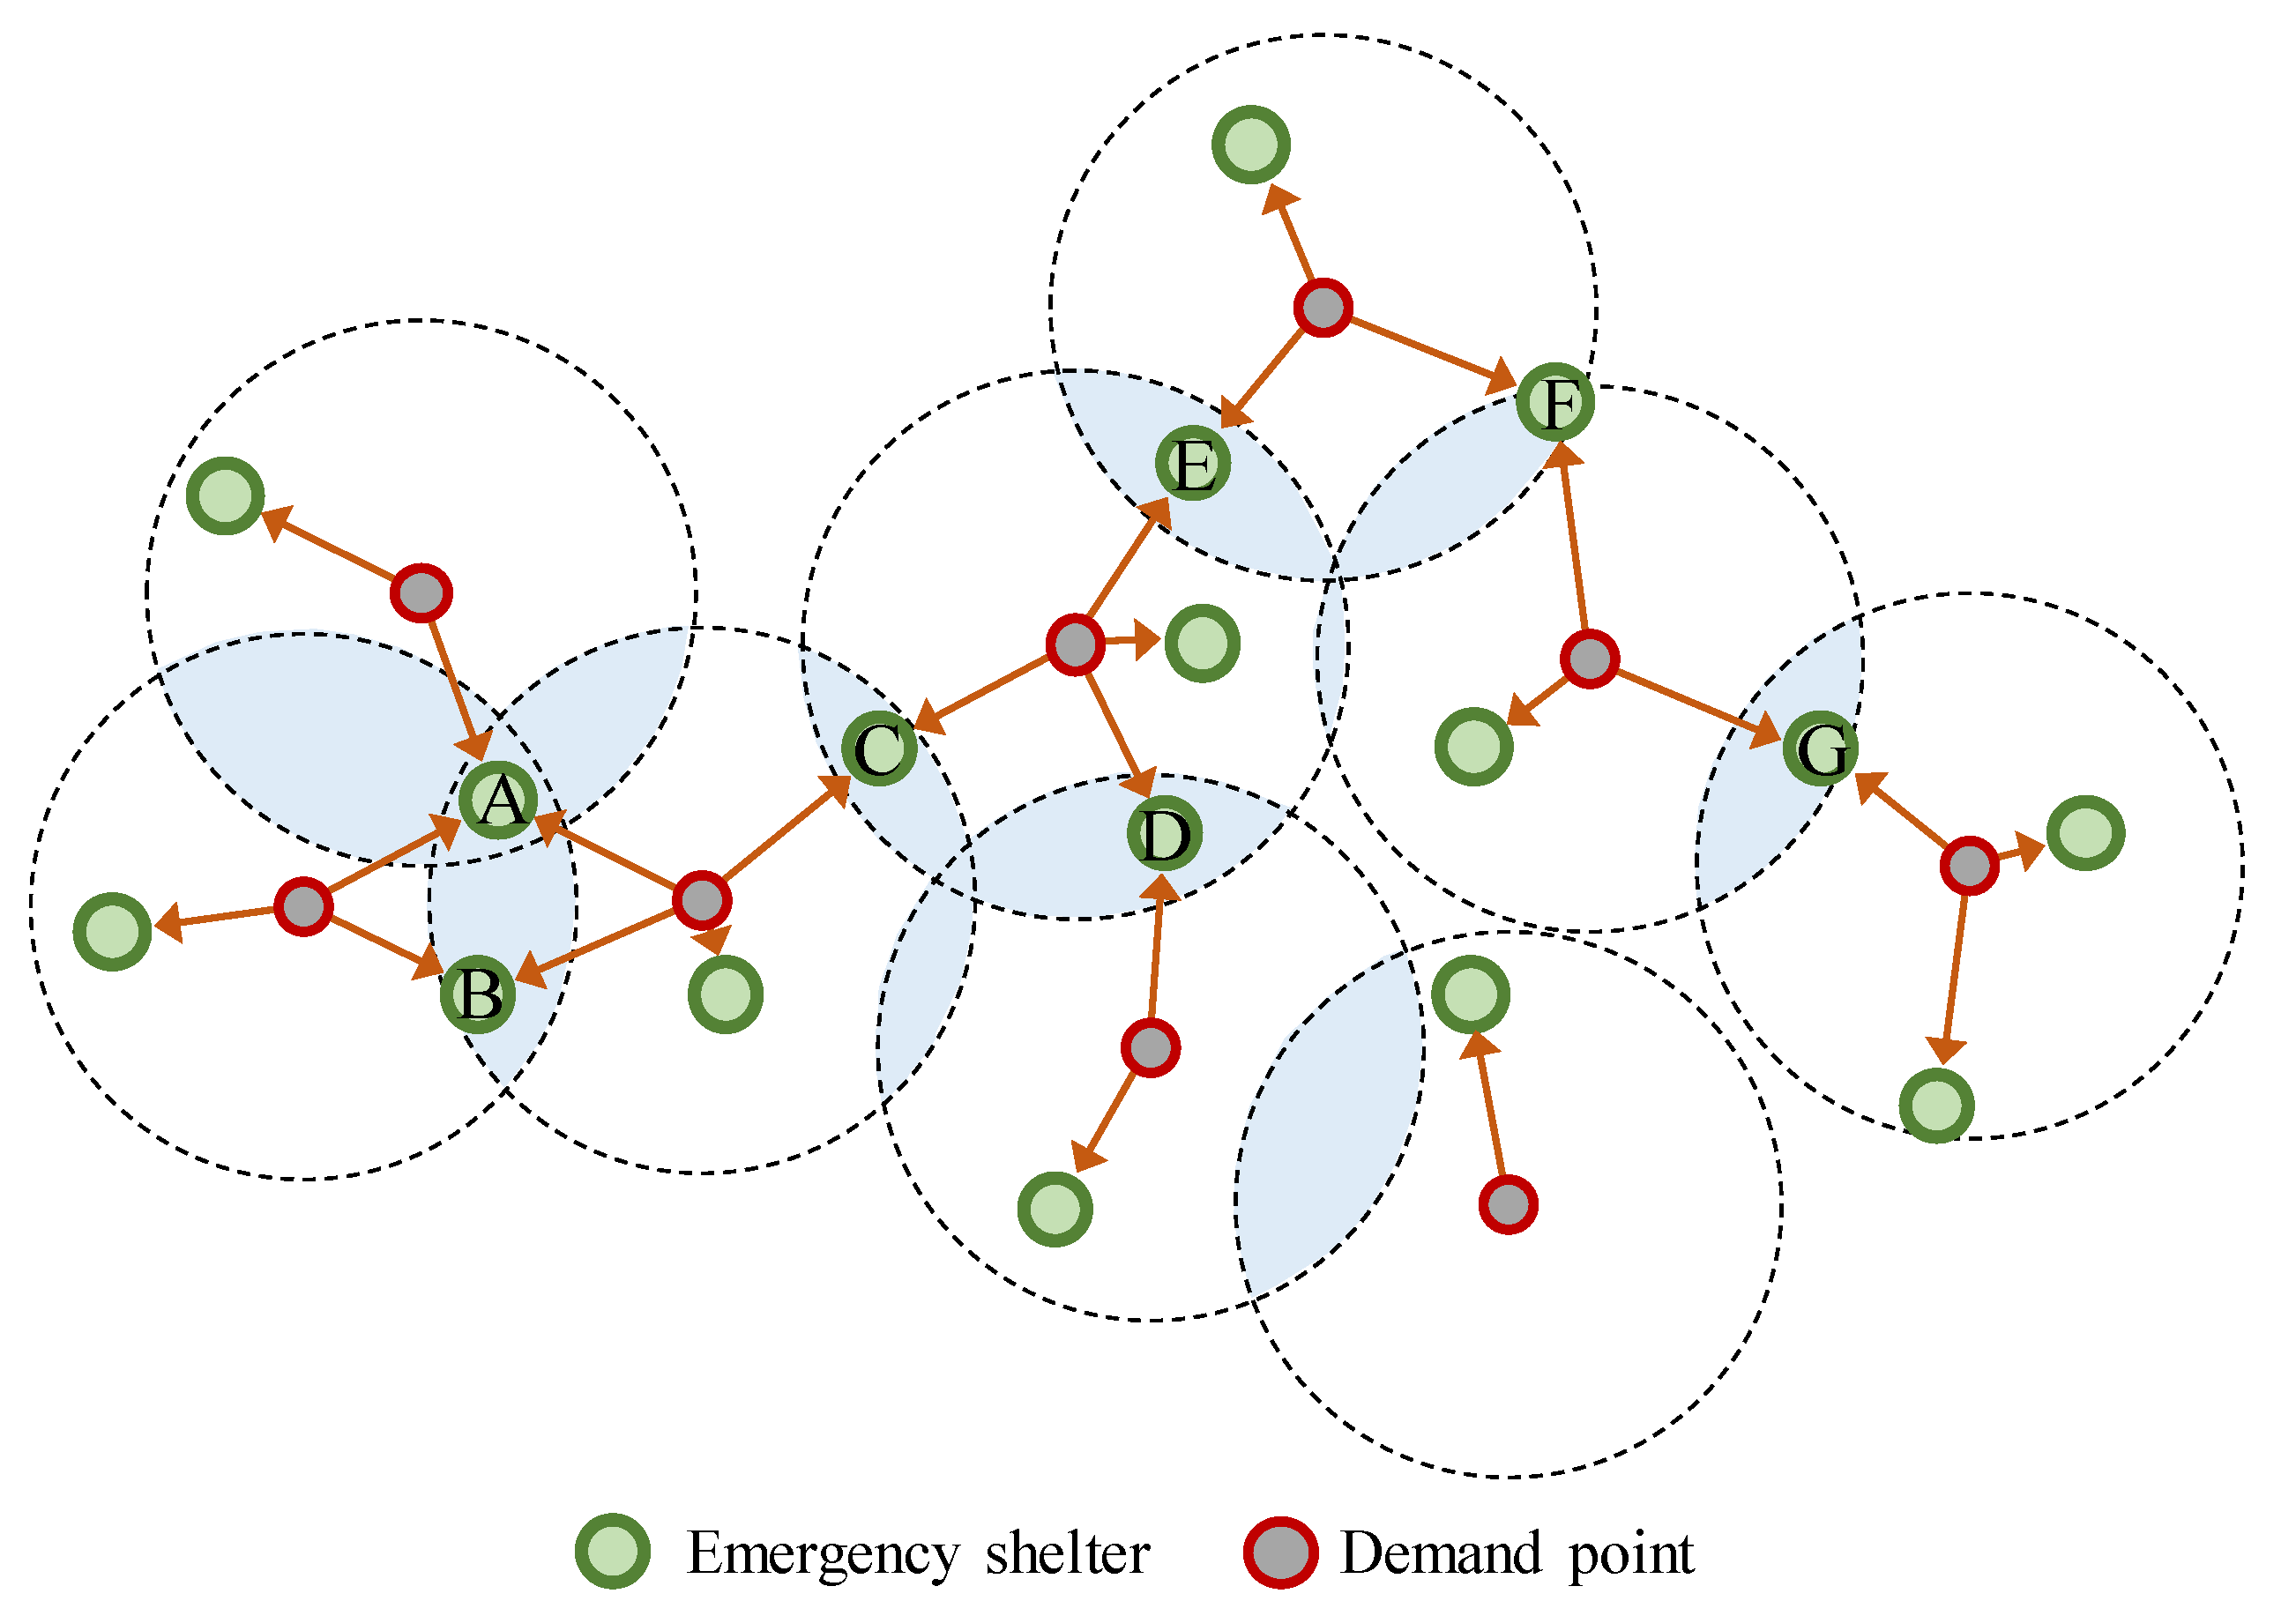
In principle, the urban-scale evacuation simulation is a multi-objective allocation problem, which tries to solve an issue of evacuee assignment from the demand point to its surrounding emergency shelters. The plots where the evacuees located are the starts (demand points), and the plots where the shelters are located are the destinations. Figure 2 shows that some demand points are covered by numerous available shelters; one shelter may also cover numerous demand points. For example, shelters A, B, C, D, E, F, and G all serve numerous demand points [12]. The objectives of the model are as follows: (1) a data set consisted of demand points, available resources for emergency shelters, and road network was established using the network analysis method, and then an OD (origin to destination) cost matrix was constructed. The input elements were road network (lines), demand points (origins), and shelters (destinations); and the output elements were evacuation distances of the routes; (2) according to the considerations of objectives and parameter settings of the model, the results of the previous part were further processed using Python. The results include key information such as the whereabouts and evacuation time of evacuees; (3) partial results were imported into the ArcGIS for spatial statistical analysis, and the results were further visualized.
3.3. Spatial Optimization of Shelters Based on the Redistribution of Remaining Non-Evacuated Evacuees
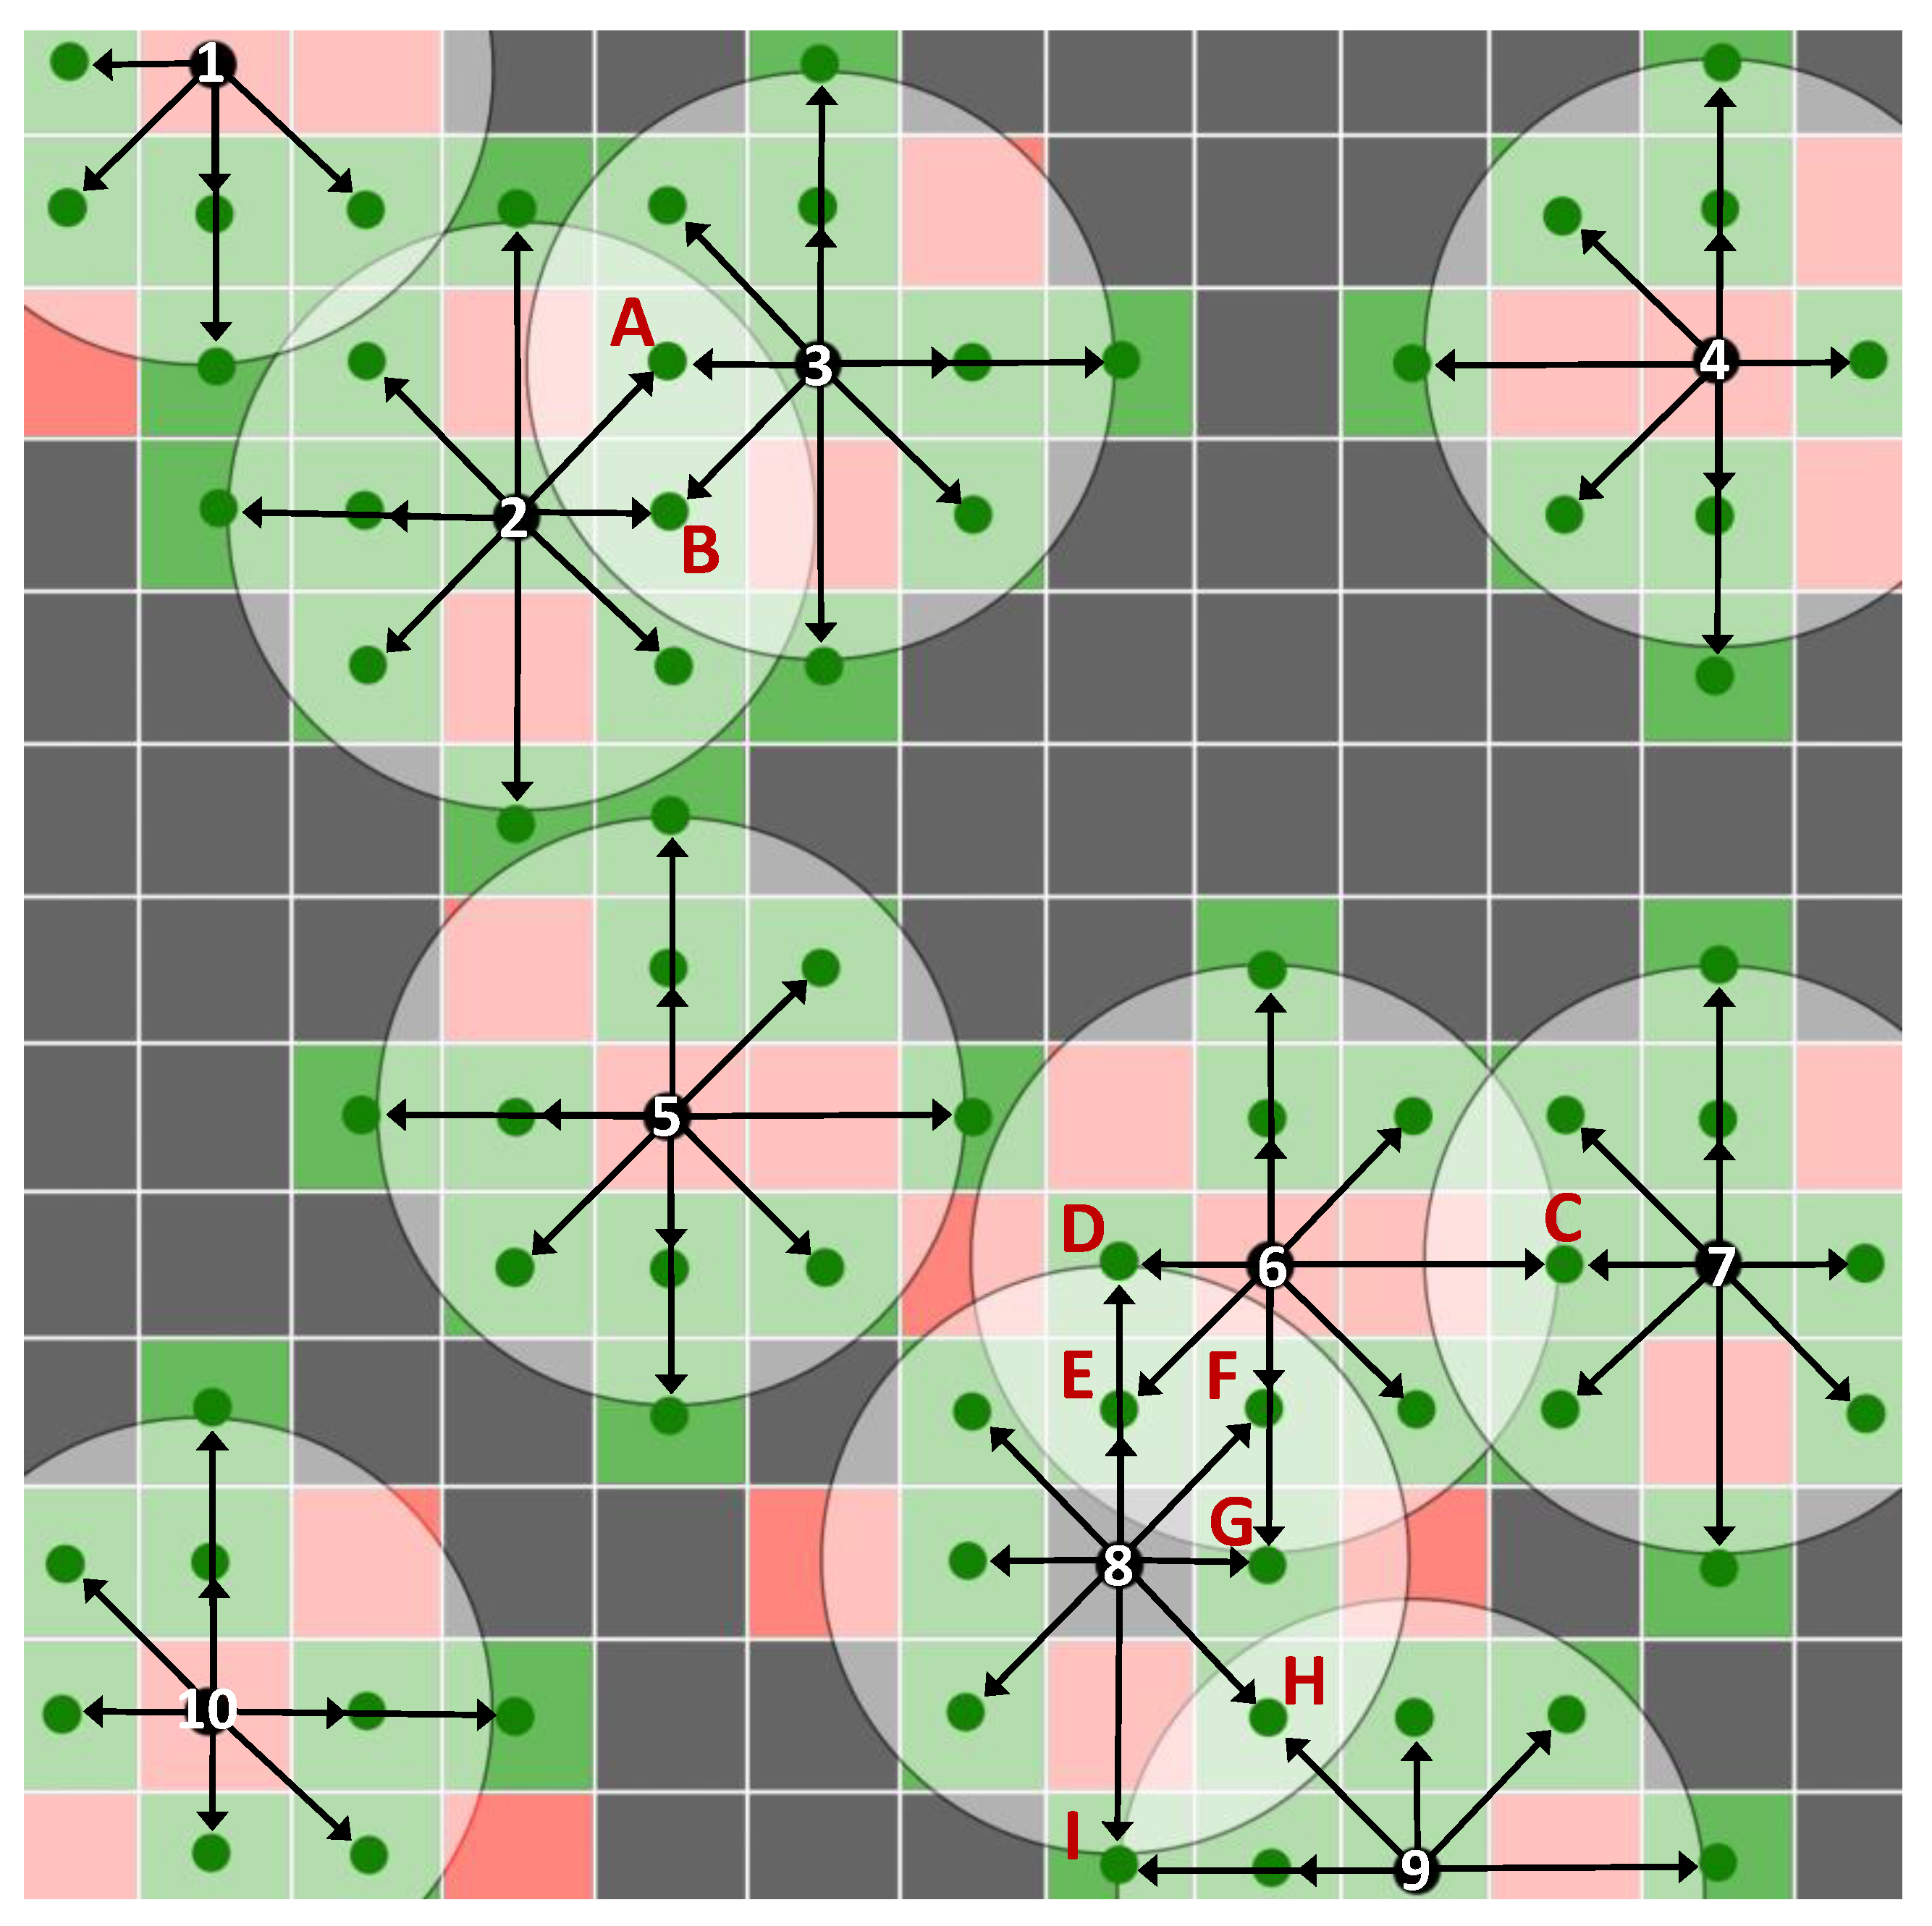
The basic principle of the spatial optimization model is to redistribute the remaining non-evacuated people from all the demand points to surrounding plots on which shelters have not yet been constructed or that do not contain available resources for shelters. As shown in Figure 3, the black points are the demand points (1, 2, 3..., 10) that have not been completely evacuated; the red plots indicate that there are already available resources for shelters (i.e., the plot has already participated in the calculation of the evacuation model, and no personnel will be assigned to it in the spatial optimization model); the green plots indicate that there are no resources available for shelters in the current situation (in the spatial optimization model, these are the target plots). These plots can be used to increase the shelter area in the future. In addition, in the interest of resource conservation, the economy, and the ease of implementation, three key points in the model should be explained: (1) the “Code for Design of Disaster Mitigation Emergency Congregate Shelter” (GB51143-2015) requires that the effective area of a short-term fixed shelter is no less than 2000 square meters and 2 square meters per capita. Therefore, priority is given to the plots with more than 1000 remaining non-evacuated people in the model; (2) overlapping target plots, such as A, B, C..., I in Figure 3, should be used as the main optimization target plots, and the targets should not be too numerous or too scattered; (3) by combining the relevant standards, the shelter supply, and the demand analysis, the size and type of shelter that should be provided on a target plot can be determined.
4. Materials and Methods
4.1. Overview of the Study Area and Data
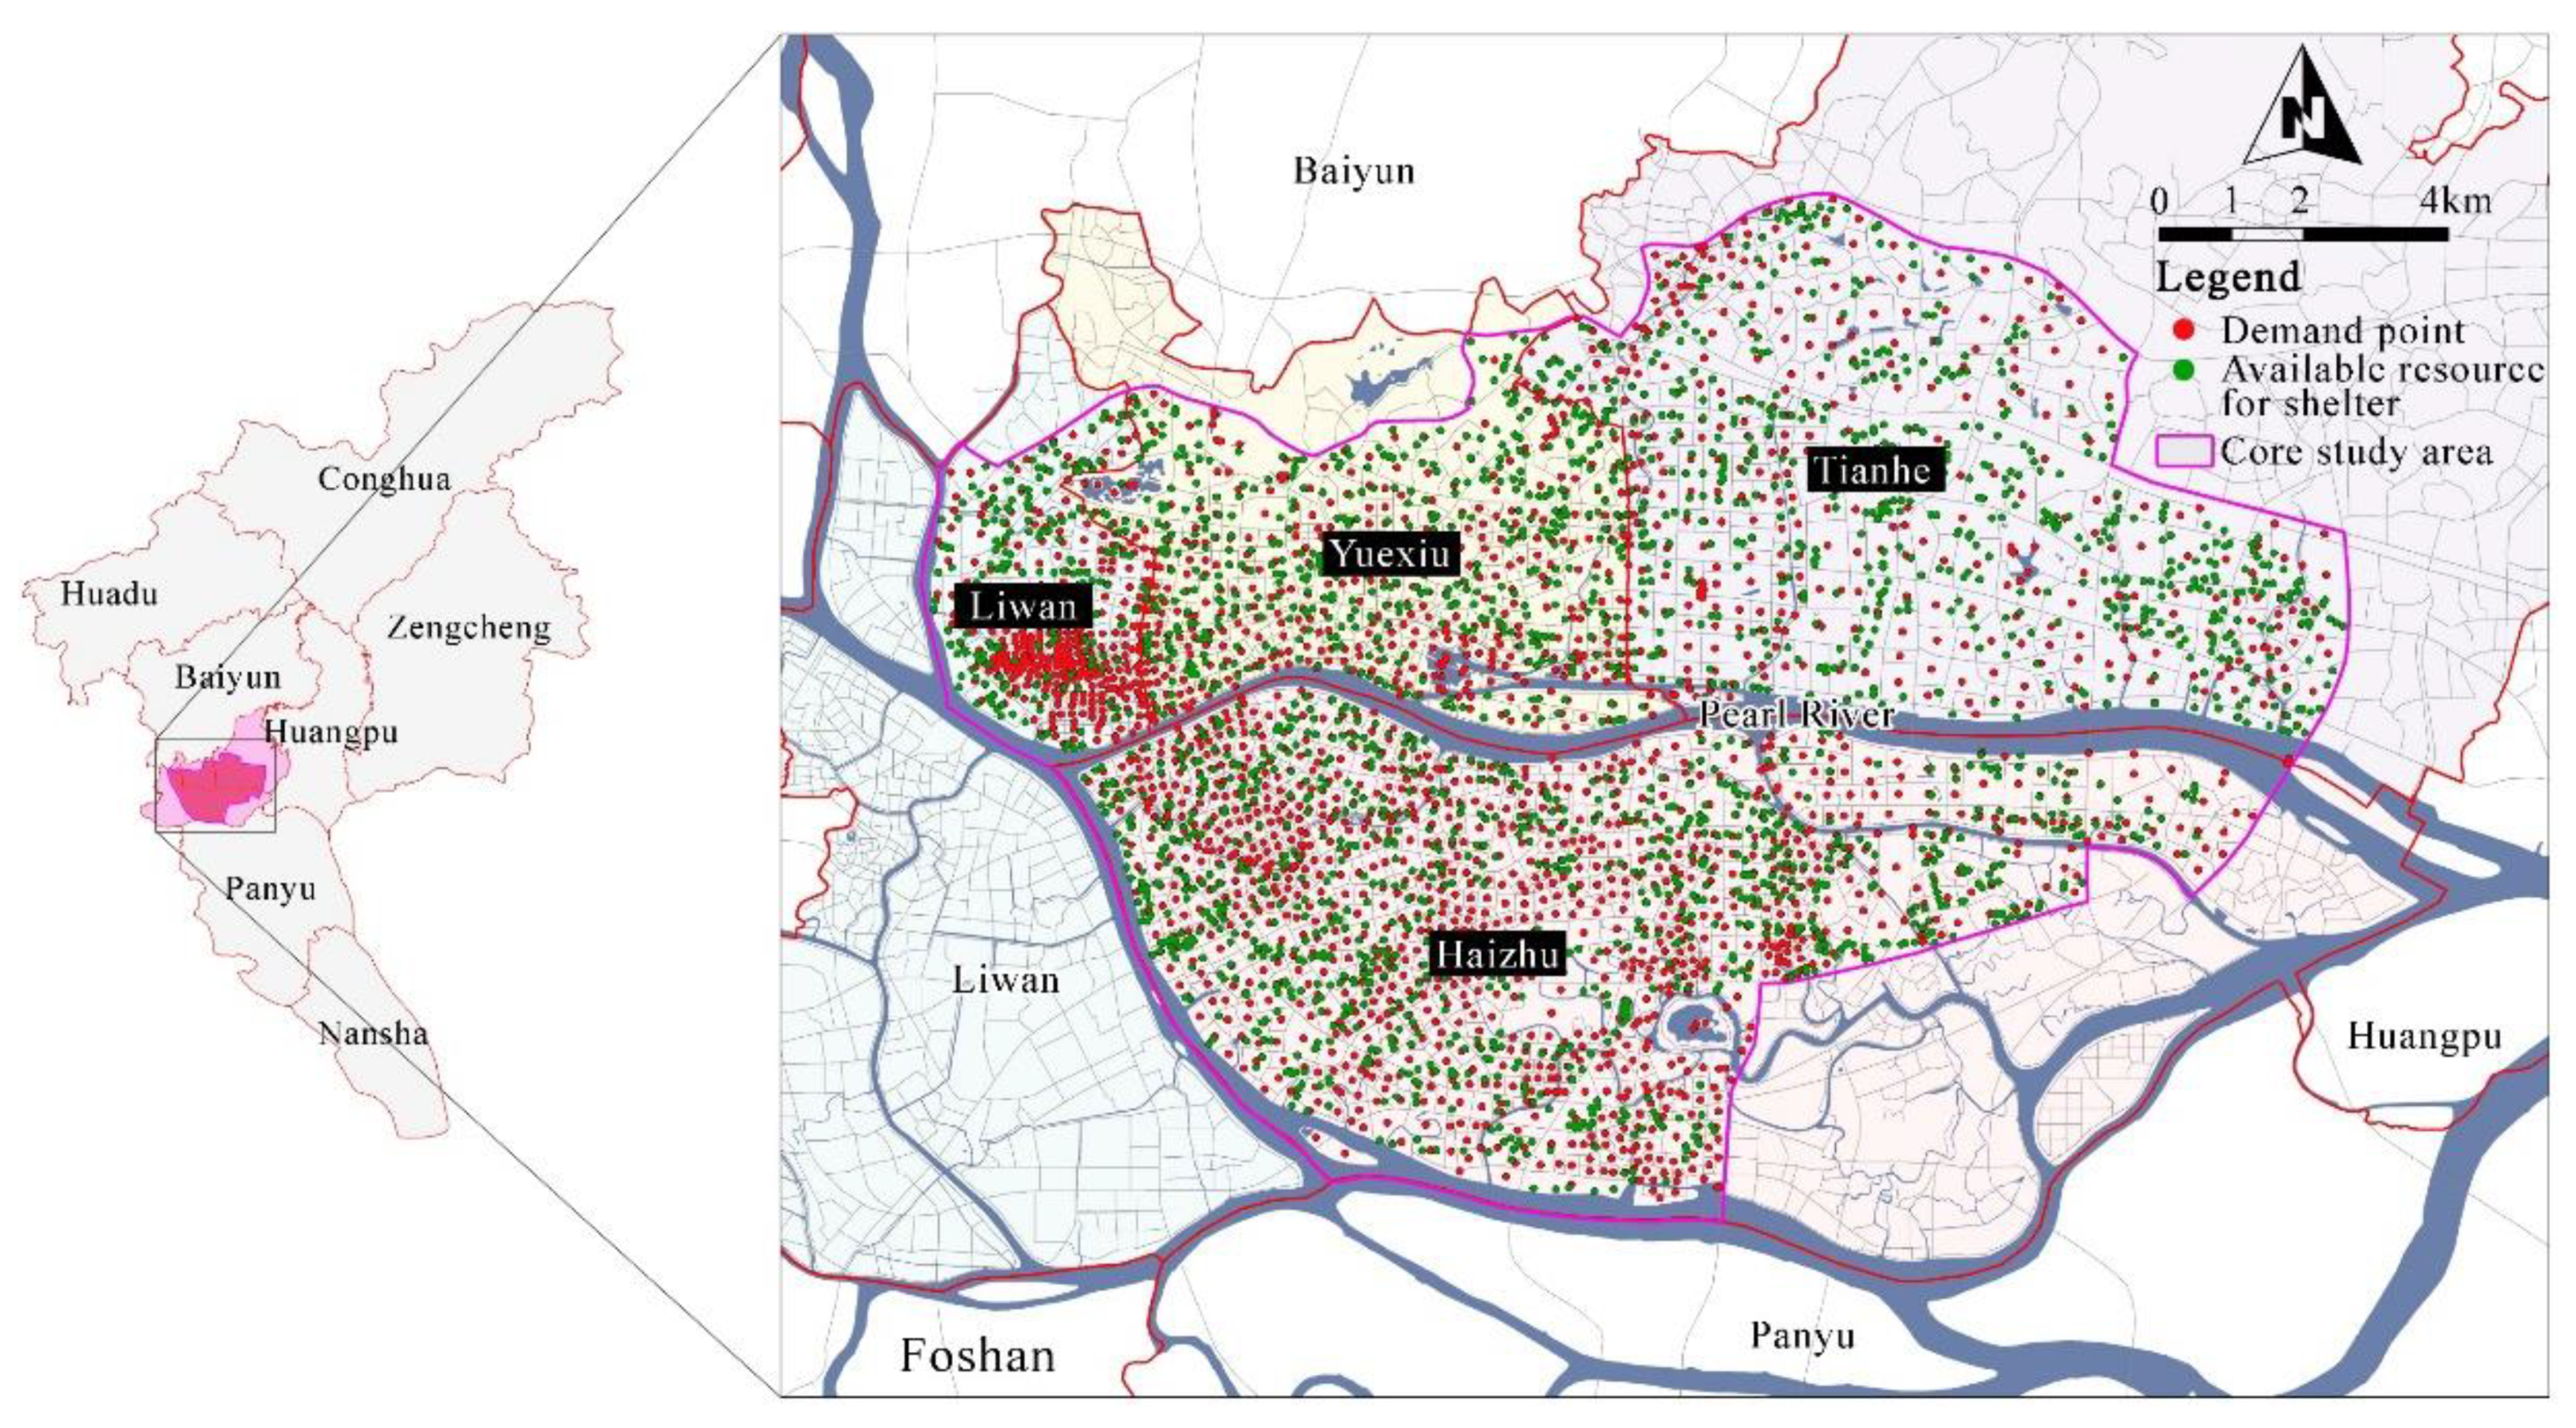
The study area includes the districts of Liwan, Yuexiu, Tianhe, and Haizhu, which are located at the center of downtown Guangzhou, China. According to the data released by the Guangzhou Statistics Bureau (http://tjj.gz.gov.cn/ accessed on 28 August 2021), the total land area of the four districts is 279.63 km2 (accounting for 3.76% of the whole city), and the study area has a high economic density, the GDP of which accounts for 47.39% of the GDP of all 11 districts in Guangzhou. Yuexiu and Liwan are traditional old towns with small areas of 33.8 and 59.1 km2, respectively, whereas Tianhe and Haizhu are newly built, and, respectively, cover areas of 96.33 and 90.4 km2. According to data from the Guangzhou Municipal Bureau of Statistics, at the end of 2020, the population of Guangzhou was 15,305,900, of which the study area accounts for 37.47%. To facilitate the construction of models to analyze the supply, demand, and spatial optimization of emergency shelters, plots with evacuees and plots with available resources for shelters were, respectively, converted into points of demand and shelter, and the core study scope was narrowed to the more mature built-up areas in the four districts, with a total area of approximately 177.92 km2 (Figure 4). The demand points contained information about the number of evacuees, whereas the shelter points contained information about the effective evacuation area, which is necessary for the simulation.
In addition to basic geospatial and statistical data, POI data, residential unit data with household attributes, building distribution data, and road network data were used in this study. The POI data were divided into 14 categories and 524 subcategories (including catering services, scenic spots, enterprises, shopping services, transportation facilities, finance and insurance, education and culture, business housing, living services, sports and leisure, healthcare, government agencies, accommodation services, and public facilities), which cover virtually all kinds of facilities that citizens can access. POI data and official employment demographic data were used to predict the shelter demand; this means that, because the urban population distribution must be analyzed via economic activities, the industry classification of the two data types must be consistent. Therefore, it was necessary to screen and reclassify the POI data according to the official statistical caliber, and this process was conducted in GIS. The residential unit data included data on residential quarters, apartments, and dormitories. The building distribution data covered the spatial distribution of all buildings in the four districts. The road network data were divided into railways, highways, high-speed guide roads, national roads, provincial roads, county roads, township roads, urban first-class roads, urban second-class roads, other roads, and pedestrian roads. There exist both single lines and double lines. According to the needs of the study, the road network was treated as a single-line network, and was simplified to a certain extent. The attributes of each type of data are presented in Table 1.
4.2. The Construction of Evacuation Simulation Model
When people at a demand point evacuate to nearby available shelters within a reasonable distance, after the capacity of a certain shelter reaches the maximum, the shelter is marked as invalid and it will stop accepting evacuees. The rest of the evacuees will continue to seek refuge at an unexpired shelter within a reasonable distance. An evacuation simulation under the restriction of shelter capacity can reveal which shelters are full and not full, as well as the demand points that have or have not been completely evacuated. The simulation requires both point data and line data. The point data refer to the demand points, each of which contains information about the number of people to be evacuated. The line data represent specific information about the evacuation route, including the spatial distribution of the route and its length; the line data can be calculated and analyzed by establishing an OD distance cost matrix model from the starting point O (the demand point) to the destination D (the shelter) in GIS. After the basic database is established, the model parameters and objective functions of the simulation can be set.
4.2.1. Model Parameters
- is a set of shelters, where ;
- is a set of demand points, where ;
- is the evacuation route between the demand point with , and is the set of all the routes leading to different shelters from the demand point ; let , where and the corresponding elements are equal, , , and (the same below);
- t is the time since the start of the evacuation;
- is the number of evacuees received at the shelter by the t-th second;
- is the capacity of the shelter ;
- is the time it takes for all the evacuees to evacuate to shelter ;
- is the number of people to be evacuated at the demand point ;
- is the longitudinal distance between evacuees;
- is the average travel speed of evacuees;
- is the number of people the horizontal space can accommodate simultaneously;
- is the length of the route s when the demand point is evacuated, where (the same below);
- is the number of people evacuated from route s at demand point ;
- is the time it takes for all the evacuees to evacuate from route s at demand point ;
- is a dummy variable used to indicate whether the evacuation stops along route s from demand point . The initial value is 0, and 1 means that the evacuation along the route has stopped.
4.2.2. Objective Function and Model-Building Process
First, the correlation matrix between demand point and shelter is constructed as:
where:
If all the people at the demand point have been evacuated, i.e., when , the evacuation of all routes at demand point ends. At this point, and are defined as follows:
Otherwise, the number of people evacuated from route s at demand point by the t-th second is as follows:
Suppose is the number of people evacuated through route by the t-th second, and the matrix of the number of people evacuated by each path between demand point and shelter by the t-th second is as follows:
where:
Furthermore, the number of evacuees received by each shelter until the t-th second is as follows:
When , shelter reaches the upper limit of its capacity. At this point, and are defined as follows:
When all , the evacuation ends, and the time t at this point is the evacuation completion time. Then, the time t taken for all people evacuated to shelter to complete the evacuation is the longest evacuation time among all the routes leading to . Let be the time it takes for all the evacuees to complete the evacuation through route , and the following time matrix is established:
where:
Suppose the set , ; the time it takes for all the evacuees in shelter to complete the evacuation can then be calculated as follows:
Finally, the number of remaining non-evacuated evacuees at demand point is as follows:
According to all the functions listed previously, the following information can be obtained: (1) the condition of the shelter capacity limitation, the number of people evacuated on each route between each demand point and several nearby shelters, and the time taken to complete the evacuation; (2) after a shelter reaches its maximum capacity, the number of evacuees from different demand points and the time it takes to complete the evacuation of all people who go to the shelter (the time when the shelter stops receiving evacuees); (3) the final status of each demand point, i.e., how many people remain non-evacuated.
5. Results
5.1. Urban-Scale Evacuation Simulation
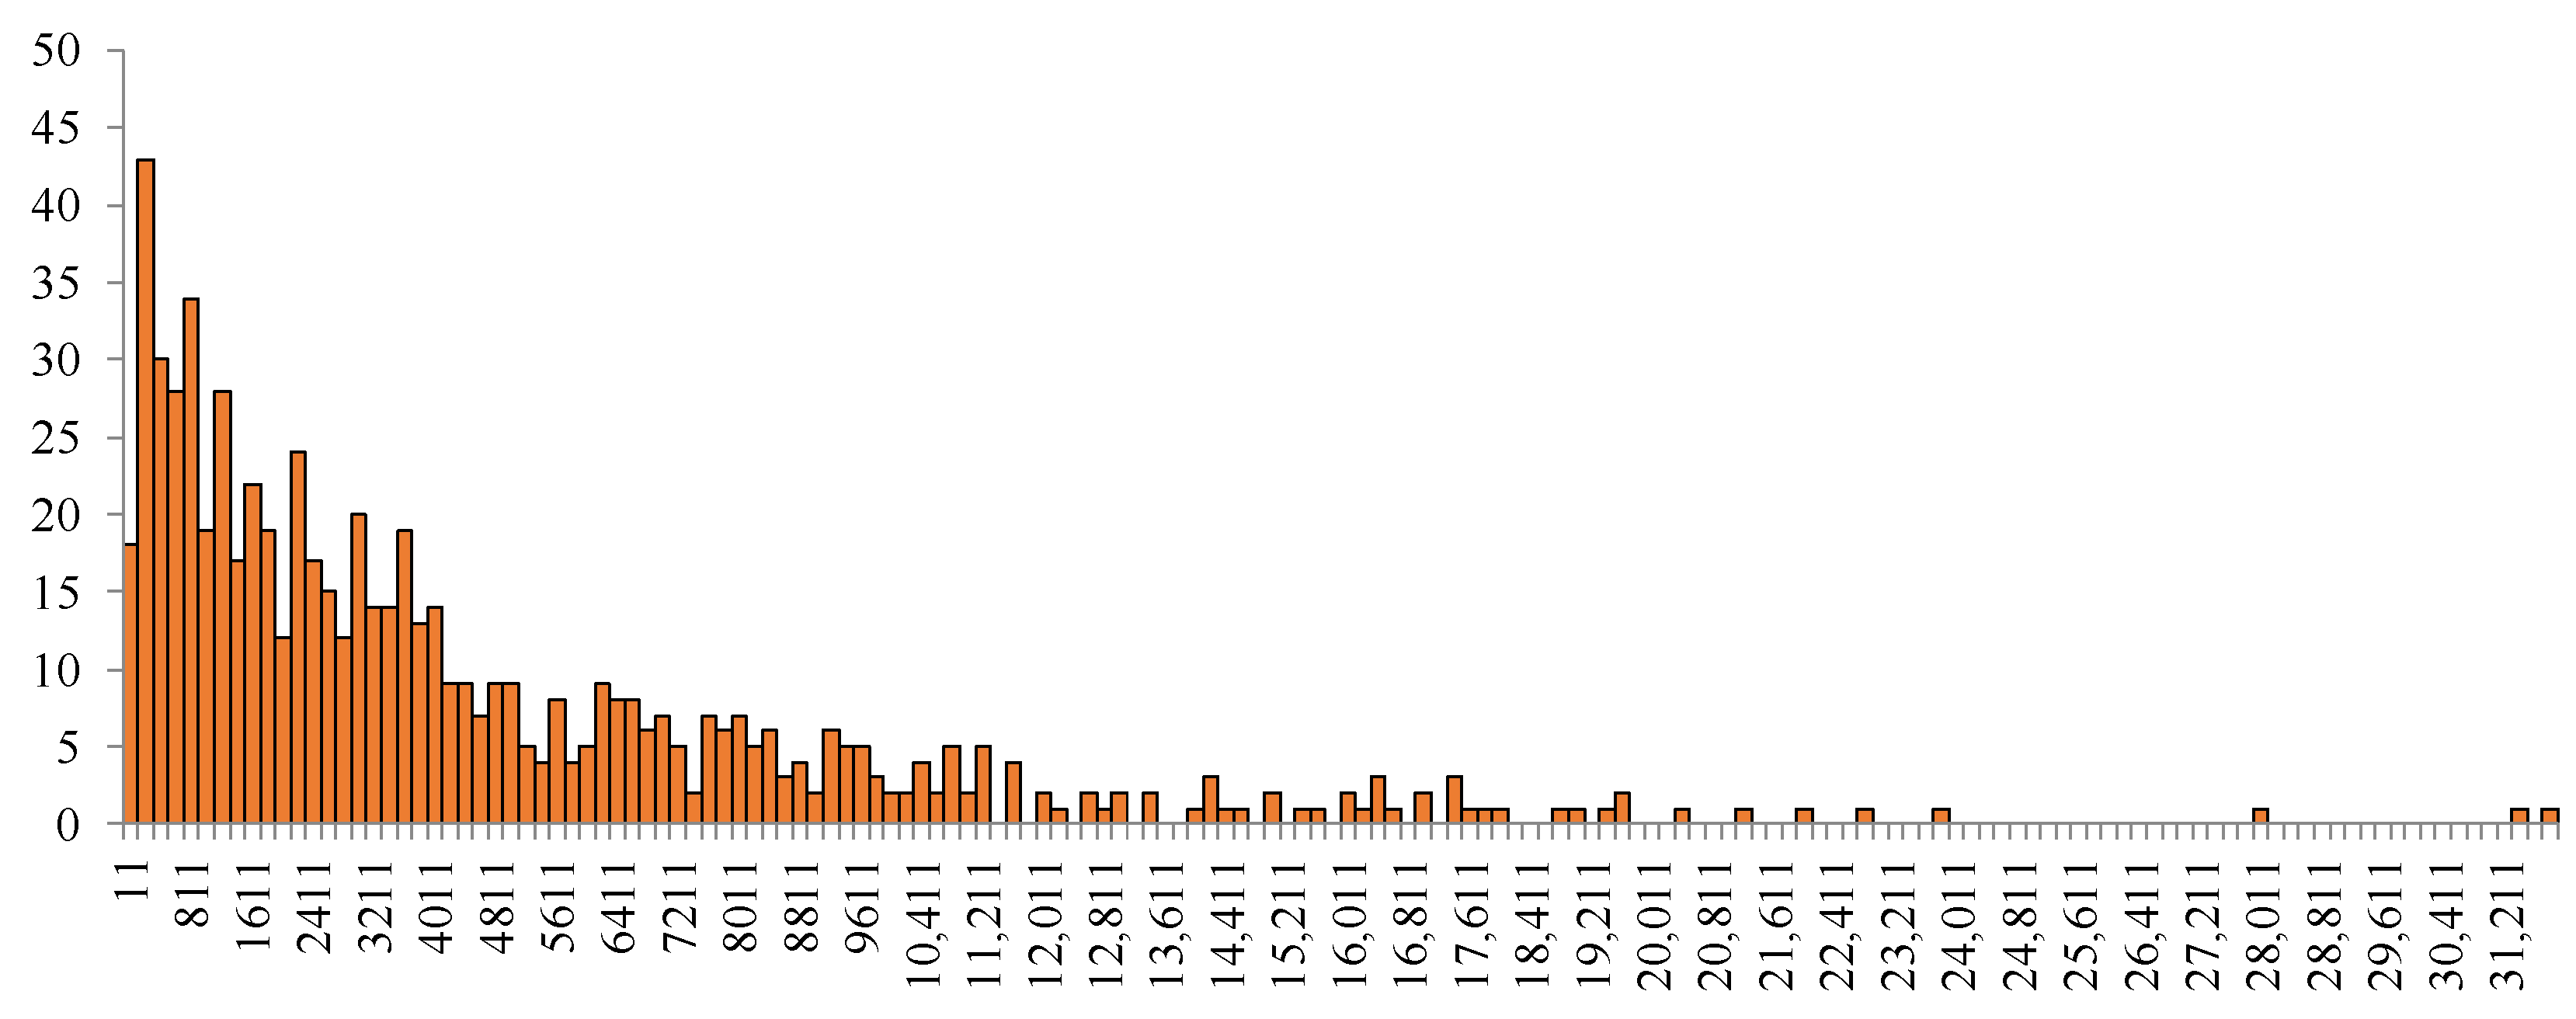
Table 2 presents detailed data regarding the situation of the demand points after evacuation simulation under the condition of short-term fixed shelter capacity constraints, including the number of people evacuated to each target shelter and the time spent evacuating, the number of people evacuated, and the number of remaining non-evacuated people who had not been evacuated at each demand point. The statistics reveal that, among the 2334 demand points, 1654 were completely evacuated, and the remaining 680 were not completely evacuated. The average number of remaining non-evacuated people at each demand point was approximately 4396, and the frequency distribution of the number of non-evacuated people is shown in Figure 5. In terms of the frequency distribution interval of the evacuation time, the average evacuation time for all the evacuated people entering the shelters was 10.3 min, the shortest evacuation time was within 1 min, and the longest was approximately 3 h.
Table 3 reports detailed information regarding the status of the short-term fixed shelters after the evacuation simulation under capacity constraints, including the number of people that the shelter could still accommodate, the time it took until the shelter stopped allocating evacuees (the evacuees that were received in the shelter and those that were on the route to the shelter that reached the upper limit of its capacity), and the time it took for the shelter to be full (the time at which all the evacuees on the route had entered the shelters and there were no evacuees left on the route). The statistics show that, of the 888 short-term fixed shelters, only 218 did not reach their maximum capacity, accounting for 24.55%. For the shelters that reached full capacity, the average time that passed before people were no longer evacuated to the shelter was approximately 5 min, and the average time it took for the shelters to reach their maximum capacity was approximately 14.6 min.
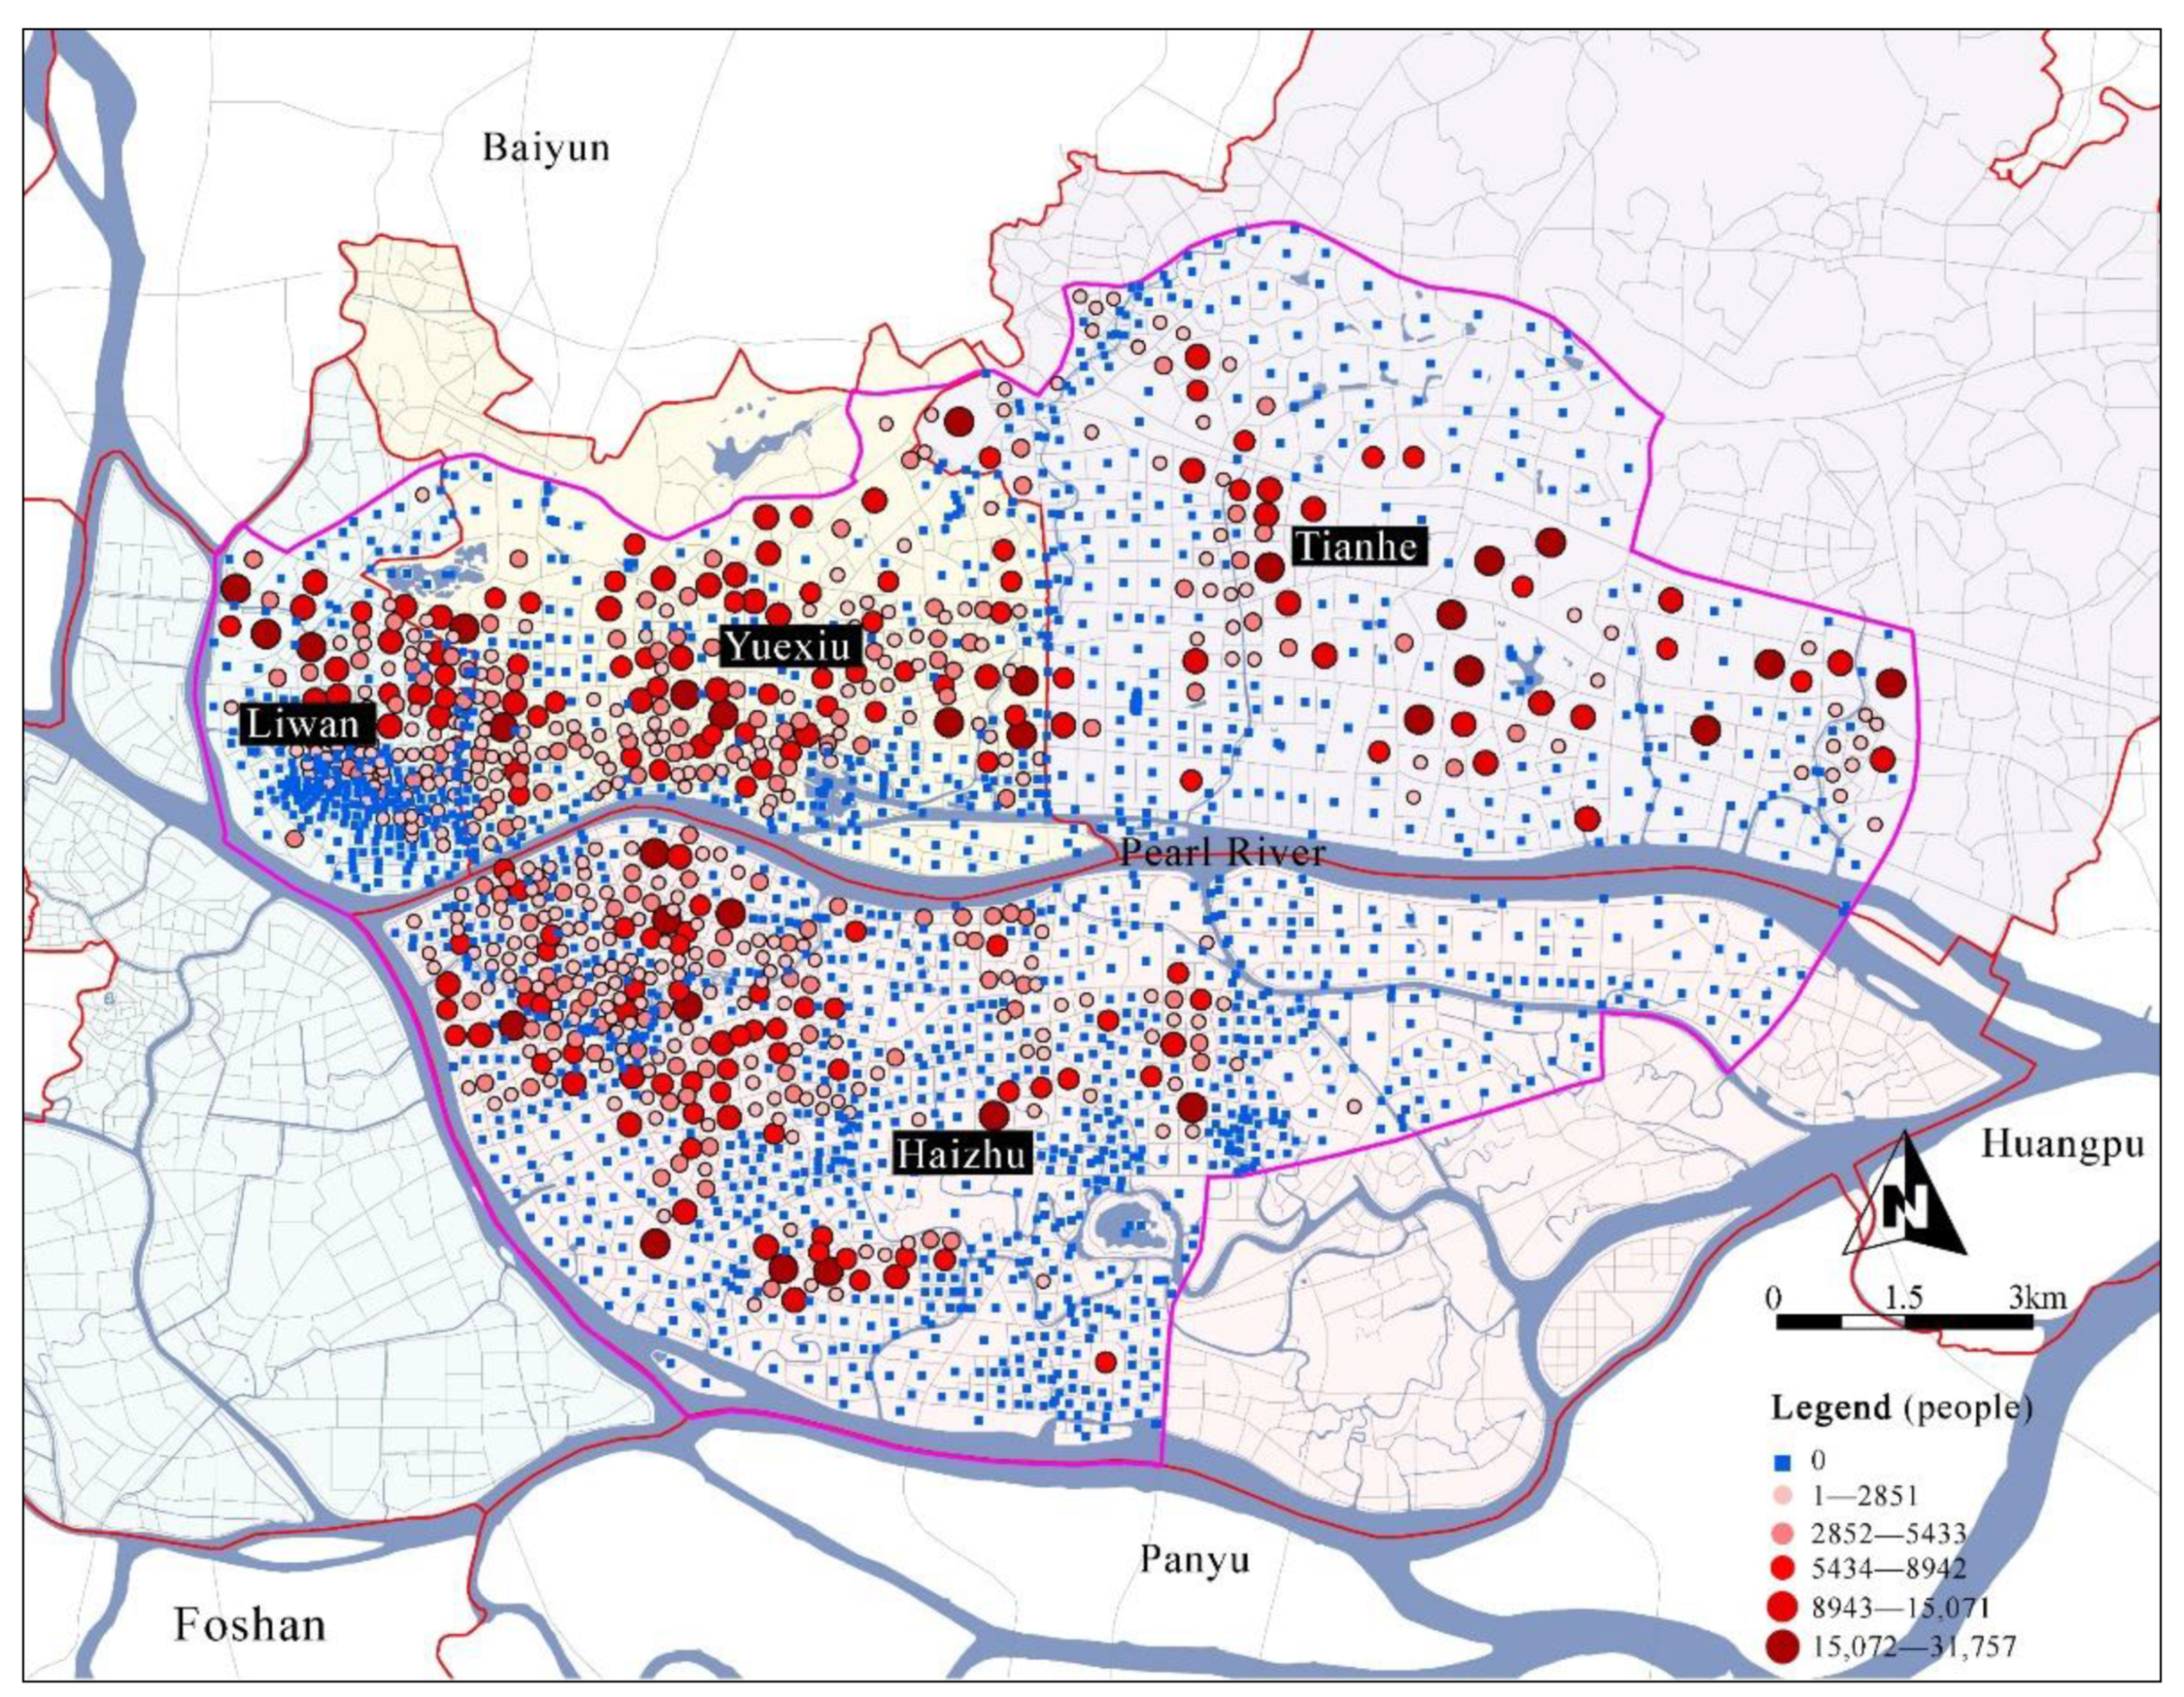
The distribution of the remaining non-evacuated people at the demand points (in the context of short-term fixed sheltering) is presented in Figure 6. In general, the four districts were distributed with demand points that were not completely evacuated, although Yuexiu and Liwan (the old urban areas) had more. It can be seen from Table 4 that, in the context of short-term fixed sheltering, Haizhu had the largest number of remaining non-evacuated people (approximately 1.11 million), followed by Yuexiu, Tianhe, and Liwan; the average number of remaining non-evacuated people at the demand points in Yuexiu was the largest (2184). The maximum number of remaining non-evacuated people among the demand points in all four districts was considerable, and that of Haizhu was the largest. The status of the demand points in the context of emergency sheltering was similar to that in the context of short-term fixed sheltering. The scale and distribution of the remaining non-evacuated people at the demand points can provide a quantitative basis for the spatial optimization of various types of emergency shelters.
5.2. Spatial Optimization of Emergency Shelters
Table 5 presents detailed information regarding the spatial optimization of short-term fixed shelters, including the number of remaining non-evacuated people that were allocated to each route and the time spent evacuating, as well as the effective shelter area that should be provided by each target plot. The statistics show that the average time that was spent on allocating the non-evacuated people for all routes was approximately 15.9 min, and the average number of non-evacuated people that were allocated to a route was approximately 1047. When the 757 target plots had received all the remaining non-evacuated people from the nearby incompletely evacuated demand points, the average time that had passed was approximately 23.4 min. This long duration was caused by the large number of people remaining at some points. The average number of people that were allocated to the target plots was approximately 4537, and most of the plots should provide an effective shelter area of more than 5000 m2. The calculation of the model for the spatial optimization of the temporary shelters reveals that the average time that was spent on all the routes was approximately 13.5 min, and the average number of non-evacuated people that were allocated to the routes was approximately 1307. When the 772 target plots had received all the remaining non-evacuated people from the nearby incomplete evacuation demand points, the average time that had passed was approximately 22.2 min. The average number of people that were allocated to the target plots was approximately 4130, and most of the plots should provide an effective shelter area of more than 4000 m2.
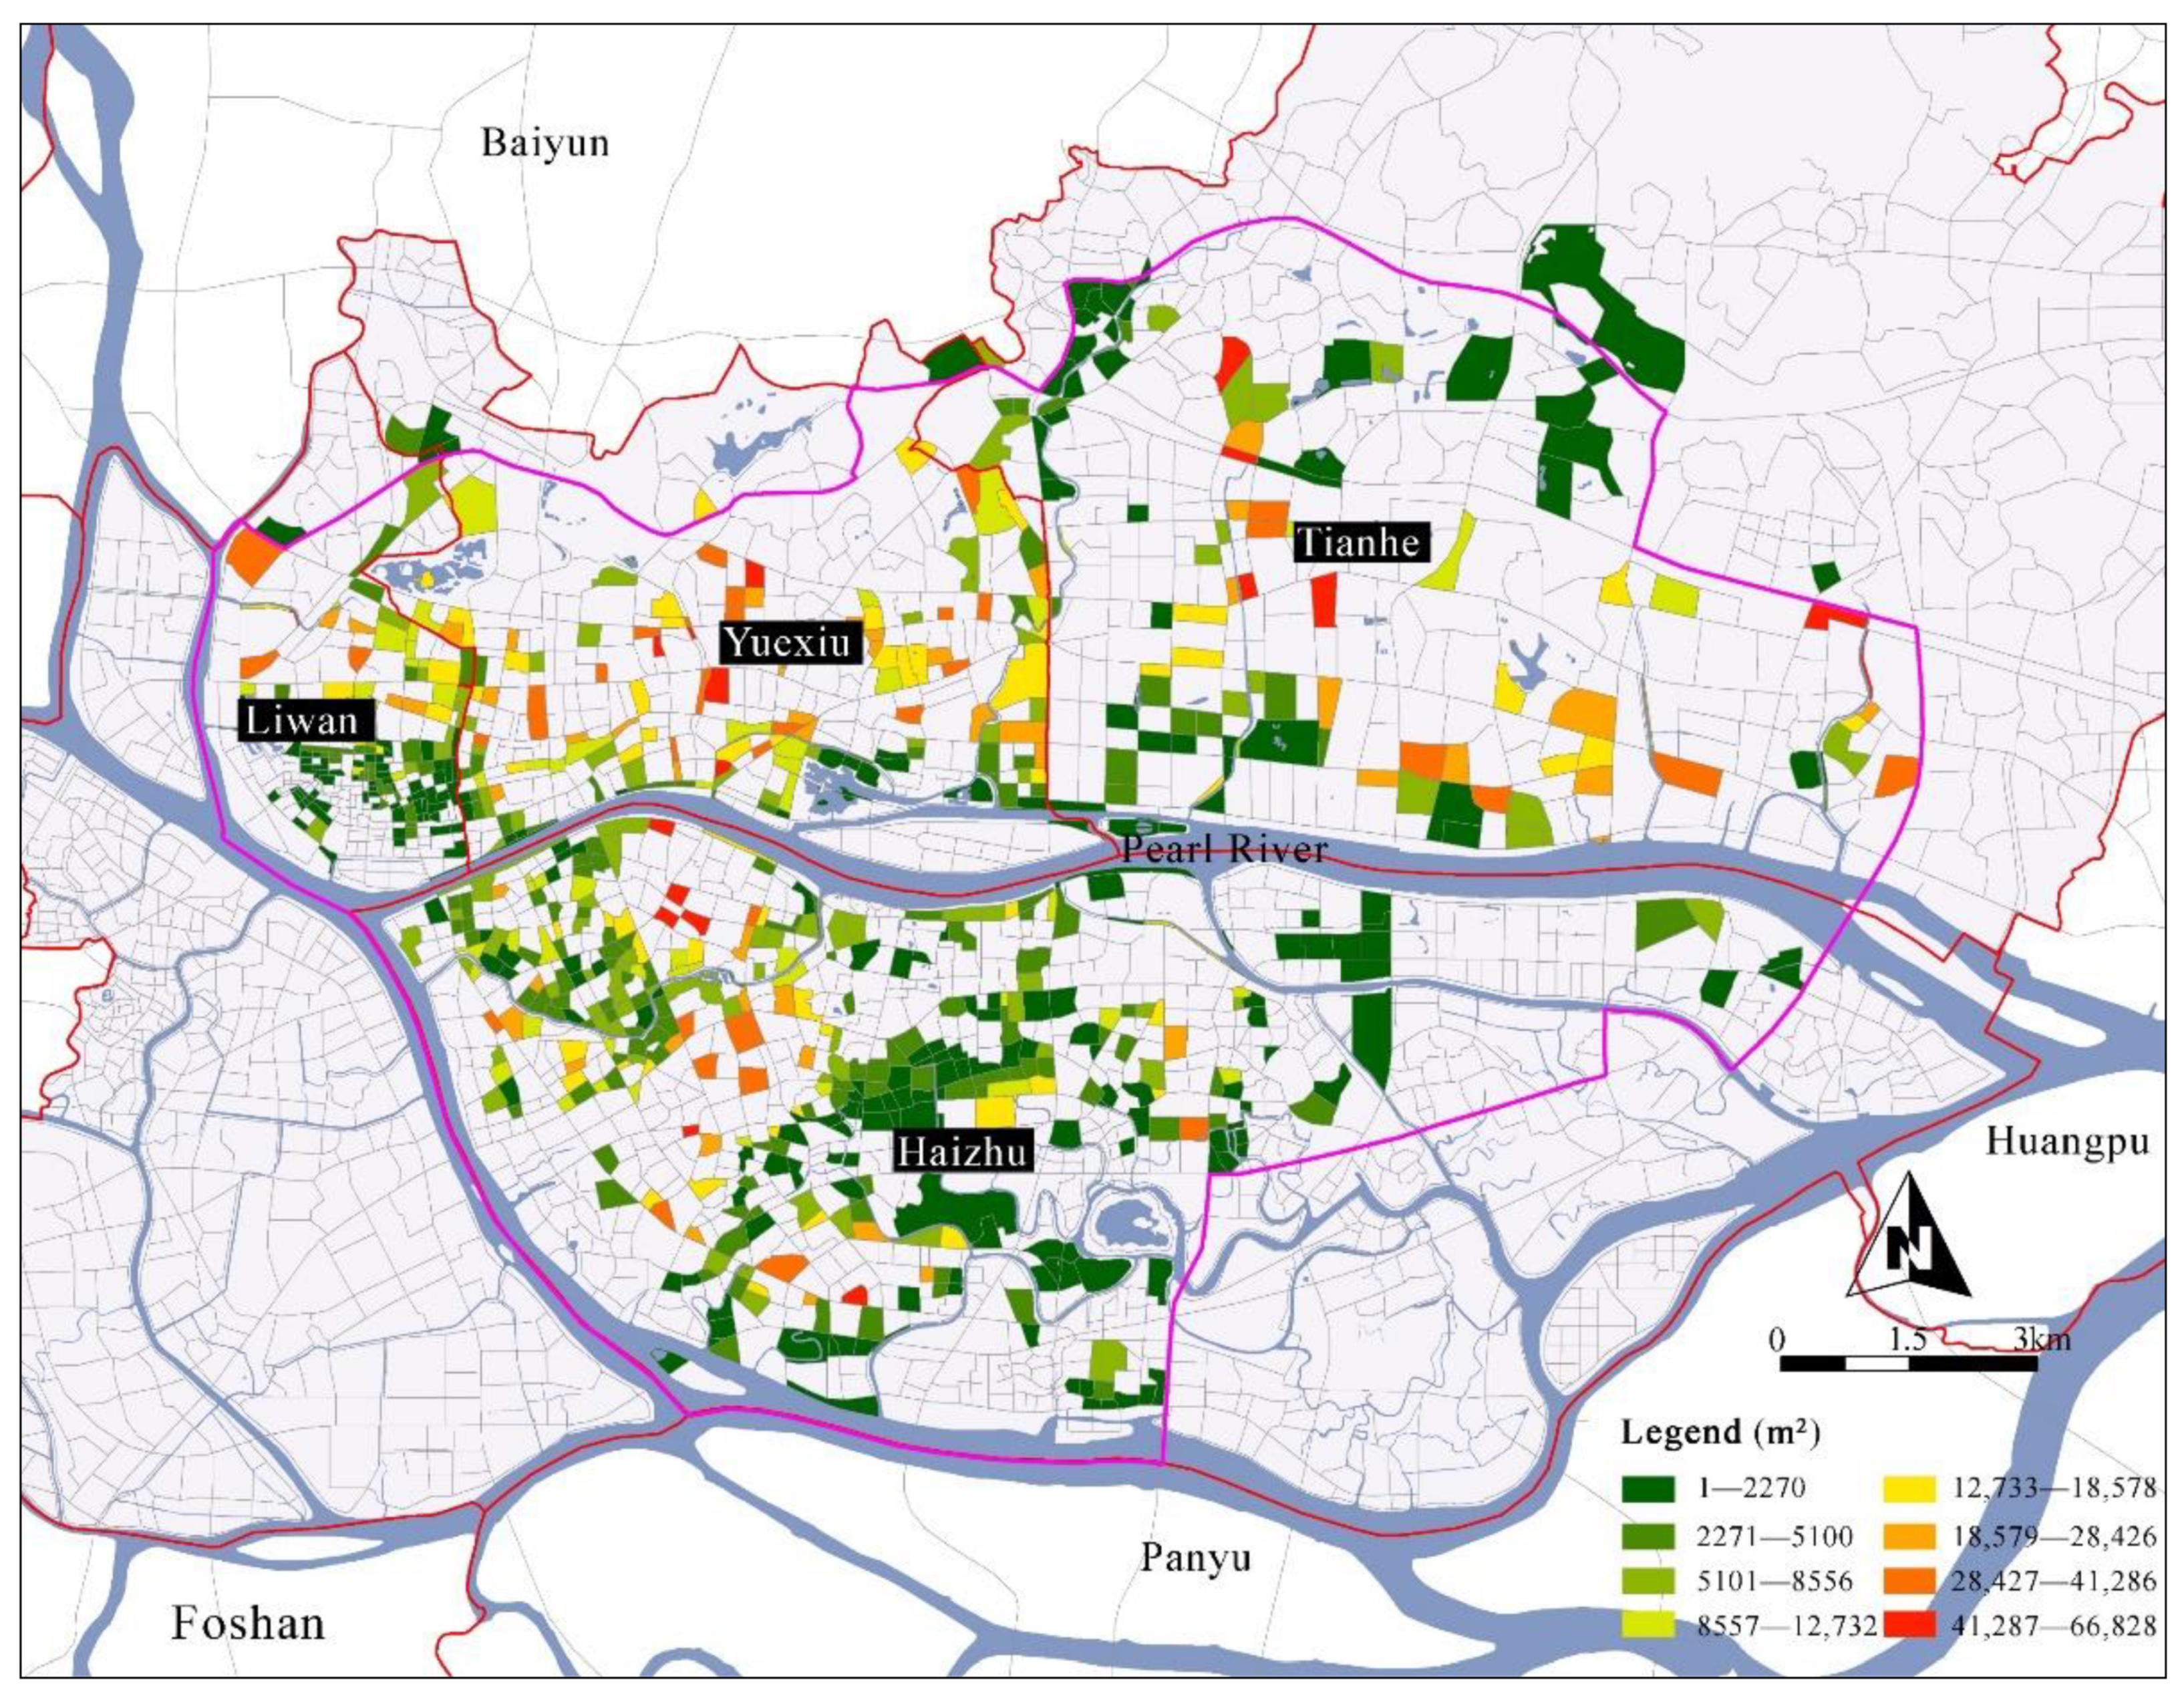
When comparing the effective area of the short-term fixed shelters with the effective area of the temporary shelters that the plot should provide, the maximum of the two is the effective shelter area that the plot should ultimately provide. The distribution and scale of the spatial optimization of the emergency shelters on the target plots are shown in Figure 7, from which it is evident that each district should considerably increase the scale of shelters. The numbers of target plots that should be added for newly available shelter resources in Haizhu, Yuexiu, Liwa, and Tianhe are, respectively, 406, 164, 141, and 136, with effective shelter areas of 2,621,100, 2,175,300, 812,100, and 1,344,600 m2, respectively. Moreover, the average newly added effective shelter areas of the plots for Haizhu, Yuexiu, Liwa, and Tianhe were found to be 6456, 13,264, 5759, and 9886 m2, respectively.
Based on the newly added effective shelter area of the target plot, and combined with the supply and demand status of the short-term fixed shelters and temporary shelters after the evacuation simulation, the spatial optimization target for the shelters on each plot was divided into two types, namely fixed and temporary shelters (Table 6). A total of 487 short-term fixed shelters and 360 temporary shelters were newly added. Recommendations regarding the different types of shelters are helpful for the allocation of targeted emergency facilities during the construction of shelters, as well as for the avoidance of unnecessary waste. Based on the statistics per district (Table 7), the recommended numbers of new short-term fixed shelters in Haizhu, Liwan, Tianhe, and Yuexiu are, respectively, 243, 70, 58, and 116, with average effective areas of 6169, 5577, 8707, and 12,931 m2, respectively. Moreover, the recommended numbers of newly added temporary shelters are, respectively, 163, 71, 78, and 48, and the average effective areas are 2706, 2581, 4017, and 6234 m2, respectively. The maximum effective shelter area of a single resource for the two types of shelters is relatively large, with an average of 46,417 m2.
6. Discussion
Human behavior and psychology are important research directions in the field of sociology, and this is also the case in the field of disaster prevention. Numerous studies have explored evacuation decision making, evacuation groups, evacuation behavior, psychology, etc., and have achieved rich results. In a disaster, people will decide to evacuate or to take refuge in a place which is usually closely related to the individual’s disaster experience and judgment of the disaster situation. For evacuated groups, such as the elderly, children, and people with limited mobility, evacuation is full of challenges: the evacuation speed will not be very fast, and the evacuation efficiency may be relatively low. After a disaster occurs, people will be evacuated outside as soon as possible. According to the disaster situation, evacuation options such as walking, taking public transportation, and driving may appear simultaneously, which will have a certain impact on the calculation of the evacuation time. Previous studies have shown that people tend to stay with friends or family members or to evacuate together when a disaster occurs, which has an impact on the organization of an evacuation. These factors were not considered in the present study, which is mainly because this study set out to explore the increase in available resources for emergency shelters from the scope of disaster prevention planning, as well as the optimization of the spatial structure of urban disaster prevention. From the perspective of realizing an evacuation simulation, complex evacuation behaviors and psychology were not considered in this study; this helped to reduce evacuation interference, and ultimately greatly reduced the evacuation complexity. However, the subject of an evacuation is people. Therefore, it is necessary to note some considerations from a sociological perspective in relation to evacuation so that more discoveries can be obtained. Based on big data, the use of machine learning, artificial intelligence, and other technical methods can enable new explorations of complex evacuation behavior and psychology.
In the evacuation simulation, the plots containing the evacuees and the shelters that can accommodate the evacuees were simplified as points, meaning that the evacuation simulation became a point-to-point multi-target allocation problem. The next difficulty was to determine the corresponding relationship and path between the demand points and shelters. In the simulation, the shelter demand was located at the geometric center of the plot. When the evacuation began, people moved from this geometric center to several shelters within a certain distance nearby. One shortcoming is that the distance and time required for people to evacuate from the inside to the outside of a building were ignored, which simplified the evacuation process and led to underestimations of both the distance and time. In addition, for the selection of road exits from the demand point to the city, the nearness principle was adopted, i.e., the side that was closest to the city road was selected as the demand point to start the evacuation, and people started to evacuate along a path that was perpendicular to the city road. Furthermore, for the convenience of calculation, only one route was set up for each demand point to connect to the city road. In the simulation model design, the simulation was set to follow the established parameters for evacuation. The dynamic evacuation process was statistically set for the entire simulation, which affected the evacuation time and the calculation of the point-to-point evacuation personnel scale to a certain extent. Because this study was based on an urban-scale evacuation simulation, it is difficult to ensure high accuracy. Moreover, from the perspective of the calculation and data basis, it is impossible to realize an evacuation simulation of individuals under the condition of free path selection, although this could be explored in a smaller-scale area.
The urban road network is a system full of uncertainties when disasters occur. In an earthquake scenario, buildings and other structures may collapse, which will affect (or even interrupt) road traffic. The movement of the crowd on the evacuation route may be congested, thereby affecting the evacuation speed. After the path is accidentally blocked, people may also take refuge in other nearby shelters. In this case, the entire evacuation plan will undergo continuous dynamic changes, resulting in changes to the scale and routes of evacuees from demand points to shelters. The original data for urban roads were double lines without the road width information, and were set as single lines in the simulation. Therefore, the sidewalk width was averaged according to the road level, which affected the evacuation capacity of the road to a certain extent. Even when a disaster occurs, urban traffic must maintain normal operation, meaning that the signal lights will delay the evacuation process and the evacuation time may consequently be underestimated. For an evacuation simulation in this type of complex environment, a large amount of data is required, and urban-scale modeling is difficult to achieve; however, the development of big data application technology provides support in solving these problems.
In the spatial optimization of emergency shelters, a basic consideration is that the existing land plots with available resources for shelters will no longer consider the allocation of the remaining non-evacuated people from the incomplete evacuated demand points (regardless of site expansion factors), and such plots can no longer provide new facilities or be used as targets for the optimization of emergency shelters. More realistically, it is necessary to investigate the potential of the current urban land, find plots that can be changed in terms of their function, and mark them as potential target plots for spatial optimization to participate in the model calculation. In addition, in the actual urban renewal and development process, the potential of plots will change. Therefore, if certain conditions are met, a dynamic up-to-date database of urban buildings and land should be established to provide data references for the optimization of shelters. The basic principle of spatial optimization is to realize the redistribution of non-evacuated people. This is accompanied by the problem that the continuous improvement of the shelter facility network is to serve the residents, and people are simultaneously flowing and changing; these changes should also be reflected in the spatial optimization of shelters in the future. For urban science, it is difficult to accurately measure the size and spatial distribution of people, although the development of big data provides the possibility for this, and the use of POI data to estimate the spatial distribution of the population in this study is a novel attempt at doing so. In the future, to continuously optimize the spatial distribution of emergency shelters, continuous and real-time mobile phone signaling data can be considered as the data basis for shelter demand assessment.
The evacuation simulation and spatial optimization of emergency shelters involve complex conditions and numerous influencing factors. This study analyzed the supply and demand status of emergency shelters using an urban-scale evacuation model. The results provide a quantitative basis for the spatial optimization of shelters; however, there remains a gap between evacuation organization in real and simulated disaster environments. Due to the numerous and complex variables of evacuation activities after disasters (such as evacuation efficiency, physical obstacles, secondary disasters, human behavior, psychology, etc.), this has always been a difficult subject in the related practice and research fields. Therefore, to realize an evacuation simulation at the urban scale, the model parameters and assumptions in this study were simplified to varying degrees, which had a certain impact on the results. However, from the perspective of providing a quantitative analysis basis for urban disaster prevention planning, this research provides a practical reference.
7. Conclusions
The construction of emergency shelters is of great significance to the formation of a complete network of disaster relief facilities. With the goal of day and night disaster prevention, based on the data of POIs, residential units with household attributes, building distributions, and road networks, short-term fixed shelters were taken as the object of the present study, and an evacuation simulation model and spatial optimization model were designed using the Python language. Then, the supply and demand status of the shelters was analyzed, and further suggestions were proposed regarding the spatial optimization of shelters. According to the evacuation simulation under the restriction of the shelter capacity, 680 demand points out of 2334 were not completely evacuated, of which the average number of remaining non-evacuated people at each demand point was approximately 4396, and the average evacuation time for all the evacuated people was approximately 10.3 min. Moreover, of the 888 short-term fixed shelters, only 218 did not reach their maximum capacity. Regarding the shelters that reached maximum capacity, the average time that passed before the shelter stopped receiving people was 5 min, and the shelters reached their maximum capacity after 14.6 min. In the context of short-term fixed sheltering, Haizhu had the largest scale of remaining non-evacuated people (1.11 million), and the average number of remaining non-evacuated people was the largest in Yuexiu, namely 2184. According to the results of the spatial optimization of the shelters, the number of target plots for new shelter resources in Haizhu, Yuexiu, Liwa, and Tianhe should, respectively, be increased by 406, 164, 141, and 136, with effective shelter areas of 2,621,100, 2,175,300, 812,100, and 1,344,600 m2, respectively. Furthermore, the average newly added effective shelter areas of the plots for Haizhu, Yuexiu, Liwa, and Tianhe were found to be 6456, 13,264, 5759, and 9886 m2, respectively. Finally, a total of 487 short-term fixed shelters and 360 temporary shelters were newly added. Recommendations for different types of shelters are helpful for the allocation of targeted emergency facilities during the construction of shelters. Based on the statistics per district, the recommended numbers of new short-term fixed shelters in Haizhu, Liwan, Tianhe, and Yuexiu are, respectively, 243, 70, 58, and 116, with average effective areas of 6169, 5577, 8707, and 12,931 m2, respectively. Additionally, the recommended numbers of newly added temporary shelters in Haizhu, Liwan, Tianhe, and Yuexiu are, respectively, 163, 71, 78, and 48, with average effective areas of 2706, 2581, 4017, and 6234 m2, respectively. In any case, the supply and demand of the shelters in the study area are imbalanced; in other words, the service of shelters has blind spots, which makes it impossible to provide refuge for all residents when a disaster occurs. The findings of this study act as a direct quantitative basis for the spatial optimization of various types of emergency shelters, and as a reference for the improvement of the network of urban disaster prevention facilities in future urban planning.
As mentioned in the discussion, in the evacuation simulation and spatial optimization, some conditions and the model environment were simplified. In a real disaster scenario, numerous complex variables exist in the evacuation process (such as secondary disasters, interruption of roads, physical obstacles, behavior, and psychology), which are difficult to quantify in a model. In the spatial optimization of emergency shelters, the population distribution and the potential of urban land use are crucial points. Therefore, the analysis of the temporal and spatial distributions of the population based on big data and a database of the construction of urban land potential is necessary. Based on feasibility, in addition to constructing a model that is as close as possible to real disaster conditions and improving the technical methods for optimizing the spatial distribution of shelters, an online management system for emergency shelters will be explored in the future.
Author Contributions
Conceptualization, W.C. and Y.S.; Data curation, W.C., W.W., and C.W.; Methodology, W.C., W.W., and W.L.; Programming, W.C. and W.W.; Writing—original draft preparation, W.C. and W.L.; Writing—review and editing, W.C. and W.W.; Visualization, W.C. and C.W.; Supervision, Y.S. and W.L.; Project administration, W.C. and Y.S.; Funding acquisition, W.C., W.W., and W.L. All authors have read and agreed to the published version of the manuscript.
Funding
National Natural Science Foundation of China (Grant Nos. 52108053 and 42001237); Natural Science Foundation of Jiangsu Province (Grant No. BK20200762); Social Science Foundation of Jiangsu Province (Grant No. 20ZZC001); University Natural Science Research Project of Jiangsu Province (Grant No. 20KJB560024); University Social Science Research Project of Jiangsu Province (Grant No. 2020SJA0098); Foundation of Jiangsu Provincial Double-Innovation Doctor Program (Grant No. CZ032SC20003); NUPTSF (Grant No. NYY220005); Natural Science Foundation of Zhejiang Province (Grant No. LQ20D010002); Social Science Foundation of Anhui Province (Grant No. AHSKQ2021D10).
Institutional Review Board Statement
Not applicable.
Informed Consent Statement
Not applicable.
Acknowledgments
The authors would like to thank the editor and anonymous reviewers who read the paper and provided helpful comments for improvements.
Conflicts of Interest
The authors declare no conflict of interest.
References
- UNDRR. The Human Cost of Disasters: An Overview of the Last 20 Years (2000–2019). Available online: https://www.preventionweb.net/files/74124_humancostofdisasters20002019reportu.pdf (accessed on 4 August 2021).
- Munich Re. Record Hurricane Season and Major Wildfires: The Natural Disaster Figures for 2020. Available online: https://www.munichre.com/en/company/media-relations/media-information-and-corporate-news/media-information/2021/2020-natural-disasters-balance.html (accessed on 8 July 2021).
- Davis, I. What have we learned from 40 years’ experience of disaster shelter? Environ. Hazards 2011, 10, 193–212. [Google Scholar] [CrossRef]
- Tsai, C.; Chen, C.; Chiang, W.; Lin, M. Application of geographic information system to the allocation of disaster shelters via fuzzy models. Eng. Comput. 2008, 25, 86–100. [Google Scholar] [CrossRef]
- Trivedi, A.; Singh, A. A hybrid multi-objective decision model for emergency shelter location-relocation projects using fuzzy analytic hierarchy process and goal programming approach. Int. J. Proj. Manag. 2017, 35, 827–840. [Google Scholar] [CrossRef]
- Gama, M.; Santos, B.F.; Scaparra, M.P. A multi-period shelter location-allocation model with evacuation orders for flood disasters. EURO J. Comput. Optim. 2016, 4, 299–323. [Google Scholar] [CrossRef]
- Geng, S.; Hou, H.; Zhou, Z. A hybrid approach of VIKOR and Bi-objective decision model for emergency shelter location-allocation to respond to earthquakes. Mathematics 2021, 9, 1897. [Google Scholar] [CrossRef]
- Paul, B.K. Factors affecting evacuation behavior: The case of 2007 cyclone Sidr, Bangladesh. Prof. Geogr. 2012, 64, 401–414. [Google Scholar] [CrossRef]
- National Center for Supercomputing Applications and Mid America Earthquake Center. ERGO-EQ Platform for Multi-Hazard Assessment, Response, and Planning. Available online: http://ergo.ncsa.illinois.edu/?page_id=44 (accessed on 15 July 2021).
- FEMA. Hazus Technical and User’s Manuals. Available online: https://www.fema.gov/media-library/assets/documents/24609?id=5120 (accessed on 15 July 2021).
- Masuya, A.; Dewan, A.; Corner, R.J. Population evacuation: Evaluating spatial distribution of flood shelters and vulnerable residential units in Dhaka with geographic information systems. Nat. Hazards 2015, 78, 1859–1882. [Google Scholar] [CrossRef]
- Chen, W.; Fang, Y.; Zhai, Q.; Zhang, Y. Assessing emergency shelter demand using POI data and evacuation simulation. ISPRS Int. Geo-Inf. 2020, 9, 41. [Google Scholar] [CrossRef] [Green Version]
- Bayram, V.; Yaman, H. Shelter location and evacuation route assignment under uncertainty: A benders decomposition approach. Transp. Sci. 2018, 52, 416–436. [Google Scholar] [CrossRef]
- Briggs, D.J.; Gulliver, J.; Fecht, D.; Vienneau, D.M. Dasymetric modelling of small-area population distribution using land cover and light emissions data. Remote Sens. Environ. 2007, 108, 451–466. [Google Scholar] [CrossRef]
- Mao, Y.; Ye, A.; Xu, J. Using land use data to estimate the population distribution of China in 2000. GIScience Remote Sens. 2012, 49, 822–853. [Google Scholar] [CrossRef]
- Vecere, A.; Monteiro, R.; Ammann, W.J.; Giovinazzi, S.; Melo Santos, R.H. Predictive models for post disaster shelter needs assessment. Int. J. Disaster Risk Sci. 2017, 21, 44–62. [Google Scholar] [CrossRef]
- Sugimoto, T.; Murakami, H.; Kozuki, Y.; Nishikawa, K.; Shimada, T. A human damage prediction method for tsunami disasters incorporating evacuation activities. Nat. Hazards 2003, 29, 587–602. [Google Scholar] [CrossRef]
- Yazici, M.A.; Ozbay, K. Impact of probabilistic road capacity constraints on the spatial distribution of hurricane evacuation shelter capacities. Transp. Res. Rec. J. Transp. Res. Board 2007, 2022, 55–62. [Google Scholar] [CrossRef]
- Tenerelli, P.; Gallego, J.F.; Ehrlich, D. Population density modelling in support of disaster risk assessment. Int. J. Disaster Risk Reduct. 2015, 13, 334–341. [Google Scholar] [CrossRef]
- Yu, J.; Wen, J. Multi-criteria satisfaction assessment of the spatial distribution of urban emergency shelters based on high-precision population estimation. Int. J. Disaster Risk Sci. 2016, 7, 413–429. [Google Scholar] [CrossRef] [Green Version]
- Chen, Z.; Chen, X.; Li, Q.; Chen, J. The temporal hierarchy of shelters: A hierarchical location model for earthquake-shelter planning. Int. J. Geogr. Inf. Sci. 2013, 27, 1612–1630. [Google Scholar] [CrossRef]
- Zhang, X.; Yu, J.; Chen, Y. Supply-demand analysis of urban emergency shelters based on spatiotemporal population estimation. Int. J. Disaster Risk Sci. 2020, 4, 519–537. [Google Scholar] [CrossRef]
- Yamada, T. A network flow approach to a city emergency evacuation planning. Int. J. Syst. Sci. 1996, 27, 931–936. [Google Scholar] [CrossRef]
- Zhou, T.; Wang, D.; Zong, D.; He, X. The Study of the responsibility space regionalization of emergency shelters in the urban center and the evaluation of evacuation road based on microscope computer simulation—A Case of Chongqing Three Gorges Square Area. Disaster Adv. 2012, 5, 230–236. [Google Scholar]
- Filipe, J.; Kacprzyk, J. Evacuation simulation with limited capacity sinks: An evolutionary approach to solve the shelter allocation and capacity assignment problem in a multi-agent evacuation simulation. In Proceedings of the International Conference on Evolutionary Computation (ICEC 2010), Valencia, Spain, 24–26 October 2010. [Google Scholar]
- Lee, J.; Hong, W. Estimating evacuation speed by slope of evacuation path for assessment of adequate shelter location in water disasters. Asia Life Sci. 2015, 12, 435–446. [Google Scholar]
- Yu, J.; Wen, J.; Jiang, Y. Agent-based evacuation simulation for spatial allocation assessment of urban shelters. In Proceedings of the International Conference on Intelligent Earth Observing and Applications (IEOAs), Guilin, China, 23–24 October 2015. [Google Scholar]
- Yuan, S.; Chun, S.A.; Spinelli, B.; Liu, Y.; Zhang, H.; Adam, N.R. Traffic evacuation simulation based on multi-level driving decision model. Transp. Res. Part C: Emerg. Technol. 2017, 78, 129–149. [Google Scholar] [CrossRef]
- Wang, L. A two-stage stochastic programming framework for evacuation planning in disaster responses. Comput. Ind. Eng. 2020, 145, 106458. [Google Scholar] [CrossRef]
- Godschall, S.; Smith, V.; Hubler, J.; Kremer, P. A decision process for optimizing multi-hazard shelter location using global data. Sustainability 2020, 12, 6252. [Google Scholar] [CrossRef]
- Chen, C.; Cheng, L. Evaluation of seismic evacuation behavior in complex urban environments based on GIS: A case study of Xi’an, China. Int. J. Disaster Risk Reduct. 2020, 43, 101366. [Google Scholar] [CrossRef]
- Lee, H.; Chen, H. Social determinants in choice of shelter: An evidence-based analysis. Nat. Hazards 2018, 93, 1277–1294. [Google Scholar] [CrossRef]
- Ma, Y.; Xu, W.; Qin, L.; Zhao, X. Site selection models in natural disaster shelters: A review. Sustainability 2019, 11, 399. [Google Scholar] [CrossRef] [Green Version]
- Ng, M.; Park, J.; Waller, S.T. A hybrid bilevel model for the optimal shelter assignment in emergency evacuations. Comput.-Aided Civ. Infrastruct. Eng. 2010, 25, 547–556. [Google Scholar] [CrossRef]
- Nappi, M.M.L.; Souza, J.C. Disaster management: Hierarchical structuring criteria for selection and location of temporary shelters. Nat. Hazards 2015, 75, 2421–2436. [Google Scholar] [CrossRef]
- Zhao, X.; Coates, G.; Xu, W. A hierarchical mathematical model of the earthquake shelter location-allocation problem solved using an interleaved MPSO–GA. Geomat. Nat. Hazards Risk 2019, 10, 1712–1737. [Google Scholar] [CrossRef]
- Celik, E. A cause and effect relationship model for location of temporary shelters in disaster operations management. Int. J. Disaster Risk Reduct. 2017, 22, 257–268. [Google Scholar] [CrossRef]
- Sabouhia, F.; Tavakolia, Z.S.; Bozorgi-Amirib, A.; Sheuc, J. A robust possibilistic programming multi-objective model for locating transfer points and shelters in disaster relief. Transp. A 2019, 15, 326–353. [Google Scholar] [CrossRef]
- Junian, J.; Azizifar, V. The evaluation of temporary shelter areas locations using geographic information system and analytic hierarchy process. Civ. Eng. J.-Tehran 2018, 4, 1678–1688. [Google Scholar] [CrossRef]
- Xu, W.; Zhao, X.; Ma, Y.; Li, Y.; Qin, L.; Wang, Y.; Du, J. A multi-objective optimization based method for evaluating earthquake shelter location-allocation. Geomat. Nat. Hazards Risk 2018, 9, 662–677. [Google Scholar] [CrossRef] [Green Version]
- Ertugay, K.; Argyroudis, S.; Duzgun, H.S. Accessibility modeling in earthquake case considering road closure probabilities: A case study of health and shelter service accessibility in Thessaloniki, Greece. Int. J. Disaster Risk Reduct. 2016, 17, 49–66. [Google Scholar] [CrossRef]
- Unal, M.; Uslu, C. GIS-based accessibility analysis of urban emergency shelters: The case of adana city. In Proceedings of the 3rd International GeoAdvances Workshop, Istanbul, Turkey, 16–17 October 2016; pp. 95–101. [Google Scholar]
- Whalen, T.M.; Gopal, S.; Abraham, D.M. Cost-benefit model for the construction of tornado shelters. J. Constr. Eng. Manag. ASCE 2004, 130, 772–779. [Google Scholar] [CrossRef]
- Wei, L.; Li, W.; Li, K.; Liu, H.; Cheng, L. Decision support for urban shelter locations based on covering model. Procedia Eng. 2012, 43, 59–64. [Google Scholar] [CrossRef] [Green Version]
Figure 1.
The research framework.

Figure 2.
A brief principle map for the evacuation simulation.

Figure 3.
The principle of shelter spatial optimization.

Figure 4.
The study area.

Figure 5.
The number of remaining non-evacuated people for each demand point.

Figure 6.
The distribution of non-evacuated people in the context of short-term fixed sheltering.

Figure 7.
The distribution and scale of the spatial optimization of the emergency shelters on the target plots.
Figure 7.
The distribution and scale of the spatial optimization of the emergency shelters on the target plots.


Table 1.
The attributes of the four data types.
| Data Type | Main Data Attributes | N. of Samples |
|---|---|---|
| POI data | Name, category, address, district, coordinates of the facilities | 145,084 |
| Residential unit data | Name, address, coordinates, number of buildings, number of households, property company | 4533 |
| Building distribution data | Number of floors, district, coordinates | 106,051 |
| Road network data | Road grade, road type, length | Line data |
Table 2.
The evacuation time and evacuee information for each demand point after the evacuation simulation.
Table 2.
The evacuation time and evacuee information for each demand point after the evacuation simulation.
| Route ID | Demand Point ID | Shelter Point ID | N. of People on the Route | Evacuation Time (s) | N. of People Evacuated | N. of Non-Evacuated People |
|---|---|---|---|---|---|---|
| … | … | … | … | … | … | … |
| 9331 | 1047 | 1068 | 260 | 489 | 2292 | 3176 |
| 9332 | - | 113 | 88 | 494 | - | - |
| 9333 | - | 1067 | 112 | 520 | - | - |
| 9334 | - | 112 | 628 | 803 | - | - |
| 9335 | - | 1065 | 76 | 533 | - | - |
| 9336 | - | 593 | 272 | 704 | - | - |
| 9337 | - | 1066 | 112 | 655 | - | - |
| 9338 | - | 1062 | 96 | 676 | - | - |
| 9339 | - | 1069 | 164 | 730 | - | - |
| 9340 | - | 595 | 84 | 730 | - | - |
| 9341 | - | 1051 | 244 | 817 | - | - |
| 9342 | - | 1061 | 156 | 837 | - | - |
| 9343 | 1048 | 51 | 56 | 455 | 1880 | 1842 |
| 9344 | - | 52 | 56 | 489 | - | - |
| 9345 | - | 789 | 280 | 668 | - | - |
| 9346 | - | 69 | 28 | 547 | - | - |
| 9347 | - | 585 | 48 | 674 | - | - |
| 9348 | - | 388 | 36 | 731 | - | - |
| 9349 | - | 448 | 28 | 728 | - | - |
| 9350 | - | 70 | 32 | 745 | - | - |
| 9351 | - | 369 | 128 | 822 | - | - |
| 9352 | - | 849 | 944 | 1251 | - | - |
| 9353 | - | 889 | 244 | 912 | - | - |
| ... | ... | ... | ... | … | … |
Table 3.
Information on short-term fixed shelters after evacuation simulation.
| Shelter Point ID | Maximum Capacity | Residual Capacity | Time Until Evacuee Allocation Stopped (s) | Time Until Maximum Capacity Reached (s) |
|---|---|---|---|---|
| 1 | 1720 | 1720 | 0 | 0 |
| 2 | 1224 | 1224 | 0 | 0 |
| 3 | 2005 | 2005 | 0 | 0 |
| 4 | 1571 | 0 | 307 | 987 |
| 5 | 1645 | 0 | 31 | 829 |
| 6 | 1032 | 0 | 15 | 794 |
| 7 | 1685 | 0 | 93 | 481 |
| 8 | 1311 | 0 | 21 | 335 |
| 9 | 6678 | 0 | 107 | 459 |
| 10 | 1557 | 0 | 21 | 671 |
| 11 | 6018 | 6018 | 0 | 0 |
| 12 | 2481 | 2481 | 0 | 0 |
| 13 | 2645 | 2645 | 0 | 0 |
| ... | ... | ... | ... | ... |
Table 4.
Non-evacuated people at the demand points of different evacuation scenes.
| Evacuation Scene | Statistics | Haizhu | Liwan | Tianhe | Yuexiu |
|---|---|---|---|---|---|
| Emergency sheltering | N1 | 953,138 | 321,330 | 897,862 | 947,163 |
| N2 | 818 | 956 | 2206 | 2223 | |
| N3 | 26,372 | 17,045 | 31,848 | 31,661 | |
| Short-term fixed sheltering | N1 | 1,112,254 | 359,612 | 586,861 | 930,511 |
| N2 | 955 | 1070 | 1442 | 2184 | |
| N3 | 31,320 | 17,321 | 28,023 | 31,757 |
Notes: N1 is the total number of non-evacuated people; N2 is the average number of non-evacuated people at the demand points; N3 is the maximum number of non-evacuated people among the demand points.
Table 5.
Detailed information on the spatial optimization of short-term fixed shelters.
| Demand Point ID | Target Plot ID | Route Length (m) | Evacuation Time (s) | NANEP | Increased Effective Shelter Area (m2) |
|---|---|---|---|---|---|
| ... | ... | ... | ... | ... | ... |
| 318 | 9 | 753 | 707 | 406 | 1628 |
| 295 | - | 280 | 393 | 408 | - |
| 297 | 22 | 11 | 117 | 215 | 6582 |
| 295 | - | 179 | 699 | 1155 | - |
| 318 | - | 639 | 1388 | 1921 | - |
| 316 | 32 | 891 | 780 | 368 | 4276 |
| 303 | - | 11 | 367 | 714 | - |
| 306 | - | 203 | 665 | 1056 | - |
| 423 | 34 | 1132 | 876 | 238 | 3734 |
| 368 | - | 692 | 651 | 376 | - |
| 309 | - | 194 | 758 | 1253 | - |
| 282 | 42 | 1016 | 758 | 158 | 3092 |
| 344 | - | 495 | 490 | 317 | - |
| 291 | - | 845 | 741 | 352 | - |
| 424 | - | 919 | 791 | 354 | - |
| 403 | - | 850 | 751 | 365 | - |
| 332 | 47 | 661 | 634 | 382 | 8274 |
| 313 | - | 226 | 469 | 633 | - |
| 303 | - | 180 | 479 | 714 | - |
| 316 | - | 714 | 843 | 729 | - |
| 306 | - | 11 | 849 | 1679 | - |
| ... | ... | ... | ... | ... | ... |
Notes: NANEP is the number of assigned non-evacuated people.
Table 6.
The effective shelter area (ESA) and shelter type after optimization of the target plots.
| Target Plot ID | Increased ESA (Fixed) | Increased ESA (Temporary) | Recommended Increased ESA | Recommended Shelter Type |
|---|---|---|---|---|
| ... | ... | ... | ... | ... |
| 462 | 0 | 4957 | 4957 | temporary |
| 468 | 0 | 1602 | 1602 | temporary |
| 478 | 1824 | 0 | 1824 | temporary |
| 491 | 564 | 297 | 564 | temporary |
| 496 | 0 | 185 | 185 | temporary |
| 512 | 0 | 1278 | 1278 | temporary |
| 549 | 2674 | 837 | 2674 | fixed |
| 587 | 5026 | 331 | 5026 | fixed |
| 594 | 0 | 72 | 72 | temporary |
| 609 | 0 | 1837 | 1837 | temporary |
| 611 | 19,528 | 3568 | 19,528 | fixed |
| 626 | 6268 | 1736 | 6268 | fixed |
| 629 | 0 | 2310 | 2310 | temporary |
| 641 | 944 | 2075 | 2075 | temporary |
| 644 | 52,238 | 46,889 | 52,238 | fixed |
| 652 | 666 | 0 | 666 | temporary |
| 658 | 1730 | 2408 | 2408 | temporary |
| 661 | 14,602 | 2018 | 14,602 | fixed |
| 673 | 2968 | 495 | 2968 | fixed |
| 677 | 3980 | 2422 | 3980 | fixed |
| 682 | 1696 | 277 | 1696 | temporary |
| ... | ... | ... | ... | ... |
Table 7.
Index recommendations for the spatial optimization of emergency shelters.
| Index Recommendation | Haizhu | Liwan | Tianhe | Yuexiu |
|---|---|---|---|---|
| Increased EA of temporary shelters | 1,098,521 | 363,926 | 546,288 | 1,022,414 |
| Increased EA of fixed shelters | 2,504,614 | 786,294 | 1,184,124 | 2,120,760 |
| Recommended EA increase of the shelters | 2,621,070 | 812,084 | 1,344,550 | 2,175,331 |
| Recommended number of fixed shelters | 243 | 70 | 58 | 116 |
| Maximum EA of a single fixed shelter | 52,238 | 55,020 | 56,576 | 66,828 |
| Average EA of fixed shelters | 6169 | 5577 | 8707 | 12,931 |
| Recommended number of temporary shelters | 163 | 71 | 78 | 48 |
| Maximum EA of a single temporary shelter | 46,889 | 24,256 | 31,183 | 38,349 |
| Average EA of temporary shelters | 2706 | 2581 | 4017 | 6234 |
Notes: EA is the effective area (m2).
Publisher’s Note: MDPI stays neutral with regard to jurisdictional claims in published maps and institutional affiliations. |
© 2021 by the authors. Licensee MDPI, Basel, Switzerland. This article is an open access article distributed under the terms and conditions of the Creative Commons Attribution (CC BY) license (https://creativecommons.org/licenses/by/4.0/).
Share and Cite
MDPI and ACS Style
Chen, W.; Shi, Y.; Wang, W.; Li, W.; Wu, C. The Spatial Optimization of Emergency Shelters Based on an Urban-Scale Evacuation Simulation. Appl. Sci. 2021, 11, 11909. https://0-doi-org.brum.beds.ac.uk/10.3390/app112411909
AMA Style
Chen W, Shi Y, Wang W, Li W, Wu C. The Spatial Optimization of Emergency Shelters Based on an Urban-Scale Evacuation Simulation. Applied Sciences. 2021; 11(24):11909. https://0-doi-org.brum.beds.ac.uk/10.3390/app112411909
Chicago/Turabian StyleChen, Wei, Yijun Shi, Wei Wang, Wenjing Li, and Chao Wu. 2021. "The Spatial Optimization of Emergency Shelters Based on an Urban-Scale Evacuation Simulation" Applied Sciences 11, no. 24: 11909. https://0-doi-org.brum.beds.ac.uk/10.3390/app112411909
Note that from the first issue of 2016, this journal uses article numbers instead of page numbers. See further details here.