
Drowning Risk Analysis Comparing Surf Bather Subgroups


1
College of Business, Law and Governance, Bebegu Yumba Campus, James Cook University, 1 James Cook Drive, Douglas, QLD 4815, Australia
2
Department of Forensic Medicine, Victorian Institute of Forensic Medicine, Monash University, 65 Kavanagh Street, Southbank, VIC 3006, Australia
*
Author to whom correspondence should be addressed.
Appl. Sci. 2021, 11(24), 12047; https://0-doi-org.brum.beds.ac.uk/10.3390/app112412047
Submission received: 10 November 2021
/
Revised: 29 November 2021
/
Accepted: 10 December 2021
/
Published: 17 December 2021
(This article belongs to the Special Issue Epidemiology and Public Health in Applied Sciences)
Abstract
:Featured Application
Risk analysis provides a preliminary or alternative method to analytical epidemiological study designs to identify risk factor contributions to injury problems, including drowning, accounting for risk exposure.
Abstract
The study assessed the utility of risk analysis for advancing knowledge on drowning risk factors. The setting was unintentional drowning of surf bathers in Australia. Bathers reported earlier exposure to selected risk factors (swimming ability, wave height associated with rip currents and surf bathing experience) and were observed for water exposure (in minutes). These data were then assembled in mathematical models. The analysis forecast relative drowning risk pertaining to risk markers representing selected surf bather subgroups (gender, age and water activity). Contextualized through previous study findings, comparison of results with a gold standard obtained from mortality data generated new surf bather drowning hypotheses suitable for future testing by rigorous analytical epidemiologic designs. The hypotheses were: (1) The male to female comparative surf bather drowning rate is explained primarily by differences in crude water exposure; (2) the association of cardio-vascular medical conditions with surf bather drowning is stronger for older surf bathers compared to younger surf bathers; and (3) other risk contributors to surf bather drowning are: Poorly calibrated perception of bathing ability (overconfidence) and use of alcohol. Nonetheless, drowning rates appear generally consistent with time exposure to water. The study findings may also support drowning prevention strategies targeting risk marker subgroups.
1. Introduction
Unintentional drowning is a long-standing global health problem. Recent estimates suggest falling rates, though global fatalities remain substantial at around 300,000 persons in 2017 [1]. Factors contributing to unintentional drowning risk vary by person, circumstances and setting [2]. Effective drowning prevention strategies within and across settings will be supported through establishing relative risks of causal factors for specified locations. Yet most epidemiological studies of drowning remain descriptive, and though important for hypothesis generation, associations between exposure and injury remain unknown [3]. Risk analysis incorporating observed exposure measures is proposed here as a novel analytical method to identify drowning risk factors [4]. If proven, the method has the capacity to inform rigorous epidemiological studies on target variables and so capture design efficiencies.
To test the method, the specified setting is unintentional drowning on wave-dominated beaches in Australia. Coastal locations around the globe frequently sustain drownings [5]. Persons intentionally entering the water to bathe at these locations face putative causal drowning risk factors linked to swimming ability, wave height (and associated rip currents) and surf bathing experience [6,7]. In-water person factors such as fatigue, or underlying factors contributing to this condition, including health status, may exacerbate drowning risk in high energy environments [8].
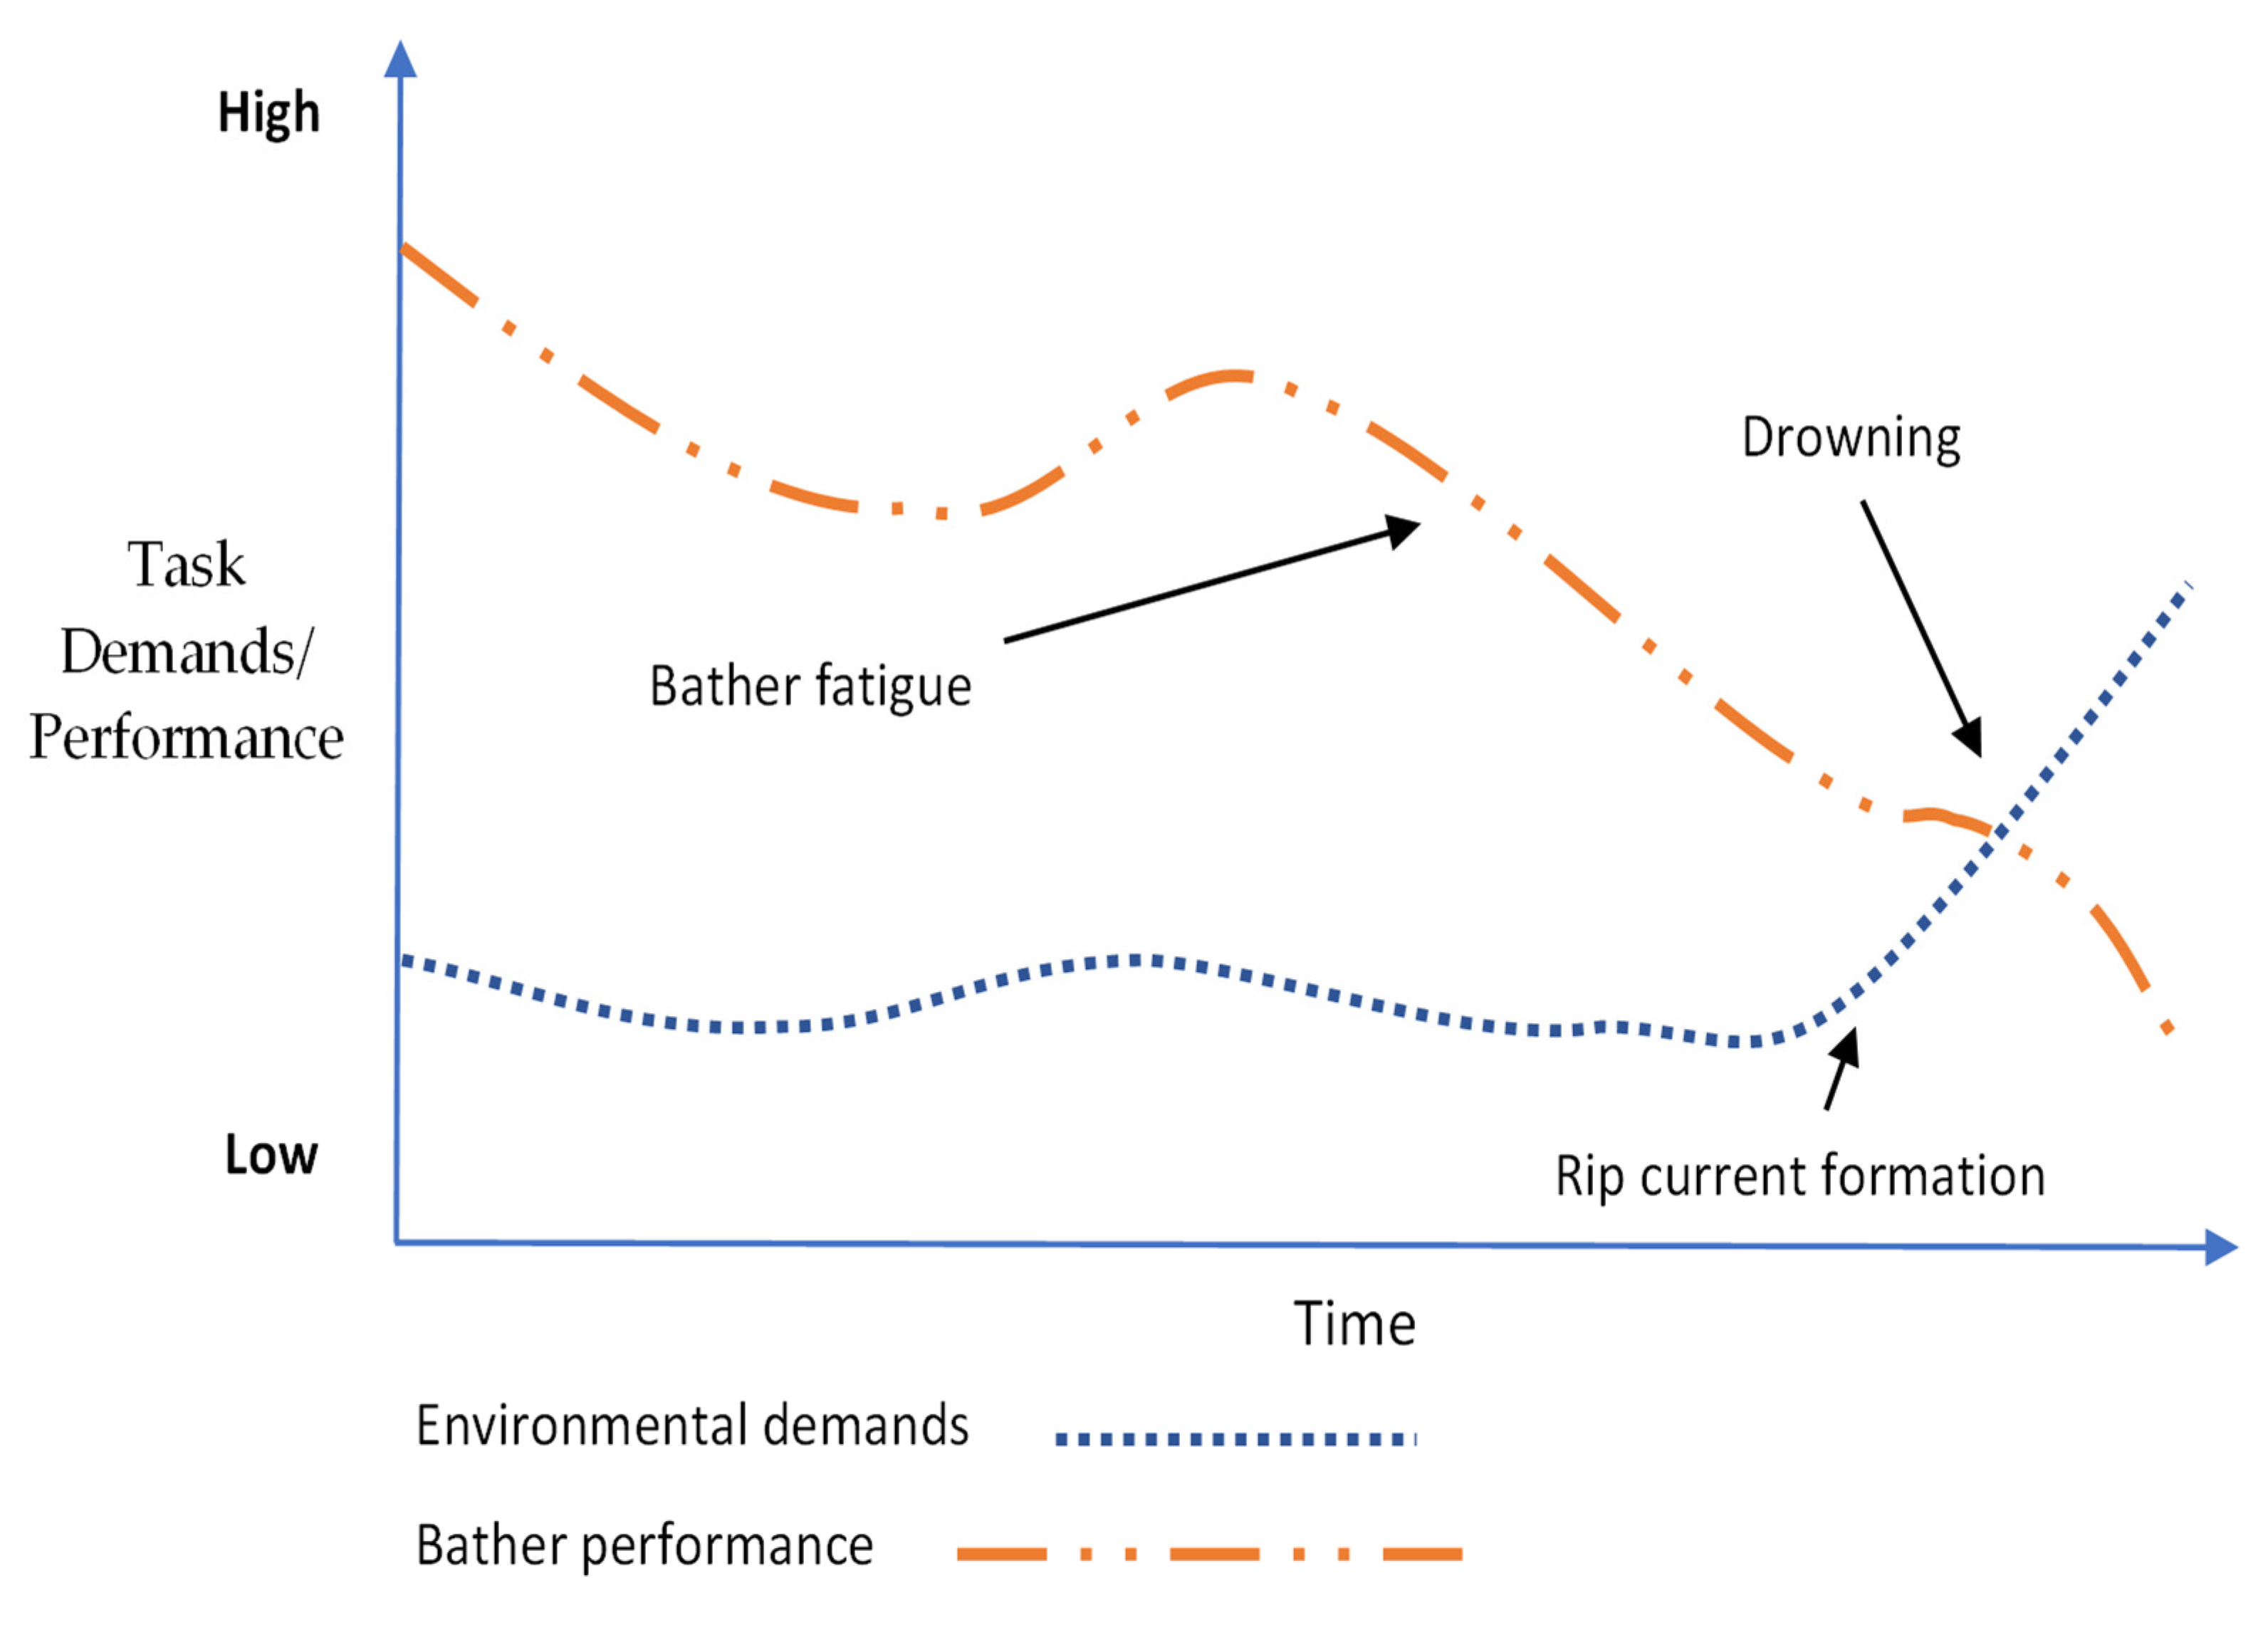
Blumenthal’s system approach model is used to represent a drowning event in this coastal setting (Figure 1) [9]. In this conceptualization, environmental or situational demands match the bather’s performance. The interaction of elements over time represents discrete pathways. A drowning event, consistent with respiratory impairment through submersion, is depicted where the pathways intersect [10]. Drowning at wave-dominated beaches under this scenario results from increased environmental demands through rip current manifestation, exacerbated by reduced performance from fatigue. Of course, for any drowning setting interactions of risk factors and exposures are complex suggesting full understanding of drowning risk requires multidisciplinary or interdisciplinary approaches [11,12].
The proposed drowning risk analysis employs a quantitative method accounting for person factors, environmental hazards and population-level exposure to water. The method, if proven, may have applicability to other unintentional injury contexts with relatively low incident rates from frequent risk exposures.
1.1. Linking Exposure, Risk Markers and Causal Factors to Drowning Events
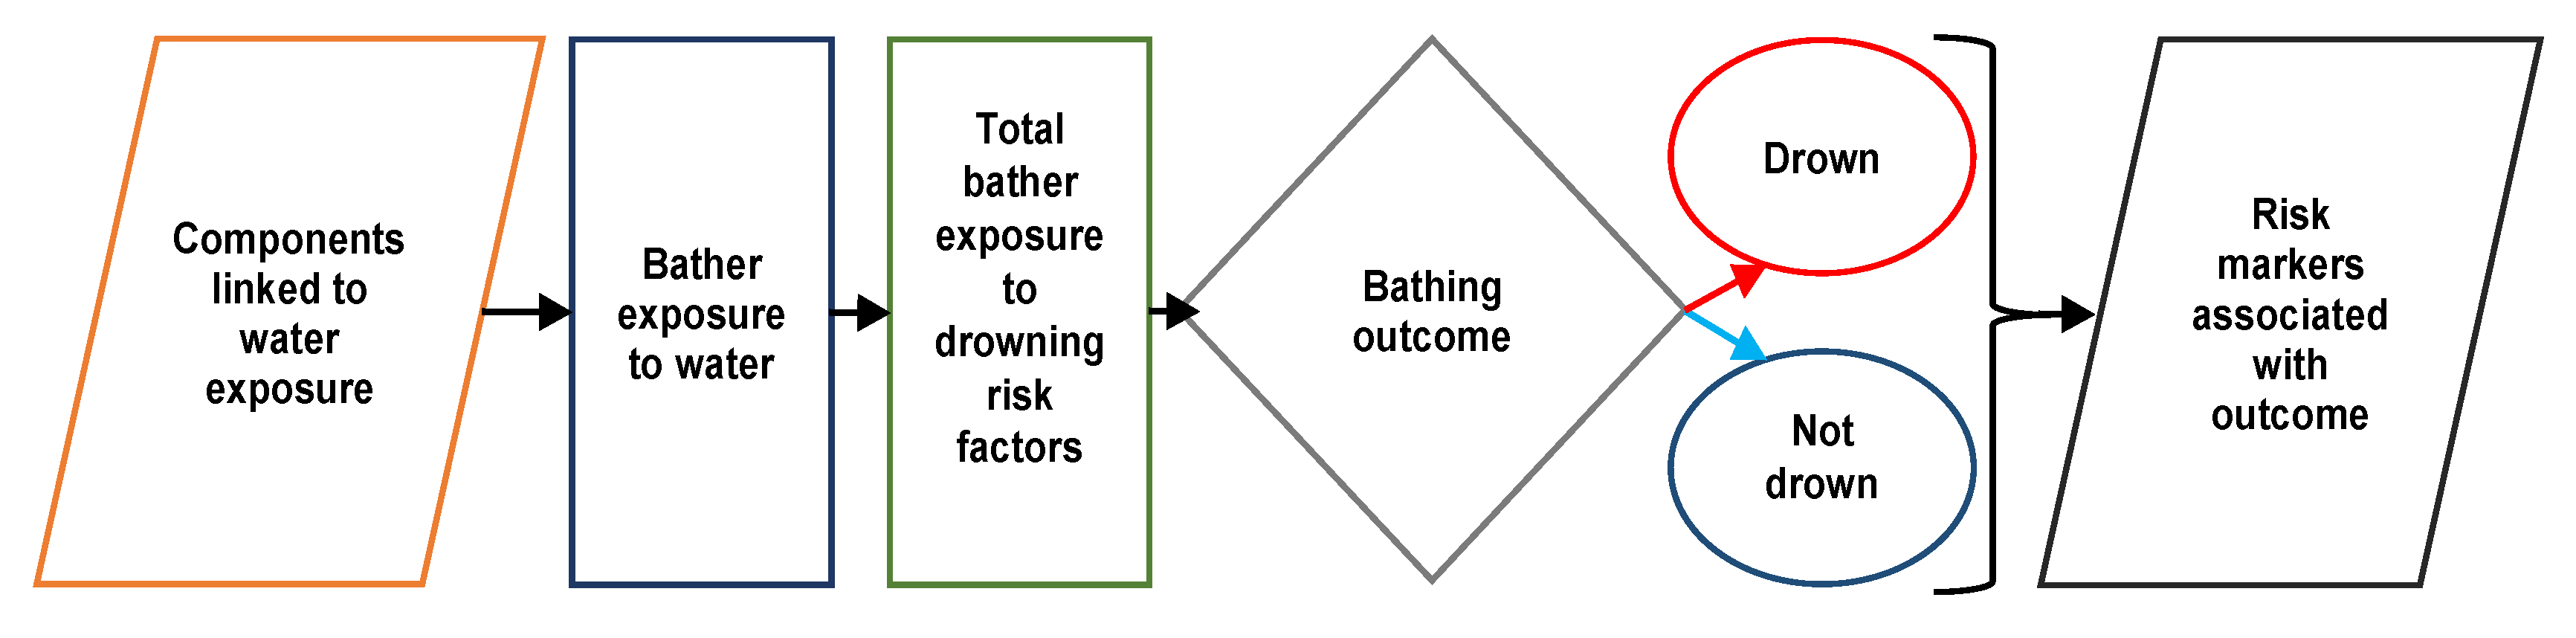
The necessity of exposure measures for causal risk factor identification are well understood in other injury contexts [13,14]. A process flowchart (Figure 2) for unintentional bather drowning at wave-dominated beaches links exposure to water, risk factor exposure, bathing outcome and risk markers [15]. Risk markers associate with drowning risk factors but are not causal. While bathers together face a total drowning risk from crude exposure, risk factors and bathing outcomes vary among individuals. Measuring exposure components, risk markers and risk factors (and risk factor interactions) theoretically allows for a full risk analysis for a specified drowning setting (Figure 2).
1.2. Available Surf Bather Data Applied to Mathematical Models
Datasets in published studies (Table 1) tested the proposed risk analysis based on mathematical models. Data were drawn from representative samples obtained from surf bathers in Victoria, Australia. Mortality data were Australia wide. Mathematical models are superior to humans in their ability to combine data from diverse information sources [17]. Contrasting to clinical judgment, mathematical models specify relationships between variables based on empirically derived data with reproducible outcomes [18,19]. Dawes and Corrigan indicate “the whole trick is to decide what variables to look at and then to know how to add them” [20] (p. 105).
In the present study, a drowning risk analysis applied mathematical models combining previously collected data to derive comparative drowning ratios (indicating relative risk) for surf bather risk-marker subgroups. To assess method validity a posed research question was: Does relative sub-group drowning risk derived from risk analysis align to a gold standard for comparative drowning rates?
2. Materials and Methods
The risk analysis determined relative drowning risk for selected Australian surf bather subgroups drawn from disparity in bathing time weighted by exposure to drowning risk factors. Differences calculated as ratios were then compared to a gold standard of comparative drowning rates from mortality data for the same subgroups. The five-step method is conceptualized in Table 2.
2.1. Linking Datasets
The risk analysis relies on conflating compatible data across five discrete datasets collected for Australian surf bathers. Data collection methods provided matching variable measures collected over corresponding time-periods [7,22,23,25,26]. For step 1 (Table 2), three factors (swimming ability, surf swimming experience and wave height) were ranked highest by an expert panel as causal risk contributors to surf bather drowning [26]. The three factors explained 75 percent of surf bather drowning risk when judged by surf beach specialists in a controlled study [7]. In the study, risk factor measures were anchored to empirically derived bather population ratings collected from bathers at surf beach locations [22]. Risk markers required for surf-bather subgroup identification were available across all datasets (Table 1).
2.2. Risk Analysis Calculations
The technical risk analysis procedure with formulas is presented in Appendix A. Appendix B provides a worked example of the method. An online Supplementary Materials provides spreadsheet calculations (BackMatter). A descriptive overview of the method consistent with Table 2 is given below.
Step 1 provides a mean rating of total drowning risk contribution from swimming ability, surf swimming experience and wave height for selected surf bather subgroups (e.g., risk marker age was sub-grouped as <30 years or ≥30 years) [26]. A unique bather risk score was derived from self-report data (N = 403) [22]. Scores were then weighted by each risk factor’s modelled contribution (including interactions) to surf bather drowning, derived from specialist assessment based on repeated measures ANOVA [7]. From tallied risk scores, an average score represented the subgroup population’s drowning risk.
Step 2 provided a ratio of total person-time crude water exposure between comparison subgroupings (e.g., males vs. females) derived from direct observation [23]. (The term crude here indicates that the measure of water time exposure does not capture individual variations in drowning risk associated with factors such as water depth or distance from shore.) Recorded person-time in water summed for each subgroup was recorded in minutes. The comparative total person time-in-water between subgroups was reduced to a ratio in the simplest form (i.e., η:1) for convenience. The antecedent term (η) applied to the first subgroup and the consequent term (1) applied to the second subgroup.
Step 3 combined subgroup drowning risk (step 1) and the comparative ratio of total person-time water exposure (step 2) to produce a ratio of derived drowning risk. The calculated antecedent term in this ratio is obtained from the first subgroup’s product of drowning risk and antecedent (η) ratio result for water time exposure. The ratio consequent term representing the second subgroup is the product of that subgroup’s drowning risk and the unitary consequent from step 2. This calculation produced a relative ratio of drowning risk between subgroups, accounting for exposure to water. This ratio was reduced to its simplest form (i.e., η:1) for convenience.
To provide a point of reference gold standard comparison for the derived drowning ratio between subgroups, step 4 established the comparative specific drowning rate (specific being an absolute or real drowning rate for a specified period). This specific drowning rate is found by comparing the relative frequency of surf bather drowning for the subgroups from mortality data [25]. As in steps 2 and 3, relative subgroup drowning frequency is reduced to a rate in the simplest form (i.e., η:1).
The specific drowning rate provided a point estimate of the drowning proportions between subgroups from relatively small sample sizes (N = 129, for a four-year period). To assess sample reliability, a 95% CI was calculated for each specific rate antecedent using the adjusted Wald binomial method [27]. This test produces superior results for small samples when compared to other common binomial methods (e.g., Wald or Exact) [28].
For each subgroup comparison on the specific drowning rate, the first subgroup (antecedent) total and the group total were entered into an online tailored calculator to produce lower and upper range confidence intervals (CI) [29]. (Note: The binomial Score method was employed for one extreme distribution.) Upper and lower antecedent subgroup 95% CI scores were converted manually to an upper and lower comparative specific rate (reduced to the simplest form [η:1]).
Step 5 provided assessment by comparisons of subgrouping derived ratio of relative drowning risk (step 3) with comparative specific drowning rate point estimate and antecedent 95% CI (step 4).
2.3. Risk Analysis Assumptions and Subgroup Identification
The five steps (Table 2) followed a logical approach weighting drowning risk with water exposure. The method necessitated important assumptions concerning variable distributions, scale validities, additivity of scales items, linear patterns of risk contributions across variables or exposure levels and risk weightings based on subjective opinion. The possibility of these assumptions introducing unknown error is discussed under study limitations.
Subgroups marking drowning risk were determined on practical grounds. Gender was sub-grouped by male or female. Age was sub-grouped by <30 years and ≥30 years to gain adequate sample sizes while being proximate to self-report sample means (males 32.5 years; females 32.8 years) [22]. Bather activity was sub-grouped into waders (remaining in water depth ≤1 m), swimmers (in water depth >1 m without surfing equipment) or surfers (surfboard or body-board).
Nine subgroup comparisons were conducted: Four comparisons within risk marker groups for gender, age and activity (for activity, two comparisons were made—including or excluding waders to investigate consistency with mortality data); one comparison for gender by age (four subgroups); two comparisons for activity by gender; and two comparisons for activity by age. Within the last four comparisons, waders with or without surfing equipment (as opposed to swimmers and surfers beyond the swash zone) were excluded on the assumption that few, if any, healthy surf bathers in <1 m depth would drown [23]. (This assumption requires validation given a study reporting 5% of drownings across five American [US] states in one year were wading [30].) For drowning mortality data used in the risk analysis, water depth could not be determined [25].
3. Results
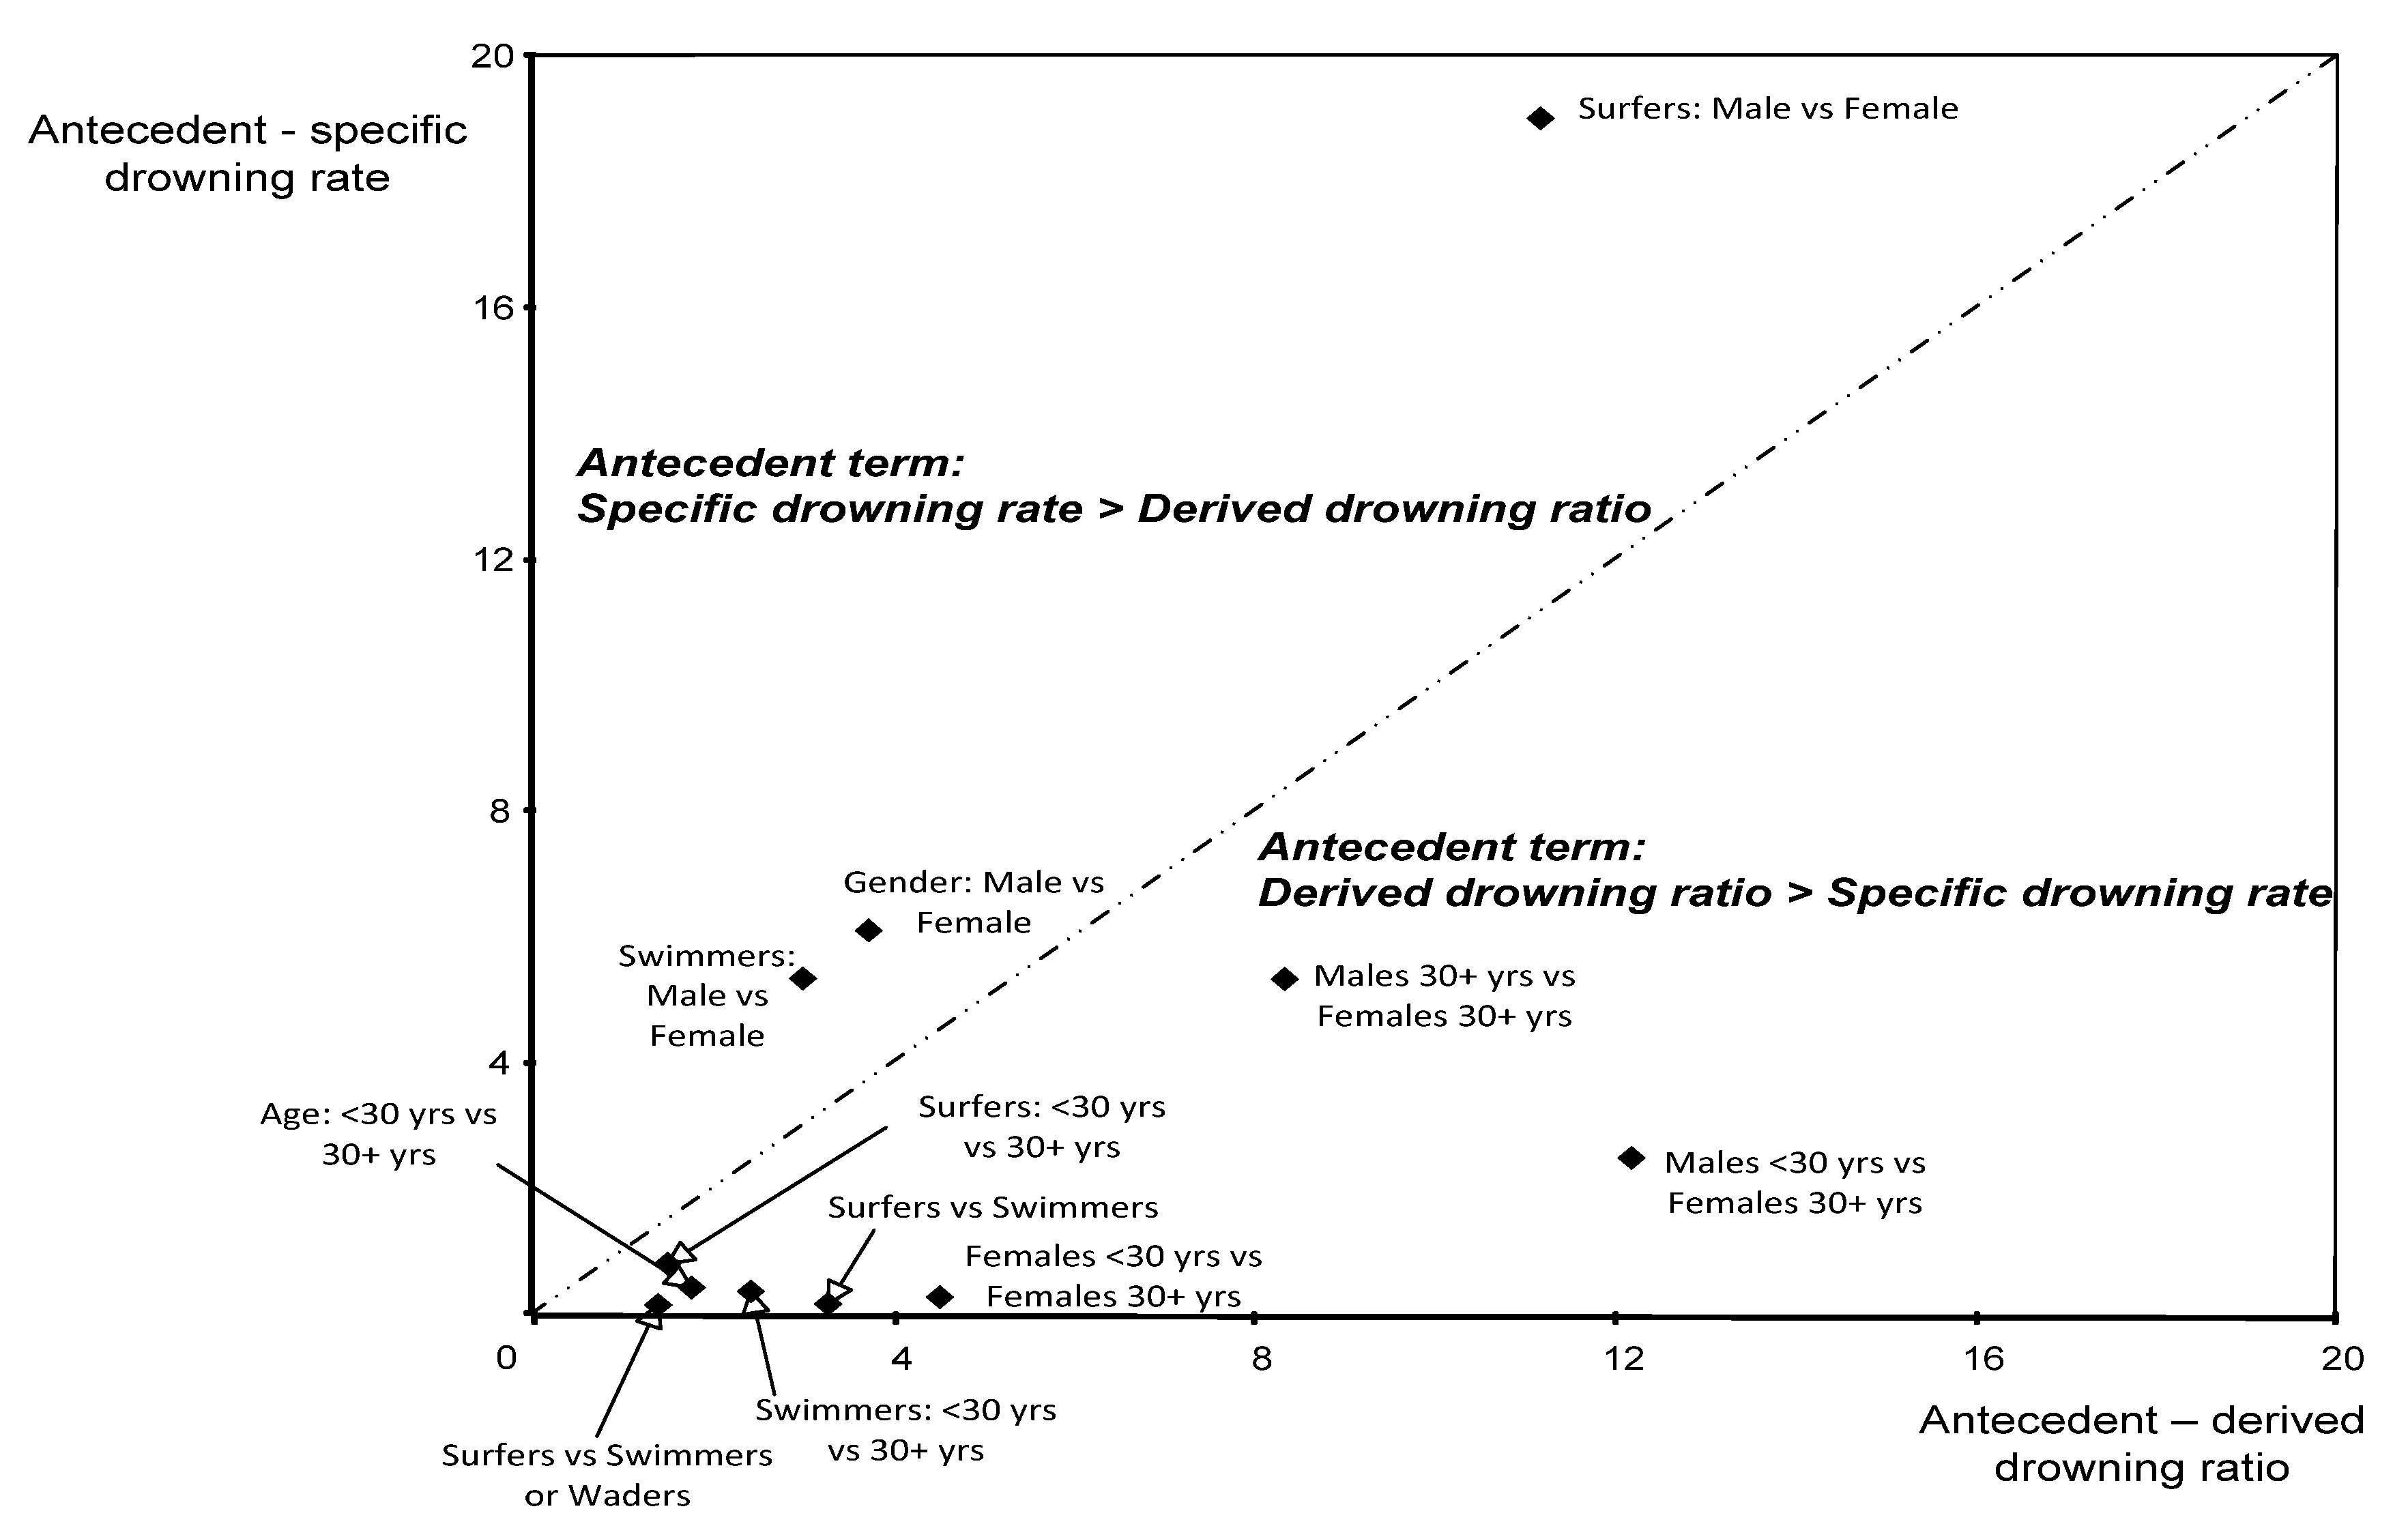
Results from risk marker subgroup comparisons are presented in Table 3 and Table 4 and Figure 3. Table 3 specifies drowning risk contributions from risk factors and crude (water time) exposure ratios with the product of these two calculations being total drowning risk. Table 4 reports derived drowning ratios from comparative subgroup drowning risk and specific drowning rate plus 95% CI calculated from mortality data. Antecedent terms for the derived drowning ratio and specific drowning rates are illustrated also in Figure 3 for full visual assessment.
Two key comparisons are available for selected subgroups. The first concerns subgroup scores within ratios or rates (Table 4; subgroup 1:subgroup 2). An antecedent term >1 specifies subgroup 1 to hold relatively higher drowning risk (ratio) or drowning frequency (rate). The reverse applies for antecedent terms <1. The second comparison falling at a broader level is between antecedent terms for derived ratios and specific rates (Figure 3). The specific rate antecedent together with confidence intervals provided a check on the results from risk analysis.
3.1. Comparisons within Subgroups
For gender, Table 3 shows that males had a lower contribution to drowning risk from the included factors but far higher crude exposure to water than females. This resulted in a male to female derived drowning ratio of 3.71:1 (Table 4). This ratio antecedent was below the specific drowning rate antecedent (6.11) but just within the specific drowning rate antecedent 95% CI (see worked example at Appendix B). By age group, bathers <30 years had both higher drowning risk contribution from the included factors and higher crude water time exposure. This was reflected in a derived drowning ratio of <30 years to ≥30 years of 1.78:1 (Table 4). The ratio antecedent was higher than that found for the specific drowning rate (0.44) and outside the antecedent 95% CI.
By age and gender subgroups, males ≥30 years had the lowest contribution to drowning risk from the included factors with the highest for females ≥30 years. The younger male subgroup had the highest crude water exposure time, with the older female subgroup lowest. This latter subgroup was used as the consequent base for ratios and rates which provided for comparisons among all four gender-age subgroups. The derived drowning ratio antecedent was highest for the younger male subgroup, followed by the older male subgroup and then the younger female subgroup (Table 4). In contrast, the comparative specific drowning rate antecedent was highest for the older male subgroup, followed by the younger male subgroup, then the older female subgroup. The antecedent for males ≥30 years versus females ≥30 years (8.33) was the only comparison among the above three to fall within the specific drowning rate antecedent 95% CI.
By activity, surfers had lower contributed drowning risk from included factors than both combined waders and swimmers and swimmers only. Surfers had higher crude water time exposure compared to both subgroups. For both comparisons, surfers had a relatively higher derived drowning ratio (1.45:1 and 3.28:1, respectively; Table 4) but a lower specific drowning rate (0.18:1). Both ratio antecedents were above the specific drowning rate antecedent 95% CI.
For activity by gender, the surfer grouping results somewhat mirrored gender only differences (Table 3) but at a comparatively higher ratio (11.45:1) and rate (19.00:1; Table 4). For this comparison, the derived drowning ratio antecedent fell within the specific drowning rate antecedent 95% CI, although due to the small sample size and high proportion of male surfers, the specified range was large. In calculating binomial confidence intervals for extreme and small distributions, the binomial Score method may provide more precise endpoints compared to the adjusted Wald method [28]. The Score method revealed a comparatively smaller specific drowning rate antecedent 95% CI (3.24 to 111.36) but this result still bounded the derived drowning ratio antecedent for male surfers relative to female surfers.
Contrary to comparable overall gender results, female swimmers had lower drowning risk contribution relative to male swimmers (Table 3). However, male swimmers had higher water exposure resulting in a derived drowning ratio for male to female swimmers of 3.02:1; this compares to a higher (for males) specific rate of 5.35:1 and falls outside the specific drowning rate antecedent 95% CI (Table 4).
For activity by age, the drowning risk contributions from included factors were relatively similar within both the swimming and surfing subgroups (Table 3). For swimmers by age, drowning risk indicated by the derived drowning ratio (2.24:1; Table 4) was higher for the <30 years subgroup compared to the ≥30 years subgroup. In contrast, younger swimmers had a lower specific drowning rate (0.38:1; with the derived ratio antecedent being above the specific drowning rate antecedent 95% CI). For surfers by age, the derived drowning ratio indicated higher drowning risk for the younger age group compared to the older age group (1.48:1); the opposite was found for the specific rate (0.82:1). The ratio antecedent for surfers by age did however fall within the specific drowning rate antecedent 95% CI.
3.2. Comparisons between Subgroups
Of all subgroups, male surfers had both the lowest drowning risk contribution from risk factors (3.99) and highest water exposure (relative to their comparison subgroup). Female surfers had the highest drowning risk contribution from risk factors among all subgroups (5.79) plus the lowest total water exposure. More generally, subgroups found to have relatively lower drowning risk contribution from included factors had correspondingly high relative water time exposure. The two exceptions to this pattern were comparisons within age (<30 years vs. ≥30 years) and male vs. female swimmers (Table 3). For both comparisons, higher relative drowning risk contribution from risk factors for both younger bathers and male swimmers was combined with higher relative water-time exposure.
3.3. Comparisons between Risk Analysis Ratios and Drowning Rates
Figure 3 plots antecedent terms for the derived drowning ratio against the specific drowning rate on a Cartesian coordinate plane. The point distance from the origin reflects the relative difference in drowning risk between the subgroup comparisons for the ratio, specific rate or both. Distance from the equivalence line (i.e., equal ratio and rate antecedents) reflects the degree of disparity between ratio and rate antecedents. The three comparisons falling above the equivalence line (rate antecedent higher than derived ratio antecedent) were all contained within gender subgroups: Males vs. females, male swimmers vs. female swimmers and male surfers vs. female surfers. The remaining eight comparisons falling below the equivalence line (rate antecedent lower than derived ratio antecedent) included either age or activity groups (some with gender comparisons).
3.4. Comparison Categories of Drowning Risk
Table 5 provides a summary from the risk analysis (as a relative drowning forecast) against recorded drownings by placing subgroup comparisons within four categories (reflecting Figure 3). For category 1 (two subgroup comparisons), drowning forecast was above that recorded without statistical difference between measures. Category 2 (one subgroup comparison) drowning forecast was also above that recorded but with statistical difference. Category 3 (two subgroup comparisons) and 4 (six subgroup comparisons) drowning forecasts were below that recorded with no statistical difference for the former and statistical difference for the latter.
4. Discussion
The study developed and tested a method to generate a comparative ratio of drowning risk between subgroups of surf bathers within risk marker groups based on data collected for a specified surf bather location in Victoria, Australia. The derived drowning ratio combined specified risk contributions from three scale-measured candidate factors (swimming ability, surf swimming experience and wave height) weighted by crude exposure time to water to produce a drowning forecast. These forecasts, presumed representative of Australian surf bather subgroup populations, were assessed against corresponding specific drowning rates ascertained from Australia-wide surf bather drowning mortality data.
Table 6 lists proposed general explanations for similarities and differences between drowning forecasts (ratios) and recorded drownings (rates) in consideration of rate antecedent 95% CI. Explanations for discrepancies between forecast and recorded drownings consider possible roles of risk factors uncaptured in the risk analysis. Limited generalizability of water exposure estimates beyond the state of Victoria may also explain study findings (Table 5). Specific results are discussed below in the context of these general explanations.
4.1. Factors Accounted and Unaccounted in the Risk Analysis
For three causal risk factors analyzed, relative to other subgroups, female surfers carry the highest absolute drowning risk and male surfers lowest (Table 3). Relative to female surfers, male surfer mean scores for self-rated swimming ability, surf bather experience and wave height exposure all specified lower risk (online data Supplementary Materials). Yet male surfer time exposure to water relative to female surfers was higher by a factor over 16 (Table 3). Hence, while a male surfer may (on average) face lower drowning likelihood relative to a female surfer, drowning risk at the population level reverses this individual pattern by accounting for water exposure. Other subgroups may be similarly considered suggesting that population exposure to water has a major bearing drowning frequency.
The drowning ratio derived from risk analysis excluded influences from numerous possible risk (or protective) factors identified elsewhere [5]. These factors, associated with person, behavior or environment, include: Adverse health condition onset, alcohol use before bathing, swimming alone, other social or psychological factors (e.g., overconfidence) that influence bathing decisions, water depth, swimming fatigue and hazards such as rocks, sandbars, wind or tide.
Nevertheless, the study results are consistent with theoretical propositions discussed below. Further, regarding the above-stated suggestion, matching patterns between drowning forecasts and recorded rates provide evidence that comparative drowning frequencies between surf bather subgroups are largely proportional to differences in crude water exposure. That is, all surf bathers exposed to water face drowning risk regardless of their associated risk markers [7].
4.2. Subgroup Comparisons within Risk Marker Subgroups
Speculative explanations (Table 6) can be applied to results reported in Table 5. Comparison category 1 includes gender only and gender by surf activity comparisons. For both comparisons, males sustained a higher than forecast drowning frequency, possibly explained (following Table 6) by drowning risk factors associated with male gender (or protective factors associated with being female) uncaptured in the risk analysis. Given true, then a logical inference is that uncaptured drowning risk factors have a disproportionate influence on drowning risk within gender groupings, at the population level (e.g., having greater proportional risk for males).
Examples of uneven gender patterns of surf bather exposure to candidate risk factors have been documented [22]. Factors include males’ more frequent use of alcohol before bathing, greater likelihood of bathing alone, bathing in deeper water farther from shore and overconfidence in their bathing abilities. Accounting for these factors in the risk analysis would almost certainly result in closer alignment between risk analysis ratios and specific drowning rates. Nonetheless, for comparison category 1, ratios fell within the 95% CI for rates (Table 5) suggesting that uncaptured factors have a relatively minor influence on drowning risk relative to risk and exposure measures employed in the risk analysis.
Comparison category 2 (Table 5) contained the male and female swimmer subgroup. As for comparison category 1, the drowning forecast was below the recorded rate, and for this subgroup, fell outside the 95% CI. Risk contributions from factor(s) uncaptured in the ratio calculations are proposed to have significant impact on actual drowning risk for this subgroup. This explanation finds support in earlier self-report data where, relative to female wave swimmers, male wave swimmers have lower surf beach experience, are more likely to consume alcohol before bathing and have higher confidence (likely over-confidence) to return to shore if caught in a rip current [22]. These factors may work in combination, resulting in male wave swimmers facing a significantly higher drowning risk relative to female activity-counterparts at the population level.
For comparisons category 3 (Table 5) drowning forecasts were above corresponding recorded drownings. Both comparisons involving age subgroups fell within the 95% CIs. The result for males and females ≥30 years suggests an uncaptured factor contributes uneven drowning risk for women (as males in the subgroup were forecast to drown at higher rate than found) though the effect is not significant (based on the rate antecedent 95% CI). A previous study found males to be overrepresented on patrolled surf beaches [22] reducing relative rescue likelihood for females.
The comparison category 3 of surfers by age (<30 with ≥30 years) forecast the younger group at higher drowning risk whereas records indicate the opposite (Table 4). As the forecast fell within the 95% CI, all significant factors may have been captured in the risk analysis or negligible (or balanced) impact of uncaptured factors may influence drowning risk for the subgroup. For example, older surfers may be exposed to deeper water, lower fitness or more testing surf conditions where increased drowning risk is counterbalanced by greater experience or circumspection in the water activity.
Comparison category 4 (Table 5) listed six subgroups. For all, drowning forecasts were above recorded drowning and outside 95% CIs. Four comparisons here included a younger versus older age. A mortality study found cardio-vascular health conditions to be associated with 26% of surf bather drownings [25] and age is a risk marker associated with cardio-vascular health conditions [31,32]. Cardio-vascular conditions therefore presumably contributed proportionally greater risk to older bathers, uncaptured in the risk analysis. This likely explained inflated forecasts for age group comparisons (as those aged <30 years formed subgroup 1 in comparisons).
Two bathing activity (only) subgroups were within comparison category 4 (Table 5). Referring to the risk analysis (Table 3), surfers carried lower average risk but higher proportional water exposure when compared to other bathers (Table 3). If all factor contributions to drowning risk were equal, then by accounting for water exposure only, surfers would be expected to drown at a relatively higher rate than swimmers. Yet the reverse was found in the mortality data. Surfers may be distinguished from other bathers by higher mean surf experience and the use of floatation devices [22,23]. Floatation devices such as surf and body boards may provide protection from drowning, but this effect has yet to be scientifically verified.
4.3. Study Implications
The study’s primary research contribution is a method development specifying relative drowning risk for surf bather subgroups accounting for exposure. The findings suggest the method is suitable for preliminary assessment of drowning risk while providing an alternative or precursor to traditional analytical epidemiological designs. The method sheds light on how captured and uncaptured candidate risk factors may combine, in tandem with water exposure, to produce differing levels of drowning risk within surf bather subgroups. Secondly, it has capacity to associate putative causal factors with risk markers including gender or age (Figure 2).
Drowning risk studies aim to inform prevention strategies. This study’s findings add evidence for swimming ability, surf beach experience and wave height being factors that influence drowning risk for surf bathers. Hypothesizing for the role of other factors identified in earlier studies ensues from the risk analysis. Significantly, the study shows the important role of exposure to water in influencing drowning risk. The findings therefore support the critical use of surveillance for coastal bathers; a strategy undergoing change and improvement through use of new technologies including drones [33].
4.4. Study Limitations
Restrictive assumptions inherent to this study and underpinning datasets prevent drawing definitive conclusions. The study’s value is realized through raising propositions concerning drowning risk factor contributions to guide further investigation. Key limitations entail generalizability of datasets, the validity of measures and a circumscribed criteria base for derived risk measures.
4.4.1. Generalizability of the Datasets
Study findings were limited by the predictive drowning ratios based on samples collected within Victoria, Australia (Table 1). Strictly, results generalize only to bathers using a small number of Victoria’s surf beaches over one summer. While samples were assumed to be representative of all Australian surf bathers in the absence of further data, testing is required for confirmation.
Excluded risk factors were proposed to explain differences in antecedents between derived drowning ratios from risk analysis and specific drowning rates from Australia-wide mortality data. Rate and ratio differences may be partially explained by dissimilar exposure patterns and candidate risk factor profiles characteristic of surf bather deaths in locations outside the Victorian sampling frame. Future studies should extend temporal and spatial sampling frames while deriving comparative specific drowning rates over longer periods to improve estimate precision.
4.4.2. Validity of Measures
The validity of measures employed presents potential limitations. For example, the precise wave size allocated to each bather (i.e., exposure to wave size recorded simultaneously with self-report data) was based on a time-point observation [22]. Moreover, self-reported time visiting a beach in the previous 12 months was used as the proxy measure for surf swimming experience which may be imprecise given that males were documented to spend relatively longer in the water per visit [22,23].
Drowning risk factors wave height and surf bather experience both are crude measures of drowning risk. Nuanced risk contributions may transpire from wave type (plunging, surging, spilling) or wave frequency. Similarly, the essential protective benefit from surf bather experience may arise from personal decision-making being calibrated with extant sea conditions. These propositions required further assessment.
The research design was intended to produce results that approximated reality. By seeking both parsimony and clarity, the method necessarily disregarded several possible influences on drowning risk including unknown interactions between candidate risk factors or risk factors and water exposure (Figure 1). However efforts to reduce bias by including all relevant variables in statistical models may actually have disbenefits [34].
For full theoretical confidence in the ecological validity of the study method, all drowning risk factors in operation require accounting; adding prohibitive complexity and virtual impossibility in practice. Given the variables used in this study were considered the most critical in surf bather drowning, results from more complex research designs may lead to only marginal improvement in precision [26]. The method sought to address a balance between methodological complexity and practical application to a defined at-risk population. By identifying the factors most influential for surf bather drowning risk, with contributions confirmed by specialist ratings, arguably, a close to optimal representation of reality generalizable to bathers using Australian surf beaches has been established [7]. Further methodological testing is required to assess this claim.
4.4.3. Applicability of Limited Criteria
A third limitation concerns strict criteria used by surf beach specialists to rate drowning risk in a scenario-based foundation study [7] of characteristics about the person, the beach type, prevailing weather conditions and behaviors. Effect sizes applied in this study were valid for bathers meeting the scenario as specified (e.g., bathing without equipment or bathing alone). Error from that study’s results was discarded in this study on the assumption of being random noise. Regardless, few beachgoers contributing self-report data for this study would match controlled behavioral and exposure patterns used to specify applied risk factor contributions [22]. More precise research should tailor specialist rating for scenarios that better reflect behaviors of the subgroup analyzed (e.g., expert ratings for surfers using equipment).
5. Conclusions
This study attempted to forecast surf bather drowning risk using a mathematical representation. In meeting requirements for monotonicity, the mathematical specification was presumed to represent relative drowning risk with greater accuracy compared to judgements by experts provided with the same raw data [17]. This conclusion is supported by numerous studies documenting superior judgements by mathematical models compared to experts or clinicians under similar conditions [18].
The variables selected as contributors to drowning risk were identified by expert ranking to be the most influential. Each had demonstrated statistically significant association with drowning risk when rated by surf specialists. Variable weightings were taken from an experimental study design that quantified each factor’s contribution to drowning risk. The specification of drowning risk from a combination of linear and configural terms provided a subtle sign of the expert [35]. Drowning risk calculated from factors, using data drawn from selected bather subgroups, was weighted by comparable water-exposure time data collected by a reliable direct observation method.
Despite the stated limitations, the findings demonstrate the method to be useful for forecasting drowning risk and generating hypotheses for further study through analytical epidemiology and/or risk assessment procedures. The study findings do not provide definitive answers to why subgroups drown at different rates but offer a basis to guide theoretical propositions about the roles of selected risk factors and the influence of water time exposure on relative drowning rates. Further research in high-risk water settings such as inland waterways may confirm the value of this risk analysis method for drowning and other defined injury problems.
Supplementary Materials
The following are available online at https://0-doi-org.brum.beds.ac.uk/10.25955/61778323d7eab, Data calculation spreadsheet.
Author Contributions
Conceptualization, D.M. and J.O.-S.; methodology, D.M.; data curation, D.M.; writing—original draft preparation, D.M.; writing—review and editing, J.O.-S.; supervision, J.O.-S.; project administration, D.M. All authors have read and agreed to the published version of the manuscript.
Funding
This research received no external funding.
Institutional Review Board Statement
The foundation studies contributing datasets used in this paper were conducted according to the guidelines of the Declaration of Helsinki and approved by the Monash University Standing Committee on Ethics in Research Involving Humans, year/project no.s: 2001/431; 2004/M0004; 2005/760EA; 2005/M0004-2.
Informed Consent Statement
Informed consent was obtained from all subjects involved in the study.
Data Availability Statement
Availability to foundation datasets used for this study listed on cited papers in Table 1. All data reported for this paper is available also directly from the corresponding author.
Conflicts of Interest
The authors declare no conflict of interest.
Appendix A
Technical procedure in five steps.
The five steps described in Table 2 are detailed here in mathematical form.
Step 1 Estimation of total drowning risk for a surf bather subgroup from selected factors (based on self-report dataset):
Trc—total risk contribution from selected drowning factors
Es[sa, se or wh]—effect size for selected drowning factor calculated by partial η2
ki—respondent score in subgroup
i—dataset employed
ni—subgroup sample size
sa—swimming ability drowning factor
sg#—subgroup
se—surf experience drowning factor
wh—wave height drowning factor
The equation in step 1 combines linear summated terms plus a multiplicative term representing factor interaction [36] (pp. 3–7). All terms in the equation were found to be statistically significant contributors to drowning risk in a linear (or close to linear) pattern, based on specialist ratings [7]. Including a configural term in predictive equations had the advantage of better differentiating an individual bather’s patterns of scores [37] (p. 122).
Effect sizes calculated by partial η2 were used as coefficients (weights) for the three candidate risk factor variables and a single interaction of two factors found to be significant predictors of surf bather drowning in the repeated measures ANOVA model [7]. The weights were: 0.82 for swimming ability, 0.85 for surf swimming experience, 0.93 for wave height and 0.15 for the interaction of surf swimming experience and wave height. The significant interaction in the model was represented by the product of the included two variables [38] (p. 445).
Step 2 Calculation of the comparative ratio of total person time water exposure for surf bather subgroups (based on direct observation dataset):
Awe—antecedent in ratio of total person time (minutes) water exposure–subgroup 1
Cwe—consequent in ratio of total person time (minutes) water exposure–subgroup 2
ki—respondent score in subgroup
i—dataset employed
ni—subgroup sample size
sg#—subgroup
Step 3 Prediction of comparative drowning risk for surf bather subgroups by combining results for step 1 (drowning risk contribution) and step 2 (relative water exposure):
Addr—antecedent in ratio of derived drowning risk–subgroup 1
Awe—antecedent in ratio of total person time (minutes) water exposure–subgroup 1
Cddr—consequent in ratio of derived drowning risk–subgroup 2
sg#— subgroup
Trc—total risk contribution from selected drowning factors
Step 4 Calculation of comparative specific drowning rate for selected subgroupings (based on mortality dataset) and 95% CI for antecedent:
Asdr—antecedent in ratio of specific drowning rate–subgroup 1
Csdr—consequent in ratio of specific drowning rate–subgroup 2
sg#— subgroup
#—frequency within subgroup
Specific comparative rates calculated in step 4 are a time-bound subset of ratios [39] (p. 152). For the calculations here, the period was four years (2001 to 2005). The confidence interval may be interpreted as the range within which 95 percent of specific drowning rates sampled from the population would fall. Alternatively, this interval can be thought of as having a 95 percent chance of containing the true comparative drowning rate between subgroups.
Step 5 Comparison of derived drowning risk ratio (step 3) against the specific drowning rate (step 4) and antecedent 95% CI by subgroup:
Addr—antecedent in ratio of derived drowning risk–subgroup 1
Asdr—antecedent in ratio of specific drowning rate–subgroup 1
Cddr—consequent in ratio of derived drowning risk–subgroup 2
Csdr—consequent in ratio of specific drowning rate–subgroup 2
sg#—subgroup
Appendix B
Worked example of method in five steps (see also online Supplementary Materials).
Subgroup comparison within gender for males vs. females.
Step 1—subgroup drowning risk (grouped by a specified risk marker variable)
Result: Males (sg1) had relatively lower mean contribution to drowning risk from selected factors (Trc) compared to females (sg2).
Step 2—Ratio of total person time exposure to water
Result: Males (sg1) have relatively higher water exposure (Awe) compared to females (Cwe).
Step 3—Derived drowning risk
Result: Males (sg1) have relatively higher derived drowning risk (Addr) compared to females (Cddr), accounting for differences in water exposure (Awe) and total contributed drowning risk from factors (Trc).
Step 4—Specific drowning rate and 95% CI for antecedent
Result: Males (sg1) have relatively higher specific drowning rate (Asdr) compared to females (Csdr). This rate of 6.11 is higher than the derived drowning risk ratio for males (Addr) of 3.71.
Result: The males (sg1) specific drowning rate (Asdr) is 6.11, relative to females. The 95% CI for this specific drowning rate (Asdr) comparison has a lower boundary of 3.71 and upper boundary of 10.11.
Step 5—Derived drowning ratio compared to specific drowning rate—males to females
Result: The male (sg1) to female (sg2) derived drowning ratio (Addr:Cddr) antecedent of 3.71 is lower than the male (sg1) to female (sg2) specific drowning rate (Asdr:Csdr) antecedent of 6.11 but this falls within (just) the 95% CI for the specific drowning rate antecedent term (Asdr) of 3.71 to 10.11.
References
- Franklin, R.C.; Peden, A.E.; Hamilton, E.B.; Bisignano, C.; Castle, C.D.; Dingels, Z.V.; Hay, S.I.; Liu, Z.; Mokdad, A.H.; Roberts, N.L.S.; et al. The burden of unintentional drowning: Global, regional and national estimates of mortality from the Global Burden of Disease 2017 Study. Inj. Prev. 2020, 26, i83–i95. [Google Scholar] [CrossRef] [Green Version]
- Tyler, M.D.; Richards, D.B.; Reske-Nielsen, C.; Saghafi, O.; Morse, E.A.; Carey, R.; Jacquet, G.A. The epidemiology of drowning in low- and middle-income countries: A systematic review. BMC Public Health 2017, 17, 413. [Google Scholar] [CrossRef] [PubMed]
- Lawes, J.C.; Uebelhoer, L.; Koon, W.; Strasiotto, L.; Anne, F.; Daw, S.; Brander, R.W.; Mulcahy, N.; Peden, A.E. Understanding a population: A methodology for a population-based coastal safety survey. PLoS ONE 2021, 16, e0256202. [Google Scholar] [CrossRef]
- Samet, J.M.; Schnatter, R.; Gibb, H. Invited Commentary: Epidemiology and Risk Assessment. Am. J. Epidemiol. 1998, 148, 929–936. [Google Scholar] [CrossRef] [Green Version]
- Koon, W.; Peden, A.; Lawes, J.C.; Brander, R.W. Coastal drowning: A scoping review of burden, risk factors, and prevention strategies. PLoS ONE 2021, 16, e0246034. [Google Scholar] [CrossRef]
- Castelle, B.; Scott, T.; Brander, R.; McCarroll, R.J.; Tellier, E.; de Korte, E.; Tackuy, L.; Robinet, A.; Simonnet, B.; Salmi, L.-R. Wave and Tide Controls on Rip Current Activity and Drowning Incidents in Southwest France. J. Coast. Res. 2020, 95, 769–774, 766. [Google Scholar] [CrossRef]
- Morgan, D.; Ozanne-Smith, J. A configural model of expert judgement as a preliminary epidemiological study of injury problems: An application to drowning. PLoS ONE 2019, 14, e0211166. [Google Scholar] [CrossRef]
- Dominteanu, T. Drowning And Rescue From Drowning. Marathon 2016, 8, 37–42. Available online: https://ideas.repec.org/a/rom/marath/v8y2016i1p37-42.html (accessed on 16 December 2021).
- Blumenthal, M. Dimensions of traffic safety problem. Traffic Saf. Res. Rev. 1968, 12, 6. [Google Scholar]
- van Beeck, E.; Branche., C.; Szpilman, D.; Modell, J.; Bierens, J. Definition of drowning. In Handbook on Drowning: Prevention, Rescue, Treatment; Bierens, J.J.L.M., Ed.; Springer: Heidelberg, Germany, 2006; pp. 45–47. [Google Scholar]
- Finch, C. A new framework for research leading to sports injury prevention. J. Sci. Med. Sport 2006, 9, 3–9. [Google Scholar] [CrossRef] [PubMed]
- Susser, M.; Susser, E. Choosing a future for epidemiology: I. Eras and paradigms. Am. J. Public Health 1996, 86, 668–673. [Google Scholar] [CrossRef] [PubMed] [Green Version]
- Kweon, Y.-J.; Kockelman, K.M. Overall injury risk to different drivers: Combining exposure, frequency, and severity models. Accid. Anal. Prev. 2003, 35, 441–450. [Google Scholar] [CrossRef]
- Robertson, L.S. Injury Epidemiology; Lulu Press Inc.: Durham, NC, USA, 2015. [Google Scholar]
- Morgan, D. Analyzing the risk of drowning at surf beaches. Tour. Rev. Int. 2006, 10, 125–130. [Google Scholar] [CrossRef] [Green Version]
- Morgan, D.; Ozanne-Smith, J. Identification of observed factors that predict bather water-immersions at beaches. Ocean Coast. Manag. 2013, 84, 180–183. [Google Scholar] [CrossRef]
- Dawes, R.M. The robust beauty of improper linear models in decision making. Am. Psychol. 1979, 34, 571. [Google Scholar] [CrossRef]
- Ægisdóttir, S.; White, M.J.; Spengler, P.M.; Maugherman, A.S.; Anderson, L.A.; Cook, R.S.; Nichols, C.N.; Lampropoulos, G.K.; Walker, B.S.; Cohen, G. The meta-analysis of clinical judgment project: Fifty-six years of accumulated research on clinical versus statistical prediction. Couns. Psychol. 2006, 34, 341–382. [Google Scholar] [CrossRef]
- Grove, W.M.; Zald, D.H.; Lebow, B.S.; Snitz, B.E.; Nelson, C. Clinical versus mechanical prediction: A meta-analysis. Psychol. Assess. 2000, 12, 19. [Google Scholar] [CrossRef] [PubMed]
- Dawes, R.M.; Corrigan, B. Linear models in decision making. Psychol. Bull. 1974, 81, 95. [Google Scholar] [CrossRef]
- Morgan, D.; Ozanne-Smith, J. Measurement of a drowning incidence rate combining direct observation of an exposed population with mortality statistics. Int. J. Inj. Control Saf. Promot. 2015, 22, 209–214. [Google Scholar] [CrossRef]
- Morgan, D.; Ozanne-Smith, J.; Triggs, T. Self-reported water and drowning risk exposure at surf beaches. Aust. N. Z. J. Public Health 2009, 33, 180–188. [Google Scholar] [CrossRef]
- Morgan, D.; Ozanne-Smith, J.; Triggs, T. Direct observation measurement of drowning risk exposure for surf beach bathers. J. Sci. Med. Sport 2009, 12, 457–462. [Google Scholar] [CrossRef] [PubMed]
- Morgan, D.; Ozanne-Smith, J. Development and trial of a water exposure measure of estimated drowning risk for surf bathers. Int. J. Aquat. Res. Educ. 2013, 7, 4. [Google Scholar] [CrossRef] [Green Version]
- Morgan, D.; Ozanne-Smith, J.; Triggs, T. Descriptive epidemiology of drowning deaths in a surf beach swimmer and surfer population. Inj. Prev. 2008, 14, 62–65. [Google Scholar] [CrossRef]
- Morgan, D.; Ozanne-Smith, J. Surf bather drowning risk and exposure-related factors identified by an expert panel. Int. J. Aquat. Res. Educ. 2012, 6, 8. [Google Scholar] [CrossRef] [Green Version]
- Agresti, A.; Coull, B.A. Approximate is better than “exact” for interval estimation of binomial proportions. Am. Stat. 1998, 52, 119–126. [Google Scholar] [CrossRef]
- Sauro, J.; Lewis, J.R. Estimating completion rates from small samples using binomial confidence intervals: Comparisons and recommendations. In Proceedings of the Human Factors and Ergonomics Society Annual Meeting, Orlando, FL, USA, 1 September 2005; pp. 2100–2103. [Google Scholar] [CrossRef]
- MeasuringU. Confidence Interval Calculator for a Completion Rate. Available online: https://measuringu.com/calculators/wald/ (accessed on 23 October 2009).
- Press, E.; Walker, J.; Crawford, I. An interstate drowning study. Am. J. Public Health Nations Health 1968, 58, 2275–2289. [Google Scholar] [CrossRef]
- Benetos, A.; Waeber, B.; Izzo, J.; Mitchell, G.; Resnick, L.; Asmar, R.; Safar, M. Influence of age, risk factors, and cardiovascular and renal disease on arterial stiffness: Clinical applications. Am. J. Hypertens. 2002, 15, 1101–1108. [Google Scholar] [CrossRef]
- Piña, I.L.; Apstein, C.S.; Balady, G.J.; Belardinelli, R.; Chaitman, B.R.; Duscha, B.D.; Fletcher, B.J.; Fleg, J.L.; Myers, J.N.; Sullivan, M.J. Exercise and heart failure: A statement from the American Heart Association Committee on exercise, rehabilitation, and prevention. Circulation 2003, 107, 1210–1225. [Google Scholar] [CrossRef] [PubMed]
- Morgan, D. Counting beach visitors: Tools, methods and management applications. In Beach Management Tools-Concepts, Methodologies and Case Studies; Springer: Heidelberg, Germany, 2018; pp. 561–577. [Google Scholar]
- Clarke, K.A. Return of the phantom menace: Omitted variable bias in political research. Confl. Manag. Peace Sci. 2009, 26, 46–66. [Google Scholar] [CrossRef]
- Hoffman, P.J. Cue-consistency and configurality in human judgment. In Formal Representation of Human Judgement; Kleinmuntz, B., Ed.; Wiley: New York, NY, USA, 1967; pp. 53–90. [Google Scholar]
- Aiken, L.S.; West, S.G.; Reno, R.R. Multiple Regression: Testing and Interpreting Interactions; Sage: Newbury Park, CA, USA, 1993. [Google Scholar]
- Hoffman, P.J. The paramorphic representation of clinical judgment. Psychol. Bull. 1960, 57, 116. [Google Scholar] [CrossRef]
- Howell, D.C. Statistical Methods for Psychology; Cengage Learning: Boston, MA, USA, 2012. [Google Scholar]
- Last, J. A Dictionary of Epidemiology; Oxford University Press: New York, NY, USA, 2001. [Google Scholar]
Figure 1.
System approach model of surf bather drowning adapted from Blumenthal [9].
Figure 1.
System approach model of surf bather drowning adapted from Blumenthal [9].

Figure 2.
Flowchart depicting relationships among risk exposure, risk factors and risk markers [15]. Components may include time of day, daily temperature, day type, surf conditions or beach amenity [16]. Risk markers may include age, gender, ethnic background.

Figure 3.
Comparisons of risk analysis drowning ratios and specific drowning rates.


Table 1.
Data applied in drowning risk analysis.
| Risk Analysis Element | Dataset Description | Data Source | Reports |
|---|---|---|---|
| Exposure components | Person-time crude water exposure (minutes) | Direct observation Self-report in situ | [21,22,23,24] |
| Risk markers | Gender: Male/female Age: <30 years/≥30 years Bather type: Wader/swimmer/surfer | Direct observation Self-report in situ Coronial records | [21,22,23,25] |
| Causal risk factors | Swimming ability Surf swimming experience Wave height (rip current indicator) | Expert panel Specialist ratings | [7,22,26] |
| Gold standard comparison | Drowning mortality | Coronial records | [25] |
Table 2.
Conceptual summary of study method.
| Step 1 To specify total drowning risk factor contribution for each subgroup |
| Information sources and analysis: Mean subgroup score derived from bathers’ self-reported swimming abilities, surf swimming experience and prevailing wave size (on day surveyed), weighted by each measured variable’s modelled contribution to drowning risk [7,22] |
| Outcome: Subgroup score representing average total drowning risk from selected factors |
| Step 2 To specify comparative total water exposure time between subgroups |
| Information sources: Total time in minutes exposed to water by subgroup [23] |
| Outcome: Ratio of water exposure for selected subgroups |
| Step 3 To specify comparative subgroups drowning risk accounting for water exposure |
| Information sources and analysis: Subgroup total drowning risk (step 1) weighted by comparative water exposure (step 2) |
| Outcome: Derived ratio of total drowning risk for selected subgroups |
| Step 4 To specify comparative drowning rate between subgroups as the gold standard |
| Information sources: Ratio of drowning frequency for subgroups from mortality data for a defined period [25] |
| Outcome: Comparative rate of drowning frequency between selected subgroups |
| Step 5 Comparison of derived drowning ratio with comparative drowning rate |
| Information sources: Derived subgroup drowning ratio (step 3) and comparative subgroup drowning rate (step 4) |
| Outcome: Derived ratio from inferential data assessed against gold standard from mortality data |
Table 3.
Subgroup drowning risk based on risk factors and exposure to water.
| Subgroups | Drowning Risk Contribution (DR) | Crude Water Time-Exposure Ratio (ER) | Total Drowning Risk (DRxER) |
|---|---|---|---|
| Within gender: | |||
| 5.02 | 4.24 | 21.29 |
| 5.74 | 1.00 | 5.74 |
| Within age: | |||
| 5.44 | 1.75 | 9.52 |
| 5.36 | 1.00 | 5.36 |
| Gender by age: | |||
| 5.05 | 13.93 | 70.33 |
| 5.01 | 9.59 | 48.07 |
| 5.70 | 4.55 | 25.95 |
| 5.77 | 1.00 | 5.77 |
| Within activity: | |||
| 4.26 | 1.96 | 8.35 |
| 5.74 | 1.00 | 5.74 |
| 4.26 | 4.18 | 17.81 |
| 5.43 | 1.00 | 5.43 |
| Activity by gender: | |||
| 5.67 | 2.75 | 15.60 |
| 5.17 | 1.00 | 5.17 |
| 3.99 | 16.63 | 66.29 |
| 5.79 | 1.00 | 5.79 |
| Activity by age: | |||
| 5.36 | 2.30 | 12.32 |
| 5.50 | 1.00 | 5.50 |
| 4.40 | 1.39 | 6.12 |
| 4.14 | 1.00 | 4.14 |
Table 4.
Risk analysis drowning ratios and drowning rates.
| Bather Subgroup Drowning Risk Comparison | Derived Drowning Ratio a | Specific Drowning Rate b | Specific Drowning Rate Antecedent 95% CI |
|---|---|---|---|
| Males:Females | 3.71:1.00 | 6.11:1.00 | 3.71 to 10.11 |
| <30 years:≥30 years | 1.78:1.00 | 0.44:1.00 | 0.30 to 0.64 |
| Males <30 years:Females ≥30 years | 12.18:1.00 | 2.50:1.00 | 1.35 to 4.63 |
| Males ≥30 years:Females ≥30 years | 8.33:1.00 | 5.34:1.00 | 3.03 to 9.55 |
| Females <30 years:Females ≥30 years | 4.50:1.00 | 0.29:1.00 | 0.09 to 0.84 |
| Surf:Swim or wade | 1.45:1.00 | 0.18:1.00 | 0.11 to 0.30 |
| Surf:Swim | 3.28:1.00 | 0.18:1.00 | 0.11 to 0.30 |
| Male swim:Female swim | 3.02:1.00 | 5.35:1.00 | 3.19 to 9.03 |
| Male surf:Female surf | 11.45:1.00 | 19.00:1.00 | 2.93 to >999 |
| Swim <30 years:Swim ≥30 years | 2.24:1.00 | 0.38:1.00 | 0.25 to 0.58 |
| Surf <30 years:Surf ≥30 years | 1.48:1.00 | 0.82:1.00 | 0.35 to 1.92 |
Note: a derived from study data. b derived from mortality data.
Table 5.
Summary results for comparison between derived drowning ratio and specific drowning rate for subgroups within risk marker groups.
Table 5.
Summary results for comparison between derived drowning ratio and specific drowning rate for subgroups within risk marker groups.
| Drowning Subgroup Comparison | Relative Drowning Forecast a | Comparison with Recorded Drownings | Statistical Difference? b | |
|---|---|---|---|---|
| 1 | Male vs. Female | 4 to 1 | Recorded drownings above forecast | No |
| Male surf vs. Female surf | 11 to 1 | |||
| 2 | Male swim vs. Female swim | 3 to 1 | Yes | |
| 3 | Males ≥30 years vs. Females ≥30 years | 8 to 1 | Recorded drownings below forecast | No |
| Surfers <30 years vs. Surfers ≥30 years | 1 to 1 | |||
| 4 | <30 years vs. ≥30 years | 2 to 1 | Yes | |
| Males <30 years vs. Females ≥30 years | 12 to 1 | |||
| Females <30 years vs. Females ≥30 years | 5 to 1 | |||
| Swim <30 years vs. Swim ≥30 years | 1 to 1 | |||
| Surf vs. Swim or wade | 1 to 1 | |||
| Surf vs. Swim | 3 to 1 |
Note: a Ratio antecedent rounded to nearest integer; b From rate antecedent 95% CI.
Table 6.
Speculative explanations for comparisons between drowning forecast and drowning rate based on risk markers.
Table 6.
Speculative explanations for comparisons between drowning forecast and drowning rate based on risk markers.
| Drowning Risk Contributor | Forecast Equivalent to Rate | Forecast Not Equivalent to Rate |
|---|---|---|
| Risk factors | Total significant drowning risk captured by the three included factors in the mathematical model. Or Total significant drowning risk not captured by the included three factors; one or more uncaptured factor had an even drowning risk contribution within subgroups. | Significant drowning risk from one or more uncaptured factor has an uneven impact within subgroups. |
| And | And/or | |
| Risk exposure | Exposure estimate is valid for Australian surf bather subgroups. | Exposure estimate is not valid for Australian surf bather subgroups. |
Note: Equivalence based on comparison of the derived ratio antecedent with the specific rate antecedent 95% CI (Table 4).
Publisher’s Note: MDPI stays neutral with regard to jurisdictional claims in published maps and institutional affiliations. |
© 2021 by the authors. Licensee MDPI, Basel, Switzerland. This article is an open access article distributed under the terms and conditions of the Creative Commons Attribution (CC BY) license (https://creativecommons.org/licenses/by/4.0/).
Share and Cite
MDPI and ACS Style
Morgan, D.; Ozanne-Smith, J. Drowning Risk Analysis Comparing Surf Bather Subgroups. Appl. Sci. 2021, 11, 12047. https://0-doi-org.brum.beds.ac.uk/10.3390/app112412047
AMA Style
Morgan D, Ozanne-Smith J. Drowning Risk Analysis Comparing Surf Bather Subgroups. Applied Sciences. 2021; 11(24):12047. https://0-doi-org.brum.beds.ac.uk/10.3390/app112412047
Chicago/Turabian StyleMorgan, Damian, and Joan Ozanne-Smith. 2021. "Drowning Risk Analysis Comparing Surf Bather Subgroups" Applied Sciences 11, no. 24: 12047. https://0-doi-org.brum.beds.ac.uk/10.3390/app112412047
Note that from the first issue of 2016, this journal uses article numbers instead of page numbers. See further details here.