
Optimal Design Approach Applied to Headspace GC for the Monitoring of Diacetyl Concentration, Spectrophotometric Assessment of Phenolic Compounds and Antioxidant Potential in Different Fermentation Processes of Barley

 ,
,  ,
,  ,
,  , , and
Abstract
:1. Introduction
2. Materials and Methods
2.1. Materials
2.2. Stopped Fermentation Methods
2.3. Thermal Process
2.4. Chemicals
2.5. Concepts on Experimental Designs
2.5.1. Methods
Nemrodw
Factors and Response
- -
- Oven temperature. (Measured by x1 in °C).
- -
- Intel Back Temperature. (Measured by x2 in °C).
- -
- Column pressure. (Measured by x3 in ATM).
2.6. Qualitative and Quantitative Methods
2.6.1. The Determination of Diacetyl and 2,3-Pentanedione in Packaged Beer Using Headspace Gas Chromatography
- A-
- Internal standard stock solution
- 150 μL 2,3-hexanedione in 100 mL ethanol
- B-
- Internal standard working solution
- 2.0 mL stock solution (A) in 200 mL 5% (v/v) ethanol
2.6.2. The Determination of Acetaldehyde, Dimethyl Sulfide, Esters, and Higher Alcohols by Gas Chromatography
X-Internal Standard Stock Solution
Y-Internal Standard Working Solution
2.6.3. Spectroscopic Analysis of Polyphenols
2.6.4. Determination of Total Phenolic Content (TPC)
2.6.5. Determination of Flavonoid Content (TFC)
2.6.6. Determination of Free Radical Scavenging Activity in Beer by DPPH
Determination
Calculation of the Results
3. Results and Discussion
3.1. Experimental Area
- -
- Oven temperature = 70 °C
- -
- 70 °C ≤ Intel Back Temperature ≤130 °C
- -
- 39 atm ≤ Column Pressure ≤ 40 atm
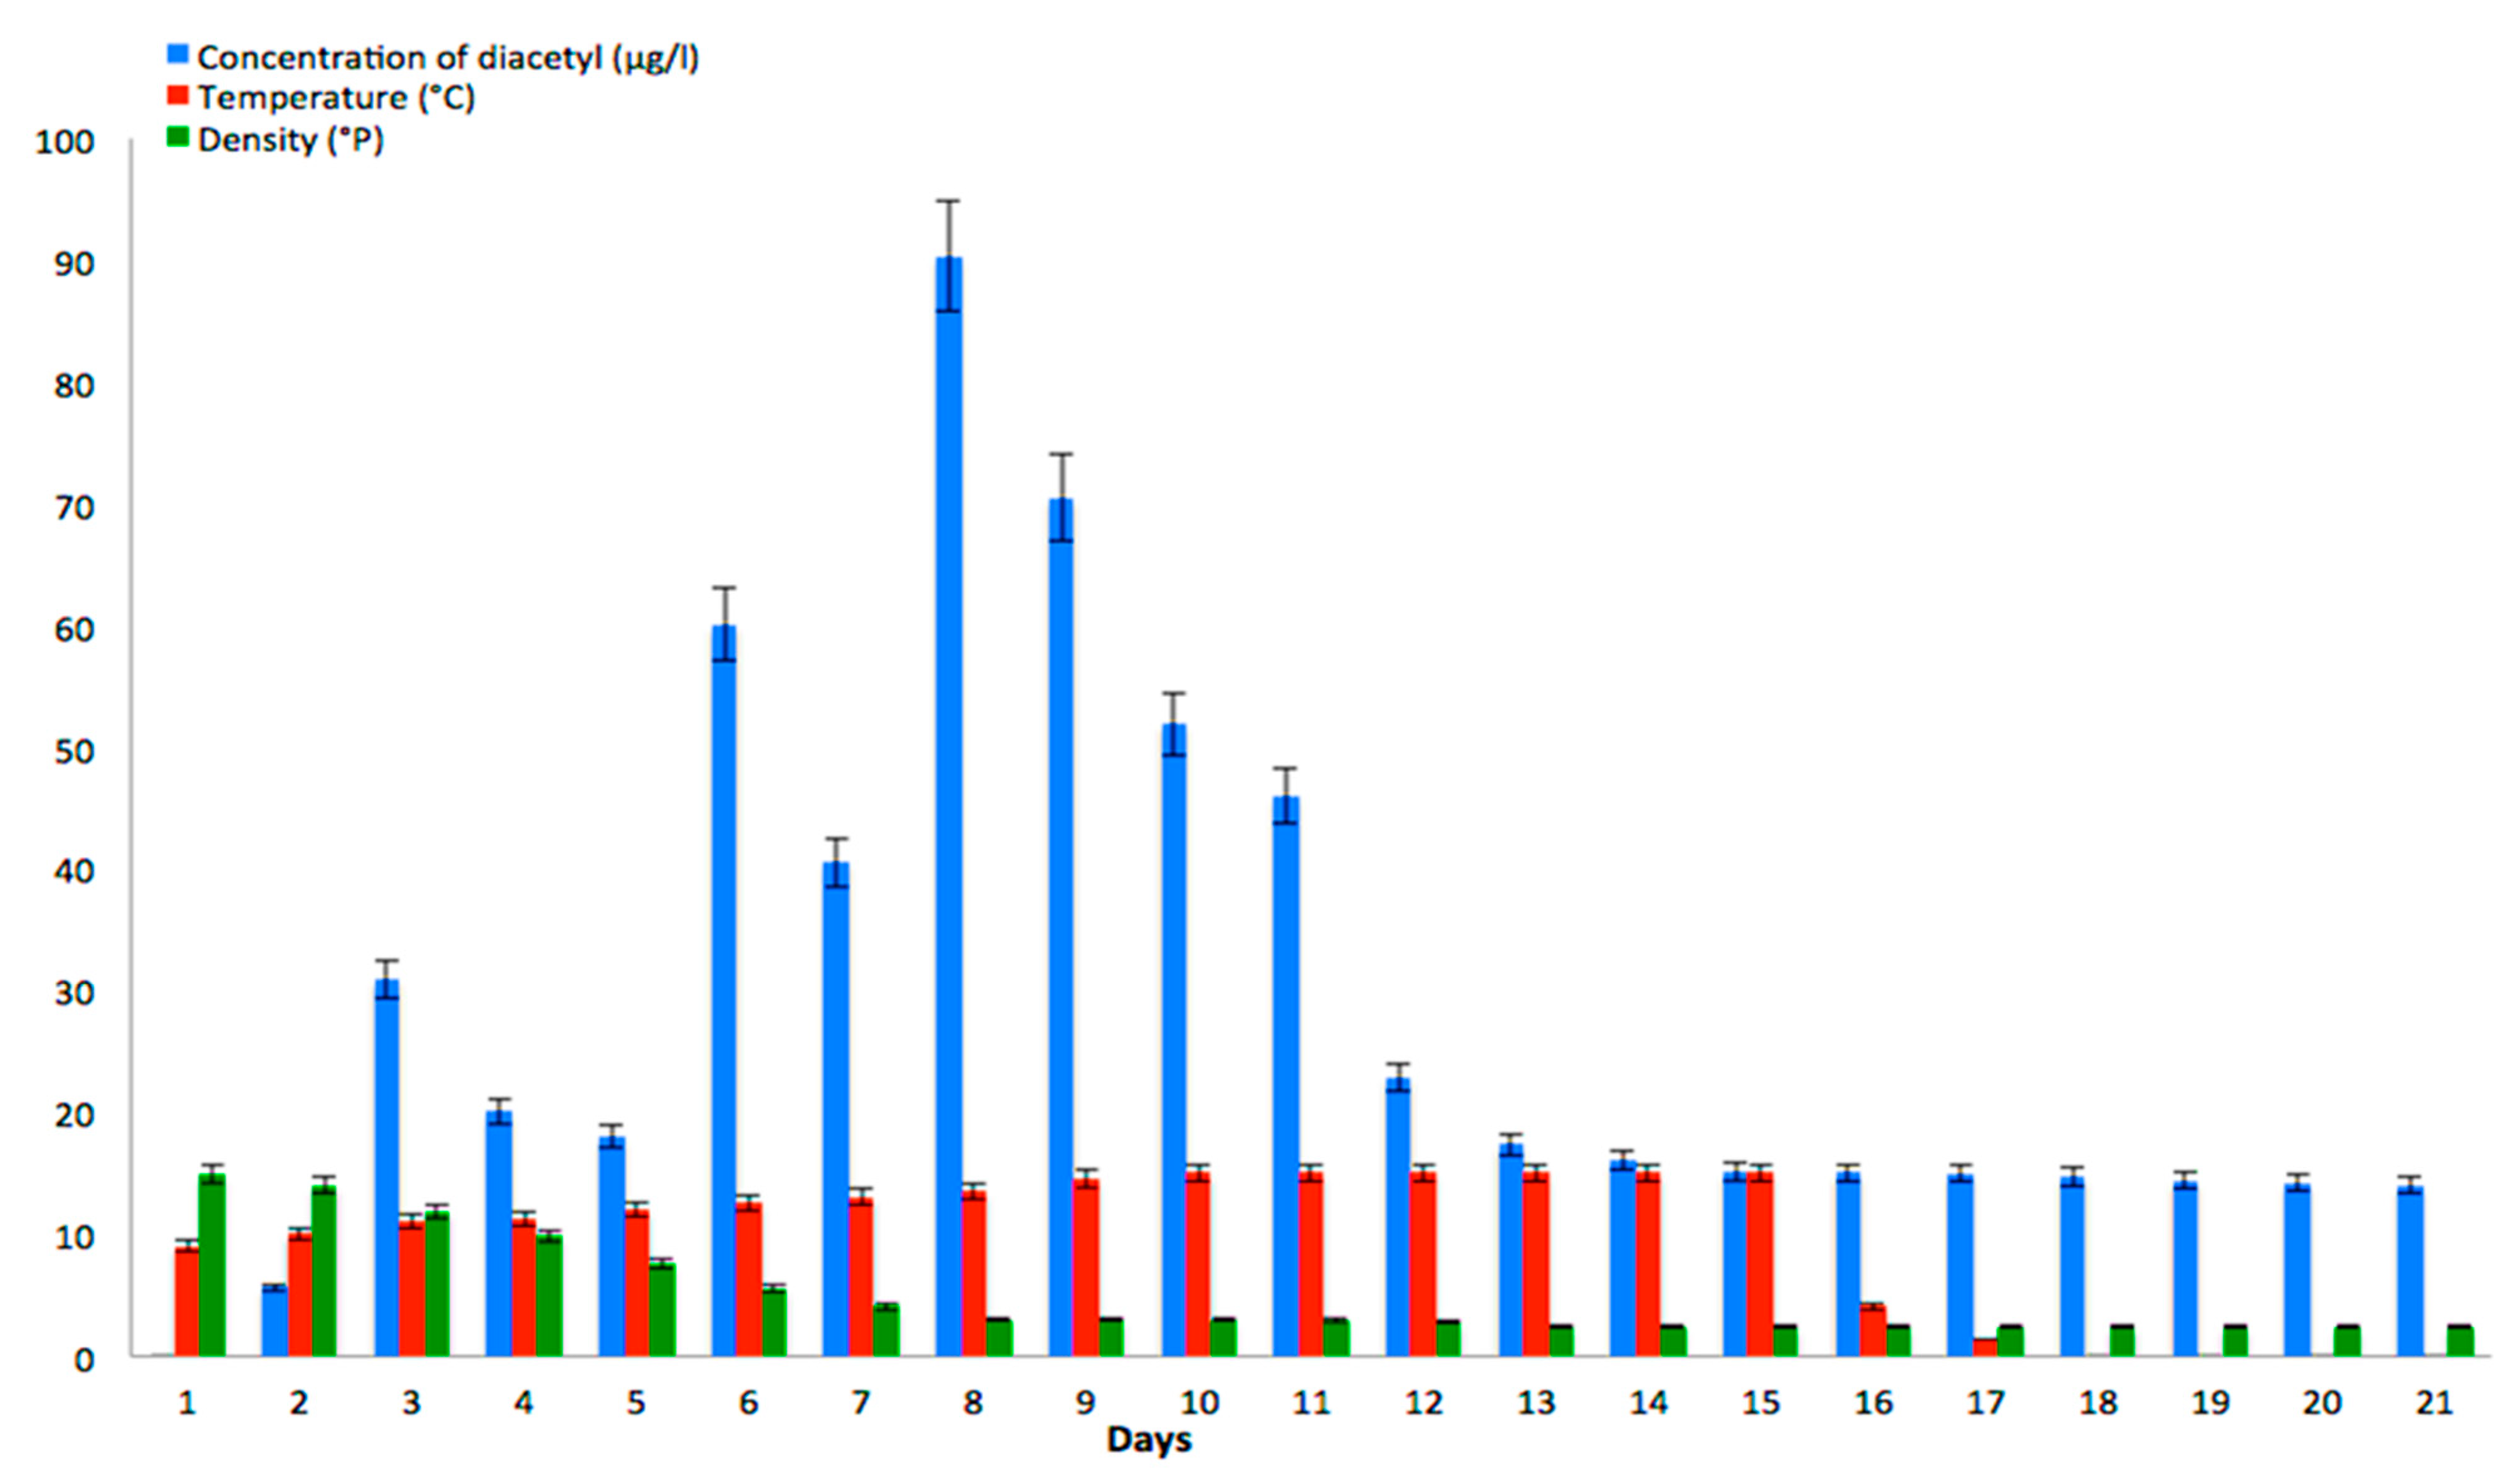
3.2. Interpretation of Analysis in Various Fermentation Conditions
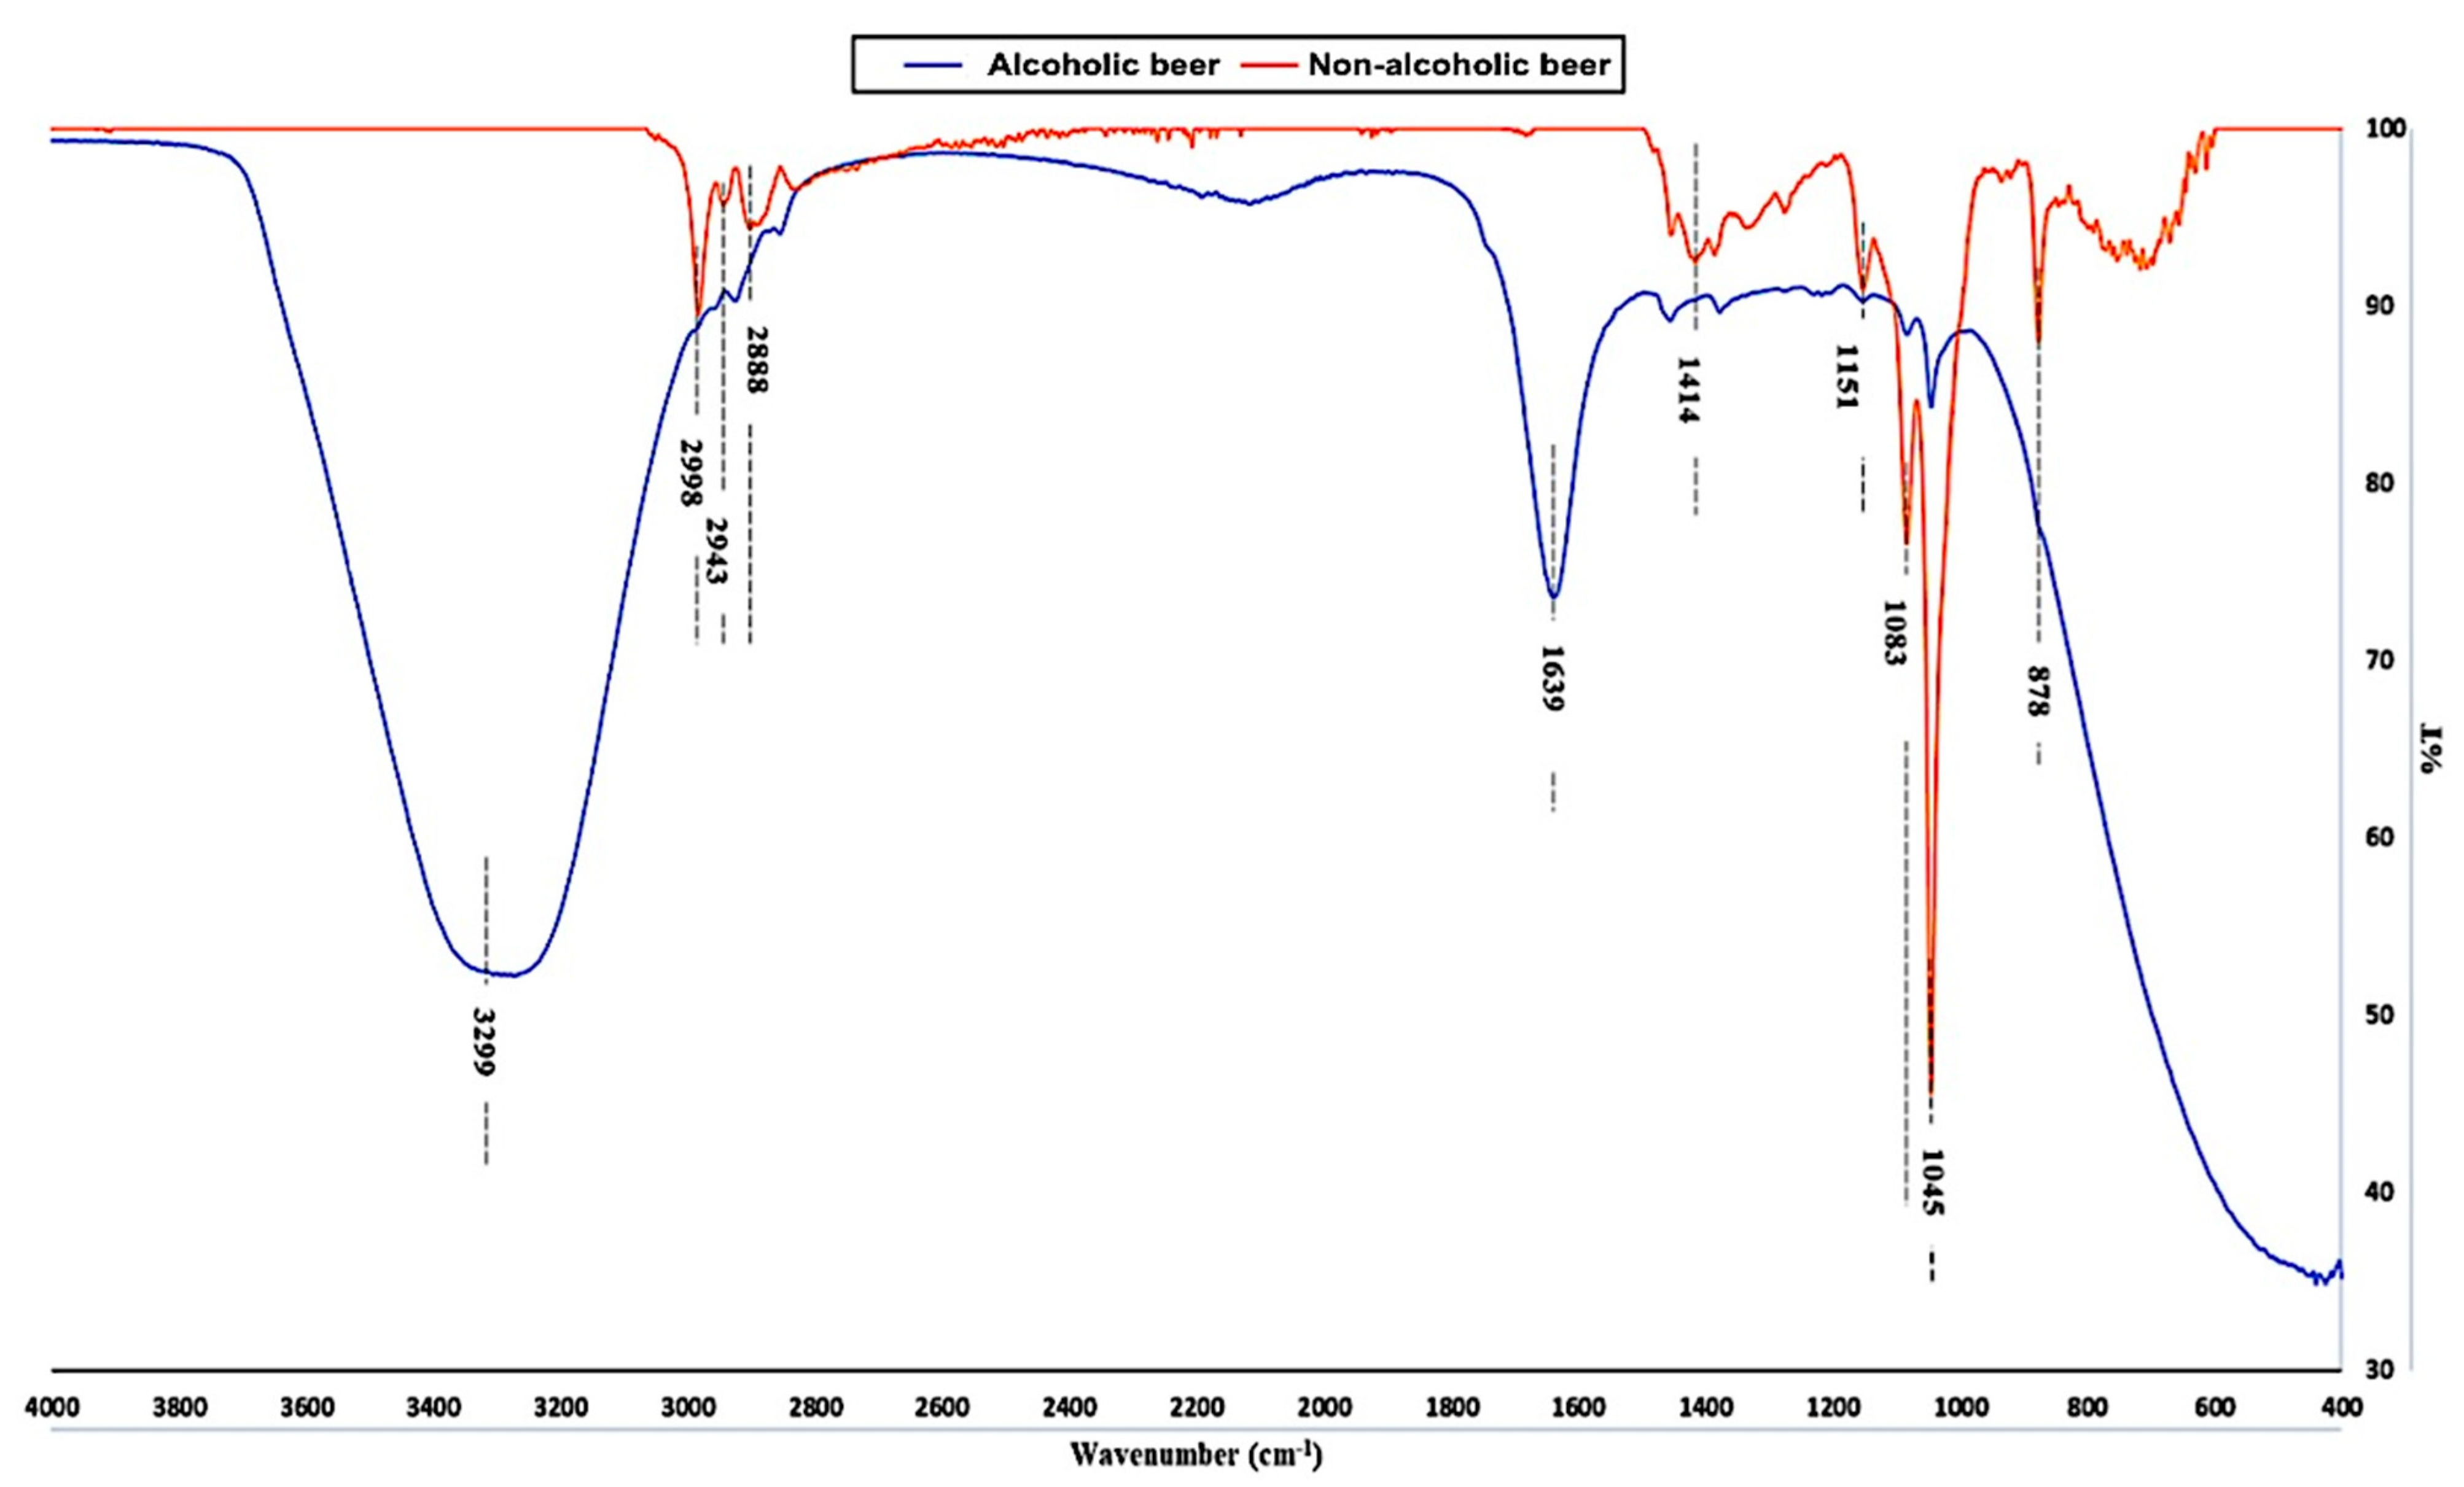
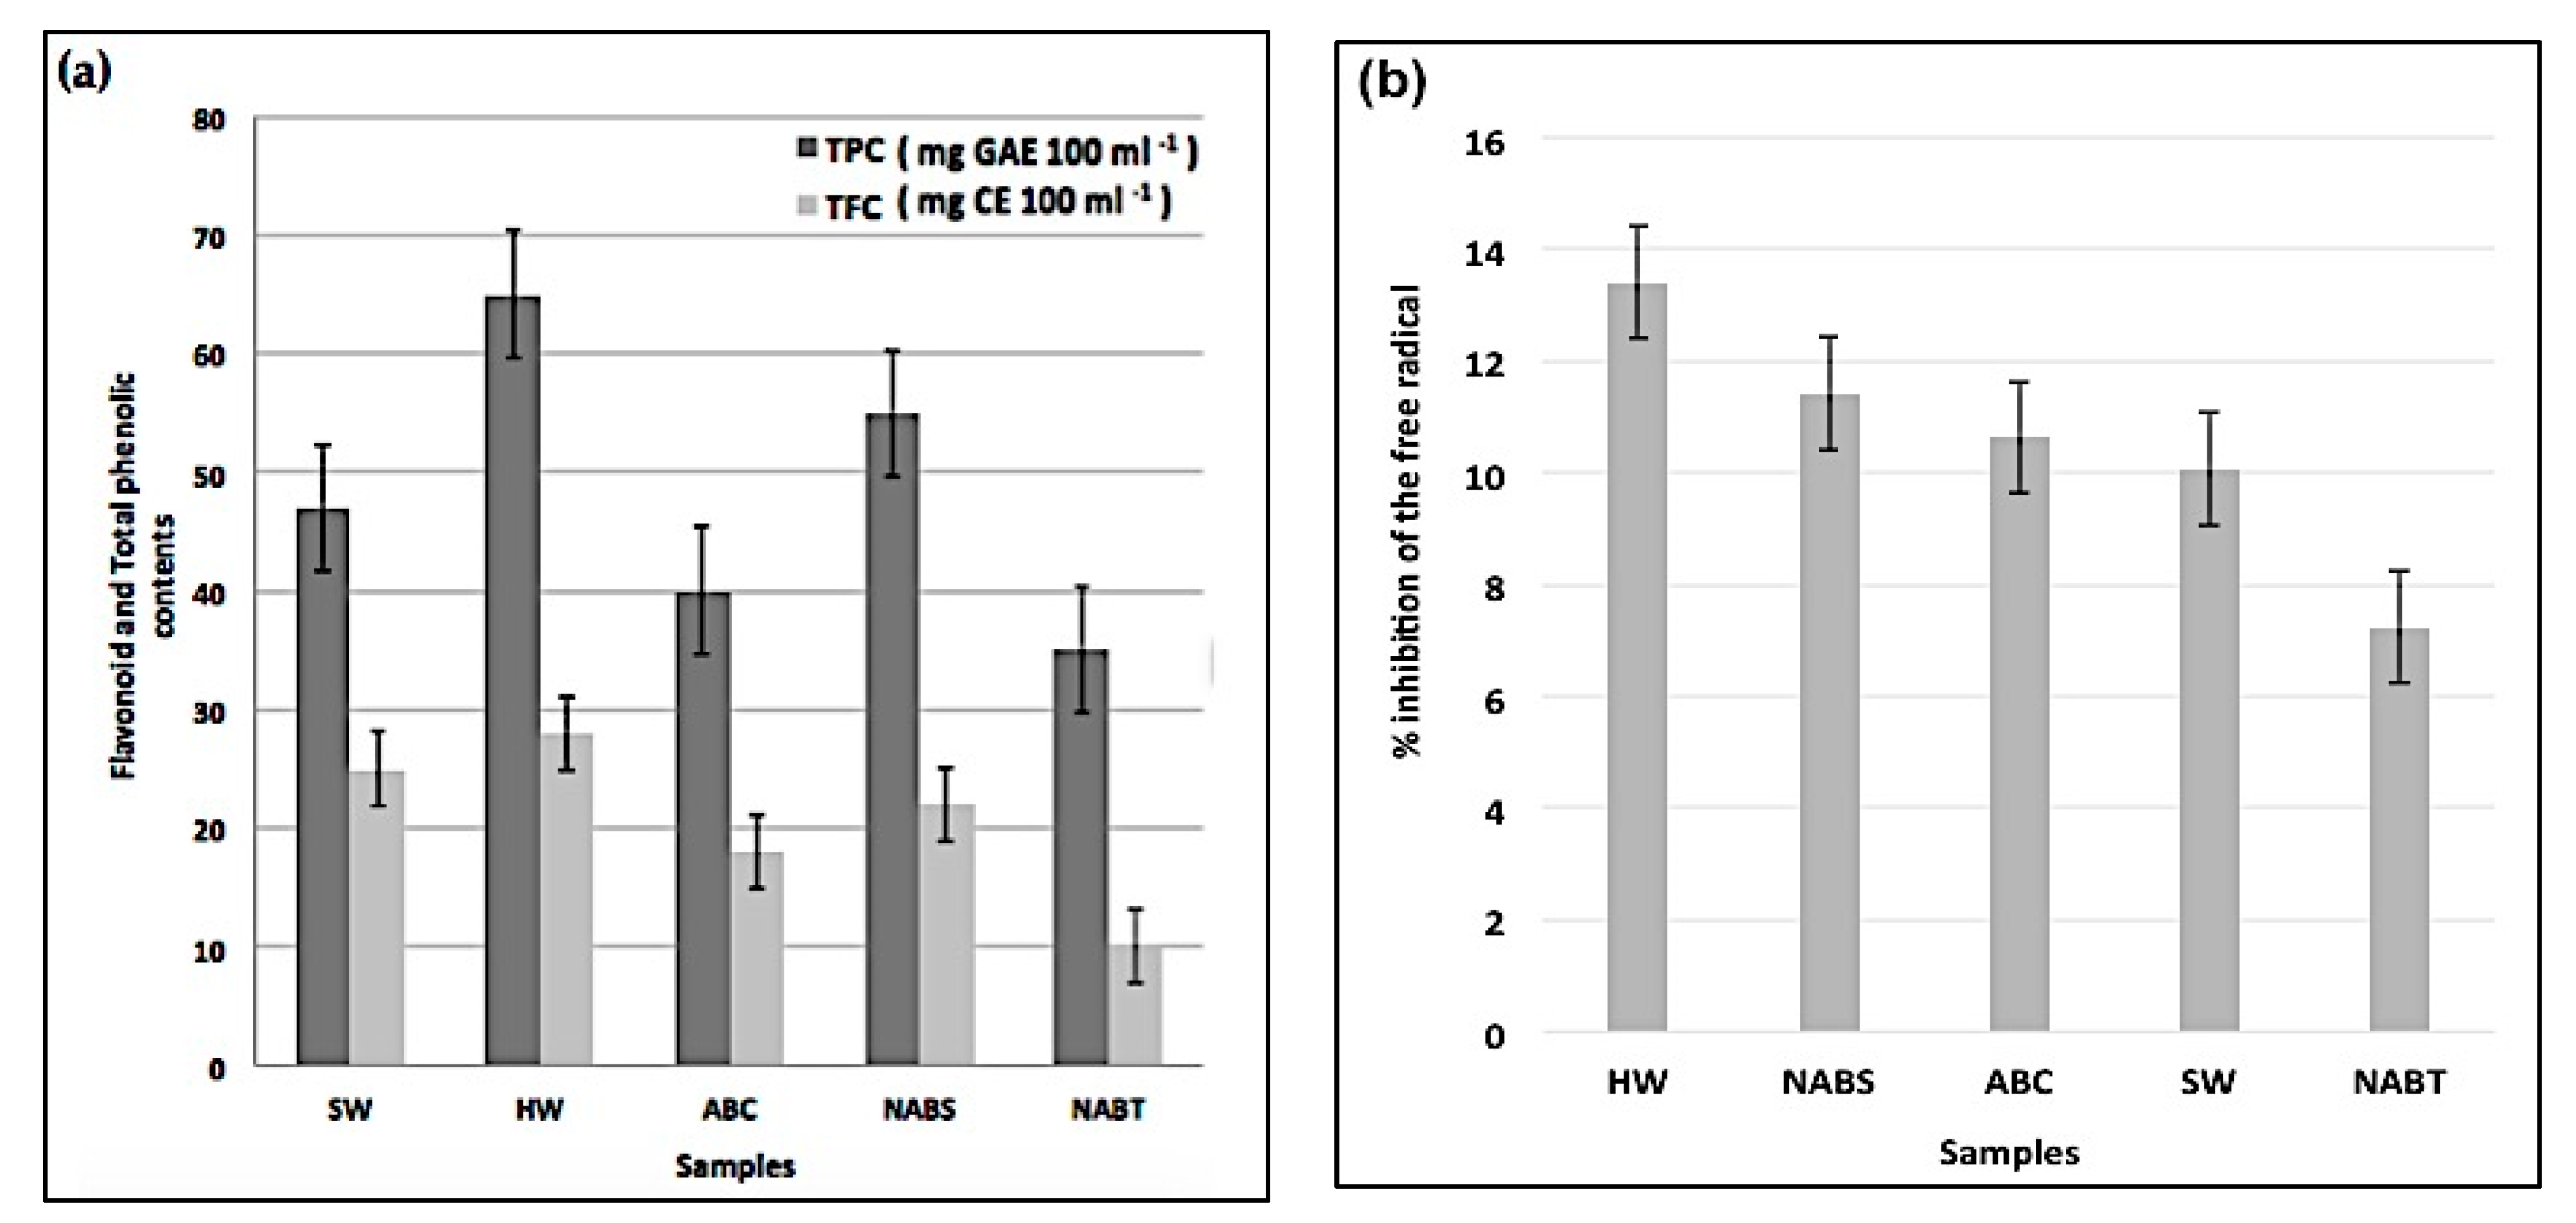
3.3. Interpretation of Spectroscopic Analysis
4. Conclusions
Author Contributions
Funding
Institutional Review Board Statement
Informed Consent Statement
Data Availability Statement
Conflicts of Interest
References
- Bamforth, C.W. Current perspectives on the role of enzymes in brewing. J. Cereal Sci. 2009, 50, 353–357. [Google Scholar] [CrossRef]
- Olaniran, A.O.; Hiralal, L.; Mokoena, M.P.; Pillay, B. Flavour-active volatile compounds in beer: Production, regulation, and control. J. Inst. Brew. 2017, 123, 13–23. [Google Scholar]
- Guido, L.F.; Rodrigues, P.G.; Rodrigues, J.A.; Gonçalves, C.R.; Barros, A.A. The impact of the physiological condition of the pitching yeast on beer flavor stability: An industrial approach. Food Chem. 2004, 87, 187–193. [Google Scholar] [CrossRef]
- Pires, E.J.; Teixeira, J.A.; Branyik, T.; Vicente, A.A. Yeast: The soul of beer’s aroma a review of flavor—Active esters and higher alcohols produced by the brewing yeast. Appl. Microbiol. Biotechnol. 2014, 98, 1937–1949. [Google Scholar] [CrossRef] [PubMed] [Green Version]
- Kunze, W. Technology Brewing and Malting; VLB Berlin: Berlin, Germany, 1996. [Google Scholar]
- Piddocke, M.; Olsson, L. Beer Brewing, Applications of Metabolic Engineering; John Wiley & Sons Inc.: Hoboken, NJ, USA, 2010. [Google Scholar]
- Saerens, S.M.G.; Duong, C.T.; Nevoigt, E. Genetic improvement of brewer’s yeast: Current state, perspectives, and limits. Appl. Microbiol. Biotechnol. 2010, 86, 1195–1212. [Google Scholar] [CrossRef] [PubMed]
- Kopsahelis, N.; Kanellaki, M.; Bekatorou, A. Low temperature brewing using cells immobilized on brewer’s spent grains. Food Chem. 2007, 104, 480–488. [Google Scholar] [CrossRef]
- Witrick, K.; Pitts, E.R.; O’Keefe, S.F. Analysis of Lambic Beer Volatiles during Aging Using Gas Chromatography–Mass Spectrometry (GCMS) and Gas Chromatography–Olfactometry (GCO). Beverages 2020, 6, 31. [Google Scholar] [CrossRef]
- Bekatorou, A.; Soupioni, M.J.; Koutinas, A.; Kanellaki, M. Low-temperature brewing by freeze-dried immobilized cells. Appl. Biochem. Biotechnol. 2002, 97, 105–122. [Google Scholar] [CrossRef]
- McKernan, L.T.; McKernan, L.T.; Kreiss, K.; Hubbs, A.; Park, R.; Dankovic, D.; Dunn, K.H.; Parker, J.; Fedan, K.; Streicher, R.; et al. Criteria for a Recommended Standard: Occupational Exposure to Diacetyl and 2,3-Pentanedione; Publication No. 2016-111; National Institute for Occupational Safety and Health: Cincinnati, OH, USA, 2016.
- Kreiss, K.; Gomaa, A.; Kullman, G.; Fedan, K.; Simoes, E.J.; Enright, P.L. Clinical bronchiolitis obliterans in workers at a microwave-popcorn plant. N. Engl. J. Med. 2002, 347, 330–338. [Google Scholar] [CrossRef] [Green Version]
- Curwin, B.D.; Deddens, J.A.; McKernan, L.T. Flavoring exposure in food manufacturing. J. Expo. Sci. Environ. Epidemiol. 2014, 25, 121. [Google Scholar] [CrossRef] [Green Version]
- Klager, S.; Vallarino, J.; MacNaughton, P.; Christiani, D.C.; Lu, Q.; Allen, J.G. Flavoring chemicals and aldehydes in E-cigarette emissions. Environ. Sci. Technol. 2017, 51, 10806–10813. [Google Scholar] [CrossRef]
- Allen, J.G.; Flanigan, S.S.; LeBlanc, M.; Vallarino, J.; Mac Naughton, P.; Stewart, J.H.; Christiani, D.C. Flavoring chemicals in E-cigarettes: Diacetyl, 2,3-pentanedione, and acetoin in a sample of 51 products, including fruit-, candy-, and cocktail- flavored E-cigarettes. Environ. Health Perspect. 2016, 124, 733–739. [Google Scholar] [CrossRef] [PubMed]
- Kucharczyk, K.; Żyła, K.; Tuszyński, T. Simultaneous Optimization of Acetaldehyde and DMS Concentrations for Better Sensory Quality of Beer Fermented on an Industrial Scale. Foods 2020, 9, 1043. [Google Scholar] [CrossRef] [PubMed]
- Kelly, F.L.; Sun, J.; Fischer, B.M.; Voynow, J.A.; Kummarapurugu, A.B.; Zhang, H.L.; Nugent, J.L.; Beasley, R.F.; Martinu, T.; Gwinn, W.M.; et al. Diacetyl induces amphiregulin shedding in pulmonary epithelial cells and in experimental bronchiolitis obliterans. Am. J. Respir. Cell. Mol. Biol. 2014, 51, 568–574. [Google Scholar] [CrossRef] [Green Version]
- Kelly, F.L.; Weinberg, K.E.; Nagler, A.E.; Nixon, A.B.; Star, M.D.; Todd, J.L.; Brass, D.M.; Palmer, S.M. EGFR-Dependent IL8 Production by Airway Epithelial Cells After Exposure to the Food Flavoring Chemical 2,3-Butanedione. Toxicol. Sci. 2019, 169, 534–542. [Google Scholar] [CrossRef]
- Gerloff, J.; Sundar, I.K.; Freter, R.; Sekera, E.R.; Friedman, A.E.; Robinson, R.; Pagano, T.; Rahman, I. Inflammatory response and barrier dysfunction by different e-cigarette flavoring chemicals identified by gas chromatography-mass spectrometry in e-liquids and e-vapors on human lung epithelial cells and fibroblasts. Appl. Vitr. Toxicol. 2017, 3, 28–40. [Google Scholar] [CrossRef] [PubMed]
- Muthumalage, T.; Prinz, M.; Ansah, K.O.; Gerloff, J.; Sundar, I.K.; Rahman, I. Inflammatory and oxidative responses induced by exposure to commonly used ecigarette flavoring chemicals and flavored e-liquids without nicotine. Front. Physiol. 2017, 8, 1130. [Google Scholar] [CrossRef] [PubMed] [Green Version]
- Kovacic, P.; Cooksy, A.L. Electron transfer as a potential cause of diacetyl toxicity in popcorn lung disease. Rev. Environ. Contam. Toxicol. 2010, 204, 133–148. [Google Scholar]
- Gwinn, W.M.; Flake, G.P.; Bousquet, R.W.; Taylor, G.J.; Morgan, D.L. Airway injury in an in vitro human epithelium-fibroblast model of diacetyl vapor exposure: Diacetyl-induced basal/suprabasal spongiosis. Inhal. Toxicol. 2017, 29, 310–321. [Google Scholar] [CrossRef]
- Hubbs, A.F.; Fluharty, K.L.; Edwards, R.J.; Barnabei, J.L.; Grantham, J.T.; Palmer, S.M.; Kelly, F.; Sargent, L.M.; Reynolds, S.H.; Mercer, R.R.; et al. Accumulation of ubiquitin and sequestosome-1 implicate protein damage in diacetyl-induced cytotoxicity. Am. J. Pathol. 2016, 186, 2887–2908. [Google Scholar] [CrossRef]
- Akpinar-Elci, M.; Travis, W.D.; Lynch, D.A.; Kreiss, K. Bronchiolitis obliterans syndrome in popcorn production plant workers. Eur. Respir. J. 2004, 24, 298–302. [Google Scholar] [CrossRef] [PubMed] [Green Version]
- Van Rooy, F.G.; Rooyackers, J.M.; Prokop, M.; Houba, R.; Smit, L.A.; Heederik, D.J. Bronchiolitis obliterans syndrome in chemical workers producing diacetyl for food flavorings. Am. J. Respir. Crit. Care Med. 2007, 176, 498–504. [Google Scholar] [CrossRef]
- Van Rooy, F.G.; Smit, L.A.; Houba, R.; Zaat, V.A.; Rooyackers, J.M.; Heederik, D.J. A cross-sectional study of lung function and respiratory symptoms among chemical workers producing diacetyl for food flavourings. Occup. Environ. Med. 2009, 66, 105–110. [Google Scholar] [CrossRef] [PubMed] [Green Version]
- Terazawa, K.; Mizukami, K.B.; Takatori, T. Fatality due to inhalation of dimethyl sulfide in a confined space: A case report and animal experiments. Int. J. Legal Med. 1991, 104, 141–144. [Google Scholar] [CrossRef] [PubMed]
- Montanari, L.; Marconi, O.; Mayer, H.; Fantozzi, P. Production of Alcohol-Free Beer. In Beer in Health and Disease Prevention; Academic Press: Cambridge, MA, USA, 2009; pp. 61–75. [Google Scholar] [CrossRef]
- Goupy, J. Introduction aux Plans D’expériences; Dunod: Paris, France, 2001; p. 303. [Google Scholar]
- Poirier, J. Analyse de la variance et de la régression. Plans d’expériences Techniques de l’ingénieur. Traité Mesures et contrôle. Ref. Tech. Sci. Expert. 1993, 260, 1–23. [Google Scholar]
- Singleton, V.L.; Orthofer, R.; Lamuela-Raventos, M. Analysis of Total Phenols and Other Oxidation Substrates and Antioxidants by Means of Folin-Ciocalteu Reagent. Methods Enzymol. 1999, 299, 152–178. [Google Scholar]
- Kim, D.O.; Jeong, S.W.; Lee, C.Y. Antioxidant Capacity of Phenolic Phytochemicals from Various Cultivars of Plums. Food Chem. 2003, 81, 321–326. [Google Scholar] [CrossRef]
- Benkeblia, N. Free radical scavenging capacity and antioxidant properties of some selected onions (Aliium cepa L.) and garlic (Aliium sativum L.) extracts. Braz. Arch. Biol. Technol. 2005, 48, 1–8. [Google Scholar] [CrossRef]
- Zufall, C.; Wackerbauer, K. Monatsschrift Process engineering parameters for the deaIcoholisation of beer by means of falling film evaporation and its influence on beer quality. Mon. Fur Brauwiss. 2000, 53, 124–137. [Google Scholar]
- Malakar, S.; Sanjib, K.P.; Jolvis Pou, K.R. Antioxidant activity of polyphenols extracted from hop used in craft beer. In Biotechnological Progress and Beverage Consumption; Grumezescu, A., Holban, A.M., Eds.; Academic Press: Salt Lake City, UT, USA, 2020; pp. 283–310. [Google Scholar] [CrossRef]
- Koren, D.; Kun, S.; Vecseri, B.H.; Kun-Farkas, G. Study of antioxidant activity during the malting and brewing process. J. Food Sci. Technol. 2019, 56, 3801–3809. [Google Scholar] [CrossRef] [Green Version]
- Ambra, R.; Pastore, G.; Lucchetti, S. The Role of Bioactive Phenolic Compounds on the Impact of Beer on Health. Molecules 2021, 26, 486. [Google Scholar] [CrossRef] [PubMed]


| Experience | Factors | Centre | Variation Degree |
|---|---|---|---|
| X1 | Oven temperature. | 100 °C | 30 |
| X2 | Intel Back Temperature. | 100 °C | 30 |
| X3 | Pressure Column. | 39.5 atm | 0.5 |
| Experience | Factor 1 | Factor 2 | Factor 3 |
|---|---|---|---|
| 1 | −1 | −1 | −1 |
| 2 | +1 | −1 | −1 |
| 3 | −1 | +1 | −1 |
| 4 | +1 | +1 | −1 |
| 5 | −1 | −1 | +1 |
| 6 | +1 | −1 | +1 |
| 7 | −1 | +1 | +1 |
| 8 | +1 | +1 | +1 |
| N° Test | Factor 1 | Factor 2 | Factor 3 |
|---|---|---|---|
| 1 | 70 | 70 | 39 |
| 2 | 130 | 70 | 39 |
| 3 | 70 | 130 | 39 |
| 4 | 130 | 130 | 39 |
| 5 | 70 | 70 | 40 |
| 6 | 130 | 70 | 40 |
| 7 | 70 | 130 | 40 |
| 8 | 130 | 130 | 40 |
| ECH | Oven Temperature (°C) | Intel Back Temperature (°C) | Pressure Column (atm) | RT | [Diacetyl] μg/L |
|---|---|---|---|---|---|
| Reference Sample | 70 | 150 | 39 | 5.6 | 16.5 |
| 1 | 70 | 70 | 39 | 5.602 | 17.06133 |
| 2 | 13 | 70 | 39 | ND (5.58) | 0 |
| 3 | 70 | 130 | 39 | 5.605 | 16.346 |
| 4 | 130 | 130 | 39 | ND | ND |
| 5 | 70 | 70 | 40 | 5.459 | 16.708 |
| 6 | 130 | 70 | 40 | ND (5.462) | 0 |
| 7 | 70 | 130 | 40 | 5.457 | 16.70835 |
| 8 | 130 | 130 | 40 | ND | ND |
| Detected Compounds | Final Product of Beer by Using Classical Fermentation | Final Product of Non-Alcoholic Beer by Using Stopping Fermentation | Final Product of Non-Alcoholic Beer by Using Thermal Process |
|---|---|---|---|
| Ethanol (vol%) | 5.2 | 0.4 | 0.02 |
| Acetaldehyde (mg/L) | 7.2 | 8.5 | 4.0 |
| Propanol (mg/L) | 22 | 9 | Not detected |
| Ethyl acetate (mg/L) | 20.2 | 3.4 | Not detected |
| Isobutanol (mg/L) | 21.4 | 3.2 | Not detected |
| Isoamyl acetate (mg/L) | 2.35 | 0.12 | Not detected |
| 3-methylbutanol (mg/L) | 60.1 | 1.25 | 0.25 |
| 2-methylbutanol (mg/L) | 20.2 | Traces | Traces |
| Phenylethanol (mg/L) | 33.11 | 35.1 | 38.5 |
| Furfuryl alcohol (mg/L) | 3.11 | 2.6 | 2.411 |
| Diacetyl (mg/L) | 0.16 | 0.36 | 0.07 |
| DMS (μg/L) | 22 | 45 | Not detected |
| Turbidity (IBC) | 0.35 | 1.5 | 2.5 |
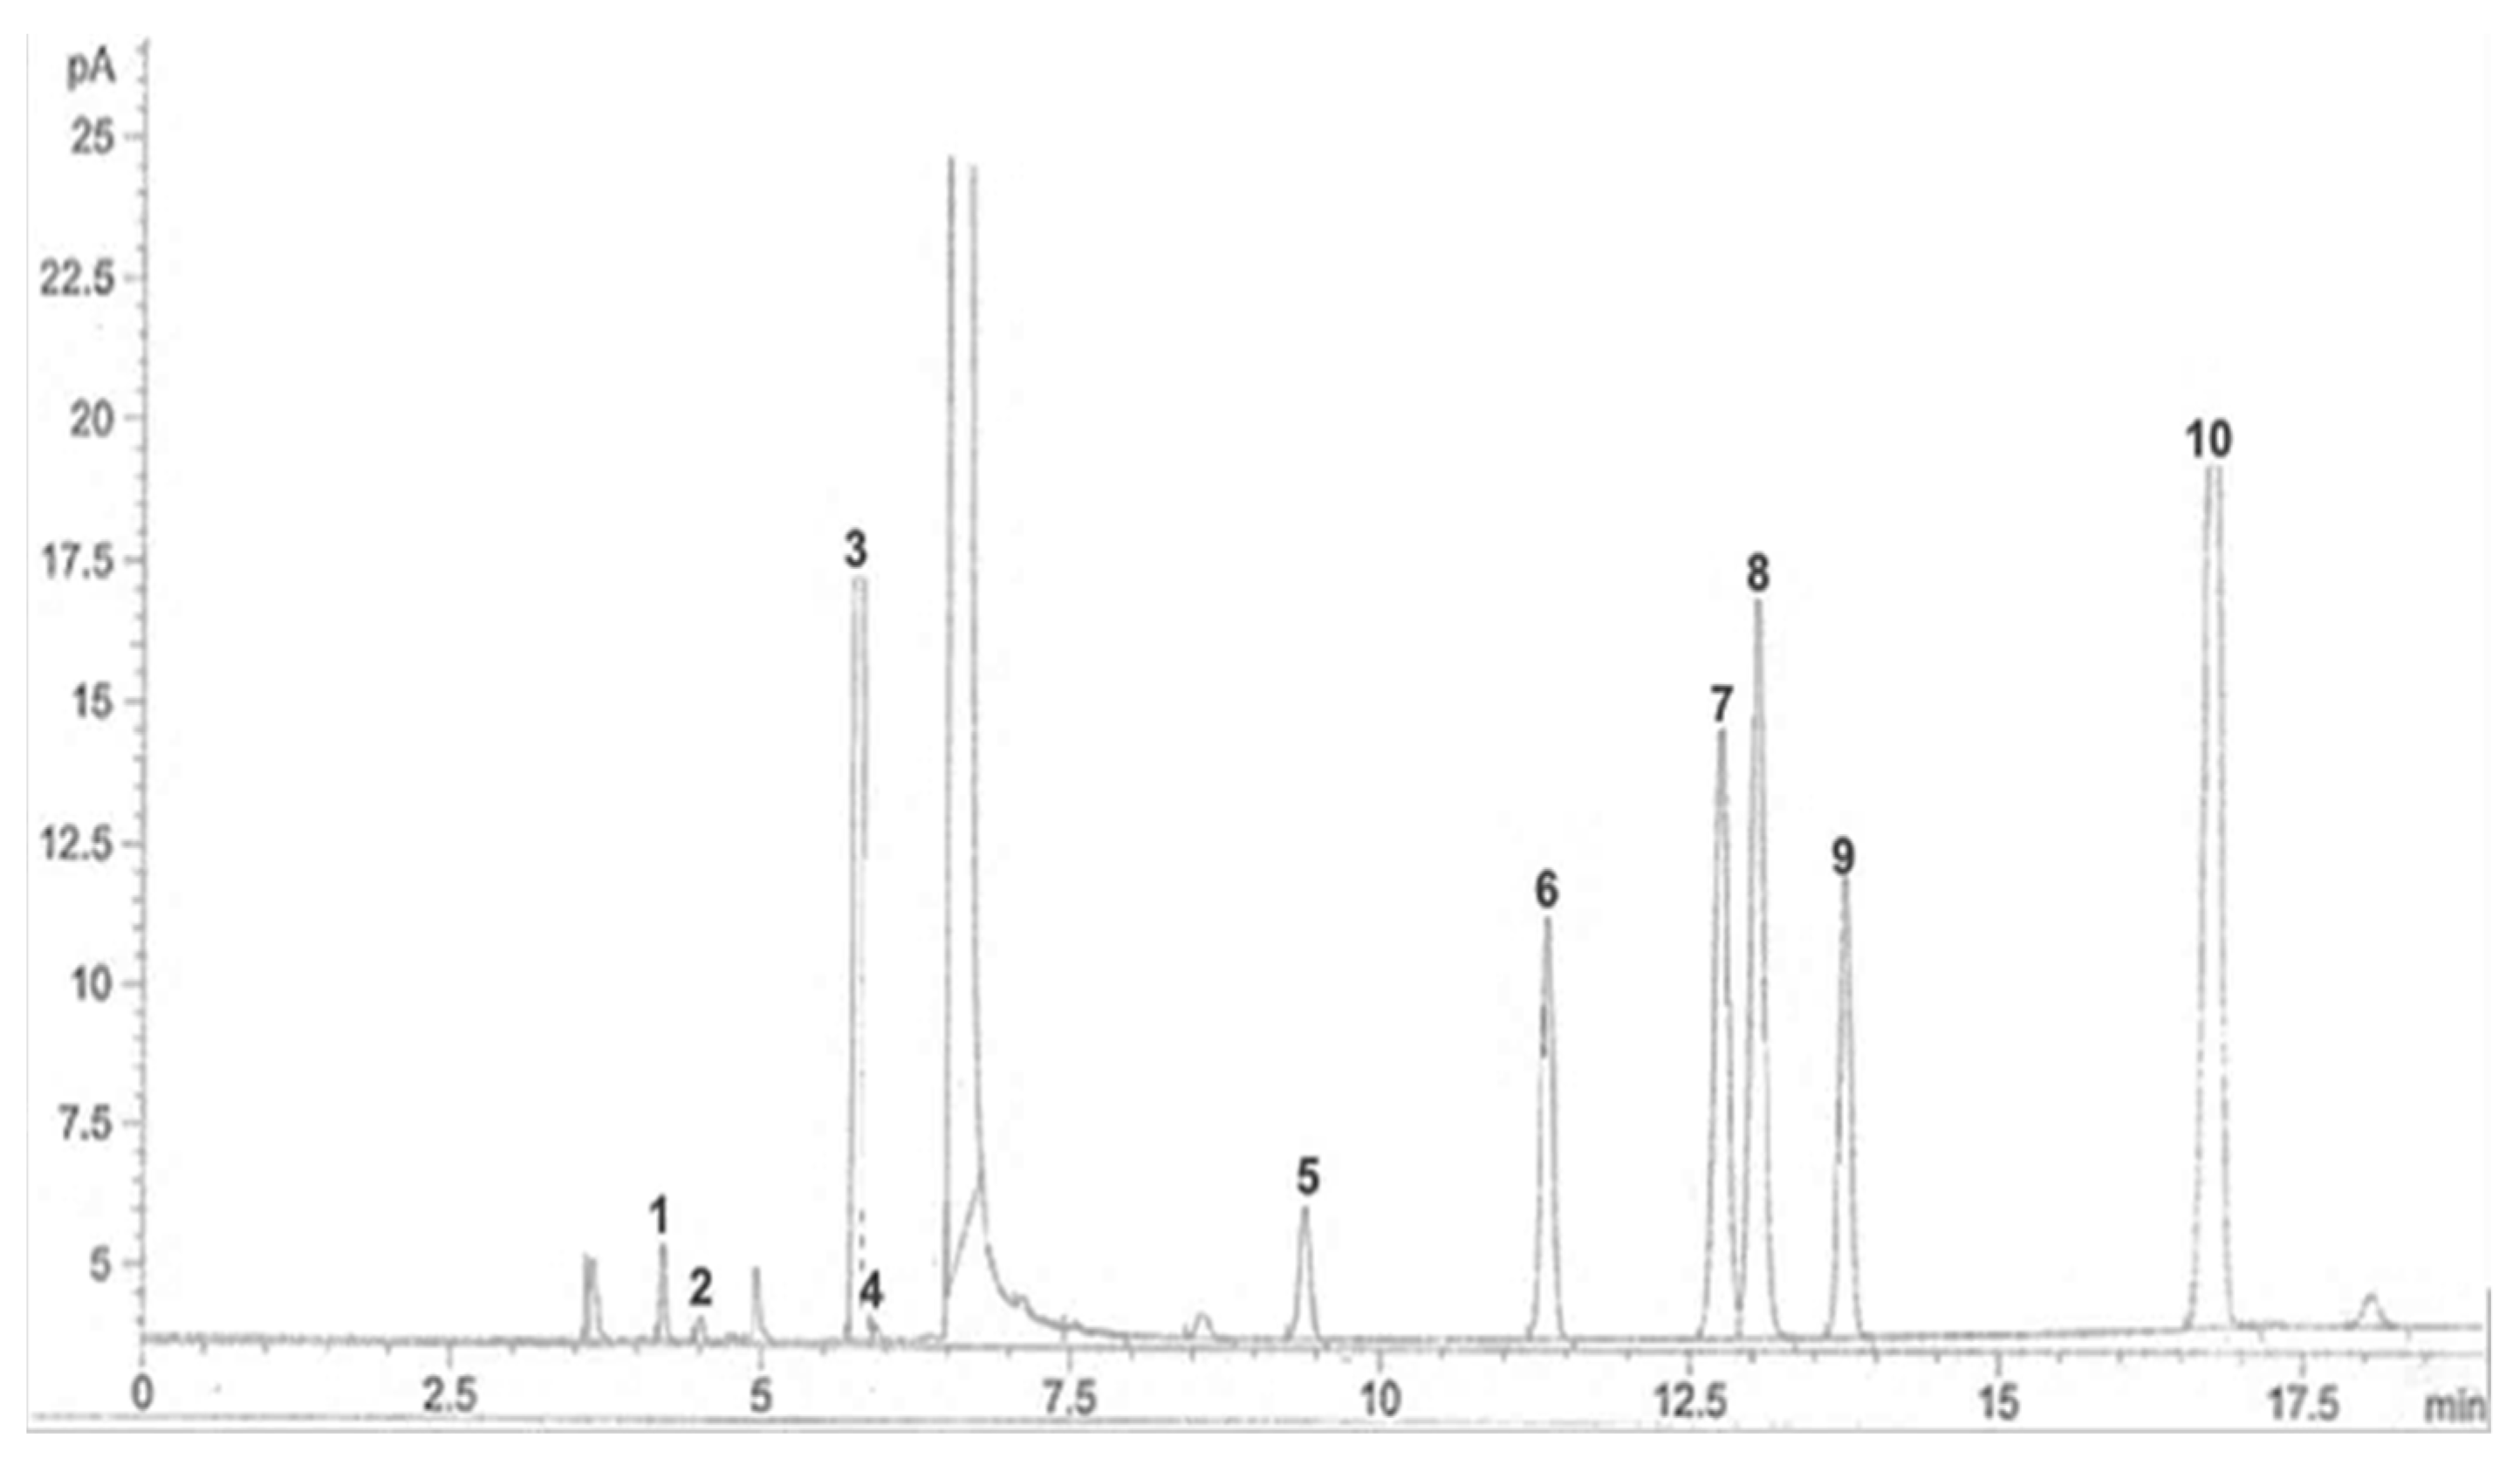
| Peak | Compound | Retention Time (min) | Amount |
|---|---|---|---|
| 1 | Acetaldehyde (mg/L) | 4.211 | 7.29 |
| 2 | DMS (μg/L) | 4.508 | 21.989 |
| 3 | Ethyl acetate (mg/L) | 5.777 | 20.838 |
| 4 | Methanol (mg/L) | 5.928 | 2.210 |
| 5 | n-Propanol (mg/L) | 9.412 | 13.546 |
| 6 | Iso-Butanol (mg/L) | 11.349 | 21.439 |
| 7 | Isoamyl acetate (mg/L) | 12.748 | 2.456 |
| 8 | Heptanone(mg/L) | 13.035 | 1.000 |
| 9 | Butanol (mg/L) | 13.750 | 1.000 |
| 10 | Amyl alcohols (mg/L) | 16.760 | 73.130 |
Publisher’s Note: MDPI stays neutral with regard to jurisdictional claims in published maps and institutional affiliations. |
© 2021 by the authors. Licensee MDPI, Basel, Switzerland. This article is an open access article distributed under the terms and conditions of the Creative Commons Attribution (CC BY) license (https://creativecommons.org/licenses/by/4.0/).
Share and Cite
Mansouri, F.E.; Farissi, H.E.; Cacciola, F.; Bouhcain, B.; Silva, J.C.G.E.d.; Lovillo, M.P.; Brigui, J. Optimal Design Approach Applied to Headspace GC for the Monitoring of Diacetyl Concentration, Spectrophotometric Assessment of Phenolic Compounds and Antioxidant Potential in Different Fermentation Processes of Barley. Appl. Sci. 2022, 12, 37. https://0-doi-org.brum.beds.ac.uk/10.3390/app12010037
Mansouri FE, Farissi HE, Cacciola F, Bouhcain B, Silva JCGEd, Lovillo MP, Brigui J. Optimal Design Approach Applied to Headspace GC for the Monitoring of Diacetyl Concentration, Spectrophotometric Assessment of Phenolic Compounds and Antioxidant Potential in Different Fermentation Processes of Barley. Applied Sciences. 2022; 12(1):37. https://0-doi-org.brum.beds.ac.uk/10.3390/app12010037
Chicago/Turabian StyleMansouri, Fouad El, Hammadi El Farissi, Francesco Cacciola, Badr Bouhcain, Joaquim C. G. Esteves da Silva, Miguel Palma Lovillo, and Jamal Brigui. 2022. "Optimal Design Approach Applied to Headspace GC for the Monitoring of Diacetyl Concentration, Spectrophotometric Assessment of Phenolic Compounds and Antioxidant Potential in Different Fermentation Processes of Barley" Applied Sciences 12, no. 1: 37. https://0-doi-org.brum.beds.ac.uk/10.3390/app12010037