Article

Removal of Copper, Nickel, and Zinc Ions from an Aqueous Solution through Electrochemical and Nanofiltration Membrane Processes

1
Department of Hydrology, Indian Institute of Technology Roorkee, Roorkee 247667, India
2
Research Management and Outreach Division, National Institute of Hydrology, Jalvigyan Bhawan, Roorkee 247667, India
*
Authors to whom correspondence should be addressed.
Submission received: 15 October 2021 / Revised: 16 December 2021 / Accepted: 22 December 2021 / Published: 28 December 2021
(This article belongs to the Special Issue Water Quality Modelling, Monitoring and Mitigation)

Abstract

:
Heavy metal contamination in water is a major health concern, directly related to rapid growth in industrialization, urbanization, and modernization in agriculture. Keeping this in view, the present study has attempted to develop models for the process optimization of nanofiltration (NF) membrane and electrocoagulation (EC) processes for the removal of copper, nickel, and zinc from an aqueous solution, employing the response surface methodology (RSM). The variable factors were feed concentration, temperature, pH, and pressure for the NF membrane process; and time, solution pH, feed concentration, and current for the EC process, respectively. The central composite design (CCD), the most commonly used fractional factorial design, was employed to plan the experiments. RSM models were statistically analyzed using analysis of variance (ANOVA). For the NF membrane, the rejection of Zn, Ni, and Cu was observed as 98.64%, 90.54%, and 99.79% respectively; while the removal of these through the EC process was observed as 99.81%, 99.99%, and 99.98%, respectively. The above findings and a comparison with the conventional precipitation and adsorption processes apparently indicate an advantage in employing the NF and EC processes. Further, between the two, the EC process emerged as more efficient than the NF process for the removal of the studied metals.

1. Introduction

Heavy metals are inorganic elements naturally found throughout the earth’s crust [1]. Their concentration above permissible limits is considered pollution. “Heavy metals” refers to a group of elements with a density greater than 4 g cm−3, including metals and metalloids [2]. Industrial discharges, agricultural runoff, storm water, mining activity, and direct inclusion of sewage/wastewater contribute to the heavy metal pollution load in fresh water, leading to various health and environmental problems. Among the commonly reported heavy metals, copper (Cu) is used widely in electroplating, batteries, pesticides, galvanized pipes, and alloys [3,4,5,6,7]. Regular consumption of copper-contaminated drinking water may cause stomach upsets, abdominal cramp and diarrhea. Nickel (Ni) is another metal found widely in water and wastewater. The electroplating industry, rechargeable batteries, and galvanized pipes are its main sources. High levels of nickel contamination cause serious lung and kidney problems as well as skin dermatitis and pulmonary fibrosis. In drinking water, the maximum allowable limit for nickel is 0.1 ppm [8]. Zinc (Zn) is used in many types of industry, such as metal production, galvanization, food preservation, agri-food and biological engineering, pharmaceuticals, electronics, mining and metallurgy, with major contributions coming from electroplating and mining effluents [9,10]. Zinc is not considered highly toxic but its presence in drinking water if exceeding 15 mg/L is reported to cause nausea, vomiting and diarrhea [11]. These heavy metals are ingested directly either by drinking contaminated water or indirectly through the food chain, and subsequently affect human health [12,13,14]. Drinking of contaminated water has been reported to lead to around 70–80% of the total diseases in developing countries [15,16], where the impact of increased pollution is particularly problematic because the population at large does not have sufficient resources to effectively treat the contaminated water or access to safe drinking water systems at their homes. According to a WHO (2017) estimate, around 844 million people do not have access to a basic drinking water source and 230 million people spend more than 30 min/day in collecting water from an improved water source, which may include piped water, boreholes, protected wells and springs, rainwater and packaged/delivered water [17]. According to the United Nations, an estimated 80% of all industrial and municipal wastewater in the developing world is released into freshwater bodies without any prior treatment [18]. Heavy metal removal can be achieved through different physical, chemical and biological methods such as fungal remediation [19], microbial remediation [12,20], phytoremediation [21,22], adsorption [23,24], flotation, coagulation–flocculation [25], chemical precipitation or ion exchange [26]; selection between these may be based on the nature and quantum of the pollution load and merits/demerits of decontamination processes along with other factors. It is noted that removal of heavy metals from water/wastewater is still an evolving research area, and there is wide scope for case-specific evaluation, optimization and integration of new and/or available technologies. In this regard, it has been noted that removal of heavy metals from aqueous solutions, especially metal-laden water or wastewater displaying high and heterogeneous concentrations is one of the major challenges. For this, nanofiltration (NF) and electrocoagulation (EC) processes have been reportedly more reliable than bioremediation in terms of the shorter time taken in providing near complete removal, ease of setup, and predictability. The primary emphasis of the present study is to explore the efficiency of removal of Cu, Ni, and Zn by NF and EC processes from their synthetic aqueous solutions in low to high concentrations. The selection of these metals for study is based on the findings of a comprehensive literature review, indicating that these comprise the major constituents in electroplating effluents or the recipient waters of these effluents.

2. Materials and Methods

2.1. Chemicals, Membranes and Electrodes

The experiments were conducted for the technical evaluation of the NF and EC processes employing a range of concentrations of metals in aqueous solution based on the available secondary data on electroplating effluent quality in the literature and also in the study area [27,28]. All chemicals used in this research were of analytical grade, and synthetic composite metal solutions were prepared by dissolving the appropriate mass of each metal in high purity Milli-Q water (18.2 MΩ cm). Copper (III) sulphate pentahydrate CuSO4·5H2O, nickel (II) sulphate hexahydrate NiSO4·6H2O, zinc sulphate ZnSO4·7H2O, sodium hydroxide (NaOH), nitric acid (69–72%), sodium chloride (NaCl) and calcium carbonate extra pure (CaCO3) were all obtained from Merck Specialties Private Ltd. Quicklime (CaO), nanofiltration membrane (Permionics, Flat Sheet Membrane HFN-300 AR) and stainless steel (SS-304) electrodes were procured from the market as commercially available. The stated membrane was specifically employed so as to effectively work in both acid and basic medium. Stainless steel electrodes were used, as they are less susceptible to corrosion, and have reportedly shown a better performance in earlier studies. The grade of steel used is reported to not contain Zn, and have very low amount of carbon.

2.2. Experimental Setup and Procedure

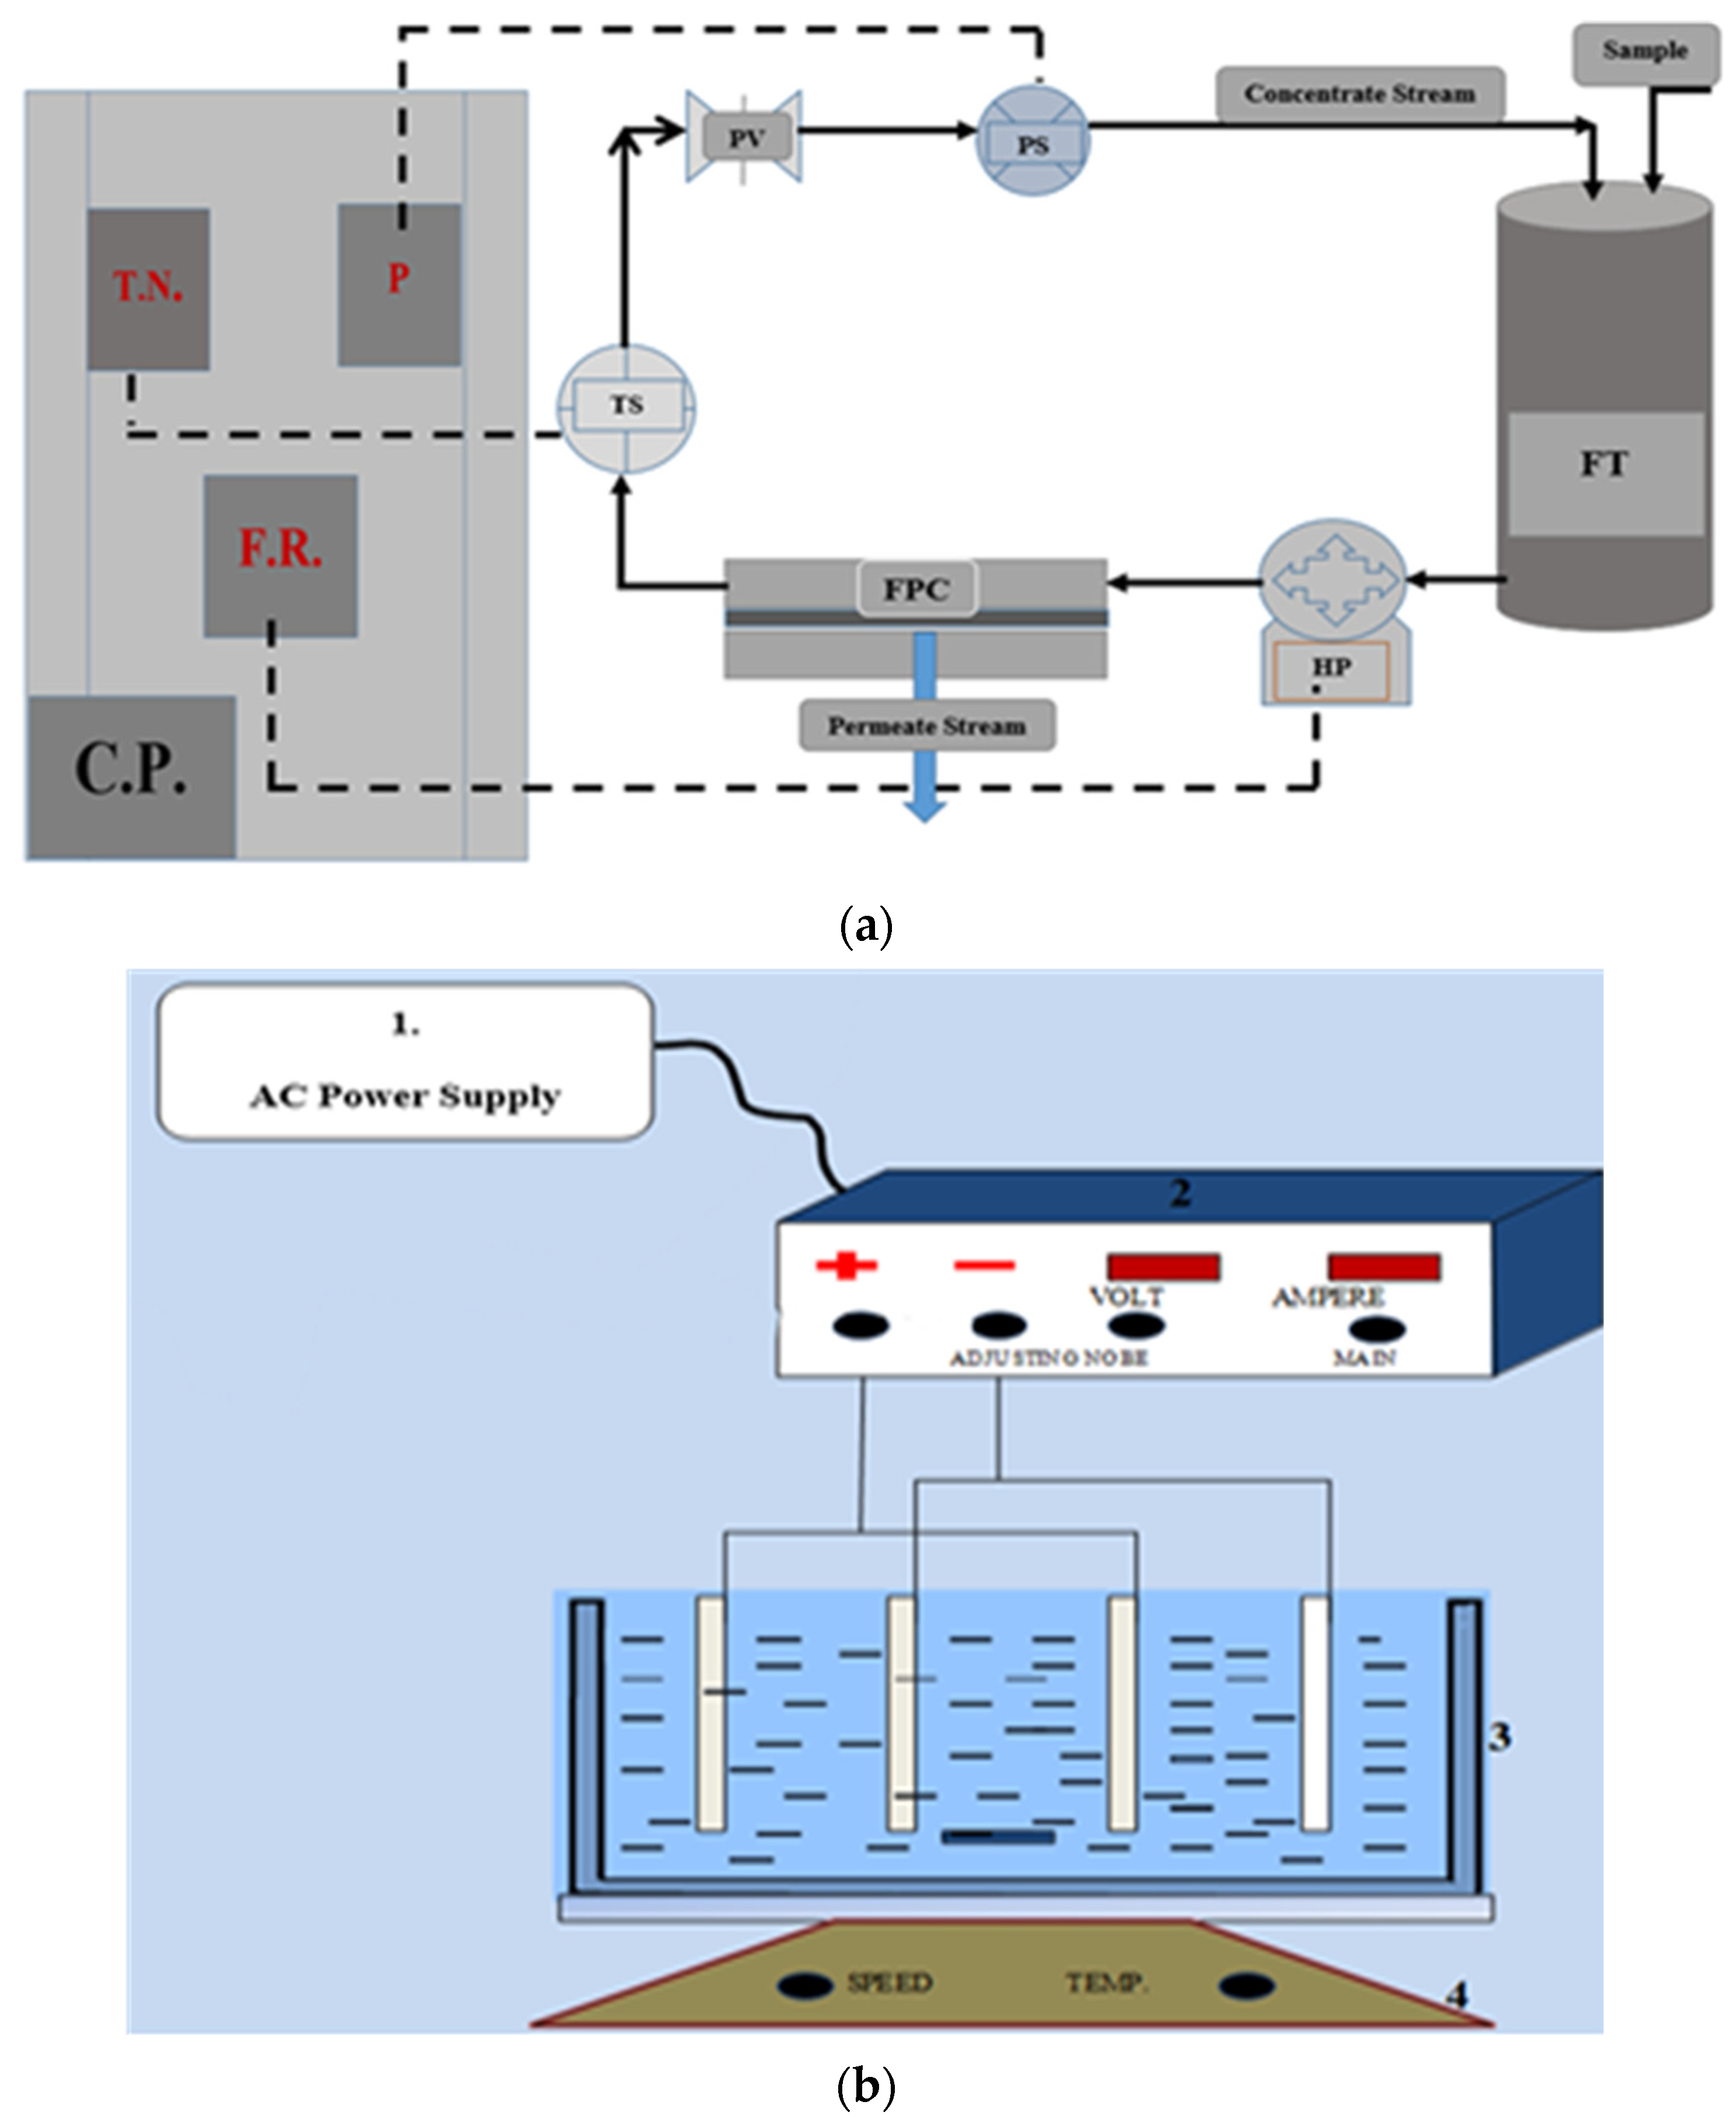
2.2.1. Experimental Setup for Nanofiltration

The NF unit was a cross-flow lab-scale system (Nilshan Nishotech Pvt. Ltd., Navi Mumbai, India). It consisted of a high-pressure pump, feed vessel, flat membrane sheet housing cell, and a temperature control unit (Figure 1a). The membrane housing cell contained a rectangular channel. The active surface area of the membrane was 0.0155 m2. Lab experiments were conducted by filtering the multicomponent solution with NF membrane. The permeate and the concentrate streams were recirculated back into the feed tank continuously during experiments. After the completion of every single experiment, the system was appropriately cleaned by Milli-Q water. The samples were collected after each experiment.

2.2.2. Experimental Set for Electrocoagulation

The electrocoagulation (EC) experimental setup consisted of a DC power supply unit for constant DC output. The experimental reactor (11.0 cm × 11.0 cm × 15.0 cm) was made of plexiglass and four mono-polar stainless-steel plates (9.0 cm × 9.0 cm × 0.1 cm) submerged in the solution as the electrodes (Figure 1b). Plate spacing was 1 cm. The magnetic stirrer was used to provide proper stirring to maintain the uniformity of the solution throughout the reactor. Initially, at the start of each EC experimental run, 1.8 L of the synthetic solution was put into the electrolytic reaction cell after mixing it with one gm/L electrolyte (NaCl). The pH of the solution was measured and maintained by adding drops of 0.1 N NaOH and H2SO4 solution using a pH meter. The current was controlled through the power supply regulator. Samples were collected at the end of the electrolysis process.
Samples collected after the experiments employing different treatment processes were digested through the microwave digestion unit (Anton Par) and filtered by 0.42 µ filter papers. They were further analyzed by inductively coupled plasma mass spectroscopy (ICP-MS of Agilent). The removal efficiency was determined by calculating the difference in the concentrations measured by ICP-MS before and after each experiment.

2.3. Preparation of Working Solutions

Metal solutions were prepared by dissolving the appropriate mass of each metal in high purity Milli-Q water (18.2 MΩ cm), as mentioned earlier. All metal salts were added sequentially, after the previous metal salt had completely dissolved. Thereafter, the mixed-metal solutions with different concentrations (ppm) were prepared for each batch experiment.

2.4. Calculation of Removal Percentage

The removal efficiency of any metal can be calculated using the following equation:
R ( % ) = C i C f C i × 100
where Ci and Cf (mg/L) denote the concentration of the metal before and after the treatment process, respectively.

2.5. Experimental Design and Optimization through Response Surface Methodology

For mathematical modelling of the process, an empirical approach [29,30,31] employing response surface methodology (RSM) was adopted [32,33,34]. RSM reportedly reduces systematic errors with an estimation of investigational error and also reduces the number of experiments [30], requires lesser computer simulations, is more accessible and more efficient than the other methods based on limited components or computational complexity [31].
RSM based on the central composite design (CCD) was used to examine the efficacy of the NF membrane and EC processes. CCD helped in arriving at the operational conditions highlighting the highest removal efficiency scenarios. In the NF membrane process, the solution pH, pressure, concentration, and temperature were the key factors widely reported to contribute to the removal of metal ions [35,36,37,38] and thus design expert software was used for the experimental design with a varying range of these factors (Table 1).
In the EC process, solution pH, time, concentration, and current were the key factors [25] widely reported to contribute to the removal of metal ions [39,40,41,42] and thus design expert software was used for experimental design with a varying range of these factors (Table 1). The initial and final conductivity values were 2.78 and 2.35 mS/cm for the final optimum condition. The complete design matrix of the NF membrane and EC processes obtained after the application of CCD is presented in Supplementary Table S1 and Supplementary Table S2 respectively, which suggest thirty sets of runs and six centrally coded level runs for each treatment process.

3. Results and Discussion

In this study, experiments were performed for different combinations of factors for both processes, as described in the following sections.

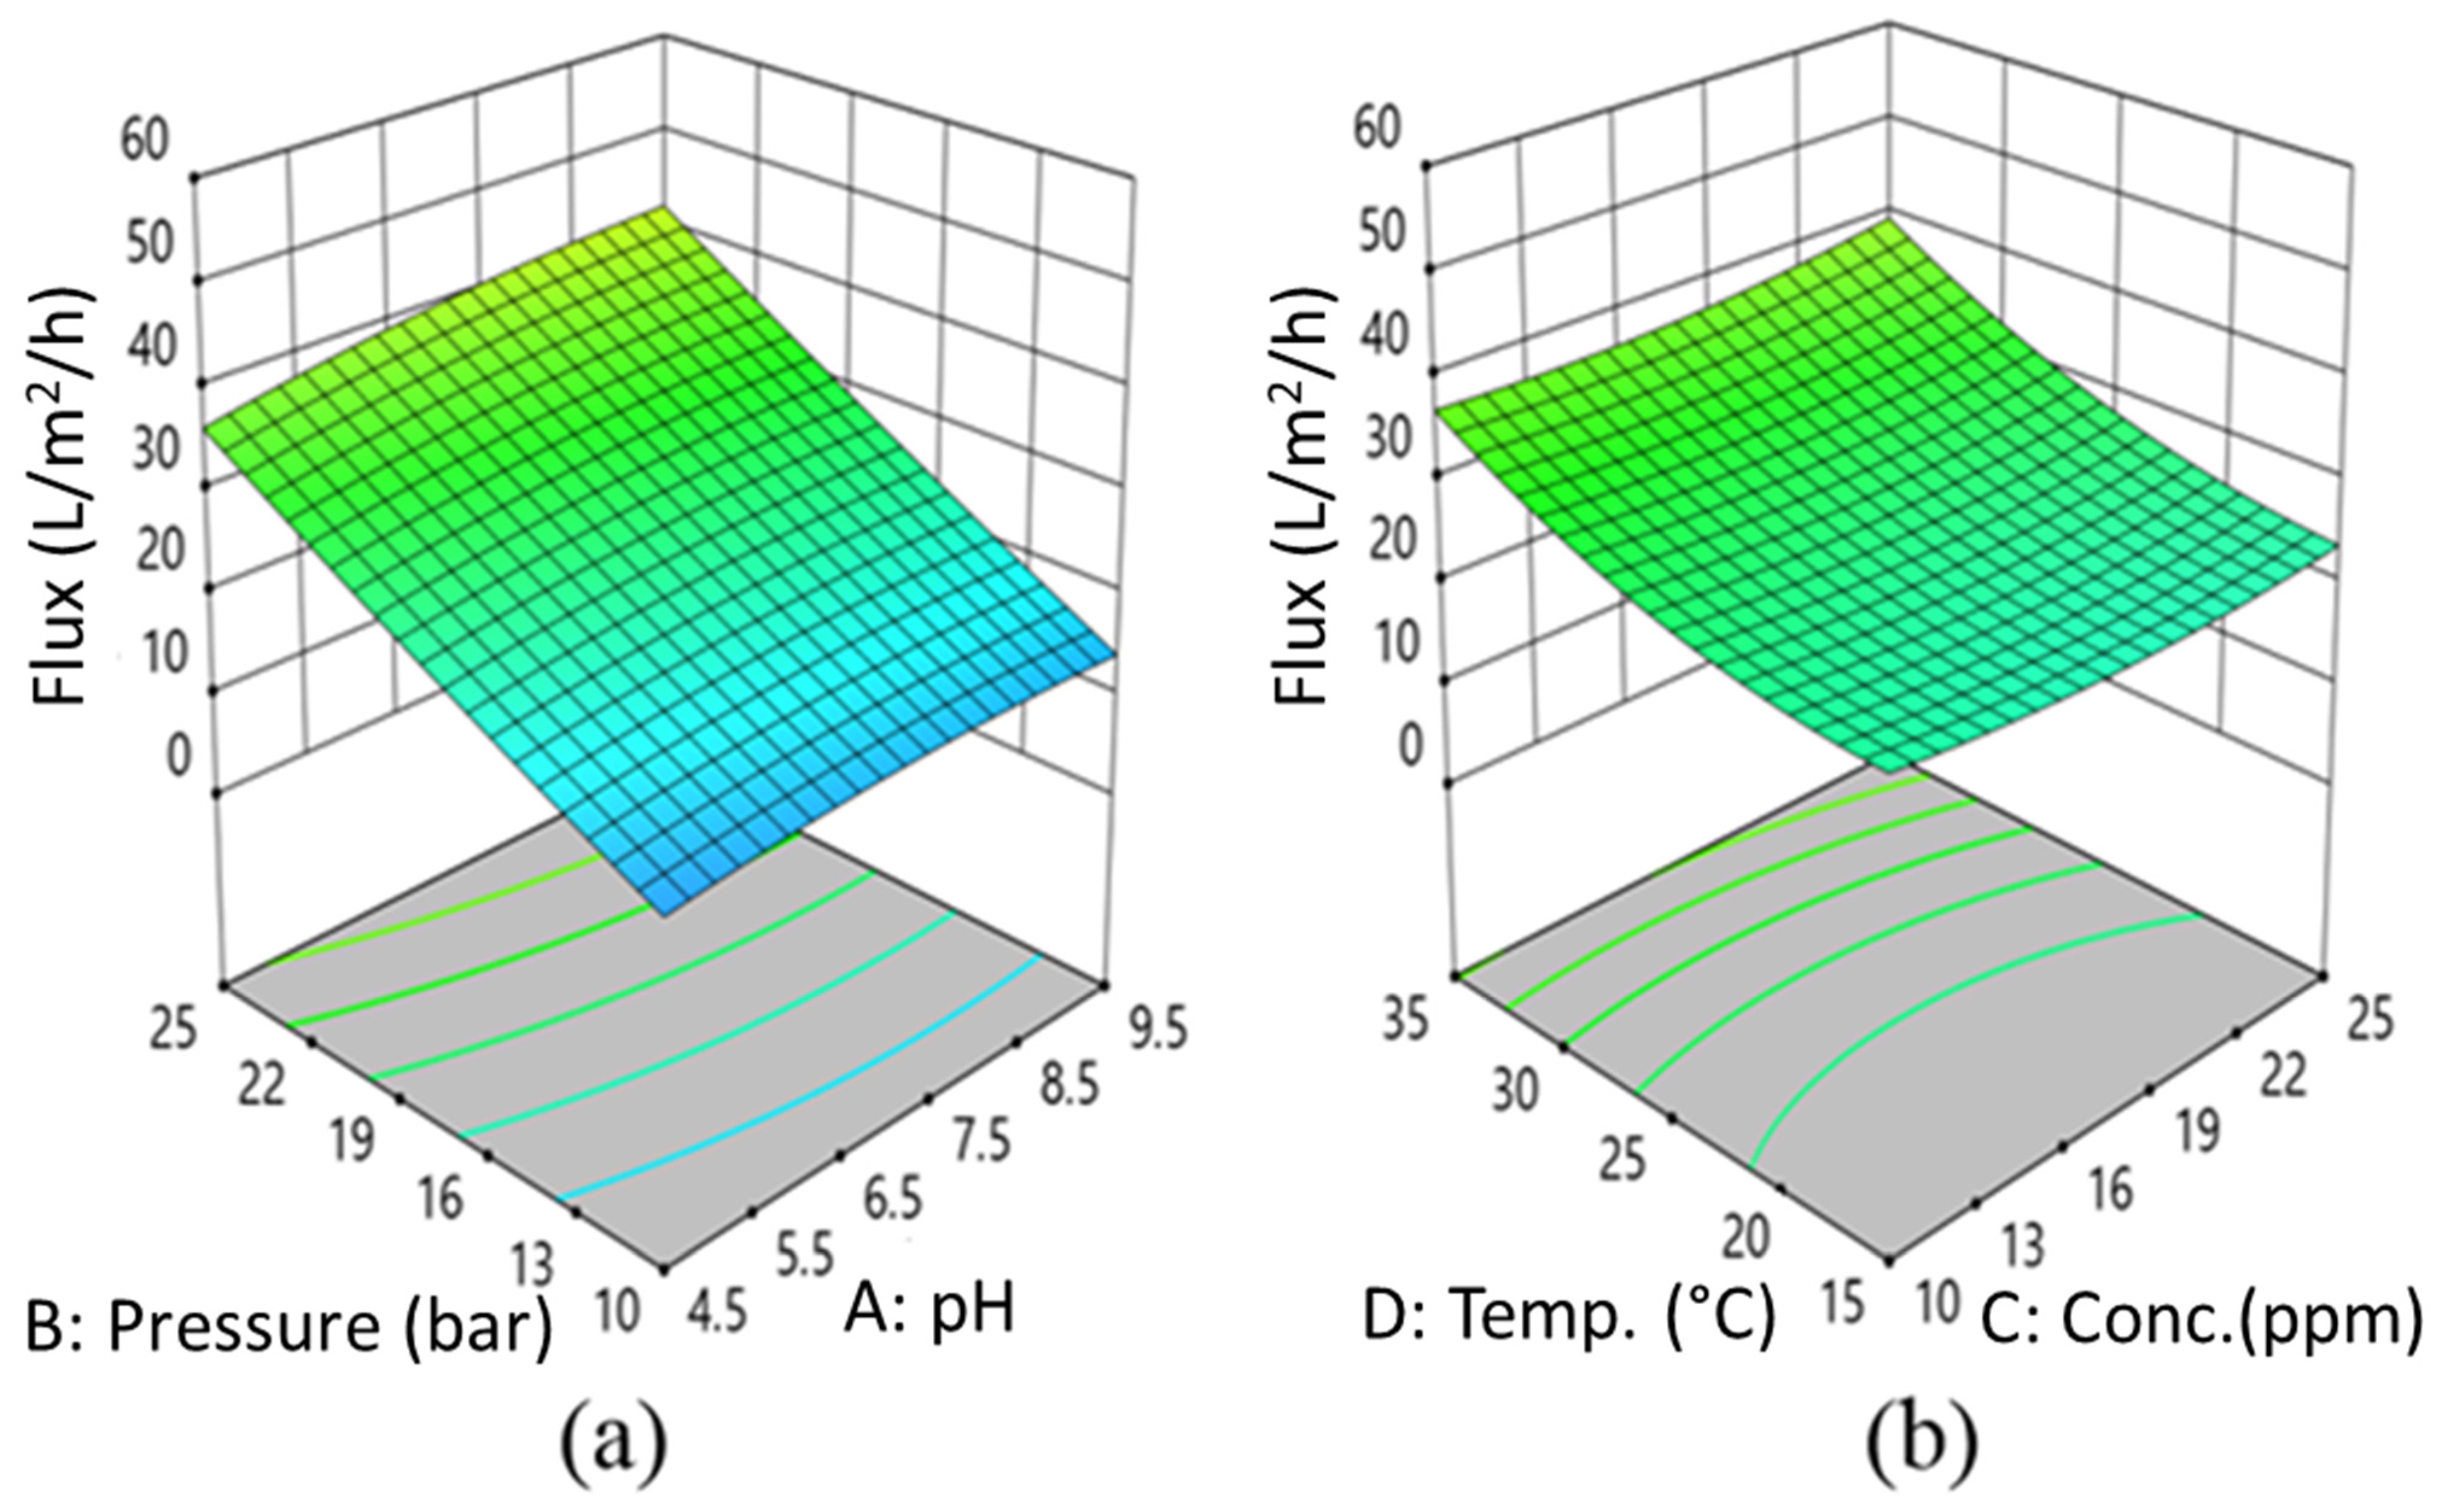
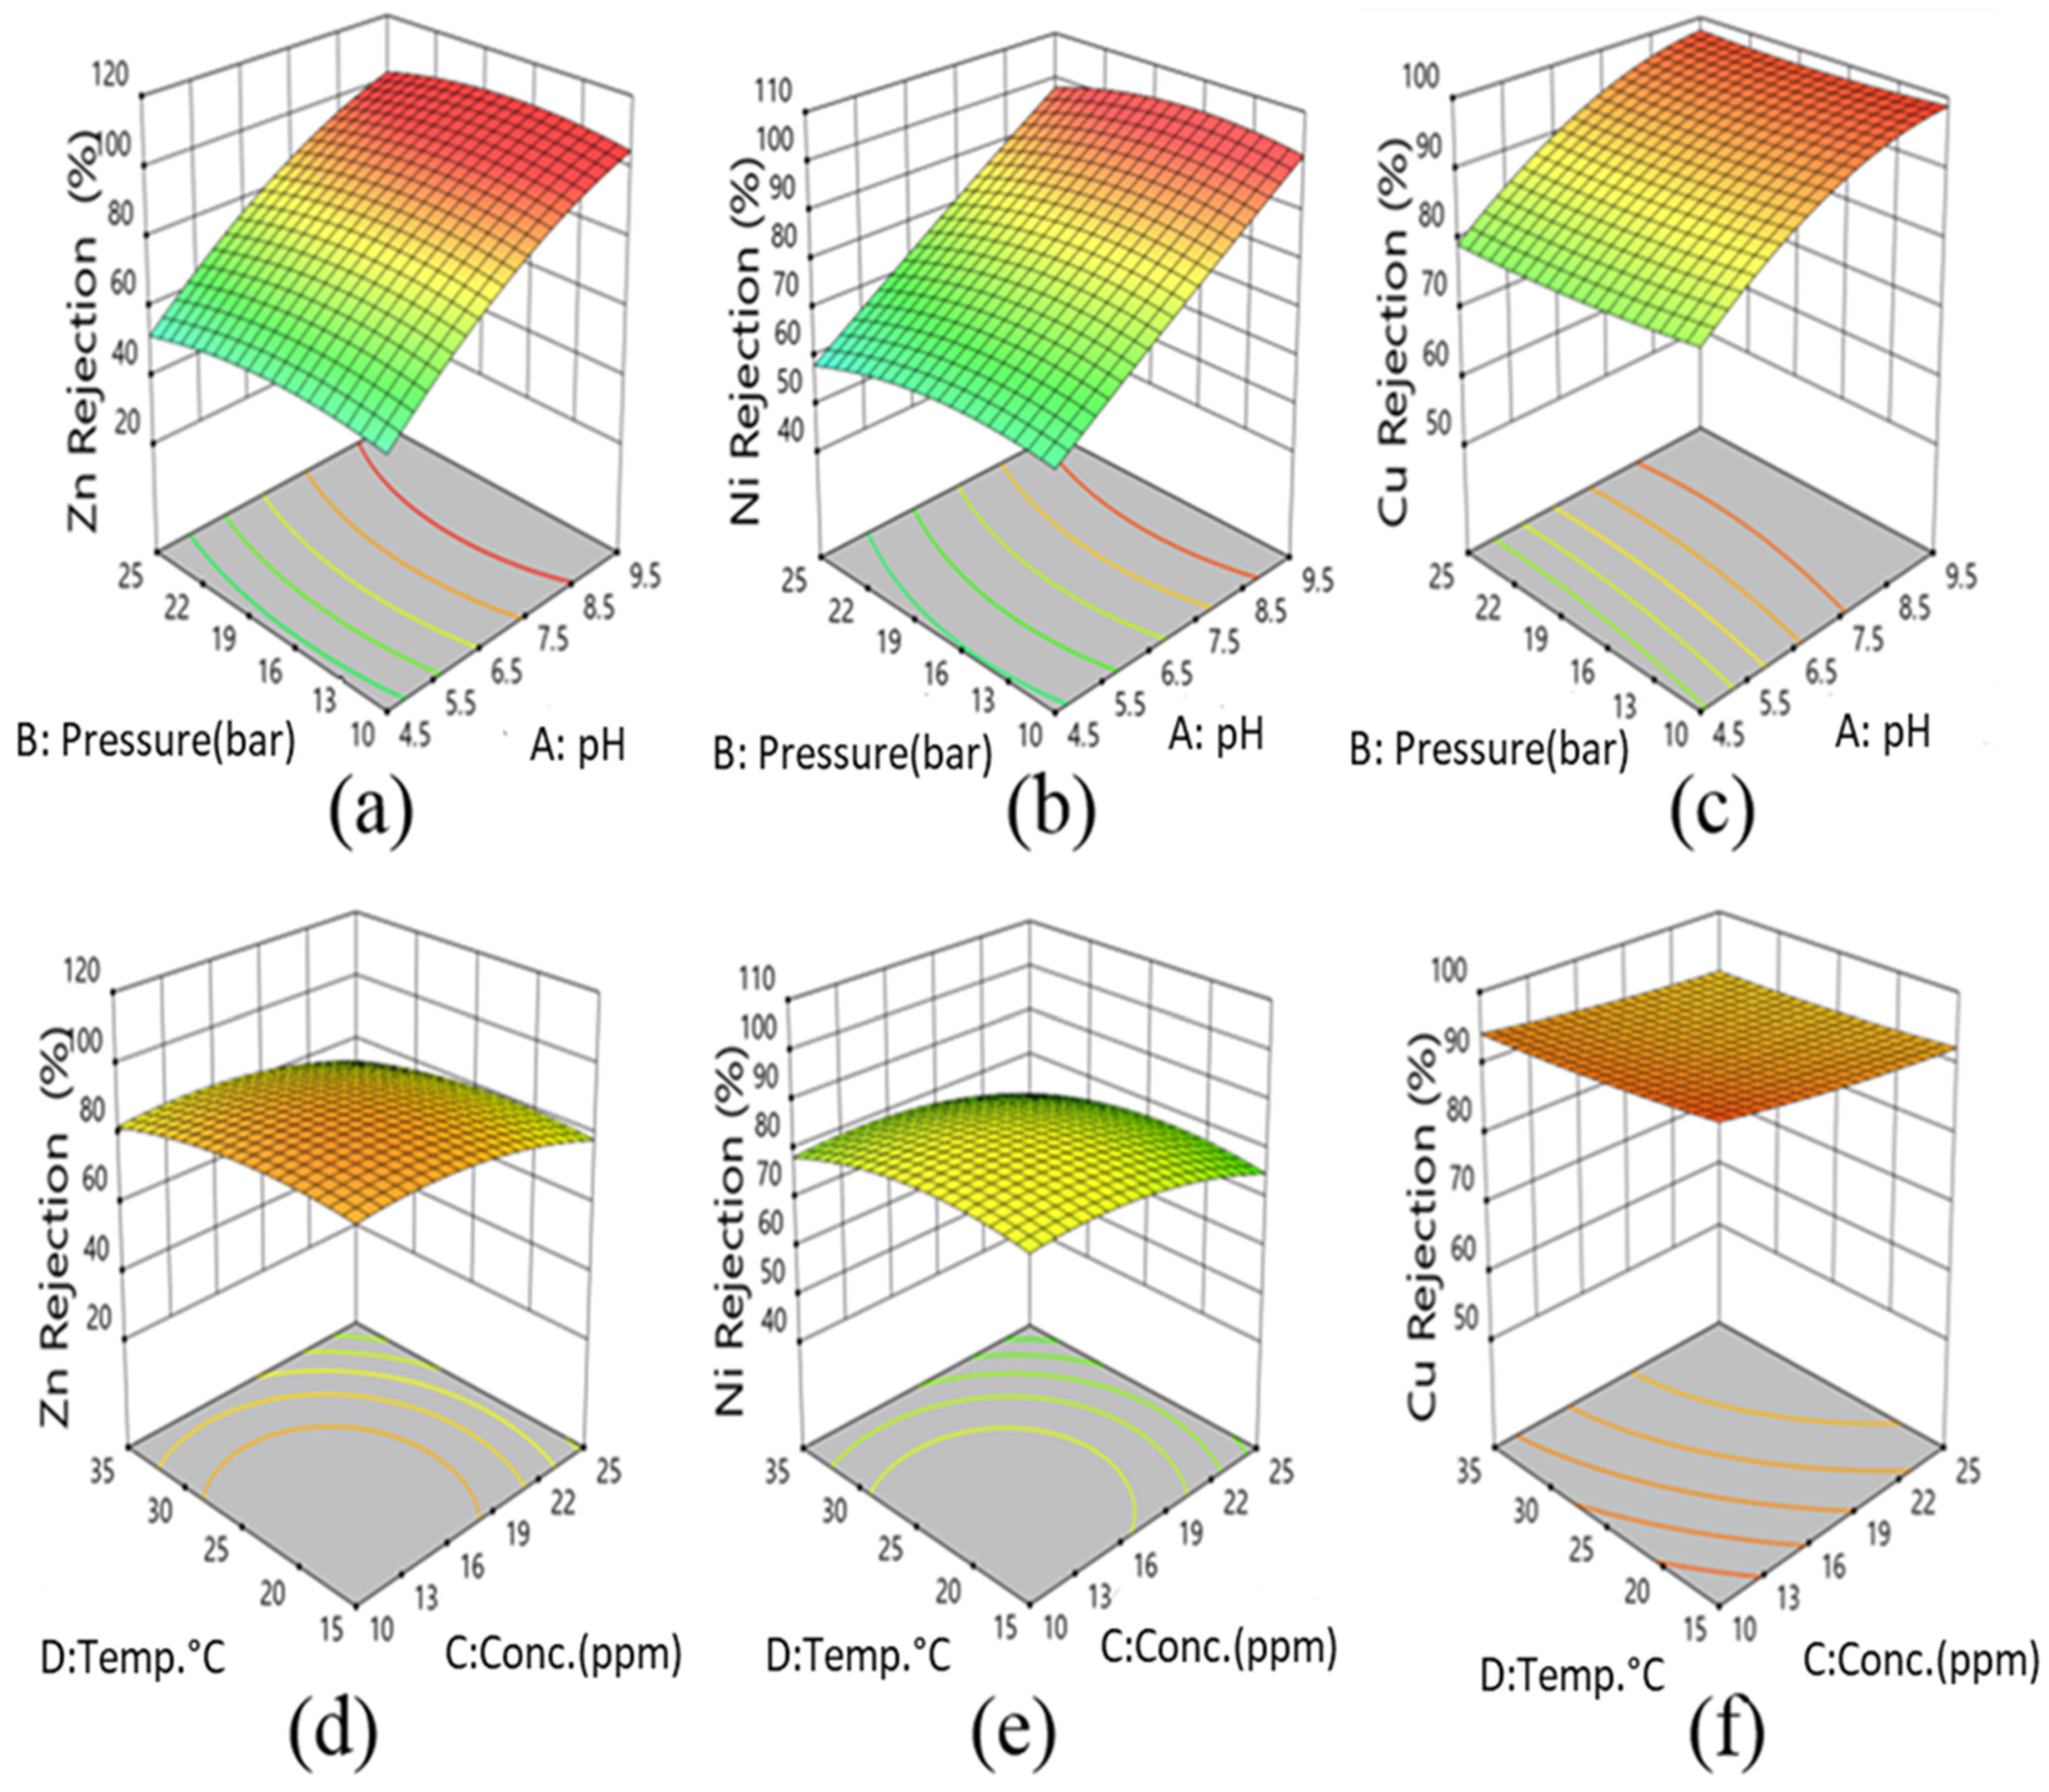
3.1. Experimental Performance of NF

The details of the coded variables (X1, X2, X3 and X4), and their response values are presented in supplementary (Supplementary Table S1).

3.1.1. Statistical Analysis and Modelling by RSM

The NF membrane process responses were studied for the permeate flux and metal rejections (Zn, Cu, and Ni). The findings of the experimental studies were analyzed statistically through analysis of variance (ANOVA). Table 2 shows the ANOVA models.
For the above models, Fisher’s test statistic (F-Value) clarifies the scattering of actual data around the fitted models, while the p-value indicates the significance of the model terms. The F value of responses suggested that the respective models were significant regarding the residual error. The p-value of a model lower than 0.05 indicates a significant model, and higher than 0.10 means an insignificant model. The p-value of all responses were lower than 0.0001, suggesting that the models are highly significant. The coefficient of regression (R2) described the system behaviour and the adequacy of the model in the range of independent variables. The high R2 and adjusted R2 in Table 2 also reveal that the models are highly significant.
The quadratic regression model equations for NF membrane permeate flux (Y1), Zn removal (Y2), Ni removal (Y3), and Cu removal (Y4) in terms of coded factors are presented below as Equations (2)–(5), respectively.
Y 1 = + 26.75 + 1.84 X 1 + 12.96 X 2 + 0.51 X 3 + 7.08 X 4 1.06 X 1 2 + 0.51 X 2 2 + 1.36 X 3 2 + 3.04 X 4 2 + 1.06 X 1   X 2 0.53 X 1   X 3 + 0.82 X 1   X 4 + 0.33 X 2   X 3 + 2.5 X 2   X 4 + 0.77 X 3   X 4
Y 2 = + 89.32 + 24.78 X 1 1.62 X 2 4.67 X 3 2.82 X 4 6.26 X 1 2 4.22 X 2 2 4.71 X 3 2 3.91 X 4 2 + 0.52 X 1 X 2 + 1.96 X 1 X 3 + 0.67 X 1 X 4 0.34 X 2 X 3 1.25 X 2 X 4 + 0.23 X 3 X 4
Y 3 = + 84.38 + 19.27 X 1 2.23 X 2 3.82 X 3 2.17 X 4 0.43 X 1 2 3.58 X 2 2 3.46 X 3 2 3.75 X 4 2 + 0.61 X 1 X 2 + 0.59 X 1 X 3 + 0.31 X 1 X 4 0.52 X 2 X 3 + 0.076 X 2 X 4 + 0.26 X 3 X 4
Y 4 = + 92.65 + 8.88 X 1 0.85 X 2 2.02 X 3 1.04 X 4 3.76 X 1 2 + 0.66 X 2 2 + 0.47 X 3 2 0.46 X 4 2 + 0.44 X 1 X 2 + 1.50 X 1 X 3 + 0.31 X 1 X 4 0.33 X 2 X 3 + 0.070 X 2   X 4 + 0.27 X 3   X 4

3.1.2. Response Surface Plots

The response surface plot for the permeate flux of NF is presented in Figure 2. The observations show an upsurge in the permeate flux simultaneously with the increase in trans-membrane pressure. It has been well established that permeate flux depends on pressure and gets amplified almost linearly with increasing pressure [32,33,34,35,36]. The maximum permeate flux of 59.34 L/m2·h is obtained at the feed concentration of 25 ppm, pH 9.5, pressure 25 bar, and temperature 35 °C, as shown in Figure 2. It is typically theorized that an increased temperature accelerates the permeate flux due to one or more reasons such as a decline in solvent viscosity, a rise in solvent diffusion, intensification in the solvent diffusion coefficient, or a surge in polymer chain mobility [24]. Membrane-solvent interactions can be expected to differ with a change in solvent properties, like dielectric constant, molecular size, dipole movements, and Hildebrand solubility parameter. The rise in temperature also affects structural properties such as pore radius and membrane thickness, which have shown a much more noticeable impact on membrane performance in comparison to solvent and solute motilities [37,38,39]. Experiments have demonstrated a linear increase in the slope of flux with a rise in temperature, as reported by others [40,41]. Figure 2a shows a direct increase of permeate flux with an increase in trans-membrane pressure. Figure 2b demonstrates a significant increase in the permeate flux with an increase in temperature. Water permeation by micropores is an activated process that is absolutely dissimilar from viscous flow. It should be taken into account that the water molecule is one of the smallest molecules, having the same range of kinetic diameter (0.29 nm), as helium (0.24 nm) and hydrogen (0.27 nm). A portion of water molecules gets adequate thermal energy to cross the energy barrier from the pore wall and passes over the pores, which is another justification based on the adsorption of water on hydrophilic pore walls. The actual pore diameter might get reduced by the water adsorbed on pore walls. In such a case, the adsorbed water layer can be thinner at higher temperatures resulting in the effective pore diameter becoming more extensive [41].
The separation of metal ions by NF is attained by size exclusion, and electrical interactions between the ions in the feed aqueous solution and the charged NF membranes. The degree of ionization of these functional groups is a function of the solution pH, which influences the membrane charge and, therefore, the rejection properties of the membrane [41]. The rejection of Cu, Ni, and Zn ions increased with the increase in the solution pH (Figure 3a–c). The feed solution pH determines the ion charge in the solution and the surface charge density of the membranes. The more the pH increases, the more the membrane charge becomes positive, leading to a stronger electrostatic repulsion between the membrane and the metal ions [35]. Copper hydroxide precipitation starts at pH 5.24, and the precipitation of the other metals (Zn and Ni) at a still higher pH. At the different pH values studied, the rejection of copper was higher than for Zn and Ni ions, as reported earlier [42]. The maximum rejection of Cu, Zn, and Ni was demonstrated as 99.99%, 99.96% and 99.63%, respectively, in the experiments where concentrations ranged between 10–25 ppm and pressure between 10–25 bar. It was observed that the rejection of metal ions decreased when the concentration of feed solution increased, a common phenomenon for NF membranes [37]. The increase in concentration in the feed solution apparently generates a screen formation of cation adjacent to the membrane on the high-pressure side, which neutralizes the negative charges of the NF membrane. Thus, the total negative charge of the membrane decreases, and the repulsion between membrane and anion decreases. As a result, the co-ions (ions with the same charge as the membrane) quickly escape through the membrane and due to electro-neutrality, the rejection of counter-ions is reduced [8,43]. Figure 3d–f shows a slight decrease in the rejection of Ni and Zn ions with an increase in feed solution concentration, whereas the rejection of the Cu ions was not much affected. Temperature and pressure also have not shown much influence upon the rejection of the metal ions. Overall, the findings of this study are quite in line with some other relevant studies, as displayed in Table 3.

3.1.3. Multi Response Optimization

The optimization of all input variables was done using the desirability function approach to arrive at the best response values of the factors Y1, Y2, Y3, Y4. As depicted in Table 4, at the optimal condition, the predicted response values of factors (Y1, Y2, Y3, Y4) were observed as 36.9 (L/m2·h), 94.77%, 88.67%, 95.89%, respectively. The average values of factor responses after three runs, were found to be 41.93 (L/m2·h) for Y1, 98.64% for Y2, 90.54% for Y3, and 99.79% for Y4. All the experimentally derived values are close to the predicted response values, showing a good correlation (Table 4).

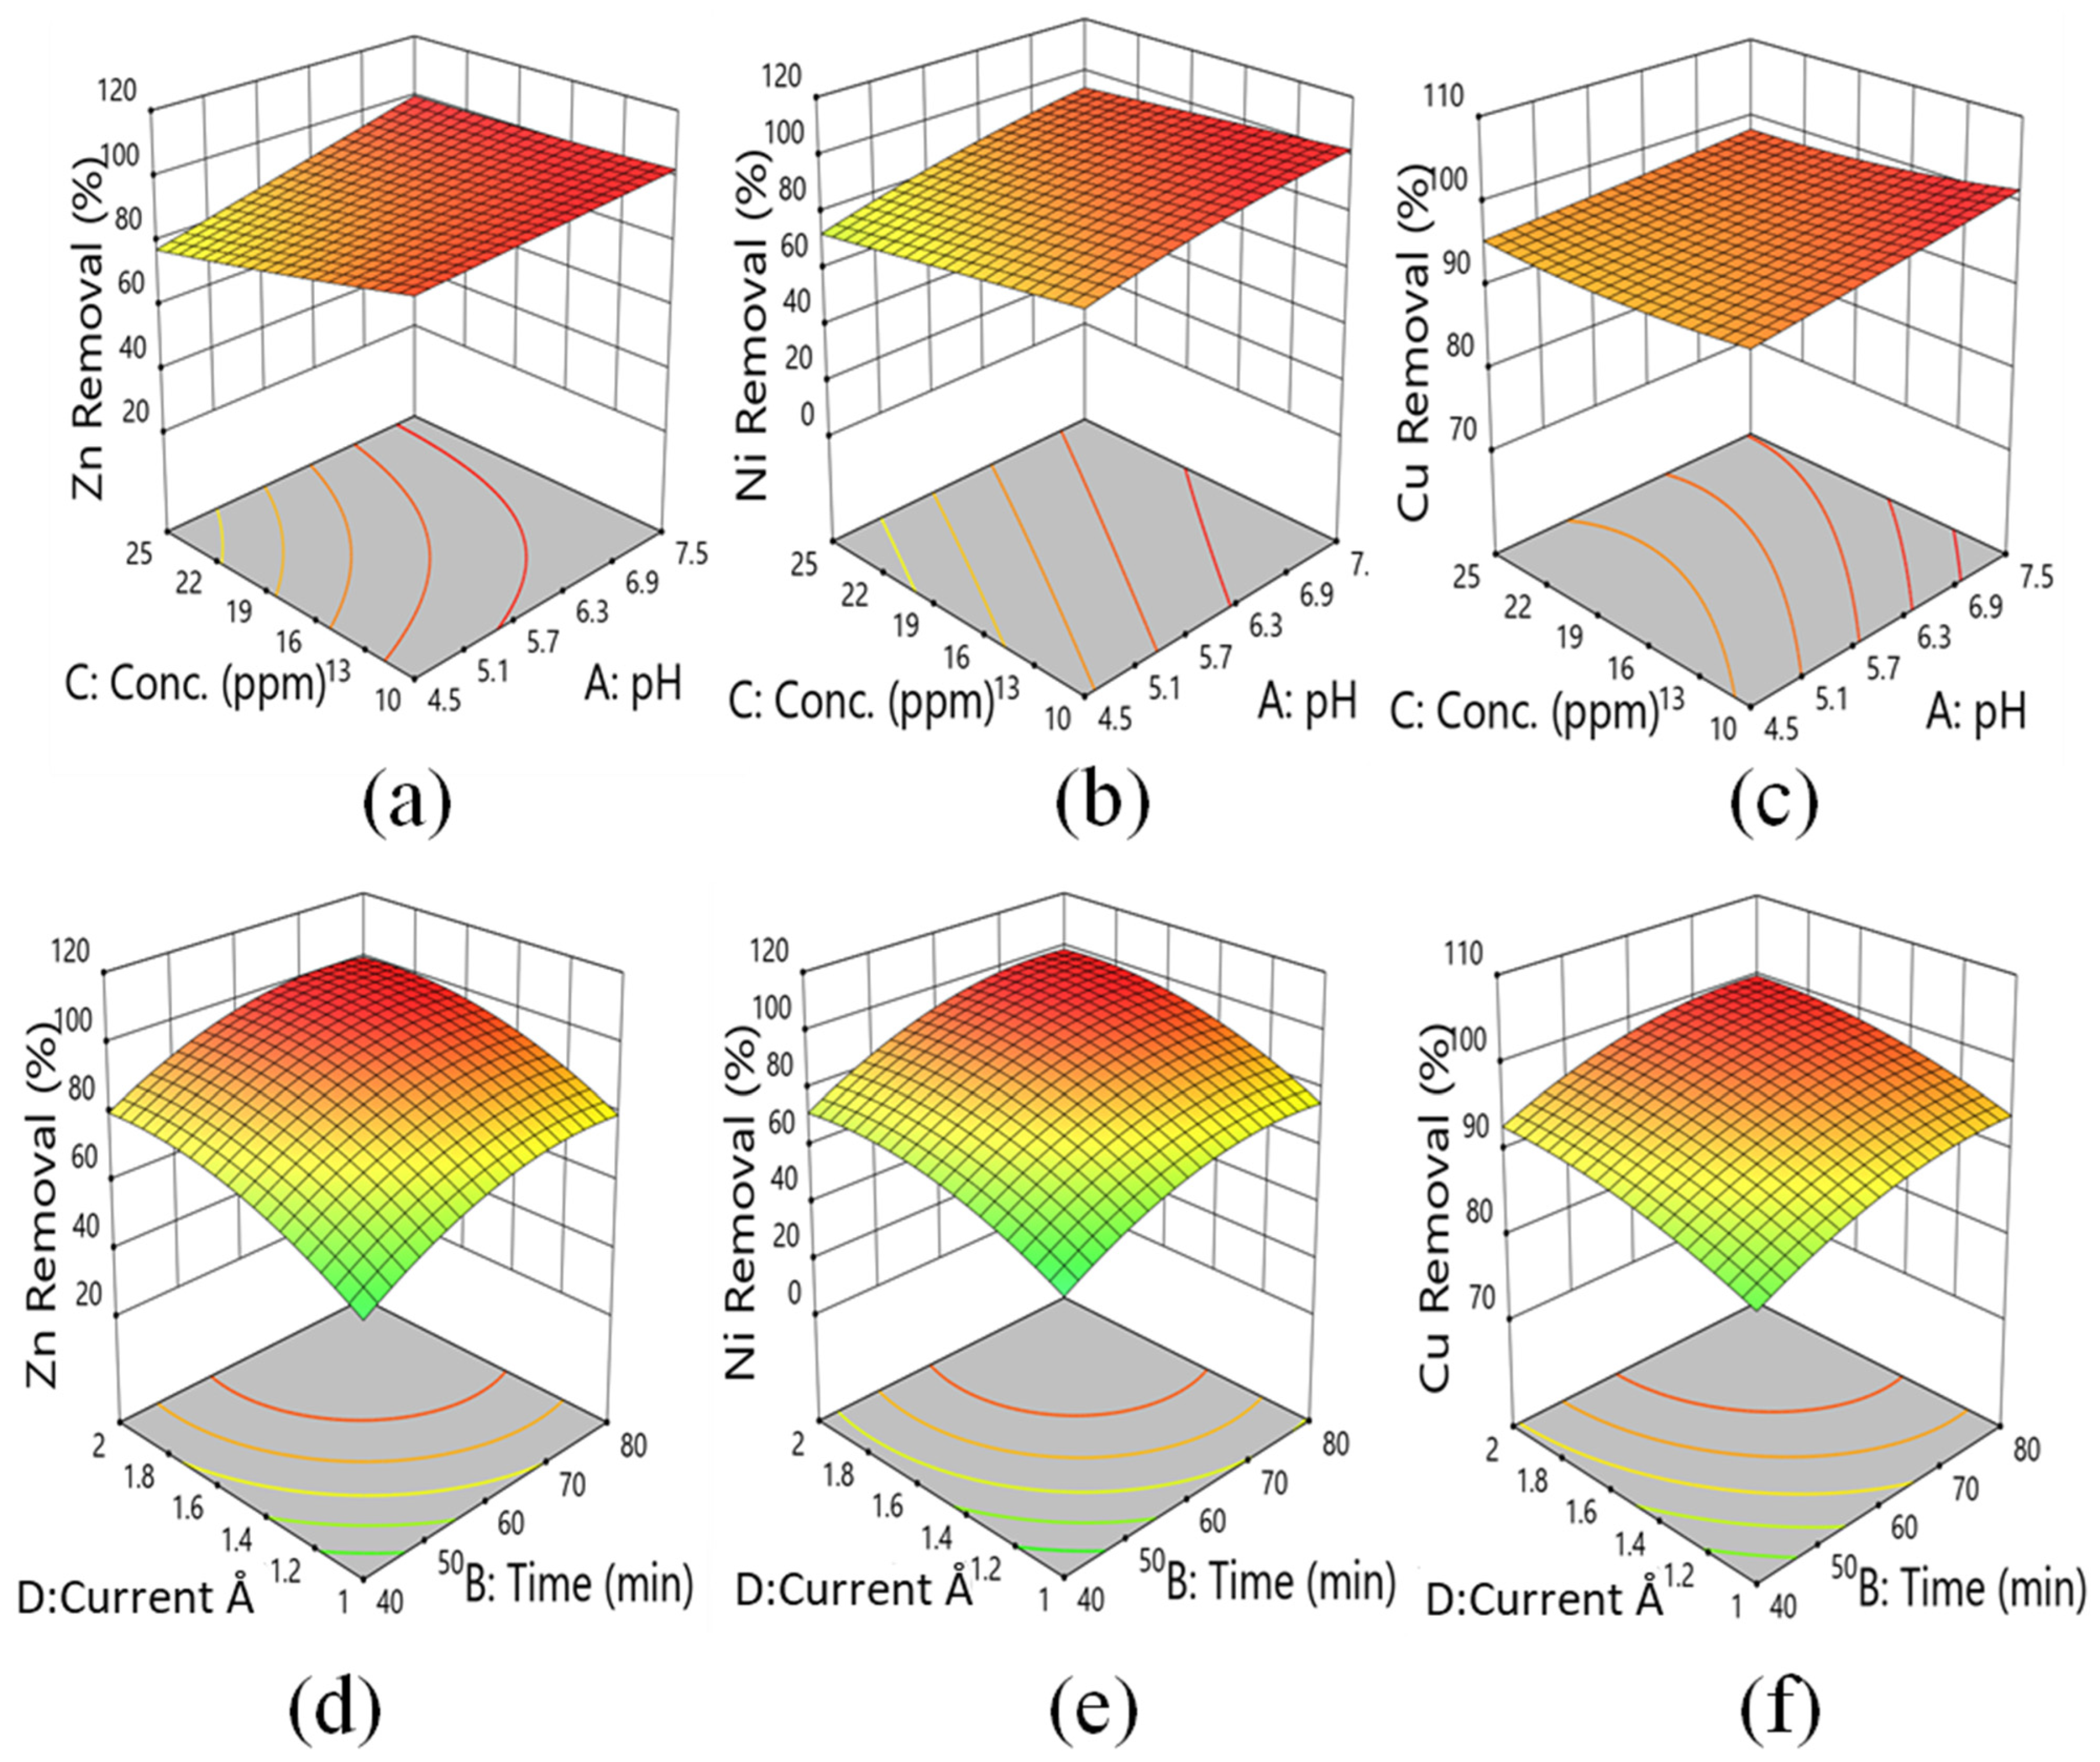
3.2. Experimental Performance of EC

The details of the coded variables (X1, X2, X3 and X4), and their response values are presented in Supplementary Table S2.

3.2.1. Statistical Analysis and Modelling by RSM

The findings of the experimental studies were analyzed statistically through analysis of variance (ANOVA). Table 5 shows the ANOVA models.
The F and p values presented in Table 5 indicate that the fitted models are significant. The values of R2 and adjusted R2 in the Table 5 also reveal the high significance levels of the models.
The quadratic regression model Equations (6)–(8) for Zn removal (Y1), Ni removal (Y2) and Cu removal (Y3) in terms of coded factors are given below.
Y 1 = + 93.51 + 7.05 X 1 + 10.35 X 2 5.22 X 3 + 10.69 X 4 0.030 X 1 2 7.46 X 2 2 + 0.58 X 3 2 6.74 X 4 2 + 0.039 X 1 X 2 + 4.07 X 1 X 3 4.70 X 1 X 4 + 0.81 X 2 X 3 0.60 X 2 X 4 + 4.38 X 3 X 4
Y 2 = + 90.88 + 9.06 X 1 + 12.42 X 2 5.53 X 3 + 10.75 X 4 2.14 X 1 2 8.60 X 2 2 + 0.069 X 3 2 7.71 X 4 2 1.75 X 1 X 2 + 1.35 X 1 X 3 4.46 X 1 X 4 + 1.01 X 2 X 3 + 0.93 X 2 X 4 + 2.24 X 3 X 4
Y 3 = + 97.05 + 2.00 X 1 + 3.69 X 2 1.00 X 3 + 3.06 X 4 + 0.10 X 1 2 2.19 X 2 2 + 0.79 X 3 2 1.55 X 4 2 + 0.081 X 1 X 2 0.57 X 1 X 3 1.25 X 1 X 4 + 0.91 X 2 X 3 0.16 X 2 X 4 + 0.32 X 3 X 4

3.2.2. Response Surface Plots

It is well documented in the literature that initial pH is an essential operating parameter that strongly affects the EC process performance. The pH effect on the removal efficiencies of metal ions after EC treatment was validated in the experimental observations. Maximum removal efficiency for Zn (99.46%), Ni (98.14%), and Cu (99.96%) has been observed at pH 6. Figure 4a–c demonstrates an increase in the removal efficiency with an increase in pH. This indicates that metal ion elimination decreases in an acidic medium [50]. As reported, in an intensely acidic medium, the protons in the solution get reduced to H2 gas at the cathode, and a sufficient number of hydroxyl ions are not generated. The pH of the initial solution affects the EC process by changing the solution’s physico-chemical properties, such as solubility of metal hydroxides, electric conductivity, and size of colloidal particles of iron (III) complexes, which are most reactive agents for metal ions [51]. A slight reduction in the removal efficiency with the rise in the initial concentration of the metals in solution, as shown in Figure 4, is attributed to the fact that the amount of dissolved iron from the electrode may not have been enough to treat the metal ions present in the wastewater. The higher initial concentration in the feed solution was also reportedly found to significantly affect the EC process [52].
It was observed (Figure 4d–f) that increasing the constant current substantially reduces metal ions. The constant current emerged as a crucial parameter in improving metal ion removal, which may have contributed to the direct current field, and potential electrolysis, resulting in more release of ferric ions and generating more iron hydroxides, further forming coagulants for metal removal.
Electrolysis time period plays a vital role in metal ion removal studies along with the constant current, pH and concentration. The concentration of Zn, Ni, and Cu has been observed to decrease with an increase in the electrolysis time. The complete reduction of metal ions was possible at a lower constant current by extending the electrolysis time. It may be stated that higher metal ion concentration consumes the adsorption ability of flocs formed, with fewer flocs being accessible for adsorption. Moreover, removal was limited by the formation rate of flocs of iron hydroxide complexes at the anode surface. It has been shown (Figure 4) that the minimum reduction was observed at lower electrolysis reaction times. The present study highlights that both the current and reaction time play a vital role in the removal efficiency of the EC process. Table 6 reports the results of this study vis-à-vis other studies reported in the literature on metal removal through EC processes.

3.2.3. Multi Response Optimization

For the EC System, the predicted response values of the factors (Y1, Y2, and Y3) were obtained as 101.50%, 94.452%, and 98.866% under optimal operating conditions. Input variables of current and time are the dominant factor in reaction conditions, so the predicted response value shows a higher value. After three experimental runs, the average response values of Y1, Y2, and Y3 were 99.81%, 99.99%, and 99.98%, respectively. All the experimentally attained values are quite close to the predicted response values and show a good correlation (Table 7).

3.3. Comparison with Chemical Precipitation and Adsorption Processes

Chemical precipitation is a commonly used treatment process for the removal of heavy metals from industrial wastewater because it is relatively inexpensive and easy to operate. This process involves the precipitation of heavy metals in the form of hydroxide and sulfide. Hydroxide precipitation depends on pH adjustment (9–11) to basic conditions [58]. The metal ions dissolved in the solution are precipitated into the insoluble solid phase as metal hydroxide through the chemical reaction when quicklime (CaO) is employed as a precipitant. Yet another common treatment process viz., adsorption, on the other hand, is a mass transfer process involving the migration of the metal ions (adsorbate) from the wastewater to a solid surface (adsorbent, commonly CaCO3) and binding through physical (weak Van der Waals force) and chemical (strong covalent bond) adsorption mechanisms [59,60]. With an idea to compare the performance of NF and EC processes with the above-stated routine ones, the present study employed concentration, contact time, and dosing amount as operational variables for the conventional chemical treatment process employing CaO and CaCO3. Twenty experiments were conducted for each process and Table 8 provides details of the experimental design.
In CaO precipitation, the removal efficiency of the process was quite high for Zn, Ni, and Cu ions, as expected and as indicated by the results in Table 9 However, understandably, there are also many demerits in this process. It requires a large amount of chemical precipitant and produces a considerable amount of low-density sludge due to the poor settling properties, duly followed by further dewatering and disposal issues [60,61]. Aggregation of metal precipitates also has long term environmental impacts. Treated water also has a very high pH (10–12), so it cannot be further used in industrial process and requires treatment.
Regarding the CaCO3 adsorption process, the results presented in Table 9 indicate that the removal of Ni ions is not as efficient as for Cu and Zn ions. In the adsorption process, generated sludge needs to be separated from the solution and requires regeneration or labelling as a hazardous waste due to the strong possibility of leaching out of metals ions in the environment, while needing post-treatment sludge management. Van der Waal forces are very weak to strong for different adsorbents, due to which the process is unable to deliver promising results [62,63,64].
NF process lies between ultrafiltration (UF) and reverse osmosis (RO). Designed to separate contaminants smaller than 10 nm, it emerges as one of the exemplary processes for eliminating dissolved metals ions from wastewater. The leading gains of this process are higher removal efficiency, reliability and easy operation, lesser space requirement, and relatively lower energy requirement [60,63,65]. Table 9 shows an outstanding rejection rate for metals ions from this study.
The EC process is also widely recognized as an effective treatment method for eliminating heavy metal ions from industrial wastewater. It does not require any additional chemicals because the electron is a crucial reagent in the process. EC is considered a rapid and well-controlled technique, provides good reduction yield, produces less sludge, has the potential of metal recovery, requires less labor, can save significant energy, and is eco-friendly [57,59]. Table 9 shows an excellent metal ion reduction in the present experimental work.

4. Conclusions

The present study examines the removal efficiency of heavy metals (Cu, Ni, and Zn) in a mixed aqueous solution in a batch mode through a nanofiltration (NF) membrane and an electrocoagulation (EC) process and compares it with conventional chemical treatment processes. Solution pH is seen to significantly affect the removal efficiency in both the NF and EC processes. The highest permeate flux of 59.34 L/m2·h was observed at the experimental condition of pH 9.5, pressure 25 Bar, concentration 25 ppm and temperature 35 °C in NF process. The rejection rate of Zn, Ni and Cu was demonstrated as 95.32%, 94.98% and 96.93%, respectively. A marked synergistic effect of temperature and pressure has been observed, which increased the flux to a high value. The EC process has shown a maximum removal of Zn (99.46%), Ni (98.14%), and Cu (99.87%) at the operational conditions viz., pH 6, time 60 (min), concentration 2.5 ppm, and current 1.5 Å. The results for the EC process indicated that a lower concentration and approximately neutral pH helped the system to reach its full potential. Overall, both NF and EC processes have shown excellent removal for all the studied metal ions and the outcome of the experiments described above projects them as promising solutions in comparison to conventional chemical treatment approaches.

Supplementary Materials

The following supporting information can be downloaded at: https://www.mdpi.com/article/10.3390/app12010280/s1, Table S1: Experimental design and responses of the NF process; Table S2: Experimental design and responses of the EC process.

Author Contributions

Conceptualization, J.K. and H.J.; methodology, J.K. and H.J.; software, J.K.; formal analysis, J.K. and S.K.M.; investigation, J.K.; resources, H.J. and S.K.M.; writing—original draft preparation, J.K.; writing, review and editing, H.J. and S.K.M. All authors have read and agreed to the published version of the manuscript.

Funding

This research received no external funding.

Data Availability Statement

All relevant data are within the manuscript and available from the corresponding author on request.

Acknowledgments

This work has been carried out with the Junior/Senior Research Fellowship of the University Grant Commission (UGC), New Delhi, India, under the Ph.D. programme. Authors are highly thankful to the Indian Institute of Technology Roorkee, Roorkee for providing the necessary support and encouragement for bringing out this publication.

Conflicts of Interest

The authors declare no conflict of interest or state.

References

  1. Tchounwou, P.B.; Yedjou, C.G.; Patlolla, A.K.; Sutton, D.J. Molecular, clinical and environmental toxicicology Volume 3: Environmental Toxicology. Mol. Clin. Environ. Toxicol. 2012, 101, 133–164. [Google Scholar] [CrossRef]
  2. Vareda, J.P.; Valente, A.J.M.; Durães, L. Assessment of heavy metal pollution from anthropogenic activities and remediation strategies: A review. J. Environ. Manag. 2019, 246, 101–118. [Google Scholar] [CrossRef] [PubMed]
  3. Hussain, J.; Husain, I.; Arif, M.; Gupta, N. Studies on heavy metal contamination in Godavari river basin. Appl. Water Sci. 2017, 7, 4539–4548. [Google Scholar] [CrossRef]
  4. Malyan, S.K.; Singh, R.; Rawat, M.; Kumar, M.; Pugazhendhi, A.; Kumar, A.; Kumar, V.; Kumar, S.S. Biocatalysis and Agricultural Biotechnology An overview of carcinogenic pollutants in groundwater of India. Biocatal. Agric. Biotechnol. 2019, 21, 101288. [Google Scholar] [CrossRef]
  5. Kumar, A.; Malyan, S.K.; Kumar, S.S.; Dutt, D.; Kumar, V. Biocatalysis and Agricultural Biotechnology An assessment of trace element contamination in groundwater aquifers of. Biocatal. Agric. Biotechnol. 2019, 20, 101213. [Google Scholar] [CrossRef]
  6. Kumar, A.; Jigyasu, D.K.; Subrahmanyam, G.; Mondal, R.; Shabnam, A.A.; Cabral-Pinto, M.M.S.; Malyan, S.K.; Chaturvedi, A.K.; Gupta, D.K.; Fagodiya, R.K.; et al. Nickel in terrestrial biota: Comprehensive review on contamination, toxicity, tolerance and its remediation approaches. Chemosphere 2021, 275, 129996. [Google Scholar] [CrossRef]
  7. Kumar, A.; Pinto, M.C.; Candeias, C.; Dinis, P.A. Baseline maps of potentially toxic elements in the soils of Garhwal Himalayas, India: Assessment of their eco-environmental and human health risks. Land Degrad. Dev. 2021, 32, 3856–3869. [Google Scholar] [CrossRef]
  8. Maher, A.; Sadeghi, M.; Moheb, A. Heavy metal elimination from drinking water using nanofiltration membrane technology and process optimization using response surface methodology. Desalination 2014, 352, 166–173. [Google Scholar] [CrossRef]
  9. Tonhá, M.S.; Garnier, J.; Araújo, D.F.; Cunha, B.C.A.; Machado, W.; Dantas, E.; Araújo, R.; Kutter, V.T.; Bonnet, M.P.; Seyler, P. Behavior of metallurgical zinc contamination in coastal environments: A survey of Zn from electroplating wastes and partitioning in sediments. Sci. Total Environ. 2020, 743, 140610. [Google Scholar] [CrossRef] [PubMed]
  10. Rodrigues, S.K.; Machado, W.; Guerra, J.V.; Geraldes, M.; Morales, S.; Vinzón, S.B. Changes in Cd and Zn distribution in sediments after closure of an electroplating industry, Sepetiba bay, Brazil. Mar. Pollut. Bull. 2020, 161, 111758. [Google Scholar] [CrossRef] [PubMed]
  11. Nriagu, J. Zinc Toxicity in Humans. Encycl. Environ. Health 2011, 801–807. [Google Scholar] [CrossRef]
  12. Qu, L.; Huang, H.; Xia, F.; Liu, Y.; Dahlgren, R.A.; Zhang, M.; Mei, K. Risk analysis of heavy metal concentration in surface waters across the rural-urban interface of the Wen-Rui Tang River, China. Environ. Pollut. 2018, 237, 639–649. [Google Scholar] [CrossRef] [PubMed] [Green Version]
  13. Kumar, A.; Subrahmanyam, G.; Mondal, R.; Cabral-pinto, M.M.S.; Shabnam, A.A.; Jigyasu, D.K.; Malyan, S.K.; Kishor, R.; Khan, S.A.; Kumar, A.; et al. Chemosphere Bio-remediation approaches for alleviation of cadmium contamination in natural resources. Chemosphere 2021, 268, 128855. [Google Scholar] [CrossRef] [PubMed]
  14. Tatiana, A.; Manceau, A.; Spadini, L.; Panfili, F.; Marcus, M.A.; Jacquet, T. Speciation and solubility of heavy metals in contaminated soil using X-ray microfluorescence, EXAFS spectroscopy, chemical extraction, and thermodynamic modeling. Geochim. Cosmochim. Acta 2006, 70, 2163–2190. [Google Scholar] [CrossRef]
  15. Li, Y.; Tsend, N.; Li, T.K.; Liu, H.; Yang, R.; Gai, X.; Wang, H.; Shan, S. Microwave assisted hydrothermal preparation of rice straw hydrochars for adsorption of organics and heavy metals. Bioresour. Technol. 2019, 273, 136–143. [Google Scholar] [CrossRef] [PubMed]
  16. Sadeek, A.; Negm, N.A.; Hefni, H.H.H.; Wahab, M.M.A. Metal adsorption by agricultural biosorbents: Adsorption isotherm, kinetic and biosorbents chemical structures. Int. J. Biol. Macromol. 2015, 81, 400–409. [Google Scholar] [CrossRef]
  17. WHO. 2017 World Health Statistics 2017: Monitoring Health for the SDGs, Sustainable Development Goals; World Health Organization: Geneva, Switzerland, 2017. [Google Scholar]
  18. UN-Water. World Water Assessment Programme (Nations Unies), the United Nations World Water Development Report 2018; United Nations Educational, Scientific and Cultural Organization: New York, NY, USA, 2018; Available online: https://www.unwater.org/publications/world-water-development-report-2018/ (accessed on 14 October 2021).
  19. Pandit, A.B.; Kumar, J.K. Clean Water for Developing Countries. Annu. Rev. Chem. Biomol. Eng. 2015, 6, 217–246. [Google Scholar] [CrossRef] [PubMed] [Green Version]
  20. Price, J.R.; Ledford, S.H.; Ryan, M.O.; Toran, L.; Sales, C.M. Science of the Total Environment Wastewater treatment plant effluent introduces recoverable shifts in microbial community composition in receiving streams. Sci. Total Environ. 2018, 613–614, 1104–1116. [Google Scholar] [CrossRef] [PubMed]
  21. Kumar, S.S.; Kadier, A.; Malyan, S.K.; Ahmad, A. Phytoremediation and Rhizoremediation: Uptake, Mobilization and Sequestration of Heavy Metals by Plants. In Plant-Microbe Interactions in Agro-Ecological Perspectives; Singh, D., Singh, H., Prabha, R., Eds.; Springer: Singapore, 2017. [Google Scholar] [CrossRef]
  22. Malyan, S.K.; Yadav, S.; Sonkar, V.; Goyal, V.C.; Singh, O.; Singh, R. Mechanistic understanding of the pollutant removal and transformation processes in the constructed wetland system. Water Environ. Res. 2021, 93, 1882–1909. [Google Scholar] [CrossRef] [PubMed]
  23. Wu, J.; Huang, R.; Zhou, Q.; Lu, H.; Li, F.; Wu, K.; Li, Z. Science of the Total Environment Magnetic biochar reduces phosphorus uptake by Phragmites australis during heavy metal remediation. Sci. Total Environ. 2021, 758, 143643. [Google Scholar] [CrossRef] [PubMed]
  24. Malyan, S.K.; Kumar, S.S.; Fagodiya, R.K.; Ghosh, P.; Kumar, A.; Singh, R.; Singh, L. Biochar for environmental sustainability in the energy-water-agroecosystem nexus. Renew. Sustain. Energy Rev. 2021, 149, 111379. [Google Scholar] [CrossRef]
  25. Kumar, D.; Sharma, C. Remediation of Pulp and Paper Industry Effluent Using Electrocoagulation Process. J. Water Resour. Prot. 2019, 11, 296–310. [Google Scholar] [CrossRef] [Green Version]
  26. Kurniawan, T.A.; Chan, G.Y.S.; Lo, W.H.; Babel, S. Physico-chemical treatment techniques for wastewater laden with heavy metals. Chem. Eng. J. 2006, 118, 83–98. [Google Scholar] [CrossRef]
  27. Singh, V.; Ram, C. Physico-Chemical Characterization of Electroplating Industrial Effluents of Chandigarh and Haryana Region. J. Civ. Environ. Eng. 2016, 6, 4. [Google Scholar] [CrossRef] [Green Version]
  28. Sivakumar, D.; Nouri, J.; Modhini, T.M.; Deepalakshmi, K. Nickel removal from electroplating industry wastewater: A bamboo activated carbon. Glob. J. Environ. Sci. Manag. 2018, 4, 325–338. [Google Scholar] [CrossRef]
  29. Dasgupta, J.; Mondal, D.; Chakraborty, S.; Sikder, J.; Curcio, S.; Arafat, H.A. Nano filtration based water reclamation from tannery effluent following coagulation pretreatment. Ecotoxicol. Environ. Saf. 2015, 121, 22–30. [Google Scholar] [CrossRef] [PubMed]
  30. Almeida, M.; Erthal, R.; Padua, E.; Silveira, L.; Am, L. Response surface methodology (RSM) as a tool for optimization in analytical chemistry. Talanta 2008, 76, 965–977. [Google Scholar] [CrossRef]
  31. Srivastava, A.; Aghilesh, K.; Nair, A.; Ram, S.; Agarwal, S.; Ali, J.; Singh, R.; Chandra, M. Response surface methodology and artificial neural network modelling for the performance evaluation of pilot-scale hybrid nanofiltration (NF) & reverse osmosis (RO) membrane system for the treatment of brackish ground water. J. Environ. Manag. 2021, 278, 111497. [Google Scholar]
  32. Sinha, A.; Biswas, P.; Sarkar, S.; Bora, U.; Purkait, M.K. Separation of chloride and sulphate ions from nano fi ltration rejected wastewater of steel industry. J. Water Process Eng. 2020, 33, 101108. [Google Scholar] [CrossRef]
  33. Madaeni, S.S.; Arast, N.; Rahimpour, F.; Arast, Y. Fabrication optimization of acrylonitrile butadiene styrene (ABS)/polyvinylpyrrolidone (PVP) nano fi ltration membrane using response surface methodology. Desalination 2011, 280, 305–312. [Google Scholar] [CrossRef]
  34. Patidar, R.; Srivastava, V.C. Chemosphere Mechanistic insight into ultrasound-induced enhancement of electrochemical oxidation of o fl oxacin: Multi-response optimization and cost analysis. Chemosphere 2020, 257, 127121. [Google Scholar] [CrossRef] [PubMed]
  35. Roy, Y.; Warsinger, D.M.; Lienhard, J.H. Effect of temperature on ion transport in nanofiltration membranes: Diffusion, convection and electromigration. Desalination 2017, 420, 241–257. [Google Scholar] [CrossRef]
  36. Figoli, A.; Cassano, A.; Criscuoli, A.; Mozumder, M.S.I.; Uddin, M.T.; Islam, M.A.; Drioli, E. Influence of operating parameters on the arsenic removal by nanofiltration. Water Res. 2010, 44, 97–104. [Google Scholar] [CrossRef] [PubMed]
  37. Al-Rashdi, B.A.M.; Johnson, D.J.; Hilal, N. Removal of heavy metal ions by nanofiltration. Desalination 2013, 315, 2–17. [Google Scholar] [CrossRef]
  38. Gherasim, C.V.; Mikulášek, P. Influence of operating variables on the removal of heavy metal ions from aqueous solutions by nanofiltration. Desalination 2014, 343, 67–74. [Google Scholar] [CrossRef]
  39. Zhou, R.; Liu, F.; Wei, N.; Yang, C.; Yang, J.; Wu, Y.; Li, Y. Comparison of Cr (VI) removal by direct and pulse current electrocoagulation: Implications for energy consumption optimization, sludge reduction and floc magnetism. J. Water Process Eng. 2020, 37, 101387. [Google Scholar] [CrossRef]
  40. Xu, L.; Xu, X.; Cao, G.; Liu, S.; Duan, Z.; Song, S.; Song, M.; Zhang, M. Optimization and assessment of Fe e electrocoagulation for the removal of potentially toxic metals from real smelting wastewater. J. Environ. Manag. 2018, 218, 129–138. [Google Scholar] [CrossRef] [PubMed]
  41. Pino, L.; Vargas, C.; Schwarz, A.; Borquez, R. Influence of operating conditions on the removal of metals and sulfate from copper acid mine drainage by nanofiltration. Chem. Eng. J. 2018, 345, 114–125. [Google Scholar] [CrossRef]
  42. Tsuru, T.; Izumi, S.; Yoshioka, T.; Asaeda, M. Temperature effect on transport performance by inorganic nanofiltration membranes. AIChE J. 2000, 46, 565–574. [Google Scholar] [CrossRef]
  43. Micari, M.; Diamantidou, D.; Heijman, B.; Moser, M.; Haidari, A.; Spanjers, H.; Bertsch, V. Experimental and theoretical characterization of commercial nanofiltration membranes for the treatment of ion exchange spent regenerant. J. Memb. Sci. 2020, 606, 118117. [Google Scholar] [CrossRef]
  44. Peydayesh, M.; Mohammadi, T.; Nikouzad, S.K. A positively charged composite loose nanofiltration membrane for water purification from heavy metals. J. Memb. Sci. 2020, 611, 118205. [Google Scholar] [CrossRef]
  45. Hamid, M.F.; Abdullah, N.; Yusof, N.; Ismail, N.M.; Ismail, A.F.; Salleh, W.N.W.; Jaafar, J.; Aziz, F.; Lau, W.J. Effects of surface charge of thin-film composite membrane on copper (II) ion removal by using nanofiltration and forward osmosis process. J. Water Process Eng. 2020, 33, 101032. [Google Scholar] [CrossRef]
  46. Wang, J.; Yu, W.; Graham, N.J.D.; Jiang, L. Evaluation of a novel polyamide-polyethylenimine nanofiltration membrane for wastewater treatment: Removal of Cu2+ ions. Chem. Eng. J. 2020, 392, 123769. [Google Scholar] [CrossRef]
  47. Roy, S.; Majumdar, S.; Sahoo, G.C.; Bhowmick, S.; Kundu, A.K.; Mondal, P. Removal of As(V), Cr(VI) and Cu(II) using novel amine functionalized composite nanofiltration membranes fabricated on ceramic tubular substrate. J. Hazard. Mater. 2020, 399, 122841. [Google Scholar] [CrossRef] [PubMed]
  48. Hosseini, S.S.; Nazif, A.; Shahmirzadi, M.A.A.; Ortiz, I. Fabrication, tuning and optimization of poly (acrilonitryle) nanofiltration membranes for effective nickel and chromium removal from electroplating wastewater. Sep. Purif. Technol. 2017, 187, 46–59. [Google Scholar] [CrossRef] [Green Version]
  49. Chaudhari, L.B.; Murthy, Z.V.P. Separation of Cd and Ni from multicomponent aqueous solutions by nanofiltration and characterization of membrane using IT model. J. Hazard. Mater. 2010, 180, 309–315. [Google Scholar] [CrossRef] [PubMed]
  50. Murthy, Z.V.P.; Chaudhari, L.B. Separation of binary heavy metals from aqueous solutions by nanofiltration and characterization of the membrane using Spiegler-Kedem model. Chem. Eng. J. 2009, 150, 181–187. [Google Scholar] [CrossRef]
  51. Al-shannag, M.; Al-qodah, Z.; Bani-melhem, K.; Rasool, M. Heavy metal ions removal from metal plating wastewater using electrocoagulation: Kinetic study and process performance. Chem. Eng. J. 2015, 260, 749–756. [Google Scholar] [CrossRef]
  52. Mollah, M.Y.A.; Schennach, R.; Parga, J.R.; Cocke, D.L. Electrocoagulation (EC)—Science and applications. J. Hazard. Mater. 2001, 84, 29–41. [Google Scholar] [CrossRef]
  53. El-Ashtoukhy, E.S.Z.; Amin, N.K.; Fouad, Y.O.; Hamad, H.A. Intensification of a new electrocoagulation system characterized by minimum energy consumption and maximum removal efficiency of heavy metals from simulated wastewater. Chem. Eng. Process.-Process Intensif. 2020, 154, 108026. [Google Scholar] [CrossRef]
  54. Sarwanto, S.; Nugroho, R.; Handayani, M.; Pratama, M.A. Heliyon Optimization and reaction kinetics on the removal of Nickel and COD from wastewater from electroplating industry using Electrocoagulation and Advanced Oxidation Processes. Heliyon 2020, 6, e03319. [Google Scholar] [CrossRef]
  55. Mamelkina, M.A.; Vasilyev, F.; Tuunila, R.; Sillanpää, M.; Häkkinen, A. Investigation of the parameters affecting the treatment of mining waters by electrocoagulation. J. Water Process Eng. 2019, 32, 100929. [Google Scholar] [CrossRef]
  56. Xu, L.; Cao, G.; Xu, X.; Liu, S.; Duan, Z.; He, C.; Wang, Y.; Huang, Q. Simultaneous removal of cadmium, zinc and manganese using electrocoagulation: Influence of operating parameters and electrolyte nature. J. Environ. Manag. 2017, 204, 394–403. [Google Scholar] [CrossRef]
  57. Prica, M.; Adamovic, S.; Dalmacija, B.; Rajic, L. The electrocoagulation/flotation study: The removal of heavy metals from the waste fountain. Process Saf. Environ. Prot. 2014, 94, 262–273. [Google Scholar] [CrossRef]
  58. Arslan, T.; Arslan-alaton, I.; Tünay, O. Complexing agent and heavy metal removals from metal plating effluent by electrocoagulation with stainless steel electrodes. J. Hazard. Mater. 2009, 165, 838–845. [Google Scholar] [CrossRef]
  59. Malik, L.A.; Bashir, A.; Qureashi, A.; Pandith, A.H. Detection and removal of heavy metal ions: A review. Environ. Chem. Lett. 2019, 17, 1495–1521. [Google Scholar] [CrossRef]
  60. Bolisetty, S.; Peydayesh, M.; Mezzenga, R. Sustainable technologies for water purification from heavy metals: Review and analysis. Chem. Soc. Rev. 2019, 48, 463–487. [Google Scholar] [CrossRef]
  61. Fu, F.; Wang, Q. Removal of heavy metal ions from wastewaters: A review. J. Environ. Manag. 2011, 92, 407–418. [Google Scholar] [CrossRef]
  62. Vunain, E.; Mishra, A.K.; Mamba, B.B. Dendrimers, mesoporous silicas and chitosan-based nanosorbents for the removal of heavy-metal ions: A review. Int. J. Biol. Macromol. 2016, 86, 570–586. [Google Scholar] [CrossRef] [PubMed]
  63. Abdullah, N.; Yusof, N.; Lau, W.J.; Jaafar, J.; Ismail, A.F. Recent trends of heavy metal removal from water/wastewater by membrane technologies. J. Ind. Eng. Chem. 2019, 76, 17–38. [Google Scholar] [CrossRef]
  64. Zhao, M.; Xu, Y.; Zhang, C.; Rong, H.; Zeng, G. New trends in removing heavy metals from wastewater. Appl. Microbiol. Biotechnol. 2016, 100, 6509–6518. [Google Scholar] [CrossRef]
  65. Vardhan, K.H.; Kumar, P.S.; Panda, R.C. A review on heavy metal pollution, toxicity and remedial measures: Current trends and future perspectives. J. Mol. Liq. 2019, 290, 111197. [Google Scholar] [CrossRef]
Figure 1. (a) Flat Plate Membrane System. (Control Panel, TN = Temperature Node, P = Pressure Node, FR = Flow Rate Controller node, TS = Temperature Sensor, PV = Pressure Valve, PS = Pressure Sensor, FPC = Flat Plate Membrane Cell, HP = High-Pressure Pump, FT = Feed Tank.). (b) Laboratory scale experimental setup of electrocoagulation unit. (1-AC, power scheme; 2, direct current supply; 3, treatment vessel, consists of anode and cathode in mono-polar mode, magnetic-bead; 4, magnetic stirrer).
Applsci 12 00280 g001
Figure 2. RSM plot for permeate flux. (a) Effect of pressure and pH. (b) Effect of temperature and concentration.
Applsci 12 00280 g002
Figure 3. NF membrane RSM plots for pH and pressure effects on metals ions rejection% efficiency—(a) Zn ions, (b) Ni ions, and (c) Cu ions; and effect of temperature and concentration on metal ions rejection% efficiency—(d) Zn ions, (e) Ni ions, and (f) Cu ions.
Applsci 12 00280 g003
Figure 4. Electrocoagulation RSM graphs: effects of concentration and pH on removal% efficiency of metal ions: (a) Zn ions, (b) Ni ions and (c) Cu ions. Effect of current and reaction time on removal% efficiency of metal ions: (d) Zn ions, (e) Ni ions and (f) Cu ions.
Applsci 12 00280 g004
Table 1. Factor and range for design experiments of NF membrane and EC.
CodeFactorsCoded Level of N.F.
−α−10+1
X1pH2.04.57.09.512.0
X2Pressure (bar)2.51017.52532.5
X3Concentration (ppm)2.51017.52532.5
X4Temperature (°C)515253545
CodeFactorsCoded level of E.C.
−α−10+1
X1pH3.04.56.07.59.0
X2Time (min)20406080100
X3Concentration(ppm)2.51017.52532.5
X4Current (Å)0.51.01.52.02.5
Table 2. ANOVA analysis for the NF membrane.
SourceSum of SquaresDegree of FreedomMean SquareF-Valuep-ValueR2R2adjResponses
Model5816.8714415.4970.29<0.00010.9850.971Flux
Model17,449.52141246.3912.41<0.00010.92050.8464Zn Removal%
Model10,360.6114740.045.070.00170.82550.6626Ni Removal%
Model2541.0114181.5019.12<0.00010.94690.8974Cu Removal%
Table 3. Comparison of rejection efficiency of metals ions by NF membrane between this and other studies in the literature.
Pollutants/Wastewater TypeMembraneMetal Rejection/RemovalReferences
Synthetic metal ion solutionNFZn (98.64%), Ni (90.54%), and Cu (99.79%)Current study
Synthetic metal ion solutionNFZn (96.7%), Mg (95.01%), Cd (92.4%), Cu (91.9%), Ca (91.3%), Ni (90.7%), and Pb (90.5%).[44]
Synthetic metal ion solutionNF and FOCu-(II) 95% and 99% in NF
and F.O., respectively.
[45]
Synthetic metal ion solutionNFCu ion rejection was >90%[46]
Synthetic metal ion solutionNFCu (99.82%), As (V) (96.75%), and Cr (97.22%).[47]
Electroplating wastewaterNFNi (88.093%) and Cr (80.271%)[48]
Synthetic metal ion solutionNFNi (93%)[8]
Synthetic metal ion solutionNFCu (100%), Cd (99%), Mn (89%), and Pb (74%)[37]
Synthetic metal ion solutionNFCd (97.26%) and Ni (98.90%)[49]
Synthetic metal ion solutionNFNi (98.94%) and Cd (82.69%)[50]
Note: NF—nanofiltration membrane; FO—Forward Osmosis.
Table 4. NF Optimization of response through RSM.
Optimum Input Variables (Feed Solution)Predicted Responses by RSMExperimental ValidationDifference%
Concentration (ppm)14.24Flux (L/m2·h)36.9241.9313.58
Temperature (°C)25Zn Removal%94.7798.644.08
pH7.84Ni Removal%88.6790.542.11
Pressure (Bar)22.79Cu Removal%95.8999.794.07
Table 5. ANOVA analysis for the EC process.
SourceSum of SquaresDegree of FreedomMean SquareF-Valuep-ValueR2R2adjResponses
Model10,750.3614767.886.030.00070.84920.7085Zn Removal%
Model13,024.8514930.359.39<0.00010.89760.8020Ni Removal%
Model940.481467.182.780.02930.72200.4625Cu Removal%
Table 6. Overview of metals ion removal efficiency by EC processes described in the literature.
Pollutants/WastewaterE.C. ProcessMetal Removal EfficiencyReferences
Synthetic wastewaterSS electrodeZn (99.81%), Ni (99.99%), and Cu (99.98%)Current study
Synthetic wastewaterAluminum ElectrodeNi2+ and Cu2+ ions% removal efficiency ranged from 34.56–100%[53]
Electroplating Industry wastewaterAluminium platesNi (99.75%)[54]
Mine wastewaterIron ElectrodesCo (99%) Ni (97%), Zn (99%), Cu (97%), and Cd (99%).[55]
Smelting wastewaterIron PlatesZn2+, Cd2+, and Mn2+ removal efficiency 99.93%, 97.15%, and 85.46% respectivilty[40]
Synthetic Smelting WastewaterFe electrodeZn2+, Cd2+, and Mn2+ removal efficiency 99.5%, 99.9%, and 55% respectively.[56]
Metal Plating WastewaterIron (carbon steel) platesCu2+, Cr3+, Ni2+, and Zn2+ over 97%[51]
Waste Fountain SolutionAluminium and Iron electrodeNi (>95%), Cu (>95%), and Zn (>80%)[57]
Metal Plating EffluentSS ElectrodeNi (100%) and Zn (100%)[58]
Table 7. EC Optimization of response through RSM.
Optimum Input Variables (Feed Solution)Predicted Responses by RSMExperimental ValidationDifference%
pH7Zn Removal%101.5099.811.67
Time60Ni Removal%94.4599.995.86
Initial Conc. (ppm)24.923Cu Removal%98.8699.981.13
Current (Å)1.912--------
Table 8. Factors and Range of Design for CaO and CaCO3.
FactorNameUnitsLow ActualHigh ActualLow CodedHigh Coded
AConc.ppm10.0025.00−1.0001.000
BContact TimeMinute30.0090.00−1.0001.000
CDosing Amountg/L4.008.00−1.0001.000
Table 9. Removal% Efficiency of Conventional (CaO and CaCO3) vs. EC and NF processes.
S.N.Elements
Name
UnitCaO
(Maximum)
CaCO3
(Maximum)
EC
(Maximum)
NF
(Maximum)
1Zn Removal%99.7299.8299.4699.96
2Ni Removal%99.9643.4698.1499.63
3Cu Removal%99.9999.9999.9699.99
Publisher’s Note: MDPI stays neutral with regard to jurisdictional claims in published maps and institutional affiliations.

