
MUFFLE: Multi-Modal Fake News Influence Estimator on Twitter
by
 ,
,
Cheng-Lin Wu
1, 
Hsun-Ping Hsieh
1,*,
Jiawei Jiang
1,
Yi-Chieh Yang
2,
Chris Shei
3 and
Yu-Wen Chen
4 1
Department of Electrical Engineering, National Cheng Kung University, Tainan 70101, Taiwan
2
Department of Foreign Languages and Literature, National Cheng Kung University, Tainan 70101, Taiwan
3
College of Arts and Humanities, Swansea University, Swansea SA2 8PP, UK
4
Research Center for Information Technology Innovation, Academia Sinica, Taipei 115, Taiwan
*
Author to whom correspondence should be addressed.
Appl. Sci. 2022, 12(1), 453; https://0-doi-org.brum.beds.ac.uk/10.3390/app12010453
Submission received: 26 November 2021
/
Revised: 24 December 2021
/
Accepted: 27 December 2021
/
Published: 4 January 2022
(This article belongs to the Special Issue Advances in Artificial Intelligence Methods for Natural Language Processing)
Abstract
:To alleviate the impact of fake news on our society, predicting the popularity of fake news posts on social media is a crucial problem worthy of study. However, most related studies on fake news emphasize detection only. In this paper, we focus on the issue of fake news influence prediction, i.e., inferring how popular a fake news post might become on social platforms. To achieve our goal, we propose a comprehensive framework, MUFFLE, which captures multi-modal dynamics by encoding the representation of news-related social networks, user characteristics, and content in text. The attention mechanism developed in the model can provide explainability for social or psychological analysis. To examine the effectiveness of MUFFLE, we conducted extensive experiments on real-world datasets. The experimental results show that our proposed method outperforms both state-of-the-art methods of popularity prediction and machine-based baselines in top-k NDCG and hit rate. Through the experiments, we also analyze the feature importance for predicting fake news influence via the explainability provided by MUFFLE.
1. Introduction
With the boom of social media platforms, there are tens of millions of user-generated information on social media platforms every day [1]. Due to the development of online communities, the world is better connected than ever before. On social networks, users are connected to other users by an average separation of 3.57 (https://research.fb.com/blog/2016/02/three-and-a-half-degrees-of-separation/) (accessed on 25 December 2021).The short communication distance and ease of access make online social media an increasingly popular venue for information sharing. The convenience and low cost of social networking are conducive to collective intelligence, but at the same time, it leads to a negative by-product: the propagation of misinformation such as fake news. Fake news is defined as a kind of news story relaying intentionally false information on social media [2,3]. In recent years, consumers have been getting used to accessing news from social media. For example, the Pew Research Center announced that approximately 79% of US adults get news from social media in 2020, compared to only 49% in 2012 (www.journalism.org/2021/01/12/news-use-across-social-media-platforms-in-2020/) (accessed on 25 December 2021).
The explosive growth of fake news has influenced democracy, justice, and public trust. Both individuals and organizations can be easily overwhelmed by the sheer volume of online posts or misled by widespread fake news. For example, studies show that approximately 5800 people were admitted to the hospital as a result of false information on social media during the COVID-19 pandemic [4]. Therefore, we aim to construct an estimator to predict the popularity of fake news in social media. The estimator will have the ability to predict which post of fake news has a high popularity potential, so it can help organizations identify and mitigate the propagation of false information in the early stage. Additionally, with the good generalization performance of our model, the methods and features proposed in this paper can also be applied to other situations, such as identifying events of viral marketing, recommendation systems, and online advertising.
In the past decade, a series of efforts have been devoted to the problem of popularity prediction and fake news detection. Generally speaking, popularity prediction aims to predict future popularity when observing early adopters during a specific observation period. Some studies proposed to use generative approaches, such as the Poisson process or Hawkes process, to model the propagation process of information and estimate the scale of cascade [1,5,6,7,8]. Other approaches employed features from various aspects of social media, such as user characteristics [9,10,11], temporal information [12,13], and the structure of propagation network [14,15,16]. These methods have shown significant improvement in prediction. However, due to the limitation that input features rely heavily on hand-crafting and domain knowledge, the models provide less generalization. To address this problem, deep learning-based methods were proposed to automatically capture the dynamics of information dissemination [1,17,18,19]. By leveraging deep learning techniques, the methods achieved robust prediction performance without requiring strong prior knowledge and feature design. However, there is still room for improvement in some specific topics, e.g., predicting the influence of fake news. Predicting the influence of fake news is not exactly the same as popularity prediction. The reason is four-fold. Firstly, existing work for popularity prediction usually considers only posts to build the cascade network. However, we exploit retweet posts to build cascade networks, which is especially worth investigating for fake news. The reason is that user characteristics, i.e., node attributes, have more impacts on message dissemination than the post itself. Second, no existing work considers user timeline and self-description in the user’s profile. These two sources are significantly important features for fake news analysis. Thirdly, most traditional work, including feature-based and deep learning-based methods, cannot provide explainability, while our designed attention mechanism can. Fourth, our work is easy to be incorporated with state-of-art fake news detection, while popularity prediction work does not focus on fake news. Our experiment confirms the prediction power of MUFFLE outperforms general popularity prediction works.
As for fake news detection, multiple approaches are categorized according to their features for prediction: (1) content-based: using text information to spot and verify fake news [20,21,22,23]. (2) user-based: relying on involved users’ characteristics to detect fake news [24,25,26,27]. (3) network-based: encoding the propagation structure and feeding it into neural network as features [21,28,29,30,31]. (4) hybrid-based: integrating some of the above-mentioned features to perform news classification [32,33,34].
Unfortunately, most studies about fake news focus on detection rather than gauging the influence of fake news (i.e., fake news popularity) on social media, which is also crucial for mitigating its impact on our society. In addition, no comprehensive framework captures the dynamics of multi-modal attributes and preserves the model explainability. To achieve our goal, we have to overcome the following challenges: (1) Data collection and fusion: The features used for prediction consist of various types, including social relationships, fake news content, news metadata, and user characteristics, etc. These types of information are stored in different sources and require a distinct retrieving process. Additionally, most of the data is user-generated and irregular, so it takes a lot of effort to link data from various domains together to rebuild the whole picture. (2) Imbalanced distribution: Due to the power-law distribution in the data of social media platforms, only a few posts have massive shares, and most posts have little to no shares. The same phenomenon exists on other social-related data, such as the users’ followers, historical posts, etc. The characteristics make it difficult for the prediction model to capture the traits and perform an accurate prediction.
To achieve our goal and overcome the challenges mentioned above, in this study, we propose a comprehensive framework MUFFLE to model the dynamics from various domains: social network, user timeline, user profile, and textual content. In MUFFLE, we construct a combination of a Graph Convolution Network (GCN) and Recurrent Neural Network (RNN) to encode the propagation of fake news in social media. As for textual data such as fake news, tweets, and user self-descriptions, we use DistilBERT [35] to encode the representation of text. Additionally, temporal and graph features that proved to be effective in related problems [33,36,37,38] are also used in MUFFLE. To further increase the explainability of our framework and raise the performance, we develop an attention mechanism that learns the importance of each aspect of feature representation.
To evaluate the proposed framework, we compare MUFFLE with other popularity prediction approaches, and the result shows that our model outperforms state-of-art models. Another experiment also indicates that the features fed into MUFFLE are effective and correlate to the propagation of fake news on social media. Finally, the feature importance recorded during the experiment shows that our proposed model has explainability in predicting the impact of fake news.
To summarize, our main contributions are:
- We study a novel problem of predicting the influence of fake news on social media in an early stage, which is also crucial for mitigating the impact of false information on our society. Most studies on fake news focus on ascertaining the veracity of news only.
- A comprehensive framework MUFFLE is proposed, which jointly models the multi-modal features including news content, social network, and user characteristics. By leveraging the strength of state-of-the-art deep learning models, MUFFLE is able to capture textual, temporal, and structural dynamics along the propagation of fake news.
- Our proposed framework provides explainability by constructing an attention mechanism. Through analyzing learned attention weights, we further investigate the importance of features in our research problem.
- We conduct experiments on real-world datasets to demonstrate the effectiveness of the proposed framework for predicting and explaining the influence of fake news on social media.
2. Related Work
Because our research focuses on the influence of fake news on social media platforms, i.e., fake news popularity prediction, we will introduce information cascade prediction and fake news detection in the following two sub-sections, respectively, and discuss them in detail.
2.1. Information Cascade Prediction
Studies on information cascades modeling mainly focus on cascade growth prediction [1,16,17,18,39] and outbreak prediction [10,16,40,41]. Nowadays, methods on information cascades prediction fall into the following three categories:
- Generative process approaches: These approaches model the intensity function for each message arrival independently. They observe every event and learn the parameters by maximizing the probability during the observation time window. There are mainly two typical generative processes. The first is Poisson process [5,8], which models the stochastic popularity by employing the reinforced Poisson process and incorporating it into the Bayesian framework for external factor inference and parameter estimation. The second is the Hawkes process [1,6,7], which constructs predictors that combine Hawkes self-exciting point process for modeling each cascade and uses feature-driven methods to estimate the properties of an information cascade, such as content virality, memory decay, and user influence [7]. These methods demonstrate enhanced comprehensibility. However, these methods cannot fully leverage the implicit information in the cascade dynamics for a satisfactory prediction.
- Feature-based approaches: These approaches rely on extracting various features from raw data, typically containing information content features [39,42,43,44], user characteristics [9,10,11], cascade’s structural attributes [14,15,16], and temporal features [12,13]. These features are fed into discriminative machine learning models to perform predictions. Combining content information with other types of features, such as temporal and structural features, can significantly reduce errors in prediction [39]. Incorporating features related to early adopters [9] demonstrated that user features are informative predictors. In addition, by comparing the prediction power of models using different sets of features, a recent study [45] found that temporal features have the largest impact on prediction.
- Deep learning-based approaches: These approaches are inspired by the recent success of deep learning in many fields and have made significant performance improvement [1,17,18,19] on cascade prediction. The first deep learning-based predictor of information cascades (DeepCas) [17] transforms the cascade graph as node sequences through a random walk and automatically learns the representation of individual graphs. Ref. [1] proposed a deep learning-based process with high predictive power that inherits the high interpretability of Hawkes process. Ref. [19] introduced to use coverage and attention mechanisms for capturing the cross-dependencies in cascades and alignments to better reflect the structural information, whereas [18] employed topological RNNs to explore the dynamic directed acyclic graph diffusion structure and tailor it for the task of node activation prediction. Refs. [46,47] used a Graph Neural Network (GNN) to effectively capture structural information and dynamics in cascade. Overall, these approaches treat the cascade modeling as a sequence modeling problem using RNN—avoiding strong prior knowledge imposed by the diffusion models and feature design while flexibly capturing sequential dependence in cascades.
2.2. Fake News Detection
Fake news detection methods generally fall into the following four categories:
- Content-based approaches: These approaches rely on text to check the veracity of news articles, which usually contain long text. A variety of text characteristics are investigated for supervised learning such as TF-IDF, document topic [20], language styles [22], writing styles and consistency [48], and social emotions [49]. In addition, Ref. [23] found that the inquiry phrases from user responses are useful, and [21] used recurrent neural networks to learn superior representations of user responses.
- User-based approaches: These approaches model the traits and credibility of users who retweet the source tweet. The authors of [27] extracted account-based features, such as the account’s verification state, gender, location, and the number of followers. Ref. [26] showed that user profiles between fake and real news are significantly different. The CRNN proposed in [25] devised a joint recurrent and convolutional network model to better represent the retweeter’s profile. Session-based heterogeneous graph embedding [24] was proposed to learn the traits of users so that they can be identified in shared accounts.
- Network-based approaches: These approaches leverage the propagation structure in social networks or cascade networks to detect fake news. Ref. [30] leveraged the implicit information, i.e., hashtags and URLs, to connect conversations in which users do not have social links. In addition, finding such implicit information can improve the performance of rumor classification. The authors of [50] created a kernel-based method that captures high-order patterns that differentiate various types of rumors. Ref. [29] developed tree-structured recursive neural networks to learn the embedding of rumor propagation structure. Multi-relational graph embedding methods [28,31] can effectively learn how different types of entities (related to source news articles) interact with each other in a heterogeneous information network for classification tasks.
- Hybrid-based approaches: These approaches consider and integrate multi-modal context information regarding the source tweets. CSI [32] learned the sequential retweet features by incorporating response text and user profiles, and generated suspicious scores of users based on their social interactions. Ref. [34] developed an event adversarial neural network to learn transferable features by removing the event-specific features, along with convolutional neural networks to extract textual and visual features. dEFEND proposed in [33] jointly learned the sequential effect of responding comments and the correlation between news content and comments and uses an attention mechanism to provide explainability. GCAN proposed in [36] further enhanced the model explainability and models short text user comments of fake news articles on social media platforms.
3. Preliminaries
3.1. Defining Fake News
There are two key factors that define fake news: authenticity and intent [2,51]. First, fake news contains claims which can be verified as false information. Second, fake news is created with malicious intent to mislead newsreaders.
Based on these two key features, there are two definitions of fake news, narrow and broad definitions. For the narrow definition, a news article is required to fulfill both key features. For the broad definition, a news article focuses on either authenticity or intent of the news content. In this study, we adopt the broad definition so we can take more data examples into account, such as false news content that was created unintentionally or biased news articles which serve the purpose of political propaganda.
3.2. Fake News on Social Media
Social media provides a new paradigm of information creation and consumption for users. The low cost of creating digital content and user accounts makes it easy for malicious users (including social bots) to spread fake news for propaganda. Studies [52] showed approximately 19 million bot accounts distorted the online discussion of the 2016 U.S presidential election by tweeting support of either Trump or Clinton in the week leading up to election day.
Another phenomenon of information diffusion on social media platforms is the echo chamber effect: Users on social media tend to form groups containing people who are like-minded [53]. This effect is caused by the fact that information consumers are selectively exposed to specific kinds of news due to the way news feed shows on their social media’s homepage. News information is usually one-sided, which makes it difficult for us to defend against the threat of fake news on a psychological level. Moreover, the echo chamber effect accelerates the process due to the following psychological factors [54]: (1) social credibility, which means people are more likely to perceive a source as credible if others perceive the source is credible, especially when there is not enough information available to verify the source. (2) frequency heuristic, which means that consumers may naturally favor information they frequently hear, even if it is fake news. These factors provide us insights to extract useful features from the user profiles and social network data and improve the accuracy of predicting the influence of fake news on social media.
3.3. Information Cascade in Social Media
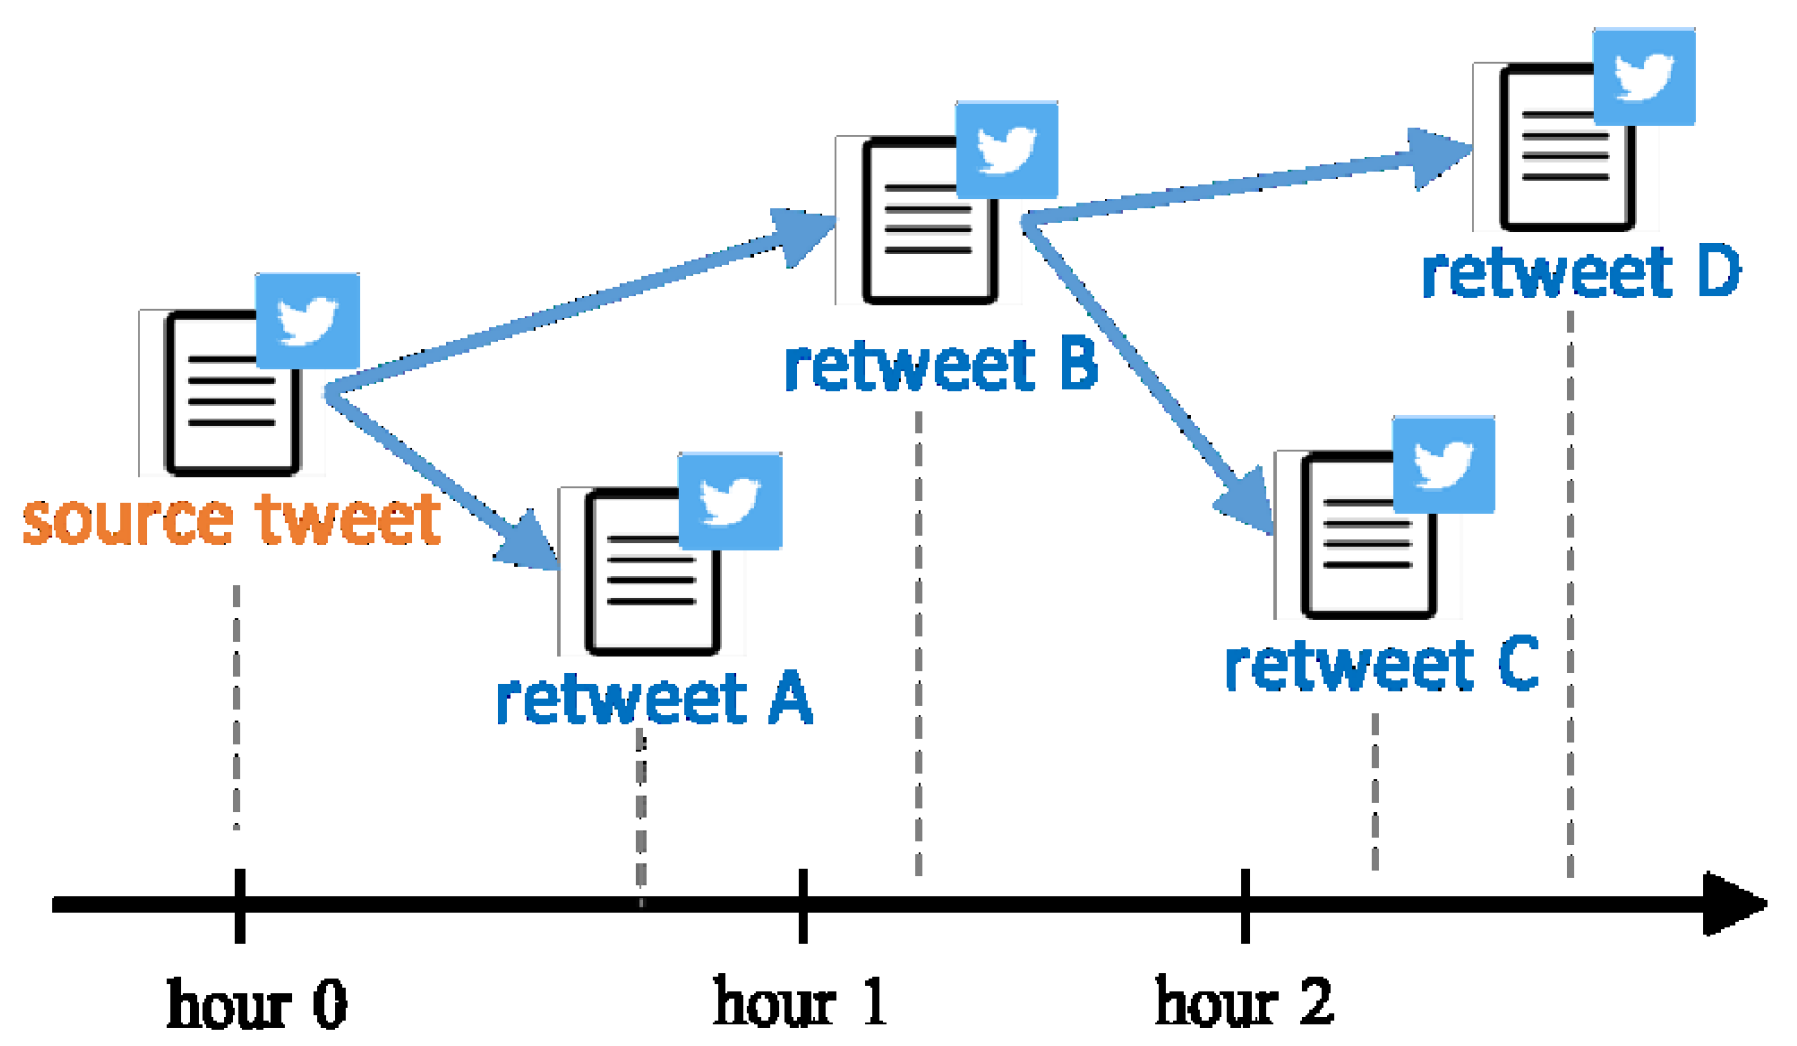
An information cascade can be viewed as a diffusion topology, which is depicted in the tree data structure. Each node in the tree represents one step of information propagation. On social media platforms, we can define the size of a post cascade as the number of users involved in the sharing process, which is also the post’s number in total. Take Twitter as an example, the root of the tree is the source tweet. If the tweet is retweeted, the retweet becomes a child node of the source tweet. The size of a post cascade on Twitter includes the source tweet and retweets. Figure 1 illustrates an example of information cascade on Twitter.
3.4. Data Structure on Twitter
The micro-blogging service Twitter is like a natural laboratory. Most of its data can be used to analyze the process of information dissemination. Unlike other user-declared networks (e.g., Facebook), Twitter is immensely useful for disseminating information, in that users subscribe to broadcasts of other users; thus, the network of “who listens to whom” can be reconstructed by crawling the corresponding “follower graph.”
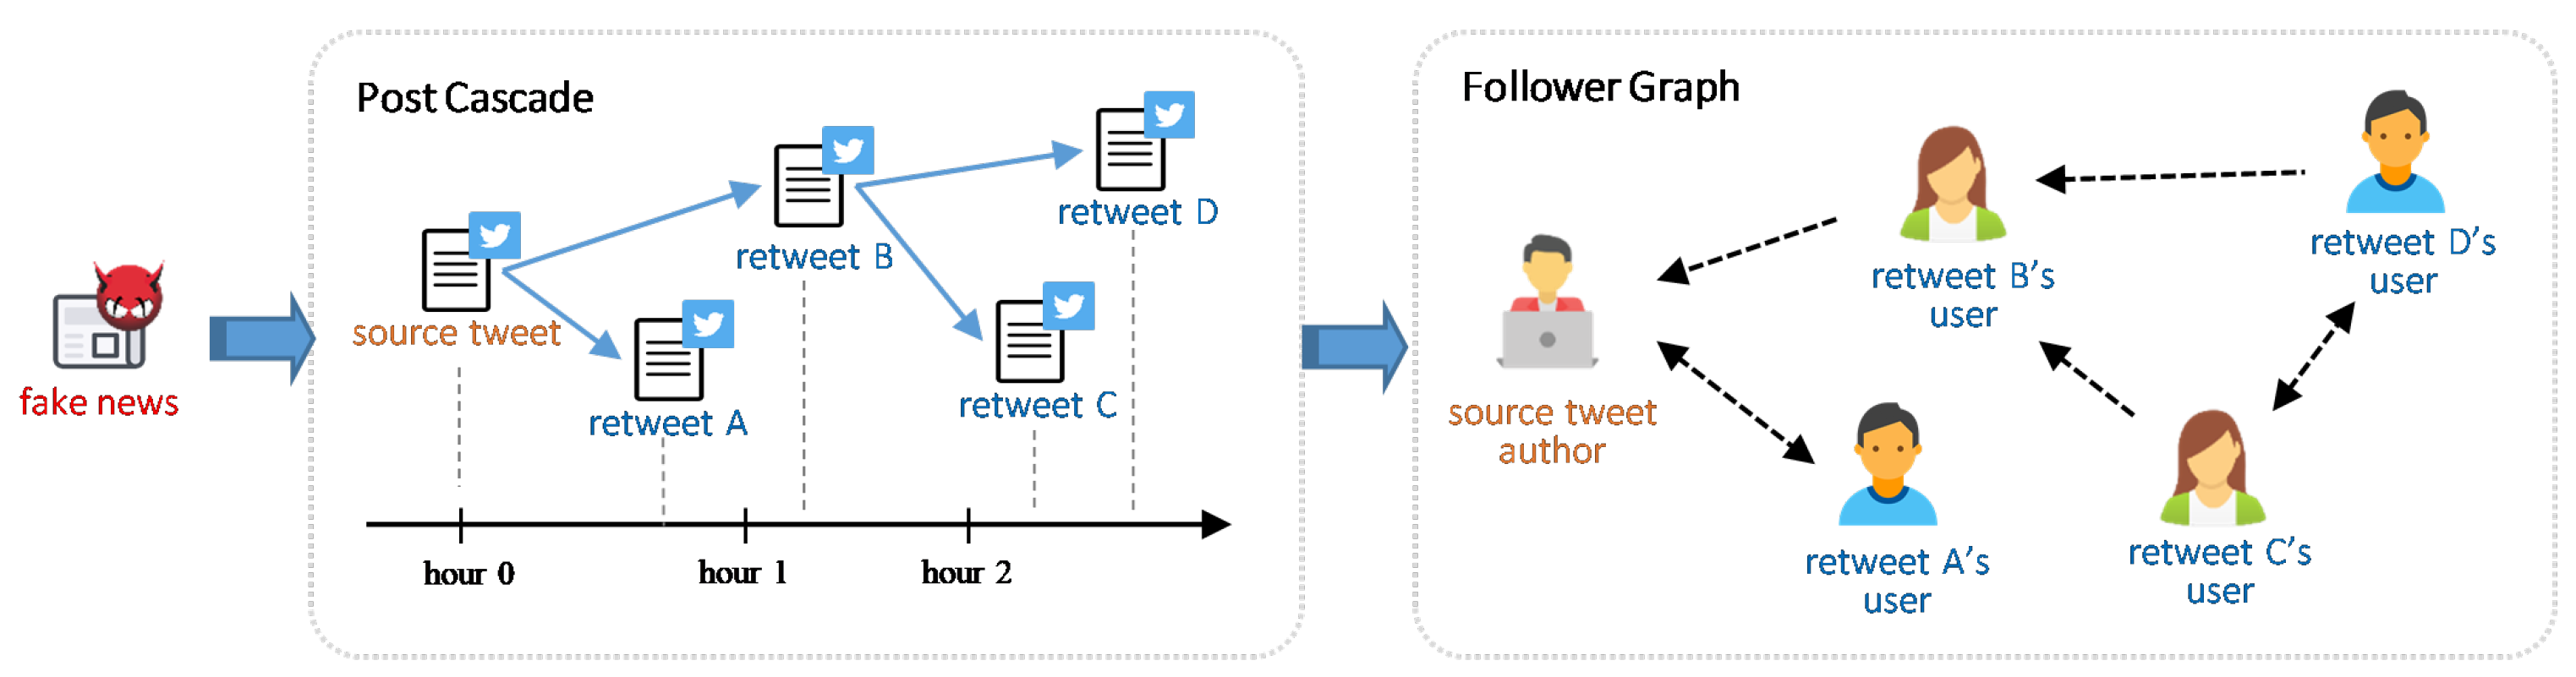
Figure 2 illustrates the process of a fake news article spreading on Twitter by retweeting the source tweet, which includes the news link. The news cascade can be further converted into a social network via each spreader’s followers. If user A follows user B in Twitter, then there is a directed edge pointing from user A to user B; if user C and user D mutually follow each other, a bi-directional edge is created between user C and D. One difference worth mentioning is that post cascade is a tree data structure which has a single root node (i.e., source tweet). However, the follower graph constructed from post cascade is not necessarily a tree structure, and directed edges can be formed between each pair of nodes in the graph depending on users’ following relationship.
3.5. Problem Statements
If M source tweets fake news, the observed cascade of source tweet m is recorded as the set of early adopters within the observation time window T, i.e., , in which is the total number of spreaders of source tweet m within the observation time window T. For the scenario shown in Figure 2 as an example, if we set the observation time window to two hours, the observed cascade is recorded as . In addition to the observed cascade, given the following relationships, profiles and historical timelines of users involved in post cascades as well as the text content of news articles and source tweets, we can formalize the fake news influence prediction problem as:
Multi-Modal Fake News Influence Prediction. Given a fake news article and a source tweet m containing the news link, we have observed cascade of source tweet m and underlying network , where V is the set of all users, and is the set of relationships between all users. For each user in the cascade, a set of historical tweets, as well as a personal profile recording statistical information, are retrieved. This study aims to predict the final popularity of source tweet m, i.e., .
4. The Proposed MUFFLE Framework
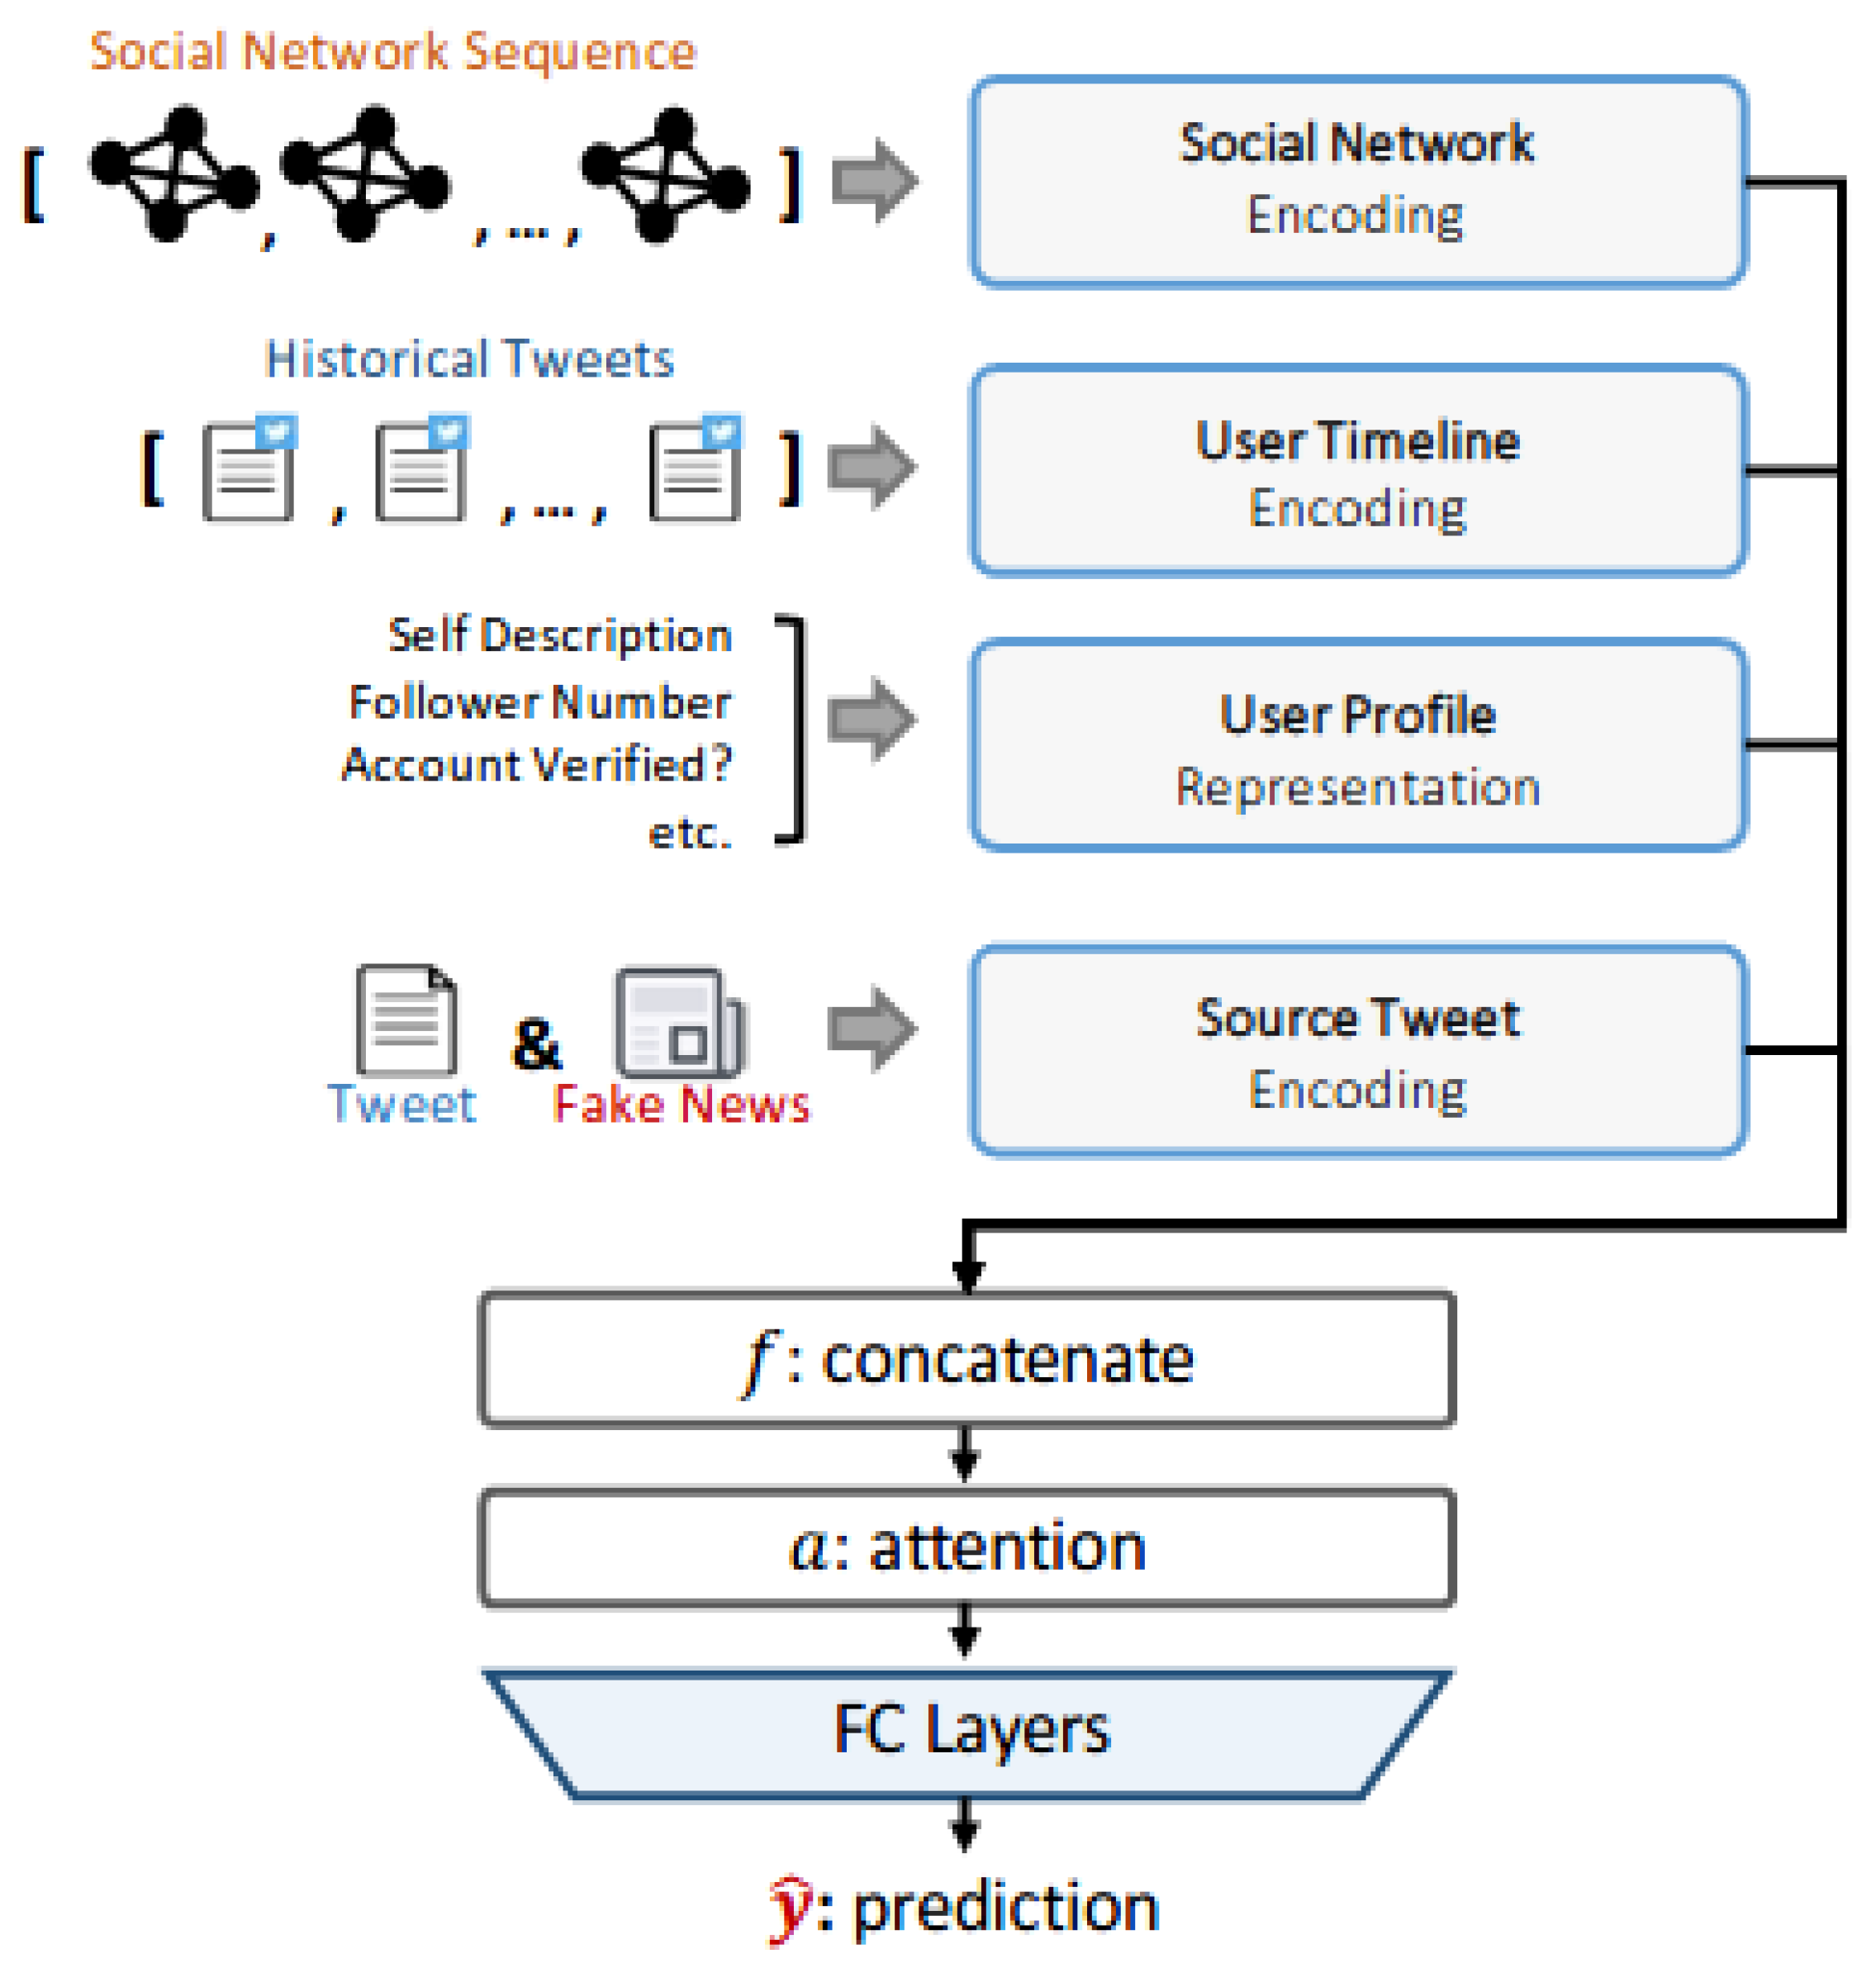
We develop a multi-modal framework, MUlti-modal Fake News in FLuence Estimator (MUFFLE), to estimate the influence of fake news on social media platforms via data various categories including source tweets, news content, social network graph sequences, and user characteristics. The architecture of the framework is depicted in Figure 3. MUFFLE consists of four components. The first component is social network encoding: modeling and representing how the follower network evolves along with the change of post cascade. The second component is user timeline encoding: generating a representation of historical tweets for the author of the source tweet. The third component is user profile representation: extracting and encoding user characteristics for the source tweet’s author. The last component is source tweet encoding, which focuses on encoding text data from source tweets, including tweet content, shared news titles, and content. To integrate multiple types of encoded features, we concatenate feature representation from the four components and utilize an attention mechanism to further direct the focus on certain factors that are able to make more effort to predict performance. Finally, several fully-connected neural network layers perform regression tasks and generate prediction output, i.e., the cascade size of the source tweet.
In the following sub-sections, we will explain data preprocessing and model architecture for each sub-component in detail.
4.1. Social Network Encoding
4.1.1. Data Extraction
When an information cascade grows over time, the underlying social network constructed from users in cascade expands as well. To predict the final size of a tweet cascade, an intuitive approach is capturing multiple ‘snapshots’ of a cascade network within the observation time window. The time intervals between each pair of neighboring cascade snapshots are all fixed (e.g., 1 h). Here we divide the observation time window into three time intervals (i.e., hour 0, hour 1, and hour 2) with the same length and get three corresponding post cascades. This way, we have a post cascade time series that provides rich clues to model the growing speed and scale of a cascade.
4.1.2. Data Pre-Processing
With users’ following relationship data collected via Twitter APIs, we can convert every cascade snapshot in time series into social networks. These social networks are in a directed graph structure in which each node represents a user in the cascade. In this work, the pointing direction of edges is from the followed to the followers, which is contrary to the direction of following relationships in existing studies. The reason behind the setting is due to the fact that information propagates from the followed to follower so that we can perform message passing in graph convolution properly. In addition to the following relationship among users, we attach several attributes to every node in a social graph: (a) number of followers, (b) listed count, (c) favorite count, (d) number of tweets, (e) geographic data is enabled or not, (f) account protected or not, (g) account verified or not, and (h) time difference b/t retweet and source tweet, in minutes.
Besides the dynamic features in the social graph series, we also extract properties from the social network at the end of the observation time window to serve as static features. Specifically, we set the window to the first three hours since the source tweet is issued and set the fixed observation interval to one hour. Then, we extract descriptive features from the social network converted from the cascade graph at hour 3. These properties are fetched in structural and temporal aspects, which are: (a) maximum/minimum/average out-degree, (b) maximum/minimum/average retweet time difference, in minutes, (c) number of nodes, and (d) number of edges.
4.1.3. Encoding
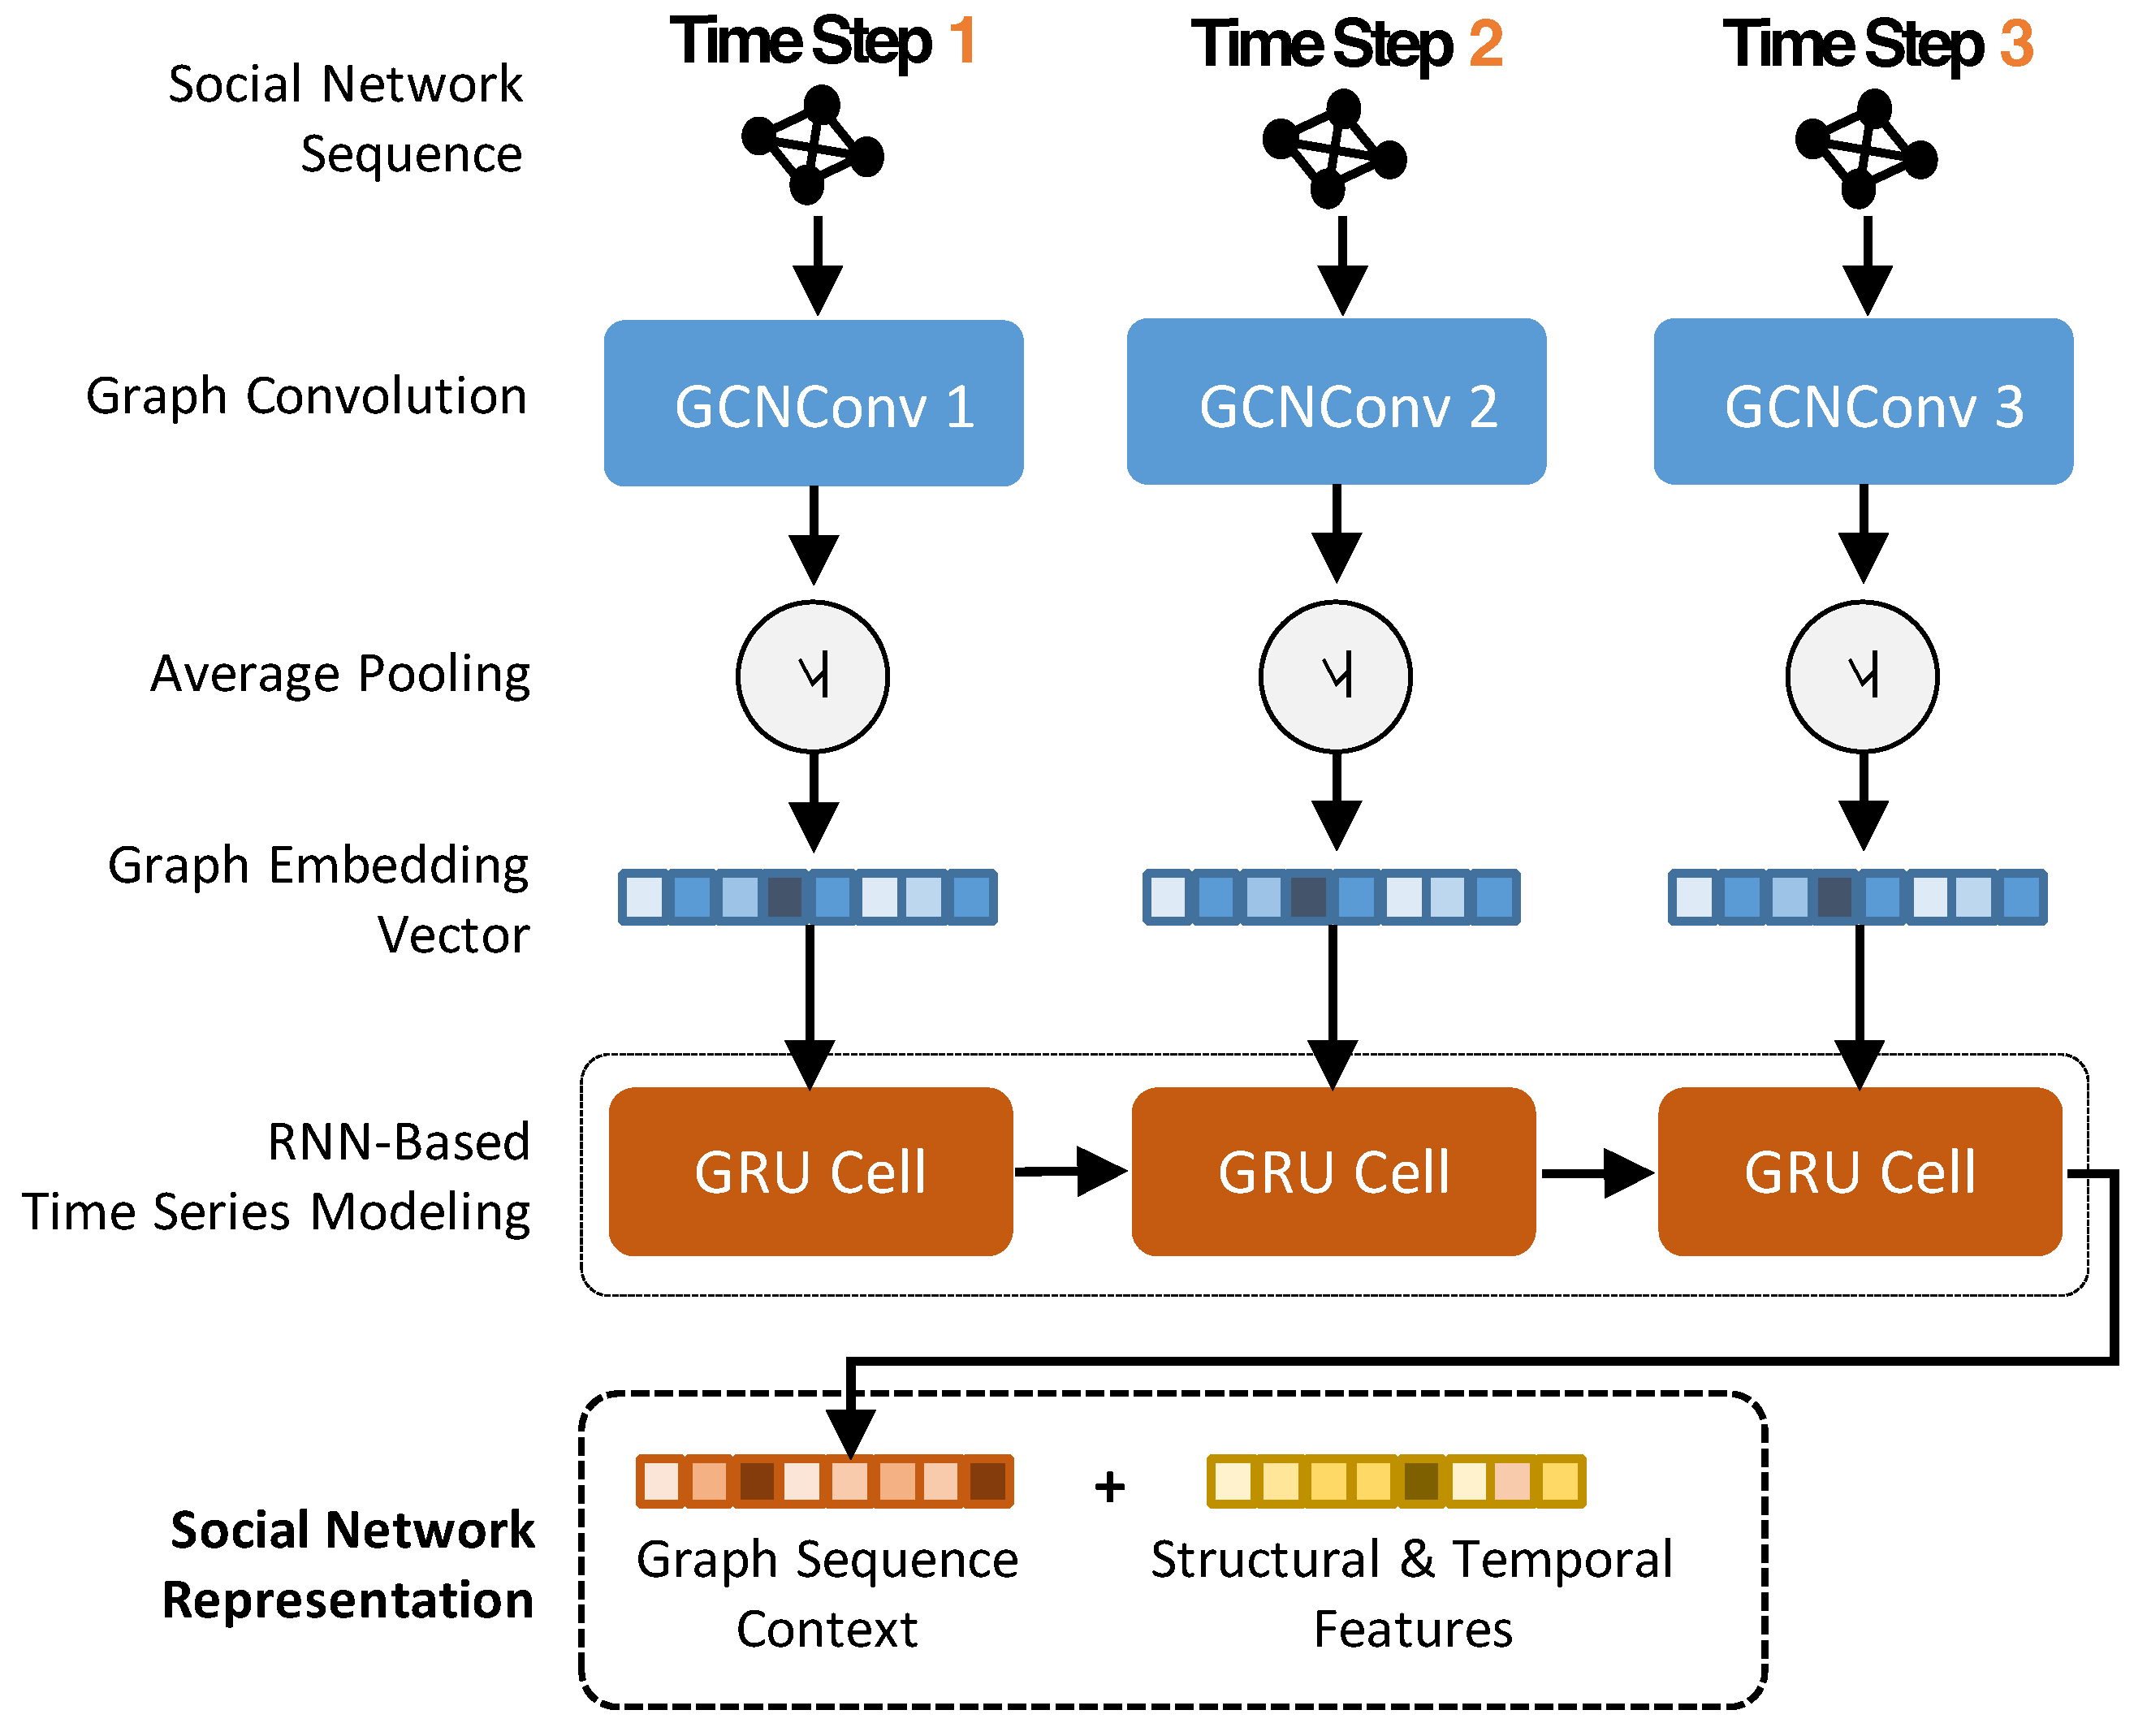
The given time series of social graphs depict how the information cascade of a source tweet gets scaled up. Recently, many studies such as [47] proved that GCN performs better than traditional graph sampling technologies. To capture the trend of the diffusion and encode it into meaningful latent vectors, we leverage both graph convolutional network and gated recurrent units and integrate them to construct the model of a social network component.
Figure 4 shows the architecture of the component; for a given source tweet m, each item in the corresponding social graph series consists of two elements: A and X, which are adjacency matrix and node attribute matrix respectively. At the beginning of this model, a Graph Convolution Network (GCN) layer [55] is created based on the given social graphs. A GCN is a multi-layer neural network that performs on graph data and generates embedding vectors of nodes according to their neighborhoods. The graph convolution network can capture information from a node’s direct and indirect neighbors through stacking layer-wise convolution. Given adjacency matrix A and node weights matrix X for a graph G, the new g-dimensional node feature matrix can be derived by
in which is the node number of a graph, l is the layer number, is the normalized symmetric adjacency matrix, and is the matrix of learnable weights at the l-th GCN layer. denotes the ReLU activation function of graph convolution. Here is set as node attribute matrix X. We choose to stack only one GCN layer for each social graph in the input series. Stacking too many layers of GCN will cause the information to interfere with each other in the propagation process and form noise. Therefore, in the attempt of stacking one layer, two layers, and three layers, we found that the effectiveness of one layer is the best.
After performing graph convolution, in order to obtain latent vectors representing convolved social graphs, we adopt an average pooling mechanism to aggregate all node vectors within each graph. So far, the structure of social networks has been properly encoded. Next, we construct Gate Recurrent Units (GRU) to model the evolution of graph structure in time. A Gated Recurrent Unit (GRU) was proposed by Cho et al. [56] to make each recurrent unit adaptively capture dependencies of different time scales. What GRU observes is a graph embedding of a network, which can represent the degree of community activity, the degree of continuous change, the number of involved people, etc. These kinds of information will vary or grow with time, so modeling using GRU is an intuitive choice. Formally, the GRU is formulated as in [57]:
in which h is the hidden state from previous GRU cell, x is the input for current GRU cell, is the sigmoid function, and ∗ denotes element-wise product. Finally, the latent representation of social network is generated by concatenating the last hidden state of GRU cell and static graph properties which include structural and temporal features.
4.2. User Timeline Representation
4.2.1. Data Extraction
For the purpose of knowing how a user’s followers react when he posts on social media, a straightforward approach would be to analyze his previous records. Therefore, we collect historical tweets on users’ timelines through Twitter’s APIs. Due to the size limitation set by Twitter, we can retrieve up to 900 tweets from a user’s timeline. For each source tweet m, we select ten most recent tweets by the same author and were posted before the source tweet m.
4.2.2. Data Preprocessing
The features fed into the user’s timeline component are extracted from the source tweet author’s ten timeline tweets introduced in the last sub-section. Among these tweets, we gather features from three distinct aspects, which are sentiment, statistics, and text, respectively.
For sentiment features, we employ a pre-trained sentiment model VADER [58] to analyze the sentiment scores of each sentence. VADER is a lightweight model which provides robust accuracy performance compared to other typical state-of-practice benchmarks. In addition to its performance and efficiency, VADER is specifically attuned to sentiment in microblog-like contexts, including posts on Twitter and Facebook. As these characteristics fit our needs, we calculate every sentence’s compound sentiment score using VADER and generate the following features which indicate both polarity and valence of sentiment: (a) positive–negative ratio, (b) number of positive sentences, (c) number of negative sentences, (d) average sentiment score, and (d) number of sentences.
For statistic features, we fetch the variables—favorite count, retweet count, and is-sensitive—which represent the number of favorites and retweets, and the indicator of a post’s sensitivity from each timeline post and calculate the average to get the statistical features: (a) average favorite count, (b) average retweet count, and (c) sensitive tweet ratio.
The last category of feature is text. We aggregate the text of all ten tweets, and perform text cleaning such as replacing the string “@username” into “account” and replacing URLs into “link.” Finally, we filter stopwords from the text in order to decrease the length of text fed into the text encoding model yet retain key information.
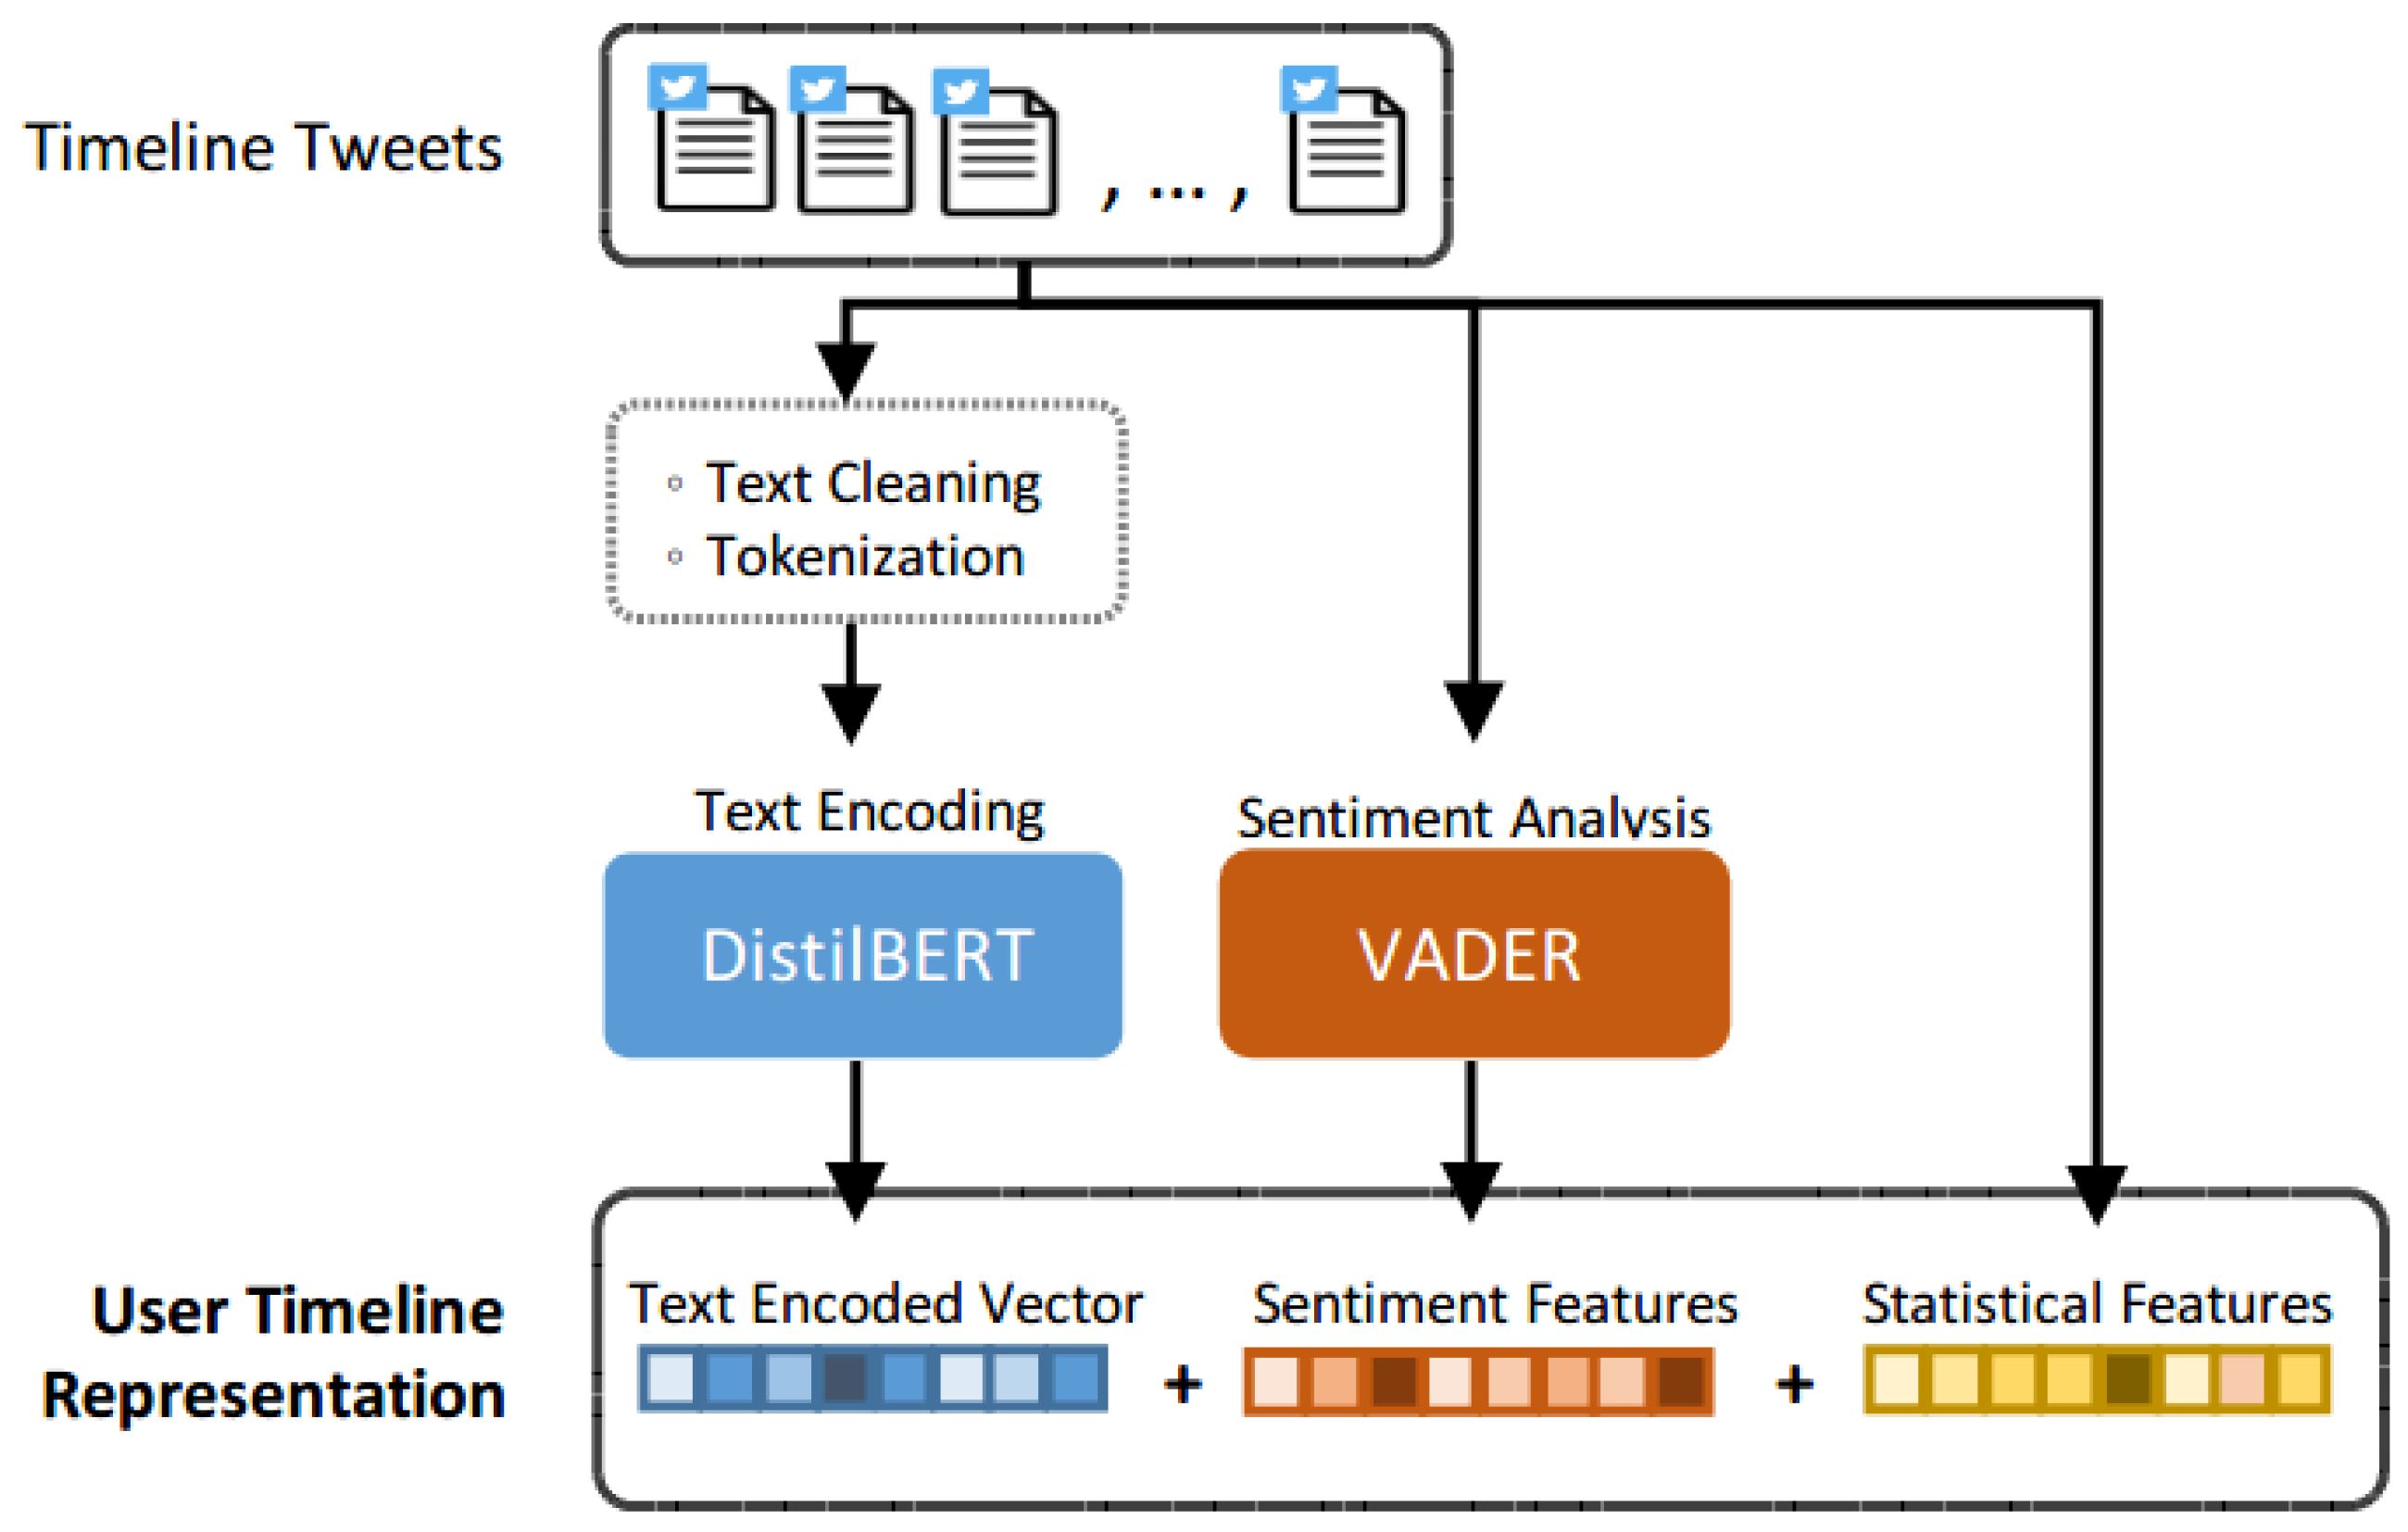
4.2.3. Representation
We believe that text content from historical timeline tweets shows the source tweet author’s characteristics, which can be the cue of estimating the cascade size of the source tweet. Figure 5 shows the architecture of the user’s timeline component. In order to encode the semantic information contained in the tweet, we adopt the DistilBERT [35] model for text encoding. DistilBERT is a pre-trained NLP model which leverages knowledge distillation during the pre-training phase and shows that it is possible to reduce the size of a BERT model by 40%, while retaining 97% of its language understanding capabilities and being 60% faster. The DistilBERT model is used to generate the representation of the semantics in the content. After encoding the text of historical tweets, we aggregate three aspects of features by concatenating the representation from DistilBERT, sentiment features from VADER and other statistical features to construct the user’s timeline representation.
4.3. User Profile Representation
4.3.1. Data Preprocessing
In this component, we aim to take advantage of the user’s profile to help predict the cascade size of source tweets. For each source tweet, we collect the user profile of its author via Twitter APIs. Studies showed that some attributes in Twitter’s user profiles are effective for issues such as popularity prediction and fake news detection [36,38]. Thus, we extract several user attributes for building user profile representation. Some of them are in numeric form: number of friends, number of followers, number of listed, number of favorites, number of tweets, and some are Boolean values: account protected, geographic data enabled, account verified, and the last attributes is a textual field: user’s self-description. For text data, we reduce the irrelevant information by simplifying URLs, usernames, hashtags, etc., which is the same process as the one we perform on tweets in the user’s timeline component.
4.3.2. Representation
Similarly, we use DistilBERT [35] as an encoder to obtain semantic representation from users’ self-description text data. Then we concatenate the encoded description, numeric statistical features, and Boolean attributes to create user profile representation.
4.4. Source Tweet Encoding
4.4.1. Data Preprocessing
For the purpose of predicting the size of post cascade, leveraging the content of source tweets as features is an intuitive way. A source tweet object contains text content which includes the URL of fake news, and the fake news article directed by the URL has both title and content as another two text fields. Besides these text attributes, we extract statistical records in source tweet data objects retrieved from Twitter APIs, such as the number of hashtags, number of mentioned users, etc. Additionally, we further create temporal features based on the column “created_at” of source tweet. We fetch the specific time and date of the posts and convert them from the numeric form into one-hot encoding. Finally, we use VADER [58] in the user’s timeline component to calculate the score of the sentiment of sentences in the source tweet content.
4.4.2. Source Tweet Encoding
The way we obtain encoding of the source tweet is similar to the approach used in user profile component. Here we construct three DistilBERT models for encoding tweet content, fake news title and fake news content respectively. Then we combine these encoded vectors with statistical, temporal and sentiment-related features via concatenation to create a representation of the source tweet.
4.5. Overall Prediction
The last part of our proposed framework MUFFLE is prediction layers. In the beginning, concatenation is taken to combine the representation vectors encoded by components of the social network, user timeline, user profile, and source tweet. Since all features do not contribute equally to the regression task, we introduce an attention mechanism to learn the weights measuring feature importance dynamically, and the learned attention weights are applied to concatenated vectors using the weighted sum, given by:
in which is the concatenated representation from all components and measures the importance of . The attention weight a is calculated as follows:
in which are the vectors of attention probabilities of multi-modal features. are learnable weights inside the attention network. Next, due to the goal of predicting the influence of fake news shared by a social media post, we generate a prediction vector indicating the cascade size of the source tweet, where can be derived through:
in which is the matrix of learnable parameters and is the bias term. The loss function is devised to minimize the mean-squared error:
in which denotes all learnable parameters in the entire neural network. We choose Adam optimizer to learn as it can determine the learning rate dynamically during the learning process.
5. Experiments
In this section, we present the experiments that evaluate the effectiveness of the proposed framework MUFFLE. Specifically, we aim to answer the following questions:
- EQ1: Can our proposed framework MUFFLE achieve robust performance on fake news popularity prediction by modeling multi-model contents including social networks, user characteristics, fake news, and tweets?
- EQ2: How effective are the features in components of social networks, user timelines, user profiles, and source tweets in improving the prediction performance of MUFFLE?
- EQ3: Can MUFFLE capture the features extracted from social media and fake news to explain why a tweet sharing fake news causes a large information cascade?
5.1. Dataset
We use one of the most comprehensive fake news data repositories: FakeNewsNet [59]. The repository consists of news data related to various fact-checking websites and the corresponding information of news content and social context. News content includes the meta attributes of the news (e.g., body text and title), and social context includes the social engagements of news items (e.g., sharing posts on Twitter). News in FakeNewsNet data repository are collected from two reliable fact-checking websites: GossipCop (https://www.gossipcop.com/) accessed on 25 December 2021) and PolitiFact (https://www.politifact.com/) (accessed on 25 December 2021), which focus on political news and entertainment news, respectively. News pieces posted on the websites are reviewed by domain experts and professional journalists and annotated as true news or fake news. We choose news with fake labels from PolitiFact due to the goal of our study: predicting the influence of fake news in social media.
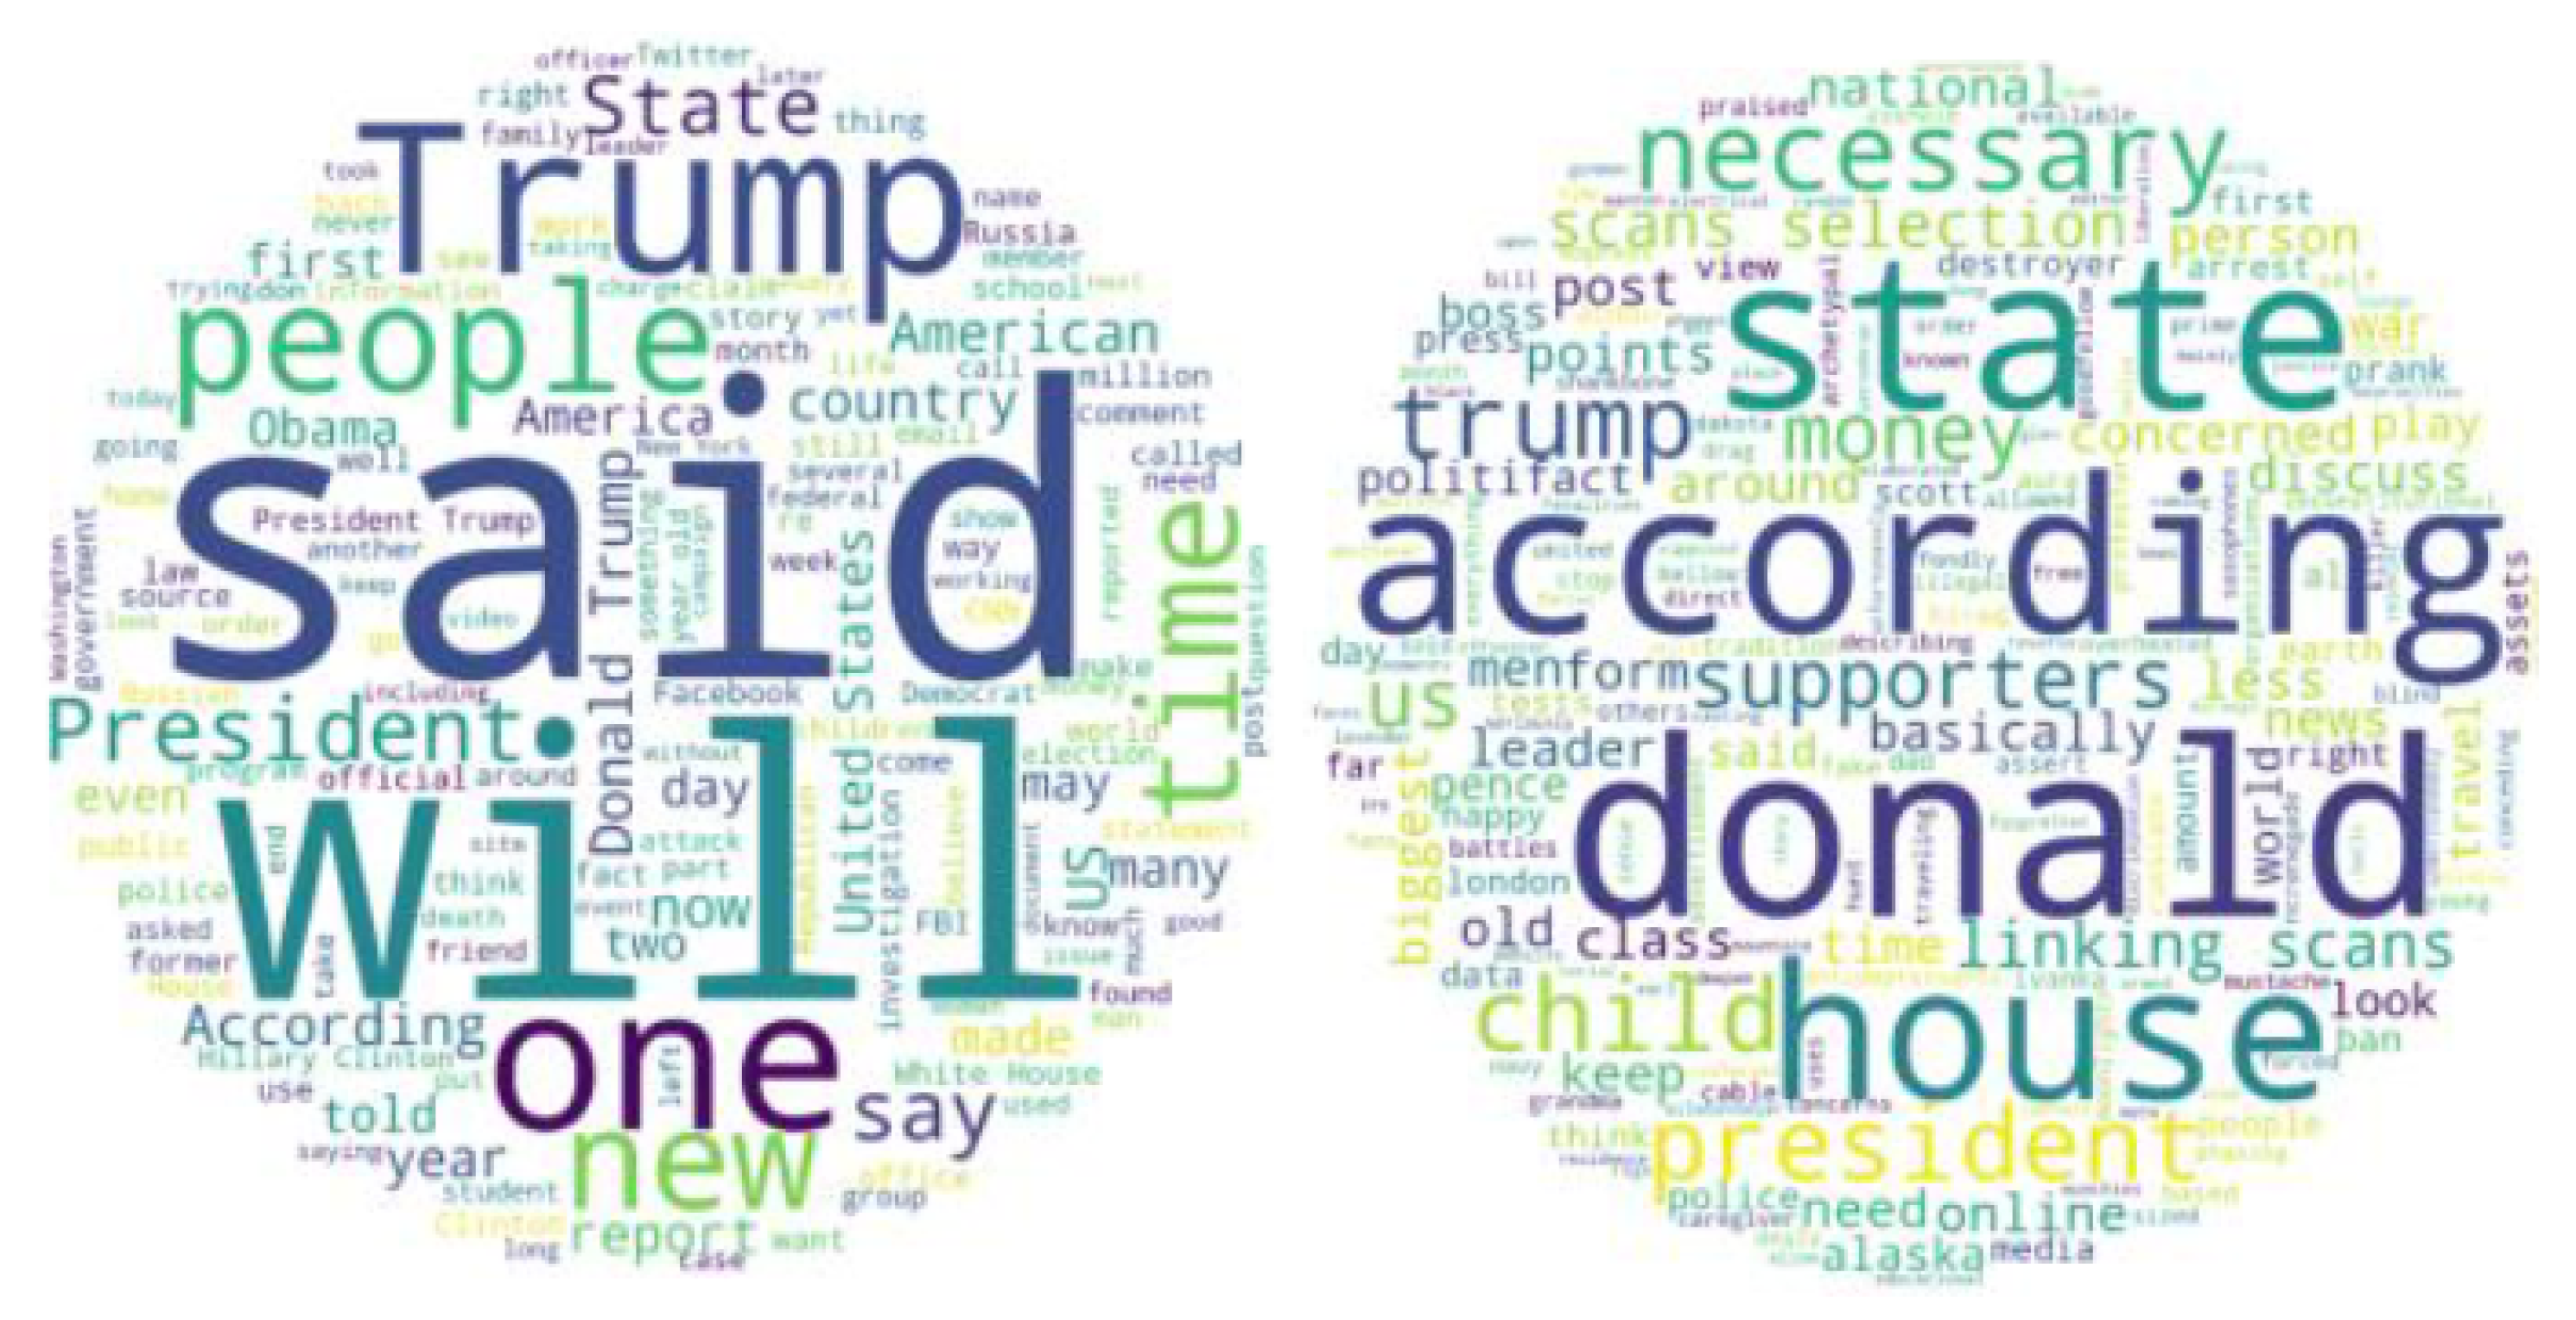
The raw dataset only contains fake news posts and tweets that share them. In order to obtain richer social context as features for prediction, such as the network formed by users retweeting the same source tweet, we have collected user profiles, user timelines, and lists of followers via Twitter APIs. The detailed statistics of the dataset are shown in Table 1. Among 376 fake news posts, we selected only 339 news articles that have been shared on Twitter. These news articles have generated up to 119,009 information cascades in total. Table 2 is the statistics for text data, and Figure 6 visualizes the word cloud of news content via term frequency and TF-IDF analysis respectively. From the figures, we can observe that many journalistic words and phrases are used, and many other terms depicted in the word cloud are related to politics.
As for social network aspect, Table 3 lists the structural properties of social networks constructed from the tweet cascade in the dataset. The minimum and median values of node number and degree centrality indicate that the following relationship among users adheres to a power law, which is a common phenomenon in social media.
In the next subsection, we will introduce the metrics to evaluate the performance of predicting cascade sizes of source tweets.
5.2. Evaluation Settings
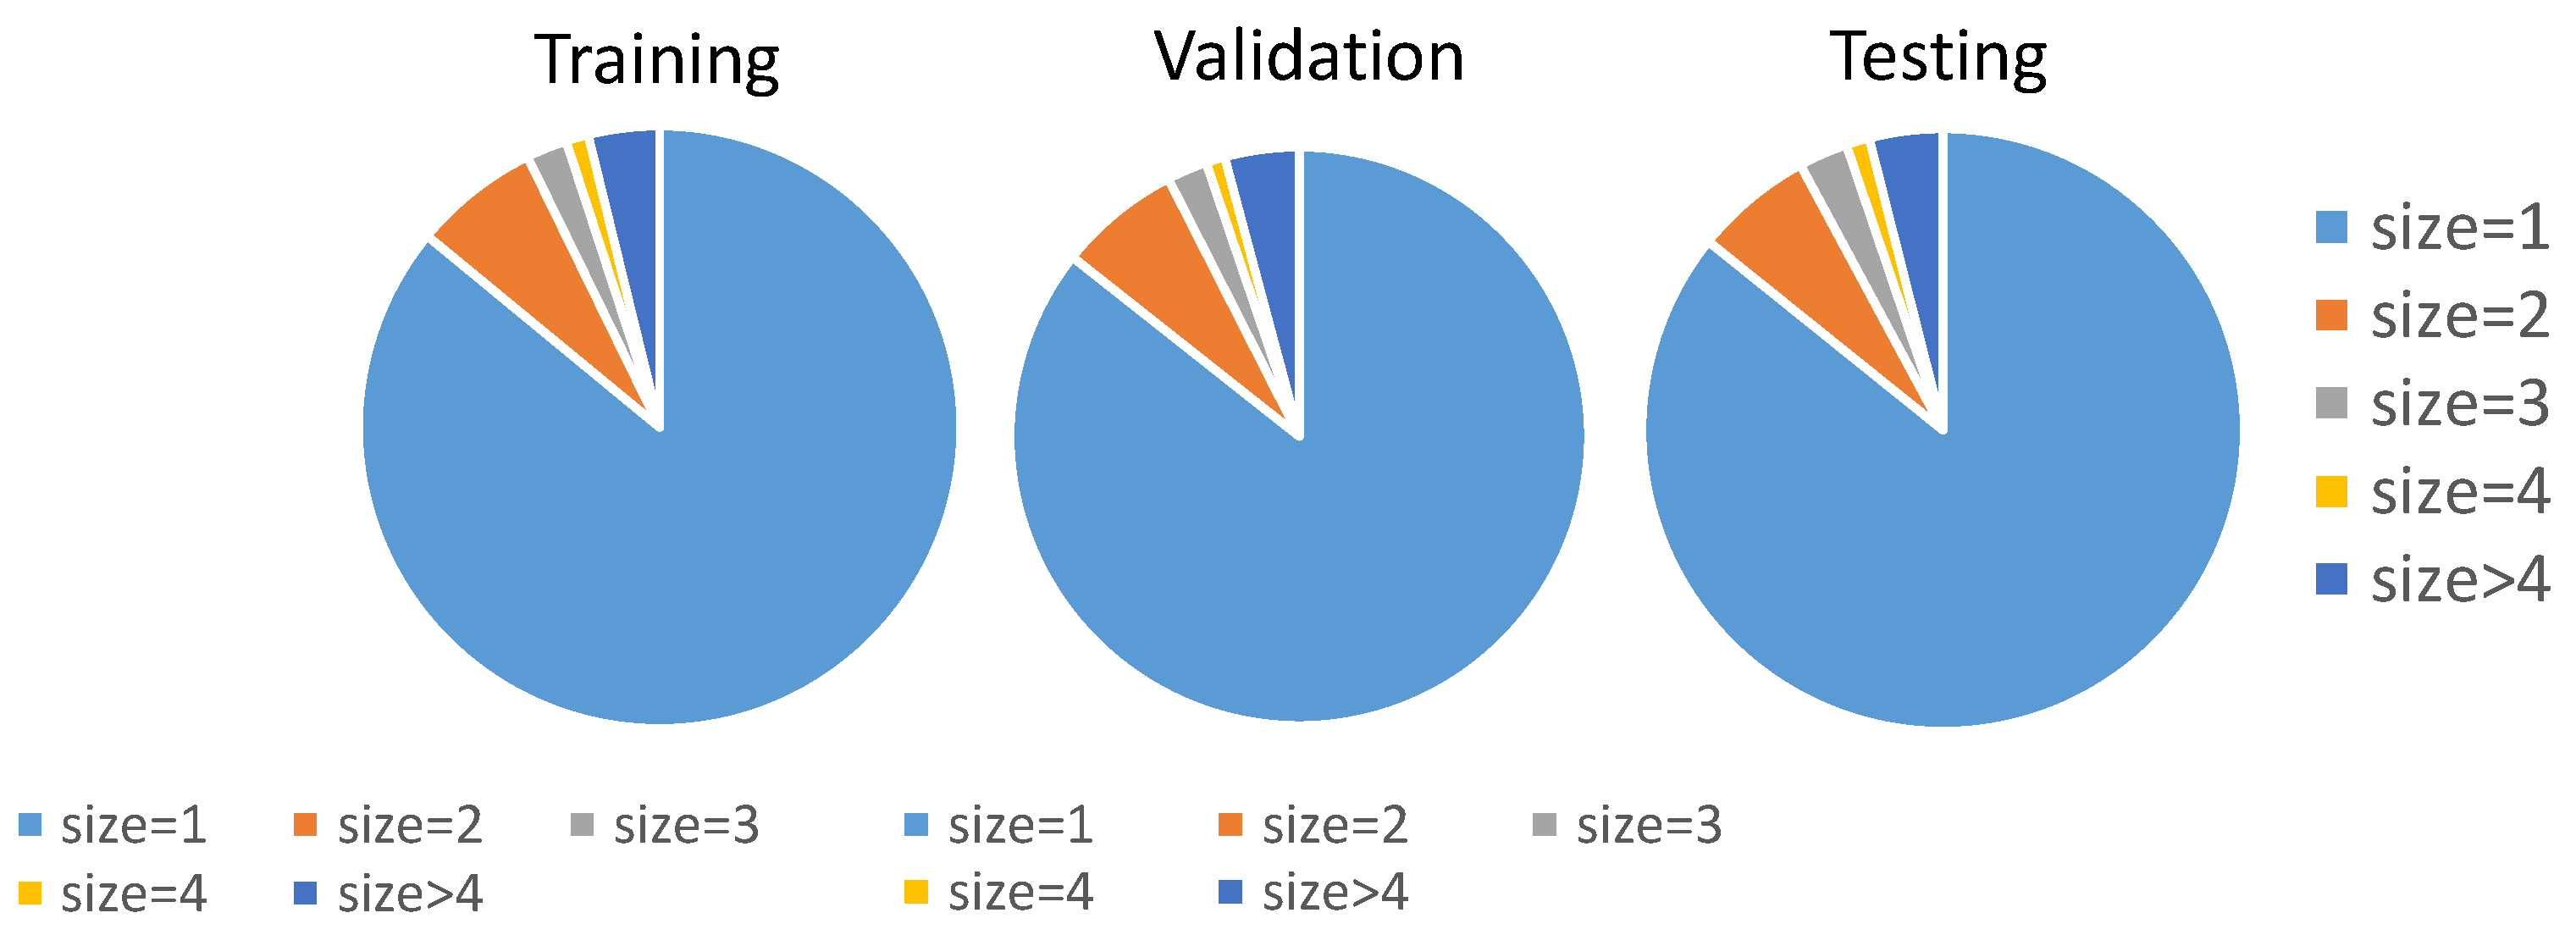
We split the whole dataset into a training set, cross-validation set, and testing set. Each example in these sets represents a cascade caused by a source tweet. Figure 7 illustrates that the distribution of labels (i.e., cascade size) of the split dataset are similar. One thing worth mentioning is that over 90 percent of cascades have a cascade size under 3. The skewed distribution of labels makes it challenging to capture the characteristics of cascades having large sizes, which are more important to our research.
Some works of information cascade prediction employ regression metrics to evaluate the performance of their proposed models [1,47]. However, in real-life situations, knowing which tweet will have a relatively larger cascade size than other tweets is more crucial than knowing every tweet’s actual cascade size, especially for the use of fake news influence prediction. Therefore, to evaluate the performance of predicting the cascade size of those popular source tweets, we adopt evaluation metrics that are commonly used for ranking problems: Normalized Discounted Cumulative Gain (NDCG) and hit rate. Both metrics are applied to top-K largest cascades since we only pay attention to those fake news tweets which are most retweeted in real-life scenarios. Here we set values of the top-K to be top-1%, top-5%, top-10% and top-15% due to the cascade size distribution shown in Figure 7.
5.3. Prediction Performance
To answer EQ1, in this section, we will compare MUFFLE with several approaches on predicting cascade sizes of source tweets sharing fake news on social media.
5.3.1. Baselines
We select methods from the following categories as competing methods: (1) statistical approaches, (2) feature-based approaches, and (3) deep learning-based approaches. For the deep learning category, we select the state-of-the-art method CasCN [47] as a strong baseline. For a feature-based model, we choose XGBoost [60] as another competing method. Furthermore, we use the historical mean and historical median as the statistical approach to be compared with our methods. The split training set, cross-validation set, and testing set are fixed for all competing methods. The above-mentioned baselines and their implementation details are as follows:
- Statistics: For the historical mean and historical median, we calculate the mean value and median value of cascade sizes of training sets, respectively, and use their values as the prediction results in testing set.
- Feature-based: We choose XGBoost as the feature-based baseline. XGBoost is an end-to-end tree boosting system that is used widely by data scientists to achieve state-of-the-art results on many machine learning challenges [60]. The features we feed into XGBoost are those statistical features that are also used in each component of our proposed framework MUFFLE. For example, we retrieve the number of followers of the source tweet user from the user profile, the average retweet numbers from user timelines, and node numbers from the social network structure. The detailed list of features can be found in the paragraphs on data preprocessing from each sub-section in Section 4. However, due to the limitation of model architecture, features not in numerical or Boolean form, such as news text or social network graph series, are not able to feed into XGBoost.
- Deep Learning-based: This type of approach is inspired by the recent successes of deep learning in many fields, and cascade prediction using deep neural networks has achieved significant improvement in performance. We choose a state-of-art method CasCN [47] to be our strong competitor. CasCN is a semi-supervised method that explicitly models and predicts cascades through learning the latent representation of both structural and temporal information, without involving any other features. Specifically, CasCN samples a cascade graph sequence from an information cascade and learns the local structures of each cascade by graph convolutional operations. The convoluted spatial structures are then fed into a recurrent neural network for training and capturing the evolving process of a cascade structure.
5.3.2. Comparison Result
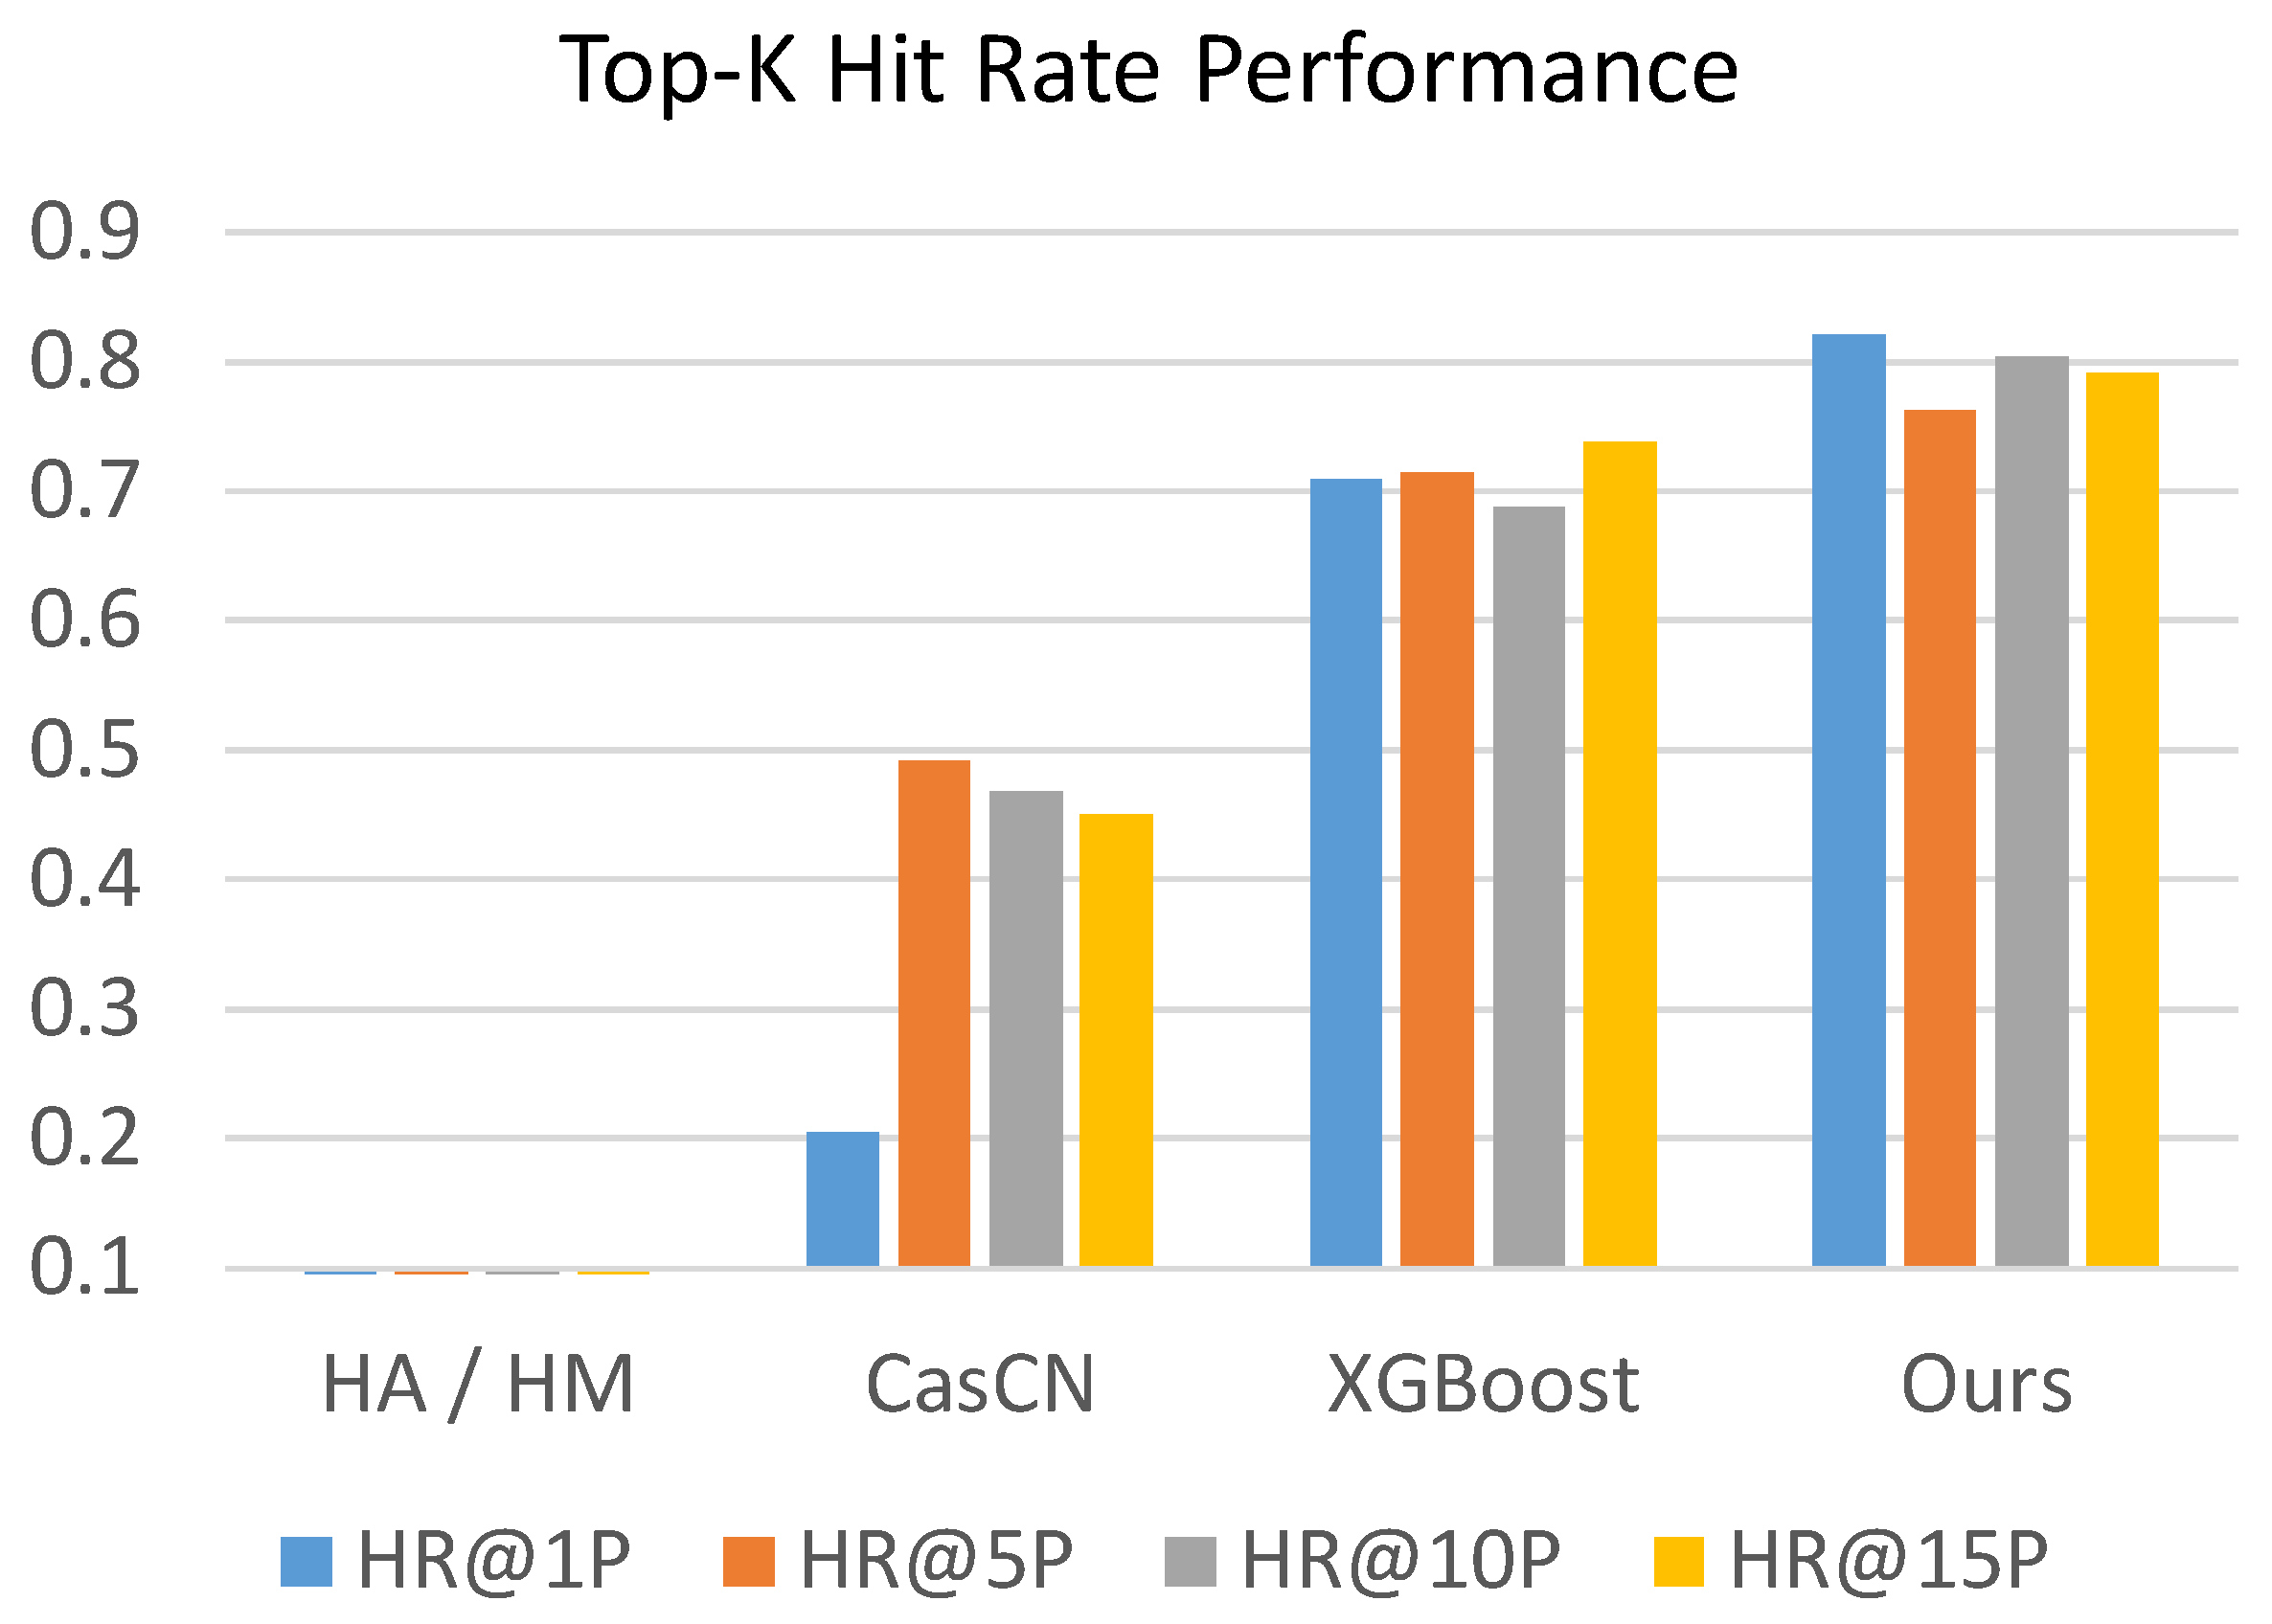
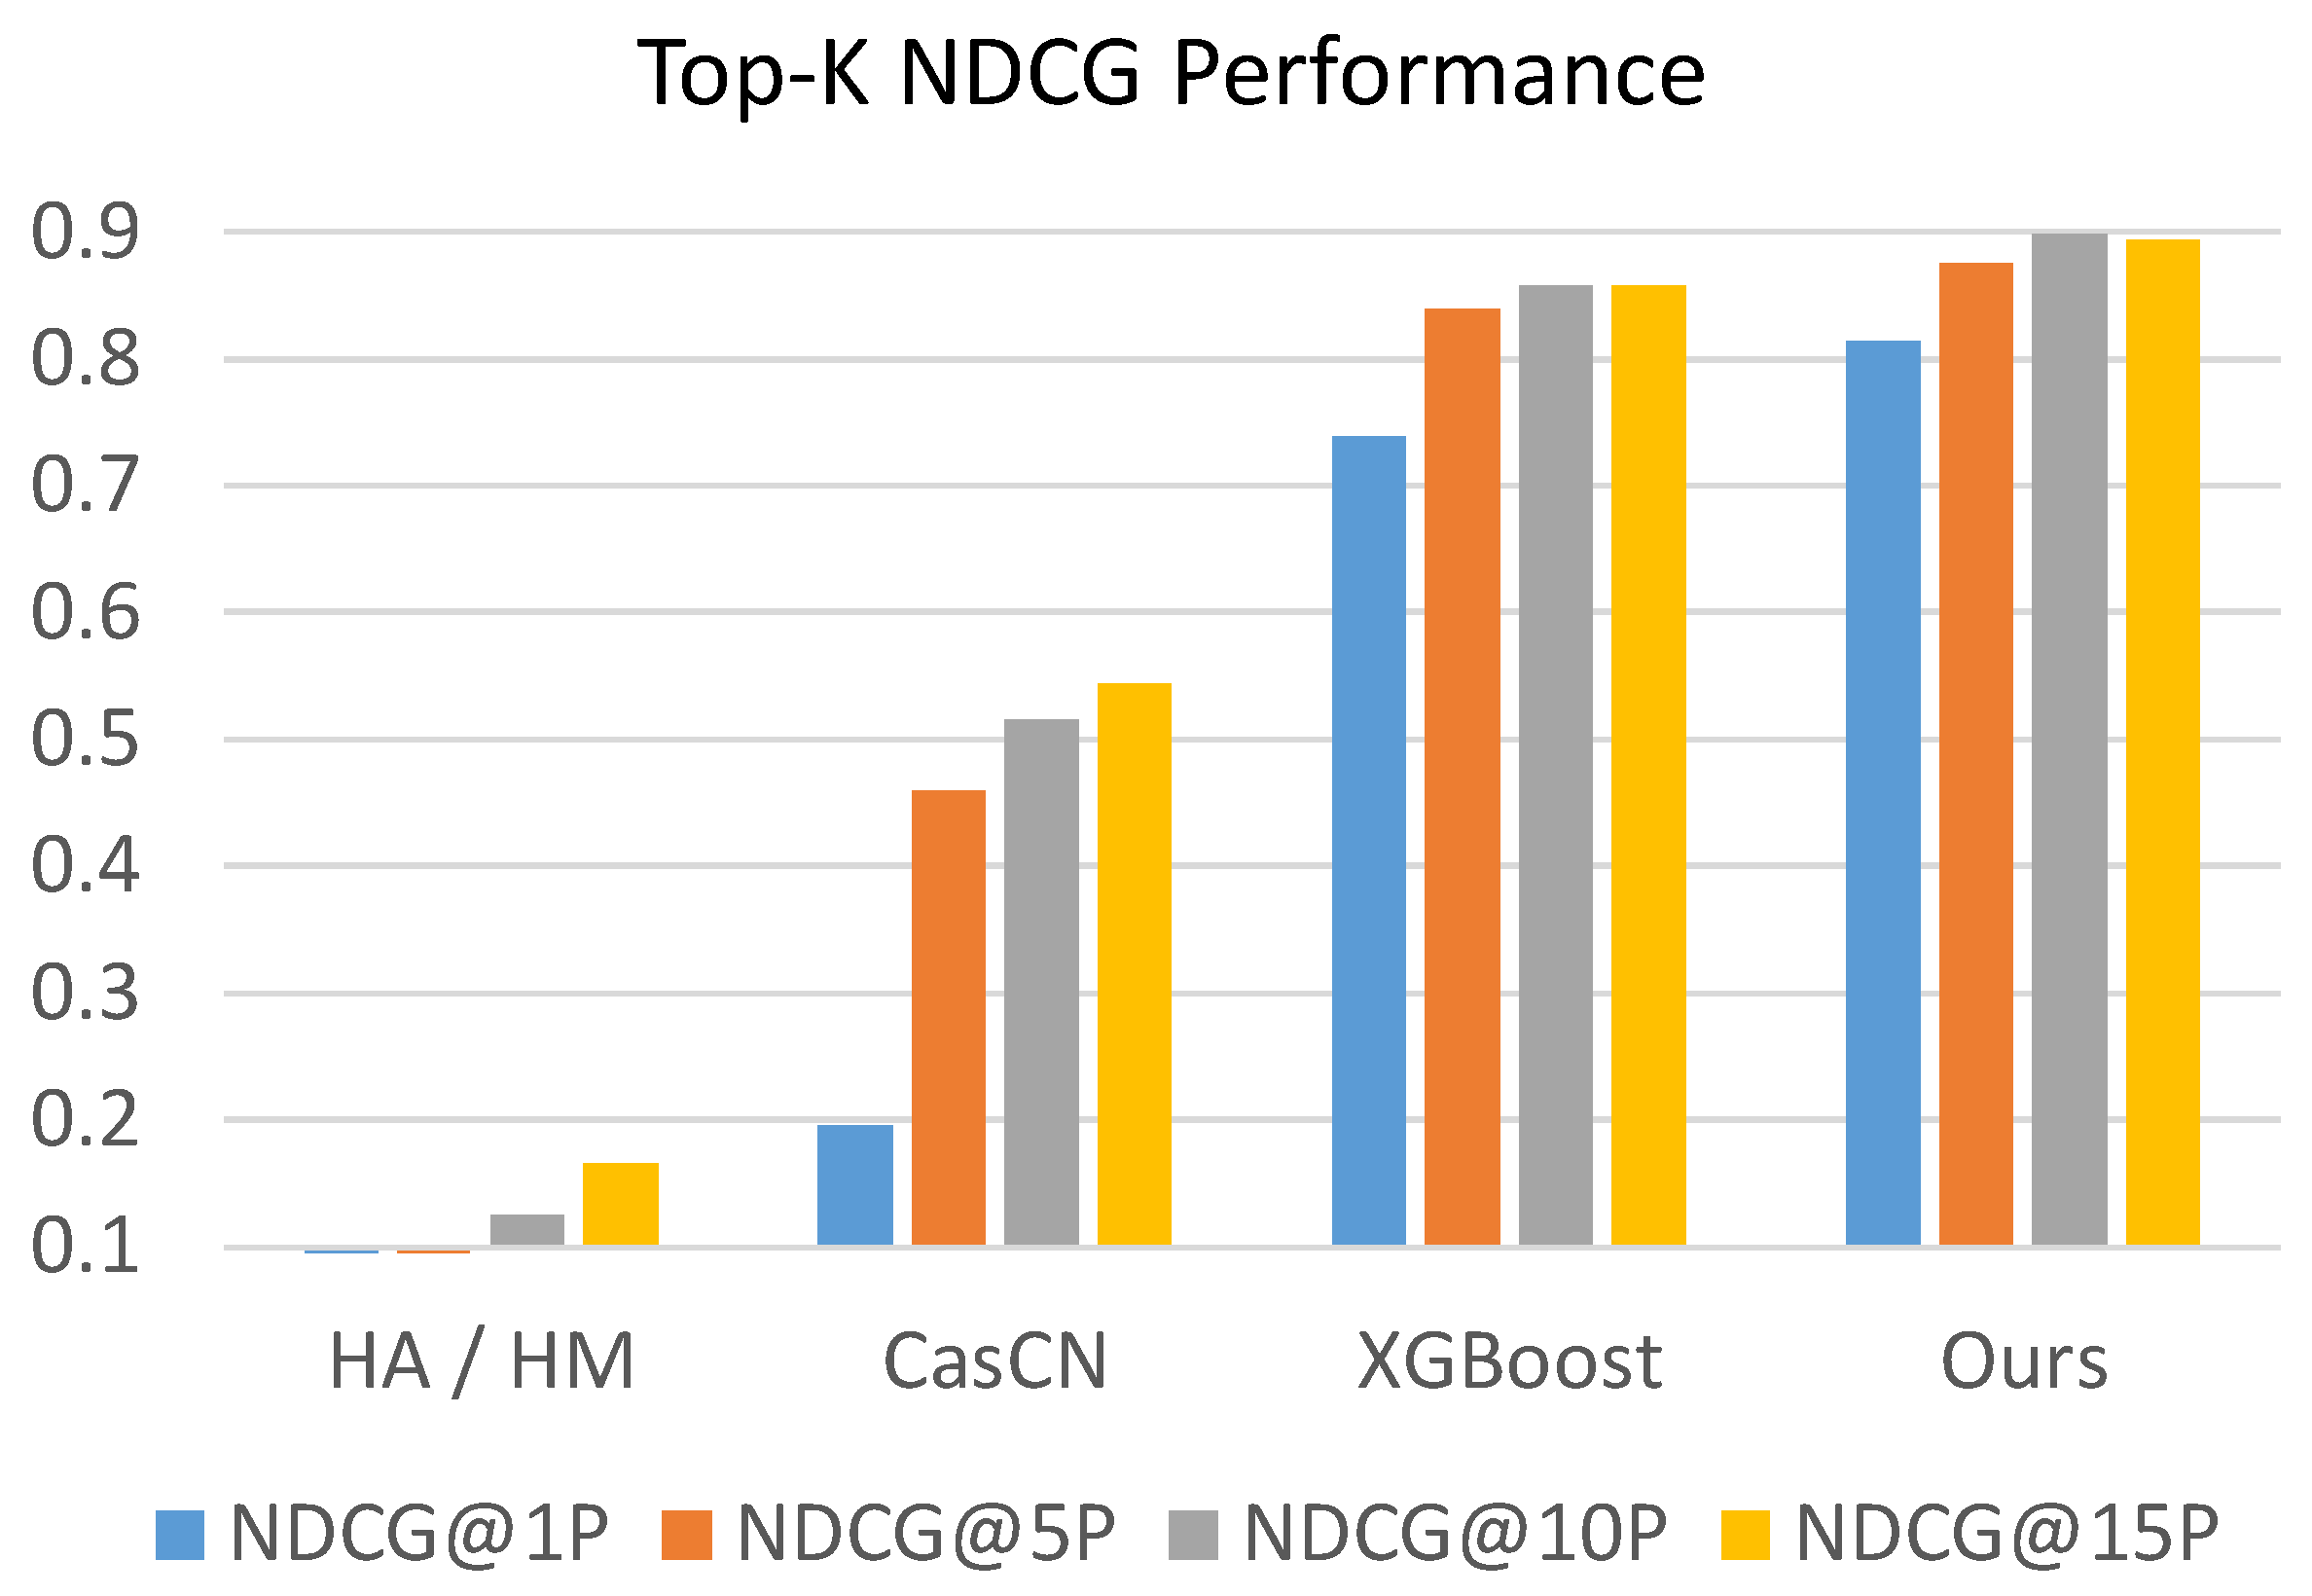
The values of evaluation metrics of competing methods and our proposed MUFFLE are shown in Table 4 and Figure 8 and Figure 9. The result shows that MUFFLE is able to achieve a relatively robust performance at metrics of hit rate and NDCG. It also indicates that our methods is accomplished in both ranking the popularity of posts and detecting the source tweets that will be retweeted massively in the future.
Generally, the evaluation result shows that MUFFLE outperforms other comparative methods (MUFFLE > XGBoost > CasCN > Statistical approaches) in terms of hit rate and NDCG. Feature-based approach XGBoost models the multi-modal properties which are extracted from statistical perspectives; however, it ignores the dynamic information which is implicitly stored in social networks with the structural and temporal characteristics.
On the other hand, CasCN captures the dynamic trend by modeling cascade graphs sequence within an observation time window, but it does not consider social contexts such as user profile and user’s historical tweets, which provide rich clues in inferring an account’s influence on a social media platform. While methods of historical mean and historical median perform extremely poorly at metrics for ranking, they perform well on MSE and MAE respectively because of the power-law distribution of cascade sizes in the dataset. For example, approximately 86% of source tweets have a cascade size equal to 1 in both the training set and testing set; i.e., the median of cascade sizes in the training set is 1 as well. Therefore, using the historical median to predict cascade sizes of source tweets tends to have a low absolute error.
5.4. Ablation Study
In our proposed framework MUFFLE, we capture information from various domains such as social context and text content, and we construct multiple components to model their representation. In order to answer EQ2, in this section, we investigate the effects of these components by evaluating the performance of several component combinations. The following abbreviations of individual components are defined for the sake of convenience:
- SN: SN is short for the component of social network encoding. It models the social graphs converted from cascade network sequences, which are extracted in the source tweet’s observation time window. In addition to graph-structured data, the descriptive graph properties are fed into this component and concatenated with encoded graphs, and then the combined features are fed into attention layers and fully-connected layers for regression.
- UT: UT is short for the component of user timeline representation. The input features contain aggregated user historical tweets, sentiment features, and statistical features. We use DistilBERT for text encoding and then concatenate encoded text and other numerical features to perform the regression task.
- UP: UP is the abbreviation of user profile representation. In this component, we adopt numerical attributes from Twitter user profiles as well as textual self-descriptions. Similar to the process of UT, text data is encoded into numerical tensors by DistilBERT, and then we concatenate all features and feed them into attentive MLP to predict the cascade size.
- ST: ST stands for source tweet encoding. We use DistilBERT to encode tweet content, news titles, as well as news content. Several types of features including sentiment features and temporal features are extracted from source tweet objects. The architecture of the model resembles UT and UP: using attention mechanism and FC layers to convert concatenated features into prediction.
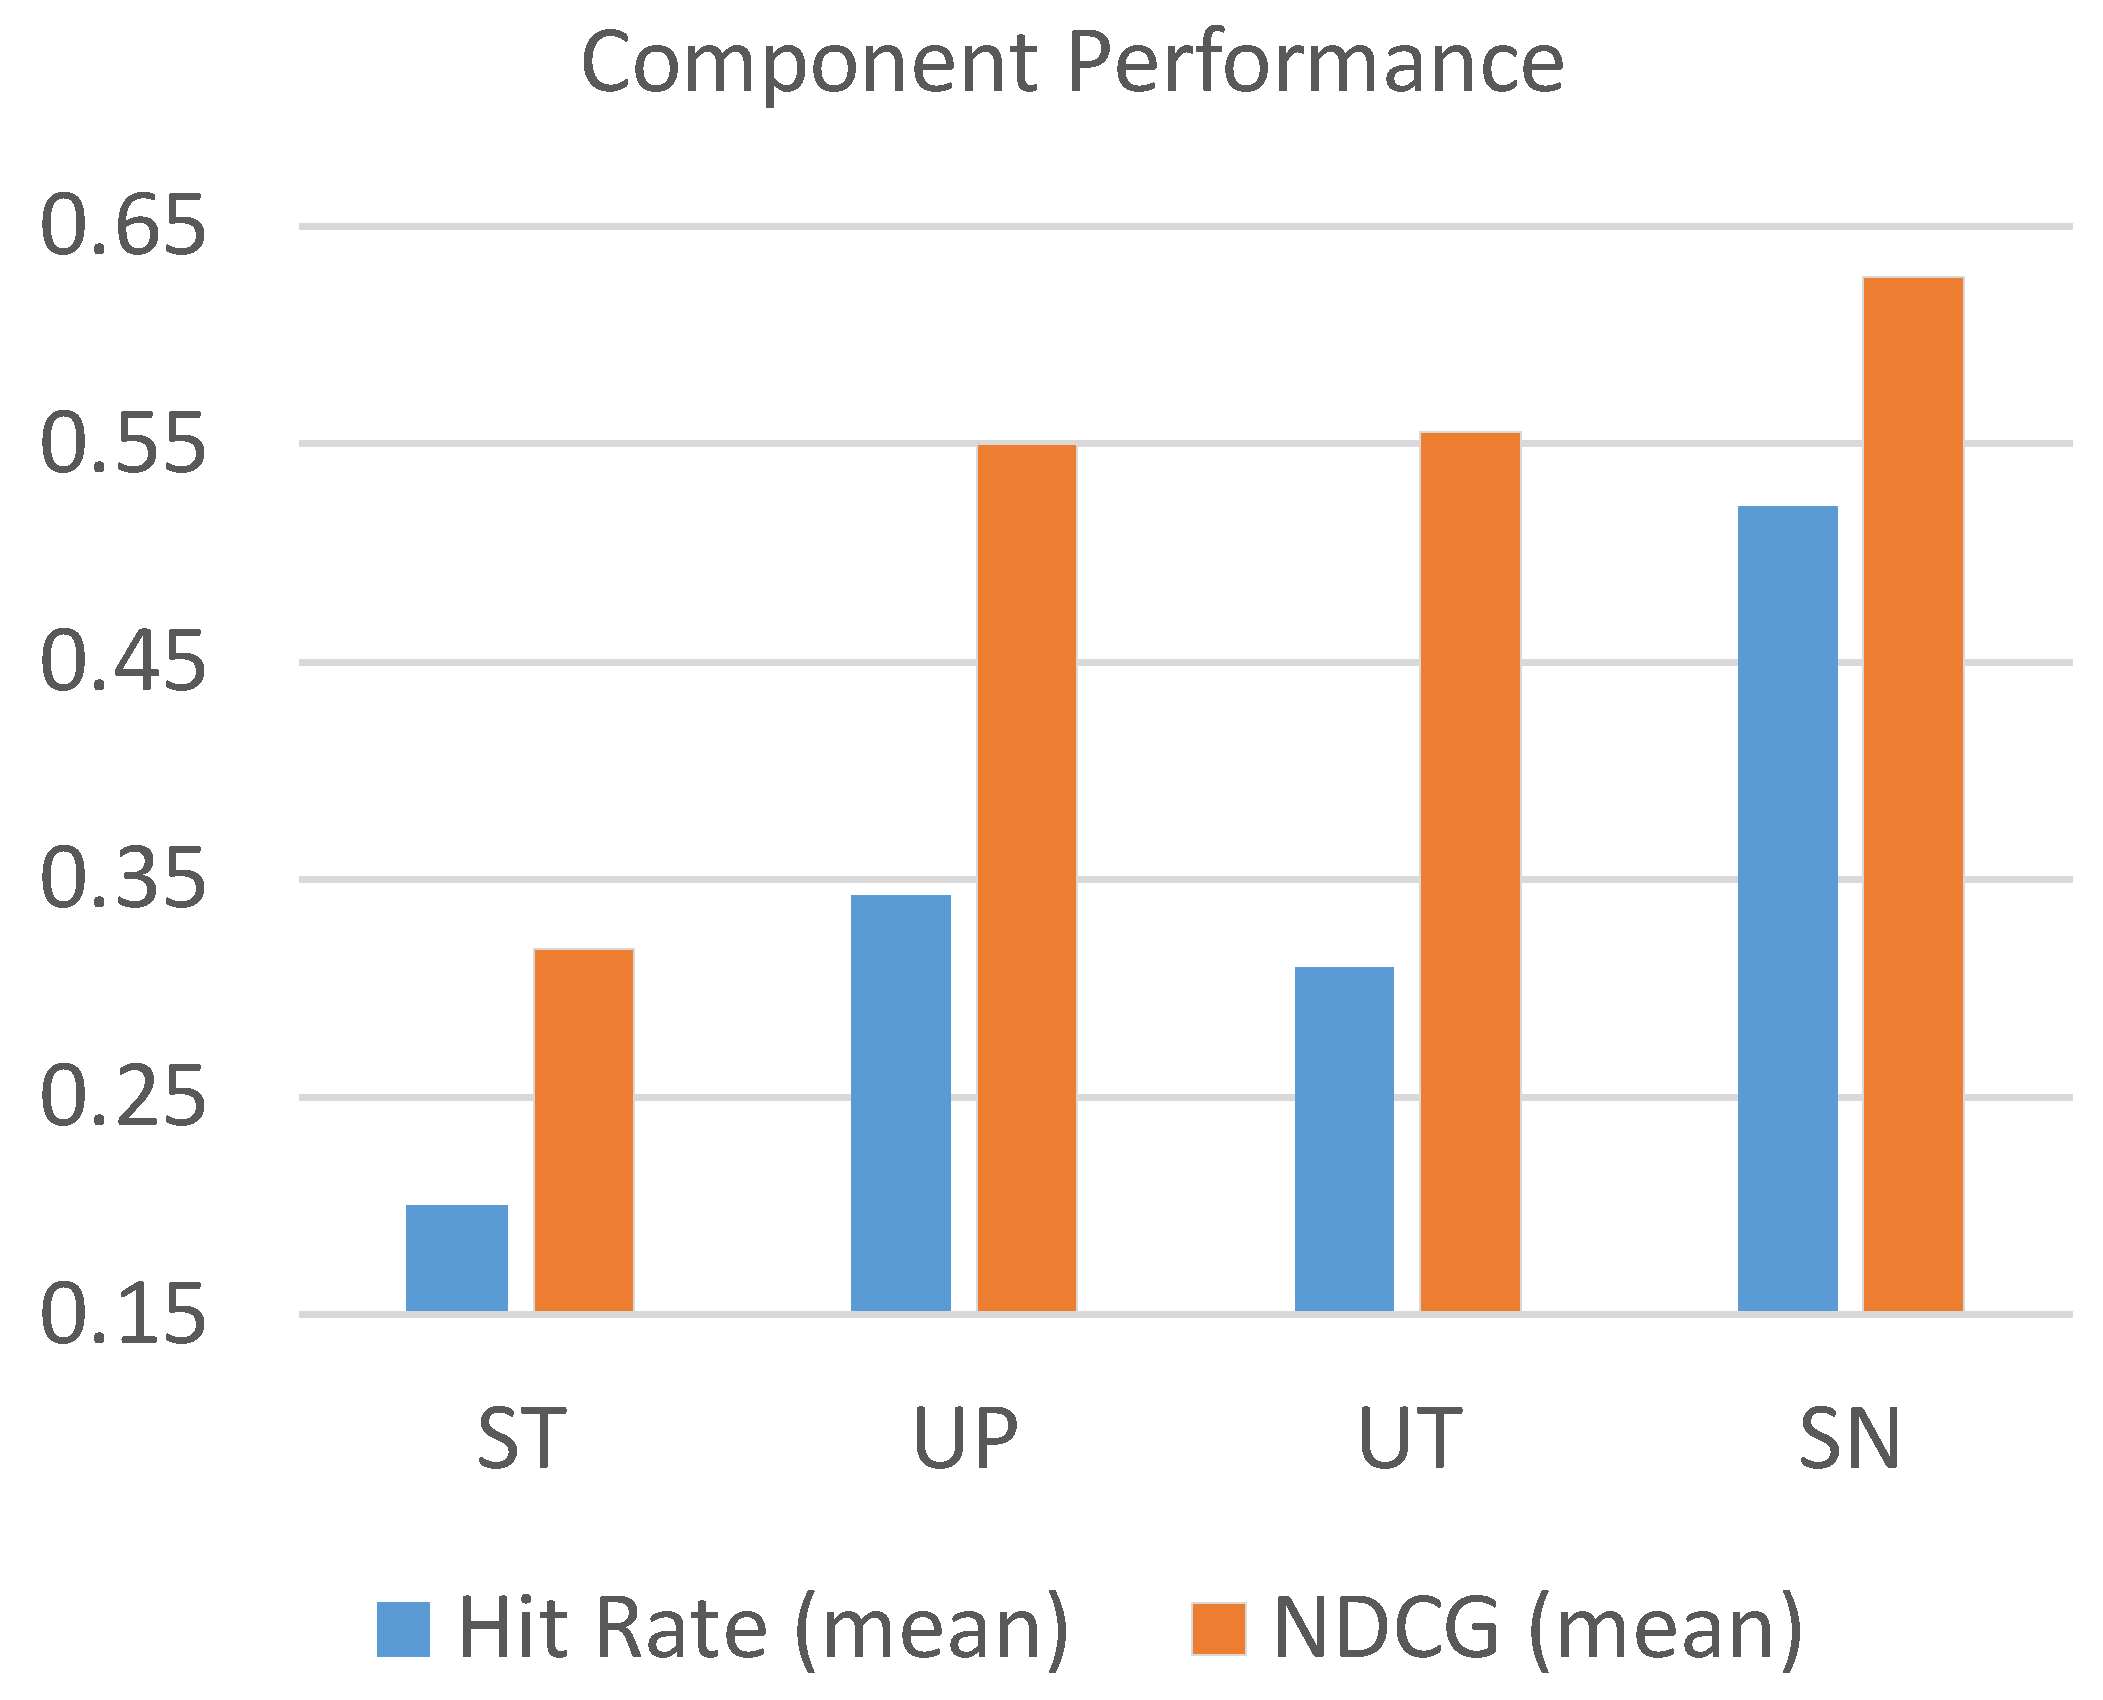
For each component, the parameters are determined with cross-validation and the best performance is reported in Figure 10. The shown values of hit rate and NDCG are averaged from the performance of all “K”s for top-k largest cascades (i.e., top-1%, top-5%, top-10%, and top-15%).
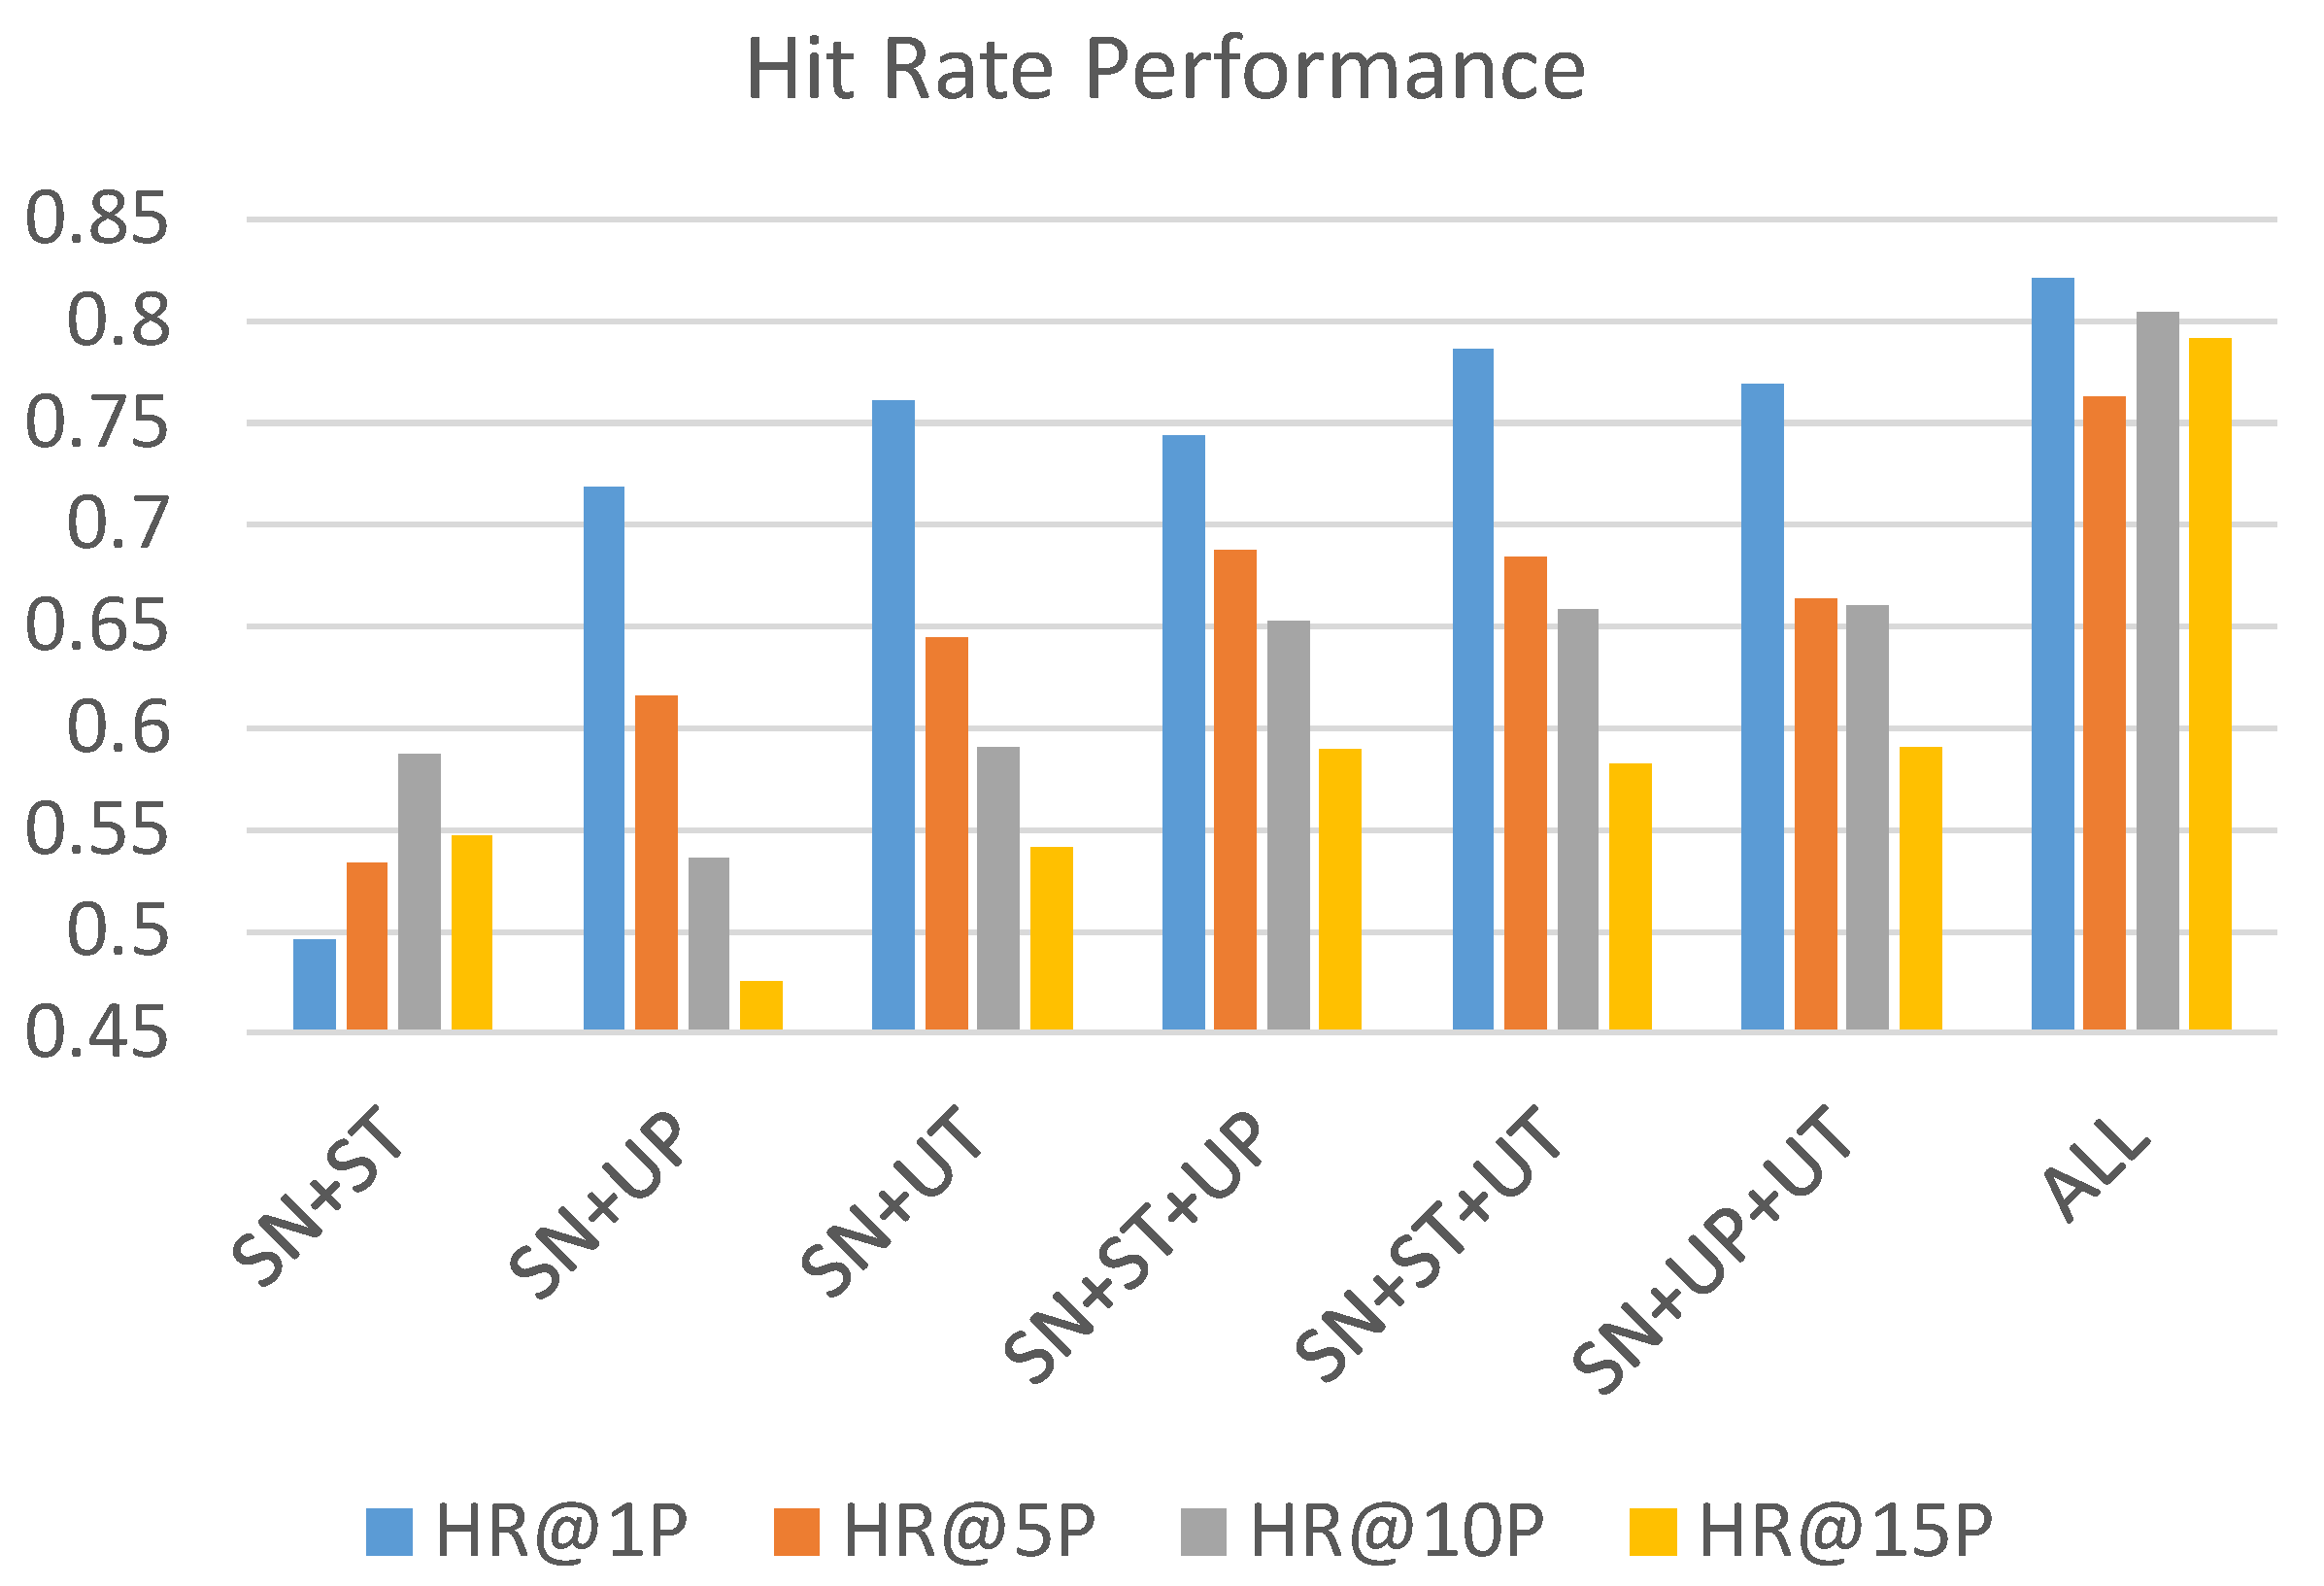
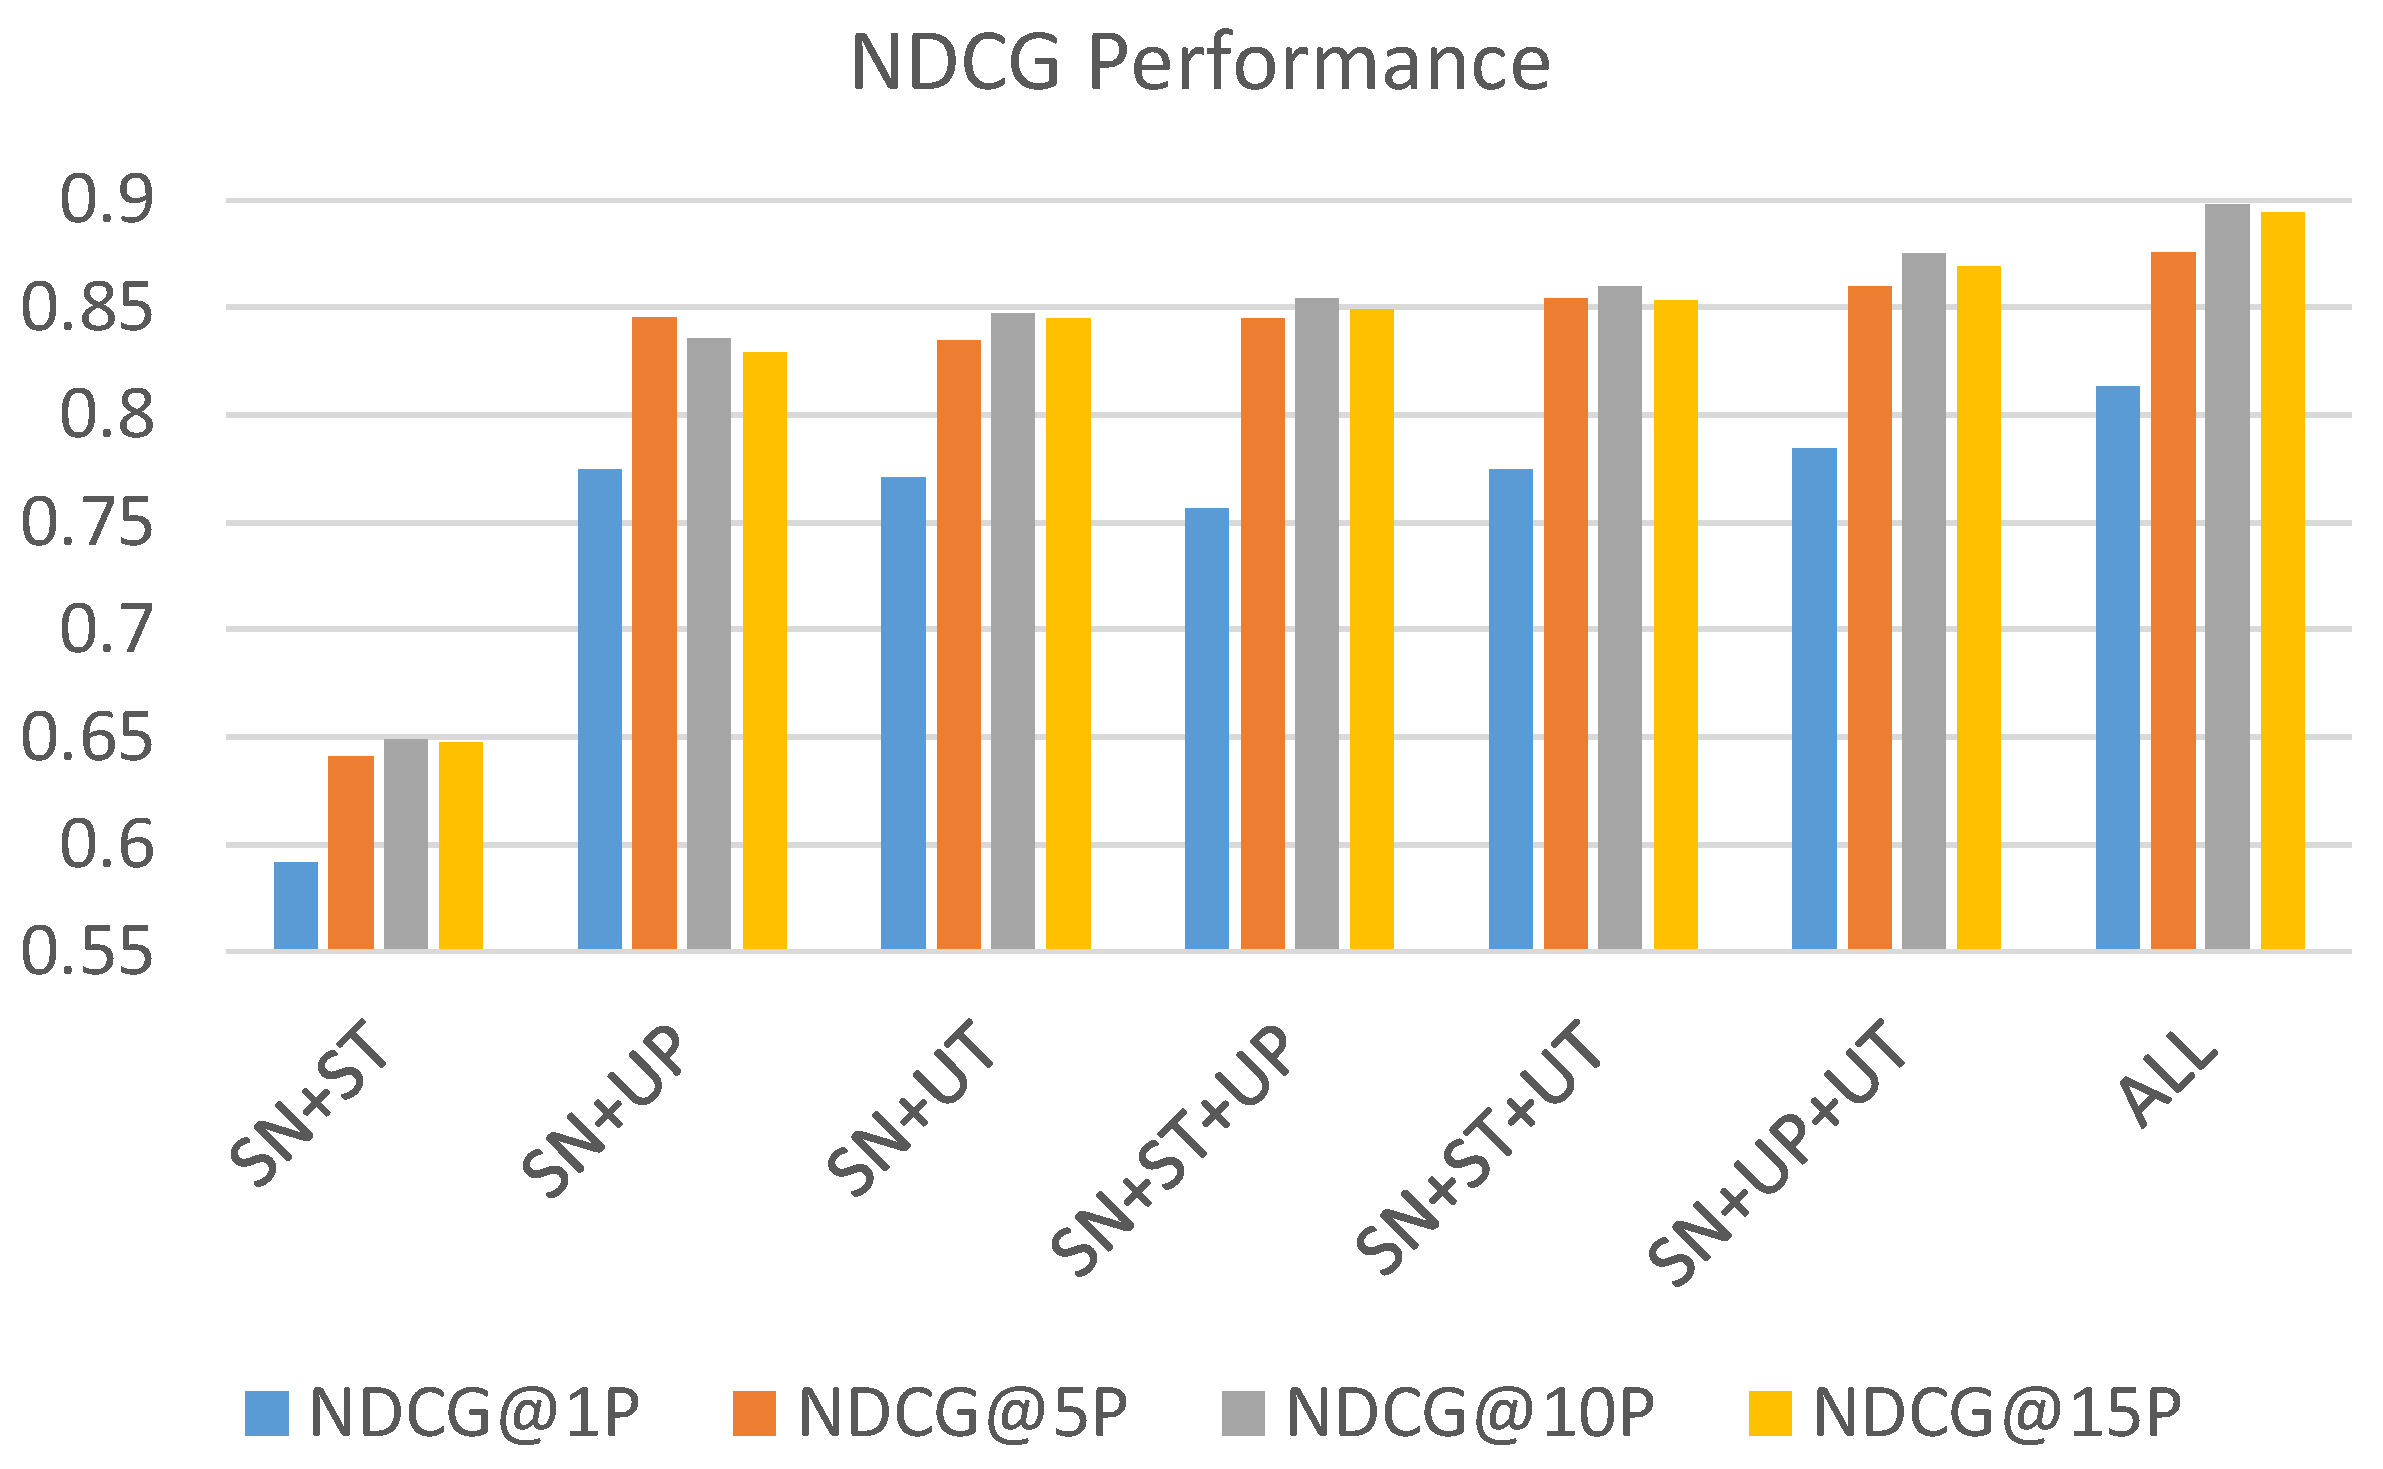
From the results, we observe that the social network component achieves the best accuracy, followed by the user profile component and user timeline component. The source tweet component contributes the least effort in prediction performance compared to the other three components. To examine the effect of each feature set, we further test the performance of each different component combination. Each combination uses SN as the base component and integrates with other components. The results are shown in Table 5 and visualized in Figure 11 and Figure 12. We make the following observations:
- While the source tweet component is the least effective in the individual performance comparison, the hit rate performance in Figure 11 shows that the source tweet component still contributes to the improvement of accuracy from the comparison between SN + UP and SN + UP + ST, as well as the comparison between SN + UT and SN + UT + ST. Both pairs reveal that the integration with ST component increases the hit rate the most in the top 10% and top 15%.
- From the opposite point of view, the component of UP and UT contribute to the hit rate mostly in the top 1% and top 5% when we look into the hit rate comparison between SN + ST and SN + ST + UT and comparison between SN + ST + UP.
- From the performance comparison of both hit rate and NDCG, the combination of all components results in the best performance.
Through the component analysis of MUFFLE, we conclude that (1) all components of social context and textual data from fake news and tweets can contribute to improving the fake news influence prediction of MUFFLE; (2) it is necessary to model features from multiple domains because they contain complementary information.
5.5. Explainability and Case Study
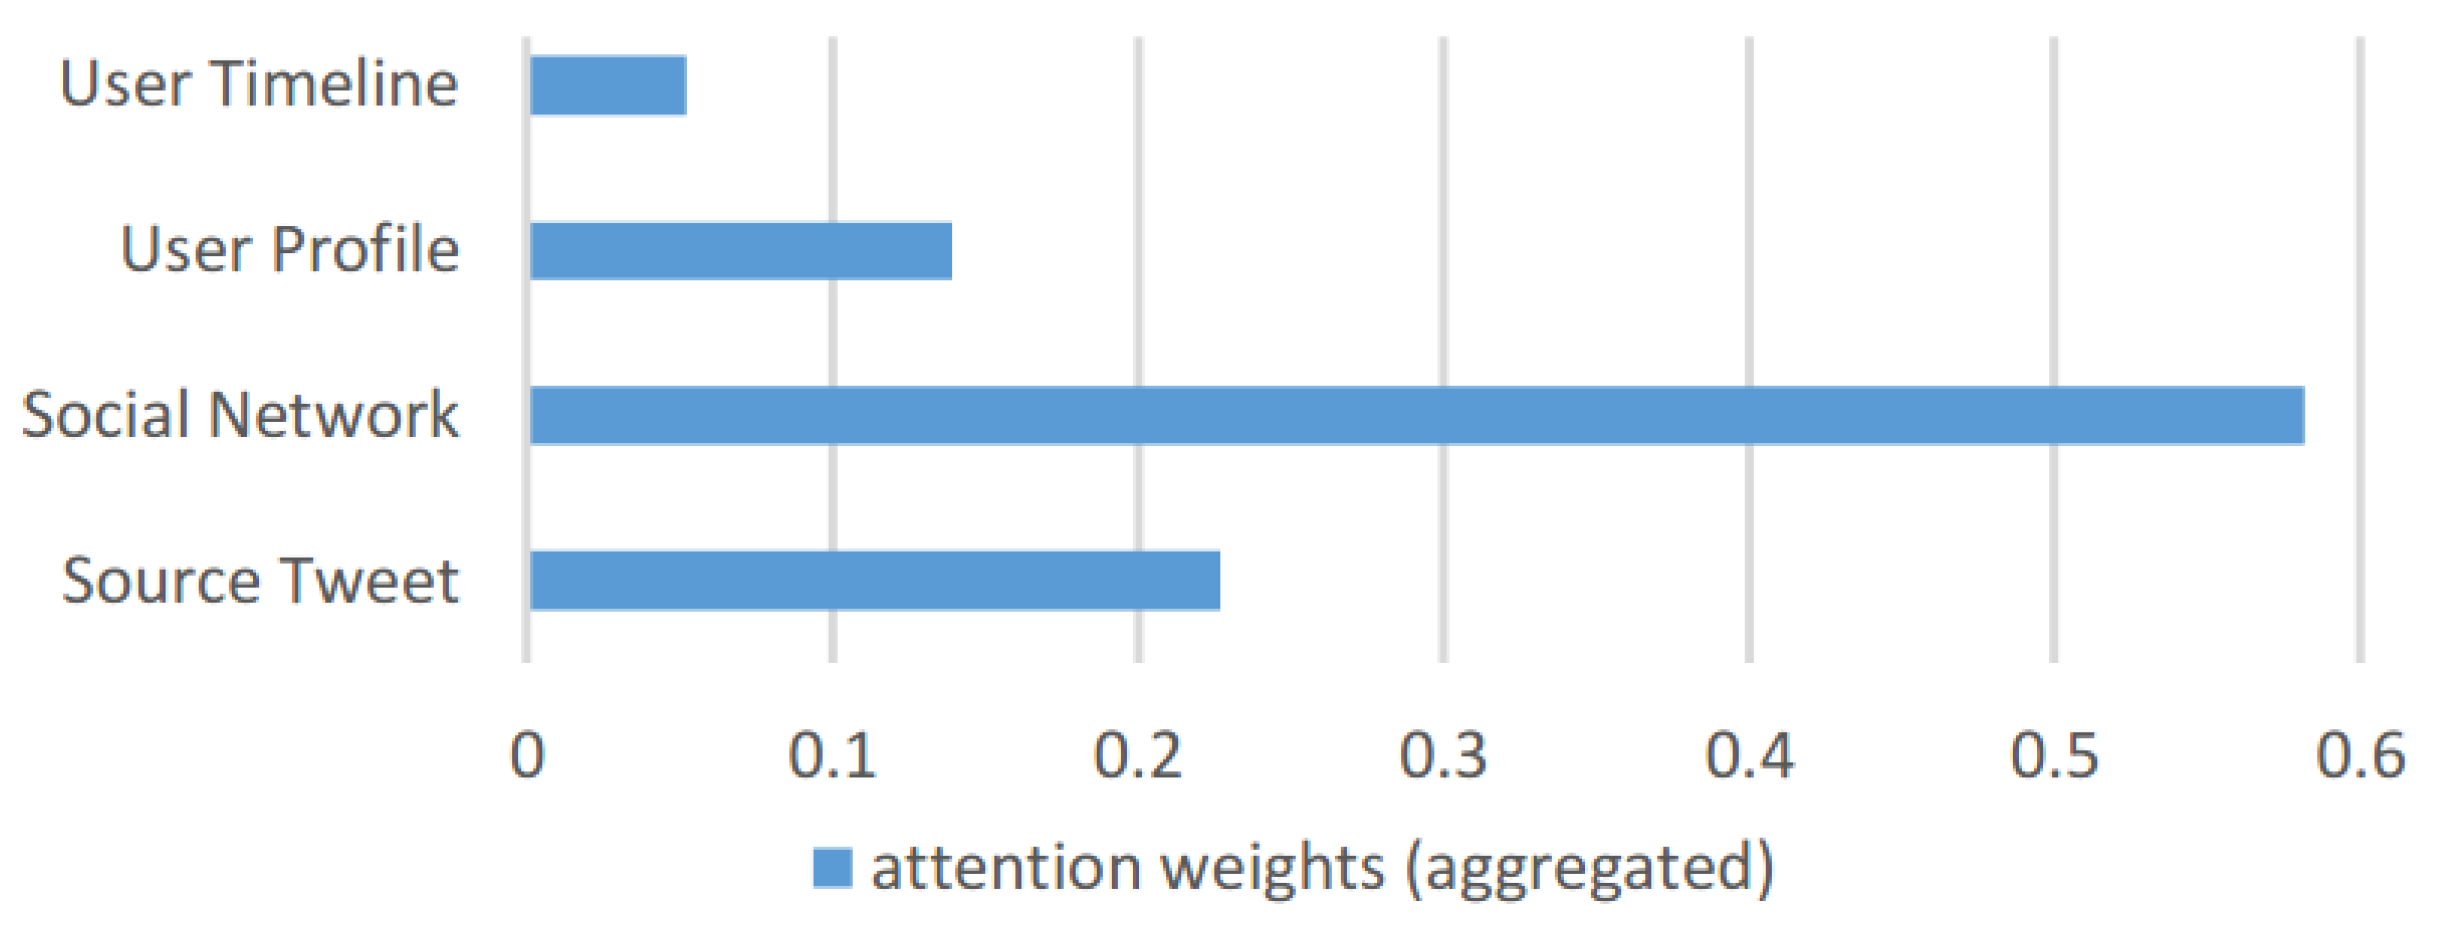
In this subsection, to answer EQ3, we look into our proposed framework MUFFLE during the phase of evaluation for assessing the ability of model explainability. Specifically, we record the learned attention weights for all features while using MUFFLE to perform prediction on source tweet examples in the testing set. Each set of attention weights is stored during evaluation, then we calculate the mean value. Figure 13 demonstrates the total attention weights MUFFLE learned for each component. Features related to social networks have the highest attention weights, which match the results of individual component performance evaluation depicted in Figure 10 in the previous sub-section. Besides, we observe that the weight of the source tweet component is approximately equal to the sum of the components of both the user timeline and user profile. The result indicates that user characteristics have the same importance as textual data, such as fake news content and tweet content.
To prove these two kinds of features are crucial to predicting fake news influence on social media platforms, we conduct two case studies on both user characteristics and textual features. In the first case study, we set the features of the user profile and timeline as independent variables, the news articles as controlled variables, and the cascade size of the source tweets as dependent variables, which symbolize the dissemination scale of the news. As for the second case study, we set different news pieces as independent variables, the users as controlled variables, and the cascade size of the source tweets as dependent variables. By exhibiting these two case studies, the importance of both domains’ features on predicting fake news influence is revealed.
5.5.1. Case Study One: User Characteristics
To demonstrate the momentousness of user characteristics, we select two source tweets sharing the same news but tweeted by two different users. One source tweet has no retweets at all, while the other source tweet has 101 retweets in total. We separate user characteristics into two parts: user profile and user timeline, as exhibited in Table 6. In the user profile, the user, whose tweet causes a larger information cascade, has many more followers, friends, listed, and favorite counts. In the user timeline, the average of retweets, favorites, and sentence counts are also higher in users who have a bigger cascade size. Due to the results, we conclude that dissimilar users may bring different effects on identical news articles.
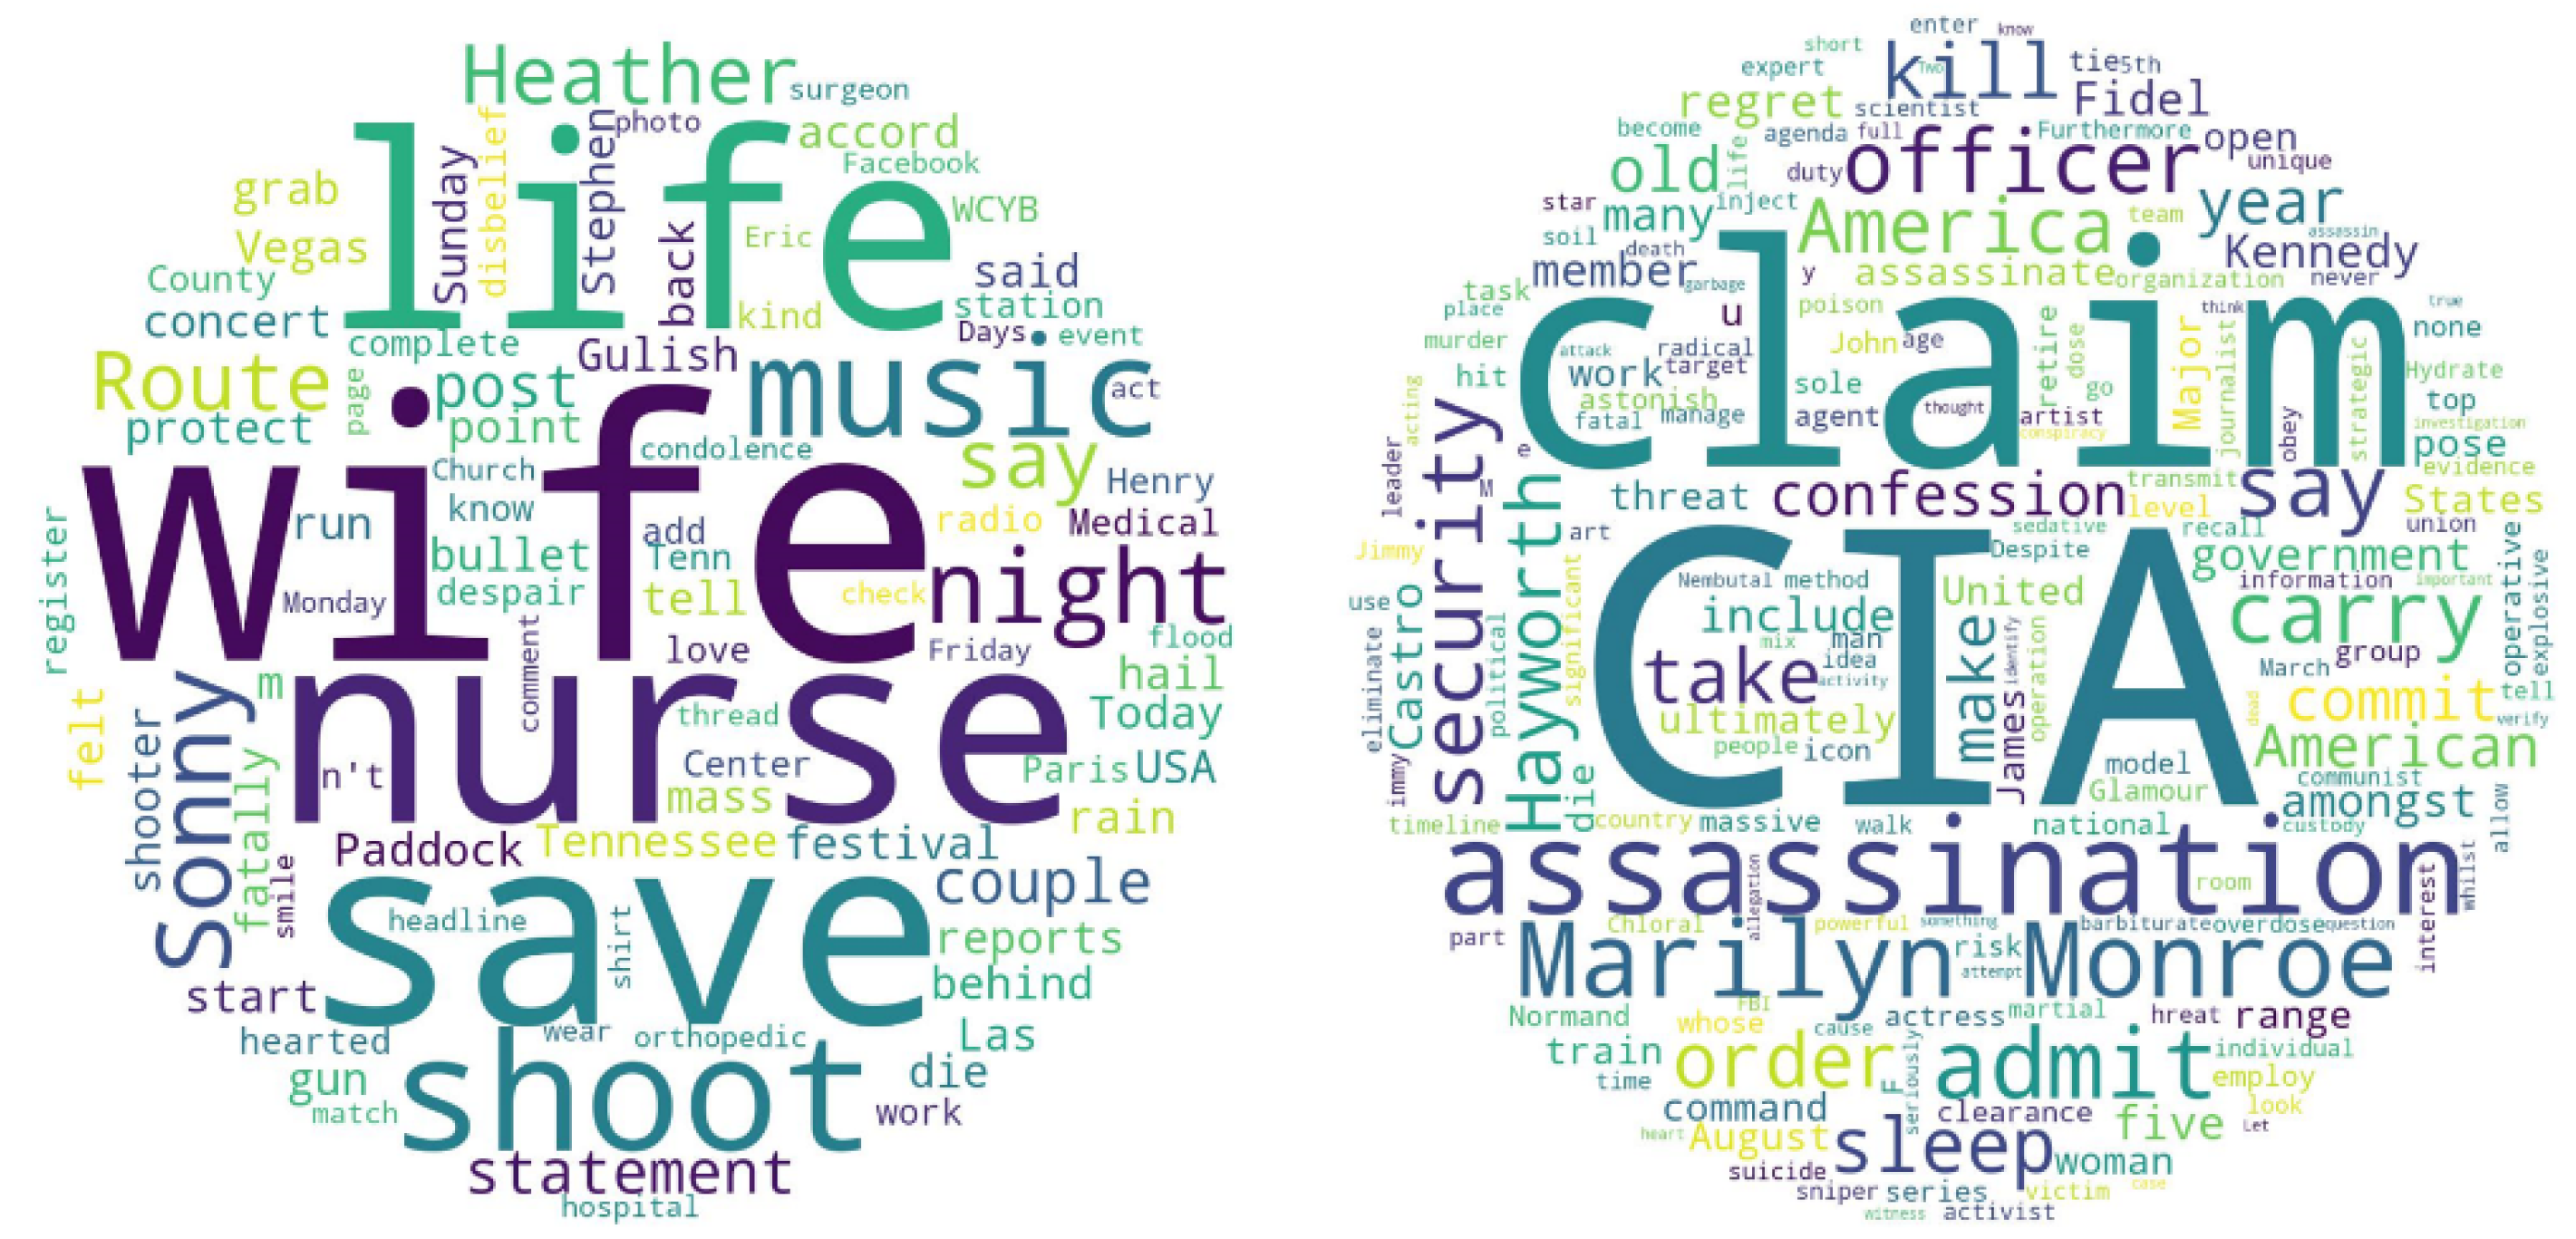
5.5.2. Case Study Two: Textual Features
We aim to prove that textual features play a crucial role in feature extraction. This time we select two source tweets from the same user but are involved in different fake news. One of the source tweets has 33 retweets and the other has no retweets. We highlight the important words from those two news articles using word cloud, shown in Figure 14. The topics of the news are different: social news and political news, which may be one of the main reasons that people are attracted to and retweeted the post. Moreover, from Table 7, we observe that the two articles have opposite sentiment scores, and the usage of sentiment words in the text is higher in the source tweet that has a larger cascade size. Such results show that the topic of the news and the sentiment contained may significantly determine the influence of the news.
5.5.3. Discussion of Execution Time
According to our experiments, the inference speed of the deep learning framework is not so crucial in this work. The reason is that the prediction can deal with 10,000 cases in 5 min on a GeForce RTX 3090 graphics card, and the time spent on data processing is less than one second, which can be ignored. The main time cost of our framework is the rate limit of the Twitter API service: 900 records in 15 min. Nevertheless, for a suspicious tweet, we can still predict its final size of cascade immediately (within 1 s).
6. Conclusions and Future Work
In this paper, we conduct a novel study that investigates the prediction of fake news influence. It aims to: (1) achieve robust prediction performance and (2) discover explainable features from aspects of social networks, user characteristics, and textual content. We propose a deep multi-modal framework, MUFFLE to capture the dynamics of fake news propagation and transfer it into useful feature representation for impact estimating. Experiments on a real-world dataset demonstrate the effectiveness of our proposed framework. Our proposed MUFFLE can be easily incorporated with decentralized oracles [61] to further detect the influence of misleading information or fake news. For future work, first, we can consider features that provide rich information on news influence on social media; e.g., images contained in news articles, geographic relationship between news events and online users, etc. Second, by testing our proposed framework on the dataset of “true” news propagation, we can explore the difference of feature importance between true and fake news propagation. Third, we can consider the credibility of the publishers and participants of news dissemination to further improve the performance of fake news influence. We believe that the followers of user reflect their personality and preference. Therefore, to enrich the information contained in user profile representation, we can further collect and model each user’s profiles of followers. Additionally, the ability of a user profile to generate and disseminate fake news can be related to the notion of trust in a social network [62,63,64,65]. Therefore, algorithms such as TrustRank [62] adapted to the social web can provide some hints to spot malicious users.
Author Contributions
Supervision, H.-P.H.; methodology, H.-P.H., J.J., Y.-W.C. and C.-L.W.; validation, C.-L.W.; investigation, H.-P.H., J.J., Y.-C.Y. and C.-L.W.; writing—original draft preparation, Y.-W.C., J.J. and C.-L.W.; writing—review and editing, H.-P.H. and C.S. All authors have read and agreed to the published version of the manuscript.
Funding
This research was funded by the Ministry of Science and Technology (MOST) of Taiwan under grants MOST 109-2636-E-006-025 and MOST 110-2636-E-006-011.
Institutional Review Board Statement
Not applicable.
Informed Consent Statement
Not applicable.
Acknowledgments
This work was partially supported by Ministry of Science and Technology (MOST) of Taiwan under grants MOST 109-2636-E-006-025 and MOST 110-2636-E-006-011(MOST Young Scholar Fellowship).
Conflicts of Interest
The authors declare no conflict of interest.
References
- Cao, Q.; Shen, H.; Cen, K.; Ouyang, W.; Cheng, X. DeepHawkes: Bridging the gap between prediction and understanding of information cascades. In Proceedings of the International Conference on Information and Knowledge Management, Singapore, 6–10 November 2017. [Google Scholar]
- Allcott, H.; Gentzkow, M. Social media and fake news in the 2016 election. J. Econ. Perspect. 2017, 31, 211–236. [Google Scholar] [CrossRef] [Green Version]
- Rashkin, H.; Choi, E.; Jang, J.Y.; Volkova, S.; Choi, Y. Truth of varying shades: Analyzing language in fake news and political fact-checking. In Proceedings of the Conference on Empirical Methods in Natural Language Processing, Copenhagen, Denmark, 7–11 September 2017. [Google Scholar]
- Islam, M.S.; Sarkar, T.; Khan, S.H.; Kamal, A.H.M.; Hasan, S.M.; Kabir, A.; Yeasmin, D.; Islam, M.A.; Chowdhury, K.I.A.; Anwar, K.S.; et al. COVID-19-Related infodemic and its impact on public health: A global social media analysis. Am. J. Trop. Med. Hyg. 2020, 103, 1621. [Google Scholar] [CrossRef] [PubMed]
- Gao, J.; Shen, H.; Liu, S.; Cheng, X. Modeling and predicting retweeting dynamics via a mixture process. In Proceedings of the International World Wide Web Conferences, Montréal, QC, Canada, 11–15 May 2016. [Google Scholar]
- Gao, S.; Ma, J.; Chen, Z. Modeling and predicting retweeting dynamics on microblogging platforms. In Proceedings of the International Conference on Web Search and Data Mining, Shanghai, China, 2–6 February 2015. [Google Scholar]
- Mishra, S.; Rizoiu, M.A.; Xie, L. Feature driven and point process approaches for popularity prediction. In Proceedings of the International Conference on Information and Knowledge Management, Indianapolis, IN, USA, 24–28 October 2016. [Google Scholar]
- Shen, H.; Wang, D.; Song, C.; Barabási, A.L. Modeling and predicting popularity dynamics via reinforced Poisson processes. In Proceedings of the AAAI Conference on Artificial Intelligence, Québec, QC, Canada, 27–31 July 2014. [Google Scholar]
- Bakshy, E.; Mason, W.A.; Hofman, J.M.; Watts, D.J. Everyone’s an influencer: Quantifying influence on twitter. In Proceedings of the International Conference on Web Search and Data Mining, Hong Kong, China, 9–12 February 2011. [Google Scholar]
- Cui, P.; Jin, S.; Yu, L.; Wang, F.; Zhu, W.; Yang, S. Cascading outbreak prediction in networks: A data-driven approach. In Proceedings of the International Conference on Knowledge Discovery and Data Mining, Chicago, IL, USA, 11–14 August 2013. [Google Scholar]
- Lerman, K.; Galstyan, A. Analysis of social voting patterns on Digg. In Proceedings of the Conference on Computer Communications—1st Workshop on Online Social Networks, Seattle, WA, USA, 18 August 2008. [Google Scholar]
- Pinto, H.; Almeida, J.M.; Gonçalves, M.A. Using early view patterns to predict the popularity of YouTube videos. In Proceedings of the International Conference on Web Search and Data Mining, Rome, Italy, 4–8 February 2013. [Google Scholar]
- Szabo, G.; Huberman, B.A. Predicting the popularity of online content. Commun. ACM 2010, 53, 80–88. [Google Scholar] [CrossRef]
- Bao, P.; Shen, H.W.; Huang, J.; Cheng, X.Q. Popularity prediction in microblogging network: A case study on sina weibo. In Proceedings of the International World Wide Web Conferences, Rio de Janeiro, Brazil, 13–17 May 2013. [Google Scholar]
- Romero, D.M.; Tan, C.; Ugander, J. On the interplay between social and topical structure. In Proceedings of the International Conference on Weblogs and Social Media, Cambridge, MA, USA, 8–11 July 2013. [Google Scholar]
- Weng, L.; Menczer, F.; Ahn, Y.Y. Predicting successful memes using network and community structure. In Proceedings of the International Conference on Weblogs and Social Media, Ann Arbor, MI, USA, 1–4 June 2014. [Google Scholar]
- Li, C.; Ma, J.; Guo, X.; Mei, Q. DeepCas: An end-to-end predictor of information cascades. In Proceedings of the International World Wide Web Conferences, Perth, Australia, 3–7 May 2017. [Google Scholar]
- Wang, J.; Zheng, V.W.; Liu, Z.; Chang, K.C.C. Topological recurrent neural network for diffusion prediction. In Proceedings of the IEEE International Conference on Data Mining, New Orleans, LA, USA, 18–21 November 2017. [Google Scholar]
- Wang, Y.; Shen, H.; Liu, S.; Gao, J.; Cheng, X. Cascade dynamics modeling with attention-based recurrent neural network. In Proceedings of the International Joint Conference on Artificial Intelligence, Melbourne, Australia, 19–25 August 2017. [Google Scholar]
- Castillo, C.; Mendoza, M.; Poblete, B. Information credibility on Twitter. In Proceedings of the International World Wide Web Conferences, Hyderabad, India, 28 March–1 April 2011. [Google Scholar]
- Ma, J.; Gao, W.; Mitra, P.; Kwon, S.; Jansen, B.J.; Wong, K.F.; Cha, M. Detecting rumors from microblogs with recurrent neural networks. In Proceedings of the International Joint Conference on Artificial Intelligence, New York, NY, USA, 9–15 July 2016. [Google Scholar]
- Popat, K. Assessing the credibility of claims on the web. In Proceedings of the International World Wide Web Conferences, Perth, Australia, 3–7 April 2017. [Google Scholar]
- Zhao, Z.; Resnick, P.; Mei, Q. Enquiring minds: Early detection of rumors in social media from enquiry posts. In Proceedings of the International World Wide Web Conferences, Florence, Italy, 18–22 May 2015. [Google Scholar]
- Jiang, J.Y.; Li, C.T.; Chen, Y.; Wang, W. Identifying users behind shared accounts in online streaming services. In Proceedings of the International Conference on Research and Development in Information Retrieval, Ann Arbor, MI, USA, 8–12 July 2018. [Google Scholar]
- Liu, Y.; Wu, Y.F.B. Early detection of fake news on social media through propagation path classification with recurrent and convolutional networks. In Proceedings of the AAAI Conference on Artificial Intelligence, New Orleans, LA, USA, 2–7 February 2018. [Google Scholar]
- Shu, K.; Zhou, X.; Wang, S.; Zafarani, R.; Liu, H. The role of user profiles for fake news detection. In Proceedings of the International Conference on Advances in Social Networks Analysis and Mining, Vancouver, BC, Canada, 27–30 August 2019. [Google Scholar]
- Yang, F.; Yu, X.; Liu, Y.; Yang, M. Automatic detection of rumor on Sina Weibo. In Proceedings of the International Conference on Knowledge Discovery and Data Mining, Beijing, China, 12–16 August 2012. [Google Scholar]
- Feng, M.H.; Hsu, C.C.; Li, C.T.; Yeh, M.Y.; Lin, S.D. Marine: Multi-relational network embeddings with relational proximity and node attributes. In Proceedings of the International World Wide Web Conferences, San Francisco, CA, USA, 13–17 May 2019. [Google Scholar]
- Ma, J.; Gao, W.; Wong, K.F. Rumor detection on twitter with tree-structured recursive neural networks. In Proceedings of the Annual Meeting of the Association for Computational Linguistics, Melbourne, Australia, 15–20 July 2018. [Google Scholar]
- Sampson, J.; Morstatter, F.; Wu, L.; Liu, H. Leveraging the implicit structure within social media for emergent rumor detection. In Proceedings of the International Conference on Information and Knowledge Management, Indianapolis, IN, USA, 24–28 October 2016. [Google Scholar]
- Wang, P.C.; Li, C.T. Spotting terrorists by learning behavior-aware heterogeneous network embedding. In Proceedings of the International Conference on Information and Knowledge Management, Beijing, China, 3–7 November 2019. [Google Scholar]
- Ruchansky, N.; Seo, S.; Liu, Y. CSI: A hybrid deep model for fake news detection. In Proceedings of the International Conference on Information and Knowledge Management, Singapore, 6–10 November 2017. [Google Scholar]
- Shu, K.; Cui, L.; Wang, S.; Lee, D.; Liu, H. Defend: Explainable fake news detection. In Proceedings of the International Conference on Knowledge Discovery and Data Mining, Anchorage, AK, USA, 4–8 August 2019. [Google Scholar]
- Wang, Y.; Ma, F.; Jin, Z.; Yuan, Y.; Xun, G.; Jha, K.; Su, L.; Gao, J. EANN: Event adversarial neural networks for multi-modal fake news detection. In Proceedings of the International Conference on Knowledge Discovery and Data Mining, London, UK, 19–23 August 2018. [Google Scholar]
- Sanh, V.; Debut, L.; Chaumond, J.; Wolf, T. DistilBERT, a distilled version of BERT: Smaller, faster, cheaper and lighter. arXiv 2019, arXiv:1910.01108. [Google Scholar]
- Lu, Y.J.; Li, C.T. GCAN: Graph-aware co-attention networks for explainable fake news detection on social media. arXiv 2020, arXiv:2004.11648. [Google Scholar]
- Shu, K.; Mahudeswaran, D.; Wang, S.; Liu, H. Hierarchical propagation networks for fake news detection: Investigation and exploitation. In Proceedings of the International Conference on Web and Social Media, Altanta, GA, USA, 8–11 June 2020. [Google Scholar]
- Wang, K.; Bansal, M.; Frahm, J.M. Retweet wars: Tweet popularity prediction via dynamic multimodal regression. In Proceedings of the 2018 IEEE Winter Conference on Applications of Computer Vision, Lake Tahoe, NV, USA, 12–15 March 2018. [Google Scholar]
- Tsur, O.; Rappoport, A. What’s in a hashtag? Content based prediction of the spread of ideas in microblogging communities. In Proceedings of the International Conference on Web Search and Data Mining, Seattle, WA, USA, 8–12 February 2012. [Google Scholar]
- Cheng, J.; Adamic, L.A.; Dow, P.A.; Kleinberg, J.; Leskovec, J. Can cascades be predicted? In Proceedings of the International World Wide Web Conferences, Seoul, Korea, 7–11 April 2014. [Google Scholar]
- Jenders, M.; Kasneci, G.; Naumann, F. Analyzing and predicting viral tweets. In Proceedings of the International World Wide Web Conferences, Rio de Janeiro, Brazil, 13–17 May 2013. [Google Scholar]
- Hong, L.; Dan, O.; Davison, B.D. Predicting popular messages in Twitter. In Proceedings of the International World Wide Web Conferences, Hyderabad, India, 28 March–1 April 2011. [Google Scholar]
- Ma, Z.; Sun, A.; Cong, G. On predicting the popularity of newly emerging hashtags in Twitter. J. Am. Soc. Inf. Sci. Technol. 2013, 64, 1399–1410. [Google Scholar] [CrossRef]
- Petrovic, S.; Osborne, M.; Lavrenko, V. Rt to win! Predicting message propagation in twitter. In Proceedings of the International Conference on Weblogs and Social Media, Barcelona, Spain, 17–21 July 2011. [Google Scholar]
- Shulman, B.; Sharma, A.; Cosley, D. Predictability of popularity: Gaps between prediction and understanding. In Proceedings of the International Conference on Web and Social Media, Cologne, Germany, 17–20 May 2016. [Google Scholar]
- Cao, Q.; Shen, H.; Gao, J.; Wei, B.; Cheng, X. Popularity prediction on social platforms with coupled graph neural networks. In Proceedings of the International Conference on Web Search and Data Mining, Huston, TX, USA, 5–9 February 2020. [Google Scholar]
- Chen, X.; Zhou, F.; Zhang, K.; Trajcevski, G.; Zhong, T.; Zhang, F. Information diffusion prediction via recurrent cascades convolution. In Proceedings of the International Conference on Data Engineering, Macao, China, 8–11 April 2019. [Google Scholar]
- Potthast, M.; Kiesel, J.; Reinartz, K.; Bevendorff, J.; Stein, B. A stylometric inquiry into hyperpartisan and fake news. In Proceedings of the Annual Meeting of the Association for Computational Linguistics, Melbourne, Australia, 15–20 July 2018. [Google Scholar]
- Guo, C.; Cao, J.; Zhang, X.; Shu, K.; Liu, H. Exploiting emotions for fake news detection on social media. arXiv 2019, arXiv:1903.01728. [Google Scholar]
- Ma, J.; Gao, W.; Wong, K.F. Detect rumors in microblog posts using propagation structure via kernel learning. In Proceedings of the Annual Meeting of the Association for Computational Linguistics, Vancouver, BC, Canada, 30 July– 4 August 2017. [Google Scholar]
- Shu, K.; Sliva, A.; Wang, S.; Tang, J.; Liu, H. Fake news detection on social media: A data mining perspective. ACM SIGKDD Explor. Newsl. 2017, 19, 22–36. [Google Scholar] [CrossRef]
- Bessi, A.; Ferrara, E. Social bots distort the 2016 U.S. Presidential election online discussion. First Monday 2016, 21, 11–17. [Google Scholar] [CrossRef]
- Quattrociocchi, W.; Scala, A.; Sunstein, C.R. Echo Chambers on Facebook. SSRN Electron. J. 2018, 1–15. [Google Scholar] [CrossRef] [Green Version]
- Paul, C.; Matthews, M. The Russian “Firehose of Falsehood” Propaganda Model: Why It Might Work and Options to Counter It; RAND Corporation: Santa Monica, CA, USA, 2017. [Google Scholar]
- Kipf, T.N.; Welling, M. Semi-supervised classification with graph convolutional networks. In Proceedings of the International Conference on Learning Representations, Toulon, France, 24–26 April 2017. [Google Scholar]
- Cho, K.; VanMerriënboer, B.; Gulcehre, C.; Bahdanau, D.; Bougares, F.; Schwenk, H.; Bengio, Y. Learning phrase representations using RNN encoder-decoder for statistical machine translation. In Proceedings of the Conference on Empirical Methods in Natural Language Processing, Doha, Qata, 25–29 October 2014. [Google Scholar]
- Bai, S.; Kolter, J.Z.; Koltun, V. An empirical evaluation of generic convolutional and recurrent networks for sequence modeling. arXiv 2018, arXiv:1803.01271. [Google Scholar]
- Hutto, C.J.; Gilbert, E. VADER: A parsimonious rule-based model for sentiment analysis of social media text. In Proceedings of the International Conference on Weblogs and Social Media, Ann Arbor, MI, USA, 1–4 June 2014. [Google Scholar]
- Shu, K.; Mahudeswaran, D.; Wang, S.; Lee, D.; Liu, H. FakeNewsNet: A data repository with news content, social context and spatiotemporal information for studying fake news on social media. Big Data 2020, 8, 171–188. [Google Scholar] [CrossRef] [PubMed]
- Chen, T.; Guestrin, C. XGBoost: A scalable tree boosting system. In Proceedings of the International Conference on Knowledge Discovery and Data Mining, San Francisco, CA, USA, 13–17 August 2016. [Google Scholar]
- Cai, Y.; Irtija, N.; Tsiropoulou, E.E.; Veneris, A. Truthful Decentralized Blockchain Oracles. Int. J. Netw. Mgmt 2021, e2179. [Google Scholar] [CrossRef]
- Gyöngyi, Z.; Garcia-Molina, H.; Jan, O. Pedersen: Combating web spam with trustrank. In Proceedings of the International Conference on Very Large Data Bases, Toronto, ON, Canada, 29 August–3 September 2004. [Google Scholar]
- Meo, P.D. Trust prediction via matrix factorisation. Acm Trans. Internet Technol. 2019, 19, 1–20. [Google Scholar] [CrossRef]
- Balmau, O.; Guerraoui, R.; Kermarrec, A.; Maurer, A.; Pavlovic, M.; Zwaenepoel, W. Limiting the spread of fake news on social media platforms by evaluating users’ trustworthiness. arXiv 2018, arXiv:1808.09922. [Google Scholar]
- Halpern, D.; Valenzuela, S.; Katz, J.; Miranda, J.P. From belief in conspiracy theories to trust in others: Which factors influence exposure, believing and sharing fake news. In Proceedings of the International Conference on Human-Computer Interaction, Orlando, FL, USA, 26–31 July 2019. [Google Scholar]
Figure 1.
An example of information cascade on Twitter.

Figure 2.
An example of fake news spreading on Twitter and follower graph converted from cascade network.
Figure 2.
An example of fake news spreading on Twitter and follower graph converted from cascade network.

Figure 3.
The architecture of our MUFFLE framework.

Figure 4.
The architecture of social network component.

Figure 5.
The architecture of user timeline component.

Figure 6.
Word cloud visualization of news terms in dataset (left: all terms, right: terms having high TF-IDF value).
Figure 6.
Word cloud visualization of news terms in dataset (left: all terms, right: terms having high TF-IDF value).

Figure 7.
The distribution of labels (i.e., cascade size).

Figure 8.
Comparison of performance for hit rate.

Figure 9.
Comparison of performance for NDCG.

Figure 10.
Individual component performance.

Figure 11.
Hit rate performance of different component combinations.

Figure 12.
NDCG performance of different component combinations.

Figure 13.
Feature importance for each component.

Figure 14.
Visualization of high frequency terms in news having different cascade sizes.


Table 1.
The statistics of FakeNewsNet—PolitiFact dataset.
| Properties | Values |
|---|---|
| # Fake news | 376 |
| # Fake news having related tweets | 339 |
| # Users | 143,125 |
| # Source Tweet (# Cascades) | 119,009 |
| # Retweet | 106.243 |
Table 2.
Text length statistics of dataset.
| Properties | Min | Median | Average | Max |
|---|---|---|---|---|
| News title length | 6 | 12.67 | 38 | 12 |
| News content length | 31 | 311 | 439.51 | 5650 |
| Tweet length | 2 | 18 | 18.02 | 72 |
Table 3.
Graph structural statistics of social networks constructed from tweet cascade in dataset.
| Properties | Min | Median | Average | Max |
|---|---|---|---|---|
| Avg. out-degree | 0 | 0 | 29.54 | 0.08 |
| Avg. out-degree | 0 | 0 | 89 | 0.29 |
| Avg. out-degree | 0 | 0 | 29.54 | 0.08 |
| Avg. out-degree | 0 | 0 | 77 | 0.21 |
| 1 | 1 | 163 | 1.87 | |
| 0 | 0 | 2748 | 1.39 |
Table 4.
The performance comparison for fake news popularity prediction.
| Method | HR @ 1P | HR @ 5P | HR @ 10P | HR @ 15P | NDCG @ 1P | NDCG @ 5P | NDCG @ 10P | NDCG @ 15P | MAE | MSE |
|---|---|---|---|---|---|---|---|---|---|---|
| Historical Mean | 0.8% | 0.08% | 0.08% | 0.05% | 0.0286% | 0.0769% | 0.1248% | 0.1666% | 1.56% | 41.26% |
| Historical Median | 0.8% | 0.08% | 0.08% | 0.05% | 0.0286% | 0.0769% | 0.1248% | 0.1666% | 0.93% | 42.12% |
| XGBoost | 70.94% | 71.45% | 68.88% | 68.66% | 0.7385% | 0.8400% | 0.8575% | 0.8574% | 1.23% | 43.87% |
| CasCN | 20.51% | 49.23% | 46.83% | 45.07% | 0.1955% | 0.4604% | 0.5156% | 0.5436% | 1.71% | 43.39% |
| Ours | 82.05% | 76.23% | 80.42% | 79.14% | 0.8137% | 0.8758% | 0.8979% | 0.8942% | 1.71% | 67.33% |
Table 5.
The performance comparison for fake news popularity prediction.
| Combination | HR @ 1P | HR @ 5P | HR @ 10P | HR @ 15P | NDCG @ 1P | NDCG @ 5P | NDCG @ 10P | NDCG @ 15P | MAE | MSE |
|---|---|---|---|---|---|---|---|---|---|---|
| SN + ST | 49.57% | 53.33% | 58.71% | 54.70% | 0.5919 | 0.6410 | 0.6487 | 0.6477 | 1.64 | 41.39 |
| SN + UP | 71.79% | 61.53% | 53.58% | 47.57% | 0.7746 | 0.8458 | 0.8356 | 0.8288 | 1.67 | 63.09 |
| SN + UT | 76.06% | 64.44% | 59.05% | 54.13% | 0.7709 | 0.8347 | 0.8473 | 0.8451 | 1.61 | 65.29 |
| SN + ST + UP | 74.35% | 68.71% | 65.29% | 58.91% | 0.7566 | 0.8448 | 0.8546 | 0.8494 | 1.69 | 67.54 |
| SN + ST + UT | 78.63% | 68.37% | 65.81% | 58.23% | 0.7743 | 0.8540 | 0.8602 | 0.8539 | 1.64 | 65.72 |
| SN + UP + UT | 76.92% | 66.32% | 65.98% | 59.03% | 0.7848 | 0.8601 | 0.8750 | 0.8692 | 1.79 | 69.15 |
| ALL | 82.05% | 76.23% | 80.42% | 79.14% | 0.8137 | 0.8758 | 0.8979 | 0.8942 | 1.71 | 67.33 |
Table 6.
User statistics of two source tweets having large and small cascade sizes.
| Cascade Size = 101 | Cascade Size = 1 | ||
|---|---|---|---|
| User Profile | # Followers | 156,218 | 3 |
| # Followers | 4021 | 832 | |
| # Followers | 5224 | 1 | |
| # Followers | 2047 | 472 | |
| User Timeline | Avg. retweets | 11,704 | 9249 |
| Avg. favorites | 35,308 | 0 | |
| Avg. sentences | 9 | 1 |
Listed: The number of public lists that the user is a member of.
Table 7.
News statistics of two source tweets having large and small cascade sizes.
| Cascade A Size = 33 | Cascade Size B = 1 | |||
|---|---|---|---|---|
| Body text | Sentiment score | 0.5233 | 0.9959 | |
| Sentimental word proportion | 0.09 | 0.086 | ||
| Title | Sentiment score | −0.1531 | −0.5514 | |
| Sentimental word proportion | 0.22 | 0.13 | ||
Publisher’s Note: MDPI stays neutral with regard to jurisdictional claims in published maps and institutional affiliations. |
© 2022 by the authors. Licensee MDPI, Basel, Switzerland. This article is an open access article distributed under the terms and conditions of the Creative Commons Attribution (CC BY) license (https://creativecommons.org/licenses/by/4.0/).
Share and Cite
MDPI and ACS Style
Wu, C.-L.; Hsieh, H.-P.; Jiang, J.; Yang, Y.-C.; Shei, C.; Chen, Y.-W. MUFFLE: Multi-Modal Fake News Influence Estimator on Twitter. Appl. Sci. 2022, 12, 453. https://0-doi-org.brum.beds.ac.uk/10.3390/app12010453
AMA Style
Wu C-L, Hsieh H-P, Jiang J, Yang Y-C, Shei C, Chen Y-W. MUFFLE: Multi-Modal Fake News Influence Estimator on Twitter. Applied Sciences. 2022; 12(1):453. https://0-doi-org.brum.beds.ac.uk/10.3390/app12010453
Chicago/Turabian StyleWu, Cheng-Lin, Hsun-Ping Hsieh, Jiawei Jiang, Yi-Chieh Yang, Chris Shei, and Yu-Wen Chen. 2022. "MUFFLE: Multi-Modal Fake News Influence Estimator on Twitter" Applied Sciences 12, no. 1: 453. https://0-doi-org.brum.beds.ac.uk/10.3390/app12010453
Note that from the first issue of 2016, this journal uses article numbers instead of page numbers. See further details here.