
A Novel Embedding Model Based on a Transition System for Building Industry-Collaborative Digital Twin


1
Department of Smart Factory Convergence, Sungkyunkwan University, 2066 Seobu-ro, Jangan-gu, Suwon 16419, Korea
2
Department of Systems Management Engineering, Sungkyunkwan University, 2066 Seobu-ro, Jangan-gu, Suwon 16419, Korea
*
Author to whom correspondence should be addressed.
Appl. Sci. 2022, 12(2), 553; https://0-doi-org.brum.beds.ac.uk/10.3390/app12020553
Submission received: 13 December 2021
/
Revised: 28 December 2021
/
Accepted: 5 January 2022
/
Published: 6 January 2022
(This article belongs to the Special Issue Artificial Intelligence in Machine Learning Approaches for Smart Manufacturing)
Abstract
:Recently, the production environment has been rapidly changing, and accordingly, correct mid term and short term decision-making for production is considered more important. Reliable indicators are required for correct decision-making, and the manufacturing cycle time plays an important role in manufacturing. A method using digital twin technology is being studied to implement accurate prediction, and an approach utilizing process discovery was recently proposed. This paper proposes a digital twin discovery framework using process transition technology. The generated digital twin will unearth its characteristics in the event log. The proposed method was applied to actual manufacturing data, and the experimental results demonstrate that the proposed method is effective at discovering digital twins.
1. Introduction
As the complexity of manufacturing systems increases alongside rapid changes in recent consumption trends, forecasting to prevent future losses is becoming more important. A lot of research is being done on this related technology, and among them, digital twins technology is considered as an important core component of Industry 4.0. In particular, this technology makes process predictions possible through digital data, not just physical implementations [1]. The output of these digital twins can provide important indicators for long term and short term decision-making in the manufacturing process.
A lot of research on digital twins is being conducted, and recently, approaches using process mining have become popular. However, there are more specialized studies for business processes than manufacturing technology, and research using process mining technology to create a digital twin of the manufacturing industry is insufficient. It is necessary to be able to create digital twins using event log data to make appropriate decisions for manufacturing operations using the vast amounts of data generated in the manufacturing process. In this paper, we propose a digital twin discovery model that can predict the remaining cycle time, which is an important indicator in manufacturing environments, using event log data.
Process characteristics are extracted through embeddings based on transition technology of event log data with activity and Class Id. Extracted data are used to uncover digital twin models that predict the manufacturing remaining cycle times. In this way, this study solves the problem of determining the time required to terminate the remaining processes based on the execution log data of the previously completed processes. We intend to solve this problem using the GRU(Gated Recurrent Unit) artificial intelligence model.
In this paper, we devised a digital twin model that predicts the remaining cycle time of a manufacturing system using event log data, and propose a cloud type architecture using this setup. There are three main contributions of our study.
- (1)
- Transition system based embedding technology to easily extract process characteristics from event logs is proposed, and this technology can help interpret numerous log data accumulated by manufacturing companies.
- (2)
- Creating a digital twin model requires a lot of technology and is costly, and in most cases additional professional manpower and costs are required to reflect real data in the created twin. In this paper, we tried to implement this process through artificial intelligence learning, and it can satisfy the need for cost reduction.
- (3)
- By providing a cloud computing style digital twin architecture, our setup can help small companies with insufficient technical skills to realize digital twin methods.
The rest of this thesis is structured as follows. Section 2 describes digital twins and introduces research that links process mining to digital twins. Section 3 provides a description of the components of the proposed approach and the main idea of this study, as well as describes the transition embedding digital twin model proposed in this paper. Section 4 describes the experimental environment, the structure of the data set, and the experimental results. Section 5 concludes the paper with a summary of the paper, evaluation results, and future research directions.
2. Related Work
2.1. Digital Twin Overview
With the transition to Industry 4.0, technologies such as data collection, storage, and communication have developed rapidly, and these developments have made it possible to check the field conditions through data [2]. This means that a digital twin using data from the manufacturing system can be linked with the real environment in real time [3]. Digital twin models created using these data can help solve traditional elusive problems by mirroring manufacturing environments. With the development of cloud computing, IoT technology, and manufacturing systems, a new paradigm for making decisions based on big data has emerged [4].
Recently, there is a growing trend of research on the implementation of digital twins for physical assets of smart factories, and Industry 4.0 aims to develop a smart factory that can meet the rapidly changing needs of customers at a lower cost [5]. In this environment, digital twins provide better decision-making and prediction in manufacturing, as well as meaningful insights into decision-making in the manufacturing process [6]. Digital twin technology can also reduce the potential risks associated with planning manufacturing processes without physical awareness. Digital twin related researchers predict that, after reducing these risk factors, many of the major industry players will utilize digital twin technology to increase manufacturing efficiencies by 10.
Early models of digital twins were used for the manufacture and repair of aircraft with numerous parts. Digital twins were also a technology that could predict the lifespan of an aircraft, which directly affects many people by maintaining the integrity of the product. A conceptual model that can predict the lifespan of aircraft structures has additionally been presented [7]. Since then, research to use digital twins in the manufacturing field has been continually conducted, including on digital twin configurations using physical workspaces, virtual workspaces, and data [8]. In addition, Luo showed that there is an advantage to creating digital twins through real time data collection and applying decisions made based on this approach to actual SMEs [9]. In the manufacturing process, digital twins can directly run and review things that cannot be executed at the actual manufacturing site through the virtual manufacturing process. Additionally, they help with operation during the manufacturing process through various insights gained experimentally.
Figure 1 is a visual representation of the digital twin framework. Real-time data created during the manufacturing processes of smart factories implemented in the real world are collected through multiple sensors, and interpretation of these data is used to make decisions by considering big data. Using big data, the machine learning process is carried out, and the digital twin model created through this process is used to implement scenarios that cannot be applied in the real world due to excessive costs. As shown in the figure, the results of the scenario are transmitted to the decision maker for the smart factory manufacturing process for decision-making, and the decision maker can use the indicator to provide more appropriate and efficient instructions.
Physical asset information can be collected in real time with the development of IoT technology, and this information is shared in a cloud computing environment, leading to a digital transformation that can improve flexibility in product creation. To enable real time interworking of such information, some degree of abstraction is required to calculate the actual phenomenon [10]. In addition, stable data processing and transmission speeds are required to provide advice and insight into decision-making through the mirror model, where this technology can bridge the physical and digital worlds [11]. Research on an environment that can handle digital twins is needed such as cloud computing [12].
Cloud computing refers to Internet based computing where programs are placed on virtualized servers on the Internet and used whenever necessary. Cloud computing can help focus on manufacturing operations because you can use servers that are already in place without considering the costs of location infrastructure for storing servers [13]. In addition, since the customer pays only for the amount of data used in the cloud service, it can provide high efficiency for service operation. Partners have the advantage of being able to create new services through the cloud even without technical skills and use high efficiency technology for investments through high quality servers. During the process of creating a digital twin environment for a smart factory, if the cloud is used as shown in the figure, there is no current technology to directly and properly implement a digital twin. Even if there is appropriate technology, hiring an employee who can continually manage the infrastructure of small and medium sized enterprises (SMEs) costly, making the implementation of digital twins in the cloud space difficult.
This method implements new scenarios in manufacturing processes at a low cost by building a digital twin via the cloud for small and medium sized enterprises (SMEs) that lack staff to manage costs or infrastructure. Additionally, this approach obtains information for medium and short term operation in the real world. It provides a new option for obtaining meaningful indicators that can be used for decision-making.
2.2. Log Data Analysis
Real time prediction in digital twins helps with making appropriate decisions in short and medium term scenarios based on the current state of the process, and uses digital systems in a virtual space rather than manufacturing systems in a real space [14]. In such a smart factory, process prediction technology can be used to analyze and evaluate the production line before implementing the process offline. It can also be used as a proactive model to prevent risk factors that may occur in the process. By using these two methods, managers who set the plant’s operation plan can make more efficient and reliable decisions, and it is possible to prevent plans from being negatively affected by unexpected external factors. In recent years, the demand for customized products has increased significantly in the market, and accordingly, the manufacturing process is also changing at a rapid pace. The existing approaches to digital twins are based on a model structure manufactured by company or consulting experts. However, recent research has focused on data driven technologies such as event log data rather than expert consulting, which requires a relatively long time and a large cost to respond to the rapidly changing consumption structure and system characteristics. Research using the process mining method to track and determine various characteristics is becoming more popular [15]. Process mining techniques can estimate the relationship between the change in outcome according to the state or parameters that implement the state. Therefore, process mining can be used to estimate the outcome or cause of a process in manufacturing scenarios [16]. Ref. [17] tried to determine why delays occurred by analyzing the event log data and using decision trees to find the cause of bottlenecks in the process. Ref. [18] tried to predict the next process based on events that occurred previously in a business process using a natural language processing model. Through this, the author tried to adjust the factors that hinder the operation of the process based on the process mining technique. Ref. [19] proposed a method for automatically discovering manufacturing systems and creating digital twins based on process mining. The author applied the proposed method to the actual manufacturing line and proved that the results were effective. The author of [20] tried to implement a digital twin using the process mining technique in building manufacturing, and through this, he tried to predict the factors that could fail in the current process. This enables tactical decision-making by preventing factors that disrupt the entire process in advance. Ref. [21] tried to implement a manufacturing digital twin based on process mining technology. In addition, the author tried to efficiently control the assets of the facility by combining RTLS (Realtime Locating System) with the digital twin. This led to optimization of the process operation and was intended to reduce the waste factor of operation.
As mentioned above, process mining technology can explain the correlation between process results and causes by considering event log data. Log data in the manufacturing process are accumulated in information systems at a faster and more rapid pace with the development of IoT technology. These data are recorded and stored on the server every day. Detailed documentation of these processes can help with predictions, but it remains difficult to fully understand the data. The log summarizes all processes generated in the manufacturing system as an event, and is structured in the format shown in Table 1. Activities are tracked according to a sequential order ID, which typically contains information such as a timestamp and associated costs, including the start time and end time. There may be multiple cases that follow the same trace, but each case is separate and considered as a different event. In theory, all processes, including manufacturing activities, can be saved as event log data considering the time dimension, and each activity can be tracked to describe the properties of the event.
Table 1 contains information on the type of product that a given machine operates and produces, including the name of the machine, the number of products, and the start and end times according to the case ID. Process mining, as described earlier, tracks and analyzes activities in these event log data. Process mining is currently used for many purposes, and although it has been frequently implemented in business processes, research using process mining technology in manufacturing processes has become more popular recently. In [22], the author explained the relationship between each activity in the system model, and used this to predict future activities based on previous activities by estimating the level of detail of the system model. In general, process mining attempts to predict a process by considering the process’s past events and the sequence of subsequent events. This paper also proposes a digital twin model that tracks past process and predicts the remaining process times for each state in the manufacturing process.
2.3. AI for Manufacturing
Modern digital twin models are moving away from traditional methods created by consulting with company experts and more towards machine learning approaches created using artificial intelligence. The data created in smart factories are vast and complicated. To learn such data, data processing is necessary, and research on it has continually developed. To link reality and virtual reality in real time using a digital twin, it is necessary to quickly create a digital twin model. The existing methods using expert opinions have difficulty quickly adapting to dynamically changing environment [23]. To solve this problem, we need a model that can quickly process complex and massive data.
Recent research on artificial intelligence has shown that it can solve these problems, and shows promise in industrial fields. The manufacturing process in an actual factory is very complex, and several studies have been conducted to implement digital models [24]. In particular, methods to better understand the manufacturing process have been studied. Today’s manufacturing industry integrates sensing, communication, big data analysis, and cloud computing technology to secure competitiveness, and this technological integration applied to manufacturing is referred to as a ‘smart industry’. In particular, smart manufacturing is regarded as a key to competitiveness, indicating the level of a country’s industrial manufacturing capacity [25]. The three key pillars of smart manufacturing are hyper convergence, hyper connection, and super intelligence. Artificial intelligence cannot be discussed without mentioning artificial intelligence while implementing a smart manufacturing system, that is, a smart factory, and artificial intelligence in industrial systems plays a key role [24]. The introduction of artificial intelligence into manufacturing systems can more efficiently analyze the big data that accumulates in the manufacturing industry, and meaningful results from this analysis help the efficient operation of the process. It can also provide an important indicator for introducing long term plans. This introduction of artificial intelligence into the manufacturing industry will enable efficient and intelligent use of manufacturing data [23]. Artificial intelligence can be broadly described as machine learning (ML) and deep learning (DL) which is one of the parts of machine learning. The analysis of data generated by these two sub technologies can generate useful information for evaluating manufacturing fixation. The results of this analysis can be used to improve the manufacturing process [26].
Along with artificial intelligence, the use of digital twins has also grown rapidly in recent years, and are considered a key supporting factor for Industry 4.0 [27]. In the manufacturing process, all state changes of physical objects are detected by sensors and used to analyze the manufacturing process. Artificial intelligence analyzes these complex and difficult data to extract usable data, and this AI technology makes it easier to project complex real world data into a virtual digital world. Advances in these technologies may accelerate the implementation of digital twins. In a smart factory manufacturing site, all equipment has up to thousands of sensors attached, leading to a lot of information being stored in a database. It is impossible for even the most experienced engineer to monitor and diagnose data from thousands of sensors in real time. However, by using artificial intelligence, it is possible to identify significant patterns in a large amount of data. For example, an AI model can help engineers by analyzing patterns and then raising an alert when it finds outlier data. Furthermore, if more interfaces are implemented, the AI model that generated the alarm can perform contribution analysis to self diagnose and even self repair whose sub digital twin has the problem. By using an artificial intelligence model, it is possible to reduce losses both in time and cost by predicting and responding to problems that can seriously affect production in advance. More of these digital twins can be combined to expand the scope of their use. Currently, they are being used within manufacturing plants, but can be expanded and modeled to include material management and shipment management [28]. There are cases of companies using AI based digital twins to provide solutions and receive funding. These include MAYA and IMPROVE, funded by the EU’s Horizon 2020 program, which emphasize the “smart factory of the future.” There is also KEEN in Germany, which focuses on artificial intelligence based solutions to complement and extend the capabilities of digital twins, as well as System X as described in [29]. According to a Gartner report, by 2021, half of all manufacturing enterprises will have digital twins, which will increase their effectiveness by 10% [30]. Digital twin technology provides improvements at every stage, which can reduce solution modeling time (up to 20%), reduce build time (up to 25%), improve document quality, and reduce the amount of design errors (up to 20%), which in medium to long term scenarios contributes to increasing a company’s sales and market share.
3. TED: Transition System Based Embedding for Digital Twin
3.1. System Architecture
This paper uses a cloud computing based digital twin framework to predict the remaining manufacturing cycle time, and solves the prediction problem through machine learning using a transition based embedding method. In addition, we propose a framework that can solve insufficient technical problems through collaboration with other companies.
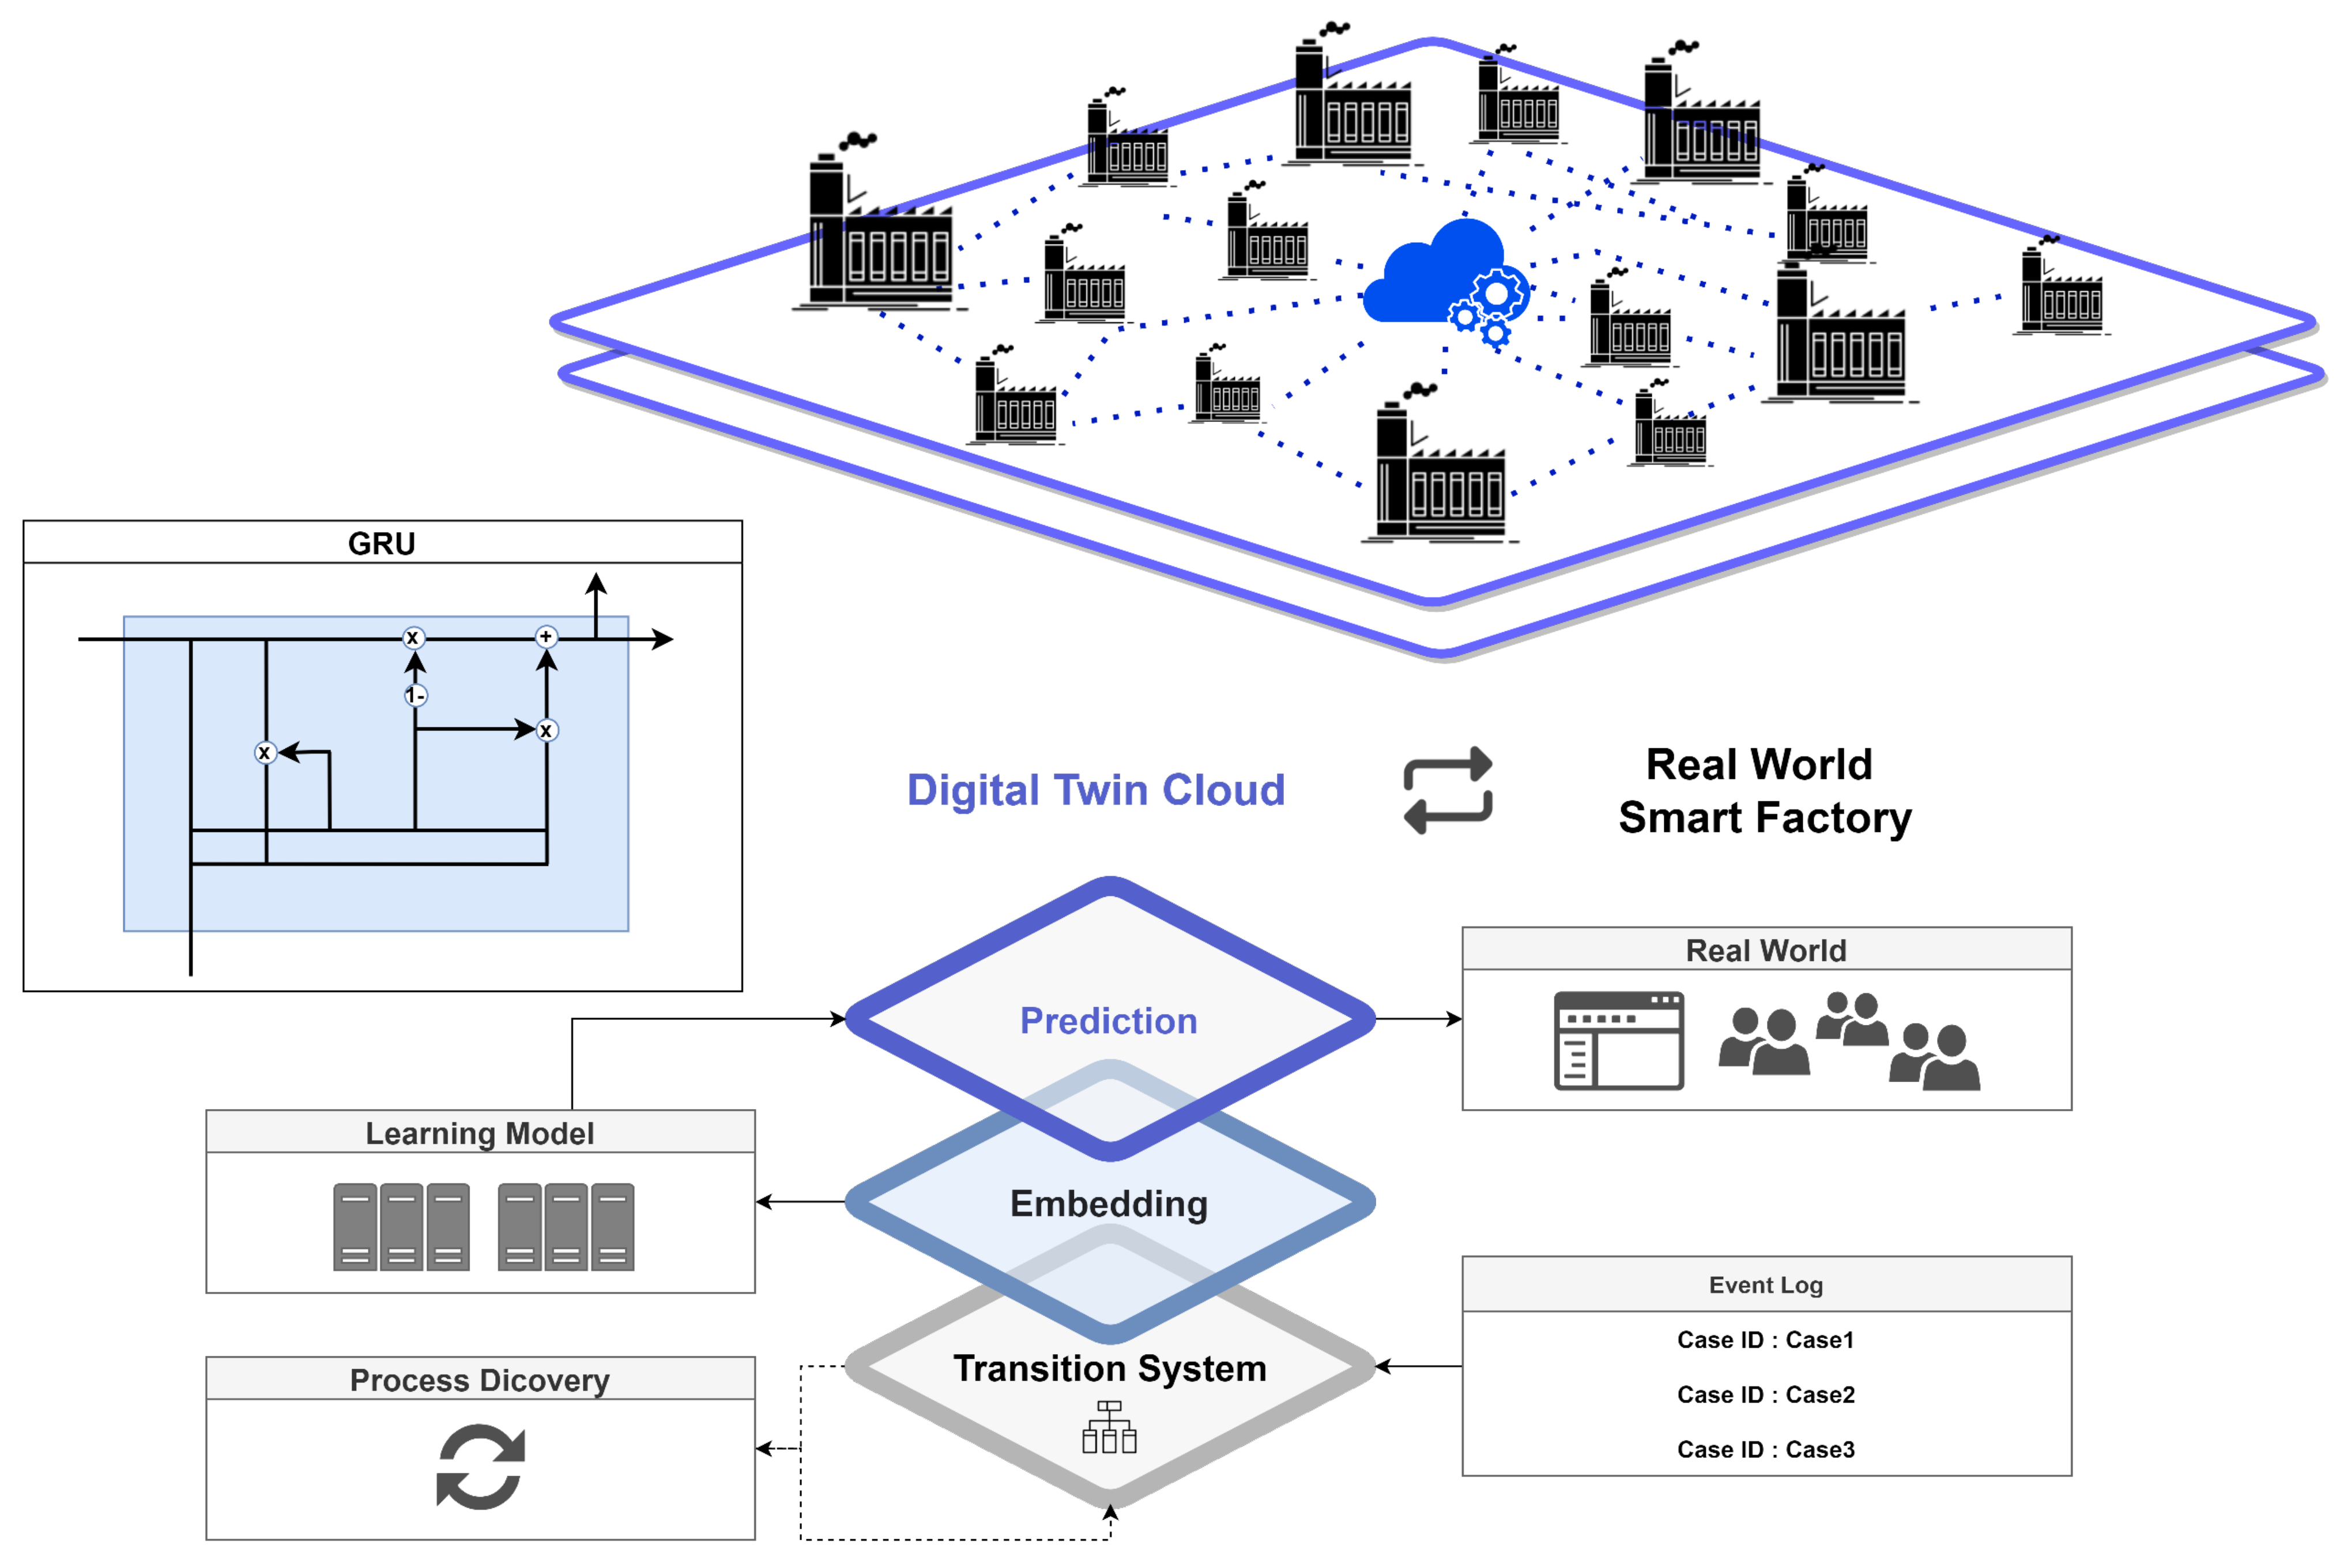
Herein, we propose a twin collaboration framework. Figure 2 illustrates a digital twin framework based on cloud computing. In this paper, after preprocessing data by tracking activities in the event log, machine learning is performed with a GRU based artificial intelligence model. We consider cloud based digital twins created through learning through the cloud, augmenting the artificial intelligence technology based on data provided by each company, allowing for the construction of precise digital twins through improved models.
We provide an integrated solution to implement digital twins in the form of pictures in smart factory manufacturing processes. A service provider receives event log data from a customer, creates a digital twin model suitable for the process, and when the customer wants to conduct experiments in the manufacturing process, creates a customer in the virtual environment of the digital twin model. The results of the experiment are delivered to the smart factory so that the customer can make a more correct mid to long term plan and operate the manufacturing process. The generated digital twin can create a more precise model while learning another customer’s dataset, and the customer can receive more reliable experimental results. In fact, most SMEs are unable to implement even a basic digital twin due to a huge lack of costs such as data analysis costs, server construction costs, and consulting costs. Most small and medium sized enterprises (SMEs) are unable to reap the many benefits of implementing a digital twin, and are often stuck in a low-level technology environment.Through this collaborative architecture that we propose, both service providers and customers can benefit, and it can provide more growth opportunities for small businesses in low-skill environments due to lack of skills to implement digital twins.
3.2. Modeling Procedures
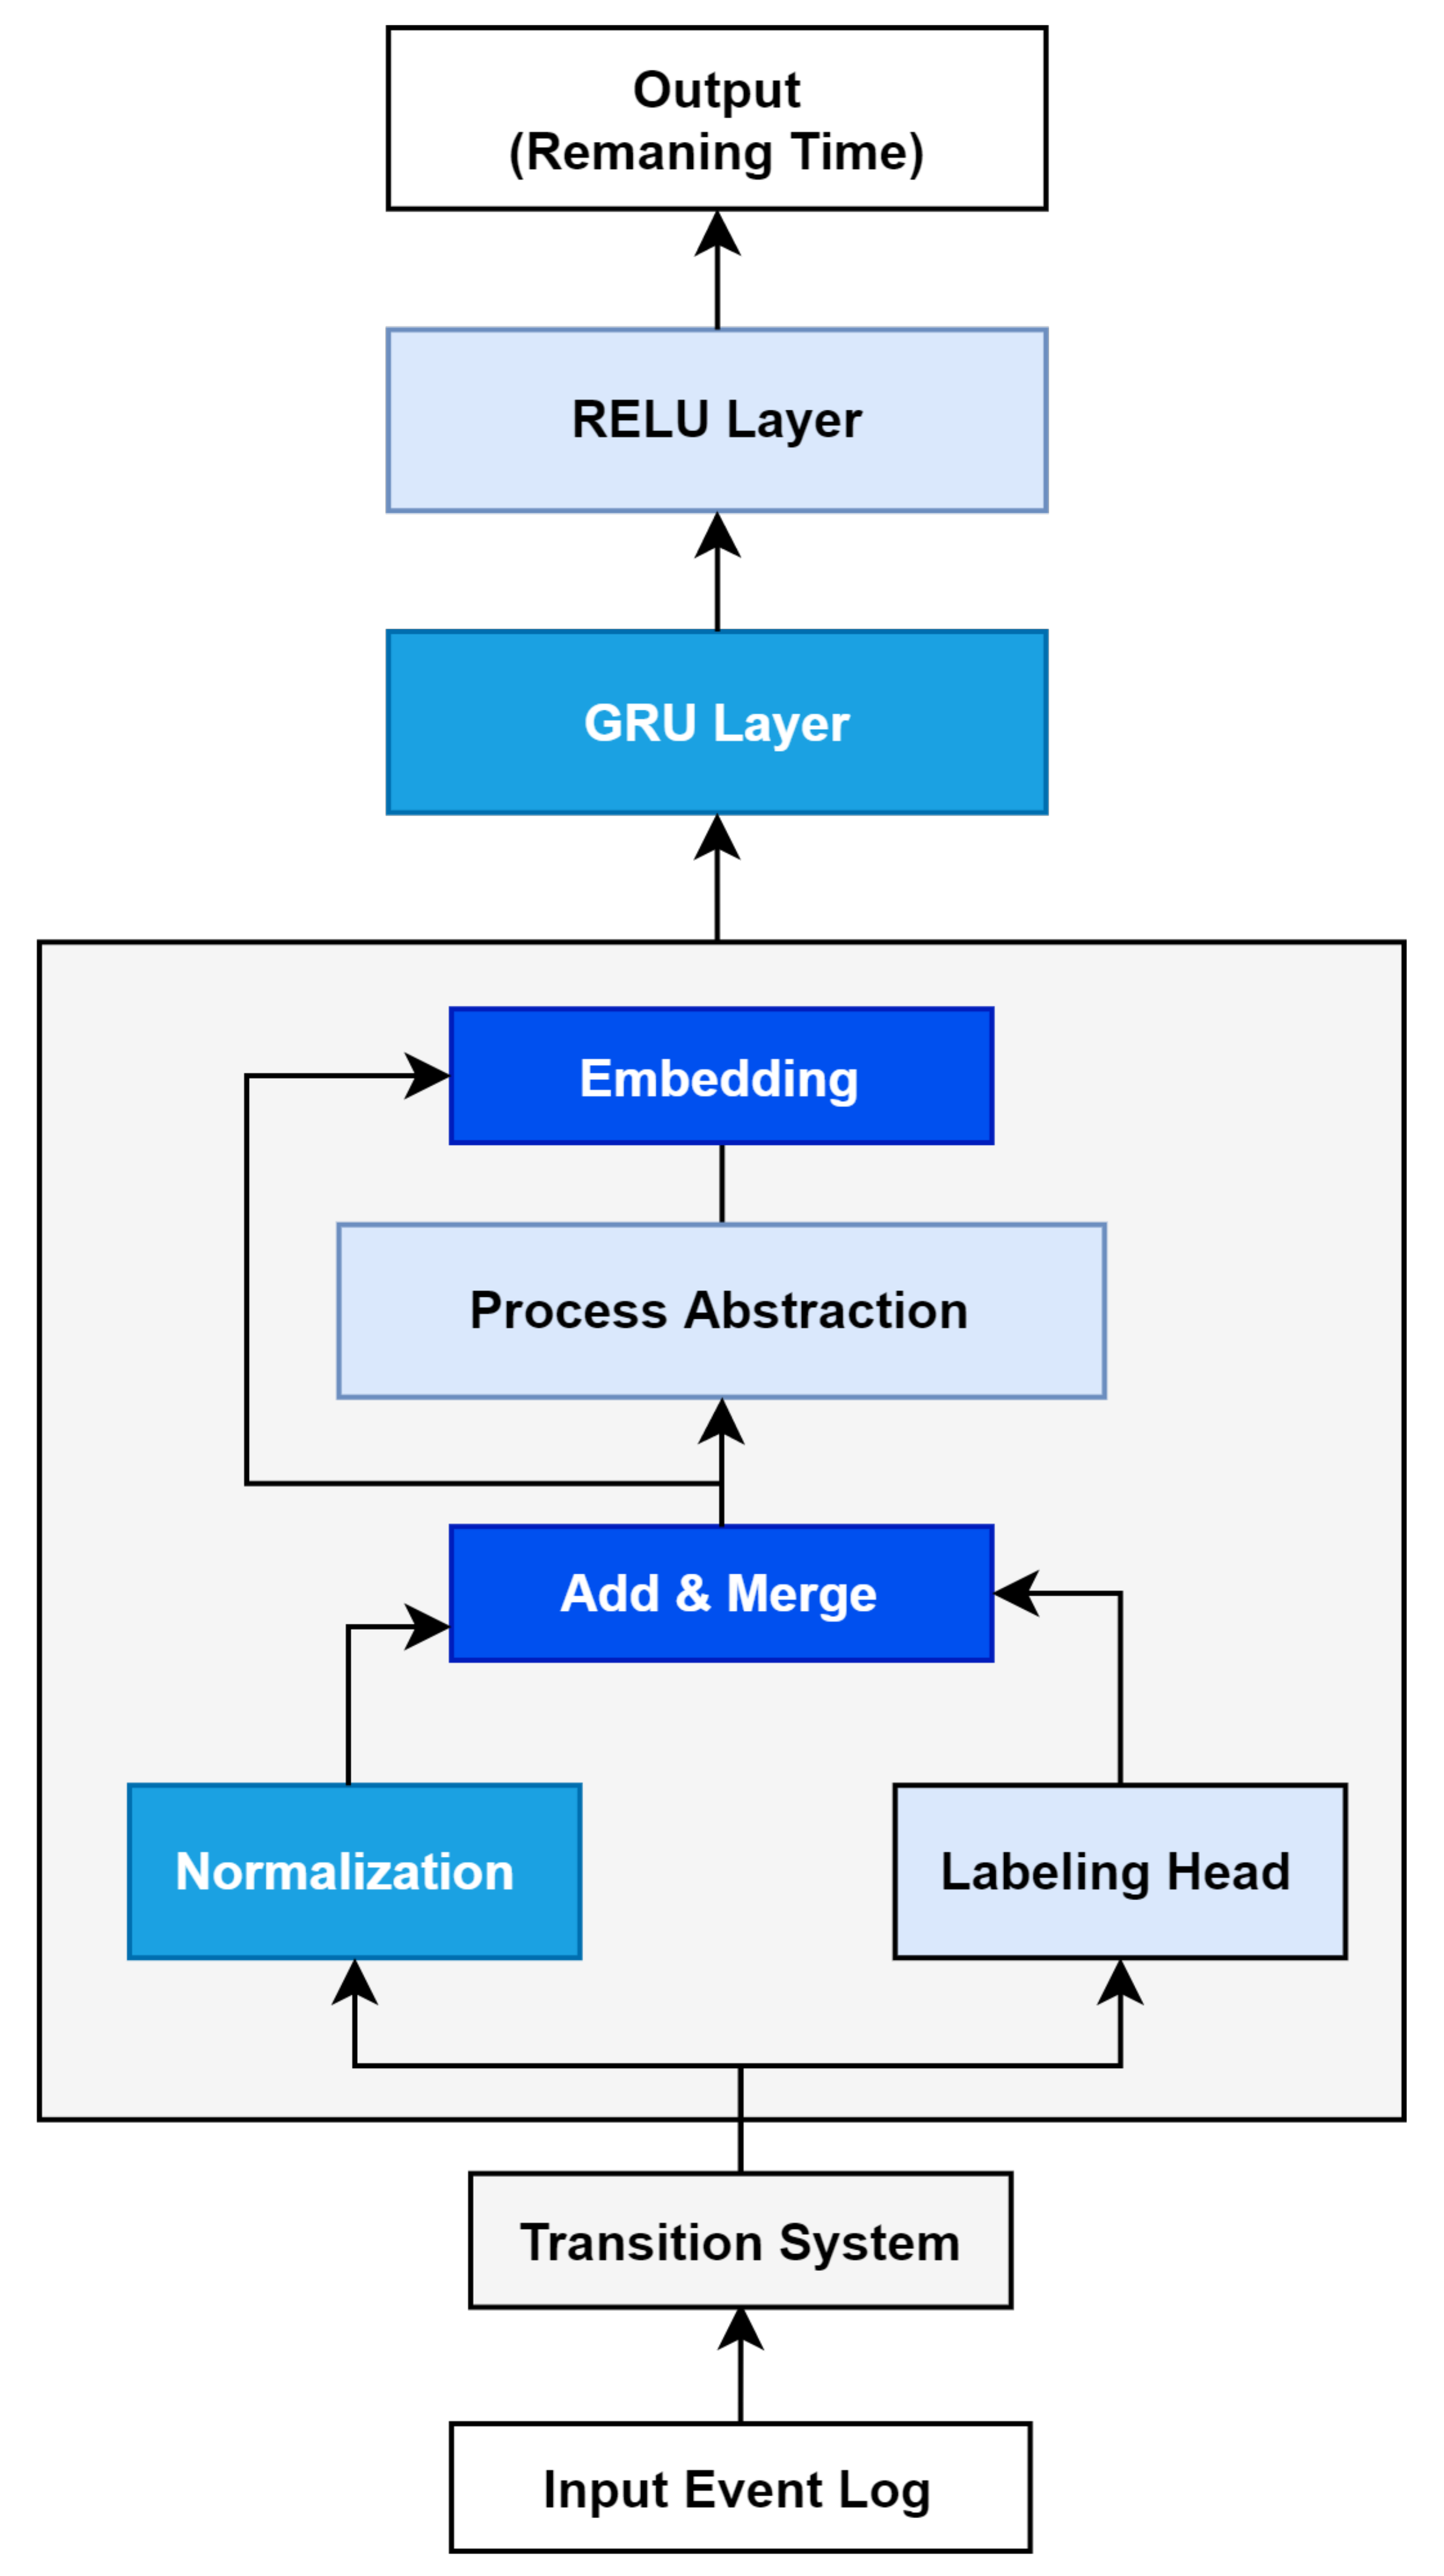
We use event logs to model digital twins. First, the activity of the manufacturing process is tracked in the event log, and the tracked activity is classified as a transition system. To proceed with machine learning using the classified data, the activity is newly mapped according to the sequence and embedding is carried out.
The name of the embedding model is TED (Transition System Based Embedding For Digital Twin). Figure 3 is an overview of the TED model. The manufacturing event log of the smart factory is injected into the model, and the output value is learned using a GRU neural network, an artificial intelligence model. Through the trained model, a digital twin that predicts the remaining cycle time in the process is created. By using the generated model, small factories of small and medium sized enterprises can also implement digital twins of the manufacturing process, helping bring factories closer to becoming a smart factories.
The data generated in the industrial process are collected through IoT sensors attached to the machine in the form of an event log including the activities and case IDs. The collected data are classified through the transition system (TS), and the TS layer describes all situations that can occur during the process. This transition relationship describes the transition from one state to another. It is expressed as a tree shaped graph explaining the direction. All transitions have start and end points, and the flow of these states can be expressed as a diagram as shown in Figure 4. The main purpose of this classification system is to understand the state of the process in detail and extract meaningful results that can improve operation of the plant based on the event log data.
As described in Figure TED, this paper collects all the names of all machines operating during product production based on the event log in the manufacturing environment and the transition system, and then maps them in order. At this time, the mapped states are collected and expressed as Process = <1,2,3,4>. Based on the state information collected in the process cases, a relationship based on a Petri net can be constructed as shown in Figure 4.
Each node in Figure 4 represents the product creation process and status in the manufacturing process. Each node is a mapping of the machine name that the product was produced from. For example, 1,2 represents a state that went through Machine 1 and Machine 2, while 1,3,2 represents a state for Machine 1 and Machine 2 such that Machine 3 has been passed.
To determine the remaining cycle time of the manufacturing process through the transition system, the time remaining until the corresponding instance is terminated is estimated based on the process information for each tracked process. For example, if one process takes a total of 4 h, 3 h are left in the case of Machine 1, and 2 h are left in the case of Machine 2. When Machine 3 starts, the remaining processing time is 2 h. The remaining processing time can be calculated using the following method. The remaining process cycle time is first mapped, then the remaining time until the final process according to each state is predicted based on the record.
Using Table 1 as log data, we will explain this method by showing an example of estimating the remaining cycle time in the manufacturing process. For each case ID, the start time of the product is set to 0, and the manufacturing process time is normalized as shown in Figure TED. After calculating the end time based on the start time, the remaining time until the end of the process is tracked for each state.
Table 2 shows the normalized remaining cycle time in the manufacturing process using the data tracked in Table 1. The number at the top of the trace column represents the progress of the manufacturing process time according to the state. By designating the start time of the first machine in the tracked state as “0” as in the following table, the start time of all machines is normalized, and the remaining process time can be expressed. In Table 1, the time expressed as 3 July 2021: 13:00 is considered as 0, i.e., the start time of the process, so the start time of Machine 2, 3 July 2021: 13:20 is 0 minus the normalized start time. Here, 20 is the processing time of Machine 1. That is, the second machine started 20 min after the first machine was operated, and the process ends at 3 July 2021: 14:30, where the end time indicates the total processing time of the product. The end time of the first case ID in Table 2 is 90. That is, the difference between the end time of the last machine and the start time of the first machine is expressed in minutes (3 July 2021: 14:30–3 July 2021: 13:00) and calculated as follows.
This paper creates a digital twin via artificial intelligence based on a data set classified using the transition system shown in Figure 3. For machine learning, the normalized data are tracked in the database according to the machine operation process situation, and the newly tracked data are output in a vector format. Each element of the vector is an integer indicating the operation of the machine, and the O1 Case ID in Table 2 is coded as in Table 3 below.
The columns in Table 3 represent the number of each machine for production, and each machine number is assigned 0 or 1 based on whether the machine is operated or not. To calculate the remaining time for each product to be produced, the progress time for each state calculated in the previous table is subtracted from the end time and divided by the number of products. The formula for this calculation is as follows:
Using the method explained through the following execution example, vectorization of all states of the event log is carried out to make a data set that can train an artificial intelligence neural network, embedding and retaining time as a Y vector in deep learning learning. Using the vectorized matrix according to tracking as an X vector, learning is carried out with the GRU artificial intelligence layer as shown in the TED picture. The next section describes the AI model used for learning in this paper.
3.3. Training Procedures
Since the model proposed in this paper is a digital twin based on regression analysis, we used the MAE (mean absolute error) as a performance indicator of the learning model and used a GRU model suitable for training ordered data. The TED model presented in this paper uses event log data, as shown in Figure TED, which is input into a transition system based embedding process and is trained on the GRU neural network layer. The residual cycle value of the manufacturing process according to the subsequent state is predicted using the GRU neural network training model proposed in [31].
The GRU model in Figure 5 is a type of RNN(Recurrent Neural Network). It is very similar to LSTM (long short term memory), a model that can effectively learn sequential data, but has a relatively simpler structure than LSTM.
As Figure 6 shows, the purpose of the Reset Gate is to properly remove past information. Multiplying the previous hidden layer by a value between 0 and 1, the output value of the sigmoid function is used to create the next layer:
As Figure 7 shows, the update gate is a combination of a forget gate and input gate of LSTM. In the update gate, the resulting output of the sigmoid function determines the amount of information at the present time, and the value subtracted from 1 is multiplied by this information in the hidden layer of the previous layer. Each layer is similar to the input gate and forget gate of LSTM.
The candidate step shown in Figure 8 calculates the information candidates at the present time. The key is not to use information from previous hidden layers as it is, but to first multiply and use the results of the reset gate:
Here, is a tangent hyperbolic and ∗ is a pointwise operation.
Finally, by synthesizing the update gate result and the candidate results, the hidden layer at the current time is calculated as described in Figure 9. As mentioned earlier, the result of the sigmoid function determines the amount of information at the present time, and the result of unity minus this sigmoid function determines the amount of information in the past:
The clear advantage of GRU compared to LSTM is that it uses an update gate that combines the forget gate and input gate of the LSTM, so that the learning weight is relatively small compared to the LSTM [31].
4. Experiments and Results
4.1. Experiment Environment
For configuration of the model proposed in this paper, an experiment was conducted using an Intel core i7, 64 GB RAM, and GeForce 1660TI environment. In addition, to create a deep learning network model, the Keras Python library was used for implementation.
Table 4 expresses the configuration parameters of the GRU neural network, and the experiment was conducted with epochs of 1000 and a batch size 40. AdaGrad was used as an optimization function for optimization, and a GRU neural network of 128 units was trained on the real world dataset.
4.2. Real World Dataset
This paper used event log data from real world process data. The datasets of the factory that the paper is analyzing can be accessed at [32]. This real world factory produces metal parts such as ball nuts and wheel shafts. With this production process, we have 28 machines for milling, wire cutting, laser marking, round grinding, flat grinding, turning, turning and milling, and lapping. Table 5 shows some of the event logs.
Table 5 shows 106 sets of cases from the data sets. The activity name in the table simply expresses the name of the actual process included in the log data [32]. Each case includes the type of machine used, the start and end times of activities, and the number of manufactured products. The quantity of products to be manufactured is also used as an important factor, and this variable distinguishes cases where the same product is produced by the same set of machines but with a different number of productions. In the absence of these data, bias may occur. These data describe the process of producing 31 products. We use the transition based embedding method proposed earlier to map the event log data into a vector format, and then proceed with modeling through artificial intelligence. After manufacturing residual cycle prediction modeling is completed, the model of the training dataset and the model of the testing dataset are compared to demonstrate the model being appropriate, where we implemented the MAE:
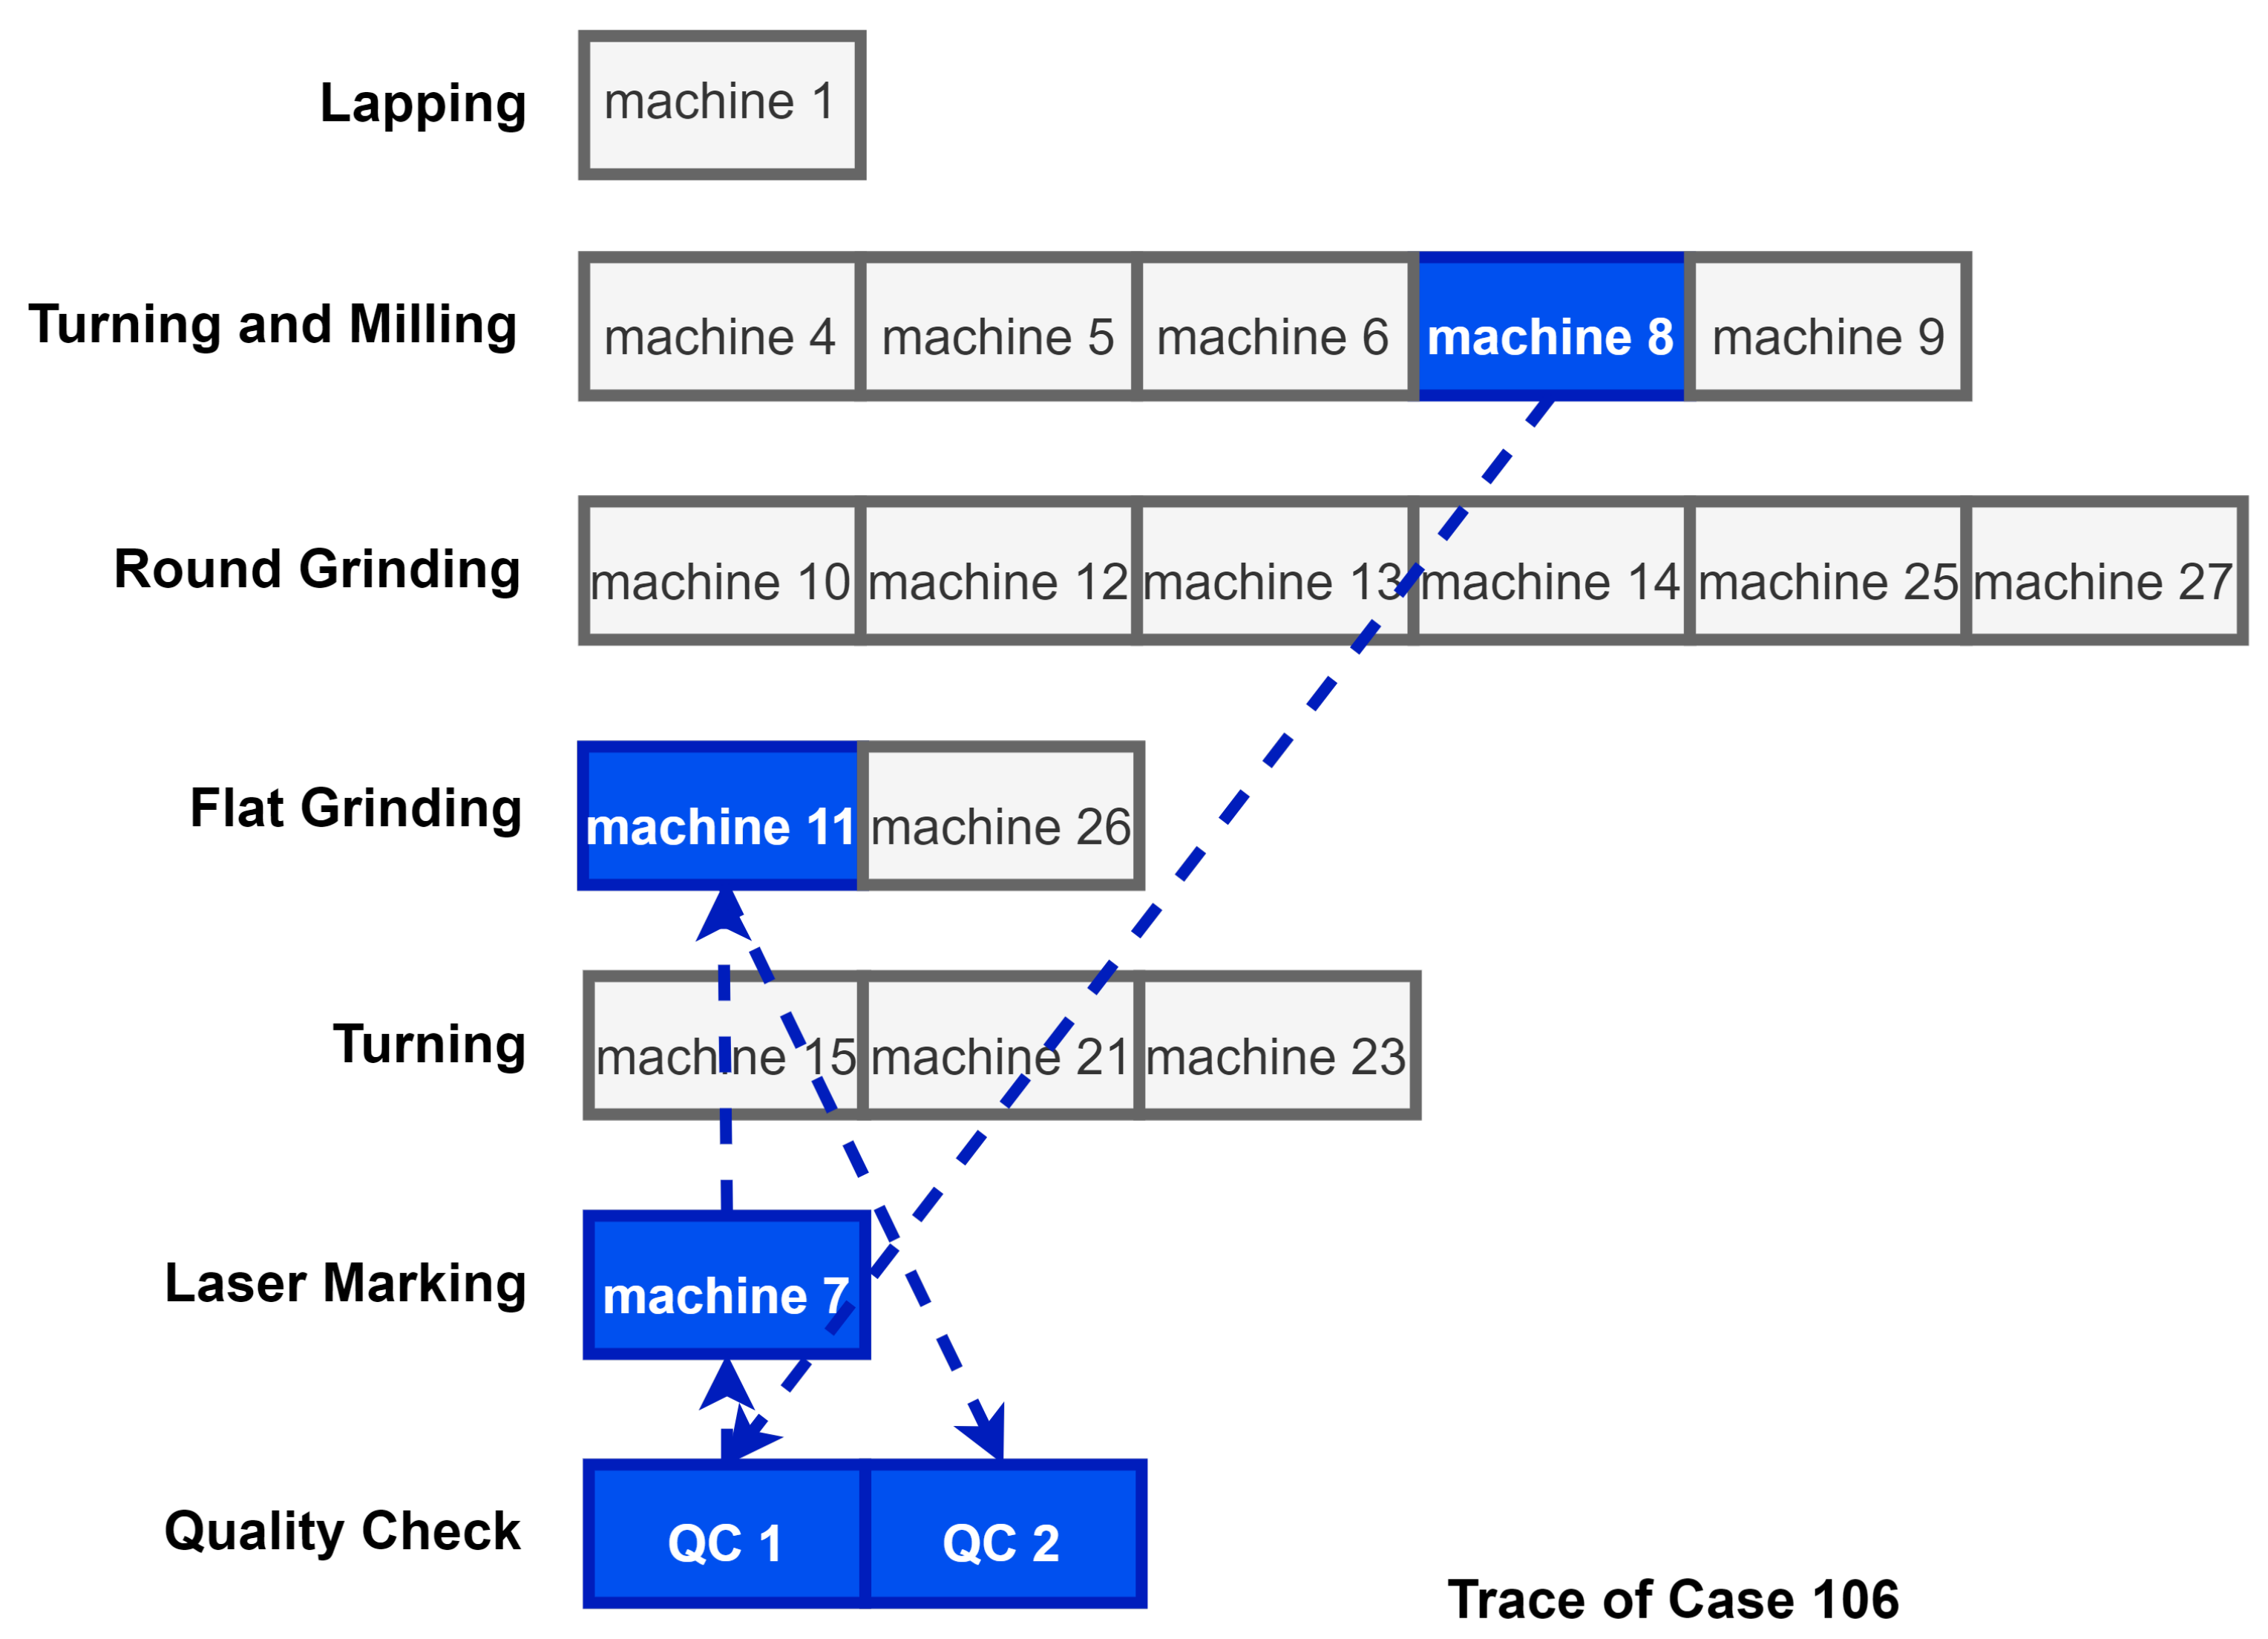
Figure 10 visually expresses the flow of the process at the manufacturing site, as well as how the activities in Table 5 proceed. This figure visually expresses the trace of case 106 described in the previous table, where this process starts from Machine 8 and proceeds along the blue dotted line. Each process is finally terminated with QC2. The following process is a relatively simple process, but since a smart factory process is very complex, it may be difficult to train an artificial intelligence neural network [19]. This is because it can interfere with the creation of a valid digital twin with repeated activities that interfere, making it difficult to understand. In this paper, to create a more meaningful digital twin model, in the case of a repeated process, the process was abstracted and considered as one activity.
4.3. Model EvaluationResults
This section shows that the approach proposed in this paper can produce meaningful results. This paper used three AI algorithms for AI learning. The most basic models of MLP (multi layer perceptron), LSTM, and GRU were used, and learning was carried out with a hyper parameter with a batch size of 40, number of epochs of 1000, and learning rate of 0.001. As an evaluation index, an evaluation was conducted based on the aforementioned MAE. As a result, when comparing the training data model and the testing data model for all three models, we found that the MAE change in value according to the increase in epochs is similar, which shows that it is an accurate model that it is not overfitted to one side. In addition, all three models showed convergence close to 0.1 (hours).
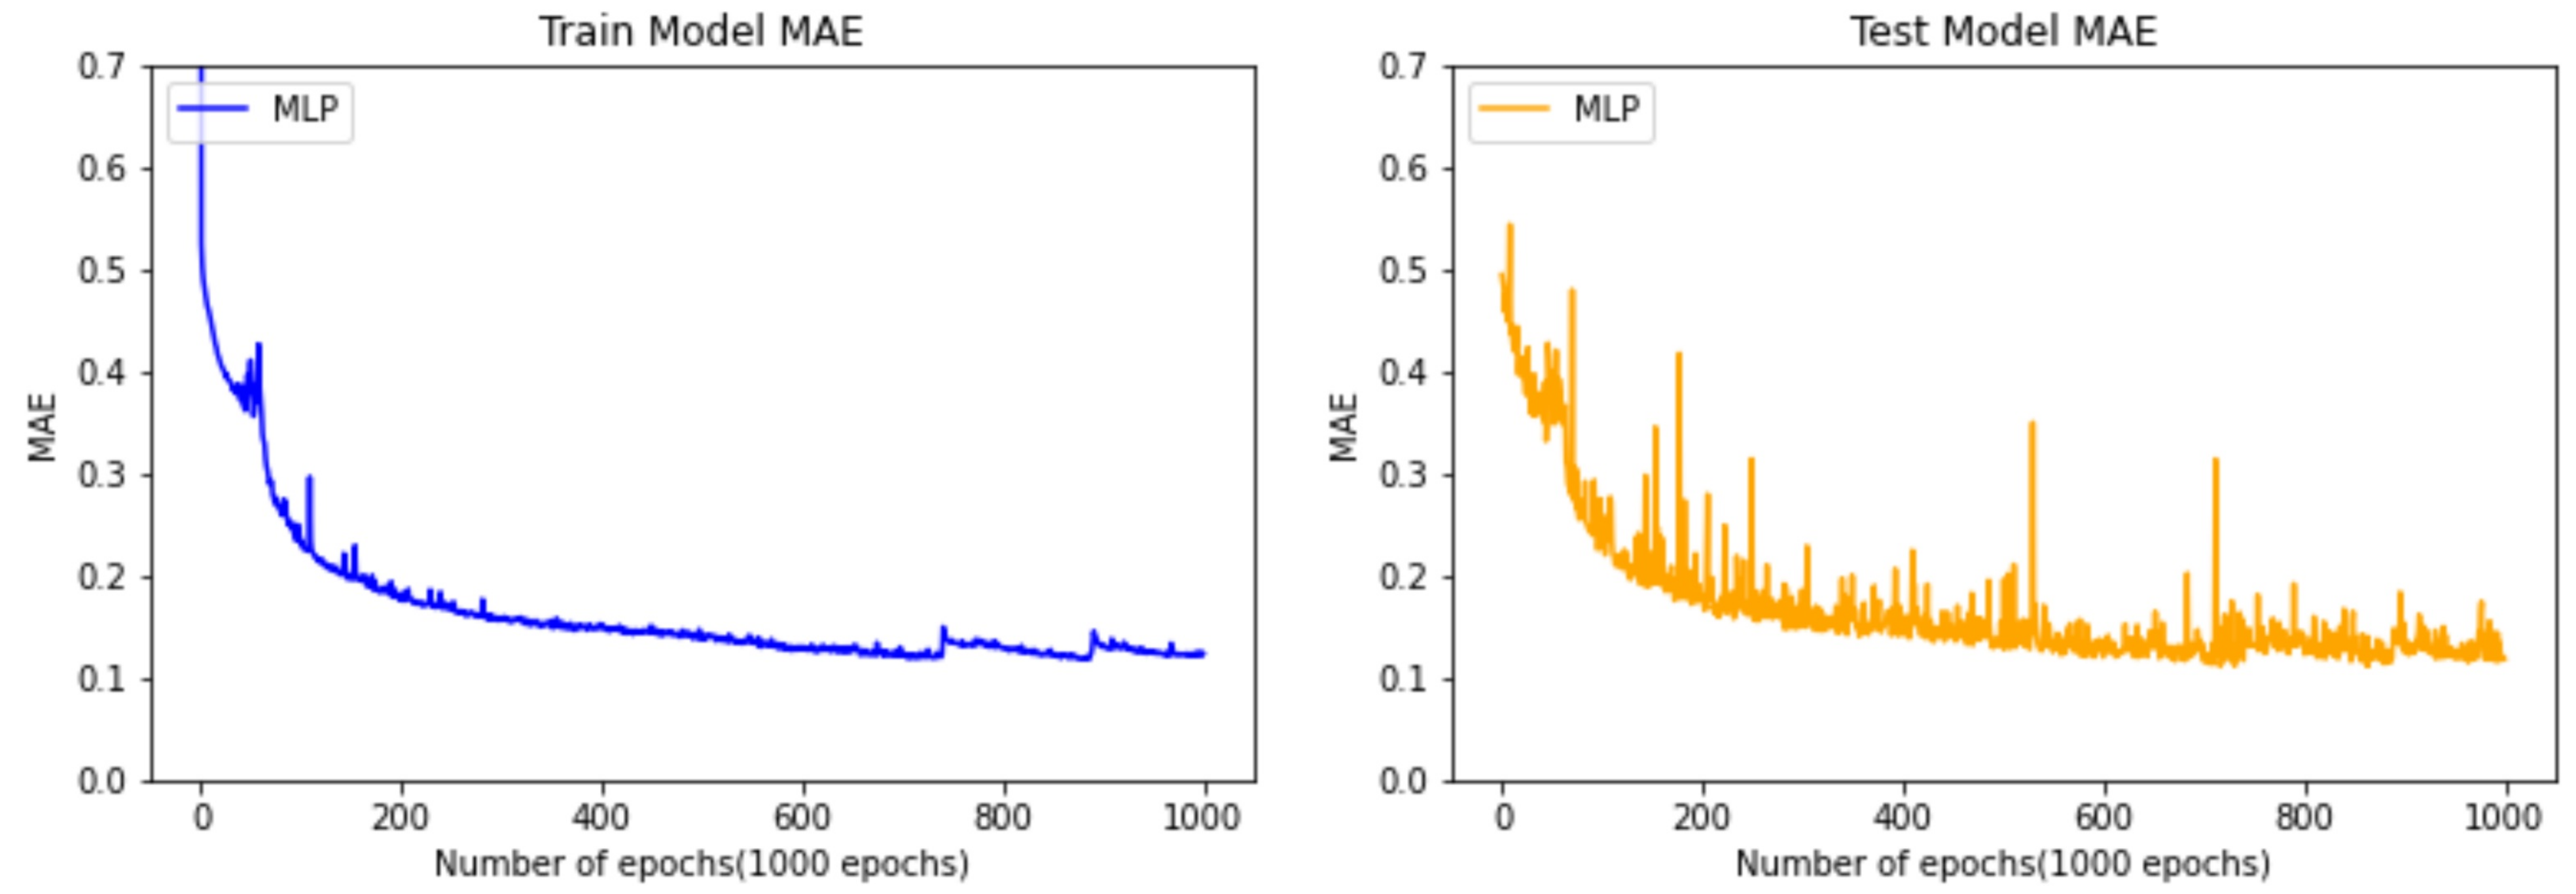
Figure 11 shows the progression of training data used to predict the remaining cycle time of the manufacturing process using the MLP algorithm. The left side is a graph of the results after training using the training data, and the right side is a graph where the MAE is extracted by inputting the test data into the MLP model trained using the testing data. Both the left and right graphs show a relatively similar downward trend, and the fact that the model is not overfitted is confirmed by the shape of both graphs, indicating that the data are not too biased to one side. This graph using the MLP algorithm shows mild convergence after 400 epochs. As a result, it can be confirmed that the best MAE value is close to 0.14 (hours).
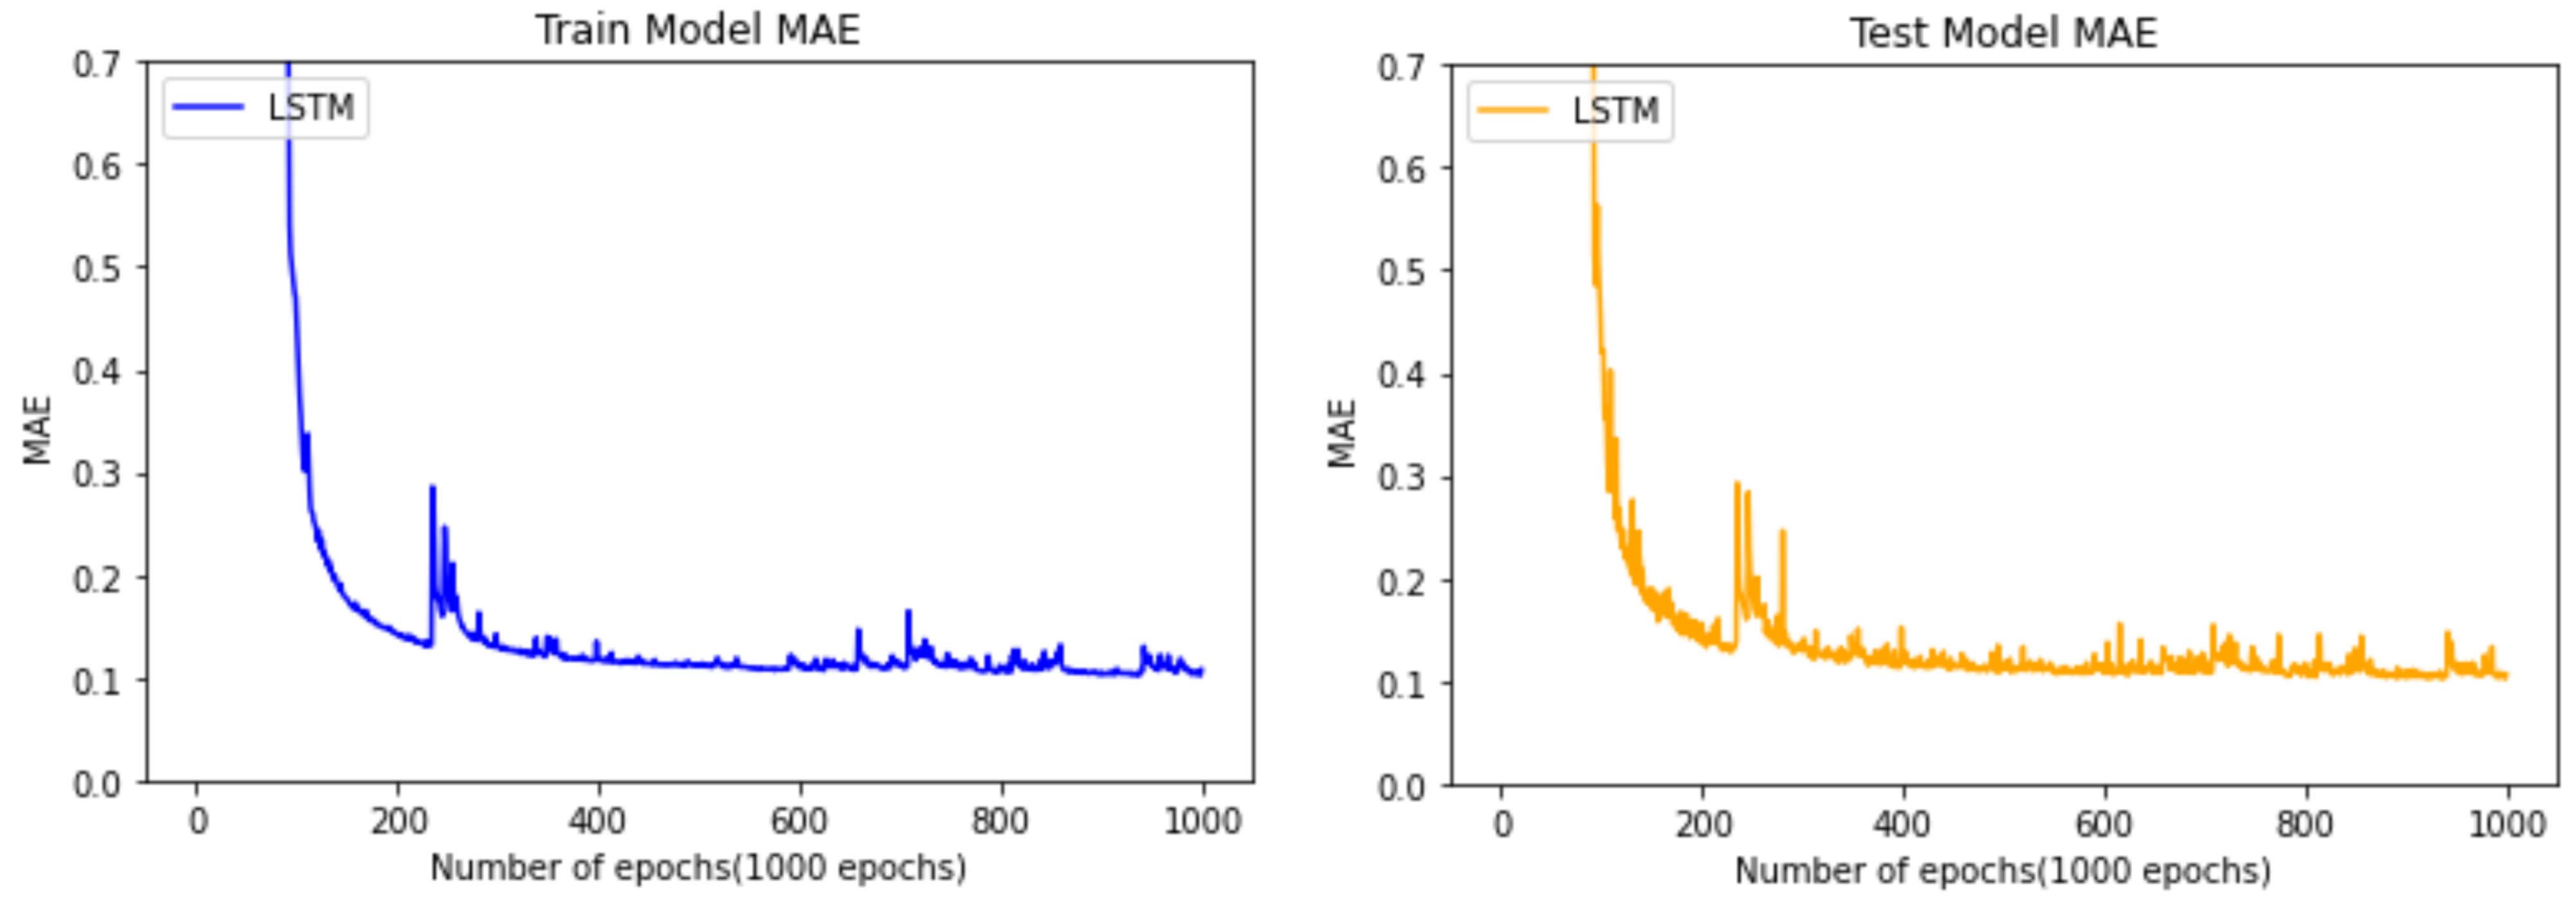
Figure 12 shows the progression of training data used to predict the remaining cycle time of the manufacturing process using the LSTM algorithm. As in Figure 11, the left side is after training using the training data, and the right side considers the MAE extracted by inputting the test data into the LSTM model trained using the testing data. These models also have a downward trend to some extent, similar for both the left and right graphs. Thus, it can be seen that it is a valid model by noting it is not overfitted to one side. In the case of the LSTM learning model, it can be seen that the MAE rapidly decelerates after 100 epochs. It can be seen from the testing graph on the right that the best MAE value converges to 0.12 (hours).
Figure 13 shows the results of training to predict the remaining cycle time of the manufacturing process using the GRU algorithm. As in Figure 11 and Figure 12, the left side is after training using the training data, and the right side is obtained by extracting the MAE by inputting the test data into the GRU model trained using the testing data. The model also has a downward trend in both left and right graphs, demonstrating that the learning results are valid by noting there is no overfitting to one side too much. In the case of the GRU learning model, it can be seen that the MAE rapidly decelerates after 50 epochs, showing the best results among the three models. It can be seen from Figure 13 that the MAE value of the GRU learning model converges to 0.1 (hours).
4.4. Model Comparison
In this experiment using real world data, a comparative experiment was conducted considering three different artificial intelligence algorithms, MLP, LSTM, and GRU. The training was conducted in a GeForce 1660TI environment, and Figure 14 shows the results of comparing the models according to these three algorithms. With a batch size of 40, the execution time for each epoch is less than 9 s on average. For accurate comparison of the three models, the early stop function was not used, and all models were run with 1000 epochs.
As shown in Figure 14, as a result of model evaluation with the test data, the model with the fastest converging MAE values among the three AI algorithms was the GRU, which also had the lowest error value. The learning results of GRU are comparatively better starting from 100 epochs. This value is six times faster than for the MLP model, which produces the best results only after reaching 600 epochs, and four times faster than the LSTM, which exhibits meaningful results only after reaching 400 epochs. The difference in MAE between the GRU model and the LSTM model shows that the difference between the GRU model and the LSTM model is small, while the experimental results demonstrate that the GRU model is superior to LSTM in terms of the learning speed.
Although the difference in MAE between the three models is not large, it can be seen from the following graph that GRU is the most effective in predicting the number of remaining cycles in the manufacturing industry.
5. Conclusions
In this paper, to create a digital twin model to predict the remaining cycle time in manufacturing processes, the GRU model using transition based embedding was validated. Research on predicting processes using event log data are a common research topic recently, but as far as we know, this is the first time that event log data have been used for digital twin modeling alongside transition based embedding. The proposed method shows good results, and we conducted experiments using various AI approaches for comparison. The results of the experiments performed in this paper show the possibility of using event log data and transition based embedding methods for constructing digital twin models.
In keeping with the rapidly changing environment of the manufacturing industry, the need for predicting industrial processes is increasing, and interest in digital twins is also increasing accordingly. However, in the case of small and medium sized enterprises (SMEs), which typically exhibit a shortage of data sets as well as insufficient manpower and consulting costs, there are many factors to consider. The digital twin model using the transition based embedding method proposed in this paper can help more users cooperate via digital twin technology. In addition, partners using the technology proposed in this paper can test manufacturing environments at a lower cost, use more data, and test various situations, leading to more meaningful results.
In this paper, the GRU algorithm is used for digital twin modeling. As a future study, we plan to upgrade this model to produce more precise results, increase their reliability, and apply the model to other industrial domains.
Author Contributions
Conceptualization, M.Y. and J.J.; methodology, J.M.; software, M.Y. and J.M.; validation, M.Y. and J.J.; formal analysis, M.Y.; investigation, M.Y. and J.M.; S.S. and J.K.; resources, J.J.; data curation, M.Y.; writing—original draft preparation, M.Y. and J.M.; writing—review and editing, J.J.; visualization, M.Y.; supervision, J.J. project administration, J.J. All authors have read and agreed to the published version of the manuscript.
Funding
This work was supported by the National Research Foundation of Korea (NRF) grant funded by the Korea government (MSIT) (No. 2021R1F1A1060054).
Institutional Review Board Statement
Not applicable.
Informed Consent Statement
Not applicable.
Data Availability Statement
Not applicable.
Acknowledgments
This research was supported by the MSIT(Ministry of Science and ICT), Korea, under the ICT Creative Consilience Program(IITP-2021-2020-0-01821) supervised by the IITP (Institute for Information & communications Technology Planning & Evaluation).
Conflicts of Interest
The authors declare no conflict of interest.
References
- Wang, X.; Wang, Y.; Tao, F.; Liu, A. New paradigm of data-driven smart customisation through digital twin. J. Manuf. Syst. 2021, 58, 270–280. [Google Scholar] [CrossRef]
- Tao, F.; Qi, Q.; Liu, A.; Kusiak, A. Data-driven smart manufacturing. J. Manuf. Syst. 2018, 48, 157–169. [Google Scholar] [CrossRef]
- Söderberg, R.; Wärmefjord, K.; Carlson, J.S.; Lindkvist, L. Toward a Digital Twin for real-time geometry assurance in individualized production. CIRP Ann. 2017, 66, 137–140. [Google Scholar] [CrossRef]
- Zhang, C.; Chen, D.; Tao, F.; Liu, A. Data driven smart customization. Procedia CIRP 2019, 81, 564–569. [Google Scholar] [CrossRef]
- Saldivar, A.A.F.; Li, Y.; Chen, W.-n.; Zhan, Z.-h.; Zhang, J.; Chen, L.Y. Industry 4.0 with cyber-physical integration: A design and manufacture perspective. In Proceedings of the 2015 21st International Conference on Automation and Computing (ICAC), Glasgow, UK, 11–12 September 2015; pp. 1–6. [Google Scholar]
- Singh, V.; Willcox, K.E. Engineering design with digital thread. AIAA J. 2018, 56, 4515–4528. [Google Scholar] [CrossRef]
- Tuegel, E.J.; Ingraffea, A.R.; Eason, T.G.; Spottswood, S.M. Reengineering aircraft structural life prediction using a digital twin. Int. J. Aerosp. Eng. 2011, 2011, 154798. [Google Scholar] [CrossRef] [Green Version]
- Bevilacqua, M.; Bottani, E.; Ciarapica, F.E.; Costantino, F.; Di Donato, L.; Ferraro, A.; Mazzuto, G.; Monteriù, A.; Nardini, G.; Ortenzi, M.; et al. Digital twin reference model development to prevent operators’ risk in process plants. Sustainability 2020, 12, 1088. [Google Scholar] [CrossRef] [Green Version]
- Luo, W.; Hu, T.; Zhang, C.; Wei, Y. Digital twin for CNC machine tool: Modeling and using strategy. J. Ambient. Intell. Humaniz. Comput. 2019, 10, 1129–1140. [Google Scholar] [CrossRef]
- Ghosh, A.K.; Ullah, A.; Kubo, A.; Akamatsu, T.; D’Addona, D.M. Machining phenomenon twin construction for industry 4.0: A case of surface roughness. J. Manuf. Mater. Process. 2020, 4, 11. [Google Scholar] [CrossRef] [Green Version]
- Aheleroff, S.; Xu, X.; Zhong, R.Y.; Lu, Y. Digital twin as a service (DTaaS) in industry 4.0: An architecture reference model. Adv. Eng. Inform. 2021, 47, 101225. [Google Scholar] [CrossRef]
- Zhou, H.; Yang, C.; Sun, Y. Intelligent Ironmaking Optimization Service on a Cloud Computing Platform by Digital Twin. Engineering 2021, 7, 1274–1281. [Google Scholar] [CrossRef]
- Chen, J.; Hu, K.; Wang, Q.; Sun, Y.; Shi, Z.; He, S. Narrowband internet of things: Implementations and applications. IEEE Internet Things J. 2017, 4, 2309–2314. [Google Scholar] [CrossRef]
- Lugaresi, G.; Matta, A. Real-time simulation in manufacturing systems: Challenges and research directions. In Proceedings of the 2018 Winter Simulation Conference (WSC), Gothenburg, Sweden, 9–12 December 2018; pp. 3319–3330. [Google Scholar]
- van der Aalst, W.M. Process mining and simulation: A match made in heaven! In Proceedings of the SummerSim, Bordeaux, France, 9–12 July 2018; pp. 1–4. [Google Scholar]
- Bergmann, S.; Feldkamp, N.; Strassburger, S. Approximation of dispatching rules for manufacturing simulation using data mining methods. In Proceedings of the 2015 Winter Simulation Conference (WSC), Huntington Beach, CA, USA, 6–9 December 2015; pp. 2329–2340. [Google Scholar]
- Ferreira, D.R.; Vasilyev, E. Using logical decision trees to discover the cause of process delays from event logs. Comput. Ind. 2015, 70, 194–207. [Google Scholar] [CrossRef]
- Moon, J.; Park, G.; Jeong, J. POP-ON: Prediction of Process Using One-Way Language Model Based on NLP Approach. Appl. Sci. 2021, 11, 864. [Google Scholar] [CrossRef]
- Lugaresi, G.; Matta, A. Automated manufacturing system discovery and digital twin generation. J. Manuf. Syst. 2021, 59, 51–66. [Google Scholar] [CrossRef]
- Pan, Y.; Zhang, L. A BIM-data mining integrated digital twin framework for advanced project management. Autom. Constr. 2021, 124, 103564. [Google Scholar] [CrossRef]
- Tran, T.a.; Ruppert, T.; Eigner, G.; Abonyi, J. Real-time locating system and digital twin in Lean 4.0. In Proceedings of the 2021 IEEE 15th International Symposium on Applied Computational Intelligence and Informatics (SACI), Timisoara, Romania, 19–21 May 2021; pp. 000369–000374. [Google Scholar]
- Lugaresi, G.; Zanotti, M.; Tarasconi, D.; Matta, A. Manufacturing Systems Mining: Generation of Real-Time Discrete Event Simulation Models. In Proceedings of the 2019 IEEE International Conference on Systems, Man and Cybernetics (SMC), Bari, Italy, 6–9 October 2019; pp. 415–420. [Google Scholar]
- Ghahramani, M.; Qiao, Y.; Zhou, M.; Hagan, A.O.; Sweeney, J. AI-based modeling and data-driven evaluation for smart manufacturing processes. IEEE/CAA J. Autom. Sin. 2020, 7, 1026–1037. [Google Scholar] [CrossRef]
- Lee, J.; Singh, J.; Azamfar, M.; Pandhare, V. Industrial AI and predictive analytics for smart manufacturing systems. In Smart Manufacturing; Elsevier: Amsterdam, The Netherlands, 2020; pp. 213–244. [Google Scholar]
- Ding, H.; Gao, R.X.; Isaksson, A.J.; Landers, R.G.; Parisini, T.; Yuan, Y. State of AI-based monitoring in smart manufacturing and introduction to focused section. IEEE/ASME Trans. Mechatron. 2020, 25, 2143–2154. [Google Scholar] [CrossRef]
- Kotsiopoulos, T.; Sarigiannidis, P.; Ioannidis, D.; Tzovaras, D. Machine Learning and Deep Learning in Smart Manufacturing: The Smart Grid Paradigm. Comput. Sci. Rev. 2021, 40, 100341. [Google Scholar] [CrossRef]
- Huang, Z.; Shen, Y.; Li, J.; Fey, M.; Brecher, C. A Survey on AI-Driven Digital Twins in Industry 4.0: Smart Manufacturing and Advanced Robotics. Sensors 2021, 21, 6340. [Google Scholar] [CrossRef]
- Mostafa, F.; Tao, L.; Yu, W. An effective architecture of digital twin system to support human decision-making and AI-driven autonomy. Concurr. Comput. Pract. Exp. 2021, 33, e6111. [Google Scholar] [CrossRef]
- Örs, E.; Schmidt, R.; Mighani, M.; Shalaby, M. A Conceptual Framework for AI-based Operational Digital Twin in Chemical Process Engineering. In Proceedings of the 2020 IEEE International Conference on Engineering, Technology and Innovation (ICE/ITMC), Cardiff, UK, 15–17 June 2020; pp. 1–8. [Google Scholar]
- Rojek, I.; Mikołajewski, D.; Dostatni, E. Digital Twins in Product Lifecycle for Sustainability in Manufacturing and Maintenance. Appl. Sci. 2021, 11, 31. [Google Scholar] [CrossRef]
- Cho, K.; Van Merriënboer, B.; Gulcehre, C.; Bahdanau, D.; Bougares, F.; Schwenk, H.; Bengio, Y. Learning phrase representations using RNN encoder-decoder for statistical machine translation. arXiv 2014, arXiv:1406.1078. [Google Scholar]
- Tello-Leal, E.; Roa, J.; Rubiolo, M.; Ramirez-Alcocer, U.M. Predicting activities in business processes with LSTM recurrent neural networks. In Proceedings of the 2018 ITU Kaleidoscope: Machine Learning for a 5G Future (ITU K), Santa Fe, Argentina, 26–28 November 2018; pp. 1–7. [Google Scholar]
Figure 1.
Digital twin framework.

Figure 2.
Collaborative digital twin framework for smart manufacturing.

Figure 3.
Transition system based embedding for digital twin modeling.

Figure 4.
Petri net of event log.

Figure 5.
Reset gate.

Figure 6.
GRU model flow chart.

Figure 7.
Update gate.

Figure 8.
Candidate step.

Figure 9.
Hidden layer calculation step.

Figure 10.
Manufacturing process overview.

Figure 11.
Comparison between train data and test data of the model using the MLP algorithm.

Figure 12.
Comparison between train data and test data of the model using the LSTM algorithm.

Figure 13.
Comparison between train data and test data of the model using the GRU algorithm.

Figure 14.
Comparing training models.


Table 1.
Fragment of an event.
| Case ID | Start Time | End Time | Product | Machine | Qtty |
|---|---|---|---|---|---|
| Case 01 | 3 July 2021: 13:00 | 3 July 2021: 13:10 | A | 1 | 10 |
| Case 01 | 3 July 2021: 13:20 | 3 July 2021: 13:40 | A | 2 | 10 |
| Case 01 | 3 July 2021: 13:55 | 3 July 2021: 14:10 | A | 3 | 10 |
| Case 01 | 3 July 2021: 14:20 | 3 July 2021: 14:30 | A | 4 | 10 |
| Case 02 | 3 July 2021: 15:00 | 3 July 2021: 15:30 | B | 1 | 20 |
| Case 02 | 3 July 2021: 15:40 | 3 July 2021: 16:20 | B | 3 | 20 |
| Case 02 | 3 July 2021: 16:30 | 3 July 2021: 17:10 | B | 2 | 20 |
| Case 02 | 3 July 2021: 17:20 | 3 July 2021: 18:00 | B | 4 | 20 |
| Case 03 | 3 July 2021: 04:00 | 3 July 2021: 04:25 | A | 1 | 5 |
| Case 03 | 3 July 2021: 04:32 | 3 July 2021: 04:44 | A | 3 | 5 |
| Case 03 | 3 July 2021: 04:55 | 3 July 2021: 05:20 | A | 2 | 5 |
| Case 03 | 3 July 2021: 05:30 | 3 July 2021: 05:55 | A | 4 | 5 |
| Case 04 | 3 July 2021: 07:00 | 3 July 2021: 07:30 | B | 1 | 10 |
| Case 04 | 3 July 2021: 07:42 | 3 July 2021: 07:55 | B | 2 | 10 |
| Case 04 | 3 July 2021: 08:05 | 3 July 2021: 09:45 | B | 3 | 10 |
| Case 04 | 3 July 2021: 10:00 | 3 July 2021: 10:30 | B | 4 | 10 |
Table 2.
Normalization of the event log.
| Case Id | Trace | Product | Qtty | End Time |
|---|---|---|---|---|
| Case 01 | A | 10 | 90 | |
| Case 02 | B | 20 | 180 | |
| Case 03 | A | 5 | 115 | |
| Case 04 | B | 10 | 190 | |
| Case05 | B | 10 | ?? |
Table 3.
Transformation of Database.
| Product | 1 | 2 | 3 | 4 | 5 | Remaining Time |
|---|---|---|---|---|---|---|
| A | 0 | 0 | 0 | 0 | 0 | 9.00 |
| A | 1 | 0 | 0 | 0 | 0 | 7.00 |
| A | 1 | 1 | 0 | 0 | 0 | 3.50 |
| A | 1 | 1 | 1 | 0 | 0 | 1.00 |
Table 4.
Description of Parameters.
| Parameter | Value |
|---|---|
| epochs | 1000 |
| batch size | 40 |
| optimizer | AdaGrad |
| GRU units | 128 |
Table 5.
Industrial event log of Case 106.
| Case ID | ActivityMachine | Start Time | Complete Time | Qtty |
|---|---|---|---|---|
| Case 106 | Turning/Milling–Machine 8 | 15 March 2012: 10:14 | 15 March 2012: 15:44 | 39 |
| Case 106 | Turning/Milling–Machine 8 | 15 March 2012: 16:55 | 15 March 2012: 20:38 | 39 |
| Case 106 | Turning/Milling Q.C. | 19 March 2012: 7:00 | 19 March 2012: 7:28 | 39 |
| Case 106 | Laser Marking–Machine 7 | 19 March 2012: 9:38 | 19 March 2012: 10:51 | 39 |
| Case 106 | Flat Grinding–Machine 11 | 19 March 2012: 14:42 | 19 March 2012: 15:20 | 39 |
| Case 106 | Final Inspection Q.C. | 21 March 2012: 15:27 | 21 March 2012: 17:57 | 39 |
| Case 106 | Packing | 22 March 2012: 0:00 | 22 March 2012: 1:00 | 39 |
| Case 106 | Final Inspection Q.C. | 22 March 2012: 11:50 | 22 March 2012: 13:05 | 39 |
Publisher’s Note: MDPI stays neutral with regard to jurisdictional claims in published maps and institutional affiliations. |
© 2022 by the authors. Licensee MDPI, Basel, Switzerland. This article is an open access article distributed under the terms and conditions of the Creative Commons Attribution (CC BY) license (https://creativecommons.org/licenses/by/4.0/).
Share and Cite
MDPI and ACS Style
Yang, M.; Moon, J.; Jeong, J.; Sin, S.; Kim, J. A Novel Embedding Model Based on a Transition System for Building Industry-Collaborative Digital Twin. Appl. Sci. 2022, 12, 553. https://0-doi-org.brum.beds.ac.uk/10.3390/app12020553
AMA Style
Yang M, Moon J, Jeong J, Sin S, Kim J. A Novel Embedding Model Based on a Transition System for Building Industry-Collaborative Digital Twin. Applied Sciences. 2022; 12(2):553. https://0-doi-org.brum.beds.ac.uk/10.3390/app12020553
Chicago/Turabian StyleYang, Minyeol, Junhyung Moon, Jongpil Jeong, Seokho Sin, and Jimin Kim. 2022. "A Novel Embedding Model Based on a Transition System for Building Industry-Collaborative Digital Twin" Applied Sciences 12, no. 2: 553. https://0-doi-org.brum.beds.ac.uk/10.3390/app12020553
Note that from the first issue of 2016, this journal uses article numbers instead of page numbers. See further details here.