
Numerical Investigation into Lateral Behavior of Monopile Due to Scour Enhanced: Role of State-Dependent Dilatancy

1
School of Civil Engineering, Qingdao University of Technology, Qingdao 266033, China
2
College of Civil Engineering and Architecture, Zhejiang University, Hangzhou 310030, China
*
Author to whom correspondence should be addressed.
Appl. Sci. 2022, 12(2), 921; https://0-doi-org.brum.beds.ac.uk/10.3390/app12020921
Submission received: 10 November 2021
/
Revised: 5 January 2022
/
Accepted: 12 January 2022
/
Published: 17 January 2022
(This article belongs to the Special Issue Railway Earthwork Maintenance and Design: Advanced Structures and Technologies)
Abstract
:The removal of soil during scouring is crucial to the lateral resistance of piles in bridges of railways or highways. In this process, dilatancy of the interface soil induces variation in normal stress, which in turn influences the interface soil lateral resistance. Due to the lack of analysis in previous studies in terms of cohesionless soil state (i.e., relative density and stress level) in remaining soil after scouring, it is difficult to simulate the properties and behavior of interface soil. The objective of this study is to explain the change of the sand state at the compression interface after scouring, quantify the stress-strain characteristics of the pile during this period and eventually present the prediction p-y curves of the lateral service capacity. The state-dependent constitutive model for saturated sand is employed, combined with the 3D finite element simulation, and the state development of the remaining soil is exhibited. The enhancement of dilation and stress relief of the remaining shallow horizon eventually gives rise to the reduction of the lateral resistance. In addition, the remaining overburden soil surrounding the pile restricts the interface soil, enlarging the normal stress and strengthening the deep horizon. Then, the friction angle considered the influence of state-dependent changes is used to quantify the hyperbolic p-y curves.
1. Introduction
In order to cross rivers and oceans, bridges are widely employed in railways and highways [1,2]. As the main foundation form of the bridge, the serviceability of the piles tends to be affected by a variety of working conditions. As a common form of erosion around the pile foundations, through the removal of the seabed soil around the pile, scour can reduce the pile embedded length. Receiving complex hydrodynamic loads (wave, current), the lateral service capacity of the piles dwindles by means of enhancing bending moment after scouring, and then leads to the failure of the whole structures [3]. Therefore, the lateral service capacity of the pile before and after scouring should be analyzed. Among them, a reasonable analysis method of the pile-soil interaction of the compression side is essential for the research.
As common models to quantify service capacity between the pile and the surrounding soil [4,5], the p-y curves can idealize the soil as a series of independent springs around the pile length. Each spring is used to describe the linear or non-linear relationship between the lateral service capacity of the soil (p) and the following lateral deflection of the pile (y) in the given depth. A simplified p-y curve analysis method based on the wedge type of failure in a scour pit condition is innovated [6]. This wedge analysis method was adopted to evaluate the effects of the scour pit dimension in the sand through this simplified method. On the basis of the subsequent finite element analysis [7,8], the scour depth influenced most on the lateral pile response than scour width and slope angle of the scour pit, which was similar to Li’s conclusions of centrifuge test [9,10]. Nevertheless, similar to the excavation effect on pile-soil interaction structure, the removal of soils subjected to scour could be considered as a slow process of unloading [11]. The lack of remaining soil characteristic analysis makes the existing p-y curves not reasonable and precise enough in the research. During the scour, the stress history of remaining soils changes in the meantime [12,13], resulting in the state variation of the soil. During the stress state and the normal stress of the remaining soil changed, the dilation of the shear interface brought about a slight rise of the friction angle [7]. As a result, neglecting the variation of stress state would result in a conservative design when considering the lateral capacity of the pile foundation.
Piles in cohesionless soil are more vulnerable to scour than cohesive soil by wave or current [6]. To cohesionless soil, the concept of critical state can be applied to assess the tendency of dilatancy. Roscoe et al. [14] and Li et al. [15] illuminated that the state parameter, the disparity between the current void ratio and the critical state void ratio corresponding to the current confining pressure, is an effective approach of the measurement of how far the material state is from the critical state. With the parameter as the state variable, a particular form of state-dependent dilatancy is shown to be equivalent to an interpretation whereby the phase transformation stress ratio is variable with the state parameter, an idea introduced by Manzari & Dafalias [16]. As a significant factor of sand under shearing, the dilatancy of the shallow sand horizon in local scour is worth analyzing.
To explore the lateral resistance of the remaining sand horizon under scouring, a centrifuge test is applied to make a comparison between the lateral soil resistance in the general scour and local scour [17], indicating that p-y curves for the local scour cases, sand horizon at a given depth below the scour pit base is much stiffer than that at the same depth below the original soil surface, while this characteristic is not founded in the general scour sand horizon. The results reflect a phenomenon that if the deformation of the pile head increased, the lateral resistance of the remaining sand horizon would also increase slightly in local scour conditions. According to the results in the CPT test and 3D finite element model tested by ABAQUS, this increasing stiffness of the p-y curves would be attributed to the constraint due to the sloping overburden soil in local scour cases [18], and then the property of shallow remaining sands changed. The stiffer sand horizon below the scour pit hardened the lateral pile capacity at the same depth. While the precedent research analyzed less in the state characteristic and the normal stress change of the remaining sand, thus lacking the reasonable quantification method of the remaining soil horizon.
The objective of this study is to adopt the state-dependent critical state model of the sand to investigate the change of the lateral pile capacity in different types of scouring conditions. In this study, the three-dimensional model referenced and validated with a published centrifuge test examines the impact of remaining soil lateral resistance at a given scour depth. On the basis of this, the researchers analyzed the variation of state parameter changes on the normal stress of interface soil, and the peak friction theory considering state parameter is applied to quantify the lateral resistance of the remaining soil horizon.
2. The State-Dependent Constitutive Model for Saturated Sand
The theory of state-dependent dilatancy in the research is derived from Li and Dafalias [13]. The research of the micromechanical analysis justified that dilatancy is defined as the unique function of the stress ratio , with and the terms of the triaxial stress variables. Hence, the stress of the sand is defined as effective mean normal stress and deviator stress , where is the effective axial stress and the effective radical stress, the total axial stress and the total radical stress.
2.1. Elastic Behavior
In the elastic stress-strain phase, the elastic shear modulus in this model is described using Richard et al. [19]’s equation as follows:
where is a material constant, is the void ratio and denotes the atmospheric pressure. Based on elasticity theory, the elastic bulk modulus is expressed in terms of and Poisson’s ratio :
2.2. Yield Function
This model considered the state-dependent dilatancy relation and plastic harden law, based on the model of Li and Dafalias [15]. The stress-strain response of sand along a path of constant stress ratio is considered. The yield surface is a straight line in the space and it is used in this model, as follows’:
this yield function is derived from the interfacial yield mechanism of coarse-grained soil and was verified by experimental studies. Their results reflect the yield mechanism of shear-induced. Therefore, this proposed model can be established with ease to include the compression-induced yield mechanism by adding a yield cap controlled by . For the sake of simplicity, the bounding effect and formed naturally or artificially is omitted in the yield function.
2.3. State-Dependent Dilatancy
The state-dependent dilatancy function proposed by Li and Dafalias [19] is employed in this study:
where is the plastic volumetric strain increment while is the plastic deviatoric strain increment. is the special value of the at the critical state. and are two material constants related to dilatancy. is the state parameter and it is defined by Been and Jefferies [20] as follows
where is the critical void ratio on the critical state line in the space corresponding to the current , improved by a power relationship and prevented by Li and Wang [21], and is the normal atmospheric pressure. , and are the material constants of the critical state. and mean contractive and dilative behavior. This formulation includes the following key features of dilatancy of sand subjected to shear [15]:
- At a loose state (), the sand exhibits a contractive behavior (), as is always lower than when [22];
- At a dense state (), the sand displays either zero dilatancies when (upon phase transformation), or a dilative behavior () if otherwise [22];
- At the critical state, the dilatancy vanishes () being irrespective of the initial state by and ;
- The equation can be recovered to the dilatancy function of the original Cam clay model (i.e.,), by setting the two material constants as and .
2.4. State-Dependent Plastic Modulus
The plastic modulus in this paper is defined as follows:
where and are the deviatoric stress increment and plastic shear strain increment. Where is a material constant, is changed by the density of the soil. This variable is simplified as follow:
The value of varies linearly with the void ration , where and are two material constants about shear hardening. Equation (4) considered -dependency on the basis of the previous plastic modulus by Wang et al. [23], which can unify the models of both strain-hardening and strain-softening behavior of remaining sands in different densities, respectively. The equation before suggests that the plastic modulus is subject to the difference of current for a ‘virtual’ peak stress ratio , which keeps changing during the shearing of the soil [13]. As a consequence, the key following features associated with the plastic hardening behavior of sand in shear can be reproduced:
- For the initial state of sand in each horizon, at which is successive with the behavior of sand showing induced by a tiny but nonzero [24];
- For the initial state of sand in each horizon, at the critical state ( and ), because of the term ;
- For loose sand, by always smaller than , during the entire process of shearing. and the sand is in a strain-hardening state.
- For relatively dense sand, the formulation allows a smooth transition from to , in which the sand changes from strain-hardening state to strain-softening state, when and , respectively.
2.5. Constitutive Equation for Saturated Sand
The constitutive equation for saturated sand can be obtained as below:
with:
where is a loading index, is a Heaviside function with for and . It is noticeable that the extension of the foregoing relationship to account for reverse loading requires some additional mechanism such as a back-stress, or memory of the reversal stress ration point. These aspects are not addressed for the restricted scope of this paper.
Based on the proposed model, the dilatancy can be regarded as a state-dependent quantity within critical soil mechanics. In this research, the model can capture the characteristics of soil state variation before and after scouring when the horizontal displacement of pile occurs. The finite element simulation below depicts the bearing capacity development characteristics of the pile-soil interface in each horizon. There are eleven material constants in the proposed state-dependency sand model, as shown with the value after model validation in Section 3.2 below, which is separated according to their functions. The function of elastic parameters (,), critical state parameters (), dilatancy parameters () and harden parameters () of the cohesionless soil is explained in Equations (1)–(7). As illustrated in the interface soil of this research, the development of the void ratio and the effective axial stress can be extracted, followed by the state variation.
3. Three-Dimensional Finite Element Model Analyses
3.1. Three-Dimensional Finite Element Model
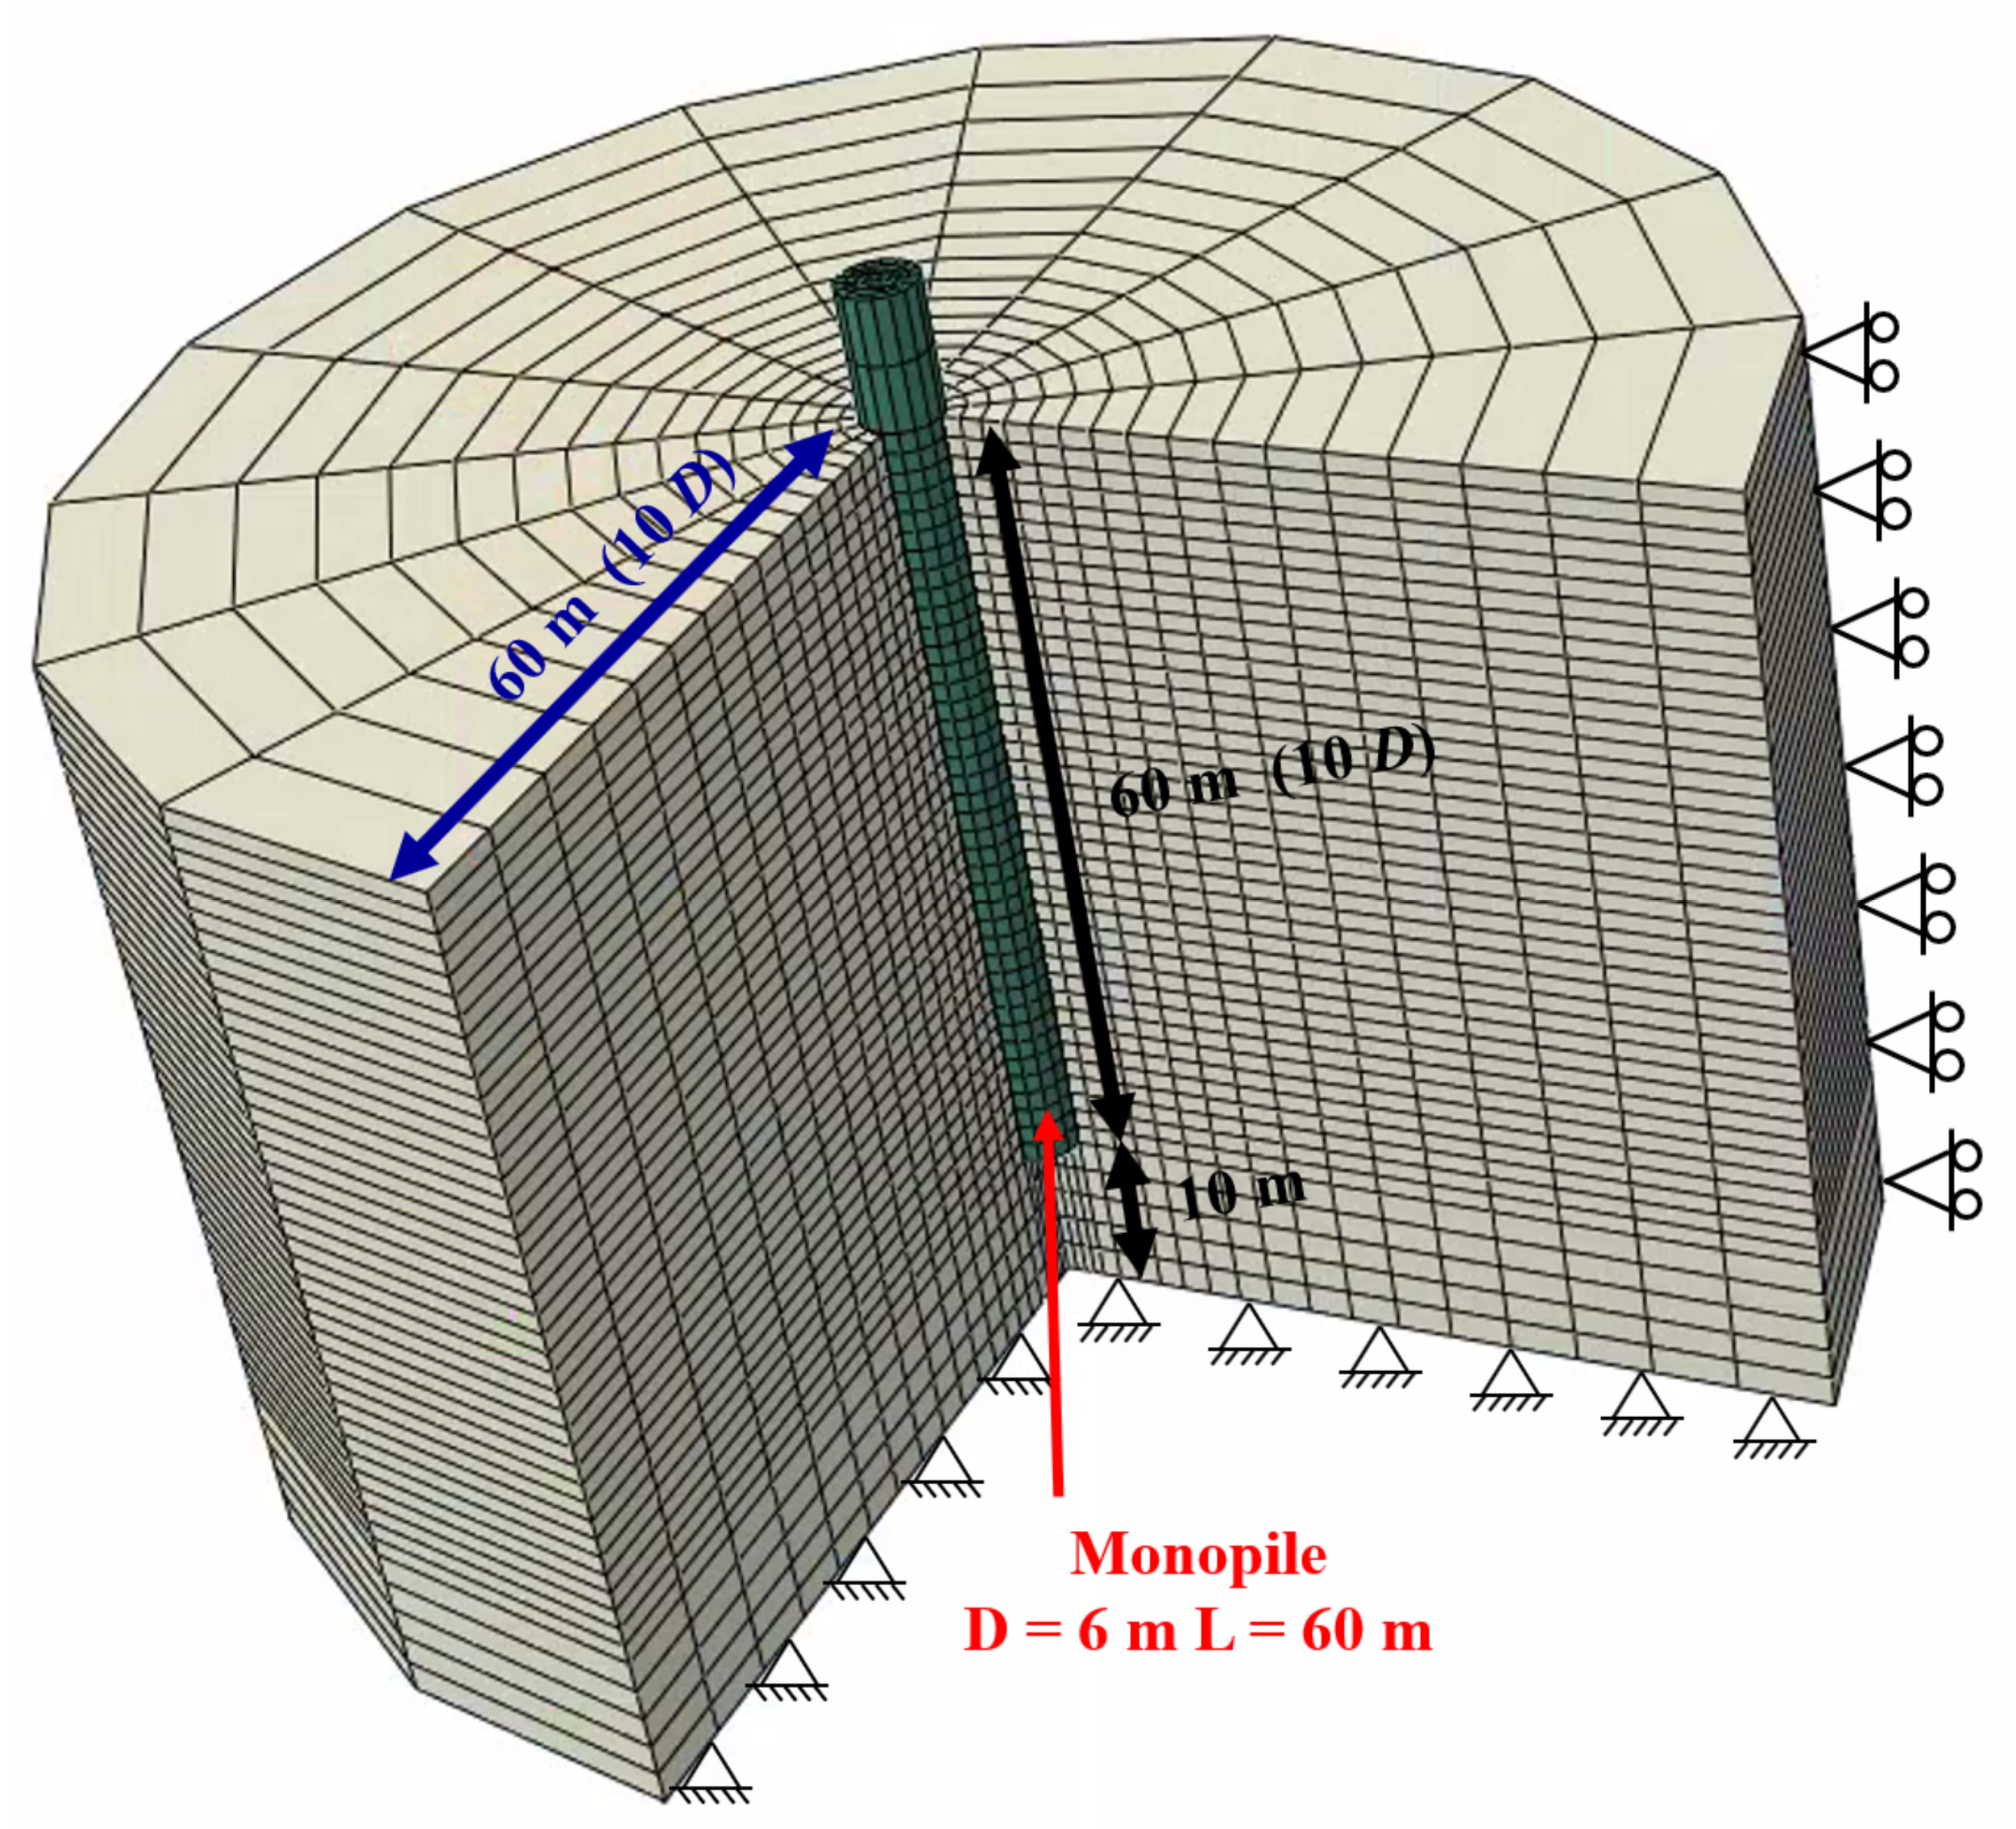
A full-scale monopile foundation in saturated sand is developed with the help of the Three-dimensional finite element model analysis software ABAQUS. The properties of the pile and sand are taken from Wang et al. [25]. The monopile has a diameter of 6 m, a wall thickness of 0.06 m, an embedded depth of 60 m, and a height of loading of 10 m.
Figure 1 illuminates an isometric view of the finite element mesh and the boundary conditions adopted in this study. The lateral boundary of the finite element mesh is constrained by roller supports, while the bottom boundary is fixed against translation in all directions. Aiming at eliminating the boundary effect [25], the lateral boundary is assigned as 10 ( is the pile diameter) from the center of the pile.
The monopile in the simulation is modeled with Eight-node brick (C3D8), calculated by the state-dependent critical state model of saturated sand, respectively. The monopile foundation is assumed to be a linear elastic model, which is transformed to be a cylinder closed-ended pile. Compared with the prototype open-ended pipe pile, it is simplified to a solid pile of the same diameter by the simulation. The typical Young’s modulus is converted into in which the prototype pile is and Poisson’s ratio is complying with the requirements of the bending stiffness. The interaction between the pile and sand is simulated based on the Coulomb friction law and the friction coefficient is based on the equation proposed by Randolph et al. [26]. The detachment between the pile and the sand horizon during the scour and load period is allowed, too.
3.2. Parameter Calibration and Model Validation
The centrifuge test proposed by Wang [25] is used by Toyoura sand. The basic parameters of the sand in the state-dependent model can be determined by following the procedure shown in Li and Dafalias [15], as summarized in Table 1 and Table 2. Regarding the uniform Toyoura sand sample, the critical state parameters, dilatancy parameters, and harden parameters are the same in Table 1. The prototype sand parameters in the state-dependent saturated model can be restored by the extraction of the basic parameters in Table 2 and elastic parameters in Table 1 from Wang’s test.
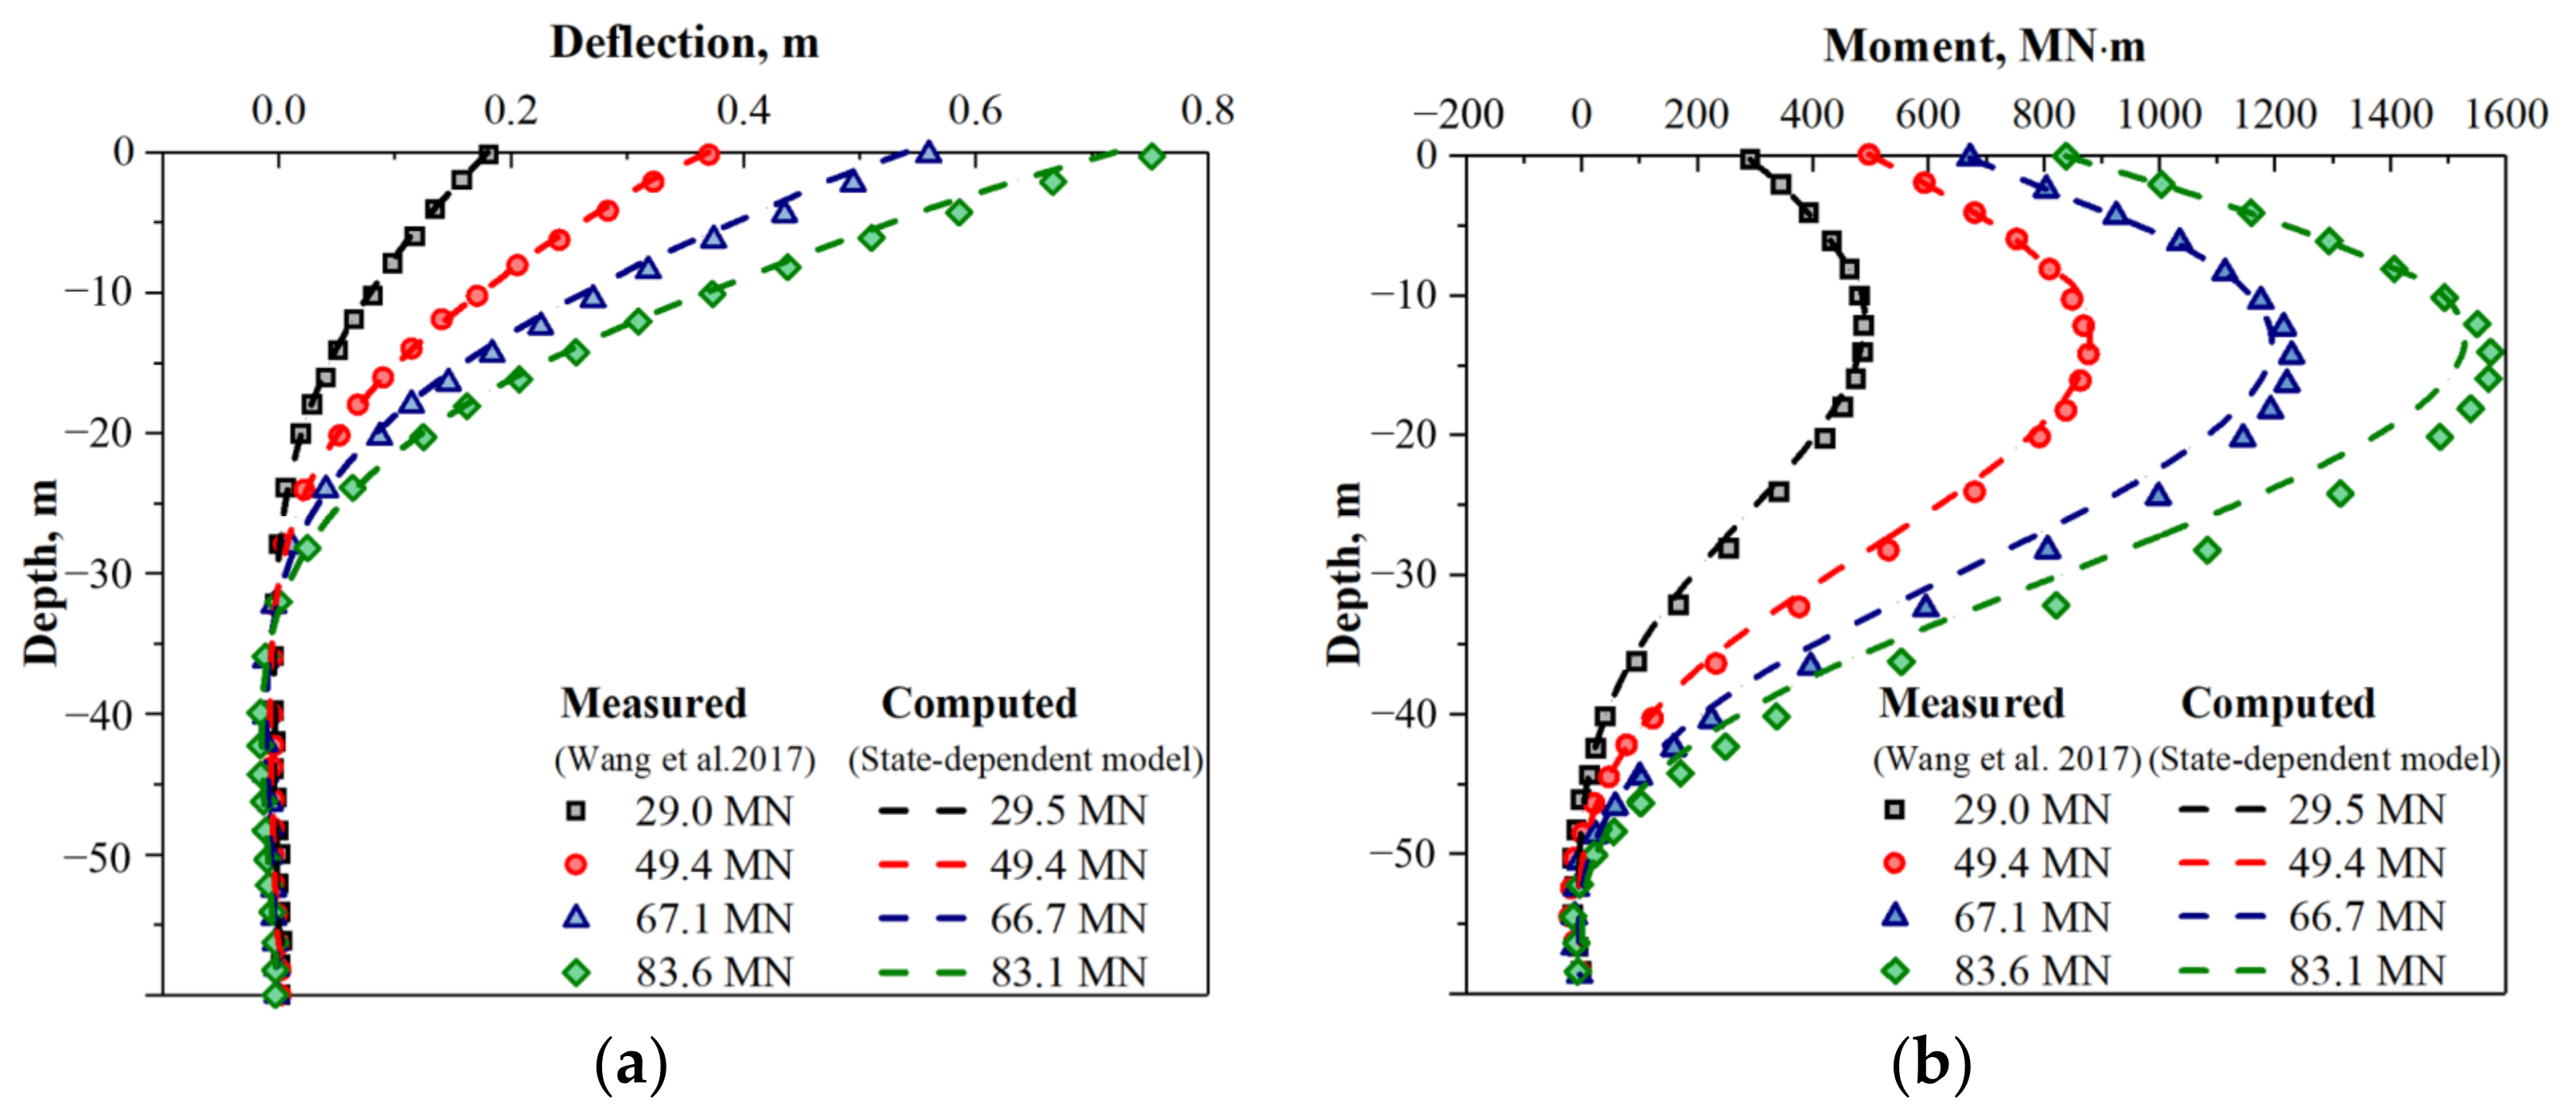
Results of the monotonic lateral load test of the monopile in the sand are presented in Figure 2 for comparison. For the purpose of restoring the loading mode of the centrifugal model test, the corresponding static load is applied to the same pile head position until the end of pile displacement. The lateral deflection and moment curve by Wang’s centrifuge test [25] can be computed by this state-dependent sand model in Abaqus. Therefore, it can be inferred that the three-dimensional finite element model adopted in this study can reasonably capture the behavior of pile-soil reaction.
3.3. Numerical Modeling Procedure
The validated pile-soil 3D model has then been developed to analyze the change of loading capacity of remaining sand after stress relief during scouring. The sand is assumed to be normally consolidated before scouring.
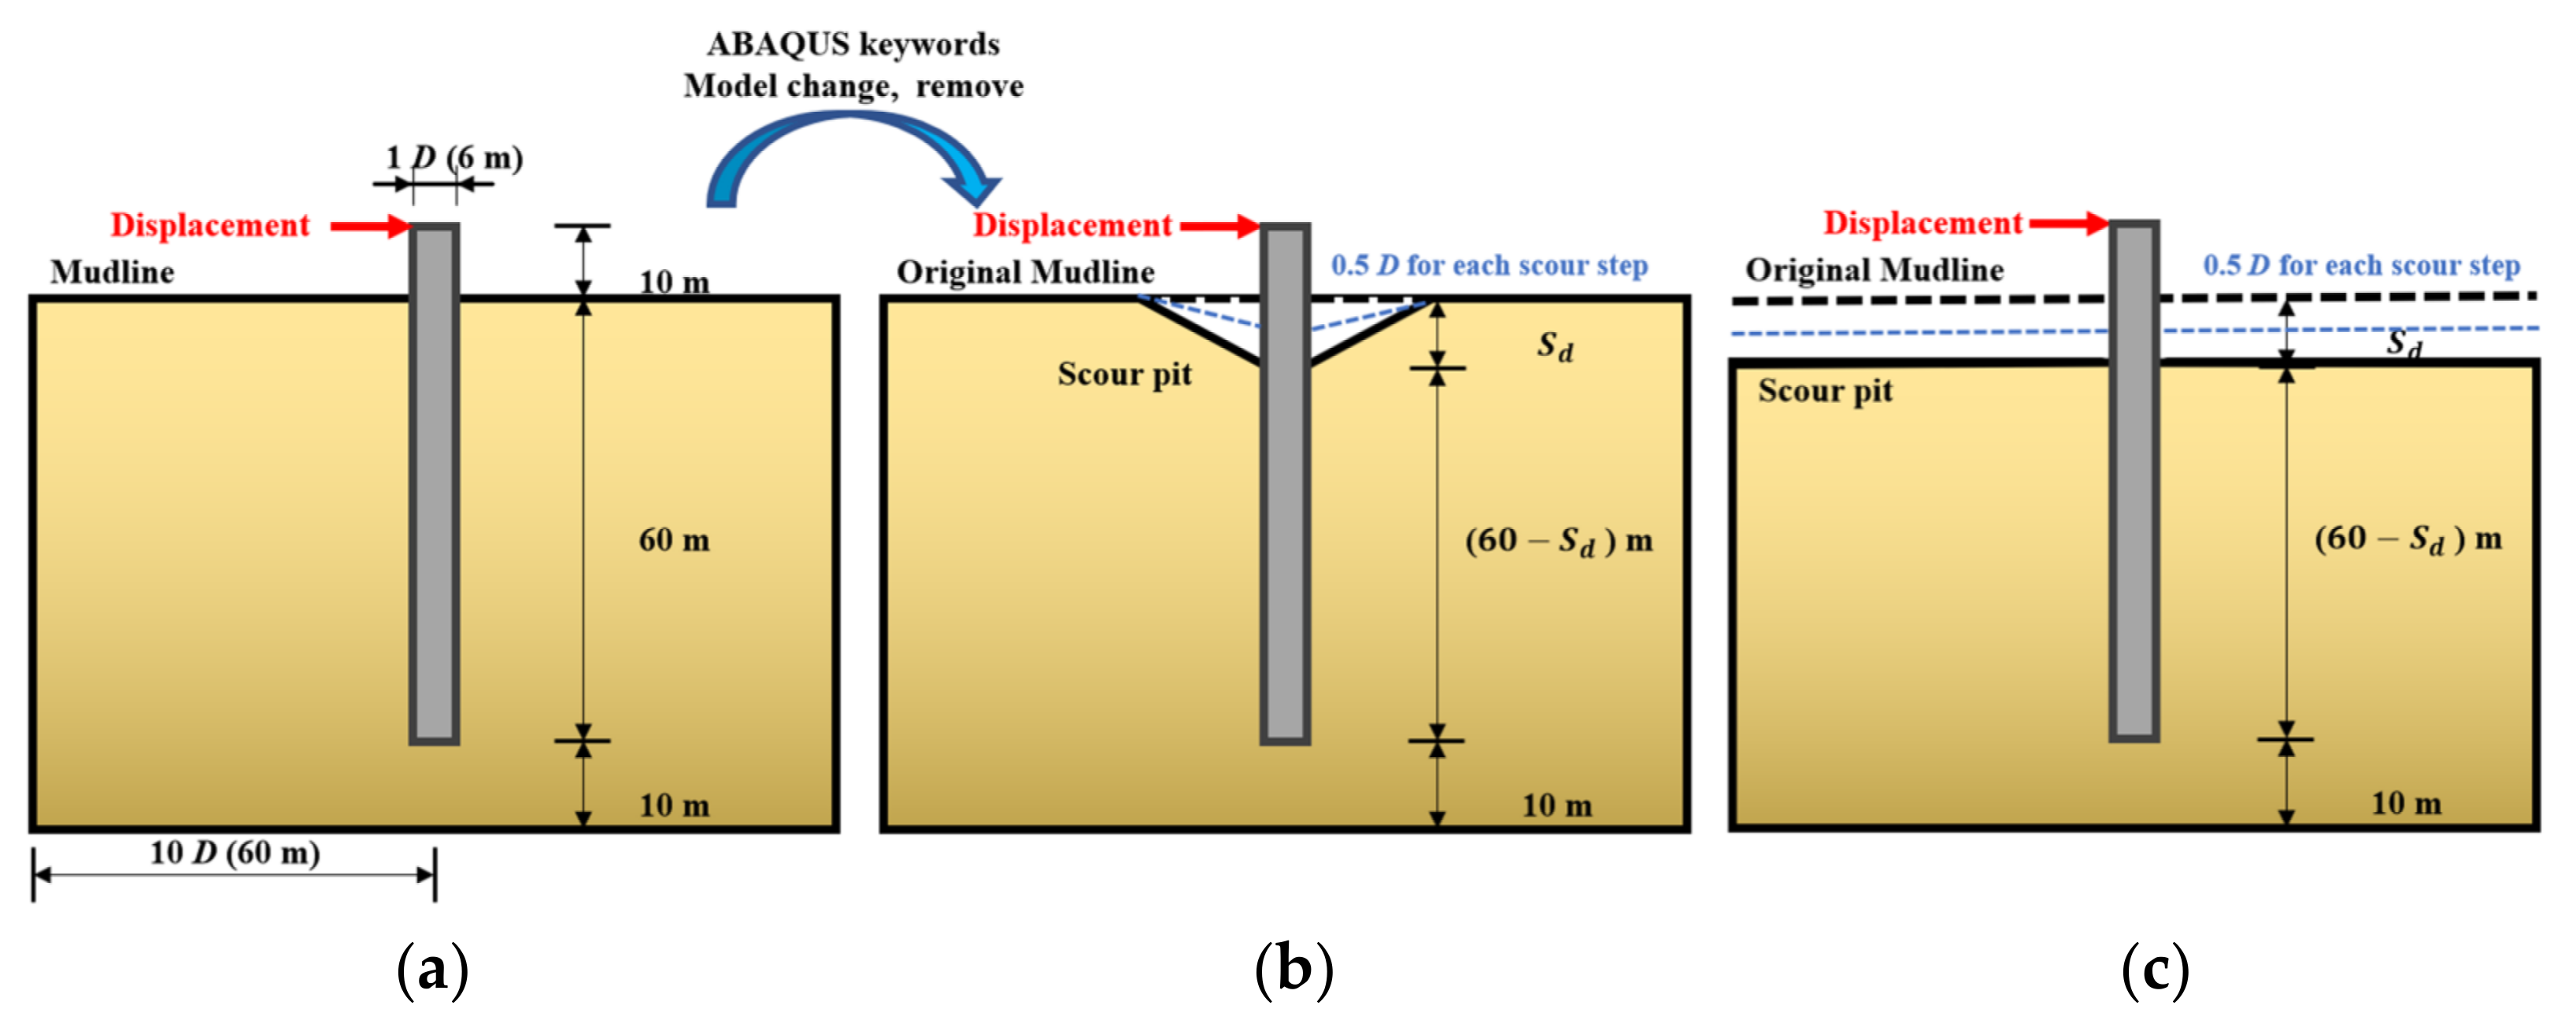
According to the conclusion of field investigation and scour model test, the local scour condition in Figure 3b forms a conical scour pit caused by the hydrodynamic loads from the no scour condition in Figure 3a. Aiming to analyze the soil horizon at each depth before and after scouring effectively, another type of scouring has been identified in Figure 3c as the general scour and the entire elevation of the soil surface is globally reduced by erosion. This scour pattern is only used to analyze the influence of the remaining overburden soil surrounding the pile on the bearing capacity of interfacial soil after scouring.
The standard stipulated that the limit scour depth of the marine structure is 1.3 . Consequently, the scour depths are identified as and for the case considered in this paper in which the slope angle is 30° based on Li and Qi’s test [9] and detailed procedures are as follows:
- Establishing the model in no scour condition (as shown in Figure 3a), then identifying the scour depth of each case;
- Defining a special step for the formation of the scour pit. According to the depth of scour in this step, the scour soil is divided into many layers by 0.5 D of each horizon Then, the scour soil is slowly removed by means of adding the keywords in the ABAQUS input file, i.e., Model change, remove as shown in Figure 3b. This operation models the slow unloading process during scouring, and considers the influence of the stress relief;
- Applying the displacement on the pile head. Making sure that the deflection of the pile-soil interaction is developed uninterruptedly;
- Changing the depth of the scour pit base, and the same displacement is applied to the structure.
4. Numerical Results
4.1. The Variation of Pile Response Subjected to Scour
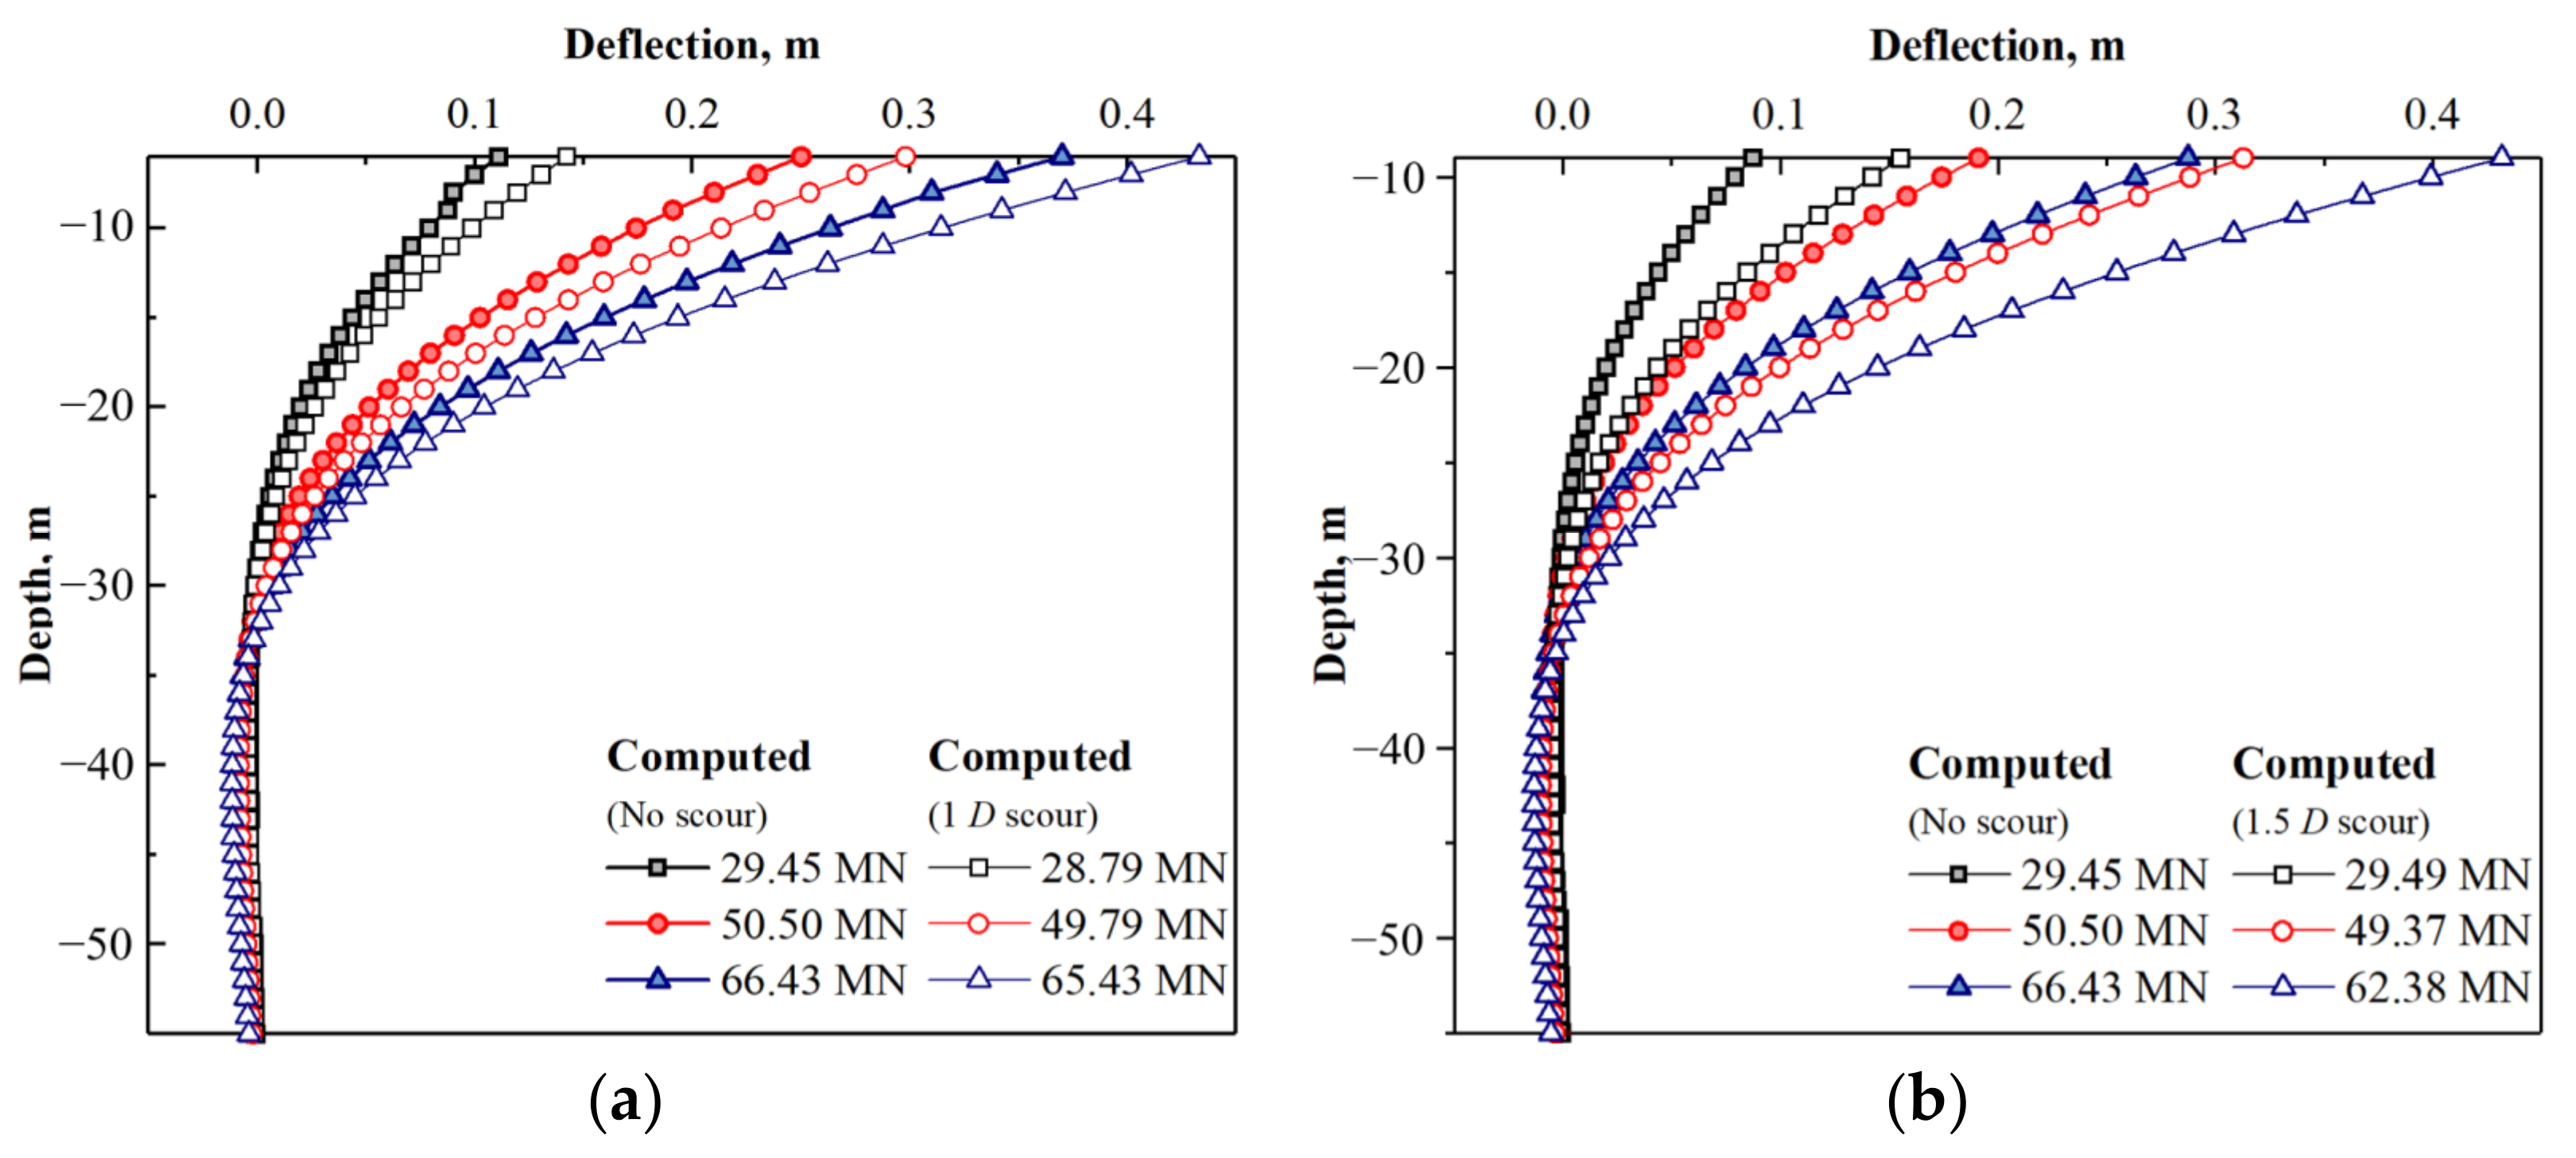
Figure 4 presents the comparison of the variation of the pile deflection at two different scour depths. By comparison, there is an evident impact of stress relief in the shallow horizon of remaining soil on the pile response after scouring as the stress state changes. More specifically, the maximum deflections are 18% and 26%, respectively, higher than the original soil. Based on the given lateral load, the point of contraflexure is in the depth of 36 m (6D), slightly affecting the scour depth. Moreover, the deflection below the depth of 35 m is negligible when the pile is flexible. Notably, the deflection development is similar to Qi’s centrifuge test result of local scour condition [17]. As the scour depth around the pile runs up, the effective soil resistance fails, resulting in the drop of overall lateral bearing capacity. Meanwhile, it can be observed that the lateral resistance of the remaining soil is affected as the scour depth grows, namely, the embedding depth of the pile decreases.
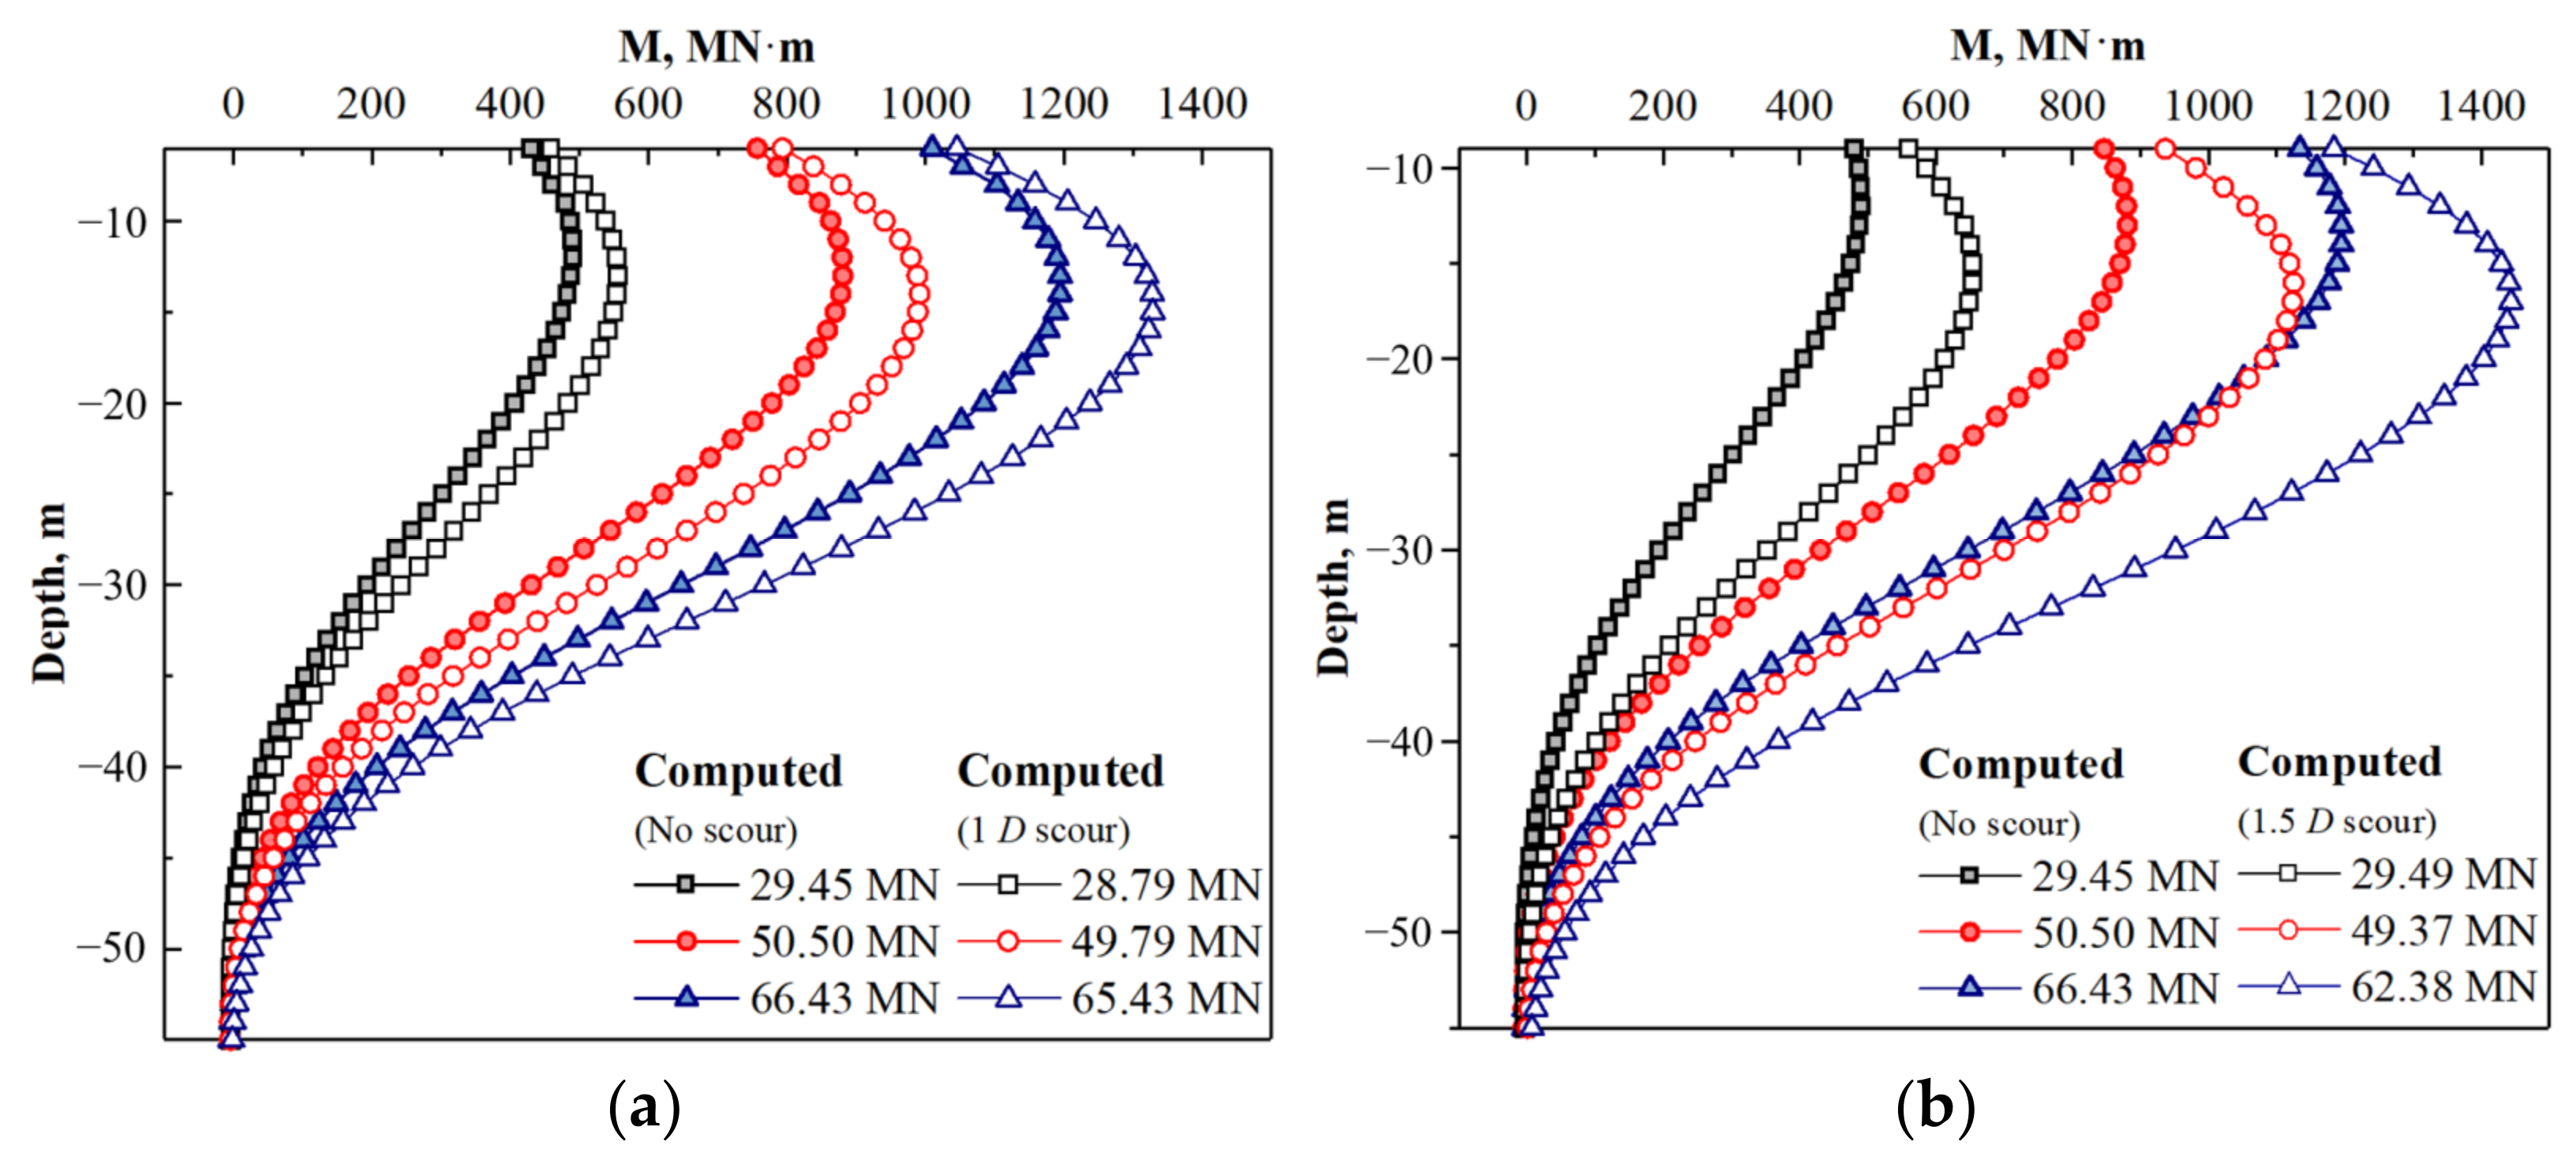
Figure 5a,b exhibits the bending moment changed for two scour depths. As the scour expands the load eccentricity of the pile, Figure 5 displays the variation of the bending moment along the vertical depth for two various scour depths. As shown in the figure, the load lies in the eccentricity of the pile due to the scour expanding. Influenced by the lateral force, the maximum bending moment of and are respectively 18% and 26% higher than that of the original soil. The maximum bending moments along with the rest of the vertical depth increase to 1 m for and 3 m for .
On the other hand, the lateral resistance of the shallow horizon plunged apparently as the scour depth increases. The influence of scouring mainly affects the area from the remaining depth to 30 m can be explained by the large-diameter flexible monopiles in this study. The influence of the scouring depth on the flexible pile is less than that of the rigid pile after reaching the limit lateral displacement. Therefore, it is necessary to refer to the variation of load-displacement behavior at different depths for further analysis at given lateral displacement on the pile head.
4.2. Lateral Load-Displacement Behavior from Simulation Results
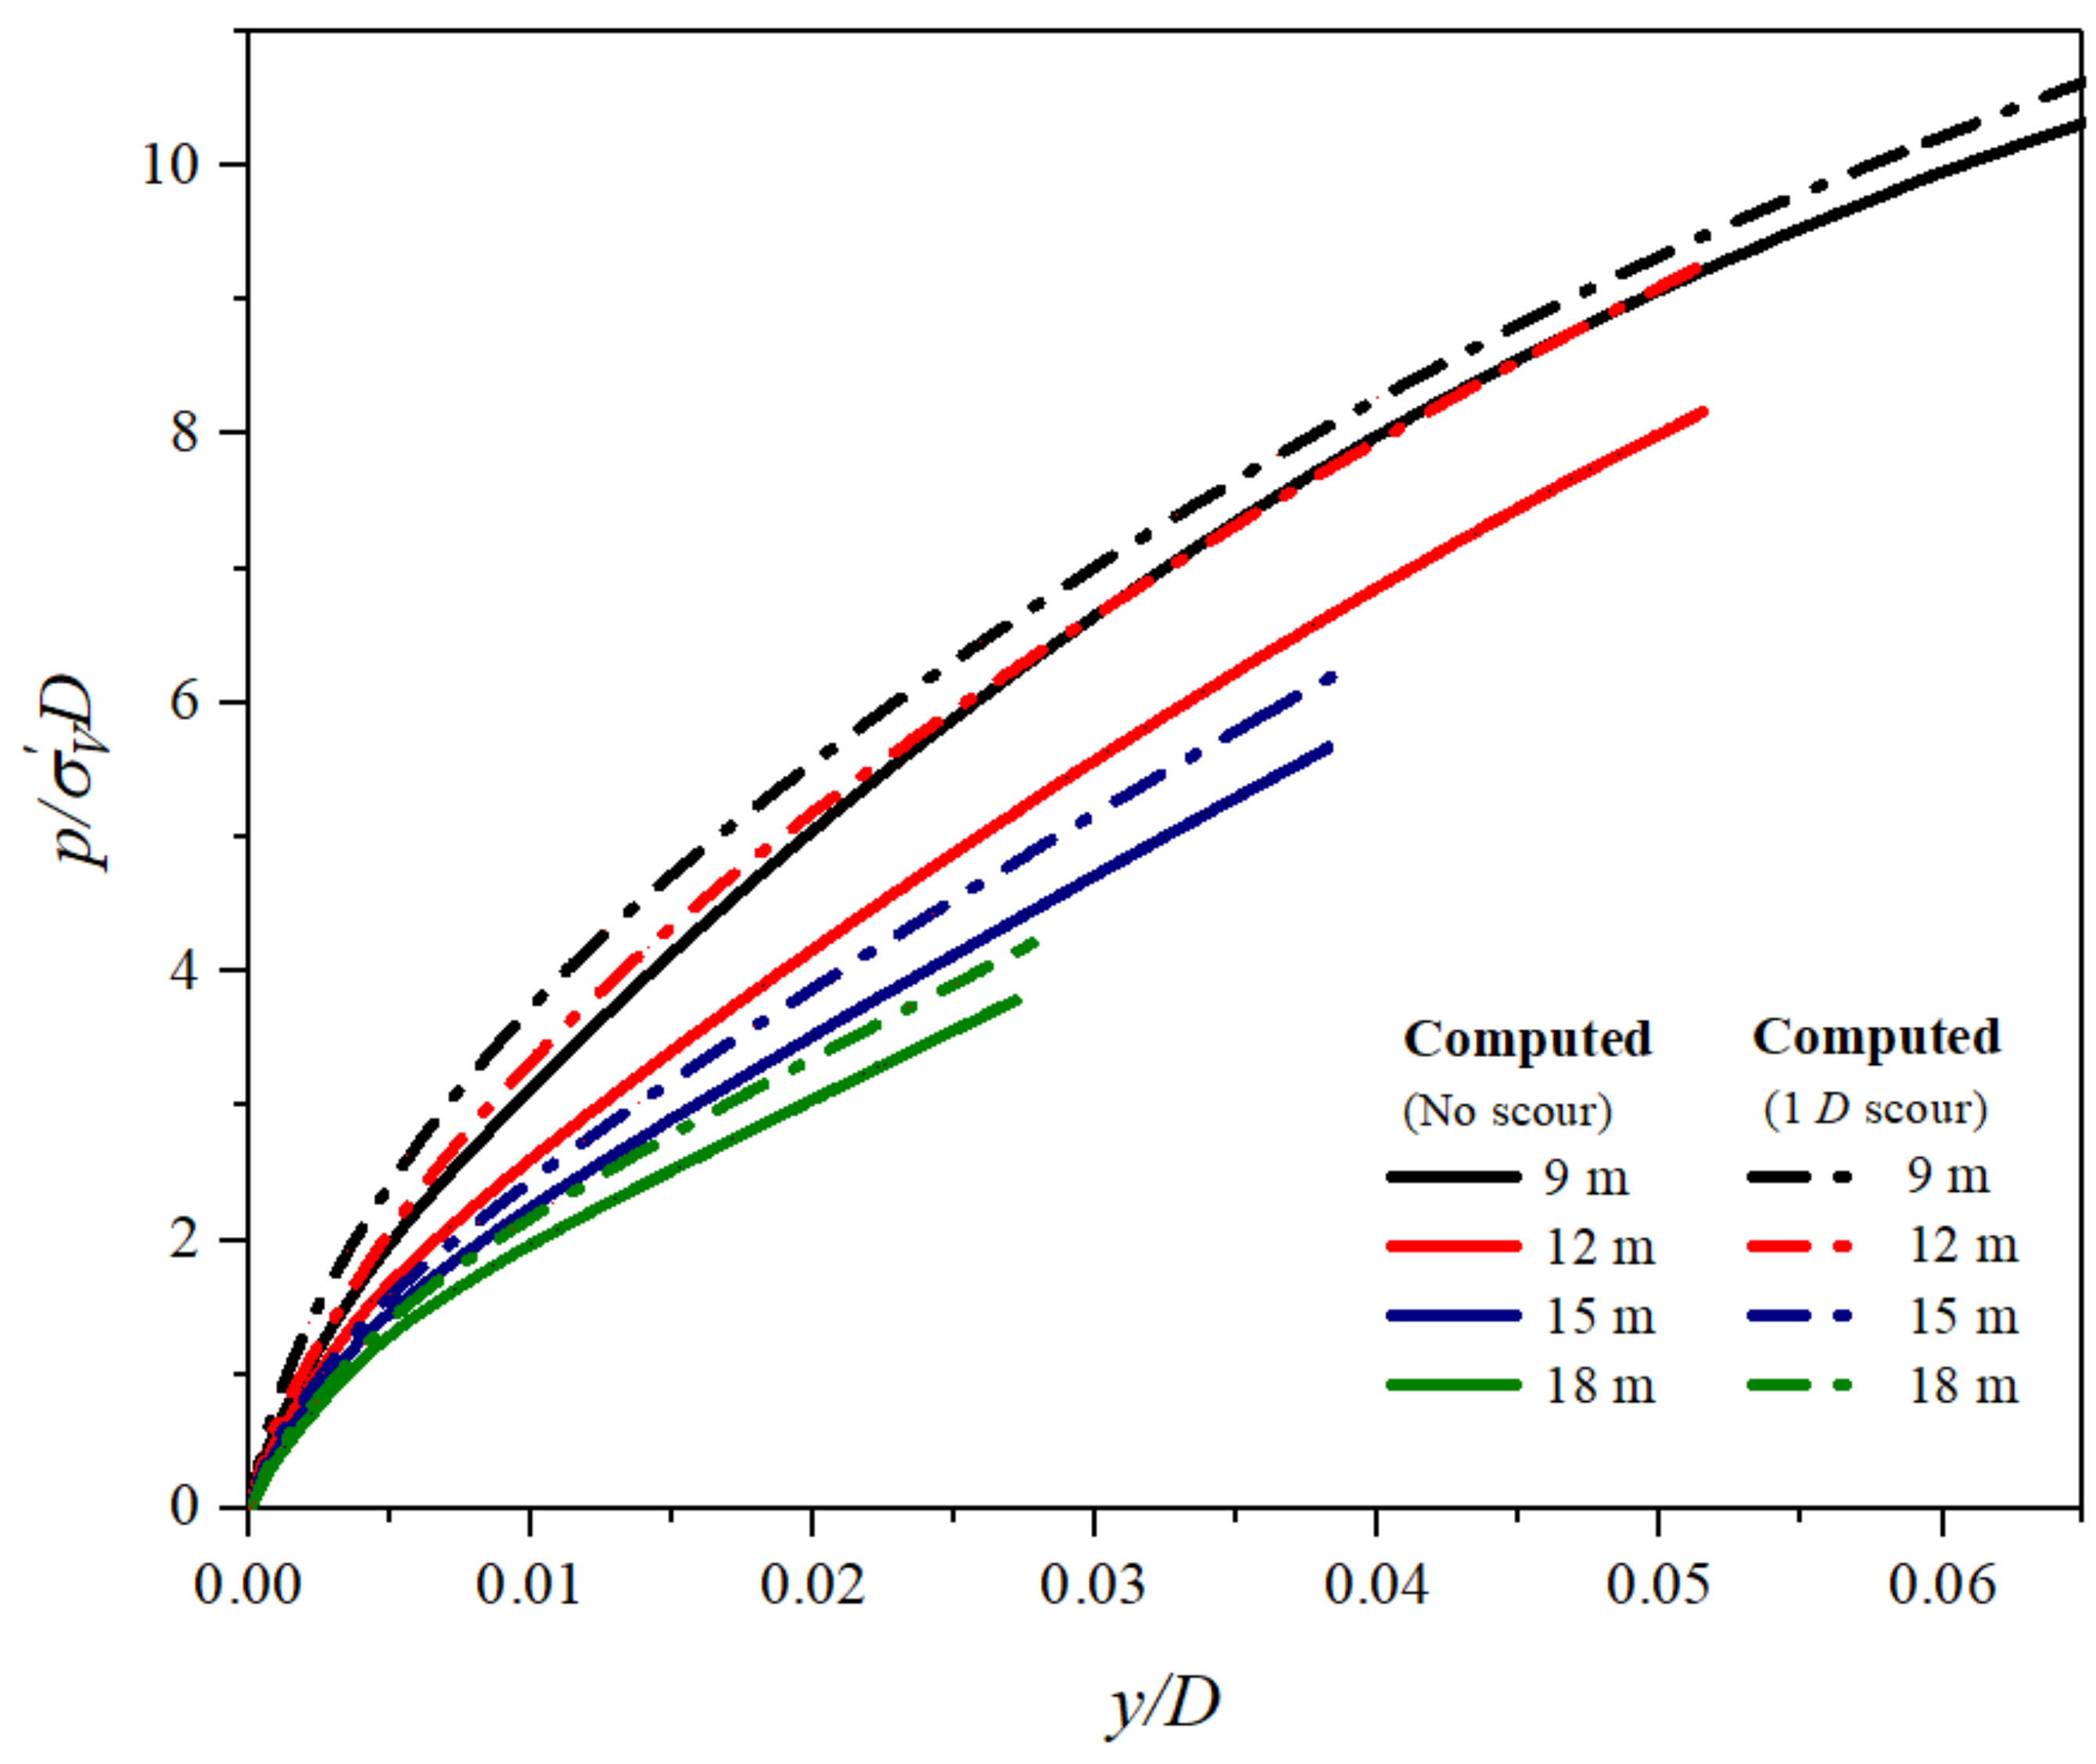
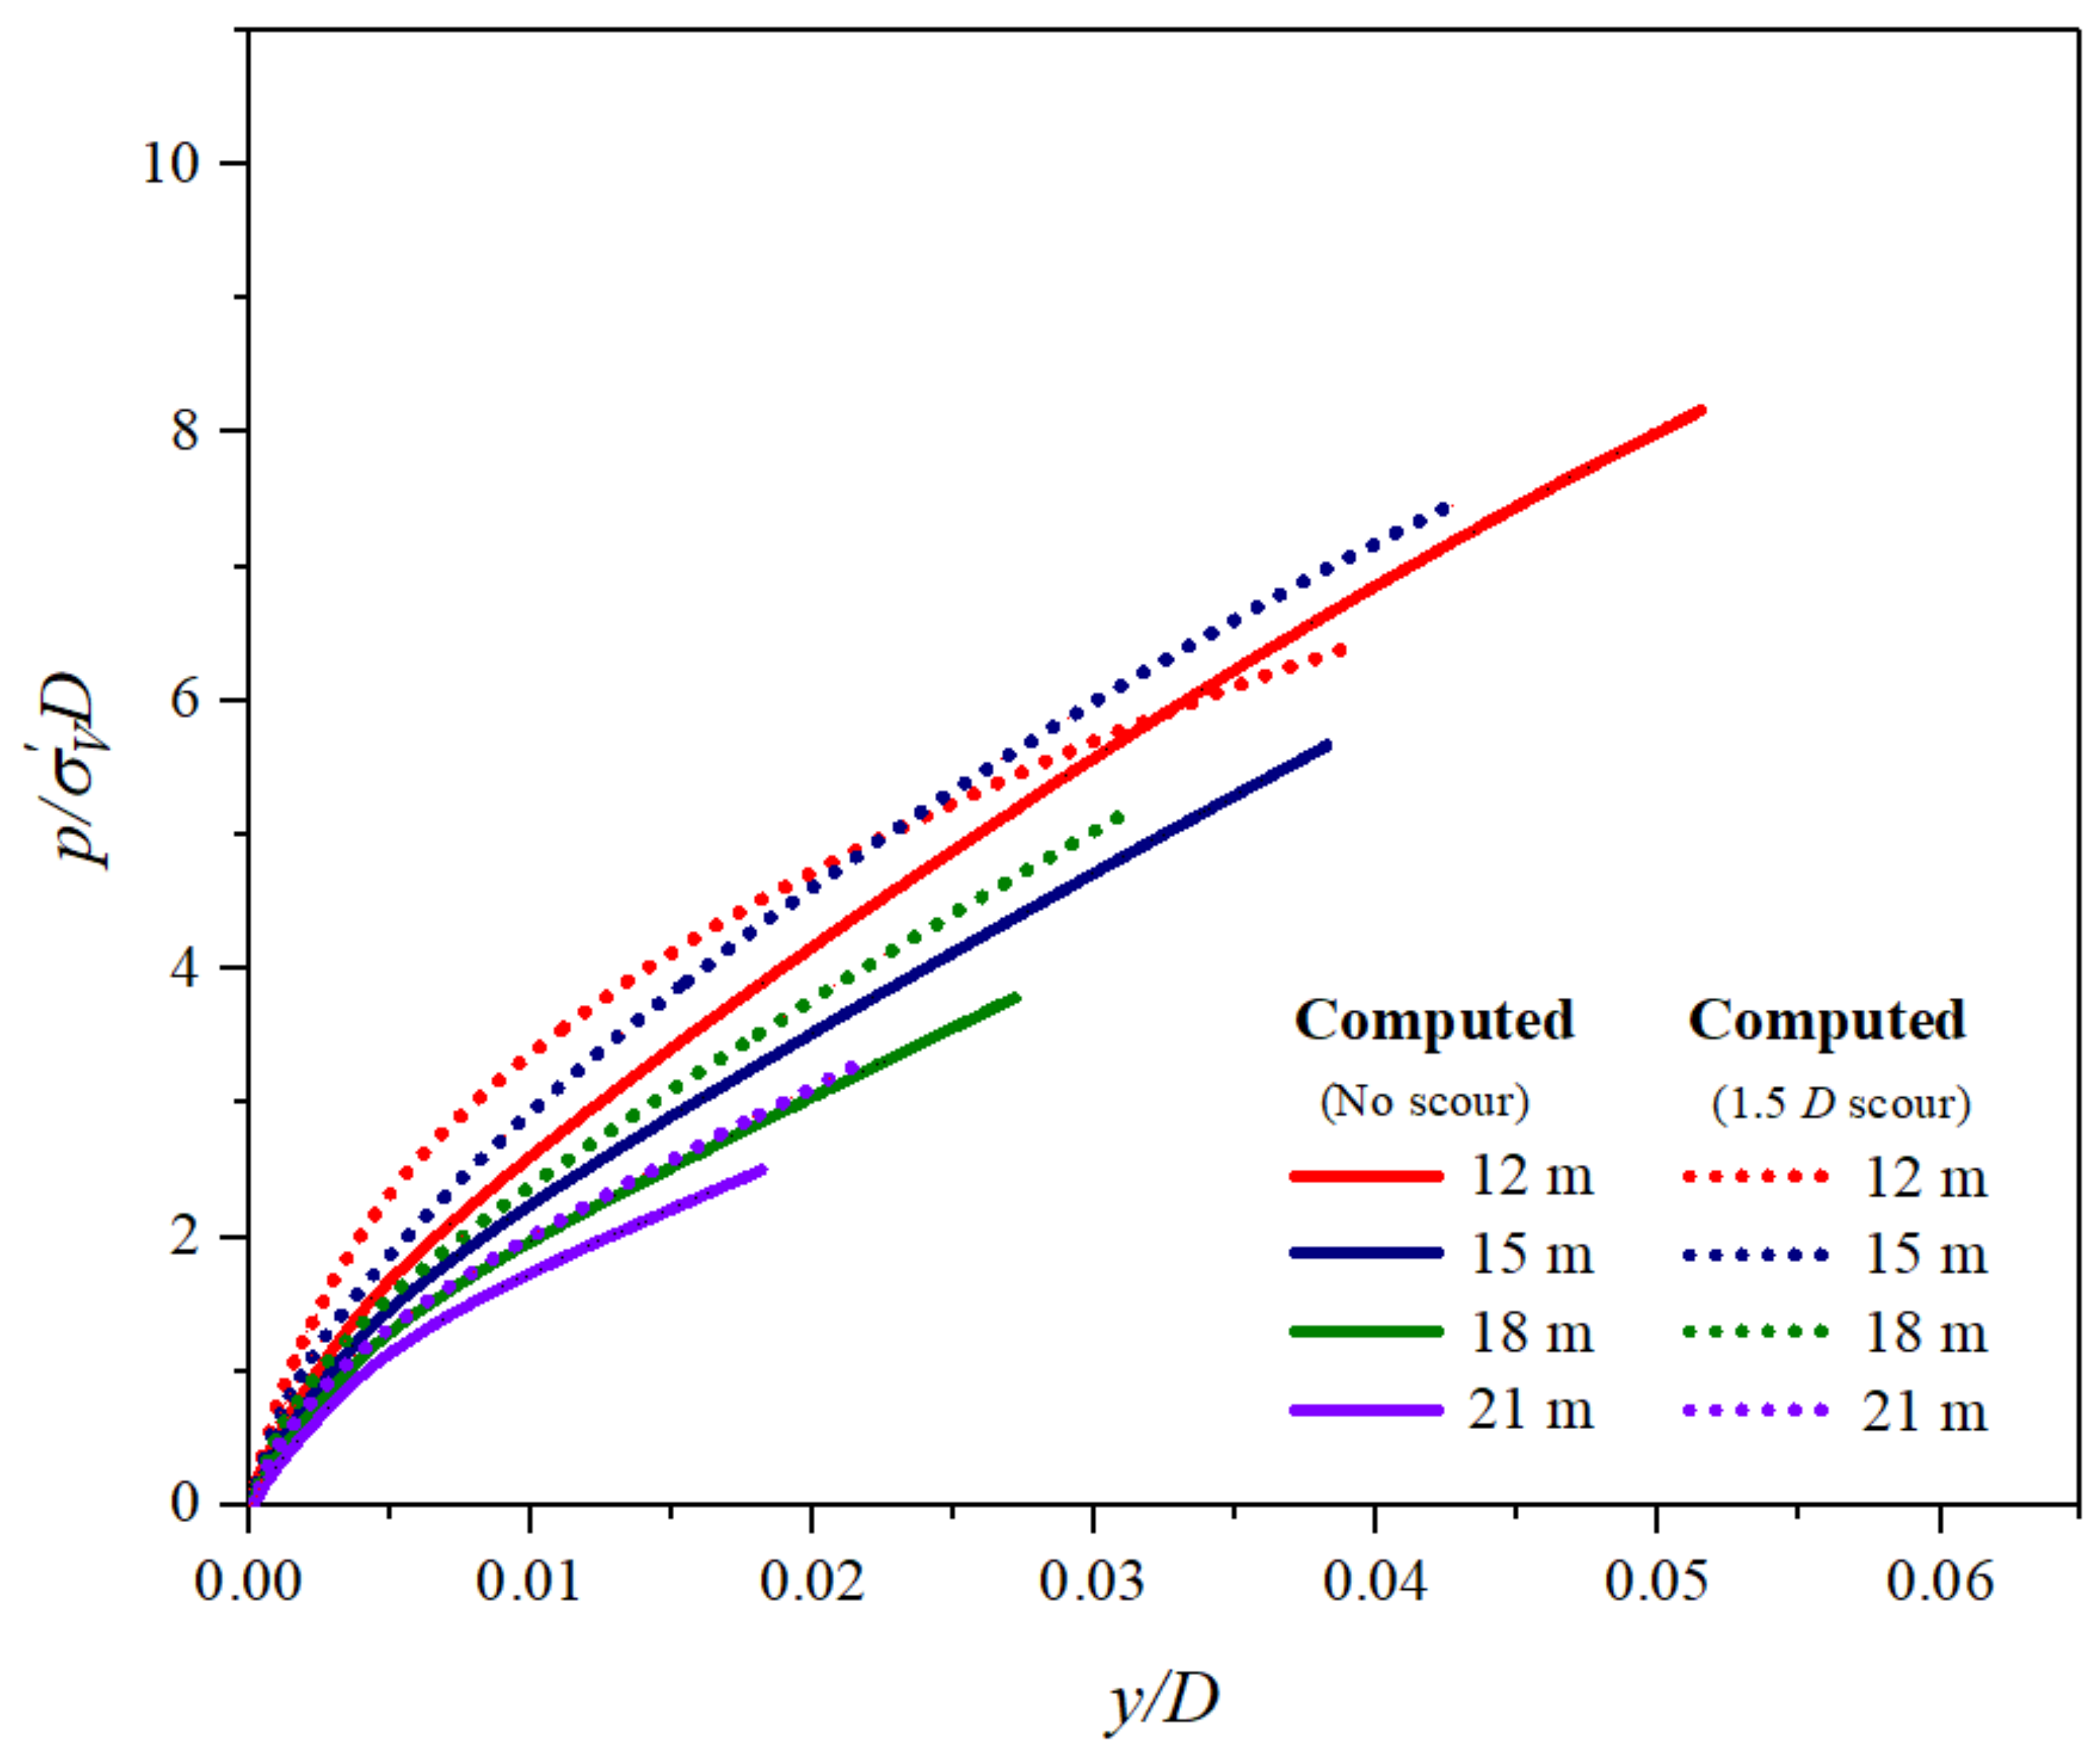
In a view to analyzing the pile-soil reaction of the lateral load, the dimensionless p-y curves at different scour depths are sorted in this research. After the displacement is applied to the pile, head develops to the ultimate deflection of 0.2 D (1.2 m), the dimensionless p-y curves of in the local scour condition in each horizon is slightly stiffer than that at the same depths than original soil in Figure 6. While the dimensionless p-y curve changed in two conditions with the difference of the depth in Figure 7. In the deeper horizon of 13–30 m, the phenomenon is similar to cases, in which resistance is still stiffer than that in the same horizon in original soil. The rigidity enhancement of the remaining interface soil in the deeper horizon becomes more obvious with the rise of scour depth. The stiffer p-y curves resulting from the local scour condition are initially explained by the increase of soil resistance for the remaining soil horizon. The result on Qi’s centrifuge test and 3D simulation indicates that the p–y response at a given soil horizon is just affected by shallow depths and, for most of the profile, the lateral soil stiffness at a given depth below the scour base is greater than that at the same relative depth below the original mudline [17,18], which is similar to the result of 1 D depth scour in this research.
Under the deeper scour depth, the p-y curves in the shallow horizon of remaining soil are weaker than original soil in the depth of 0.5–1 D. The lateral sand resistance declines and reaches the ultimate limit state earlier, which is different from the past test and simulation results. The mainstream test method could hardly reflect the characteristics of the cohesionless soil again as it can be easily disturbed and the 3D finite numerical simulation is difficult to accurately capture the variation characteristics of the lateral resistance of the shallow horizon of saturated cohesionless soil. The change of soil horizon under lateral load before and after scouring is analyzed.
4.3. The Analysis of the Remaining Sand Horizon
In the shallow scour depth of in local scour conditions, the whole horizon of the remaining interface soil changes stiffer. Differently, in the scour depth of , the remaining sand can be divided into two characteristics in local scour condition:
- The shallow sand horizon is softened and is subjected to scour obviously when the lateral sand resistance is lower than that at the same depth under original soil.
- The deeper depth is 10–20% hardener than that at the same horizon before.
For variation 1, a similar phenomenon of lateral sand resistance reduction after scouring was found in Li’s centrifuge test [9] while variation 2 was found in Qi’s experiment and simulation [17,18] accordingly. The simulation in this research observes a combination of both phenomena simultaneously, which is related to the state-dependency dilatancy of the interface soil. In the analysis of lateral soil resistance after soil excavation, Zheng et al. [27] highlights the effect of stress relief on soil strength during the soil removal and the scour can also be regarded as a slow removal process of the shallow horizon, even for the slow removal process of shallow horizon under scouring. The shallow horizon undergoes stress relief, the interaction between the changed soil particles. Therefore, the change of lateral soil resistance can be analyzed by the stress state of the soil interface. Based on the existing sand model, the state variation curve of the remaining sand in e-p’ space is sorted out to investigate the stress-strain development characteristics in different scour conditions.
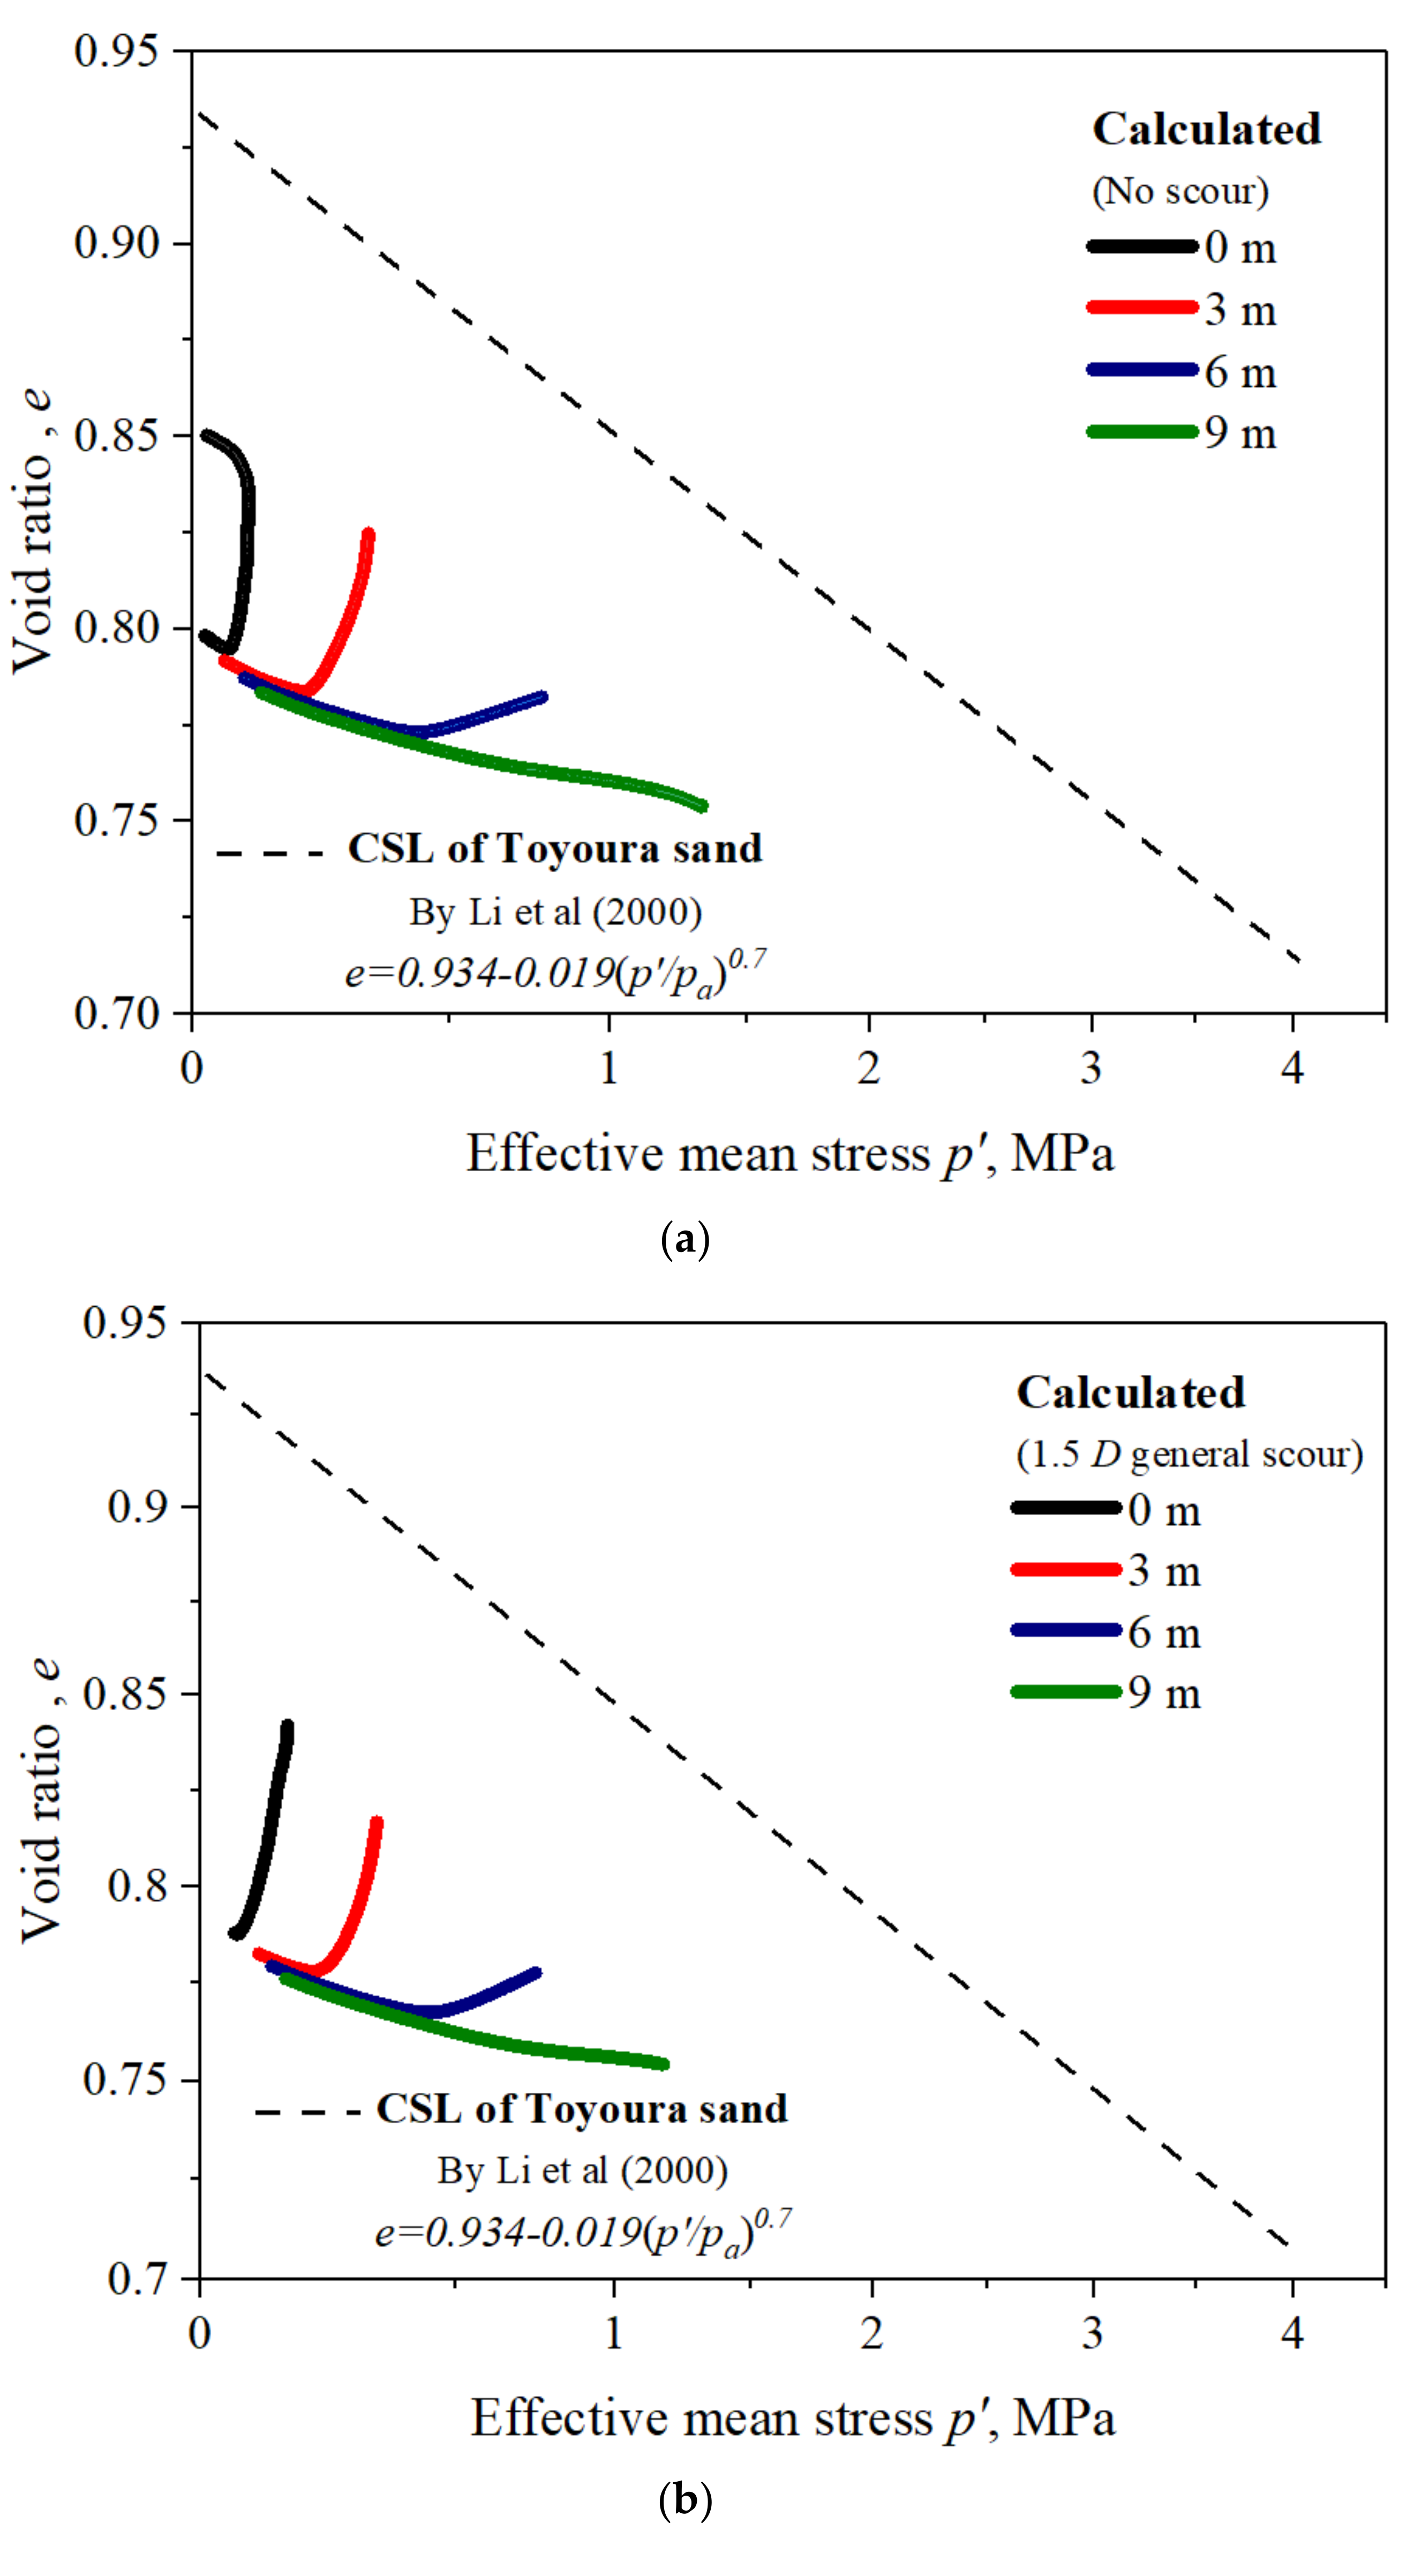
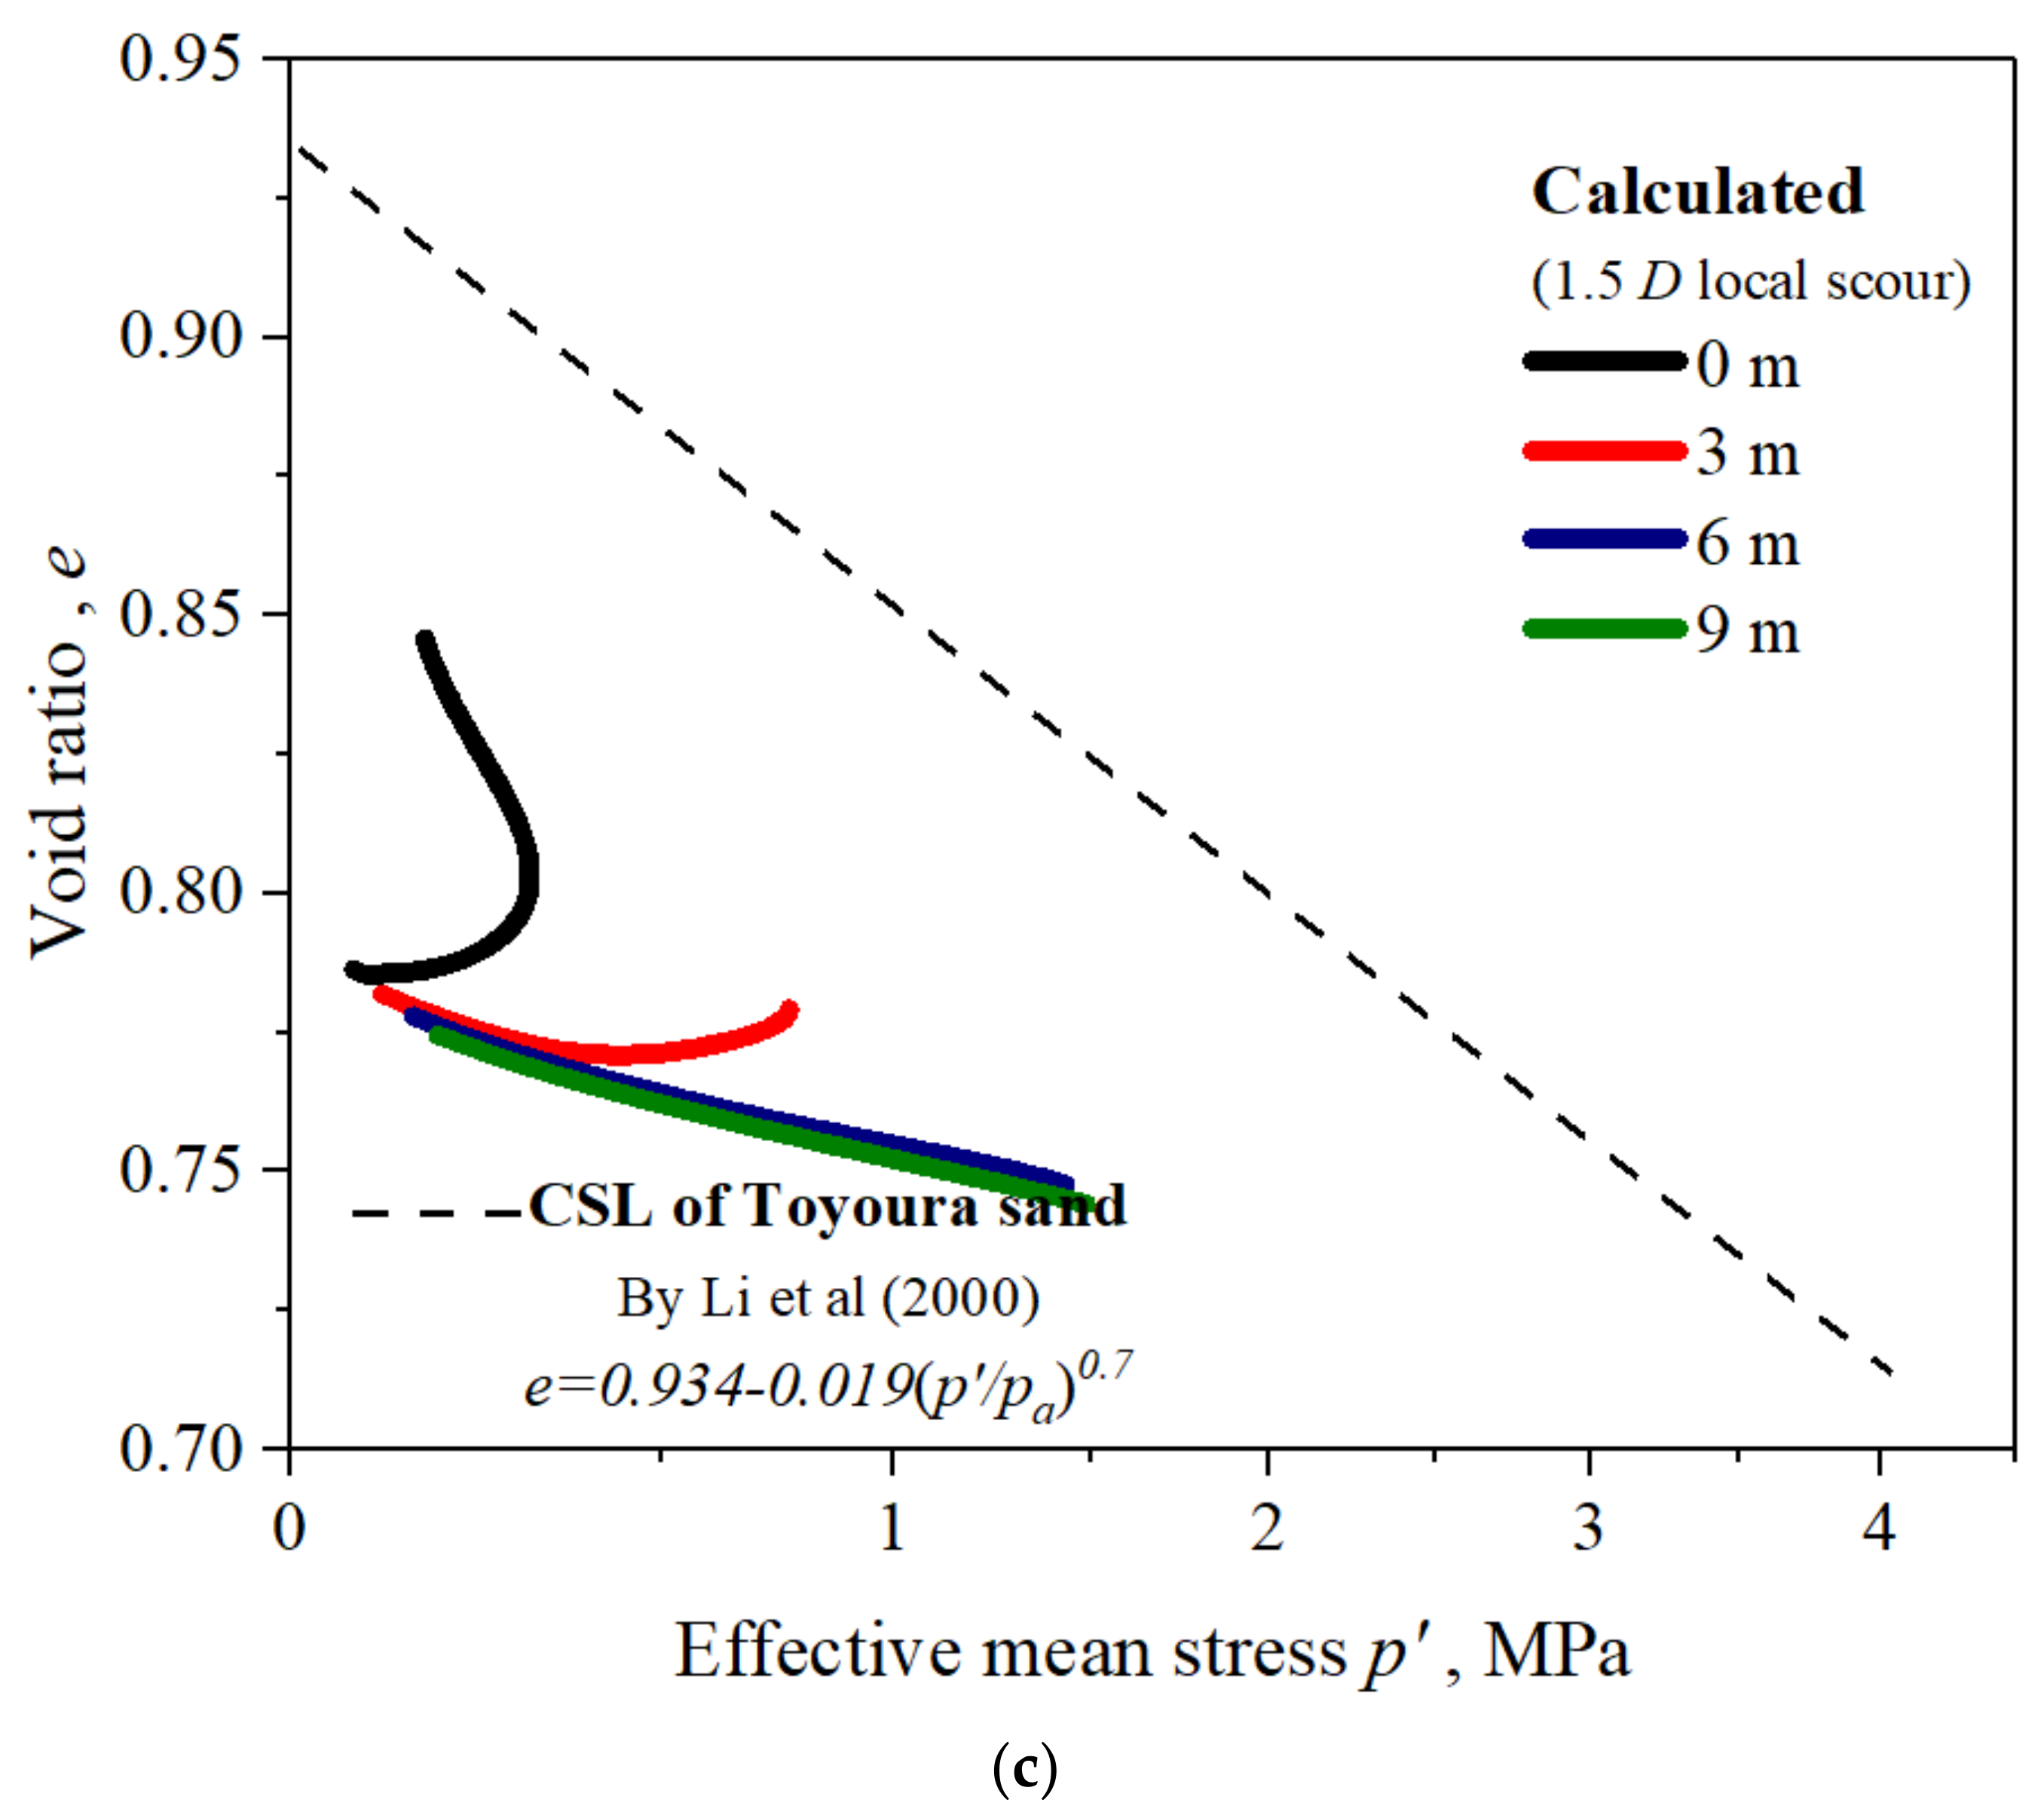
To analyze the characteristics of remaining soil in different scour conditions better, the simulation makes a comparison of three types of soil conditions in Figure 3. This research captures the variation of the stress state of interface soil on the axial compression side. Thus, the research defines the depth calculated from the mudline as the absolute depth , and the depth calculated from the top of the remaining soil as the relative depth . Comparison in different states of sand at the same relative depth can be used to evaluate the characteristics of soil development. The model simulates the lateral loading process of piles in different scour conditions, and then extracts the void ratio and the effective stress at the compressive interface of the pile-soil in e-p’ space in Figure 8. The critical state line (CSL) is collated from the total of 17 shear loading tests accomplished by Verdugo & Ishihara and the critical-state framework is also verified by Li’s state-dependent dilatancy [15] which can be used in the constitutive study of Toyoura sand. In e-p’s space, no matter what the initial state of the sand is, it will eventually develop to the critical state line.
Figure 8a,b displays the state variation of the interface soil in each relative depths during pile displacement in the no scour and the general scour condition respectively. In the analysis of the variation of interfacial soils at the compression side of the scour pit base in each horizon, the curve in the same relative depth in the general scour condition is similar to that in the no scour condition. The dilatancy on the surface of the remaining sand becomes more obvious after the upper soil layer has been scoured away. The lateral soil resistance is stronger than that of lower void ratio and denser soil.
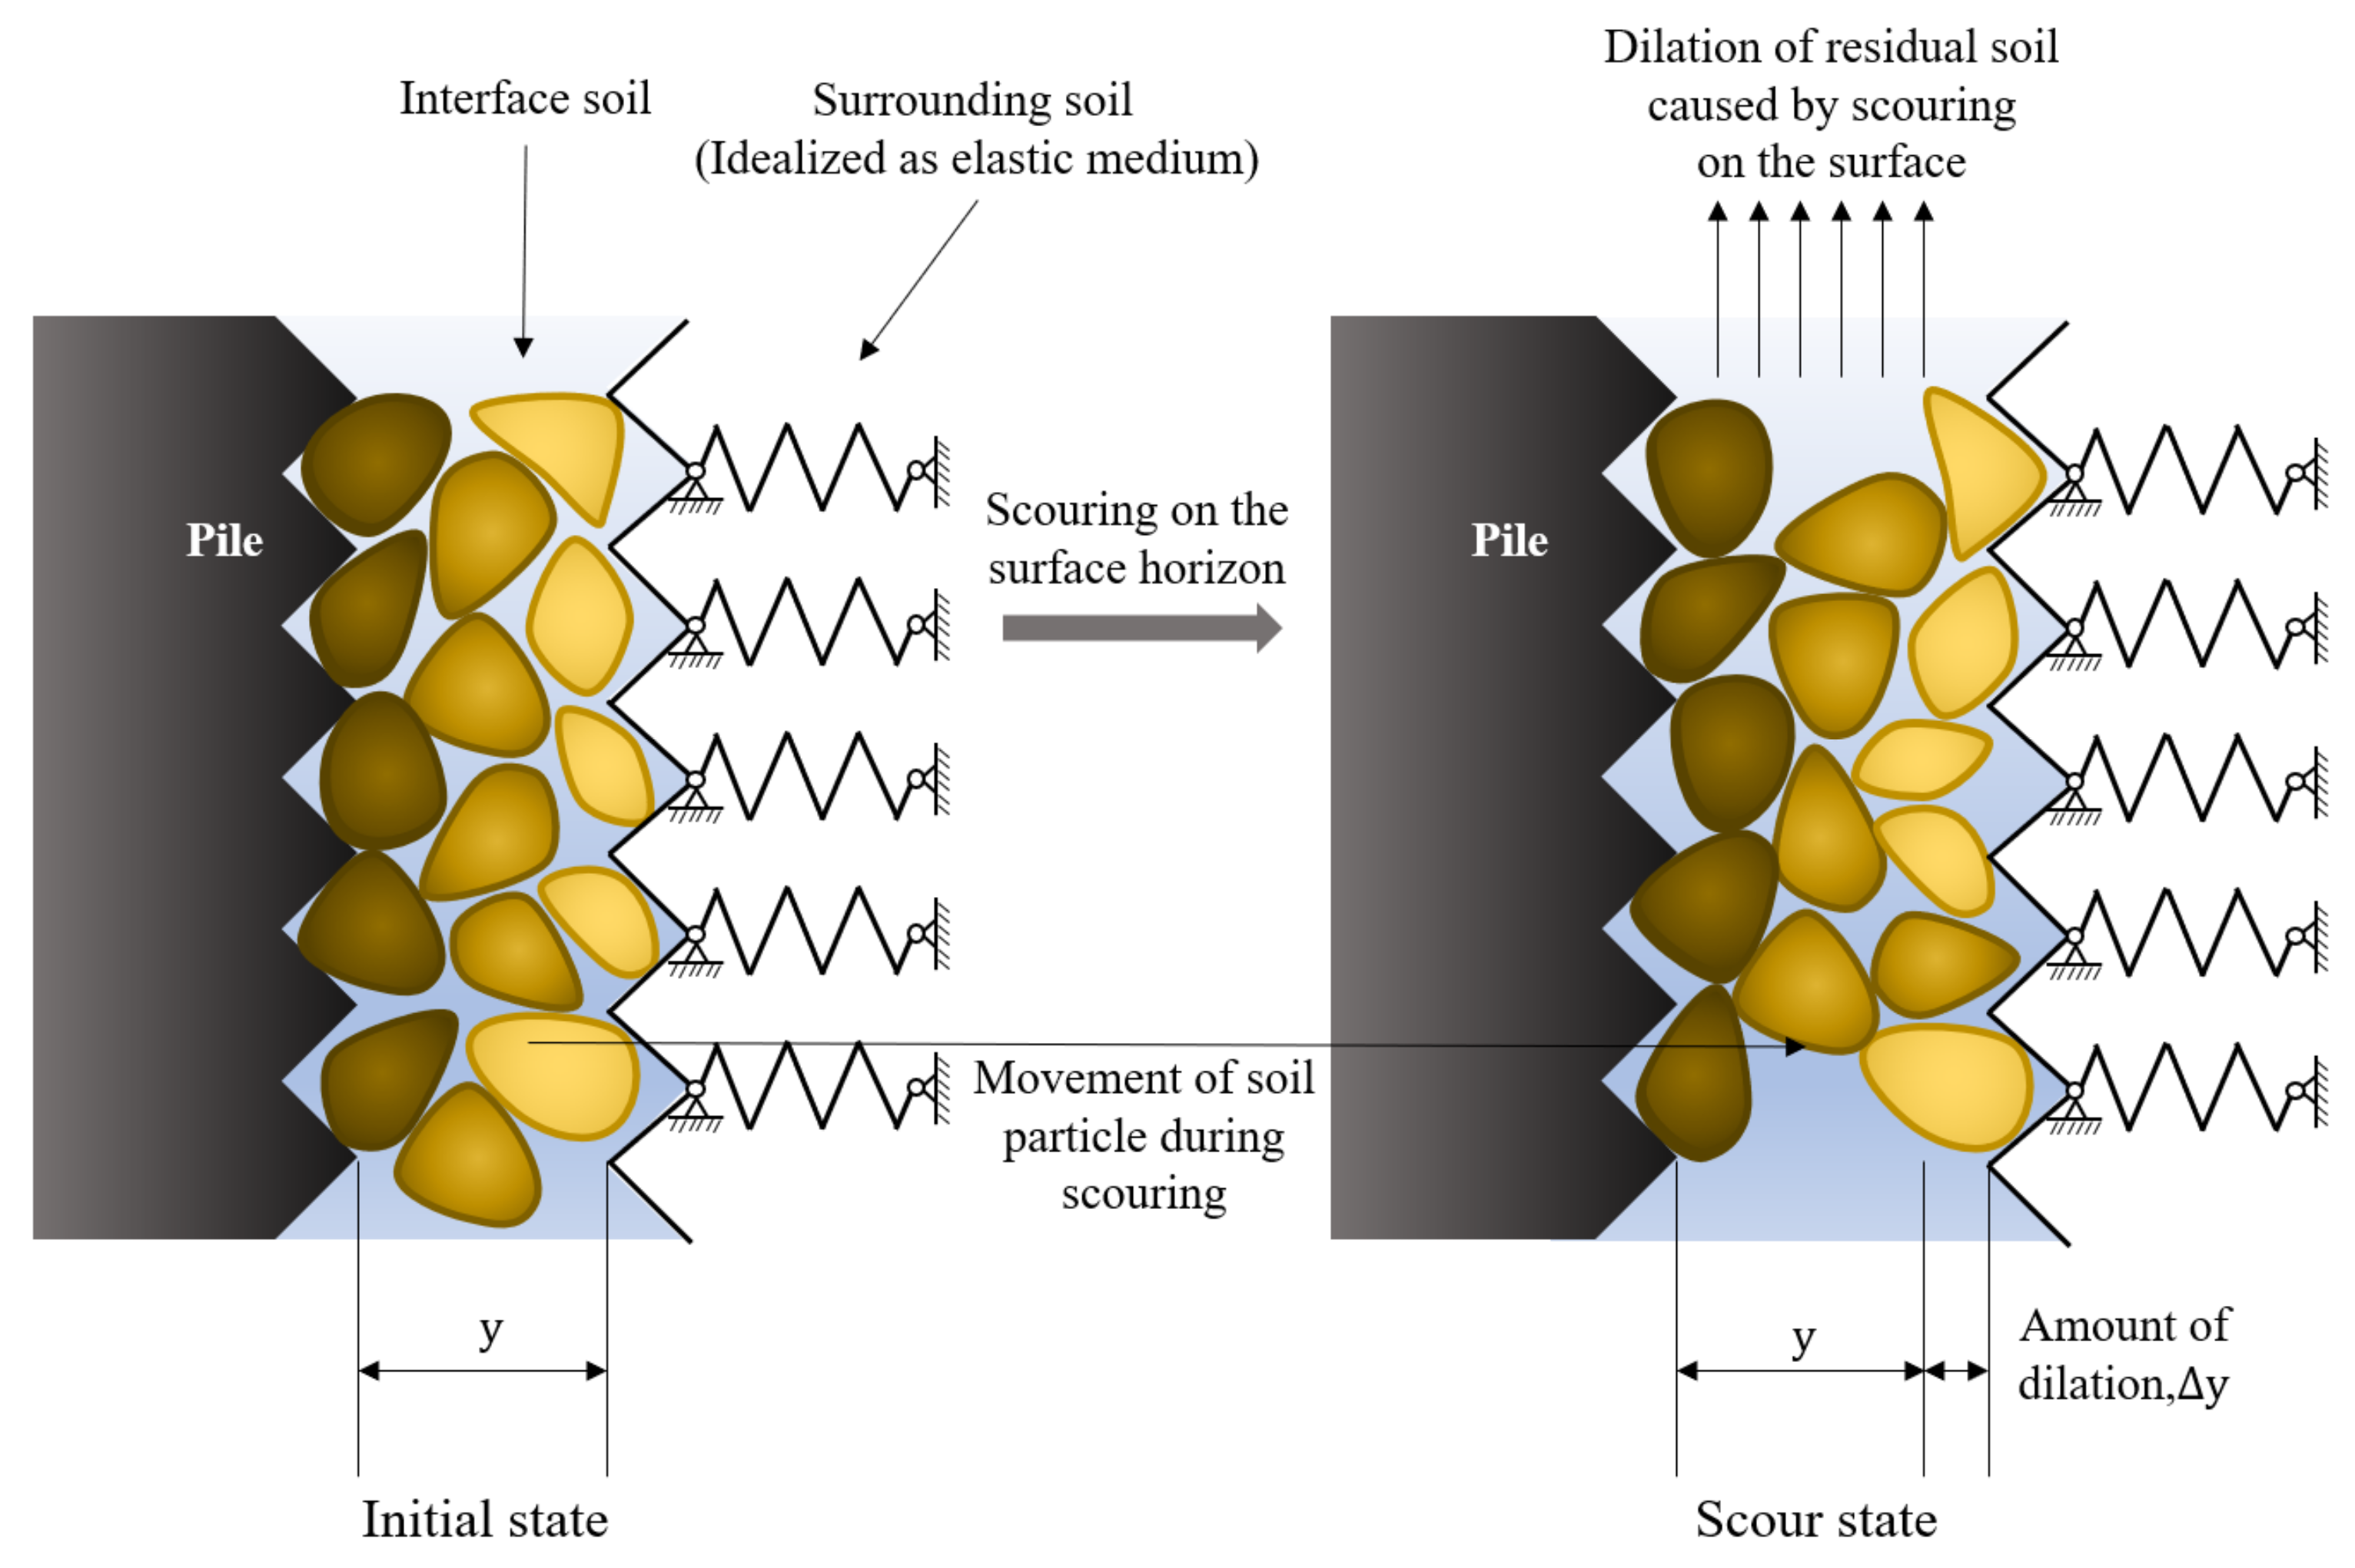
In the local scour condition in Figure 8c, the variation of stress state in the same effective depth differs entirely from that of the other two conditions. The surface of the remaining sand center has a slower dilatancy characteristic, as shown in Figure 9. The dilation of the shear band surrounding the pile plays a decisive role in the resistance of piles in sand. When the volume of soil is increased by dilation, the remaining interface soil can withstand more growth of the normal stress and thus the failure of the soil structural occurs earlier. The volume enlargement is also not obvious in lower soil. In the same ultimate displacement on the pile head, the depth below 1 D is a pure compression zone where the relative depth of dilatancy is shallower than that in the scour condition without slope angle.
Compared with the state development in no scour and general scour conditions, interface soil at the same relative depth in local scour conditions can sustain more stress aggregation when the void ratio changes simultaneously. This phenomenon is similar to the result of the simulation proposed by Qi et al. [18] which can be attributed to the inhibition of the remaining overburden soil surrounding the pile to dilatancy and the structural failure. In the process of soil extrusion from the pile displacement, the shallow horizon of interface soil is sheared but the surrounding soil limits the volume change of sand. The shallow interface sand in the center of the scour pit can release more thoroughly without any damage and the expanding surface sand will compress the underlying sand horizon at the same time, boosting its strength. Normal stress increases in that the dilation restrained by the surrounding soil is crucial to the lateral soil resistance. In the entire remaining pile-soil interface, the lateral soil resistance is eventually reduced at the shallow horizon while it increases at the underlying horizon.
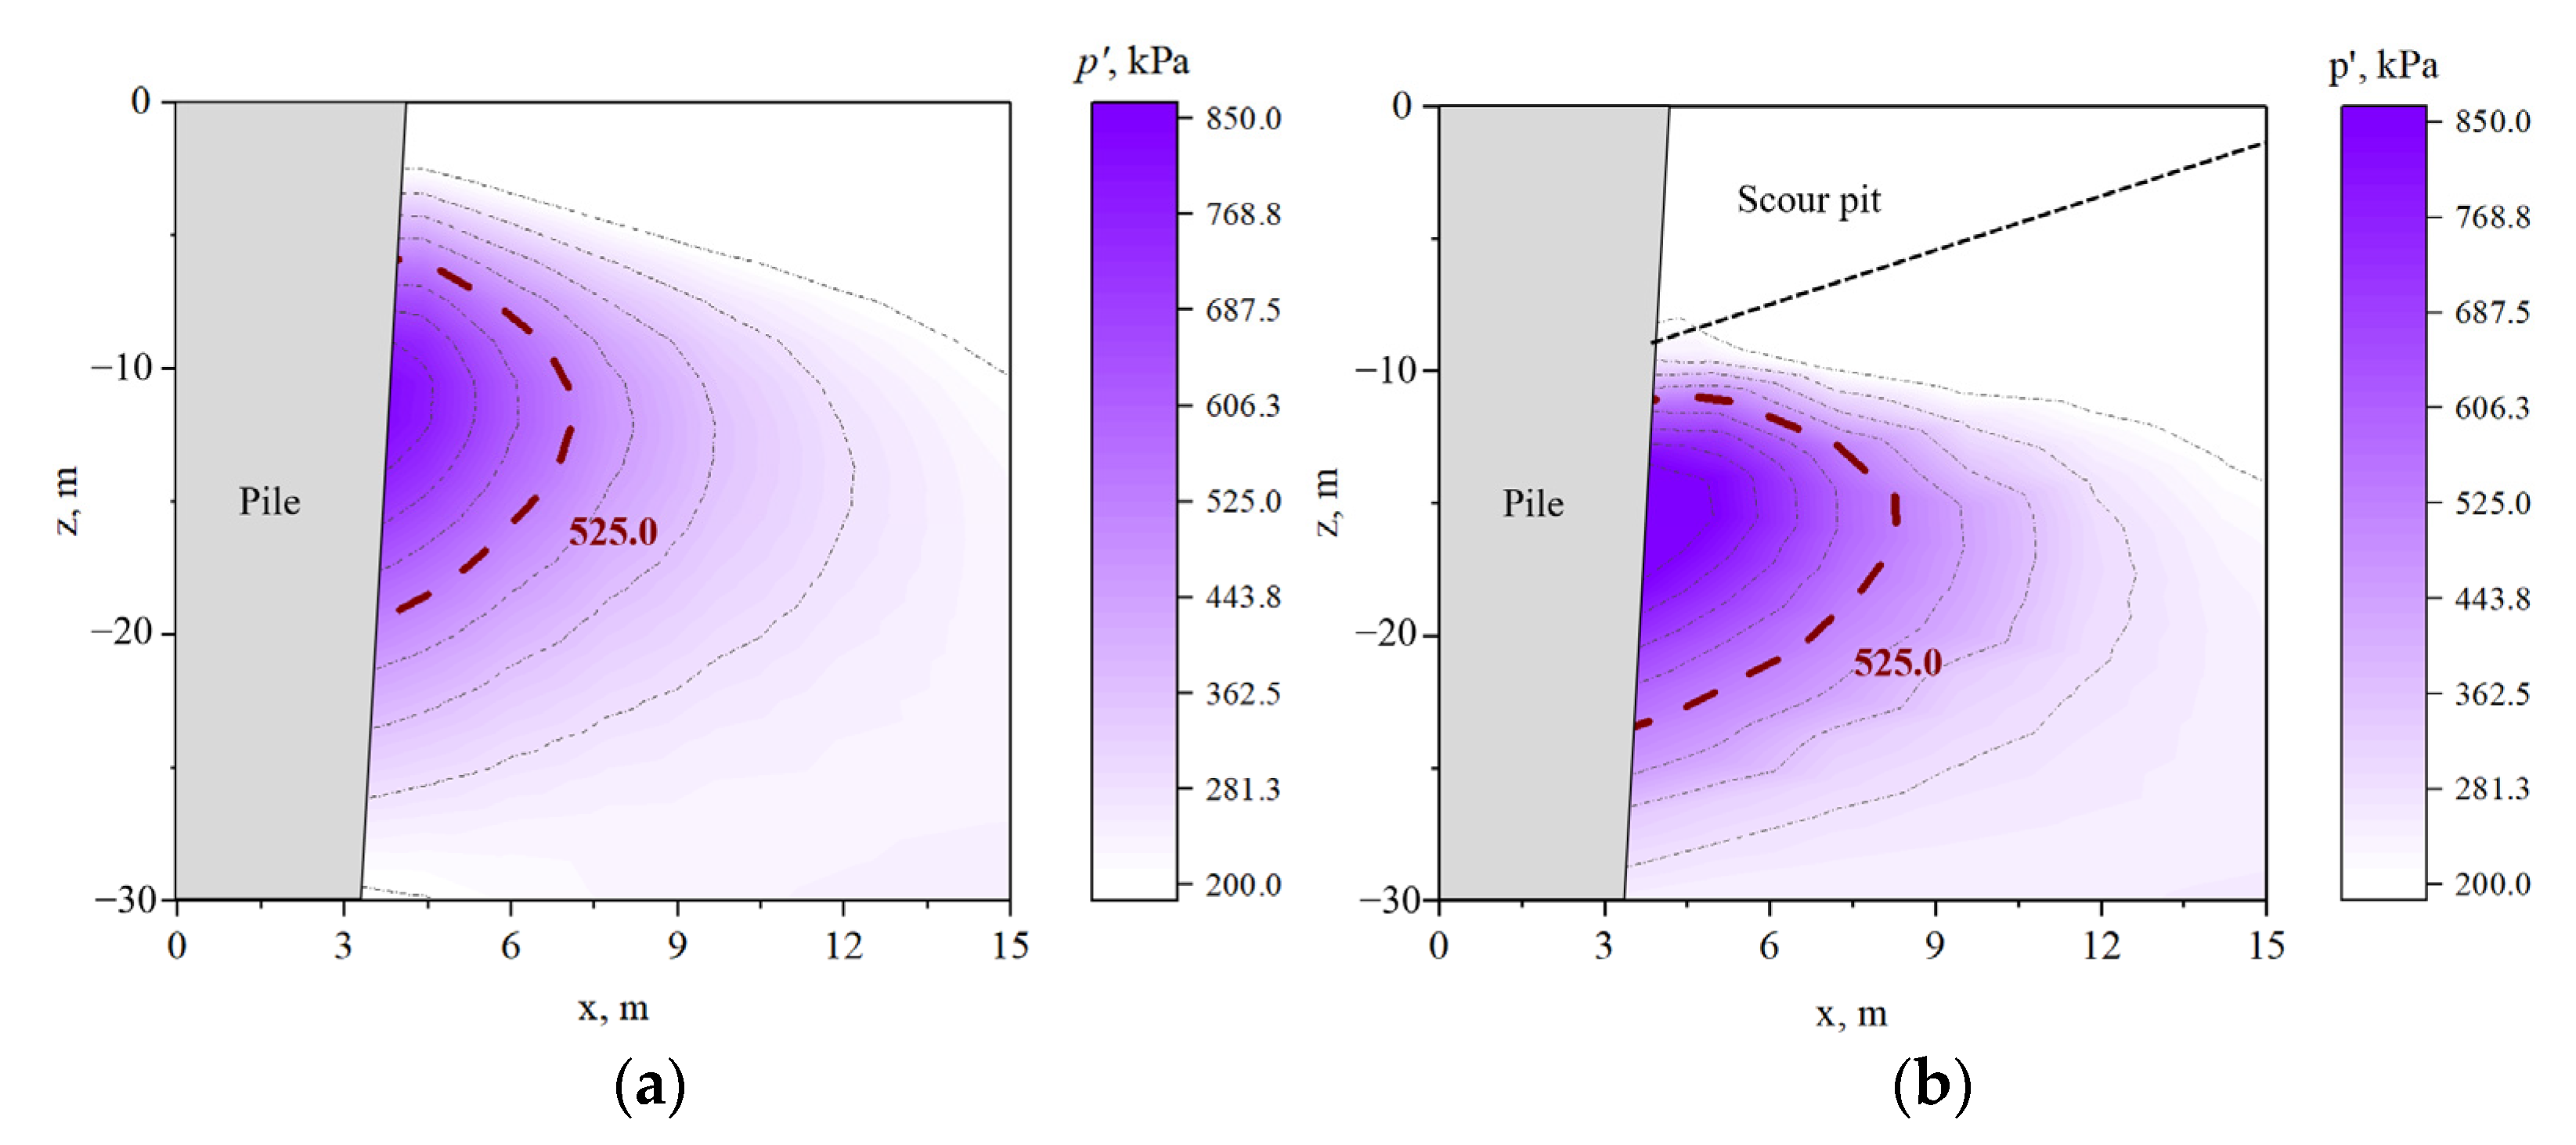
To visualize the stress distribution of the interface and the surrounding soil under extrusion, the effective normal stress contour from the axial compression side in no scour and local scour conditions are extracted in this study. The displacement inflicted on the pile head is the limit in the standard of 0.2 D (1.2 m) and the stress contour of 525 kPa at the depth of the strengthening soil interface of local scour intensity is highlighted in Figure 10. From the distribution of normal stress in no scour condition in Figure 10a, the normal stress concentration is in the absolute depth region of 1 D–3 D, and the lateral influence range is 0.5 D. The decline of normal stress in shallow horizon leads to the reduction in lateral resistance, which is positively related to the stress relief resulted from scouring. The concentration depth of the normal stress in the local scour condition turns to 1.5 D–4 D region and the lateral influence range enlarges into 1 D in Figure 10b. The regional evolution range of stress increase presents that lateral soil resistance is strengthening. According to studies by Peng et al. [28], responses of a given pile-soil interface are governed by the state of the interface soil including relative density and normal stress. Dilation or contraction of the interface soil induces variation in normal stress, which in turn influences the shear stress mobilized at the interface. Figure 10a,b examines the effect of surrounding sand on compression and deformation inhibition of lower soil interface. While the lateral resistance of the surface interface soil after the stress relief cannot carry the displacement of the pile, which explains the reduced carrying capacity of the shallow horizon of the remaining soil.
4.4. Quantization of Dilation Angle
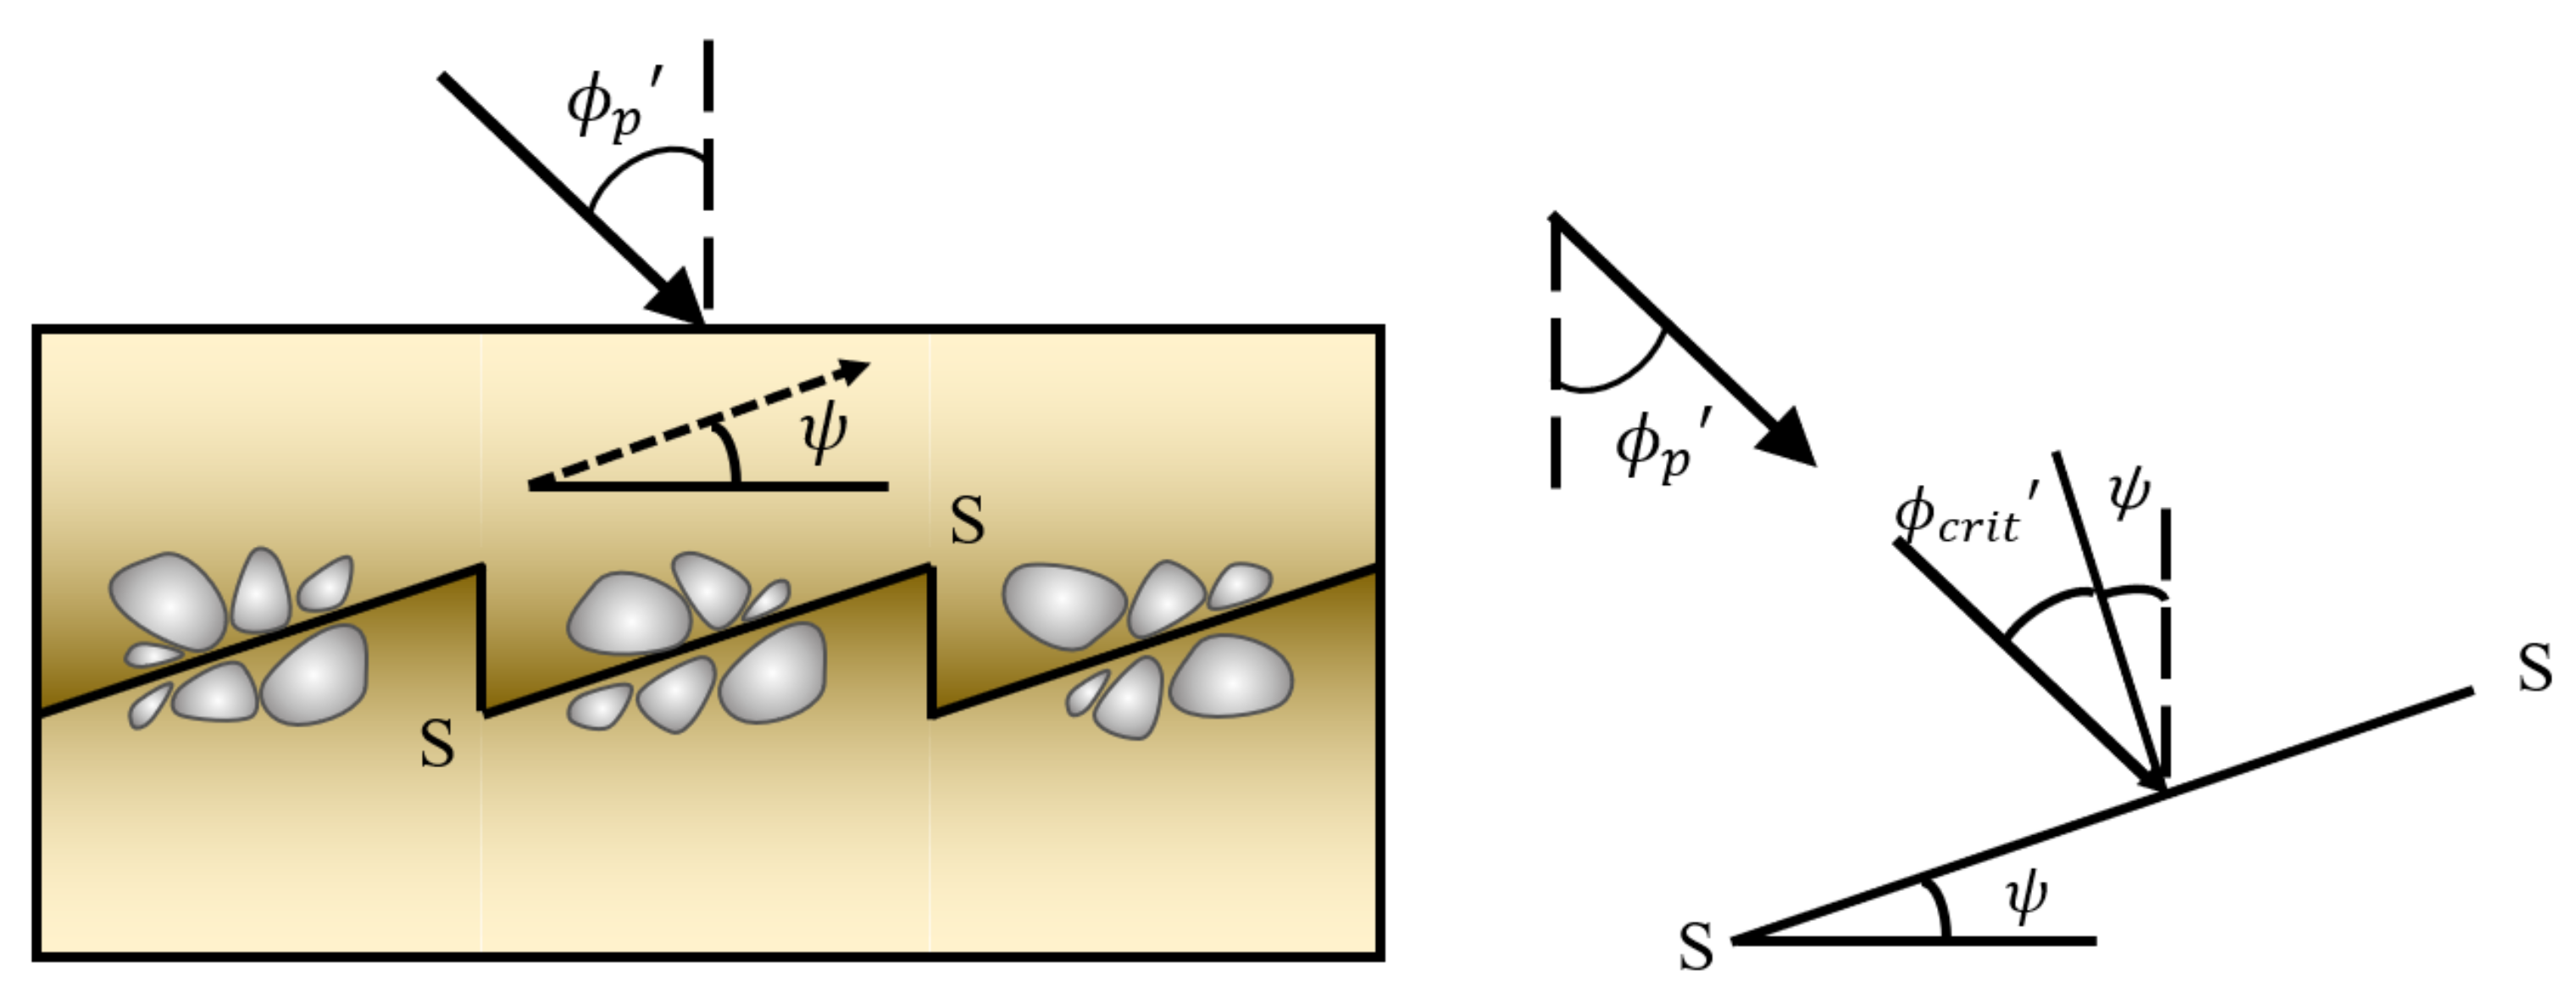
Bolton [29] analyzes the angle of dilation in the different shear conditions in Figure 11, assuming that the rigid zones lie outside the shear zone and the peak friction angle on the rupture surface consists of two parts [30,31]:
where friction angle to the peak strength; = critical state friction angle for constant volume (CV) shearing, which is 31° in triaxial test [32]; the angle of dilation.
Combined with the effect of the effective normal stress and the relative density on state-dependent dilatancy, a relative dilatancy index of the form is presented
where is the relative density; is the effective mean normal stress. Then substitute the relative dilatancy index for the angle of dilation in Equation (12) as
which presents a comprehensive review of the experimental data and suggests an empirical relation for the estimation of the peak angle of shearing resistance.
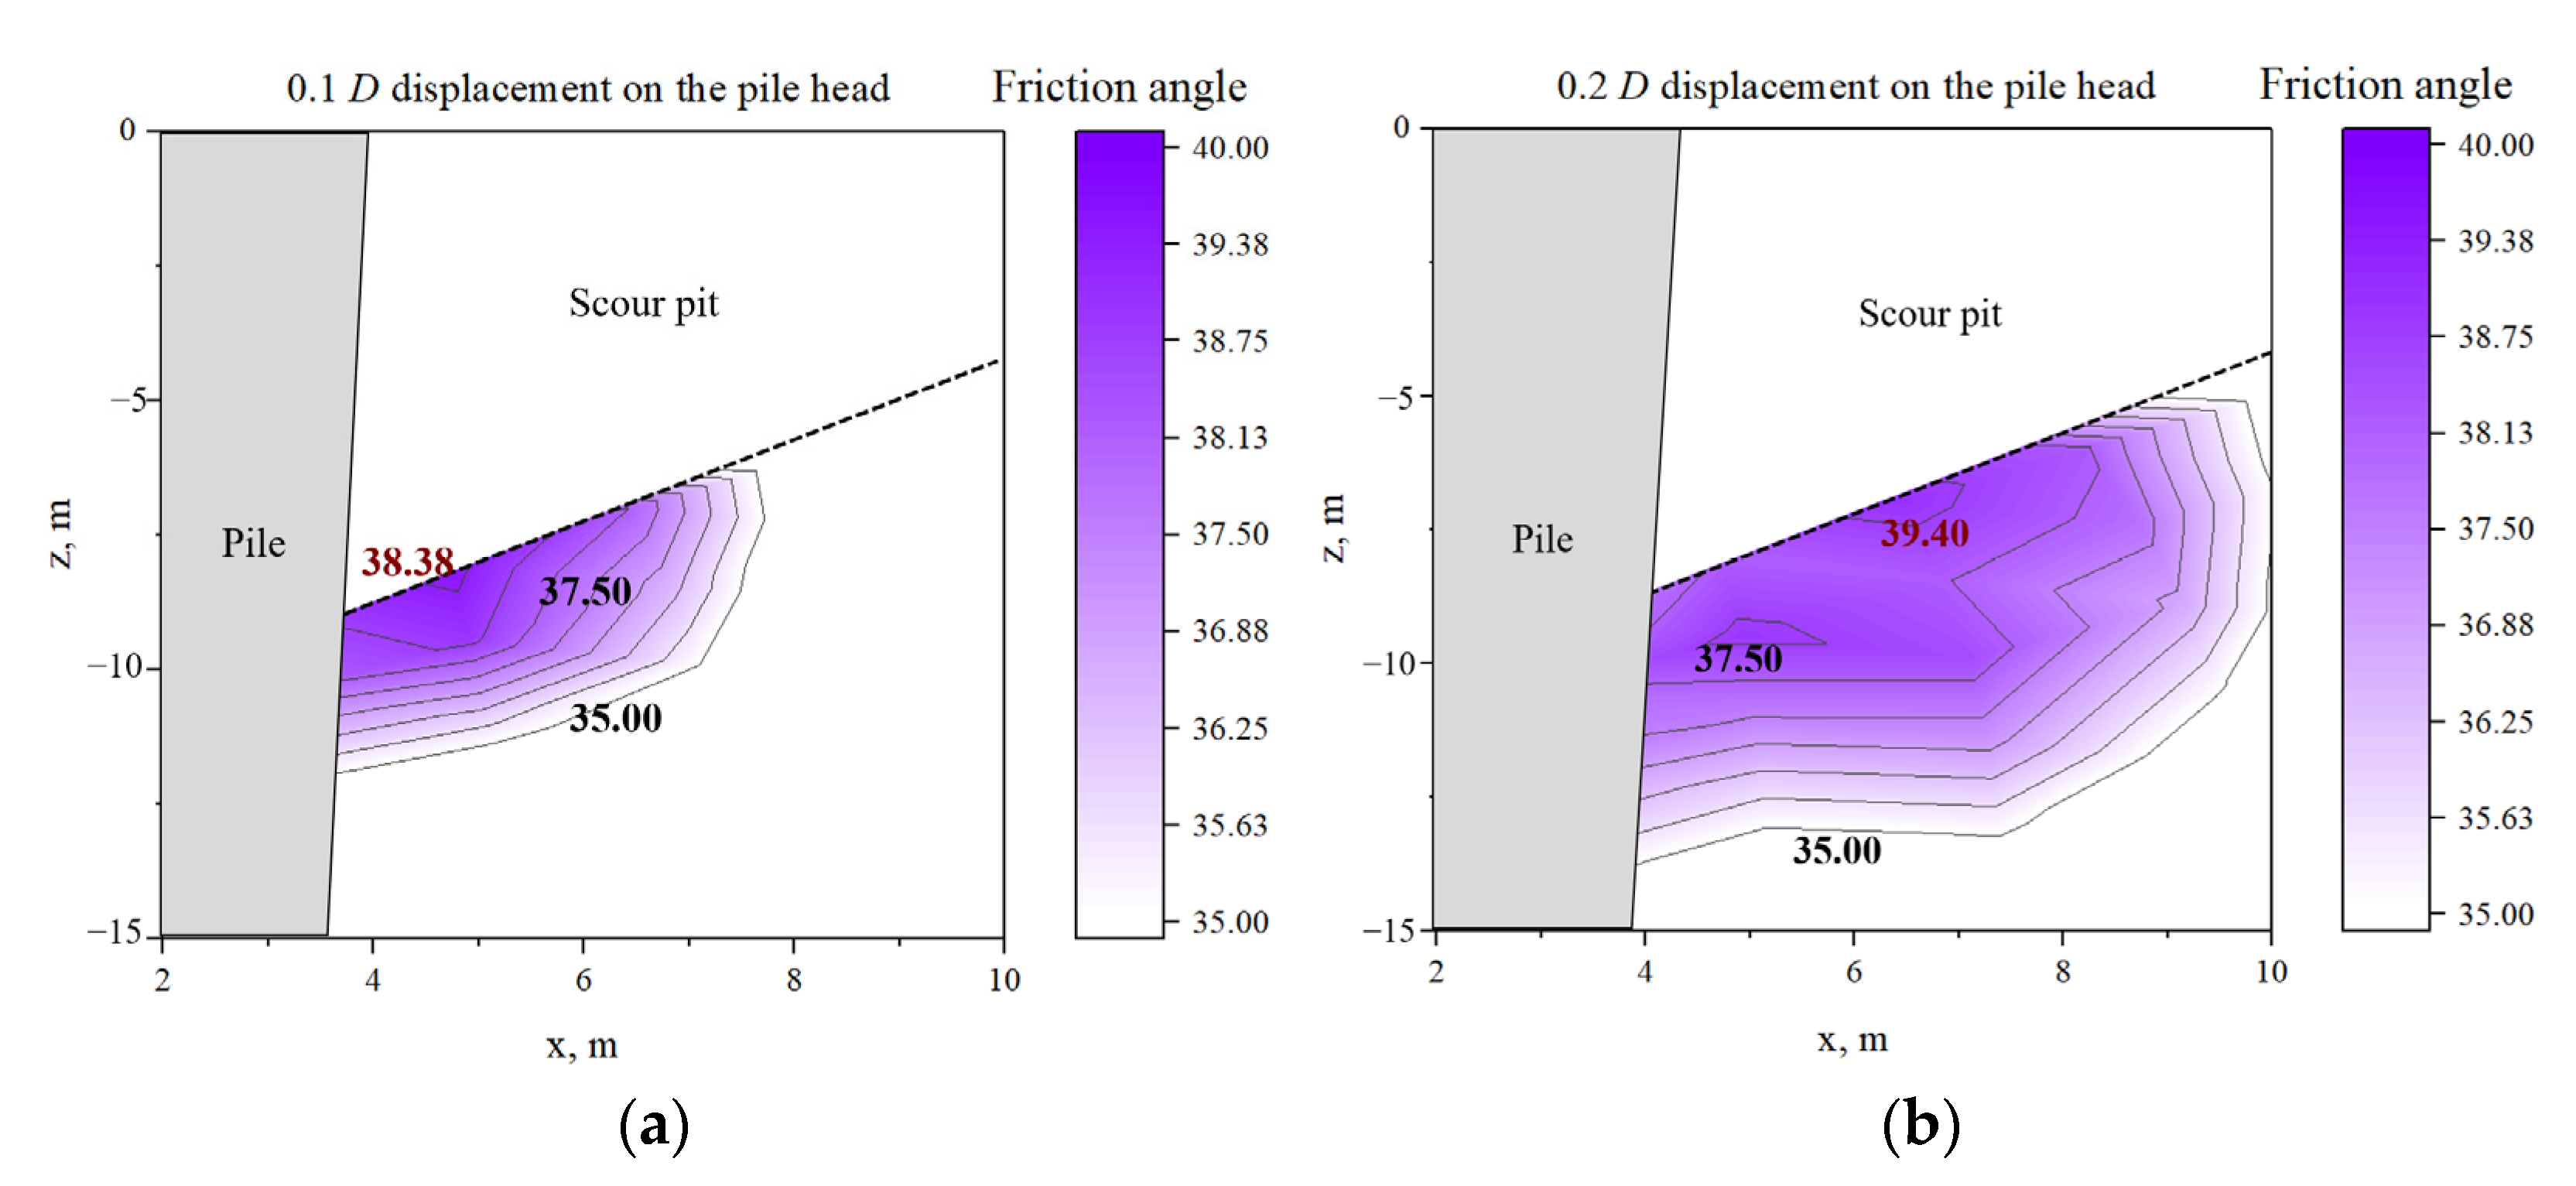
To compare the change of dilation angle, this research extracts the friction angle contour of the compression side sand before and after scouring, as shown in Figure 12 and Figure 13.
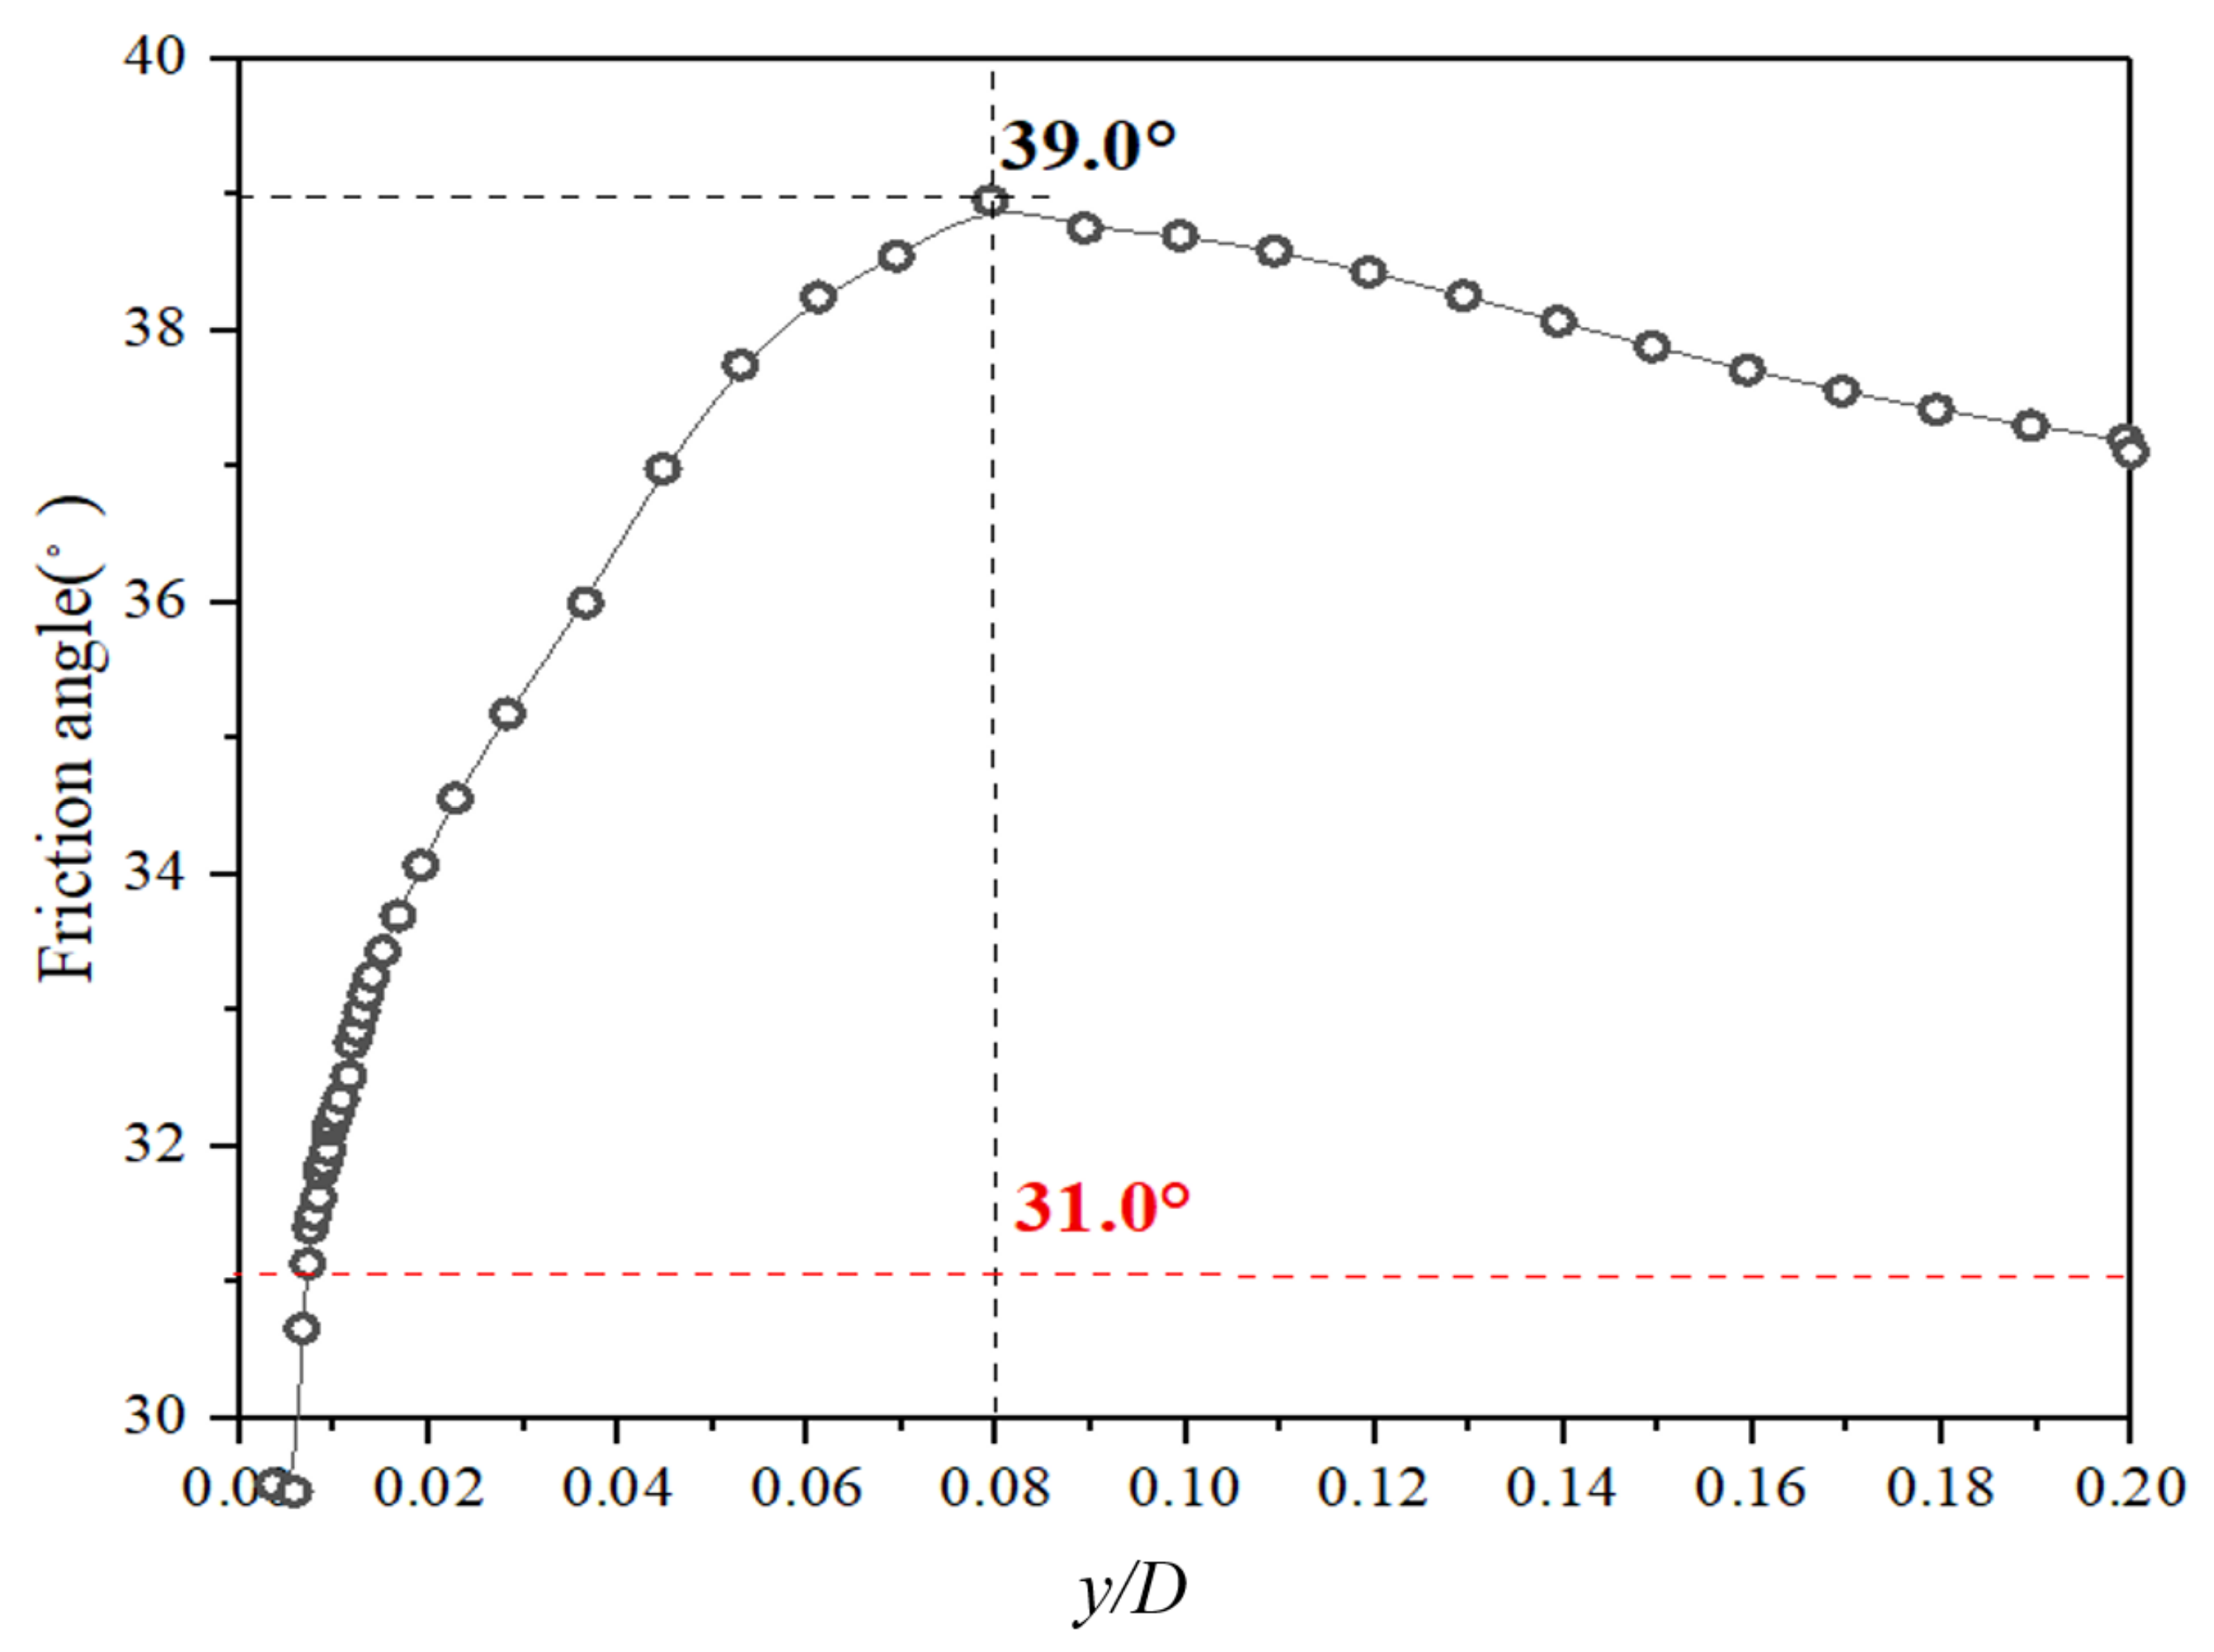
With the soil extruding during the pile displacement, the soil range of the friction angle increases. The area of dilatancy develops towards surrounding and underlying soils. Compared with Figure 12a and Figure 13a, after scouring the peak friction angle is larger, which also appears when the pile head displacement augments. The dilatancy behavior of interface soil is enhanced after scouring. To quantify variation in normal stress of pile-soil interfaces when they are subjected to loading and stress change, the friction angle of remaining interface sand surface depth during pile head displacement is extracted as shown in Figure 14.
After local scouring, the friction angle reaches its peak at nearly 0.1 pile head displacement. The corresponding friction angle is 31° for original soil in CV triaxial test. Moreover, the dilation angle by simulation is about 8°, and the result is similar to the calculation in Equation (12) as 9.7°. The feasibility of Equation (13) in evaluating dilatancy is proved. The friction angle increases in no scour condition undoubtedly can be explained by the excessive increase in the effective normal stress caused by the extrusion of the surrounding soil. In the post soil extrusion, the curve of friction angle drop in local scour condition can be explained by the failure of sand structure and the stress relief. Besides, the carry limit of soil surface during pile extrusion is also reduced.
5. p-y Curves of the Constrained Horizon in Local Scour Condition
To evaluate the stress-strain characteristics of the pile in the local scour condition, the p-y curve mentioned before is used. The past studies have shown that the p-y curve in America Petroleum Institute (API) [33] can hardly evaluate the results of large-diameter flexible monopiles. Hence, hyperbolic p-y curves [34,35,36,37,38] are analyzed to fit this condition:
where is the soil resistance, is the deformation in following depth, is the ultimate soil-pile reaction, the in this pile type is fitted in no scour condition as:
where is the effective weight of soil, z is the absolute depth of the sand, is the diameter of the pile, is the coefficient of passive earth pressure. Considering the state-dependent dilatancy characteristic, the influence of the relative density and the effective mean pressure is added into the change of the dilation angle, then enlarge the friction angle by Equation (13) as:
the is the initial horizontal subgrade modulus as:
where is 0.7 commended by Xiong [39], is the coefficient of horizontal subgrade reaction, which is considered as the constant. The value was mainly defined by the relative density between 1100 and 23,400 [34]. While in the local scour condition, due to the dilatancy on the shallow horizon and the constraint of remaining overburden soil, the change of the relative density has to be considered in the p-y curve in the local scour condition. Therefore, the in this study is fitted in terms of the absolute depth and excavation depth as:
where the equation can describe the change of the relative density in each horizon.
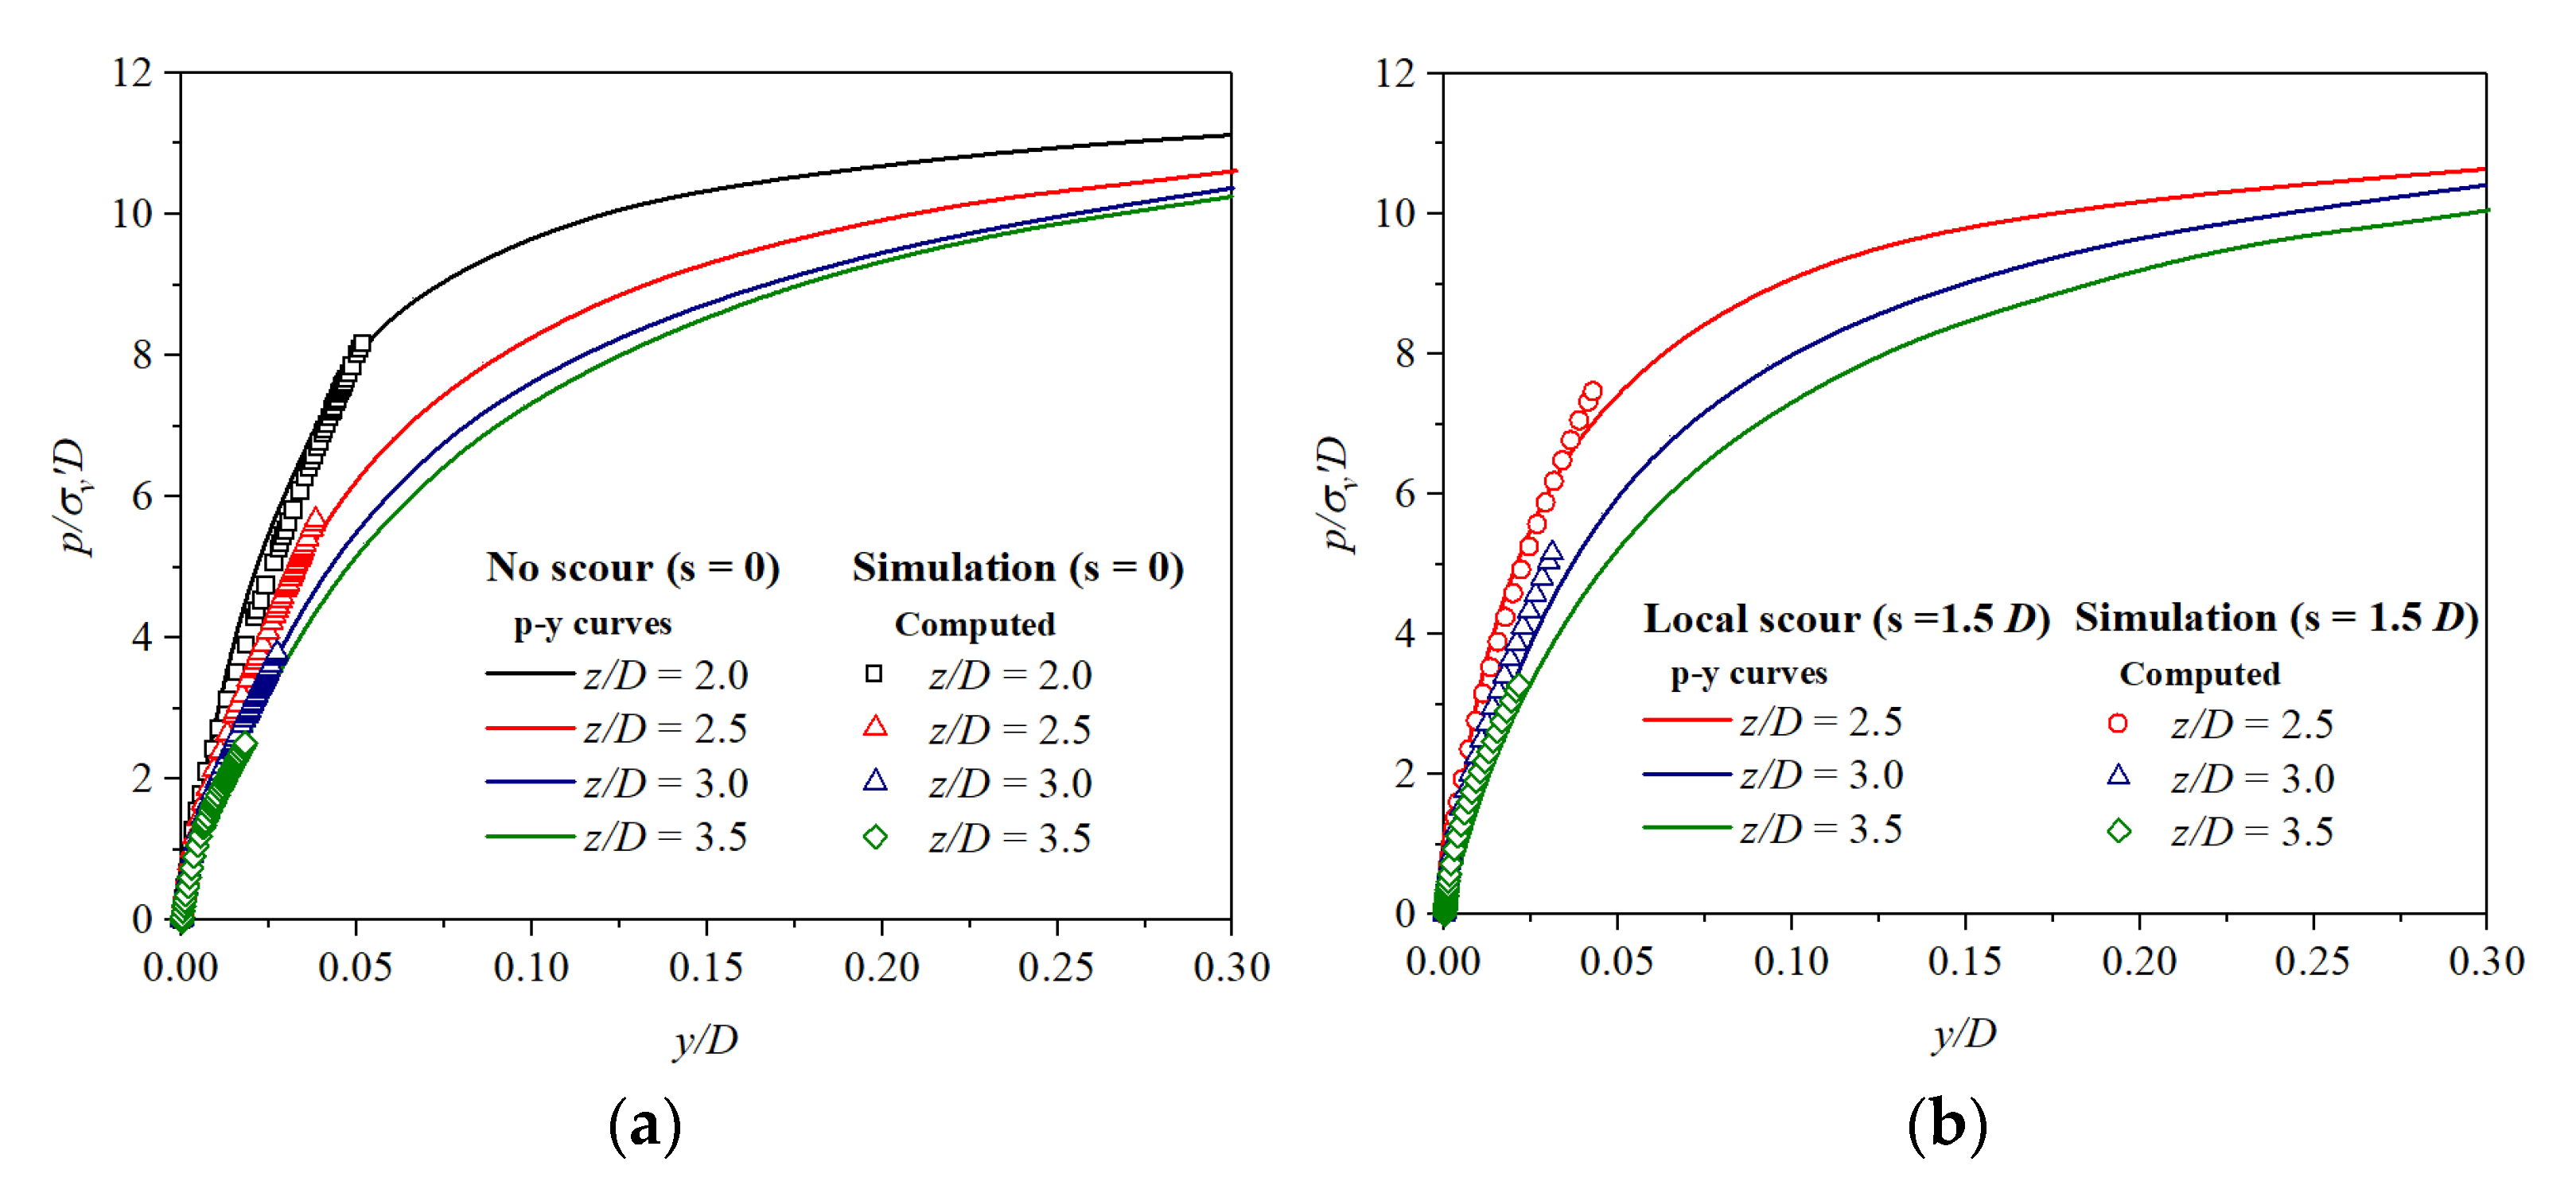
The p-y curves after dimensionless proposed by Burd et al. [40] are shown in Figure 15, which is calculated from the relative density and the effective normal stress at each depth. The curves can reasonably reflect the p-y curves in all conditions. After scouring, the curves in the same depth as the original soil become stiffer, while the ultimate soil-pile reaction remained almost unchanged. This conclusion is the same as the experimental result of Lin et al. [6], in which the influence of the scour can mainly affect the process of the 0.2 displacement at the mudline of the pile. Due to the lack of p-y data when excessive displacement on pile head occurs in past studies, control groups are deficient in the latter half of this prediction p-y curves. Considering that the service limit of existing piles is under this length, this prediction p-y curves can be regarded as a supplement to the scour condition of pile foundations in bridge engineering.
6. Conclusions
This paper presents a simulation of studying the lateral sand resistance on the compression side of monopile foundations after scouring, based on the state-dependent constitutive model for saturated sand. The soil strength that changes with depth in local scour conditions is explained. Based on the theory of the influence of dilatancy on friction angle proposed by Bolton [29], the p-y curves restricted in the deep horizon in the local scour condition are calculated. The conclusions are as follows:
- After the erosion depth increases gradually, which differs from the past lateral service capacity variation of remaining interface soil, the lateral soil resistance in the shallow horizon failed. The relative density increases by dilatancy and process the stress relief brings about the strength failure. The depth of the weakened area is about 0.6 times scour depth.
- Unlike the general scour condition, the dilatancy of the shallow horizon and the restriction of remaining overburden soil surrounding the pile enhance the normal stress of the interface sand. Therefore, the lateral soil resistance in the deep horizon is ameliorated.
- Having considered the effect of dilatancy on friction angle and the change in normal stress and relative density during the displacement of the pile, the p-y curves considering the state variation can evaluate the lateral resistance in the deep horizon in local scour conditions.
Author Contributions
Funding acquisition, J.L.; Investigation, N.J.; Methodology, N.J. and X.W.; Resources, J.L.; Writing—original draft, N.J.; Writing—review & editing, J.L. and X.W. All authors have read and agreed to the published version of the manuscript.
Funding
This research was funded by the Outstanding Youth Foundation of Shandong province (ZR2021YQ31), the National Natural Science Foundation of China (U2006225), the National Major Scientific Instruments Development Project of China (41627801) and Young Innovative Talents Introduction and Training Program of Colleges and Universities of Shandong Province.
Institutional Review Board Statement
Not applicable.
Informed Consent Statement
Not applicable.
Data Availability Statement
The data presented in this study are available on request from the corresponding author.
Conflicts of Interest
The authors declare no conflict of interest.
References
- Prendergast, L.J.; Gavin, K. Monitoring of Scour Critical Bridges Using Changes in the Natural Frequency of Vibration of Foundation Piles: A Field Investigation. In Proceedings of the Transport Research Arena (TRA) 5th Conference, Paris, France, 14–17 April 2014. [Google Scholar]
- Liu, J.; Guo, Z.; Ling, X.; Yu, X.; Zhu, N. Studies on Bearing Characteristic of Open-Ended and Close-Ended Pipe Piles under High-Speed Railway Loadings. Int. J. Struct. Stab. Dyn. 2021, 21, 2140001. [Google Scholar] [CrossRef]
- Yi, J.H.; Kim, S.B.; Yoon, G.L.; Andersen, L.V. Natural frequency of bottom-fixed offshore wind turbines considering pile-soil-interaction with material uncertainties and scouring depth. Wind Struct. Int. 2015, 21, 625–639. [Google Scholar] [CrossRef]
- Reese, L.C.; Cox, W.R.; Koop, F.D. Analysis of laterally loaded piles in sand. In Proceedings of the Offshore Technology Conference, Houston, TX, USA, 5–7 May 1974. [Google Scholar]
- Xu, L.Y.; Cai, F.; Wang, G.X.; Ugai, K. Nonlinear analysis of laterally loaded single piles in sand using modified strain wedge model. Comput. Geotech. 2013, 51, 60–71. [Google Scholar] [CrossRef]
- Lin, C.; Wu, R. Evaluation of vertical effective stress and pile lateral capacities considering scour-hole dimensions. Can. Geotech. J. 2019, 56, 135–143. [Google Scholar] [CrossRef]
- He, B.; Lai, Y.C.; Wang, L.Z.; Hong, Y.; Zhu, R. Scour Effects on the Lateral Behavior of a Large-Diameter Monopile in Soft Clay: Role of Stress History. J. Mar. Sci. Eng. 2019, 7, 170. [Google Scholar] [CrossRef] [Green Version]
- Wang, L.; Lai, Y.; Hong, Y.; Mašín, D. A unified lateral soil reaction model for monopiles in soft clay considering various length-to-diameter (L/D) ratios. Ocean. Eng. 2020, 212, 107492. [Google Scholar] [CrossRef]
- Li, Q.; Prendergast, L.J.; Askarinejad, A.; Gavin, K. Effect of scour on the behavior of a combined loaded monopile in sand. In Numerical Methods in Geotechnical Engineering IX; CRC Press: Boca Raton, FL, USA, 2018. [Google Scholar] [CrossRef]
- Chortis, G.; Askarinejad, A.; Prendergast, L.J.; Li, Q.; Gavin, K. Influence of scour depth and type on p-y curves for monopiles in sand under monotonic lateral loading in a geotechnical centrifuge. Ocean. Eng. 2020, 197, 106838. [Google Scholar] [CrossRef]
- Lin, C.; Bennett, C.; Jie, H.; Parsons, R.L. Scour effects on the response of laterally loaded piles considering stress history of sand. Comput. Geotech. 2010, 37, 1008–1014. [Google Scholar] [CrossRef]
- Bateni, H.; Jeng, D.S. Estimation of pile group scour using adaptive neuro-fuzzy approach. Ocean. Eng. 2007, 34, 1344–1354. [Google Scholar] [CrossRef]
- Lin, C.; Han, J.; Bennett, C.; Parsons, R.L. Analysis of laterally loaded piles in sand considering scour hole dimensions. J. Geotech. Geoenviron. Eng. 2014, 140, 04014024. [Google Scholar] [CrossRef]
- Roscoe, K.H.; Schofield, A.N.; Wroth, C.P. On the yielding of soils. Géotechnique 1958, 8, 22–53. [Google Scholar] [CrossRef]
- Li, X.S.; Dafalias, Y.F. Dilatancy for Cohesionless Soils. Géotechnique 2000, 50, 449–460. [Google Scholar] [CrossRef]
- Manzari, M.T.; Dafalias, Y.F. A critical state two-surface plasticity model for sands. Geotechnique 1997, 47, 255–272. [Google Scholar] [CrossRef]
- Qi, W.G.; Gao, F.P.; Randolph, M.F.; Lehane, B.M. Scour effects on p-y curves for shallowly embedded piles in sand. Géotechnique 2016, 66, 648–660. [Google Scholar] [CrossRef] [Green Version]
- Qi, W.G.; Gao, F.P. Numerical study of local scour effects on the lateral pile-soil interaction. In Proceedings of the 8th International Conference on Scour and Erosion, Oxford, UK, 12–15 September 2016; pp. 293–300. [Google Scholar] [CrossRef] [Green Version]
- Richard, F.E.; Hall, J.R.; Woods, R.D. Vibrations of Soils and Foundations; Prentice Hall Inc.: Englewood Cliffs, NJ, USA, 1970. [Google Scholar] [CrossRef]
- Been, K.; Jefferies, M.G. A state parameter for sands. Géotechnique 1985, 35, 99–112. [Google Scholar] [CrossRef]
- Li, X.S.; Wang, Y. Linear representation of steady-state line for sand. J. Geotech. Geoenviron. Eng. 1998, 124, 1215–1217. [Google Scholar] [CrossRef]
- Li, X.S. A sand model with state-dependent dilatancy. Géotechnique 2002, 52, 173–186. [Google Scholar] [CrossRef]
- Wang, Z.L.; Dafalias, Y.F.; Shen, C.K. Bounding surface hypoplasticity model for sand. J. Eng. Mech. 1990, 116, 983–1001. [Google Scholar] [CrossRef]
- Kuwano, R.; Jardine, R.J. A triaxial investigation of kinematic yielding in sand. Géotechnique 2007, 57, 563–579. [Google Scholar] [CrossRef]
- Wang, H.; Wang, L.; Hong, Y.; Askarinejad, A.; He, B.; Pan, H. Influence of pile diameter and aspect ratio on the lateral response of monopiles in sand with different relative densties. J. Mar. Sci. Eng. 2021, 9, 618. [Google Scholar] [CrossRef]
- Randolph, M.F.; Wroth, C.P. Application of the failure state in undrained simple shear to the shaft capacity of driven piles. Géotechnique 1981, 31, 143–157. [Google Scholar] [CrossRef]
- Zheng, G.; Peng, S.Y.; Ng, C.; Diao, Y. Excavation effects on pile behaviour and capacity. Can. Geotech. J. 2012, 49, 1347–1356. [Google Scholar] [CrossRef]
- Peng, S.Y.; Ng, C.; Zheng, G. The dilatant behaviour of sand–pile interface subjected to loading and stress relief. Acta Geotech. 2014, 9, 425–437. [Google Scholar] [CrossRef]
- Bolton, M.D. The strength and dilatancy of sands. Géotechnique 1987, 36, 219–226. [Google Scholar] [CrossRef]
- Yang, J.; Li, X.S. State-dependent strength of sands from the perspective of unified modeling. J. Geotech. Geoenviron. Eng. 2004, 130, 186–198. [Google Scholar] [CrossRef] [Green Version]
- Cinicioglu, O.; Abadkon, A. Dilatancy and Friction Angles Based on In Situ Soil Conditions. J. Geotech. Geoenviron. Eng. 2015, 141, 06014019. [Google Scholar] [CrossRef]
- Ishihara, K. Liquefaction and flow failure during earthquakes. Géotechnique 1993, 43, 351–451. [Google Scholar] [CrossRef]
- American Petroleum Institute. Recommended Practice Planning, Designing, and Constructing Fixed Offshore Platforms—Working Stress Design. API 2A-WSD, 22nd ed.; American Petroleum Institute: Washington, DC, USA, 2014. [Google Scholar]
- Kim, S.R. Evaluation of combined horizontal-moment bearing capacities of tripod bucket foundations in undrained clay. Ocean Eng. 2014, 85, 100–109. [Google Scholar] [CrossRef]
- Kim, D.J.; Choo, Y.W.; Kim, J.H.; Kim, S.; Kim, D.S. Investigation of monotonic and cyclic behavior of tripod suction bucket foundations for offshore wind towers using centrifuge modeling. J. Geotech. Geoenviron. Eng. 2014, 140, 04014008. [Google Scholar] [CrossRef]
- Klinkvort, R.T. Centrifuge Modelling of Drained Lateral Pile-Soil Response. Ph.D. Thesis, Technical University of Denmark, Lyngby, Denmark, 2012. [Google Scholar]
- Klinkvort, R.T.; Hededal, O.; Springman, S.M. Scaling issues in centrifuge modelling of monopiles. Int. J. Phys. Model. Geotech. 2013, 13, 37–49. [Google Scholar] [CrossRef]
- Zhu, B.; Li, T.; Xiong, G.; Liu, J.C. Centrifuge model tests on laterally loaded piles in sand. Int. J. Phys. Model. Geotech. 2016, 16, 160–172. [Google Scholar] [CrossRef]
- Xiong, G. Centrifuge Modelling and 3-D Numerical Analysis of Large Diameter Single Pile Under Lateral Loads. Master’s Thesis, Zhejiang University, Hangzhou, China, 2013. [Google Scholar]
- Burd, H.J.; Taborda, D.M.G.; Zdravković, L.; Abadie, C.N.; Byrne, B.W.; Houlsby, G.T.; Gavin, K.G.; Igoe, D.J.; Jardine, R.J.; Martin, C.M.; et al. PISA design model for monopiles for offshore wind turbines: Application to a marine sand. Géotechnique 2020, 70, 1048–1066. [Google Scholar] [CrossRef] [Green Version]
Figure 1.
Diagram of the three-dimensional finite element mesh and boundary conditions.

Figure 2.
Validation of the numerical model against the centrifuge test reported by Wang et al. [25], compared with (a) deflection; (b) moment of the pile.
Figure 2.
Validation of the numerical model against the centrifuge test reported by Wang et al. [25], compared with (a) deflection; (b) moment of the pile.

Figure 3.
Schematic diagram of numerical modeling procedures in (a) no scour condition; (b) local scour condition; (c) general scour condition.
Figure 3.
Schematic diagram of numerical modeling procedures in (a) no scour condition; (b) local scour condition; (c) general scour condition.

Figure 4.
Comparison of pile deflection before and after scouring; (a) ; (b) .

Figure 5.
Comparison of pile deflection before and after scouring; (a) ; (b) .

Figure 6.
Load displacement characteristics of piles at different depths in
condition.

Figure 7.
Load displacement characteristics of piles at different depths in condition.

Figure 8.
Modified data and theoretical fitting of the CSL (critical state line) in e-p’ space for Toyoura sand in (a) no scour condition; (b) general scour condition; (c) local scour condition.
Figure 8.
Modified data and theoretical fitting of the CSL (critical state line) in e-p’ space for Toyoura sand in (a) no scour condition; (b) general scour condition; (c) local scour condition.


Figure 9.
Dilatancy of shallow horizon of the remaining interface soil in local scour condition.

Figure 10.
The effective stress contour in the compression side in (a) no scour condition (b) local scour condition.
Figure 10.
The effective stress contour in the compression side in (a) no scour condition (b) local scour condition.

Figure 11.
The saw blades model of dilatancy by Bolton (1986).

Figure 12.
The friction angle contour at the pile head displacement of (a) 0.1 ; (b) 0.2 in local scour condition.
Figure 12.
The friction angle contour at the pile head displacement of (a) 0.1 ; (b) 0.2 in local scour condition.

Figure 13.
The friction angle contour at the pile head displacement of (a) 0.1 ; (b) 0.2 in local scour condition.
Figure 13.
The friction angle contour at the pile head displacement of (a) 0.1 ; (b) 0.2 in local scour condition.

Figure 14.
Evolution diagram of surface friction angle of the remaining interface after scouring.

Figure 15.
The p-y curves consider the dilatancy in (a) no scour condition; (b) local scour condition.
Figure 15.
The p-y curves consider the dilatancy in (a) no scour condition; (b) local scour condition.


Table 1.
Model parameters of state-dependent saturated sand in Wang’s test.
| Meaning of Parameters | Parameter | This Test | |
|---|---|---|---|
| Elastic parameters | Elastic modulus | 50 | |
| Poisson’s ratio | 0.1 | ||
| Critical state parameters | Stress ratio at the critical state | 1.25 | |
| Intercept of CSL in or plane | 0.934 | ||
| Slope of CSL in or plane | 0.019 | ||
| 0.7 | |||
| Dilatancy parameters | Parameters of dilatancy function | 1 | |
| 3.5 | |||
| Hardening parameters | Parameters of the hardening law | 3.15 | |
| 3.05 | |||
| 1.1 |
Table 2.
Typical engineering properties of Toyoura sand in Wang’s test.
| Meaning of Parameters | Parameter | This Test | |
|---|---|---|---|
| Basic parameters | Mean particle size (mm) | 0.4 | |
| Specific gravity | 2.65 | ||
| Maximum void ratio | 0.934 | ||
| Minimum void ratio | 0.6 |
Publisher’s Note: MDPI stays neutral with regard to jurisdictional claims in published maps and institutional affiliations. |
© 2022 by the authors. Licensee MDPI, Basel, Switzerland. This article is an open access article distributed under the terms and conditions of the Creative Commons Attribution (CC BY) license (https://creativecommons.org/licenses/by/4.0/).
Share and Cite
MDPI and ACS Style
Jia, N.; Liu, J.; Wang, X. Numerical Investigation into Lateral Behavior of Monopile Due to Scour Enhanced: Role of State-Dependent Dilatancy. Appl. Sci. 2022, 12, 921. https://0-doi-org.brum.beds.ac.uk/10.3390/app12020921
AMA Style
Jia N, Liu J, Wang X. Numerical Investigation into Lateral Behavior of Monopile Due to Scour Enhanced: Role of State-Dependent Dilatancy. Applied Sciences. 2022; 12(2):921. https://0-doi-org.brum.beds.ac.uk/10.3390/app12020921
Chicago/Turabian StyleJia, Ning, Junwei Liu, and Xuetao Wang. 2022. "Numerical Investigation into Lateral Behavior of Monopile Due to Scour Enhanced: Role of State-Dependent Dilatancy" Applied Sciences 12, no. 2: 921. https://0-doi-org.brum.beds.ac.uk/10.3390/app12020921
Note that from the first issue of 2016, this journal uses article numbers instead of page numbers. See further details here.