Article

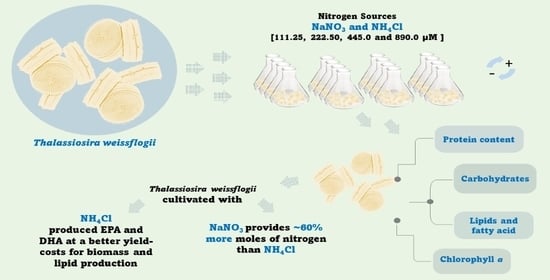
Effects on Cell Growth, Lipid and Biochemical Composition of Thalassiosira weissflogii (Bacillariophyceae) Cultured under Two Nitrogen Sources

by
Francisco Eduardo Hernández-Sandoval
1,*,
Jorge Arturo Del Ángel-Rodríguez
2,*,
Erick Julian Núñez-Vázquez
1,*,
Christine Johanna Band-Schmidt
3,
Bertha Olivia Arredondo-Vega
1,
Ángel Isidro Campa-Córdova
1,
Manuel Moreno-Legorreta
1,
Leyberth José Fernández-Herrera
3 and
David Javier López-Cortés
1,†
1
Centro de Investigaciones Biológicas del Noroeste (CIBNOR), La Paz 23096, Mexico
2
Department of Ocean Sciences, Memorial University of Newfoundland, St. John’s, NL A1K 3E6, Canada
3
Departamento de Plancton y Ecología Marina, Centro Interdisciplinario de Ciencias Marinas (IPN-CICIMAR), Instituto Politécnico Nacional, La Paz 23096, Mexico
*
Authors to whom correspondence should be addressed.
Deceased.
Submission received: 8 November 2021 / Revised: 23 December 2021 / Accepted: 13 January 2022 / Published: 18 January 2022
(This article belongs to the Special Issue Advances in Algal Biomass Applications)

Abstract

:
The protein and polyunsaturated fatty acid (PUFA) enrichment of microalgae can improve their nutritional value for larvae of various reared organisms. Protein enrichment can be achieved by increasing nitrogen concentration and selecting nitrogen sources that are easy to assimilate during microalga culture. Nitrogen-rich cultures can increase organism growth, biomass, and protein content, but their lipid content tends to stall. Since the diatom Thalassiosira weissflogii is usually provided to feed shrimp larvae, this study evaluated its digestibility and biochemical composition, culturing it with two nitrogen sources (NaNO3 and NH4Cl) at different concentrations (111.25, 222.50, 445 and 890 µM). The cell abundance, dry-weight biomass, Chl a, proteins, carbohydrates, total lipids and essential fatty acids were determined. The cell density and biomass peaked faster (day 12) with treatment < 890 µM than with 890 µM (day 15) in both nitrogen sources. However, the highest cell density, biomass and peak protein yield were not significantly different among treatments, suggesting the need to compare maintenance costs for a given production. After nine days of culture, concentrations ≤ 222.5 µM increased lipid content irrespective of the nitrogen source and decreased by 10–20% afterwards. With higher lipid production, the dominant PUFA were eicosapentaenoic acid (EPA) and docosahexaenoic acid (DHA). One gram of NH4Cl provides ~60% more nitrogen than 1 g of NaNO3. In conclusion, based on time and growth rate, T. weissflogii cultivated with NH4Cl at 222.50 µM produced EPA and DHA at a better yield–cost ratio for biomass and lipid production. Furthermore, its nutritional value as enriched live-food for the reared larvae of marine organisms suggests potential biotechnological applications for aquaculture.

Graphical Abstract

1. Introduction

In the last few years, interest in aquaculture has increased worldwide because of the growing market demand and high commercial value created by these products [1]. Their production success is undoubtedly related to the quality and quantity of the food supplied [2]. Microalgae are traditionally used in aquaculture for larval growth. Nevertheless, although attempts have been conducted to substitute natural food with microencapsulates, yeast or bacteria, the poor enzymatic activity and nonfunctional stomach of larvae do not allow them to digest formulated diets completely [3,4]. Accordingly, natural microalgae are still considered as the main live food source for marine larvae [2,5].
As a consequence of their nutritional value, diatom species, such as Skeletonema costatum, Thalassiosira sp., Phaeodactylum sp., Chaetoceros gracilis, C. calcitrans and the flagellates Pavlova lutheri, Isochrysis galbana, Tetraselmis chuii and T. suecica are all grown as food for rearing marine organisms of commercial value [6,7]. Their biochemical composition is important for their nutritional value because of their ability to synthesize and accumulate essential fatty acids and other nutrients [8,9].
Among the species previously mentioned, Thalassiosira weissflogii has been provided successfully for feeding shrimp larvae [10] because of its shape, digestibility and biochemical composition [11], which can vary as a result of changes in the environment [12,13,14]. Thus, the effects of temperature, salinity, pH, nutrients and their interactions have been addressed [14,15,16]. Additionally, the growth phase is recognized as an important factor influencing the biochemical composition of microalgae. For example, during the stationary phase, when nitrogen becomes limiting, microalgae shift their metabolism to carbohydrate and lipid production [17]. Among all the physical-chemical factors, nitrogen influences lipid metabolism and its deficient conditions increase fatty acid concentration in various microalgae [18,19]. Nitrogen in the form of nitrate, ammonia or urea (or their combinations) is added to most media for commercial aquaculture in high concentrations and changes in nitrogen supply are known to strongly influence the growth and biochemical composition of microalgae [20]. Furthermore, nitrogen is easy to manipulate and less expensive compared to other growth factors. Comparatively few studies have analyzed the effects of different nitrogen sources on the biochemical composition of the diatom T. weissflogii. Therefore, this study evaluated different concentrations of two nitrogen sources, sodium nitrate (NaNO3) and ammonium chloride (NH4Cl), on the growth, biochemical composition (protein, carbohydrate and lipid) and main fatty acids in the microalga T. weissflogii.

2. Materials and Methods

2.1. Strain and Culture

Thalassiosira weissflogii (CIB-85 strain) was acquired by donation of CITMA (Ministerio de Ciencia y Tecnología y Medio Ambiente de Cuba; https://www.citma.gob.cu (accessed on 6 November 2021). The species was grown in batch cultures in 2.5 L Fernbach glass flasks (Thermo Fisher Scientific, Waltham, MA, USA) with f/2 + Si media [21]. Culture conditions were: illumination of 120 μmol photon m−2 s−1, continuous aeration, photoperiod of 12 h:12 h light/dark cycle, and temperature of 22 ± 0.5 °C.

2.2. Experimental Design

Culture media f/2 + Si for experiments was initially prepared without nitrogen. The selected nitrogen source and concentration was added posteriorly (Table 1). Each experimental combination was assayed in quadruplicate cultures (i.e., 8 × 4 = 32). All treatments were inoculated with an initial concentration of 2.37 × 10⁵ cells mL−1. Cultures were progressively conditioned to each nitrogen concentration from an initial condition of 890 µM. The cells were adapted for three generations to each treatment before starting the batch culture. The experiment was conducted for 18 days.

2.3. Growth and Biomass Production

Cell density and dry biomass were monitored every third day using seven replicates for each sample (i.e., 8 × 7 = 56/day). Cell counts were performed on a Neubauer chamber (VWR SCIENTIFIC, superior, VWR International, Radnor, PA, USA).
Cell growth was evaluated using two models: the first one was via the logistic growth model, [22,23,24].
d N t / d t = r N [ ( k N t ) / k ] ,
where t is time (h); Nt is the cell density (cells mL−1) at time t; r is the proportionality constant (h−1); and k is the carrying capacity of the system (cells mL−1) or maximum cell density (Nmax) reached at the end of the exponential phase. The value k/2, which is half the carrying capacity (cells mL−1), was also estimated, and tk/2 represents the estimated time (h) to reach half of the carrying capacity. For this model, the non-linear regression parameters were estimated via the iterative process to reach the least sum of squares (SSQ).
Additionally, two other parameters were estimated. The first was maximum specific growth rate µ (h−1), calculated by the equation [25,26]:
µ m a x = ln ( k / N 1 ) / ( t k t 1 ) ,
where tk is time at the end of the exponential phase, and t1 and N1 are time and cell density at the beginning of the exponential phase, respectively. The second parameter was population doubling time (h), estimated as, [27]:
P D T = ln 2 / µ ,
The second model was an exponential rise to the maximum of the form: Nt = N0 + a (1 − e(−b·t)), where cell density increase is represented by parameter a, and estimated growth rate is estimated by parameter b. For this model, time values were represented as days, thus at the beginning of the experiment:
(t = 0) Nt = N0,
Nonlinear regressions were performed using the preset model for exponential rise to maximum, with three parameters, available in Sigmaplot Version 12.
Dry biomass was determined every 48 h by filtering 10 mL of culture through pre-weighed and pre-burned GF/F glass-fiber filter, 0.7 µm pore size (Whatman, Maidstone, UK). Biomass was further washed with 0.5 M ammonium formate to remove salt precipitates and dried at 60 °C for 24 h. The weight difference between the filter and the filter with the sample was determined.

2.4. Biochemical Composition

Biochemical composition was also monitored every 48 h, using seven replicates for each sample. A sample of 100 mL was obtained and centrifuged at 1658× g (BECKMAN GPR Centrifuge, CA, USA) for 15 min at 5 °C, and further lyophilized (LABCONCO 5.0 Liter, Virtis Freeze Dryers, Kansas City, MO, USA).

2.4.1. Total Protein

Total protein content (5 mg) of lyophilized microalgae was determined spectrophotometrically with the Folin-Phenol Reagent (Sigma-Aldrich, St. Louis, MO, USA) [28]. Bovine serum albumin (BSA) was used as a standard (Sigma Aldrich STD). Samples were analyzed at 570 nm with a spectrophotometer (Beckman DU 640, spectrophotometer Beckman Coulter, Inc. Pasadena, CA, USA).

2.4.2. Total Carbohydrates

The carbohydrate content of 5 mg lyophilized microalgae was analyzed according to the sulfuric acid colorimetric method [29], based on phenolphthalein absorbance. Samples were analyzed at 490 nm (Beckman DU 640 spectrophotometer Beckman Coulter, Inc.).

2.4.3. Chlorophyll a

Two mg of lyophilized algae were extracted with 4 mL of acetone 100% HPLC grade (high performance liquid chromatography). Samples were stored at −20 °C every 24 h. Extract was recovered after centrifugation (1658× g at 5 °C for 15 min). Chlorophyll a (Chl a) was separated and quantified by HPLC (Mod. 1100, Hewlett Packard, CA, USA), as described in [30]. The mobile phase consisted of MeOH: 1 N aqueous ammonium acetate, 70:30% v/v (solvent A), and MeOH (solvent B). A C8 MOS Hypersil column 10 cm × 0.45 cm, 5 µm particle size was used with standards for identification and quantification. For the identification of pigments, retention time standards (RST) (International Agency for 14C determinations, Denmark, DHI-Denmark, PPS-CHLA) and absorption spectra (350–750 nm) were considered.

2.4.4. Total Lipids

The total content of lipids were extracted according to the method [31], where 5 mg of lyophilized microalgae was added to 2 mL chloroform: methanol (2:1 v/v) HPLC grade at 4 °C for 24 h. Extracts were centrifuged at 1658× g for 20 min, and the supernatant was collected. Distilled water was added until the system became biphasic. The lower chloroform layer was separated and dried under nitrogen (N2) flow. Lipids were quantified accordingly [32], which involved organic matter carbonization with sulfuric acid, using triestearine as the standard. Samples were analyzed at 375 nm with a spectrophotometer (Beckman DU 640, Beckman Coulter, Inc.).

2.4.5. Fatty Acid Composition and Statistical Analyses

Methanolysis of fatty acids with HCl:CH3OH (5:95 v/v) was performed as described in [33]. Methyl ester extract was evaporated to dryness under a stream of N2. The resulting methyl esters were resuspended in n-hexane HPLC. The extract was injected into a gas chromatograph mass spectrometer with an electronic ionization detector (GCD Plus Hewlett Packard, model G1800B) equipped with an Omega Wax Column (30 m × 0.25 mm × 0.25 µm). Oven temperature was programmed as follows: initially 110 °C with 280 °C as the maximum temperature. The flame detector temperature was 260 °C. The carrier gas utilized was helium at a flow rate of 0.9 mL min−1. The identification of fatty acids was performed using two criteria: (1) retention time of methylated standard and (2) presence of the characteristic ion mass/charge (m/z). Different fatty acid methyl esters (FAME chemical standard, Sigma Aldrich) were used to determine retention time and response factor of each fatty acid.
The results for biochemical composition and cell growth were analyzed by a multifactorial analysis of variance (ANOVA) considering nitrogen source, nitrogen concentration and time as factors. The level of significance was α = 0.05 [34]. All analyses were carried out using STATISTICA® software v.6.0 (Statsoft, Tulsa, OK, USA).

3. Results

3.1. Growth and Biomass Production of Microalgae

As expected, the T. weissflogii peak cell density (k) improved significantly (p < 0.05) when the nitrogen concentration increased from 111.25 to 890 µM. According to the sigmoidal curve model (Table 2), the highest NaNO3 (N4) concentration produced the largest cell density (>12.5 × 10⁶ cells mL−1) at the end of the exponential phase. However, the highest NH4Cl (C4) concentration yielded a similar cell density (~6% less) but with a higher proportionally constant (r) (0.385 vs. 0.275 h−1). Accordingly, the estimated time to reach half of the maximum cell density (tk/2) occurred 33 h earlier for C4 compared with N4. In general, T. weissflogii reached tk/2 7–30 h earlier when the nitrogen source was NH4Cl. The exponential rise model (Table 3, bottom) also confirmed higher final cell densities (a parameter) for N4 and C4, but they were not significantly different. Within this model, the estimated growth rate (b parameter) was not significantly different among similar concentrations of different nitrogen sources.
Diatom T. weissflogii treated with NaNO3 and NH4Cl concentrations of 222.5 and 445 µmol L−1 (N2, N3, C2 and C3), respectively, achieved population duplication times (PDT) < 56 h, which suggests that moderate salt concentrations provided concentrations close to the optimum nitrogen amounts required for cell duplication, i.e., neither limited nor in excess. With the 890 µM treatment, NaNO3 reached a plateau in biomass production (~0.4 mg mL−1) around day 12 and remained at similar levels until day 18. By contrast, the treatment with 890 µM NH4Cl reached a similar peak value (~0.4 mg mL−1) until day 15 but rapidly decreased at day 18. The rest of the treatments did not exceed a biomass concentration of 0.250 mg mL−1.
The cell density (cell mL−1) correlated positively with the dry weight measurements (mg mL−1) for both nitrogen sources. For NaNO3, the slope was 2.45 × 10⁻⁸ mg cell−1, R2 = 0.93 and p < 0.05, whereas for NH4Cl the slope was 2.53 × 10⁻⁸ mg cell−1, R2 = 0.95 and p < 0.05. Furthermore, no significant differences were observed between slopes for both sources (ANCOVA Source p = 0.172).

3.2. Biochemical Composition

3.2.1. Chlorophyll a

The chlorophyll a content in T. weissflogii increased with time and nitrogen concentration (p < 0.001). However, the time to reach peak production varied depending on the source and concentration. For instance, NaNO3 and NH4Cl treatments with 111.25 µM reached small peak chlorophyll a (2500–3900 ng mg−1 dry weigh) values earlier (day 12). By contrast, treatments with 890 µM yielded the highest chlorophyll a production, with similar results at peak production (7084–7199 and 7039–8691 ng mg−1 dry weight for NaNO3 and NH4Cl, respectively). However, with NaNO3, the peak was reached at the end of the experiment (day 18), whereas for NH4Cl, it was reached three days earlier (day 15).

3.2.2. Proteins, Carbohydrates and Lipids

As expected, with both salts, a clear tendency was observed towards an increase in protein content as a consequence of an increase in nitrogen concentration (p < 0.05). However, this difference was not sustained throughout the experiment. This result is common in batch cultures without nitrogen replenishment. As the microalgae grew, moderate-to-strong nitrogen depletion decreased amino acid synthesis, as was expected. For instance, at the onset of the experiment (day 3), a significantly high protein concentration (~390 µg mg−1) was observed in the 890 µM-treated NH4Cl and NaNO3, as well as in the 445 µM-treated NaNO3. As the experiment progressed, protein concentration decreased, reaching concentrations of <220 µg mg−1 by day 18. A high decrease, from 47 to 57%, in protein content was observed in very low (N1 and C1), moderately high (N3 and C3) and high (N4 and C4) nitrogen salt concentrations with time. Moderately low salt concentrations (C2 and N2) initially yielded lower protein concentrations but showed less variation with time. In this case, the decline in protein concentration during the experiment was 39% for NaNO3 and 31% for NH4Cl (Table 3 and Table 4).
The carbohydrate and lipid contents were influenced by the interaction between nitrogen concentration and culture age (p < 0.005) and not by the nitrogen source. The carbohydrate concentration was the least consistent in time and nitrogen concentration. For instance, during most of the experiment, carbohydrates showed higher concentrations with high NH4Cl concentrations (C3 and C4) but no clear pattern was observed with time. By contrast, the NaNO3 cultures increased their carbohydrate concentration with time and increased, on most days, with low nitrogen concentration (Table 3).
As expected, the lipids reached highest concentrations at lower nitrogen concentrations. In the case of NaNO3, they reached a plateau of ~460 µg mg−1 for N2 and 495 µg mg−1 for N1 after day 6. These values were not significantly different from those observed at day 9 or 12, suggesting a relatively long stationary phase in terms of lipid yield. For the treatments with NH4Cl, C1 and C2 reached a small plateau of ~500 and 450 µg mg−1 after day 9 and remained at similar values after day 12. In most treatments, the lipid content dropped after day 15, indicating a time limit for harvesting if maximum lipid concentrations are the main goal.

3.3. Fatty Acids

The T. weissflogii fatty acid pattern was divided based on the degree of saturation, namely SAFA (saturated fatty acid), MUFA (monounsaturated fatty acid) and PUFA (polyunsaturated fatty acid). During exponential growth, the microalgae tended to show similar fatty acid percentages between the two different nitrogen sources, but the fatty acid concentration differed (p > 0.05).
In the NaNO3 cultures, SAFA constituted 53.52%, PUFA 44.78% and, in a lower proportion, MUFA contributed 1.69%. In the NH4Cl cultures, SAFA was 50.16%, PUFA 48.60% and, in a lower proportion, MUFA contributed 1.22%. The T. weissflogii concentration of selected PUFAs varied widely as a consequence of nitrogen source and concentration (Table 5).
The major fatty acids were eicosapentaenoic (EPA, 20:5n3) and docosahexaenoic (DHA, 22:6n3) acids, and both increased at higher NaNO3. EPA concentration was higher than DHA in treatments with low and medium NaNO3 concentrations. However, at the highest NaNO3 concentration, the DHA concentration surpassed that of EPA. By contrast, the NH4Cl treatments yielded mixed results: the EPA and DHA concentrations were higher at moderately low and very high NH4Cl concentrations, whereas at very low and moderately high NH4Cl concentrations, these values dropped. In all four NH4Cl concentrations, EPA concentration surpassed that of DHA.

4. Discussion

4.1. Microalgae Growth and Biomass Production

As the nitrogen concentration increased in the cultures, the T. weissflogii biomass concentration and cell density increased. A decrease in algal biomass concentration in low nitrate concentration was also observed [35] in Nannochloropsis sp.
As previously described, reduced nitrogen forms as ammonium or urea are preferably used for microalgae, since nitrate must be transformed into ammonium before it is utilized assimilated by algal cells, so more energy expenditure is necessary [36,37]. This assertion remains true for lower nitrogen salt concentrations and was particularly evident for moderately low concentrations (N2 and C2), where the NH4Cl yielded a biomass peak twice as large as that yielded by the NaNO3. However, high NH4Cl concentration cultures reached peak biomass three days later than similar NaNO3 cultures, which suggests that at high salt concentrations, NaNO3 can be assimilated slightly faster than NH4Cl.
Considering only the cost per metric ton of each salt ($200–$430 USD ton−1 NaNO3 vs. $90–$200 USD metric ton−1 NH4Cl) [38,39] and the amount required to run the experiment, an estimated production (mg USD−1) was computed. Since NH4Cl is less than half the price of NaNO3, treatments with low NH4Cl were the most cost-effective in all cases. All the treatments reached their most cost-effective values after 15 or 18 days. However, differences in time and growth rate were also important for estimated costs. For instance, C1 and C2 (low and moderately low NH4Cl) provided a maximum of >6 mg DW USD−1 after 15 days, whereas C3 and C4 (moderately high and high NH4Cl) provided a maximum of 3–4 mg DW USD−1 after 15 and 18 days, respectively. By contrast, N1 reached a maximum of 3.2 mg DW USD−1 after 18 days, and N2–N4 provided only 1.44–1.68 mg DW USD−1 after 15 or 18 days.

4.2. Biochemical Composition

Since microalgal species can vary in nutritional value as a function of culture conditions, several studies have attempted to manipulate them with the objective of increasing biochemical products [2,40,41], protein [13], carbohydrate [35,42], lipid [43,44,45] and fatty acid [16,46,47] contents. Many microalgal species, respond to nitrogen deficiency by increasing their lipid content. A lack of nitrogen and carbon availability allows microalgae to switch from synthetizing proteins to lipids, with correspondingly slower growth rates and lower biomass production [48]. Some strains of the genus Thalassiosira have been described as potentially harmful [49] but the production of allelochemical compounds from T. weisflogii strains with allelopathic effects against potentially harmful microalgae, such as Phaeocystis globosa, has also been reported [50].
Chlorophyll is utilized as an intracellular nitrogen pool to support further cell growth and biomass production as nitrogen in the media becomes depleted [47,51]. Chlorophyll a follows a similar trend to biomass production, since chlorophyll a is a nitrogen-rich compound that contains four nitrogen atoms. This suggests that cells accumulate large quantities of chlorophyll molecules when a nitrogen source is abundantly available [52]. This pattern has been described in a previous research [13].
The protein content revealed maximum values in the exponential growth phase, decreasing throughout the stationary phase. Costard [13] found the same trend for five genera of microalgae from the Brazilian coast (Bellerochea sp., Van Heurck 1885; Chaetoceros sp., Ehrenberg 1844; Chlorella sp. M. Beijerinck 1890; Rhodomonas sp. Karsten 1898 and Thalassiosira sp. Cleve 1873). Silva [53] also reported a peak in the protein content of Rhodomonas in the transitional growth phase and a declination in the stationary stage.
Generally, as microalgae enter the stationary stage due to limited nutrients, cells accumulate carbon in the form of lipids and carbohydrates [13,54]. Navarro [55] observed that the lipid content tends to increase when cultures reach the stationary phase, especially when silicate and nitrogen are limited. This study proved that lipid content rises as nitrogen concentration declines in the cultures around day nine, i.e., at the onset of the stationary phase. This phenomenon was clearly observed in cultures with lower nitrogen concentrations (111.25, 222.50 µM). Lv [56] studied the effect of KNO3 concentration on the lipid concentration. Different KNO3 concentrations of 0.2, 1.0, 3.0 and 5.0 mM were applied to Chlorella vulgaris cultures and demonstrated that the lipid content decreased as the KNO3 concentration increased.

4.3. Fatty Acids

The use of microalgae as natural sources of fatty acids for aquaculture has become the focus of scientific developments in recent years, particularly PUFA content, which performs specific physiological functions as a phospholipid biomembrane component [8].
In this study, the fatty acid content of T. weissflogii fatty was predominantly represented by SAFA and PUFA, which increased with lower nitrogen concentration cultures and culture age. The fatty acid component can be modified by the nitrogen concentration and source. The presence of NH4+ stimulates the activity of desaturases, which catalyzes the formation of double bonds, forming unsaturated fatty acids; the highest PUFA levels were noted with the NH4Cl source. The major fatty acids were eicosapentaenoic acid (EPA, 20:5n3) and docosahexaenoic (DHA, 22:6n3). EPA results have been reported for T. weissflogii and other diatom strains as one of the major fatty acid contents [57,58,59,60].

5. Conclusions

Higher nitrogen concentrations influenced T. weissflogii cell metabolism, increasing cell biomass and protein content. By contrast, low nitrogen concentrations increased lipid concentration, probably due to their storage of cell reserves. In most cases, the carbohydrate concentrations also increased with nitrogen limitation.
With respect to production, moderately low NH4Cl treatment (C2) proved to be highly efficient in EPA, moderately efficient in DHA, and the most cost-effective in terms of biomass; no variations were observed in protein content with culture age. Concentrations of NH4Cl close to 222 µM were considered the best option for cultivating T. weissflogii as food for the growth of marine larvae of commercial interest. However, if the goal is to maximize DHA production, NaNO3 at 890 µM should be considered for rearing purposes.

Author Contributions

Conceptualization, methodology, investigation and writing—original draft preparation, F.E.H.-S.; formal analysis and writing—review and editing J.A.D.Á.-R.; supervision, writing—review and editing E.J.N.-V.; writing—review and editing, C.J.B.-S.; resources and writing—review and editing B.O.A.-V.; writing—review and editing Á.I.C.-C.; data curation and software, M.M.-L.; visualization and editing L.J.F.-H.; conceptualization, writing—original draft preparation and funding acquisition, D.J.L.-C. All authors have read and agreed to the published version of the manuscript.

Funding

This research was funded by the institutional projects PC 0.11, PC 0.12 and AC0.8 (CIBNOR) and the student fellowship CONACyT 126348.

Institutional Review Board Statement

Not applicable for studies not involving humans or animals.

Informed Consent Statement

Not applicable.

Data Availability Statement

Not applicable.

Acknowledgments

The authors thank Laura Carreon-Palau for her assistance in the GC-MS analysis; Gerardo García for his help in the preparation of the figures; W. Johnson and Miguel Cordoba-Matson for improving the English version; and Diana Fischer for English editing.

Conflicts of Interest

The authors declare no conflict of interest.

References

  1. FAO-Food and Agriculture Organization of the United Nations. The State of World Fisheries Aquaculture; FAO Fisheries and Aquaculture Department: Rome, Italy, 2010; p. 197. ISBN 978-92-5-106675-1. [Google Scholar]
  2. Lavens, P.; Sorgeloos, P. Manual on the Production and Use of Live Food for Aquaculture; FAO Fisheries Technical: Rome, Italy, 1996; p. 295, Paper No. 361. [Google Scholar]
  3. Knauer, J.; Southgate, P.C.A. Review of the Nutritional Requirements of Bivalves and the Development of Alternative and Artificial Diets for Bivalve Aquaculture. Rev. Fish. Sci. 1999, 7, 241–280. [Google Scholar] [CrossRef]
  4. Aji, L.P. The Use of Algae Concentrates Dried Algae and Algal Substitutes to Feed Bivalves. Makara Sains 2011, 15, 1–8. [Google Scholar]
  5. Sukenik, A.; Zmora, O.; Carmeli, Y. Biochemical Quality of Marine Unicellular Algae with Special Emphasis on Lipid Composition. II Nannochloropsis sp. Aquaculture 1993, 117, 313–326. [Google Scholar] [CrossRef]
  6. Volkman, J.K.; Jeffrey, S.W.; Nichols, P.D.; Rogers, G.I.; Garland, C.D. Fatty Acid and Lipid Composition of 10 Species of Microalgae Used in Mariculture. J. Exp. Mar. Biol. Ecol. 1989, 128, 219–240. [Google Scholar] [CrossRef]
  7. Becker, E.W. Micro-algae as a Source of Protein. Biotechnol. Adv. 2007, 25, 207–210. [Google Scholar] [CrossRef]
  8. Patil, V.; Källqvist, T.; Olsen, E.; Vogt, G.; Gislerød, H.R. Fatty Acid Composition of 12 Microalgae for Possible Use in Aquaculture Feed. Aquacult. Int. 2007, 15, 1–9. [Google Scholar] [CrossRef]
  9. Ehteshami, F.; Christianus, A.; Rameshi, H.; Harmin, S.A.; Saad, C.R. Proximate and Fatty Acid Composition of the Gonads of Wild versus Hatchery-Conditioned Pinctada margaritifera Broodstock. Aquacul. Nut. 2011, 17, 675–682. [Google Scholar] [CrossRef]
  10. Kiatmetha, P.; Siangdang, W.; Bunnag, B.; Senapin, S.; Withyachumnarnkul, B. Enhancement of Survival and Metamorphosis Rates of Penaeus monodon Larvae by Feeding with the Diatom Thalassiosira weissflogii. Aquacul. Int. 2011, 19, 599–609. [Google Scholar] [CrossRef]
  11. Kiron, V.; Phromkunthong, W.; Huntley, M.; Archibald, I.; De Scheemaker, G. Marine Microalgae from Biorefinery as a Potential Feed Protein Source for Atlantic Salmon, Common Carp and Whiteleg Shrimp. Aquacult. Nutr. 2012, 18, 521–531. [Google Scholar] [CrossRef]
  12. Liu, Z.Y.; Wang, G.C.; Zhou, B.C. Effect of Iron on Growth and Lipid Accumulation in Chlorella vulgaris. Bioresour. Technol. 2008, 99, 4717–4722. [Google Scholar] [CrossRef] [PubMed]
  13. Costard, G.S.; Machado, R.R.; Barbarino, E.R.; Martino, C.; Lourenço, S.O. Chemical Composition of Five Marine Microalgae that Occur on the Brazilian Coast. Int. J. Fish. Aquacult. 2012, 4, 191–201. [Google Scholar]
  14. Garcia, N.; Lopez-Elias, J.A.; Miranda, A.; Martinez-Porchas, M.; Huerta, N.; Garcia, A. Effect of Salinity on Growth and Chemical Composition of the Diatom Thalassiosira weissflogii at Three Culture Phases. Lat. Am. J. Aquat. Res. 2012, 40, 435–440. [Google Scholar] [CrossRef]
  15. Moronta, R.; Mora, R.; Morales, E. Respuesta de la Microalga Chlorella sorokiniana al pH, Salinidad y Temperatura en Condiciones Axénicas y no Axénicas. La Rev.Fac.Agron. 2006, 23, 27–41. [Google Scholar]
  16. Pacheco, J.M.; Cadena, M.A.; Sánchez, M.P.; Tovar, R.D.; Rangel, D.C. Effect of Culture Medium and Nutrient Concentration on Fatty Acid Content of Chaetoceros muelleri. Revista Latinoam. Biotecnol. Ambient. Algal. 2010, 1, 6–15. [Google Scholar]
  17. Renaud, S.M.; Thinh, L.V.; Parry, D.L. The Gross Chemical Composition and Fatty Acid Composition of 18 Species of Tropical Australian Microalgae for Possible Use in Mariculture. Aquaculture 1999, 170, 147–159. [Google Scholar] [CrossRef]
  18. Gouveia, L.; Oliveira, A.C. Microalgae as a Raw Material for Biofuels Production. J. Ind. Microbiol. Biotechnol. 2009, 36, 269–274. [Google Scholar] [CrossRef]
  19. Pruvost, J.; Vooren, G.; Gouic, B.; Mossion, A.; Legrand, J. Systematic Investigation of Biomass and Lipid Productivity by Microalgae in Photobioreactors for Biodiesel Application. Bioresour. Technol. 2011, 102, 150–158. [Google Scholar] [CrossRef] [Green Version]
  20. Lourenco, S.O.; Barbarino, E.; Mancini-Filho, J.; Schinke, K.P.; Aldar, E. Effects of Different Nitrogen Sources on the Growth and Biochemical Profile of 10 Marine Microalgae in Batch Culture: An Evaluation for Aquaculture. Phycologia 2002, 41, 158–168. [Google Scholar] [CrossRef]
  21. Guillard, R.R. Culture of Phytoplankton for Feeding Marine Invertebrate Animals. Culture of Marine Invertebrate Animals; Smith, W.L., Chanley, M.H., Eds.; Plenum Press: New York, NY, USA, 1975; pp. 29–60. [Google Scholar]
  22. Verhulst, P.F. Recherches mathématiques sur la loi d’accroissement de la population [Mathematical Researches into the Law of Population Growth Increase]. Nouv. Mém. L’académie R. Sci. Belles-Lett. Brux. 1845, 18, 1–42. [Google Scholar]
  23. McKendrick, A.; Pai, M. The Rate of Multiplication of Micro-organisms: A Mathematical Study. Proc. R. Soc. Edinb. 1912, 31, 649–655. [Google Scholar] [CrossRef] [Green Version]
  24. Pearl, R.; Reed, L. On the Rate of Growth of the Population of the United States. Proc. Natl. Acad. Sci. USA 1920, 6, 275–288. [Google Scholar] [CrossRef] [Green Version]
  25. Guillard, R.R.L.; John, H.; Ryther, J.H. Studies of marine planktonic diatoms: I. Cyclotella nana Hustedt, and Detonula confervacea (Cleve) Gran. Can. J. Microbiol. 1962, 8, 229–239. [Google Scholar] [CrossRef]
  26. Levasseur, M.; Thompson, P.A.; Harrison, P.J. Physiological acclimation of marine phytoplankton to different nitrogen sources. J. Phycol. 1993, 29, 587–595. [Google Scholar] [CrossRef]
  27. Zhang, X.; Wen, Y.; Yang, S.T. Modes of Culture/Animal Cells. In Comprehensive Biotechnology, 2nd ed.; Murray, M.Y., Ed.; Academic Press: Cambridge, MA, USA, 2011; pp. 285–302. [Google Scholar]
  28. Lowry, O.H.; Rosebrough, N.J.; Farr, A.L.; Randall, R.J. Protein Measurement with the Folin-Phenol Reagent. J. Biol. Chem. 1951, 193, 265–275. [Google Scholar] [CrossRef]
  29. Dubois, M.; Gilles, K.A.; Hamilton, J.D.; Rebers, P.A.; Smith, F. Colorimetric Method for Determination of Sugars and Related Substances. Anal. Chem. 1956, 28, 350–356. [Google Scholar] [CrossRef]
  30. Vidussi, F.; Claustre, H.; Bustillos, G.J.; Cailiau, C.; Marty, J.C. A Rapid HPLC Method for the Determination of Phytoplankton Pigments in Natural Waters Including the Separation of Chlorophyll a from Divinyl-chlorophyll a and Zeaxathin from Lutein. J. Plankton Res. 1996, 18, 2377–2382. [Google Scholar] [CrossRef] [Green Version]
  31. Bligh, E.G.; Dyer, W.J. A Rapid Method of Total Lipid Extraction and Purification. Can. J. Biochem. Physiol. 1959, 37, 911–917. [Google Scholar] [CrossRef]
  32. Marsh, J.B.; Weinstein, D.B. Simple Charring Method for Determination of Lipids. J. Lip. Res. 1966, 7, 574–576. [Google Scholar] [CrossRef]
  33. Sato, N.; Murata, N. Membrane Lipids. Methods Enzymol. 1988, 167, 251–259. [Google Scholar]
  34. Zar, J. Biostatitical Analysis; Prentice Hall: Englewood Cliffs, NJ, USA, 1999; p. 663. [Google Scholar]
  35. Huertas, E.; Montero, O.; Lubian, L.M. Effects of Dissolved Inorganic Carbon Availability on Growth, Nutrient Uptake and Chlorophyll Fluorescence of two Marine Microalgae. Aquac. Eng. 2000, 22, 181–197. [Google Scholar] [CrossRef]
  36. Chitra, R.S.; Sumitra, V.C.; Yash, S. Effect of Different Nitrogen Sources and Plant Growth Regulators on Glutamine Synthetase and Glutamate Synthase Activities of Radish cotyledons. Bul. J. Plant Physiol. 2002, 28, 46–56. [Google Scholar]
  37. Rees, T.A. Metabolic and Ecological Constraints Imposed by Similar Rates of Ammonium and Nitrate Uptake per Unit Surface Area at Low Substrate Concentrations in Marine Phytoplankton and Macroalgae. J. Phycol. 2007, 43, 197–207. [Google Scholar]
  38. Available online: https://www.made-in-china.com/products-search/hot-china-products/nano3_price.html (accessed on 6 November 2021).
  39. Available online: https://www.made-in-china.com/products-search/hot-china-products/nh4cl_price.html (accessed on 6 November 2021).
  40. Fu, W.; Wichuk, K.; Brynjólfsson, S. Developing diatoms for value-added products: Challenges and opportunities. N. Biotechnol. 2015, 32, 547–551. [Google Scholar] [CrossRef]
  41. Vinayak, V.; Manoylov, K.M.; Gateau, H.; Blanckaert, V.; Hérault, J.; Pencréac’h, G.; Marchand, J.; Gordon, R.; Schoefs, B. Diatom Milking: A Review and New Approaches. Mar. Drugs 2015, 13, 2629–2665. [Google Scholar] [CrossRef] [Green Version]
  42. Sánchez, A.; Cerón, M.; García, F.; Molina, E.; Chisti, Y. Growth and Biochemical Characterization of Microalgal Biomass Produced in Bubble Column and Airlift Photobioreactors: Studies in Fed-Batch Culture. Enzyme Microb. Technol. 2002, 31, 1015–1023. [Google Scholar] [CrossRef]
  43. Lee, Y.C.; Kim, B.; Farooq, W.; Chung, J.; Han, H.; Shin, J.; Jeong, H.; Park, J.; Lee, S.; Oh, K. Harvesting of Oleaginous Chlorella sp. by Organoclays. Bioresour. Technol. 2013, 132, 440–445. [Google Scholar] [CrossRef] [PubMed]
  44. Gatenby, C.M.; Orcutt, D.M.; Kreeger, D.A.; Parker, B.C.; Jones, V.A.; Neves, R.J. Biochemical Composition of Three Algal Species Proposed as Food for Captive Freshwater Mussels. J. Appl. Phycol. 2003, 5, 1–11. [Google Scholar] [CrossRef]
  45. Yi, Z.; Xu, M.; Di, X.; Brynjolfsson, S.; Fu, W. Exploring Valuable Lipids in Diatoms. Front. Mar. Sci. 2017, 4, 17. [Google Scholar] [CrossRef] [Green Version]
  46. Li, Y.; Horsman, M.; Wang, B.; Wu, N.; Lan, C.Q. Effects of Nitrogen Sources on Cell Growth and Lipid Accumulation of Green Algae Neochloris oleoabundans. Appl. Microbiol. Biotechnol. 2008, 81, 629–636. [Google Scholar] [CrossRef] [PubMed]
  47. Sabia, A.; Clavero, E.; Pancaldi, S.; Salvadó, R.J. Effect of different CO2 concentrations on biomass, pigment content, and lipid production of the marine diatom Thalassiosira pseudonana. Appl. Microbiol. Biotechnol. 2018, 102, 1945–1954. [Google Scholar] [CrossRef] [PubMed]
  48. Liang, Y.; Kangsen, M. Effect of Growth Phase on the Fatty Acid Compositions of Four Species of Marine Diatoms. J. Ocean Univ. China. 2005, 4, 157–162. [Google Scholar] [CrossRef]
  49. Fryxell, G.A.; Hasle, G.R. Taxonomy of diatoms. In Manual on Harmful Marine Microalgae; Hallegraeff, G.M., Andersen, D.M., Cembella, A.D., Eds.; UNESCO: Paris, France, 2003; pp. 465–510. [Google Scholar]
  50. Wang, X.; Huo, Y.; Yang, F.; Wang, Y. Induced Allelopathic Effects of Thalassiosira weissflogii on Colony Formation in Phaeocystis globosa. Water 2021, 13, 581. [Google Scholar] [CrossRef]
  51. Brennan, L.; Owende, P. Biofuels from Microalgae—A Review of Technologies for Production, Processing, and Extractions of Biofuels and Co-Products. Renew. Sust. Energ. Rev. 2010, 14, 557–577. [Google Scholar] [CrossRef]
  52. Ördöget, V.; Stirk, W.A.; Bálint, P.; Staden, J.; Lovász, C. Changes in Lipid, Protein and Pigment Concentrations in Nitrogen-Stressed Chlorella minutissima Cultures. J. Appl. Phycol. 2012, 24, 907–914. [Google Scholar] [CrossRef]
  53. Silva, A.F.; Lourenco, S.O.; Chaloub, R.M. Effects of Nitrogen Starvation on the Photosynthetic Physiology of a Tropical Marine Microalgae Rhodomonas sp. (Cryptophyceae). Aquat. Bot. 2009, 91, 291–297. [Google Scholar] [CrossRef]
  54. Makarevičienė, V.; Andrulevičiūt, V.; Skorupskaitė, V.; Kasperovičienė, J. Cultivation of Microalgae Chlorella sp. and Scenedesmus sp. as a Potentional Biofuel Feedstock. Environ. Res. Eng. Manage. 2011, 3, 21–27. [Google Scholar]
  55. Navarro, P.A.; Rebolloso, M.M.; Ramos, J.J.; Guil, J.L. Biomass Nutrient Profiles of the Microalgae Phaeodactylum tricornutum. J. Food Biochem. 2001, 25, 57–76. [Google Scholar]
  56. Lv, J.M.; Cheng, L.H.; Xu, X.H.; Zhang, L.; Chen, H.L. Enhanced Lipid Production of Chlorella vulgaris by Adjustment of Cultivation Conditions. Bioresour. Technol. 2010, 101, 6797–6804. [Google Scholar] [CrossRef]
  57. Marella, T.K.; Tiwari, A. Marine diatom Thalassiosira weisflogii based biorefinery for co-production of eicosapentaenoic acid and fucoxanthin. Bioresour. Technol. 2020, 307, 123245. [Google Scholar] [CrossRef] [PubMed]
  58. d´Ippolito, G.; Sardo, A.; Paris, D.; Vella, F.M.; Adelfi, M.G.; Botte, P.; Gallo, C.; Fontana, A. Potential of lipid metabolism in marine diatoms for biofuel production. Biotechnol. Biofuels. 2015, 8, 28. [Google Scholar] [CrossRef] [PubMed] [Green Version]
  59. Ryckebosch, E.; Bruneel, C.; Termote-Verhalle, R.; Goiris, K.; Muylaert, K.; Foubert, I. Nutritional evaluation of microalgae oils in omega-3 chain polyunsaturated fatty acid as an alternative for fish oil. Food Chem. 2014, 160, 393–400. [Google Scholar] [CrossRef] [Green Version]
  60. Kumar, B.R.; Deviram, G.; Mathimani, T.; Duc, P.A.; Pugazhendhi, A. Microalgae as rich source of polyunsaturated fatty acids. Biocatal. Agric. Biotechnol. 2019, 17, 583–588. [Google Scholar] [CrossRef]
Table 1. Sources and concentrations of nitrogen used in Thalassiosira weissflogii experimental culture media.
Concentration
(µM)
Treatments
(NH4Cl)
Treatments
(NaNO3)
111.25 C1N1
222.5 C2N2
445 C3N3
890 C4N4
Table 2. Parameter estimations of Thalassiosira weissflogii growth curves with two different nitrogen sources at different concentrations via different models.
NaNO3 µmolNH4Cl µmol
TreatmentN1N2N3N4C1C2C3C4
µmol L−1 [as Salt]111.25222.50445.00890.00111.25222.50445.00890.00
µg L−1 [N]18.3336.6773.33146.6729.1358.26116.52233.05
Parameter estimation of the sigmoidal curve via least squares (SSQ)
N0 (cells mL−1)507,498416,176505,885457,116473,424439,717485,535426,034
r (h−1)0.03040.02210.03510.02750.03580.02940.03670.0385
k or Nmax (cells mL−1)5,378,4788,360,9229,553,60112,580,3065,589,7477,700,4077,921,20111,852,018
% max k43667610044616394
k/2 (cells mL−1)2,689,2394,180,4614,776,8016,290,1532,794,8733,850,2033,960,6005,926,009
tk/2 (hours)741348211967957586
Formula estimation of µ and PDT
µmax (h−1)0.01110.01250.01330.01140.01170.01300.01290.0118
PDT (hours)62.255.352.260.859.453.353.958.8
Parameter estimation of an exponential rise to maximum model via non-linear regression (Note t (days)
b0.3430.1140.2410.1220.2770.1730.2950.145
95% CI b0.2640.0640.0870.0400.1730.0800.1350.044
a4,349,8739,604,8789,306,67315,151,9145,246,4308,220,8187,207,90214,152,484
95% CI a851,4062,393,7871,012,2722,163,974931,9081,363,124902,5461,691,236
Values represent equations 1 and 2 parameters and therefore describe the whole growth curves.
Table 3. Total protein, carbohydrate and lipid contents (mean value and standard deviation) of Thalassiosira weissflogii dry biomass at different days, cultured at four different nitrogen concentrations of NaNO3.
Time (Days)
NaNO3 µmol391518
Protein
(µg mg−1)
111.2574.7 ± 9.588.5 ± 7.177.5 ± 12.745.2 ± 7.7
222.50158.9 ± 12.0123.7 ± 43.4116.6 ± 19.196.27 ± 2.5
445325.1 ± 63.4200.0 ± 24.4183.4 ± 2.2144.7 ± 7.5
890351.4 ± 22.8239.7 ± 36.5232.9 ± 3.6185.6 ± 10.5
Carbohydrates
(µg mg−1)
111.25178.0 ± 27.7300.4 ± 9.7399.4 ± 50.3290.2 ± 9.9
222.50 188.8 ± 70.5386.7 ± 10.9312.8 ± 48.7436.6 ± 5.3
445216.5 ± 66.7274.1 ± 36.7334.1 ± 43.0272.1 ± 64.7
890215.8 ± 15.4253.7 ± 10.0238.5 ± 7.4211.5 ± 5.8
Lipids
(µg mg−1)
111.25318.6 ± 22.0494.5 ± 10.5447.1 ± 20.9370.1 ± 8.7
222.50 338.9 ± 31.2460.4 ± 51.1388.2 ± 22.4356.4 ± 40.2
445244.8 ± 5.7349.1 ± 44.2340.3 ± 38.7268.5 ± 32.8
890240.0 ± 10.1281.9 ± 61.9335.5 ± 12.5289.1 ± 13.3
Table 4. Total protein, carbohydrate and lipid contents (mean value and standard deviation) of Thalassiosira weissflogii dry biomass at different days cultured at four different nitrogen concentrations of NH4Cl.
Time (Days)
NH4Cl µmol391518
Protein
(µg mg−1)
111.25126.5 ± 10.572.21 ± 20.9124.4 ± 16.6102.9 ± 11.8
222.50143.4 ± 22.8146.8 ± 11.8165.8 ± 5.8128.5 ± 23.3
445230.2 ± 16.0238.3 ± 52.1171.2 ± 43.7183.8 ± 56.7
890393.1 ± 68.5242.3 ± 12.5218.7 ± 6.9199.4 ± 11.5
Carbohydrates
(µg mg−1)
111.25350.9 ± 45.9354.3 ± 22.2279.9 ± 45.6279.1 ± 22.9
222.50351.7 ± 106.9385.6 ± 13.6380.9 ± 29.1266.6 ± 21.4
445205.1 ± 77.4348.6 ± 20.3284.2 ± 20.6248.1 ± 16.9
890142.3 ± 50.6353.0 ± 54.3271.6 ± 34.8267.9 ± 30.0
Lipids
(µg mg−1)
111.25378.6 ± 10.5497.7 ± 11.1404.7 ± 17.7387.6 ± 11.1
222.5048.6 ± 28.3450.9 ± 28.2404.8 ± 0.08425 ± 14.4
445263.1 ± 10.8328.6 ± 24.3414.2 ± 12.0309.4 ± 7.2
890235.0 ± 9.4319.8 ± 6.54318.8 ± 9.0309.2 ± 14.9
Table 5. Polyunsaturated fatty acid (PUFA), eicosapentaenoic acid (EPA) and docosahexaenoic acid (DHA) composition of Thalassiosira weissflogii growth in different nitrogen sources (µM) and concentrations in pg cells−1 (mean ± SD). SD: standard deviation.
NaNO3 (µM)NH4Cl (µM)
PUFA111.25222.5445890111.25222.5445890
18:21.20 ± 0.531.59 ± 0.461.32 ± 0.312.96 ± 0.830.63 ± 0.210.97 ± 0.381.38 ± 0.681.52 ± 0.37
18:33.03 ± 1.132.82 ± 1.172.58 ± 1.914.08 ± 2.691.33 ± 0.292.57 ± 1.993.53 ± 1.294.08 ± 2.69
18:43.11 ± 1.054.86 ± 1.823.53 ± 2.135.95 ± 4.673.61 ± 1.433.14 ± 1.905.83 ± 3.611.89 ± 1.45
20:40.014 ± 0.040.026 ± 0.010.059 ± 0.040.043 ± 0.020.01 ± 0.00090.01 ± 0.0060.01 ± 0.0070.02 ± 0.009
20:5n3 (EPA)16.67 ± 4.357.58 ± 2.4814.12 ± 3.097.29 ± 1.1411.94 ± 9.4716.91 ± 4.7310.24 ± 3.3611.04 ± 6.67
22:6n3 (DHA)7.22 ± 1.454.37 ± 3.026.45 ± 2.769.24 ± 3.694.82 ± 2.068.38 ± 2.015.25 ± 2.446.77 ± 4.16
Publisher’s Note: MDPI stays neutral with regard to jurisdictional claims in published maps and institutional affiliations.

