Article

Quantitative Optical Coherence Tomography for Longitudinal Monitoring of Postnatal Retinal Development in Developing Mouse Eyes

1
Department of Biomedical Engineering, University of Illinois Chicago, Chicago, IL 60612, USA
2
Department of Ophthalmology and Visual Sciences, University of Illinois Chicago, Chicago, IL 60612, USA
*
Author to whom correspondence should be addressed.
Submission received: 6 January 2022 / Revised: 4 February 2022 / Accepted: 5 February 2022 / Published: 11 February 2022
(This article belongs to the Special Issue Advanced Optical Coherence Tomography (OCT) in Ophthalmology)

Abstract

:

Featured Application

Quantitative optical coherence tomography (OCT) promises a noninvasive method for longitudinal monitoring of postnatal retinal development.

Abstract

A better study of postnatal retinal development is essential for the in-depth understanding of the nature of the vision system. To date, quantitative analysis of postnatal retinal development is primarily limited to endpoint histological examination. This study is to validate in vivo optical coherence tomography (OCT) for longitudinal monitoring of postnatal retinal development in developing mouse eyes. OCT images of C57BL/6J mice were recorded from postnatal day (P) 14 to P56. Three-dimensional (3D) frame registration and super averaging were adopted to investigate the fine structure of the retina. Quantitative OCT analysis revealed distinct outer and inner retinal layer changes, corresponding to eye development. At the outer retina, external limiting membrane (ELM) and ellipsoid zone (EZ) band intensities gradually increased with aging, and the IZ band was detectable by P28. At the inner retina, a hyporeflective layer (HRL) between the nerve fiber layer (NFL) and inner plexiform layer (IPL) was observed in developing eyes and gradually disappeared with aging. Further image analysis revealed individual RGCs within the HRL layer of the young mouse retina. However, RGCs were merged with the NFL and the IPL in the aged mouse retina. Moreover, the sub-IPL layer structure was observed to be gradually enhanced with aging. To interpret the observed retinal layer kinetics, a model based on eyeball expansion, cell apoptosis, and retinal structural modification was proposed.

1. Introduction

The mammalian retina continuously grows after birth, which is the so-called postnatal retinal development. Most of the cell differentiation, structure building, and synaptogenesis is complete at the time point of eye opening [1], while the retinal neurite circuit is still under development after eye opening [2,3,4]. For mice, the dendrites of retinal ganglion cells (RGCs) ramify across the whole inner plexiform layer (IPL) at the time of birth and refine into different stratifications during postnatal retinal development [5]. After eye opening, a light-stimulation-regulated, RGC dendritic lamination was observed. Around 40% of bistratified RGCs turned into monostratified [3,6]. With stratification refinement, the density of both ribbons and conventional synapses in the IPL continuously increases after eye opening and reaches the peak level by around postnatal day (P) 21 [7]. However, the receptive field center size of RGCs of the mouse at P28 reduced from the mouse at P17 (3 days after eye opening) [8]. All these studies indicated that the postnatal retinal development after eye opening is important for visual function. However, the study of developing mouse retinas is primarily limited to endpoint histological examination, which limits dynamic observation of developing retinal architecture. Thus, an in vivo imaging method for longitudinal monitoring of postnatal retinal development is desirable.
This study is to validate optical coherence tomography (OCT) for longitudinal monitoring of postnatal retinal development in developing mouse eyes. OCT has been widely used in ophthalmology clinics and research for its excellent depth-resolved capability [9]. For instance, the retinal thickness, as a reflection of total cell number and retinal structure complexity, has been used as a biomarker for retinal degeneration [10,11,12] and damage recovery [13,14] studies. Retinal layer thickness abnormity has also been associated with retinopathy of prematurity (ROP). Compared with the normally developed retina, for ROP, the photoreceptor layer was thinner, and the inner nuclear layer (INL) was thicker [15]. As a new OCT modality, OCT angiography has been used to monitor vascular changes in normal-developing and diseased animal models [16,17,18].
In this study, longitudinal OCT of developing mouse eyes was conducted from eye opening, i.e., P14 up to P56. Quantitative analysis of individual retinal layers was analyzed and discussed. Three-dimensional (3D) frame registration and super averaging [19,20,21] were adopted to investigate the fine structure of the retina. Interestingly, a hyporeflective layer (HRL) between the nerve fiber layer (NFL) and inner plexiform layer (IPL) was observed in developing eyes and gradually disappeared with aging. On the contrary, the IPL stratification structure was not clear at an early age but gradually developed with aging. To interpret the observed retinal layer development, a model based on eyeball expansion, cell apoptosis, and retinal structural modification is discussed.

2. Materials and Methods

2.1. Animal Preparation

All animal care and experiments conformed to the Association for Research in Vision and Ophthalmology statement for the use of animals in ophthalmic and vision research. All experiments were conducted following the protocols approved by the Animal Care Committee at the University of Illinois Chicago (UIC). C57BL/6J mice were grouped into P14, P17, P21, P28, and P56. Each group contained 5 or 6 mice. The mice were housed in the Biology Resource Lab of UIC with 14 h light and 10 h dark circulation. Before OCT recording, the mice were anesthetized with a mixture of 100 mg/kg ketamine and 5 mg/kg xylazine injected intraperitoneally. A heating pad was used to maintain body temperature during image recording. The pupil was fully dilated with 0.5% tropicamide. A cover glass, along with lubricant eye gel (GenTeal, Alcon Laboratories, Fort Worth, TX, USA), was placed on the cornea to prevent drying as well as to serve as a contact concave lens to improve the image quality.

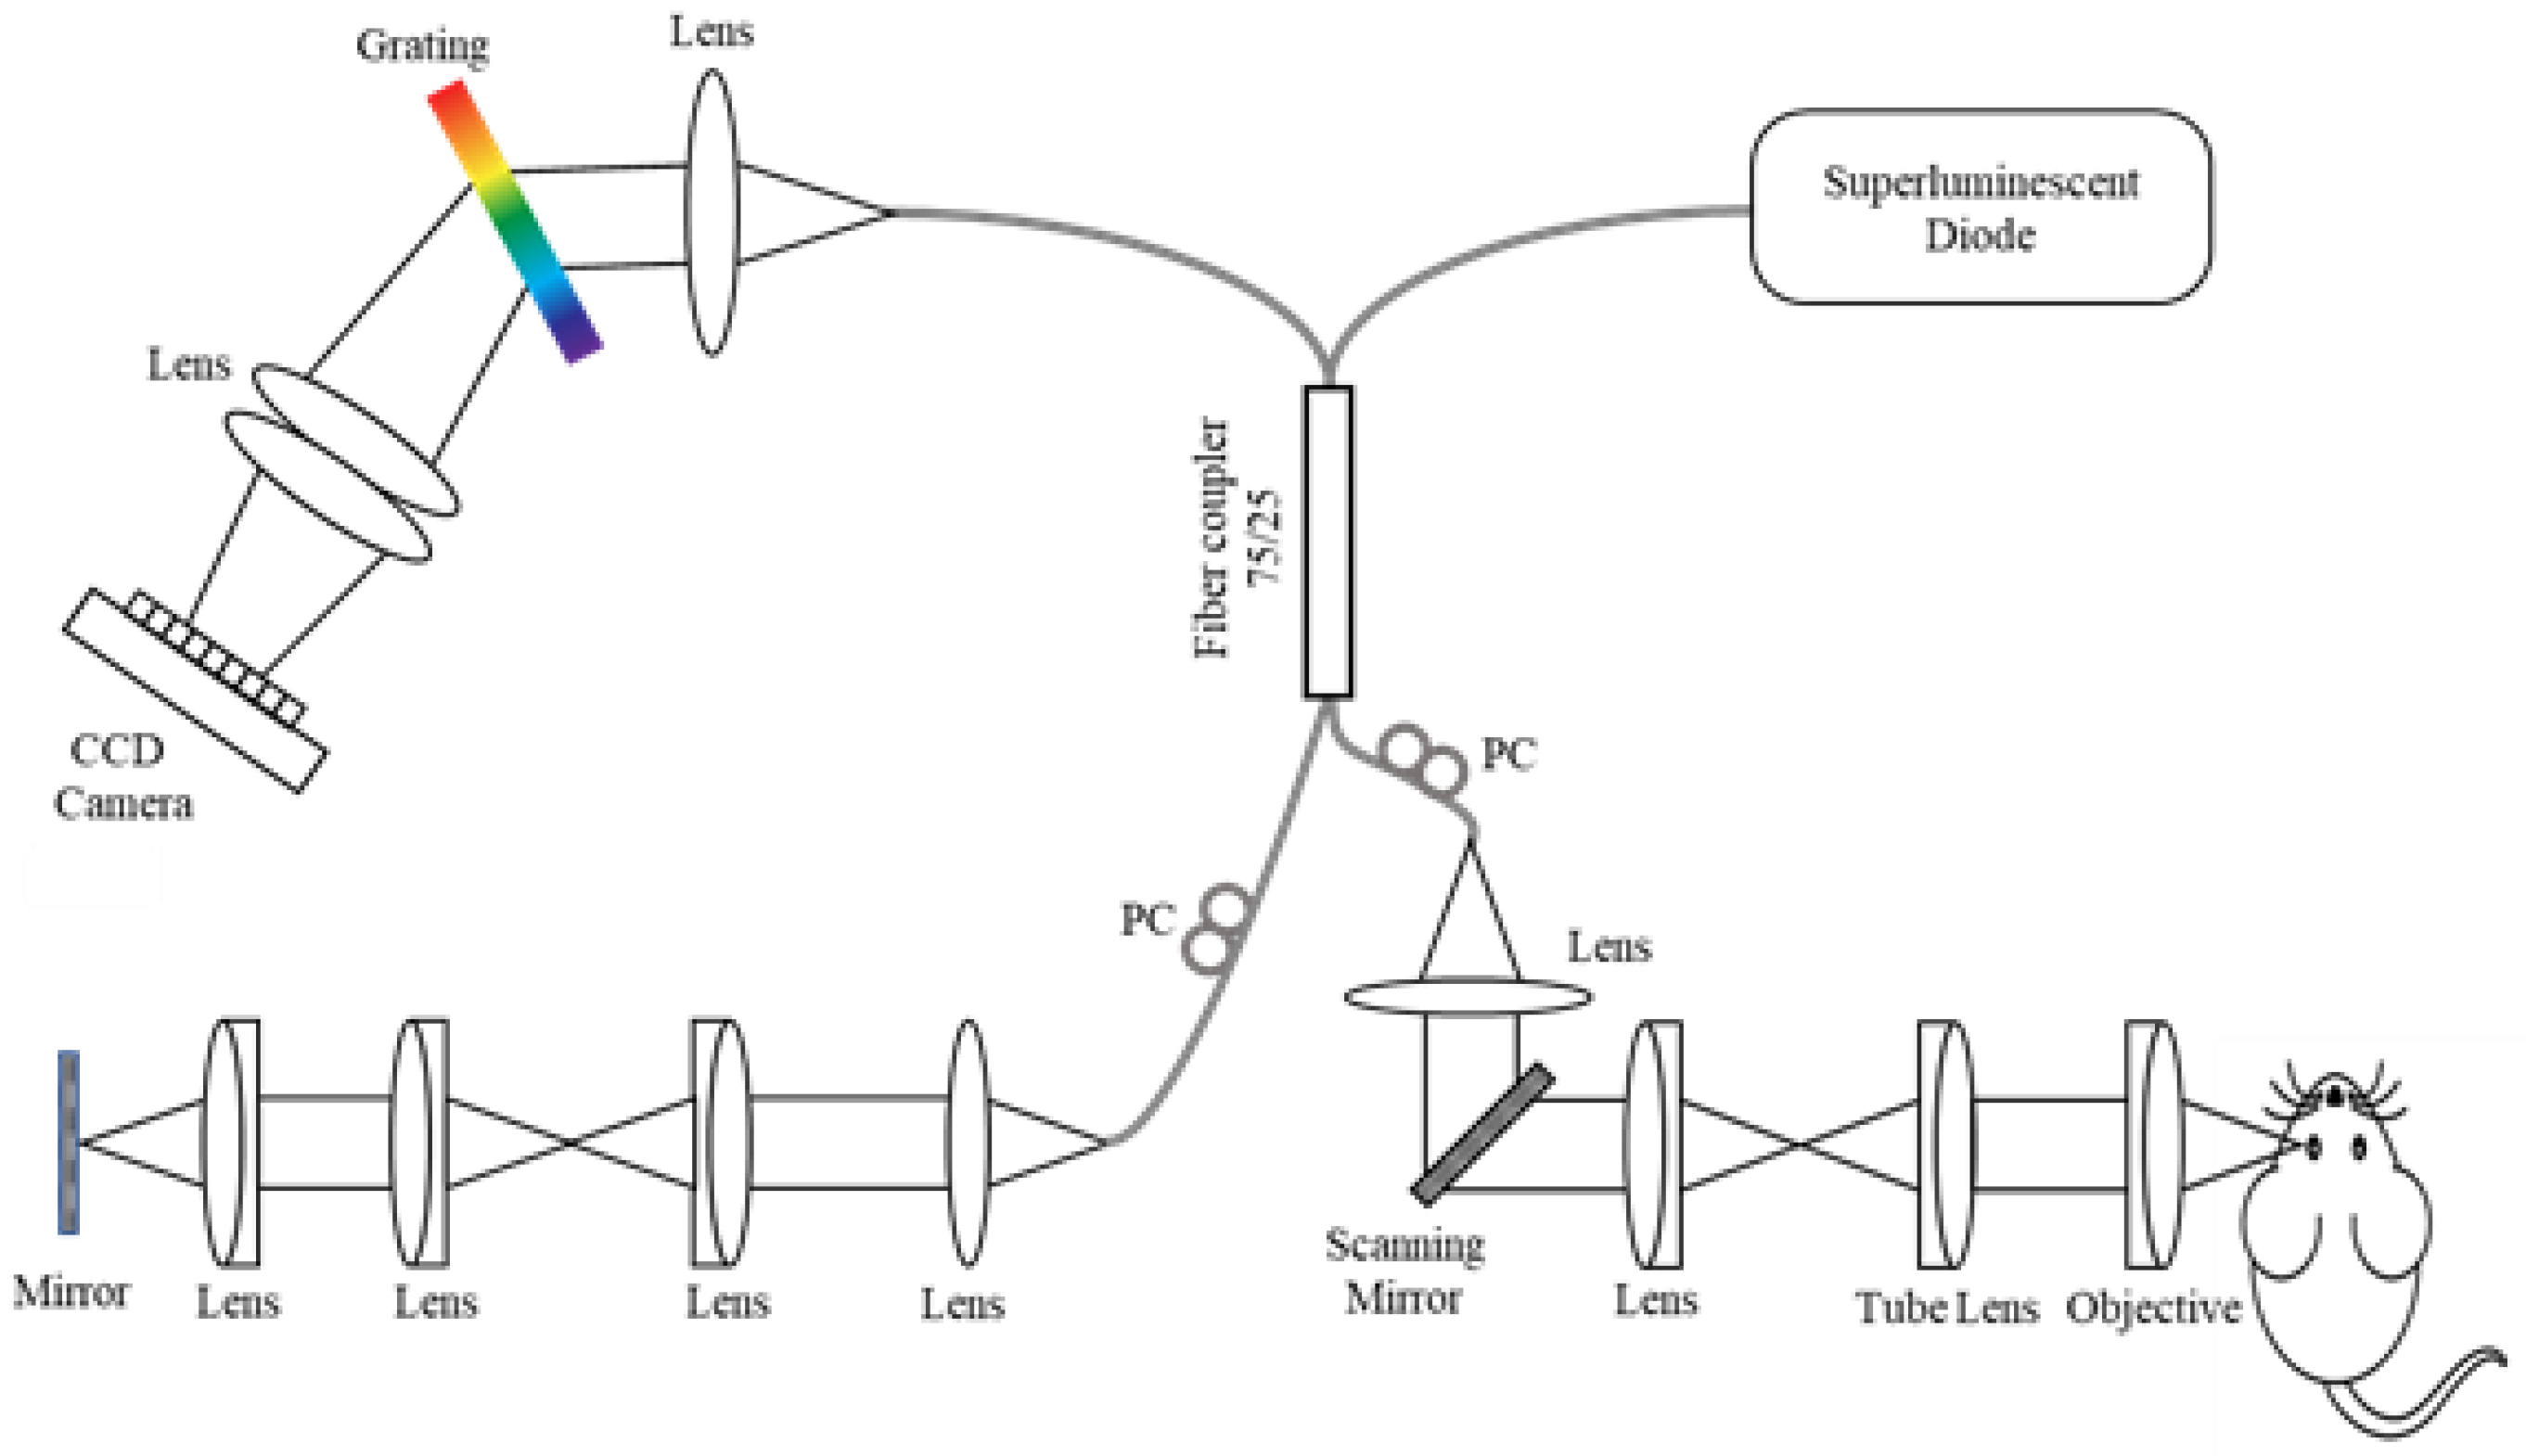
2.2. Imaging System Setup

Custom-designed OCT has been used for an in vivo imaging study of mouse retina [22,23]. Figure 1 shows the schematic diagram of the system used for this study. A broadband (M-T-850-HP-I, Superlum, Cork, Ireland, λ c e n t e r = 850   nm ,   Δ λ = 165   nm ) superluminescent diode (SLD) was used as the light source. A fiber coupler (TW850R5A2, Thorlabs, Newton, NJ, USA; 75:25) divided the OCT light to the sample and reference arms. A custom-designed spectrometer was constructed with a line CCD camera (OCTOPLUS, e2v, Chelmsford, UK; 2048 pixels) and a transmission grating (Wasatch Photonics, West Logan, UT, USA; 1200 line/mm). The axial and lateral resolution of the system was theoretically estimated at 1.4 and 3 μm, respectively. The pixel resolution is 1.2 μm in both axial and lateral dimensions.

2.3. Data Acquisition and Image Processing

For the retinal layer thickness measurement, 3D raster scan volume data were taken at the optic nerve head, nasal, dorsal, temporal, and ventral quadrants. For the retina layer thickness time-course change measurement, the B-scan in the center location of a dorsal quadrant was measured. For the measurement of the HRL thickness distribution, the retina was divided into 8 parts. In each part, the center B-scan was selected and segmented for the HRL thickness measurement. For the retinal inner-layer structure analysis, the dorsal quadrant was imaged with a field of view of 600   μ m × 600   μ m . Each OCT volume contained 500 B-scans, and each B-scan consisted of 500 A-scans. Two hundred repetitive 3D OCT volumes were collected with an A-scan rate of 80 kHz. The total recording time was 13.5 min.
For image processing, the standard OCT image reconstruction and post-processing procedures were applied. Briefly, the workflow was k-sampling, interferogram extraction, apodization, fast Fourier transform (FFT), and image registration. Thereafter, the retinal layer thickness was manually measured using MATLAB. For inner retinal structure analysis, frame registration was applied [21]. Briefly, each OCT volume was considered as a rigid cubic, four degrees of freedom were registered to adjust the direction and location of the OCT volumes. The procedure was as follows: first, the enface image of each OCT volume was produced to obtain an image stack, and then the stack was registered using a plugin function in ImageJ named MultiStackReg. During the registration, the transformation matrix was recorded. Second, the enface registration transformation matrix was applied to all the data sets in MATLAB. Third, an image stack with the center B-scans of each volume was extracted. The stack was then registered with MultiStackReg, and the transformation matrix was recorded. Fourth, the B-scan registration transformation matrix was applied to all the data sets as well. The 200 OCT volumes were averaged to get a clear OCT 3D image [19,21].

3. Results

Figure 2 shows longitudinal OCT monitoring of the developing retina, and the means and standard deviations of the layer thicknesses are summarized in Table 1. After eye opening, the retinal layer thickness kept changing until P28. Figure 2A shows the enface image of the dorsal quadrant, which indicates the location of the B-scans in Figure 2B. Figure 2B shows the representative B-scans used for layer thickness measurement. The red arrows indicate an HRL, which was unambiguously observed between P14 and P17 and gradually disappeared until P28. The green, purple, and orange two-headed arrows represent the thicknesses of the INL, outer nuclear layer (ONL), and external limiting membrane (ELM) to retinal pigment epithelium (RPE). Figure 2C shows the reflectance profiles of the B-scans in Figure 2B. The results show that the HRL was obvious before P17, but gradually disappeared after P21. ELM and ellipsoid zone (EZ) were very dim at P14, but the reflectivity gradually becomes stronger with aging. The interdigitation zone (IZ) (yellow arrows, Figure 2C) was not observed before P17 but gradually becomes distinguishable after P28. Figure 2D shows the distribution of the HRL thicknesses over the whole retina. The result shows that the HRL exists all over the retina at P14 to P21, with the center region slightly thicker than the peripheral region. Figure 2E shows the layer thickness changes with ages from P14 to P56. The inner retina layer thickness change is shown in Figure 2(E1). The NFL thickness decreased from P14 to P21 and then remained the same. The HRL thickness kept decreasing after eye opening and disappeared at about P28. The IPL thickness did not change significantly between P14 to P56 days. The INL thickness kept decreasing after eye opening until P28. Figure 2(E2) shows layer thickness change in the outer retina. The ONL thickness kept decreasing until P28. On the contrary, the ELM-RPE thickness kept increasing until P28. Figure 2(E3) shows the thickness change of the inner retina, outer retina, and the whole retina. The thickness of the inner retina and the whole retina kept decreasing until P28. On the contrary, the thickness of the outer retina slightly increased after eye opening.
Figure 3 shows a comparative volumetric analysis of the inner retina of a P17 mouse (Figure 3A) and a P56 mouse. After frame registration and super averaging, the detailed structure was disclosed. In the OCT B-scan of the P17 mouse (Figure 3(A1)), individual RGCs were observed in the HRL. The stratification of the IPL of the P17 mouse was not clear; however, it was clearer for the P56 mouse (Figure 3(A2,B2)). The nerve fibers of P17 and P56 were clearly observed (Figure 3(A3,B3)). The RGCs were observed in the enface images (Figure 3(A4,B4)). For the P17 mouse, the RGCs were located in the HRL; thus, the individual RGCs were clearly observed. For the P56 mouse, the RGCs were closely packed with the NFL and the IPL, and the contour of RGCs was not clear.

4. Discussion

In summary, longitudinal OCT of postnatal retinal development has been demonstrated in developing mouse eyes from P14 to P56. Quantitative OCT analysis revealed distinct outer and inner retinal layer changes, corresponding to eye development. An HRL between the NFL and the IPL was observed in developing eyes and gradually disappeared with aging. The fine structure development of inner retina layers was analyzed via frame registration and super averaging.
Three possible factors could contribute to the retinal thickness changes after eye opening. First, the eyeball diameter increases [24], causing a general thinning effect, affecting all the retinal layers. Second, cell death during retina development [25] also causes a thinning effect, affecting a few layers. Third, the retinal structure modification [26] causes a thinning or a thickening effect, affecting a few layers. The thickness change of an individual retinal layer can be the combination of all these three effects. As the eyeball expansion affects all retinal layers, the other two factors will be discussed in detail below.
The NFL thickness decreased from P14 to P21 and became stable after P21 (Figure 2(E1)). The change could be explained by the combination of eyeball expansion and retinal structure modification. The RGC population remains stable during development after eye opening; therefore, the total number of axons is stable [25,27]. However, right after eye opening, until 3 weeks postnatal, there is a maximum rate of nerve fiber growth and myelination [28]. It has been reported that, during this period, the number of myelinated nerve fibers as well as the nerve fiber diameter increased [29], which is considered to be dependent on environmental light stimulation [30]. The nerve fiber modification caused NFL thickness to increase.
The IPL thickness remained stable (Figure 2(E1)) from P14 to P56. This observation could be explained by the combination of eyeball expansion, cell death, and retinal structure modification. The IPL is composed of the dendrite and synapse connections between RGCs, bipolar cells, and amacrine cells. After eye opening, the population of bipolar cells keeps decreasing until P19, and the population of amacrine cells also slightly decreases [25]. The apoptosis of these cells causes the IPL thickness to decrease. However, during postnatal development, the dendritic field size of RGCs keeps increasing until 3 weeks after birth [5]. The density of both ribbons and conventional synapses in the IPL continuously increases after eye opening and reaches the peak level by around the age of P21 [7]. This dendritic refinement causes the IPL to thicken.
The INL thickness decreased after eye opening (Figure 2(E1)) until P28. The change could be explained by eyeball expansion and cell death. The INL is composed of nuclei of bipolar cells, horizontal cells, and amacrine cells. The layer thickness is only related to the population of the cells. After eye opening, the population of the horizontal cells remains stable, the population of amacrine cells shows a slight decrease, and the population of bipolar cells shows a decrease until P19 [25]. The apoptosis of bipolar cells and amacrine cells causes INL thinning.
Similar to the INL, the ONL thickness also decreases after eye opening (Figure 2(E2)) until P28. The change could be explained by eyeball expansion and cell death. The ONL is composed of the nuclei of retinal photoreceptors. The population of photoreceptors keeps decreasing until P24 [25], which could cause ONL thinning.
The ELM-RPE thickness increased after eye opening (Figure 2(E2)) until P28. The ELM to RPE layer is composed of the photoreceptor inner segment, outer segment, and RPE layers. The change could be explained by the combination of eyeball expansion, cell death, and photoreceptor inner and outer segment elongation. The population of photoreceptors keeps decreasing until P24, which could cause layer thinning. However, the photoreceptor inner segmentation and outer segmentation both expand significantly [26], which causes this layer to thicken.
To the best of our knowledge, the HRL between the NFL and the IPL in the OCT B-scans of mouse retina has not been reported before. For human OCT images, the hyporeflective layer between the NFL and the IPL is the ganglion cell layer (GCL). However, for mouse retina, most studies considered that the RGCs are buried in the NFL or the IPL. As the intensity of RGCs is much weaker than axons, dendrites, and synapses in the NFL and the IPL, they are hard to identify in the OCT image [21]. Therefore, for mouse retina segmentation, some people consider the RGCs are included in the NFL and call it the NFL–GCL complex [31,32,33,34]; some people consider the RGCs are included in the IPL and call it the GCL–IPL layer [35,36], while some people simply use NFL or GCL to denote the layer that is above the IPL [37,38]. From the enface image (Figure 3(A3,B3)) at the location of the HRL, we could see individual RGC somas. By comparing enface images of P17 and P56 mice, we can see that the RGCs of P17 were “cleaner” and the RGCs of P56 are co-located with nerve fibers and neuron dendrites and synapses. Considering the IPL and nerve fiber refinements after eye opening, we speculate that this hyporeflective band between the GCL and the IPL are the RGCs. The actual mechanism of the HRL vanishing is not well understood. We have two hypotheses. First, during the refinement of the IPL, the RGCs are well surrounded by the neuronal dendrites of bipolar cells, amacrine cells, and RGCs, and thus reduce the difference of light properties in neighboring regions. The other hypothesis is that, during the refinement of the nerve fiber, the RGCs are well packed into the NFL layer, and thus reduce the difference of light properties in neighboring regions. Either way, the HRL of RGCs will vanish because of being buried in other hyperreflective tissues. An immunofluorescent study could help to test these hypotheses. This immunofluorescent study will not only help to explain the vanishing of the HRL, but also help to identify the correlation between the retinal OCT image and the anatomic correlate.
The observation of the morphological changes of retinal inner layers, such as the NFL and the IPL, during retinal postnatal development, is consistent with the observation of the IPL modification after eye opening [7], RGC dendritic refinement [4,5,6], and nerve fiber growth [29]. The fine structure is hard to observe with OCT. However, with super averaging processing after frame registration, the nerve fibers, individual RGCs, and stratification of the IPL could be observed [19,20,21]. In a previous study, the whole frame registration was all executed by ImageJ. A few hours are needed to finish the frame registration of 150 OCT volumes which contain 512 A-scans times 512 B-scans in each volume. In our approach, the registration information is computed by ImageJ; however, the volume image data transformation is executed by MATLAB. Due to the good 3D matrix computation performance capability and parallel computing, the total time cost for frame registration was within 30 min for 200 OCT volumes. Each OCT volume consisted of 500 B-scans, and each B-scan included 500 A-scans.
There are several similarities and differences between the observations of mouse and human retinal postnatal development by OCT [39]. Photoreceptor development can be observed both in the human and mouse retina [40]. Similar to the mouse retina, photoreceptor elongation is overserved during human retinal postnatal development, which causes the photoreceptor layer to thicken. This elongation process occurs rapidly after 38 weeks postmenstrual age (PMA). Some sub-photoreceptor layers, such as the ELM, EZ, and IZ, cannot be observed at an early PMA but become clear and distinguishable with maturation. An obvious difference between human and mouse retinas is that, during the postnatal development, the inner retinal cells migrate centrifugally, which develops a mature fovea pit [40,41].

5. Conclusions

In vivo OCT provides a feasible solution for longitudinal monitoring of postnatal retinal development. Quantitative OCT analysis revealed distinct outer and inner retinal layer changes, corresponding to eye development. At the outer retina, the ELM and EZ band intensities gradually increased with aging, and the IZ band was detectable by P28. At the inner retina, an HRL between the NFL and IPL was observed in developing eyes and gradually disappeared with aging. Super averaging image analysis revealed individual RGCs within the HRL layer in the young mouse retina. On the contrary, in the aged retina, RGCs were merged with the NFL and IPL, resulting in the HRL layer gradually disappearing. Moreover, the sub-IPL structure gradually enhanced with aging.

Author Contributions

Conceptualization, G.M. and X.Y.; Data curation, G.M. and J.D.; Funding acquisition, X.Y.; Supervision, X.Y.; Visualization, G.M.; Writing—Original draft, G.M.; Writing—review and editing, T.-H.K. and X.Y. All authors have read and agreed to the published version of the manuscript.

Funding

National Eye Institute: P30 EY001792, R01 EY030101, R01 EY023522, R01EY029673, R01 EY030842, R44 EY028786; Richard and Loan Hill endowment; unrestricted grant from Research to Prevent Blindness; Chicago Biomedical Consortium with support from the Searle Funds at the Chicago Community Trust.

Institutional Review Board Statement

Not applicable.

Informed Consent Statement

Not applicable.

Data Availability Statement

Data underlying the results presented in this paper are not publicly available at this time but may be obtained from the authors upon reasonable request.

Conflicts of Interest

The authors declare no conflict of interest.

References

  1. Morgan, J.; Wong, R. Development of cell types and synaptic connections in the retina. In Webvision: The Organization of the Retina Visual System; University of Utah Health Sciences Center: Salt Lake City, UT, USA, 2007. [Google Scholar]
  2. Chan, Y.-C.; Chiao, C.-C. Effect of visual experience on the maturation of ON–OFF direction selective ganglion cells in the rabbit retina. Vis. Res. 2008, 48, 2466–2475. [Google Scholar] [CrossRef] [PubMed] [Green Version]
  3. Tian, N.; Copenhagen, D.R. Visual stimulation is required for refinement of ON and OFF pathways in postnatal retina. Neuron 2003, 39, 85–96. [Google Scholar] [CrossRef] [Green Version]
  4. Tian, N. Development of retinal ganglion cell dendritic structure and synaptic connections. In Webvision: The Organization of the Retina Visual System; University of Utah Health Sciences Center: Salt Lake City, UT, USA, 2012. [Google Scholar]
  5. Coombs, J.L.; Van Der List, D.; Chalupa, L.M. Morphological properties of mouse retinal ganglion cells during postnatal development. J. Comp. Neurol. 2007, 503, 803–814. [Google Scholar] [CrossRef] [PubMed]
  6. Tian, N. Visual experience and maturation of retinal synaptic pathways. Vis. Res. 2004, 44, 3307–3316. [Google Scholar] [CrossRef] [Green Version]
  7. Fisher, L.J. Development of synaptic arrays in the inner plexiform layer of neonatal mouse retina. J. Comp. Neurol. 1979, 187, 359–372. [Google Scholar] [CrossRef]
  8. Koehler, C.L.; Akimov, N.P.; Rentería, R.C. Receptive field center size decreases and firing properties mature in ON and OFF retinal ganglion cells after eye opening in the mouse. J. Neurophysiol. 2011, 106, 895–904. [Google Scholar] [CrossRef] [Green Version]
  9. Drexler, W.; Fujimoto, J.G. Optical Coherence Tomography: Technology and Applications; Springer Science & Business Media: Berlin/Heidelberg, Germany, 2008. [Google Scholar]
  10. Hariri, S.; Moayed, A.A.; Choh, V.; Bizheva, K. In vivo assessment of thickness and reflectivity in a rat outer retinal degeneration model with ultrahigh resolution optical coherence tomography. Investig. Ophthalmol. Vis. Sci. 2012, 53, 1982–1989. [Google Scholar] [CrossRef]
  11. Nivison-Smith, L.; Wang, H.; Assaad, N.; Kalloniatis, M. Retinal Thickness Changes throughout the Natural History of Drusen in Age-related Macular Degeneration. Optom. Vis. Sci. 2018, 95, 648–655. [Google Scholar] [CrossRef]
  12. Kim, T.-H.; Son, T.; Klatt, D.; Yao, X. Concurrent OCT and OCT angiography of retinal neurovascular degeneration in the 5XFAD Alzheimer’s disease mice. Neurophotonics 2021, 8, 035002. [Google Scholar] [CrossRef]
  13. Chauhan, B.C.; Stevens, K.T.; Levesque, J.M.; Nuschke, A.C.; Sharpe, G.P.; O’Leary, N.; Archibald, M.L.; Wang, X. Longitudinal in vivo imaging of retinal ganglion cells and retinal thickness changes following optic nerve injury in mice. PLoS ONE 2012, 7, e40352. [Google Scholar]
  14. Zeimer, R.; Asrani, S.; Zou, S.; Quigley, H.; Jampel, H. Quantitative detection of glaucomatous damage at the posterior pole by retinal thickness mapping: A pilot study. Ophthalmology 1998, 105, 224–231. [Google Scholar] [CrossRef]
  15. Maldonado, R.S.; O’Connell, R.V.; Sarin, N.; Freedman, S.F.; Wallace, D.K.; Cotten, C.M.; Winter, K.P.; Stinnett, S.; Chiu, S.J.; Izatt, J.A. Dynamics of human foveal development after premature birth. Ophthalmology 2011, 118, 2315–2325. [Google Scholar] [CrossRef] [PubMed] [Green Version]
  16. Kim, T.H.; Son, T.; Yao, X. Feature article: Functional OCT angiography reveals early physiological dysfunction of hyaloid vasculature in developing mouse eye. Exp. Biol. Med. 2019, 244, 819–823. [Google Scholar] [CrossRef] [PubMed]
  17. Kim, T.H.; Son, T.; Le, D.; Yao, X. Longitudinal OCT and OCTA monitoring reveals accelerated regression of hyaloid vessels in retinal degeneration 10 (rd10) mice. Sci. Rep. 2019, 9, 16685. [Google Scholar] [CrossRef]
  18. Kim, T.H.; Son, T.; Lu, Y.; Alam, M.; Yao, X. Comparative Optical Coherence Tomography Angiography of Wild-Type and rd10 Mouse Retinas. Transl. Vis. Sci. Technol. 2018, 7, 42. [Google Scholar] [CrossRef] [Green Version]
  19. Pi, S.; Hormel, T.T.; Wei, X.; Cepurna, W.; Morrison, J.C.; Jia, Y. Imaging retinal structures at cellular-level resolution by visible-light optical coherence tomography. Optics Lett. 2020, 45, 2107–2110. [Google Scholar] [CrossRef]
  20. Liu, Z.; Kurokawa, K.; Zhang, F.; Lee, J.J.; Miller, D.T. Imaging and quantifying ganglion cells and other transparent neurons in the living human retina. Proc. Natl. Acad. Sci. USA 2017, 114, 12803–12808. [Google Scholar] [CrossRef] [Green Version]
  21. Zhang, P.; Miller, E.B.; Manna, S.K.; Meleppat, R.K.; Pugh, E.N.; Zawadzki, R. Temporal speckle-averaging of optical coherence tomography volumes for in-vivo cellular resolution neuronal and vascular retinal imaging. Neurophotonics 2019, 6, 041105. [Google Scholar] [CrossRef]
  22. Ma, G.; Son, T.; Kim, T.H.; Yao, X. In vivo optoretinography of phototransduction activation and energy metabolism in retinal photoreceptors. J. Biophotonics 2021, 14, e202000462. [Google Scholar] [CrossRef]
  23. Son, T.; Alam, M.; Toslak, D.; Wang, B.; Lu, Y.; Yao, X. Functional optical coherence tomography of neurovascular coupling interactions in the retina. J. Biophotonics 2018, 11, e201800089. [Google Scholar] [CrossRef]
  24. Tkatchenko, T.V.; Shen, Y.; Tkatchenko, A.V. Analysis of postnatal eye development in the mouse with high-resolution small animal magnetic resonance imaging. Investig. Ophthalmol. Vis. Sci. 2010, 51, 21–27. [Google Scholar] [CrossRef] [PubMed] [Green Version]
  25. Young, R.W. Cell death during differentiation of the retina in the mouse. J. Comp. Neurol. 1984, 229, 362–373. [Google Scholar] [CrossRef] [PubMed]
  26. Caley, D.W.; Johnson, C.; Liebelt, R.A. The postnatal development of the retina in the normal and rodless CBA mouse: A light and electron microscopic study. Am. J. Anat. 1972, 133, 179–211. [Google Scholar] [CrossRef] [PubMed]
  27. Farah, M.H.; Easter, S.S., Jr. Cell birth and death in the mouse retinal ganglion cell layer. J. Comp. Neurol. 2005, 489, 120–134. [Google Scholar] [CrossRef] [PubMed] [Green Version]
  28. Dangata, Y.; Findlater, G.; Kaufman, M. Postnatal development of the optic nerve in (C57BL × CBA) F1 hybrid mice: General changes in morphometric parameters. J. Anat. 1996, 189, 117. [Google Scholar] [PubMed]
  29. Gyllensten, L.; Malmfors, T.R. Myelinization of the optic nerve and its dependence on visual function—A quantitative investigation in mice. Embryol. Exp. Morphol. 1963, 255–266. [Google Scholar] [CrossRef]
  30. Gyllensten, L.; Malmfors, T.; Norrlin-Grettve, M.L. Developmental and functional alterations in the fiber composition of the optic nerve in visually deprived mice. J. Comp. Neurol. 1966, 128, 413–418. [Google Scholar] [CrossRef]
  31. Antony, B.J.; Jeong, W.; Abramoff, M.D.; Vance, J.; Sohn, E.H.; Garvin, M.K. Automated 3D segmentation of intraretinal surfaces in SD-OCT volumes in normal and diabetic mice. Transl. Vis. Sci. Technol. 2014, 3, 8. [Google Scholar] [CrossRef] [Green Version]
  32. Ruggeri, M.; Wehbe, H.; Jiao, S.; Gregori, G.; Jockovich, M.E.; Hackam, A.; Duan, Y.; Puliafito, C.A. In vivo three-dimensional high-resolution imaging of rodent retina with spectral-domain optical coherence tomography. Investig. Ophthalmol. Vis. Sci. 2007, 48, 1808–1814. [Google Scholar] [CrossRef]
  33. Zhang, P.; Zam, A.; Jian, Y.; Wang, X.; Li, Y.; Lam, K.S.; Burns, M.E.; Sarunic, M.V.; Pugh, E.N., Jr.; Zawadzki, R.J. In vivo wide-field multispectral scanning laser ophthalmoscopy–optical coherence tomography mouse retinal imager: Longitudinal imaging of ganglion cells, microglia, and Müller glia, and mapping of the mouse retinal and choroidal vasculature. J. Biomed. Opt. 2015, 20, 126005. [Google Scholar] [CrossRef] [Green Version]
  34. Harper, D.J.; Augustin, M.; Lichtenegger, A.; Gesperger, J.; Himmel, T.; Muck, M.; Merkle, C.W.; Eugui, P.; Kummer, S.; Woehrer, A. Retinal analysis of a mouse model of Alzheimer’s disease with multicontrast optical coherence tomography. Neurophotonics 2020, 7, 015006. [Google Scholar] [CrossRef] [PubMed]
  35. Dysli, C.; Enzmann, V.; Sznitman, R.; Zinkernagel, M.S. Quantitative analysis of mouse retinal layers using automated segmentation of spectral domain optical coherence tomography images. Transl. Vis. Sci. Technol. 2015, 4, 9. [Google Scholar] [CrossRef] [PubMed] [Green Version]
  36. Srinivasan, P.P.; Heflin, S.J.; Izatt, J.A.; Arshavsky, V.Y.; Farsiu, S. Automatic segmentation of up to ten layer boundaries in SD-OCT images of the mouse retina with and without missing layers due to pathology. Biomed. Opt. Express 2014, 5, 348–365. [Google Scholar] [CrossRef] [PubMed] [Green Version]
  37. Pennesi, M.E.; Michaels, K.V.; Magee, S.S.; Maricle, A.; Davin, S.P.; Garg, A.K.; Gale, M.J.; Tu, D.C.; Wen, Y.; Erker, L.R. Long-term characterization of retinal degeneration in rd1 and rd10 mice using spectral domain optical coherence tomography. Investig. Ophthalmol. Vis. Sci. 2012, 53, 4644–4656. [Google Scholar] [CrossRef] [PubMed] [Green Version]
  38. Hanna, J.; Yücel, Y.H.; Zhou, X.; Mathieu, E.; Paczka-Giorgi, L.A.; Gupta, N. Progressive loss of retinal blood vessels in a live model of retinitis pigmentosa. Can. J. Ophthalmol. 2018, 53, 391–401. [Google Scholar] [CrossRef] [PubMed] [Green Version]
  39. Vinekar, A.; Mangalesh, S.; Jayadev, C.; Maldonado, R.S.; Bauer, N.; Toth, C.A. Retinal imaging of infants on spectral domain optical coherence tomography. BioMed Res. Int. 2015, 2015, 782420. [Google Scholar] [CrossRef] [Green Version]
  40. Vajzovic, L.; Hendrickson, A.E.; O’Connell, R.V.; Clark, L.A.; Tran-Viet, D.; Possin, D.; Chiu, S.J.; Farsiu, S.; Toth, C.A. Maturation of the human fovea: Correlation of spectral-domain optical coherence tomography findings with histology. Am. J. Ophthalmol. 2012, 154, 779–789. e772. [Google Scholar] [CrossRef] [Green Version]
  41. Vajzovic, L.; Rothman, A.L.; Tran-Viet, D.; Cabrera, M.T.; Freedman, S.F.; Toth, C.A. Delay in retinal photoreceptor development in very preterm compared to term infants. Investig. Ophthalmol. Vis. Sci. 2015, 56, 908–913. [Google Scholar] [CrossRef]
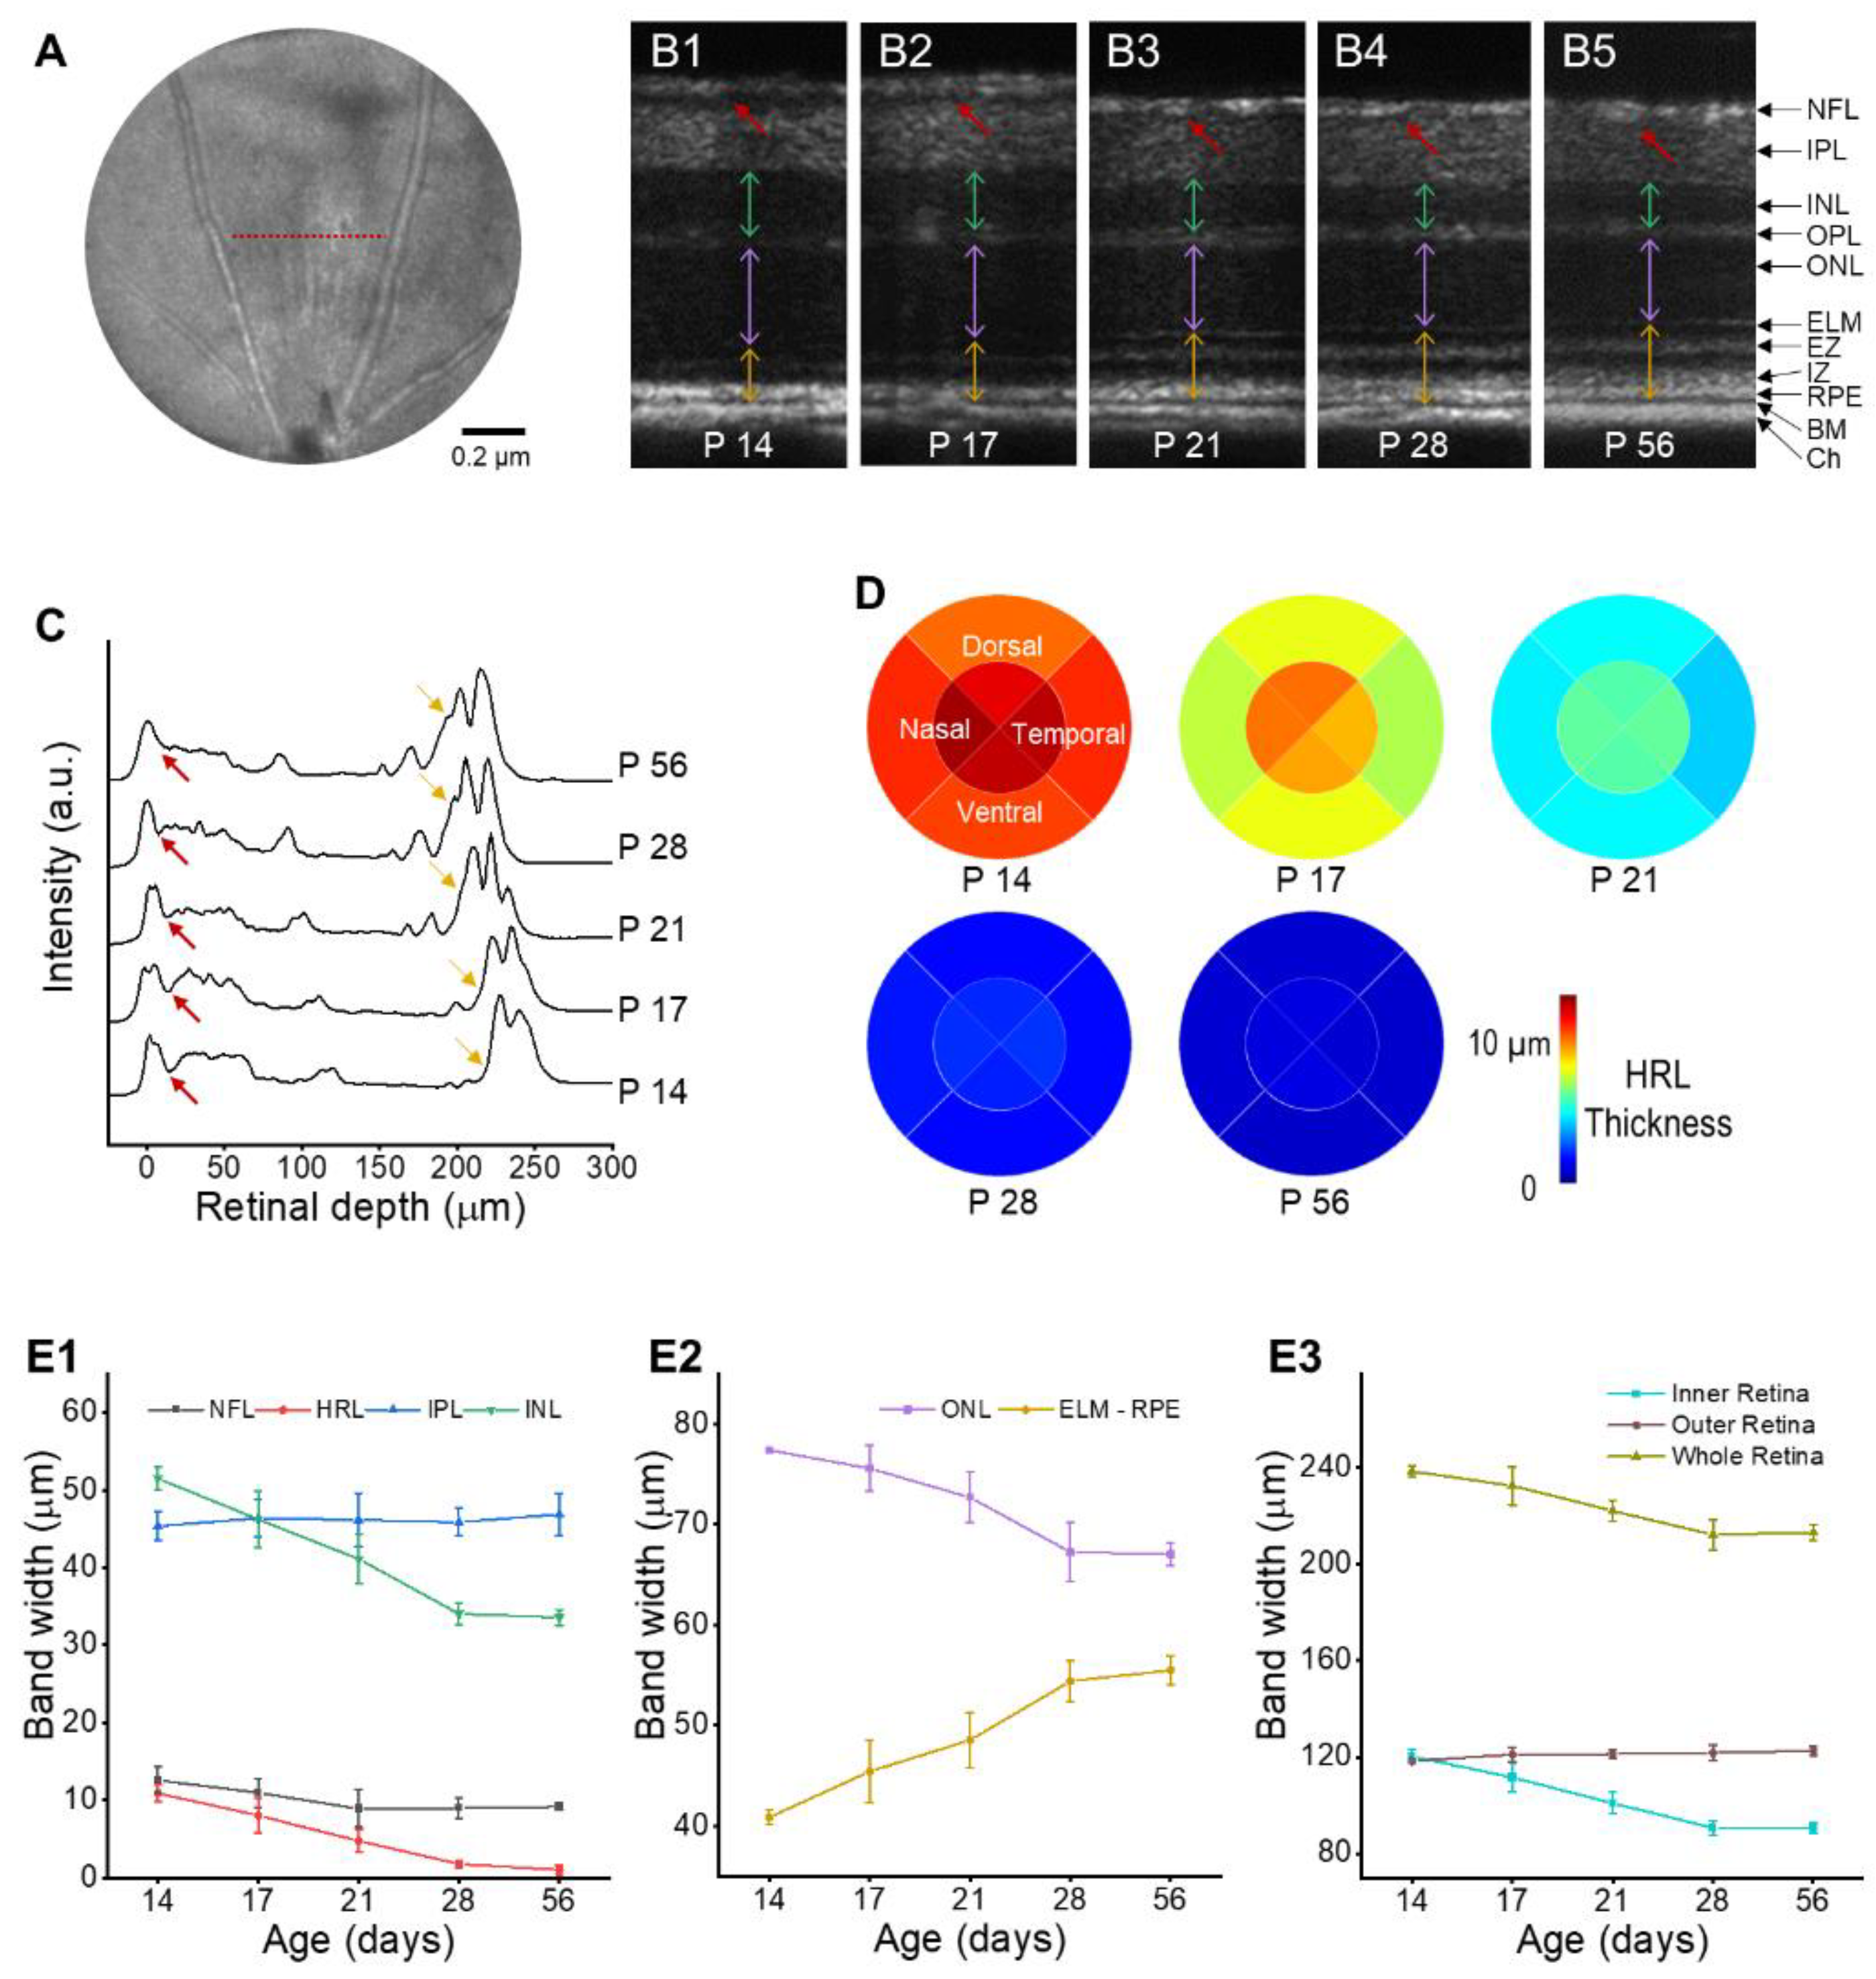
Figure 1. Schematic diagram of the custom-designed optical coherence tomography (OCT). PC, polarization controller.
Applsci 12 01860 g001
Figure 2. Longitudinal OCT monitoring of developing retina. (A) Representative enface image of the dorsal quadrant of the mouse retina. The red line indicates the location for B-scan analysis. (B) Representative OCT B-scans of mouse retina from P14 to P56. The red arrows indicate the location of a hyporeflective layer (HRL). The green, purple, and yellow two-headed arrows indicate the thickness of INL, ONL, and ELM to RPE layers. (C) Line profiles of the image B-scans in B. The red arrows indicate the location of HRL, and the yellow arrows indicate the location of IZ. (D) The thickness distribution of HRL over time. The radius of the retinal area is 1 mm. (E) Layer thickness changes of inner retina layers (E1), outer retinal layers (E2), whole retina (E3). NFL, nerve fiber layer; HRL, hyporeflective layer; IPL, inner plexiform layer; INL, inner nuclear layer; ONL, outer nuclear layer; ELM, external limiting membrane; EZ, ellipsoid zone; IZ, interdigitation zone; RPE, retinal pigment epithelium; BM, Bruce membrane; Ch, choroid. In (D), each group was composed of 5–6 mice, and the error bars indicate the standard deviation.
Applsci 12 01860 g002
Figure 3. Comparative 3-D OCT volumetric analysis of P17 (A) and P56 (B) mouse retinas. (A1,B1) Representative B-scans. The purple arrows in A1 indicate individual RGCs. (A2,B2) The enlarged view of the purple dash square in A1 and B1. The orange arrows in B2 indicate the stratification of IPL. ((A3A5) and (B3B5)) are the enface images of NFL, GCL, and IPL, which correspond to the location of the blue, green, and orange arrows in A1 and B1. The red arrows in A4 and B4 indicate the individual RGCs.
Applsci 12 01860 g003
Table 1. Quantitative thickness analysis of individual retinal layer changes with aging.
AgeNFL
(μm)
HRL
(μm)
IPL
(μm)
INL
(μm)
ONL
(μm)
ELM-RPE (μm)Inner Retina (μm)Outer Retina (μm)Whole Retina (μm)
P1412.6 ± 1.710.9 ± 1.145.3 ± 1.951.5 ± 1.577.4 ± 0.340.9 ± 0.7120.3 ± 2.5118.3 ± 0.9238.5 ± 2.3
P1710.9 ± 1.88 ± 2.346.4 ± 2.446.2 ± 3.675.6 ± 2.245.4 ± 3.1111.5 ± 6.2121 ± 3232.5 ± 8
P218.9 ± 2.44.7 ± 1.546.1 ± 3.541.1 ± 3.272.7 ± 2.548.6 ± 2.7100.9 ± 4.4121.3 ± 1.9222.1 ± 4.4
P288.9 ± 1.31.7 ± 0.545.9 ± 1.834 ± 1.467.3 ± 2.954.4 ± 290.6 ± 3.1121.7 ± 3.2212.3 ± 6.2
P569.1 ± 0.51 ± 0.646.9 ± 2.733.6 ± 167 ± 1.155.5 ± 1.490.5 ± 2.2122.6 ± 1.9213.1 ± 3.2
Publisher’s Note: MDPI stays neutral with regard to jurisdictional claims in published maps and institutional affiliations.

