
Laboratory Test Campaign Aimed at the Analysis of an Uncommon Wear Phenomenon in a Marble Quarry

 ,
,  ,
,  ,
, 
Abstract
:Featured Application
Abstract
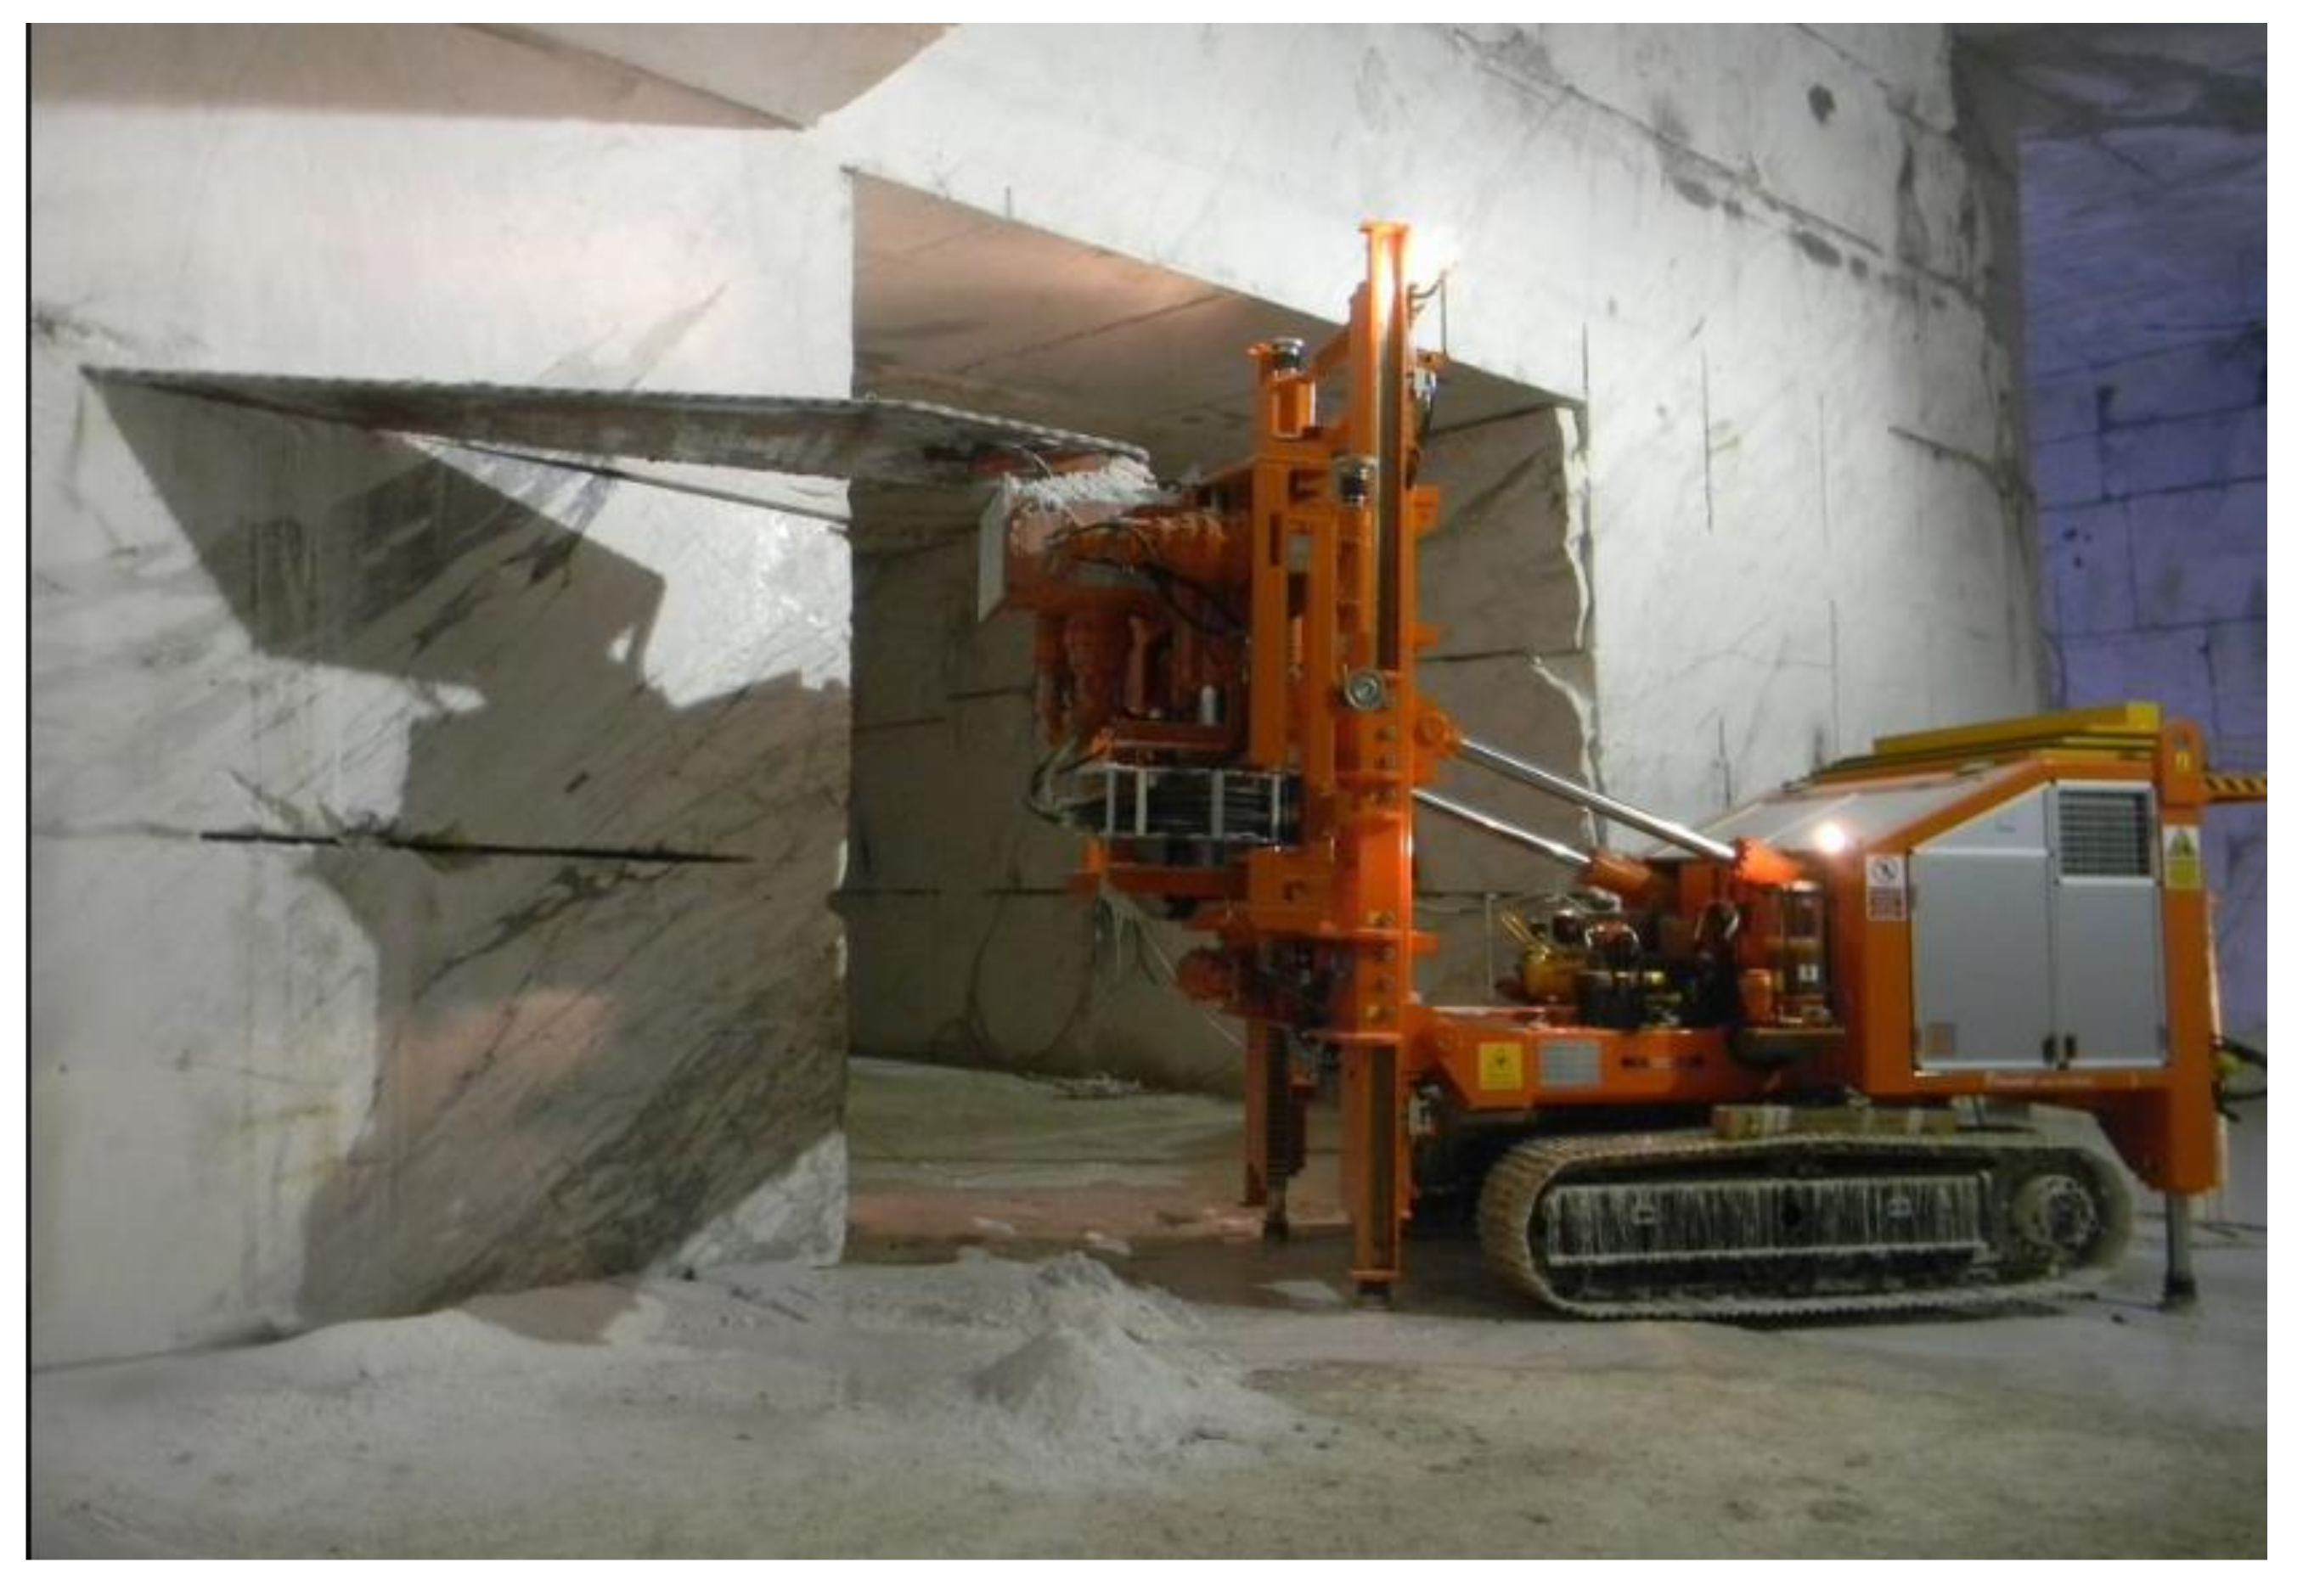
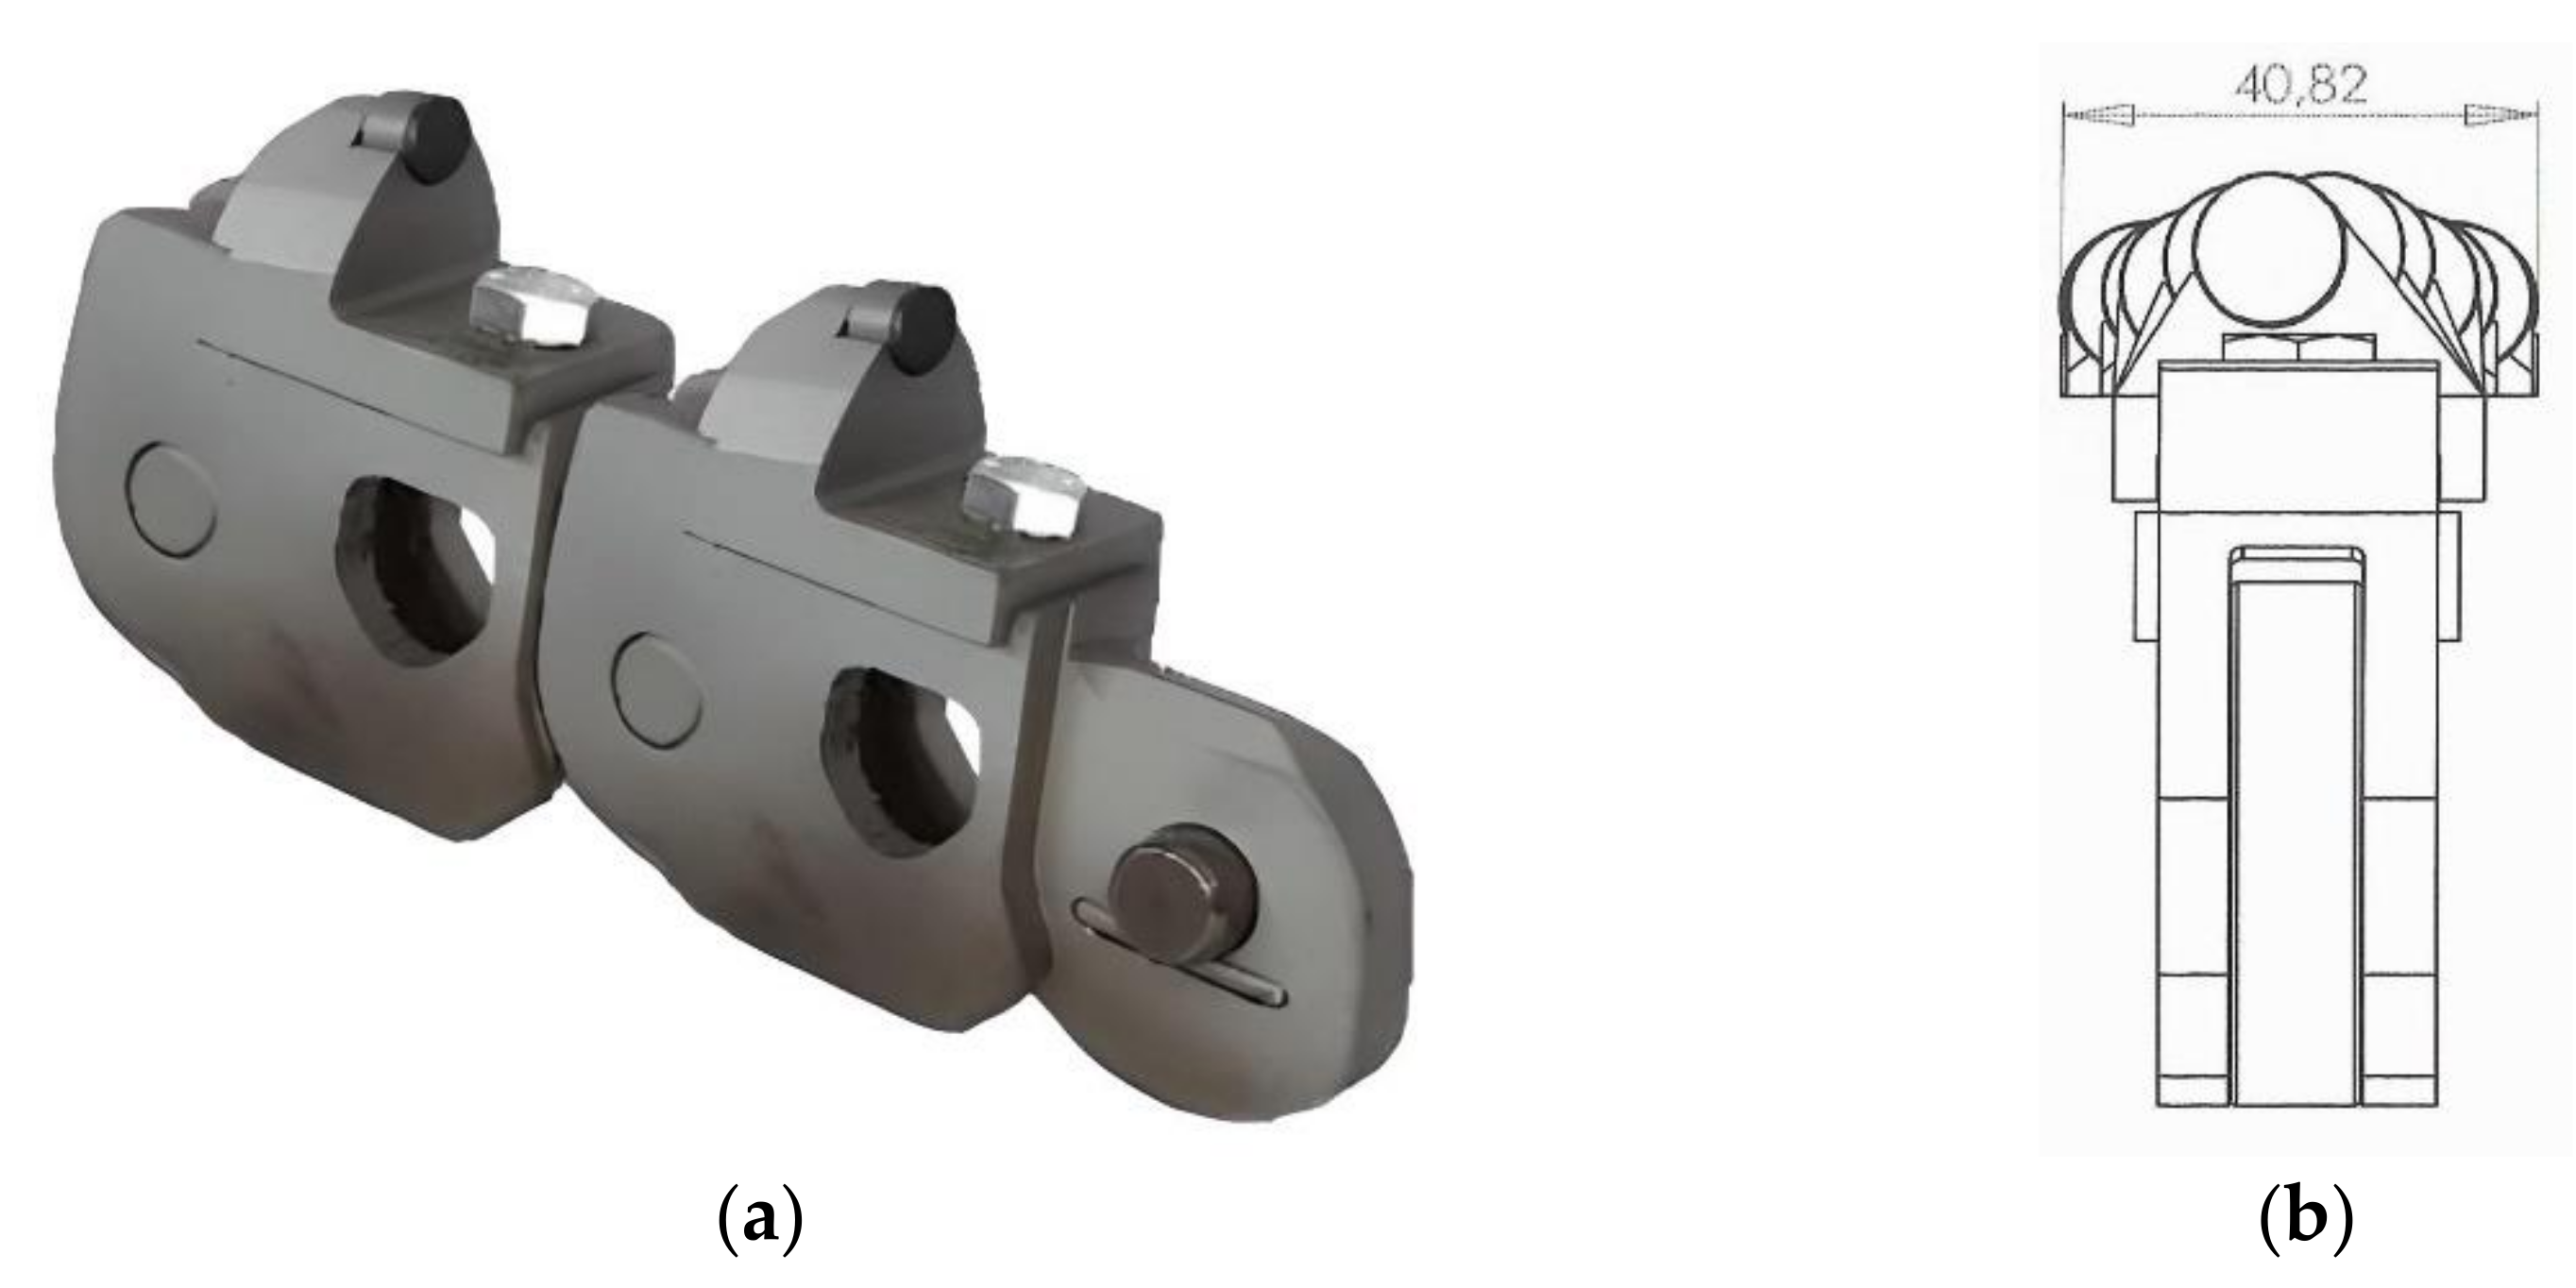
1. Introduction
2. Laboratory Tests and Results
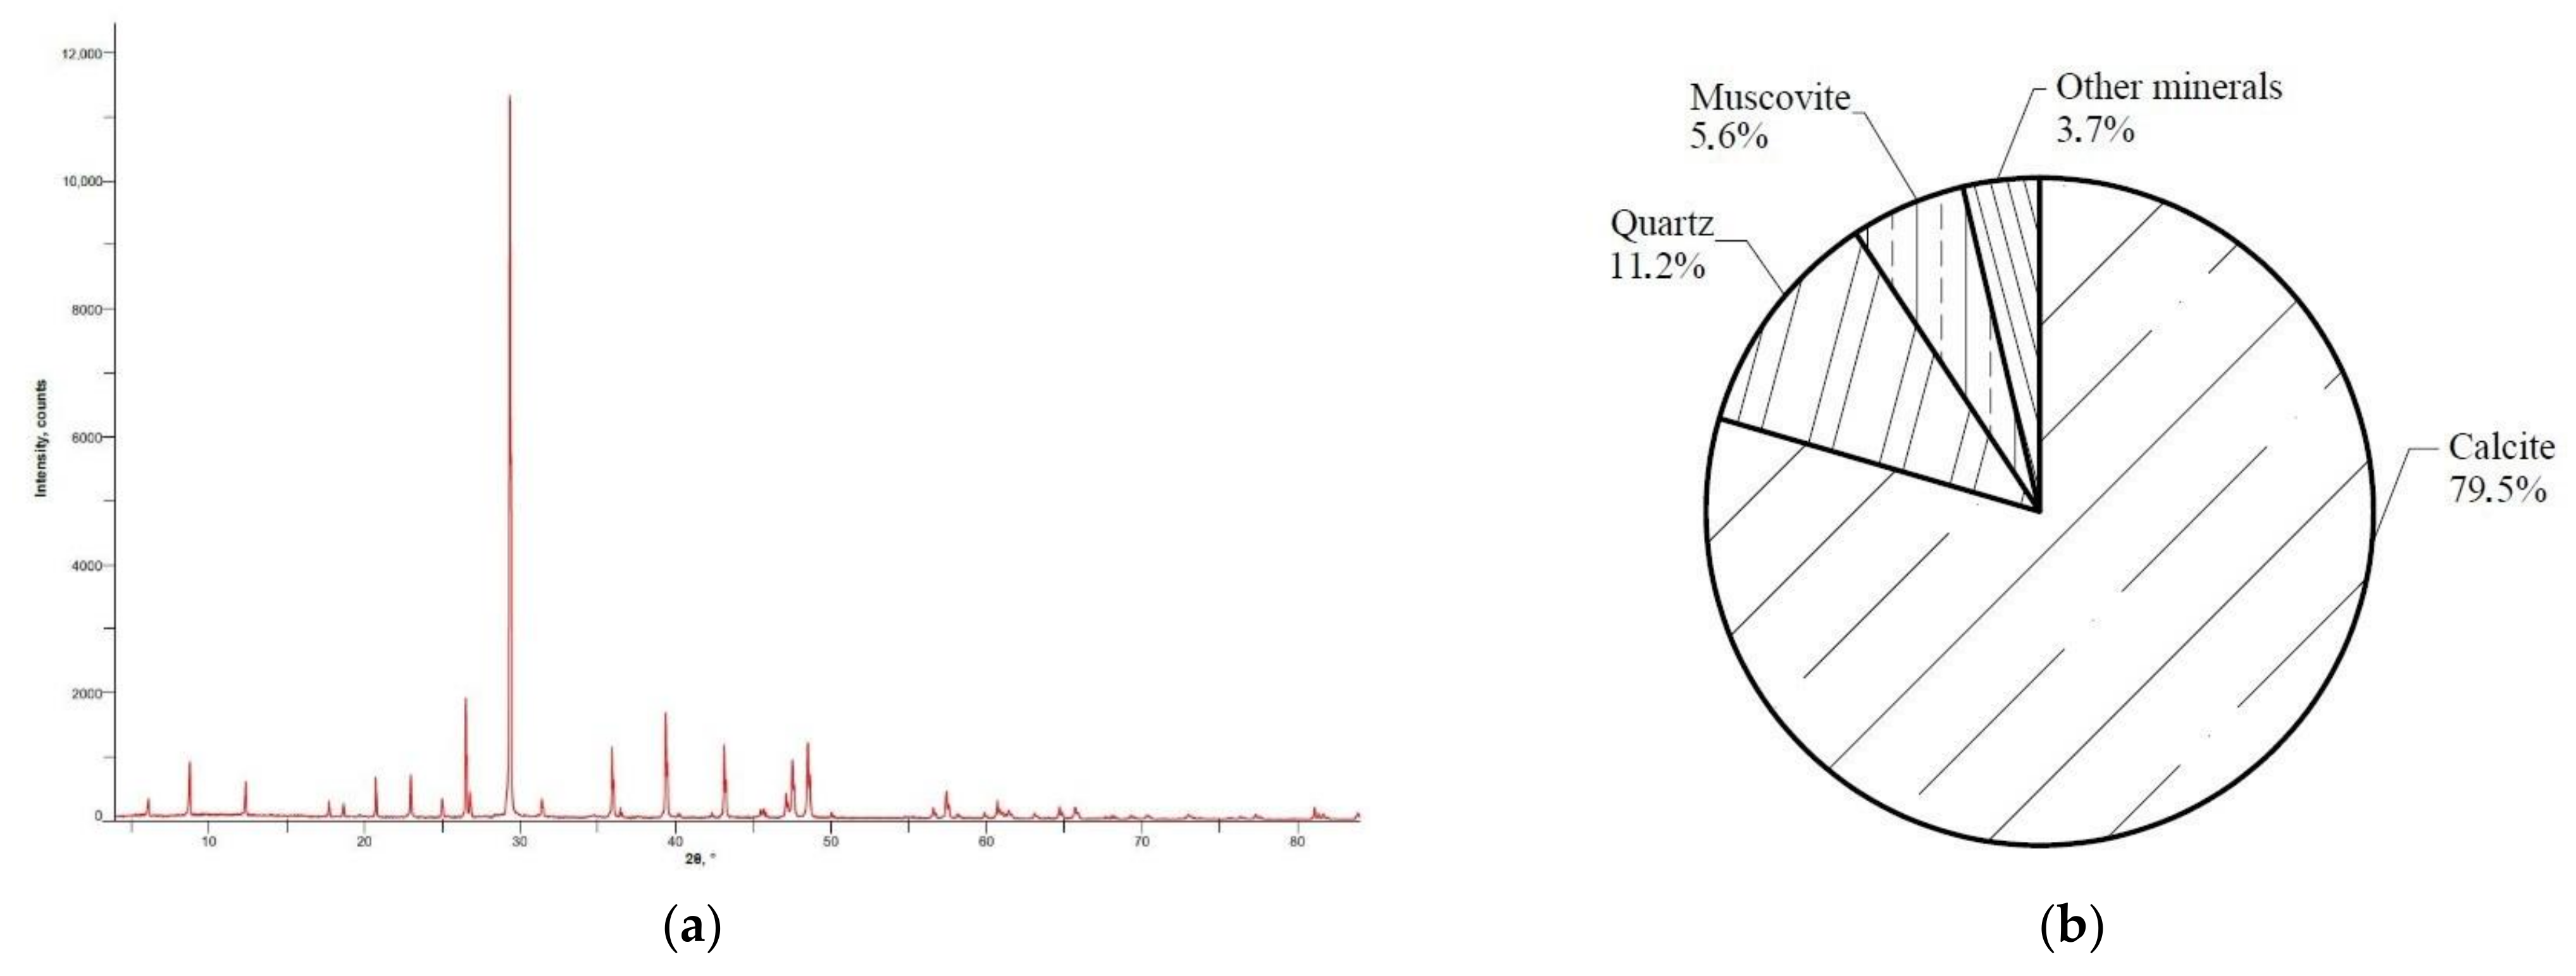
2.1. XRD—X-ray Diffraction Analysis
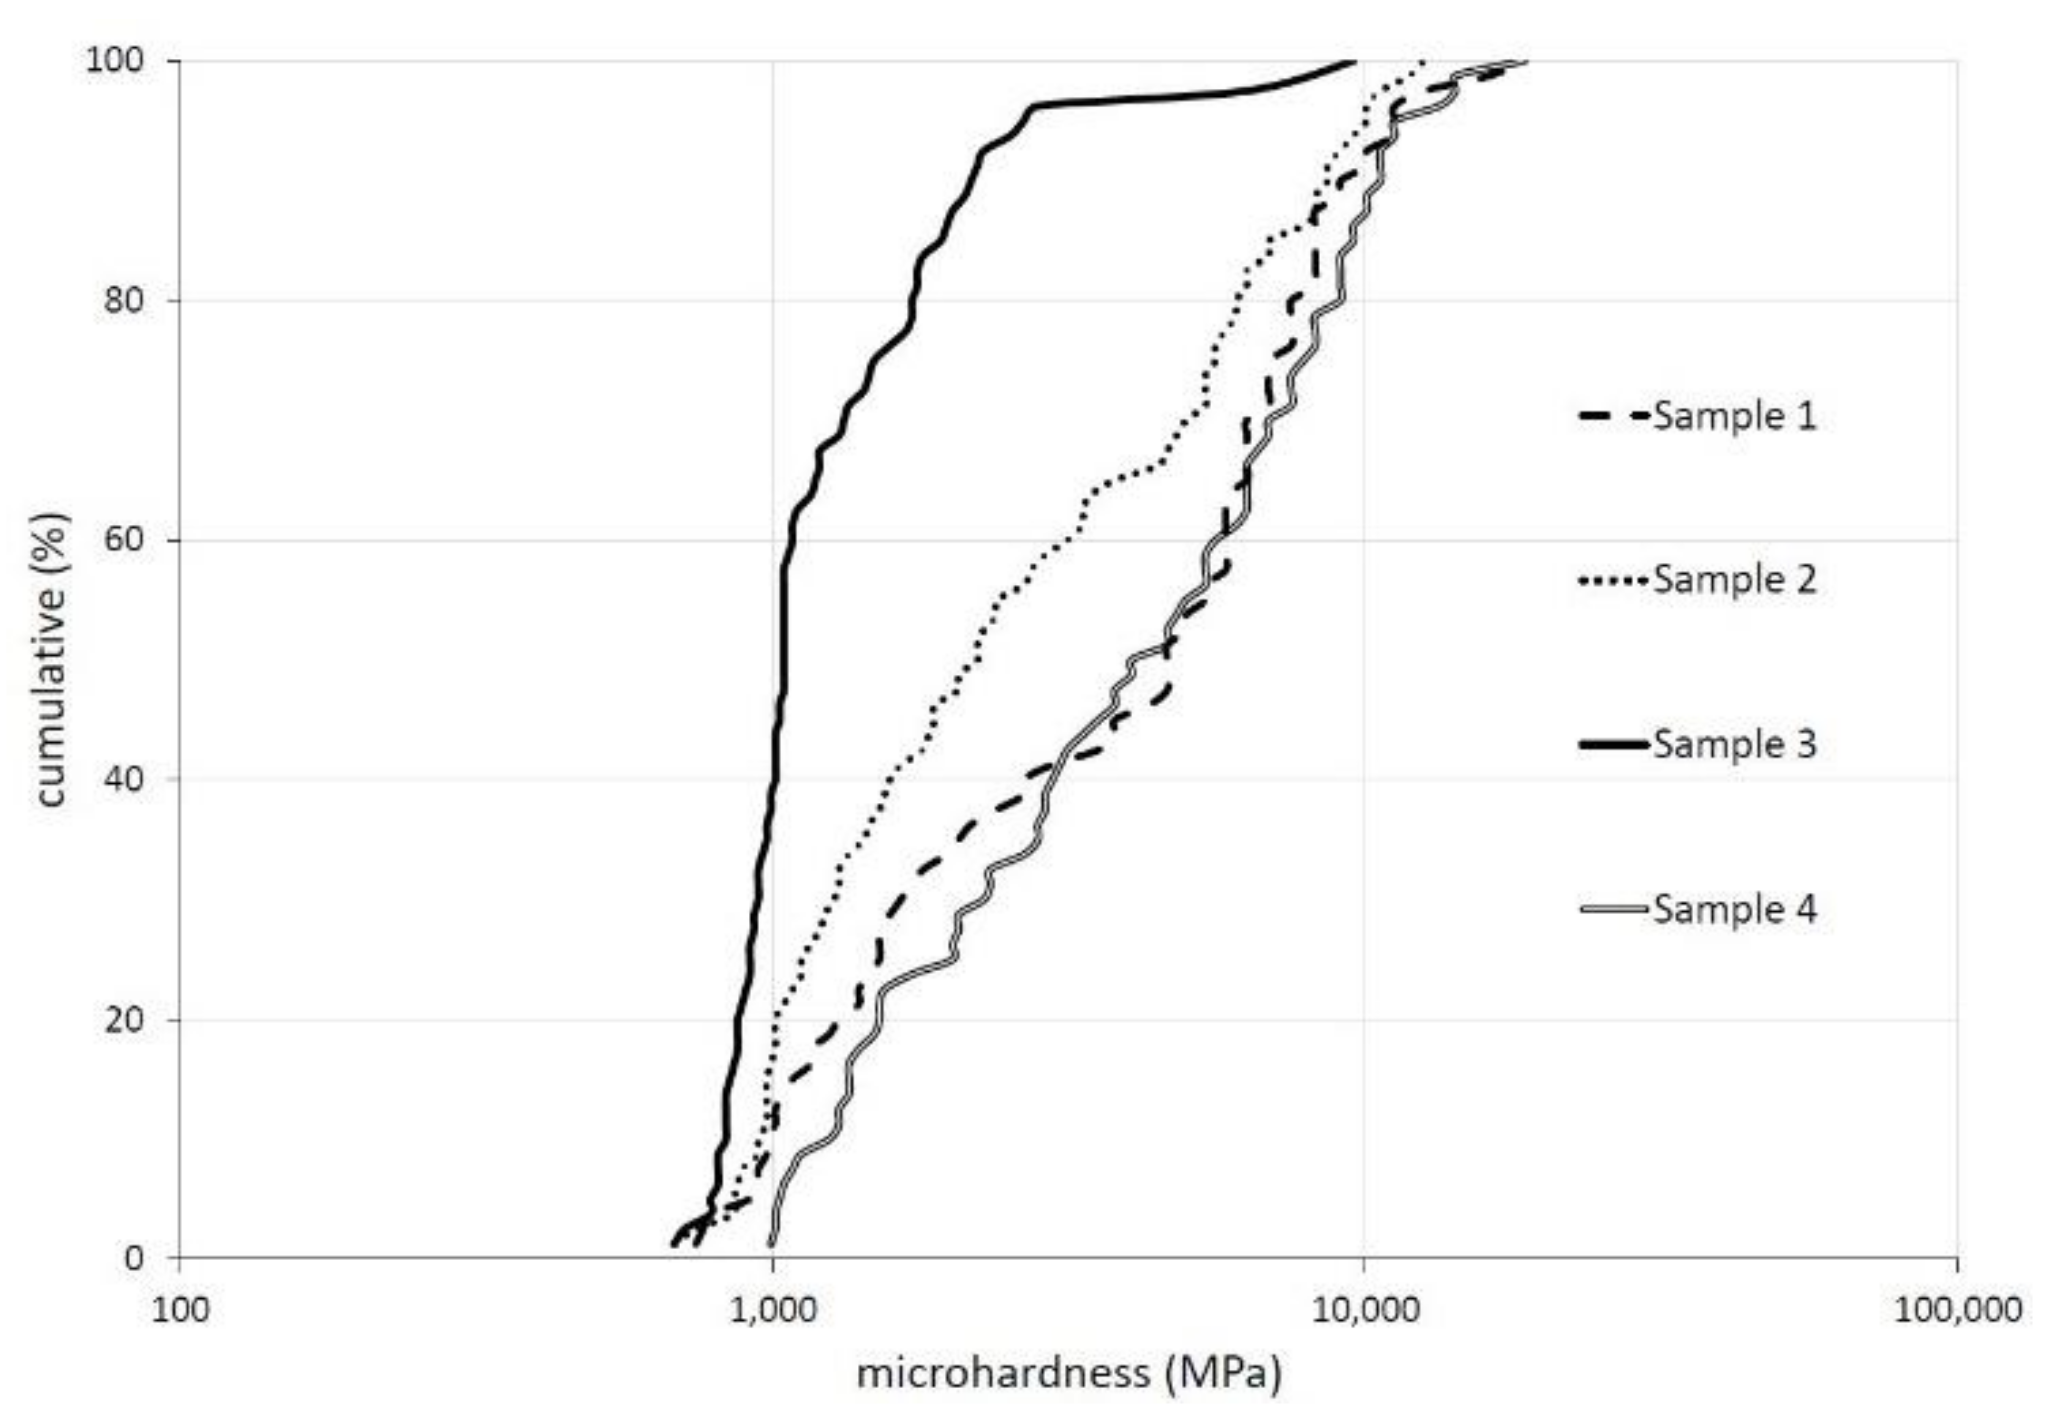
2.2. Vickers Microhardness Test
2.3. CAI—Cerchar Abrasivity Index
2.4. SATA—Soil Abrasion Testing Apparatus
2.4.1. The Wear Bell
2.4.2. Wear Test with Conditioning Agents
3. Discussion
4. Concluding Remarks
Author Contributions
Funding
Institutional Review Board Statement
Informed Consent Statement
Data Availability Statement
Acknowledgments
Conflicts of Interest
References
- Vagnon, F.; Dino, G.A.; Umili, G.; Cardu, M.; Ferrero, A.M. New Developments for the Sustainable Exploitation of Ornamental Stone in Carrara Basin. Sustainability 2020, 12, 9374. [Google Scholar] [CrossRef]
- Careddu, N.; Marras, G. Marble processing for future uses of CaCO3-microfine dust: A study on wearing out of tools and consumable materials in stone working factories. Miner. Processing Extr. Metall. Rev. 2015, 36, 183–191. [Google Scholar] [CrossRef]
- Capitano, C.; Peri, G.; Rizzo, G.; Ferrante, P. Toward a holistic environmental impact assessment of marble quarrying and processing: Proposal of a novel easy-to-use IPAT-based method. Environ. Monit. Assess. 2017, 189, 1–16. [Google Scholar] [CrossRef] [PubMed]
- Mordor Intelligence. Marble Market-Growth, Trends, COVID-19 Impact, and Forecasts (2021–2026); Mordor Intelligence Inc.: Hyderābād, India, 2021. [Google Scholar]
- Angotzi, G.; Bramanti, L.; Tavarini, D.; Gragnani, M.; Cassiodoro, L.; Moriconi, L.; Saccardi, P.; Pinto, I.; Stacchini, N.; Bovenzi, M. World at work: Marble quarrying in Tuscany. Occup. Environ. Med. 2005, 62, 417–421. [Google Scholar] [CrossRef] [PubMed] [Green Version]
- Oggeri, C.; Oreste, P. Underground Quarrying for Marble: Stability assessment through modelling and monitoring. Int. J. Min. Sci. 2015, 1, 35–42. [Google Scholar]
- Bieniawski, Z.T. Engineering Rock Mass Classifications: A Complete Manual for Engineers and Geologists in Mining, Civil, and Petroleum Engineering; Wiley: New York, NY, USA, 1989. [Google Scholar]
- Hoek, E.; Brown, E.T. Practical estimates of rock mass strength. Int. J. Rock Mech. Min. Sci. 1997, 34, 1165–1186. [Google Scholar] [CrossRef]
- Copur, H.; Balci, C.; Bilgin, N.; Tumac, D.; Düzyol, İ. Full-scale linear cutting tests towards performance prediction of chain saw machines. In Proceedings of the 20th International Mining Congress of Turkey; The Chamber of Mining Engineers of Turkey: Ankara, Turkey, 2007; pp. 161–169. [Google Scholar]
- Sariisik, A.; Sariisik, G. Efficiency analysis of armed-chained cutting machines in block production in travertine quarries. J. South. Afr. Inst. Min. Metall. 2010, 110, 473–480. [Google Scholar]
- Sariisik, A.; Sariisik, G. Investigation of the cutting performance of the natural stone block production in quarries with armed-chain cutting machine. Proc. Inst. Mech. Eng. Part C J. Mech. Eng. Sci. 2013, 227, 1291–1301. [Google Scholar] [CrossRef]
- Copur, H.; Balci, C.; Tumac, D.; Bilgin, N. Field and laboratory studies on natural stones leading to empirical performance prediction of chain saw machines. Int. J. Rock Mech. Min. Sci. 2011, 48, 269–282. [Google Scholar] [CrossRef]
- Copur, H. Linear stone cutting tests with chisel tools for identification of cutting principles and predicting performance of chain saw machines. Int. J. Rock Mech. Min. Sci. 2010, 47, 104–120. [Google Scholar] [CrossRef]
- Hekimoglu, O.Z. Studies on increasing the performance of chain saw machines for mechanical excavation of marbles and natural stones. Int. J. Rock Mech. Min. Sci. 2014, 72, 230–241. [Google Scholar] [CrossRef]
- Tumac, D.; Avunduk, E.; Copur, H.; Bilgin, N.; Balci, C. Estimation of the performance of chain saw machines from shore hardness and the other mechanical properties. ISRM SINOROCK 2013, 1, 261–265. [Google Scholar]
- Milinovic, J.; Dias, Á.A.; Janeiro, A.I.; Pereira, M.F.C.; Martins, S.; Petersen, S.; Barriga, F.J.A.S. XRD Identification of Ore Minerals during Cruises: Refinement of Extraction Procedure with Sodium Acetate Buffer. Minerals 2020, 10, 160. [Google Scholar] [CrossRef] [Green Version]
- Young, R.A. The Rietveld Method; Oxford University Press: New York, NY, USA, 1993. [Google Scholar] [CrossRef]
- Gualtieri, A. Accuracy of XRPD QPA using the combined Rietveld-RIR method. J. Appl. Cryst. 2000, 33, 267–278. [Google Scholar] [CrossRef]
- Ashby, N.A. The factor of hardness in metals. N. Z. Eng. 1951, 6, 33–34. [Google Scholar]
- Gerberich, W.W.; Tymiac, N.I.; Grunlan, J.C.; Horstemeyer, M.F.; Baskes, M.I. Interpretation of indentation size effect. J. Appl. Mech. 2002, 69, 433–442. [Google Scholar] [CrossRef]
- Yihang, L.; Daxi, G.; Zhenyu, S.; Zehua, Z.; Xinggang, J.; Deyuan, Z. A study on strengthening and machining integrated ultrasonic peening drilling of Ti-6Al-4V. Mater. Des. 2021, 212, 110238. [Google Scholar] [CrossRef]
- Smith, R.L.; Sandland, G.E. An Accurate Method of Determining the Hardness of Metals, with Particular Reference to Those of a High Degree of Hardness. Proc. Inst. Mech. Eng. 1922, 102, 623–641. [Google Scholar] [CrossRef]
- Germak, A.; Herrmann, K.; Dai, G.; Li, Z. Development of calibration methods for hardness indenters. VDI-Ber 2006, 1948, 13–26. [Google Scholar]
- Menčík, J. Determination of mechanical properties by instrumented indentation. Meccanica 2007, 42, 19–29. [Google Scholar] [CrossRef]
- ASTM E384:2017; Standard Test Method for Micro-Indentation Hardness of Material. ASTM International: West Conshohocken, PA, USA, 2017.
- Suana, M.; Peters, T. The Cerchar abrasivity index and its relation to rock mineralogy and petrography. Rock Mech. Rock Eng. 1982, 15, 1–7. [Google Scholar] [CrossRef]
- Al-Ameen, S.I.; Waller, M.D. The influence of rock strength and abrasive mineral content on the Cerchar abrasive index. Eng. Geol. 1994, 36, 293–301. [Google Scholar] [CrossRef]
- Hamzaban, M.T.; Memarian, H.; Rostami, J. Continuous monitoring of pin tip wear and penetration into rock surface using a new Cerchar abrasivity testing device. Rock Mech. Rock Eng. 2014, 47, 689–701. [Google Scholar] [CrossRef]
- Hamzaban, M.T.; Memarian, H.; Rostami, J. Determination of scratching energy index for Cerchar abrasion test. J. Min. Environ. 2018, 9, 73–89. [Google Scholar] [CrossRef]
- He, J.; Li, S.; Li, X.; Wang, X.; Guo, J. Study on the correlations between abrasiveness and mechanical properties of rocks combining with the microstructure characteristic. Rock Mech. Rock Eng. 2016, 49, 2945–2951. [Google Scholar] [CrossRef]
- Majeed, Y.; Abu Bakar, M.Z. Statistical evaluation of CERCHAR abrasivity index (CAI) measurement methods and dependence on petrographic and mechanical properties of selected rocks of Pakistan. Bull Eng. Geol. Environ. 2016, 75, 1341–1360. [Google Scholar] [CrossRef]
- Bakar, M.A.; Majeed, Y.; Rostami, J. Effects of rock water content on CERCHAR Abrasivity Index. Wear 2016, 368, 132–145. [Google Scholar] [CrossRef]
- Rostami, J.; Ozdemir, L.; Bruland, A.; Dahl, F. Review of Issues Related to Cerchar Abrasivity Testing and Their Implications on Geotechnical Investigations and Cutter Cost Estimates. In Proceedings of the Rapid Excavation and Tunnelling Conference, Seattle, WA, USA, 27–29 June 2005; pp. 738–751. [Google Scholar]
- Rostami, J.; Ghasemi, A.; Gharahbagh, E.A.; Dogruoz, C.; Dahl, F. Study of Dominant Factors Affecting Cerchar Abrasivity Index. Rock Mech. Rock Eng. 2013, 47, 1905–1919. [Google Scholar] [CrossRef]
- Alber, M.; Yaralı, O.; Dahl, F.; Bruland, A.; Käsling, H.; Michalakopoulos, T.N.; Cardu, M.; Hagan, P.; Aydın, H.; Özarslan, A. ISRM suggested method for determining the abrasivity of rock by the CERCHAR abrasivity test. Rock Mech. Rock Eng. 2014, 47, 261–266. [Google Scholar] [CrossRef]
- Yarali, O.; Yasar, E.; Bacak, G.; Ranjith, P.G. A study of rock abrasivity and tool wear in coal measures rocks. Int. J. Coal Geol. 2008, 74, 53–66. [Google Scholar] [CrossRef]
- Plinninger, R.J.; Kasling, H.; Thuro, K. Wear prediction in hard rock excavation using the Cerchar abrasiveness index (CAI). In Proceedings of the EUROCK 2004 & 53rd Geomechanics Colloquium, Salzburg, Austria, 7–9 October 2004; pp. 599–604. [Google Scholar]
- Plinninger, R.J.; Kasling, H.; Thuro, K.; Spaun, G. Testing conditions and geomechanical properties influencing the cerchar abrasivity index (CAI) value. Int. J. Rock Mech. Min. Sci. 2003, 40, 259–263. [Google Scholar] [CrossRef]
- Peila, D.; Martinelli, D.; Todaro, C.; Luciani, A. Soil conditioning in EPB shield tunnelling–An overview of laboratory tests. Geomech. Tunn. 2019, 12, 491–498. [Google Scholar] [CrossRef]
- Salazar, C.G.O.; Todaro, C.; Bosio, F.; Bassini, E.; Ugues, D.; Peila, D. A new test device for the study of metal wear in conditioned granular soil used in EPB shield tunnelling. Tunn. Undergr. Space Technol. 2018, 73, 212–221. [Google Scholar] [CrossRef] [Green Version]
- Rostami, J.; Gharahbagh, E.A.; Palomino, A.M.; Mosleh, M. Development of soil abrasivity testing for soft ground tunneling using shield machines. Tunn. Undergr. Space Technol. 2012, 28, 245–256. [Google Scholar] [CrossRef]
- Jakobsen, P.D.; Langmaack, L.; Dahl, F.; Breivik, T. Development of the Soft Ground Abrasion Tester (SGAT) to predict TBM tool wear, torque and thrust. Tunn. Undergr. Space Technol. 2013, 38, 398–408. [Google Scholar] [CrossRef]
- Zhao, D.H.; Yan, G.Y.; Wu, Q. Research on wear characteristics of CVD composite coated tool in natural marble cutting. Adv. Mater. Res. 2014, 941, 1644–1649. [Google Scholar] [CrossRef]
- Barbero, M.; Peila, D.; Picchio, A.; Chieregato, A.; Bozza, F.; Mignelli, C. Procedura sperimentale per la valutazione dell’effetto del condizionamento del terreno sull’abrasione degli utensili nello scavo con EPB. Geoing Ambient. Min. 2012, 135, 13–19. [Google Scholar]
- Salazar, C.G.O.; Martinelli, D.; Todaro, C.; Peila, D.; Boscaro, A. Study of wear in conditioned granular soil by using a new test device. In Proceedings of the ITA-AITES World Tunnel Congress 2016, San Francisco, CA, USA, 22–28 April 2016; Volume 3, pp. 2445–2454. [Google Scholar]
- Salazar, C.G.O.; Martinelli, D.; Todaro, C.; Luciani, A.; Boscaro, A.; Peila, D. Preliminary study of wear induced by granular soil on metallic parts of EPB tunnelling machines. Geoing Ambient. Min. 2016, 148, 67–70. [Google Scholar]
- Alavi Gharahbagh, E.; Rostami, J.; Palomino, A.M. New soil abrasion testing method for soft ground tunneling applications. Tunn. Undergr. Sp. Tech. 2011, 26, 604–613. [Google Scholar] [CrossRef]
- Alavi Gharahbagh, E.; Qiu, T.; Rostami, J. Evaluation of granular soil abrasivity for wear on cutting tools in excavation and tunneling equipment. J. Geotech. Geoenviron. 2013, 139, 1718–1726. [Google Scholar] [CrossRef]
- Alavi Gharahbagh, E.; Rostami, J.; Talebi, K. Experimental study of the effect of conditioning on abrasive wear and torque requirement of full face tunneling machines. Tunn. Undergr. Sp. Tech. 2014, 41, 127–136. [Google Scholar] [CrossRef]
- Zhang, B.; Reza, H.; Gu, S.; Gupta, N. Investigation of physical and chemical characteristics of Masonry Stones and Bricks during Building Cleaning: Part 1. Physical testing. J. Phys. Sci. Appl. 2014, 4, 207–222. [Google Scholar]
- Akaishi, M.; Oshawa, T.; Yamaoka, S. Synthesis of Fine-Grained Polycrystalline Diamond Compact and Its Microstructure. J. Am. Ceram. Soc. 1991, 74, 5–10. [Google Scholar] [CrossRef]
- Antsev, A.V.; Pasko, N.I.; Antseva, N.V. Assessment of wear dependence parameters in complex model of cutting tool wear. IOP Conf. Ser. Mater. Sci. Eng. 2018, 327, 042005. [Google Scholar] [CrossRef]


Publisher’s Note: MDPI stays neutral with regard to jurisdictional claims in published maps and institutional affiliations. |
© 2022 by the authors. Licensee MDPI, Basel, Switzerland. This article is an open access article distributed under the terms and conditions of the Creative Commons Attribution (CC BY) license (https://creativecommons.org/licenses/by/4.0/).
Share and Cite
Di Giovanni, A.; Todaro, C.; Cardu, M.; Bianchini, S.; Forfori, B. Laboratory Test Campaign Aimed at the Analysis of an Uncommon Wear Phenomenon in a Marble Quarry. Appl. Sci. 2022, 12, 2264. https://0-doi-org.brum.beds.ac.uk/10.3390/app12042264
Di Giovanni A, Todaro C, Cardu M, Bianchini S, Forfori B. Laboratory Test Campaign Aimed at the Analysis of an Uncommon Wear Phenomenon in a Marble Quarry. Applied Sciences. 2022; 12(4):2264. https://0-doi-org.brum.beds.ac.uk/10.3390/app12042264
Chicago/Turabian StyleDi Giovanni, Alfio, Carmine Todaro, Marilena Cardu, Stefano Bianchini, and Brunello Forfori. 2022. "Laboratory Test Campaign Aimed at the Analysis of an Uncommon Wear Phenomenon in a Marble Quarry" Applied Sciences 12, no. 4: 2264. https://0-doi-org.brum.beds.ac.uk/10.3390/app12042264