Article

Experiment Study on Mechanical Evolution Characteristics of Coal and Rock under Three-Dimensional Triaxial Stress

1
School of Energy and Mining Engineering, China University of Mining and Technology (Beijing), Beijing 100083, China
2
State Key Laboratory of Hydroscience and Engineering, Department of Hydraulic Engineering, Tsinghua University, Beijing 100084, China
*
Author to whom correspondence should be addressed.
Submission received: 25 January 2022 / Revised: 21 February 2022 / Accepted: 22 February 2022 / Published: 26 February 2022
(This article belongs to the Collection Geoinformatics and Data Mining in Earth Sciences)

Abstract

:
The surrounding rock is in a complex stress environment and its mechanical behavior is also complex, especially after the excavation of the coal seam, the phenomenon of stress release of surrounding rock often occurs. The vertical stress and horizontal stress of the surrounding rock mass will have a series of complex changes. In underground engineering, rock mass is affected by dead weight pressure and tectonic stress. With coal mine production, the original stress of surrounding rock is demolished, and the destruction of surrounding rock is reflected in the loading and unloading failure of three-dimensional stress. Aiming at the phenomenon, this paper takes the Pingshuo East open-pit mine as the research background, and the experiments on physical and mechanical parameters of coal and rock mass was carried out, obtaining the coal and rock mechanics parameters, such as elastic modulus, Poisson’s ratio, internal friction angle, cohesive force, etc. The stress strain curve was created based on the conventional triaxial experiment of coal and rock under different confining pressure conditions. According to the characteristics of these curves, we obtain underground engineering rock mass unloading stress–strain variation characteristics. Through establishing a stress–strain equation based on confining pressure, we finally describe the mechanical failure characteristics of rock under triaxial stress.

1. Introduction

In recent years, rapid urbanization in developing countries is spurring the demand for coal resources to an unprecedented growth [1]. Therefore, shallow coal mine resources are decreasing constantly [2], coal mining has gradually transferred to deep mining [3], and many domestic coal mines are focusing on open-pit and underground mining models from exhaustion of coal mine shallow resources [4]. Along with the instance of the Pingzhuang West open-pit mine [5], there are also the Antaibao open-pit mine [6], China’s Anjialing open-pit mine [7], and other open-pit and non-ferrous metal mines. When the two mining exploitation methods are used in the same area, the co-occurring processes of underground mining and open-pit influence each other [8]. In one aspect, the synchronization of the two working conditions will significantly change the strata structure, stress status, and formation of the mining of space [9,10]. On the other hand, more attention should be paid to the goafs at the bottom of underground mines, because the crown pillars are thin and a failure of the goaf close to the bottom may trigger a landslide disaster in the upper slope [11,12]. The interaction effects are predominantly evident in goaf stability analysis. The contributing factors of goaf stability are related to the changes of roadway lining distribution, the anchor, and surrounding rock. In particular, the surrounding rock coal mining brakes the equilibrium state of in situ stress field. The surrounding rock experiences deformation, destruction, caving, and stability under the coupled action of mining stress field and supporting stress field. Consequently, the stability of the surrounding rock greatly impacts the mine operations and personnel safety, and simultaneously reflects the mechanical evolution characteristics of coal petrography in a complex stress environment.
The significance of the destruction of original stress of the surrounding rock on existing roadways is a multidisciplinary problem and involves many aspects, such as the dynamic response of rock mechanics, the exploitation of the underground construction, the explosion vibration, the loose zone of the surrounding rock, and the propagation of the stress wave. Research methods have involved theoretical analyses, numerical simulations [13], field tests [14,15], and synthesis methods. Huang et al. [16] discussed the corresponding methods of controlling the surrounding rock stability, comparing general methods, and provided an important theoretical foundation for application in deep coal mines. Salmi et al. [17] dedicated considerable efforts to explore and summarize surrounding rock masses classification methods through empirical equations. Unlike the empirical techniques, numerical methods [18] can be used for evaluating deformation development progress of surrounding rock masses in mining geological and geotechnical conditions [19]. Li et al. [20] presupposed single monitoring information (e.g., resistivity profiles and source position messages) and presented multiparameter dynamic monitoring methods. These methods were validated using numerical simulation results. Jing et al. [21] took an anonymous coal mine of China as an example, explicating the numerical simulation results of the stress evolution, displacement field, overall distribution, and failure characteristics of the anchorage structure of surrounding rock with different rock bolt spacing. The results showed that when the maximum displacement between the roof and floor of the west wing track roadway reach a certain value, it can ensure the stability and safety of the excavated roadway. Finally, in association with field tests, Zhang et al. [22] conducted a research item in four different Chinese coal mining sites and evaluated the related response of influencing circumstances and factors of surrounding rock such as mining depth, support strength, and area of gob-side hanging roof. Yu et al. [23] developed a shaft and auxiliary shaft system for the stability and control technology of surrounding rock by the chamber and roadway ground of 850 m level in a mining area. He et al. [24] established a stability classification and order-arranging model of surrounding rock based on certainty measure theory. Chen et al. [25] employed X-ray diffraction technology to analyze the repair control technology of the surrounding rock in mining areas which contain clay minerals.
In the meantime, the accidents due to underground coal mining, such as roadways surrounding rock large deformation, account for more than 40% of all the accidents in mine construction and production. In this situation, global scholars and enterprise decision-makers have spent more effort on fundamentally recognizing the deformation mechanism and proposing reasonable control measures for roadways in deep underground areas. Most researchers have conducted numerous substantive research on deformation, failure mechanism, and control measures for surrounding rock in underground mining. He et al. [26] and Sun et al. [27] presented a design theory of nonlinear large deformation of surrounding rock deep underground and built up a bolt with constant resistance and large deformation. Kang and Liu et al. [28] analyzed the supporting difficulties and mechanism of soft fragmentized surrounding rock roadway with high stress, and they proposed a new kind of combined supporting system including a new kind of hollow grouting cable. Li and Wang [29] studied deformation characteristics of the surrounding rock in deep roadway with top coal, and they designed the pressure relief anchor box beam system. Singh et al. [30] studied the trigger factors and deformation mechanisms of failure of surrounding rock used at high stress levels from two different Indian open-pit and underground coupling coal mines. Sasaoka et al. [31] discussed the technologies for developing roadways in deep German coal mines under difficult ground conditions.
Although many previous studies have been proposed and conducted to date on this topic using theoretical analysis [32], numerical simulations [33,34], and field tests [35,36], research on the effects of seismic waves on existing roadways due to blasting in open-pit and underground coupled mining is lacking. In addition, because field measurements and laboratory mechanical experiment are scarce in open-pit coupled underground mining circumstances, most of the research results can only be used as reference data for surround rock in underground construction. Moreover, many studies are restricted due to geographical environmental, engineering background, and construction conditions, and the data are not suitable to settle this problem.
Considering the characteristics of surrounding rock in high-stress environments, this paper carries out work in the following aspects: According to the geological survey and geophysical characteristics of the East open-pit mine, regional geology, hydrogeology, and geophysical characteristics were analyzed [37,38], and the ore body and surrounding rock were sampled, respectively. The specific work carried out is as follows: (ⅰ) Physical properties of rock (natural bulk density, saturated water absorption, saturated bulk density) experiment; (ⅱ) Rock deformation parameter experiment; (ⅲ) Rock uniaxial compression experiment; (ⅳ) Rock triaxial compression experiment; (ⅴ) Shear test of rock with variable angle mode. By carrying out indoor coal and rock mechanics experiments under triaxial stress, this paper provides a basis for roof mechanical model analysis and goaf stability analysis.

2. Materials and Methods

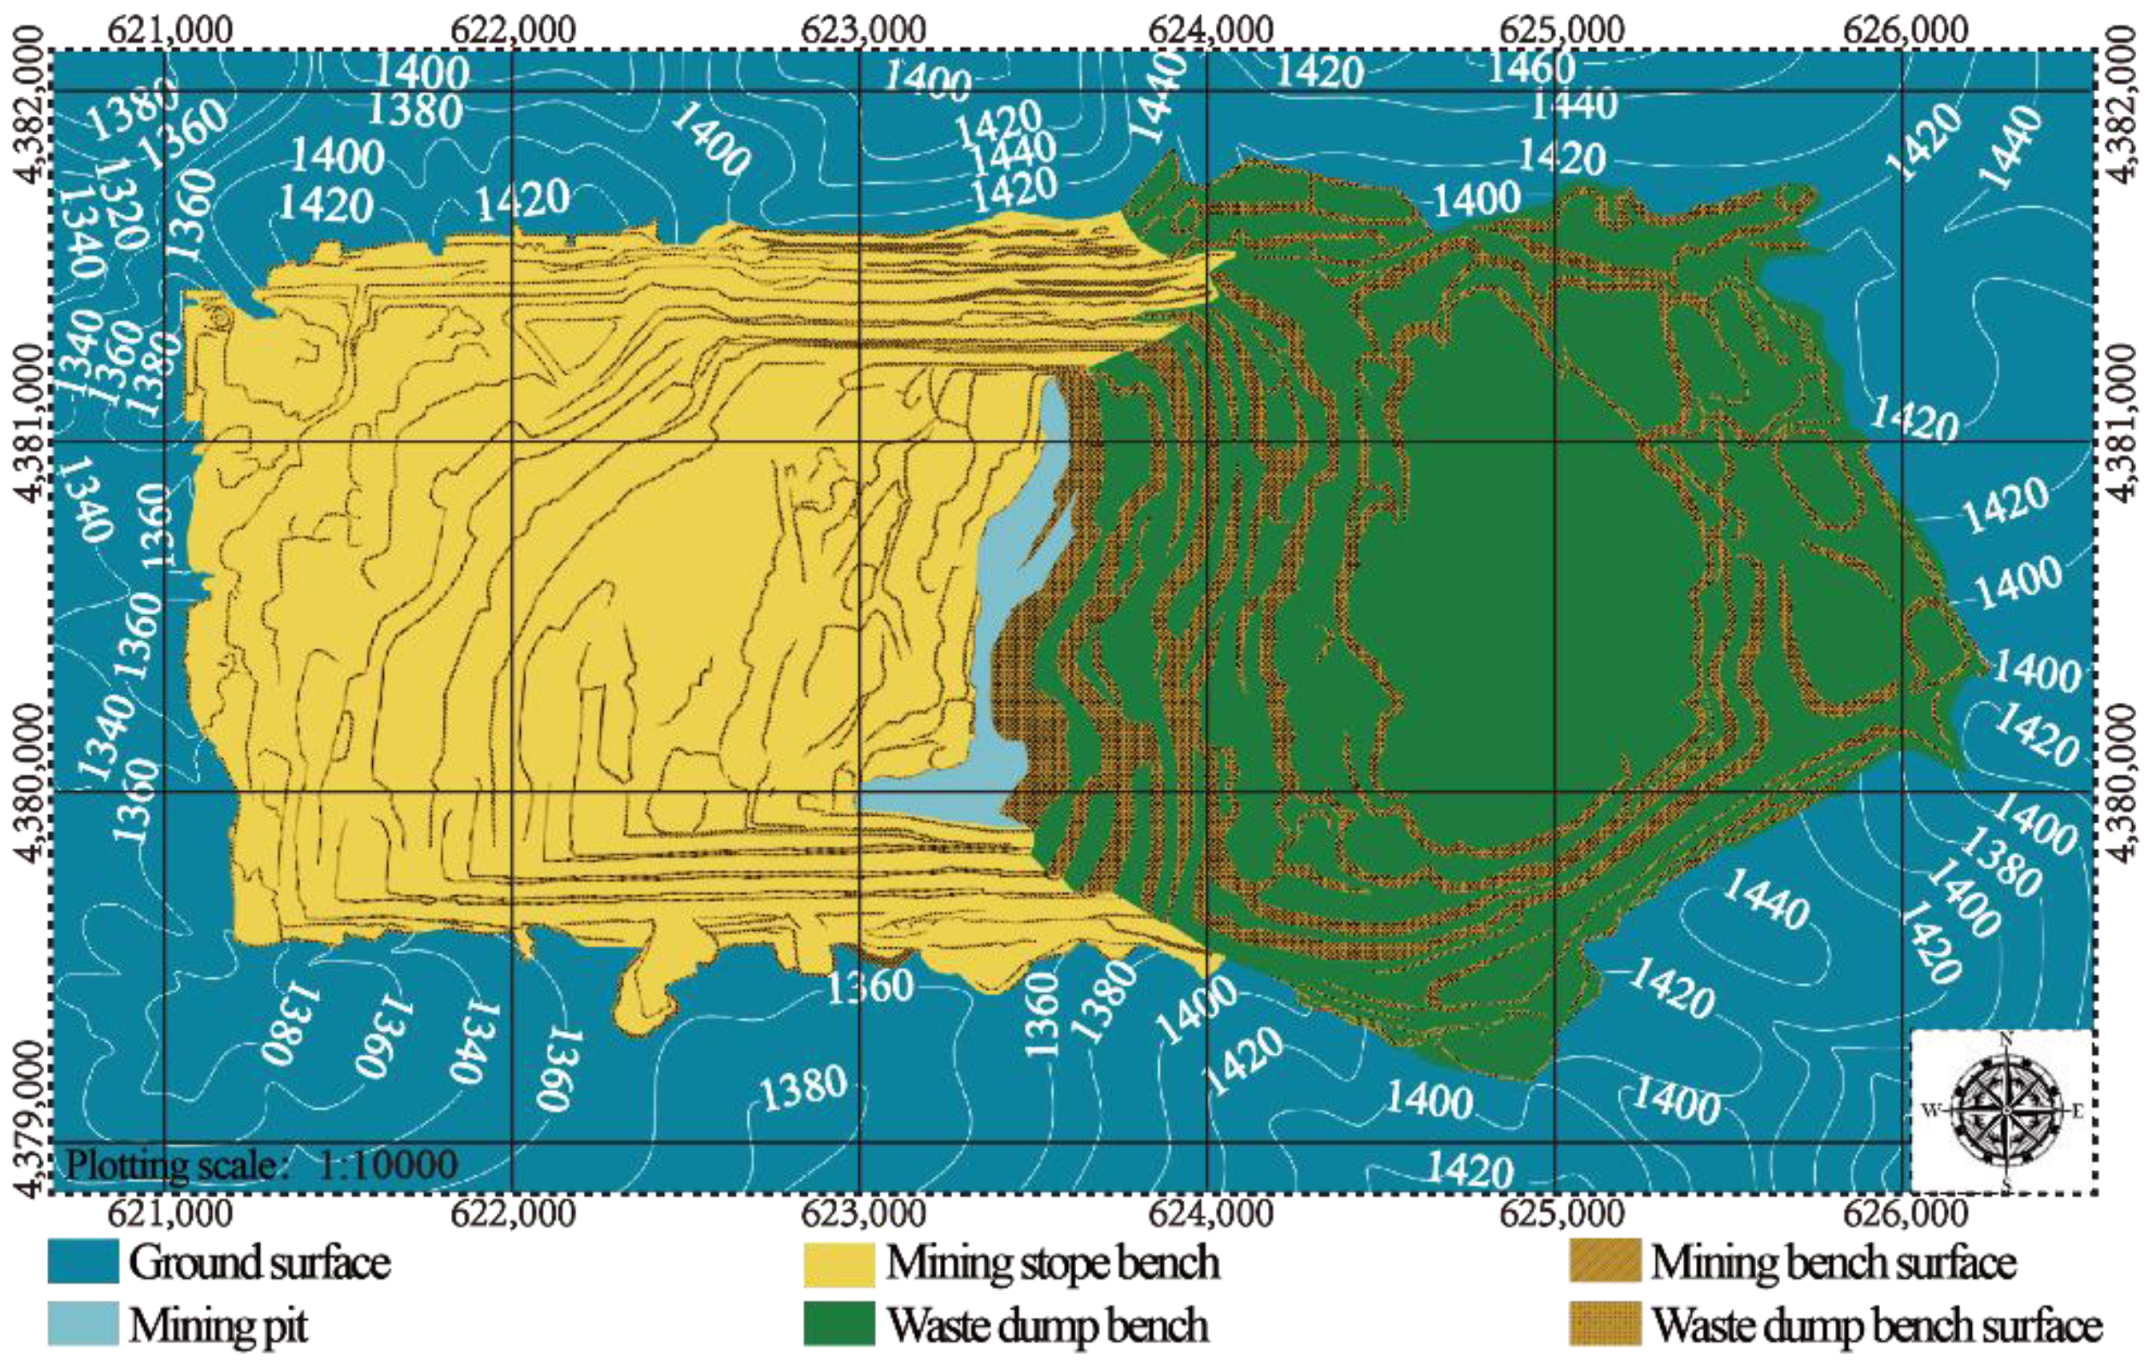
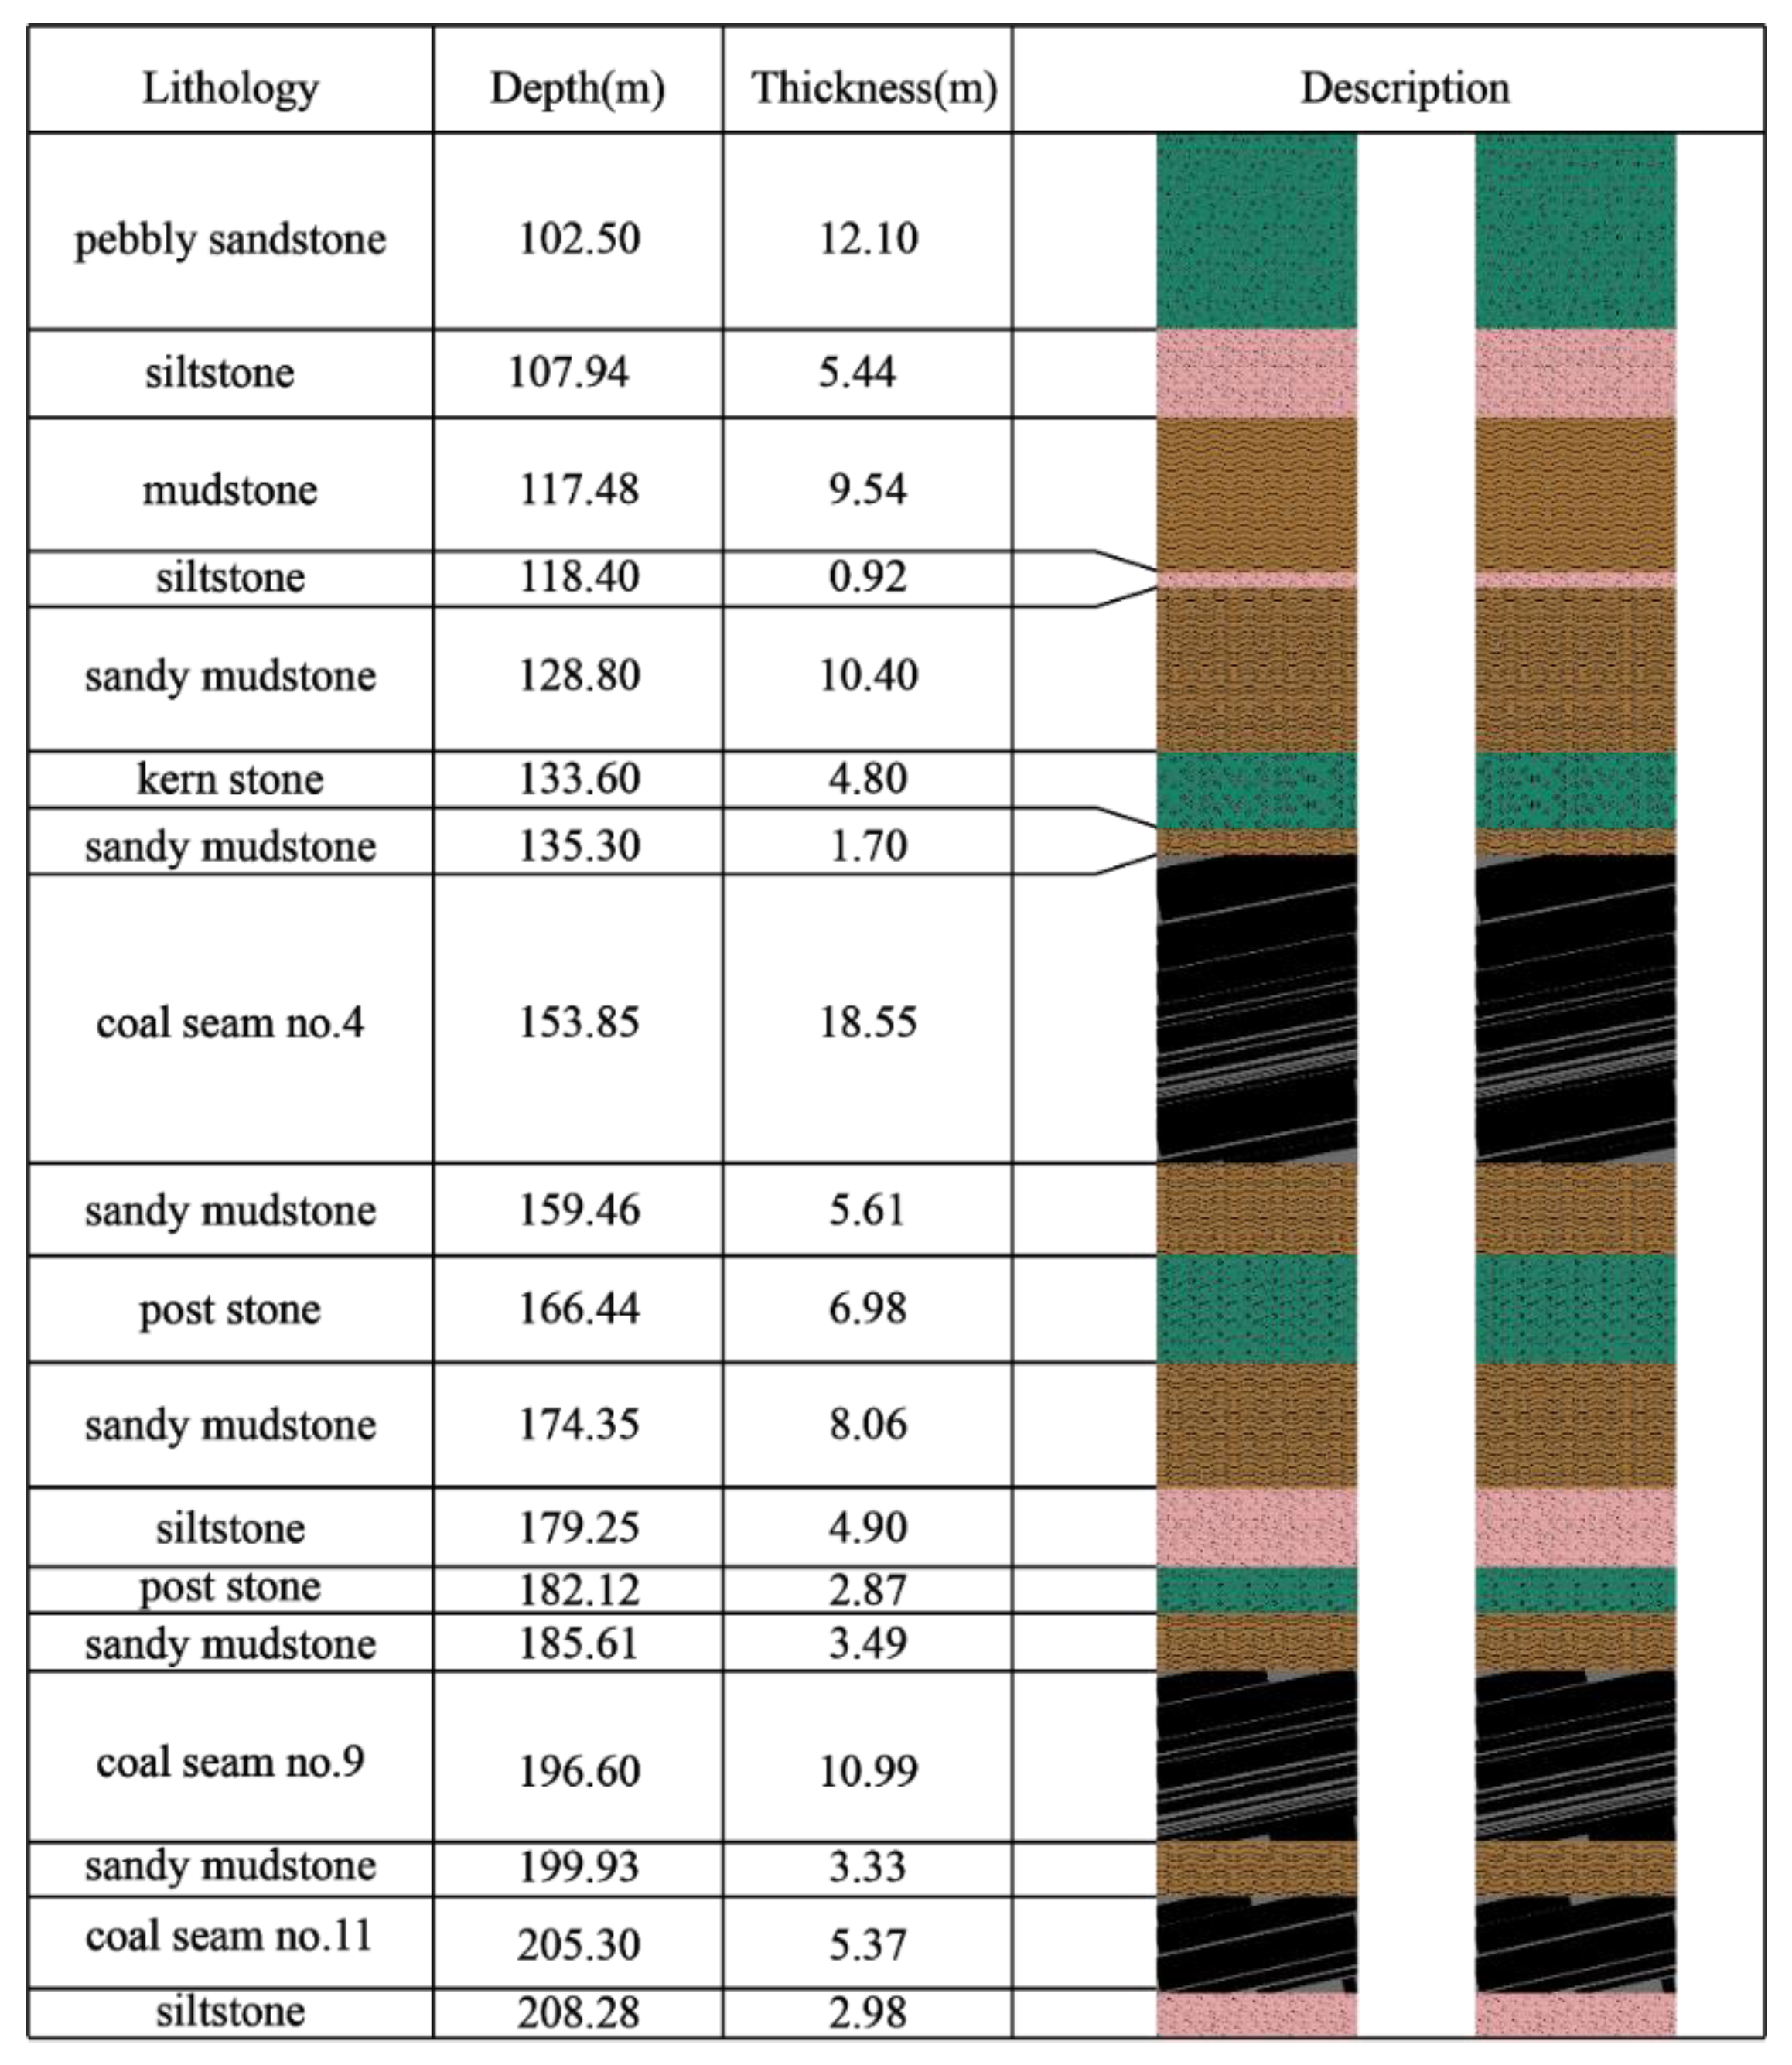
2.1. Engineering Background and Geological Setting

Pingshuo East open-pit mine (as shown in Figure 1) is subordinate to China coal Pingshuo group co., LTD. It is 4.42~5.47 km wide from east to west and 6.53~10.3 km long from north to south. The mining area is 48.73 km2, and the mining depth of No. 11 coal floor is about 200 m on average. The main coal seams are No. 4, 9, and 11. The average thickness of coal seams in the whole area is 34 m, and the reserves are 1848.92 Mt. The approved production capacity is 20.0 Mt/a. A typical borehole histogram is shown in Figure 2.
The stripping adopts the single-bucket truck discontinuous process, and the main stripping material is yellow sand soil, red clay, limestone, sandstone, etc. The bucket with capacity of 25 m3, 32 m3, and 55 m3 is used for loading, and it is transported to the dump site by the supporting dump truck with load capacity of 200 t and 300 t. The coal mining adopts the semicontinuous process of single bucket—truck—semi-fixed crushing station—belt conveyor—coal preparation plant. The electric shovel is used in conjunction with the coal mining of the former machine, and the coal is transported to the coal crushing station by 200 t class truck.

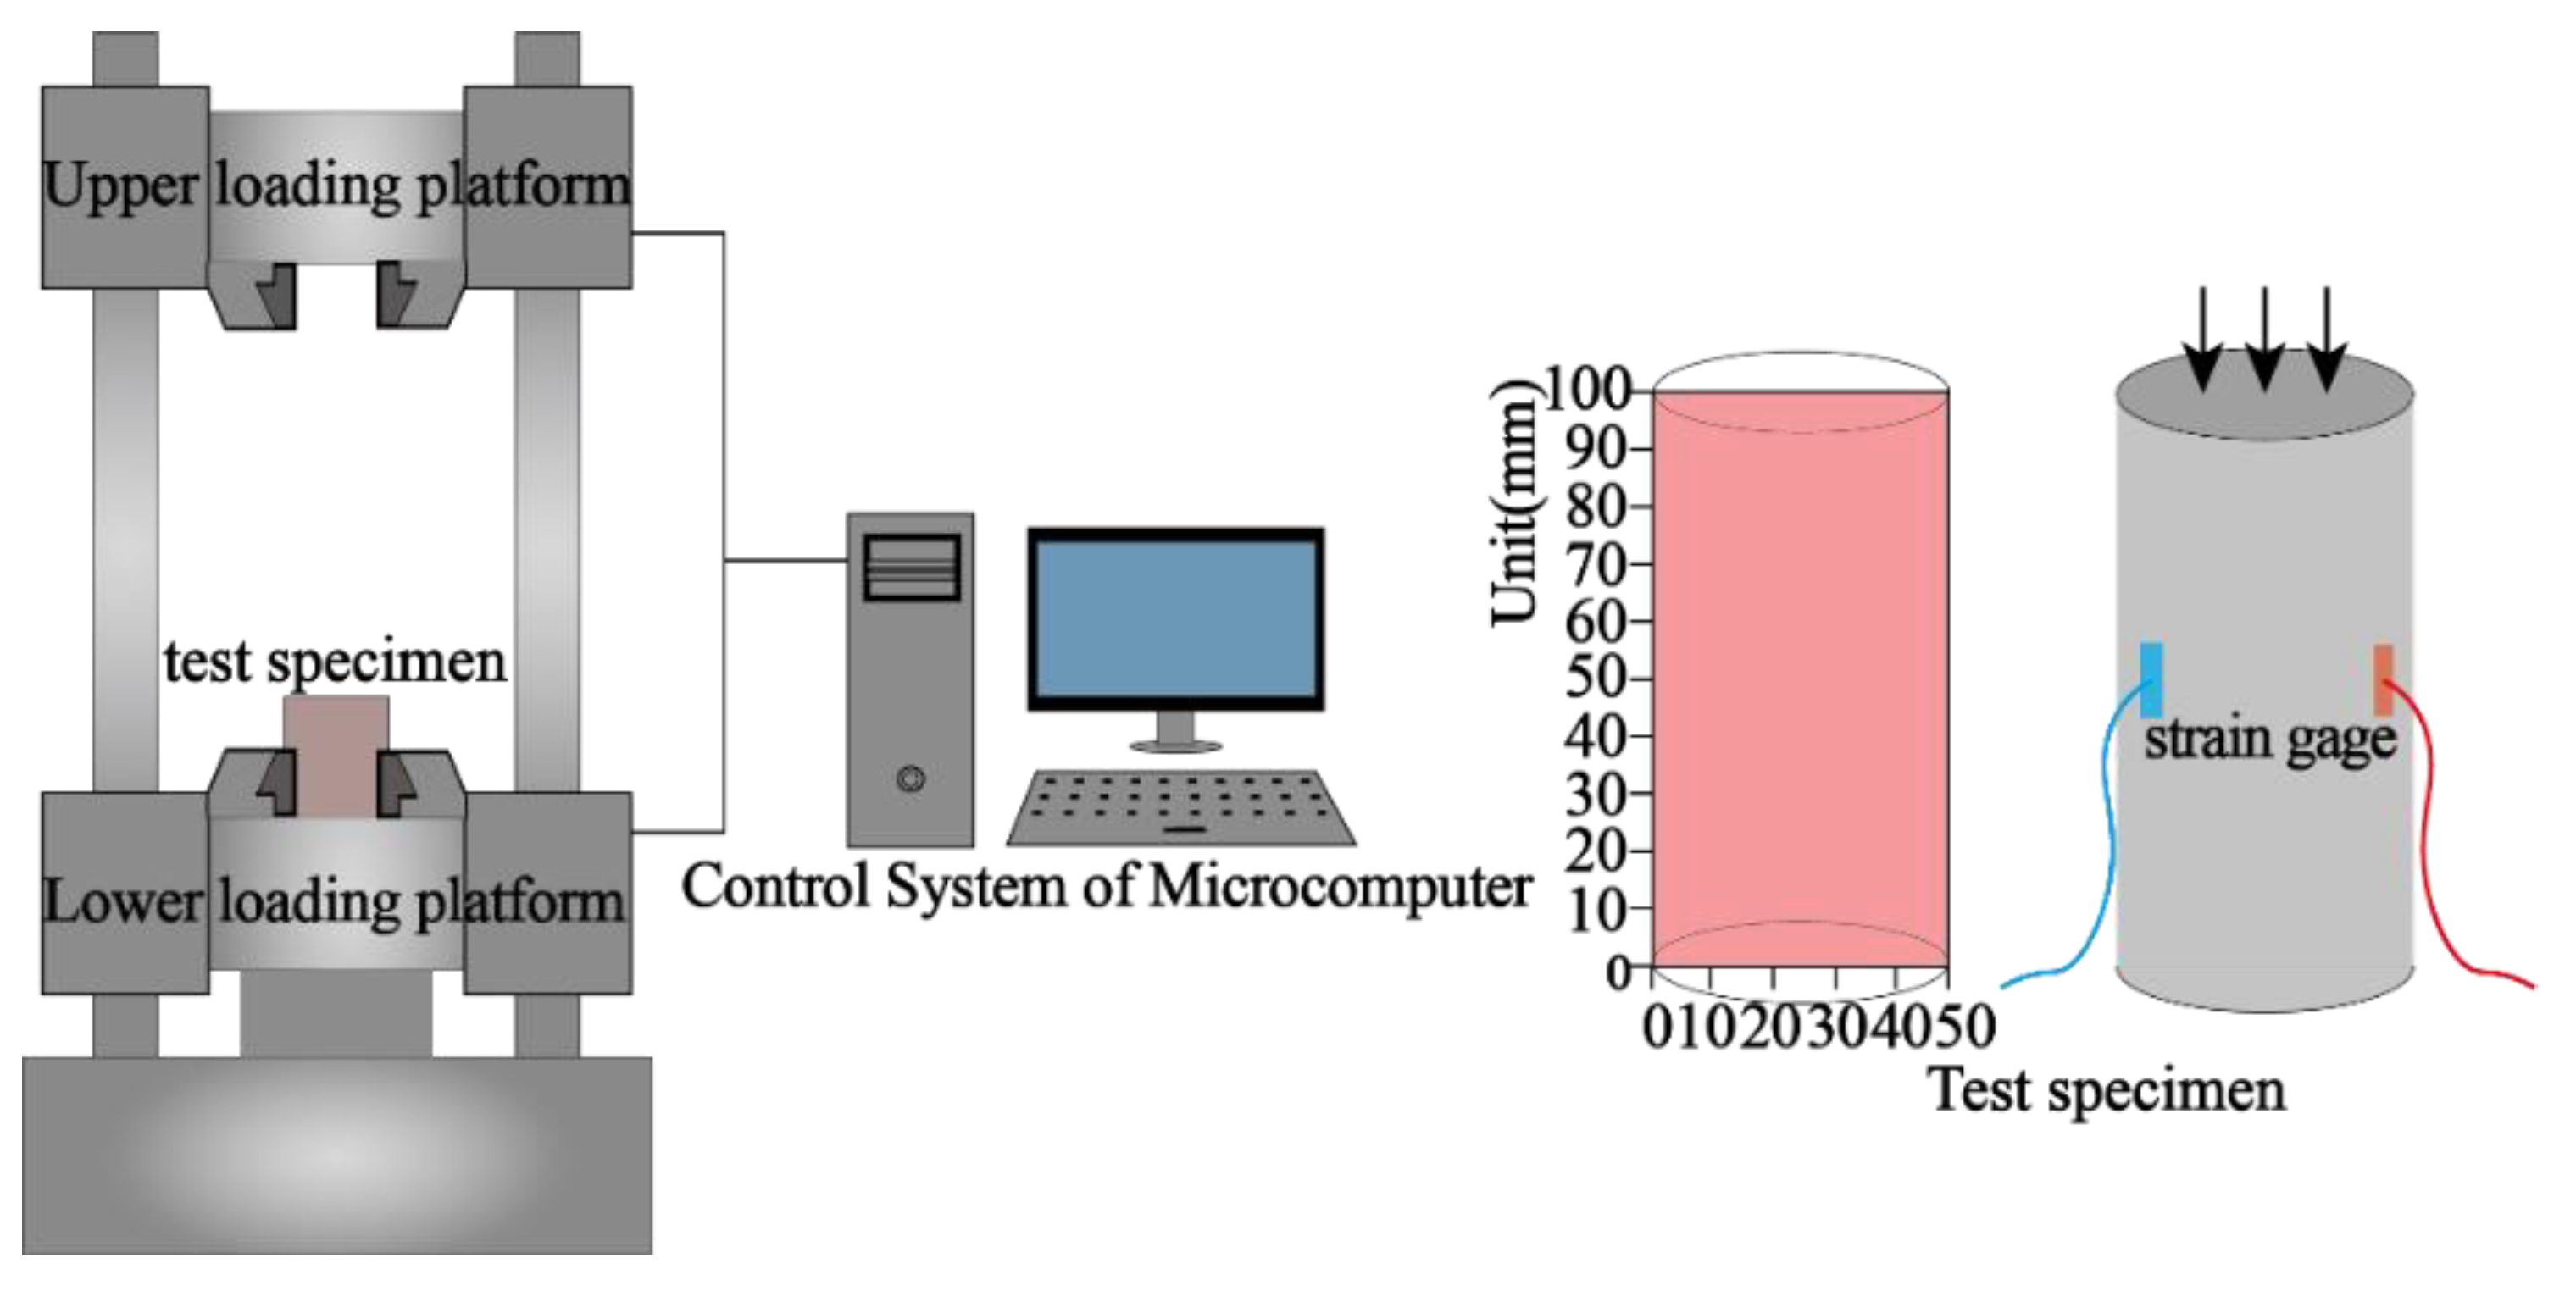
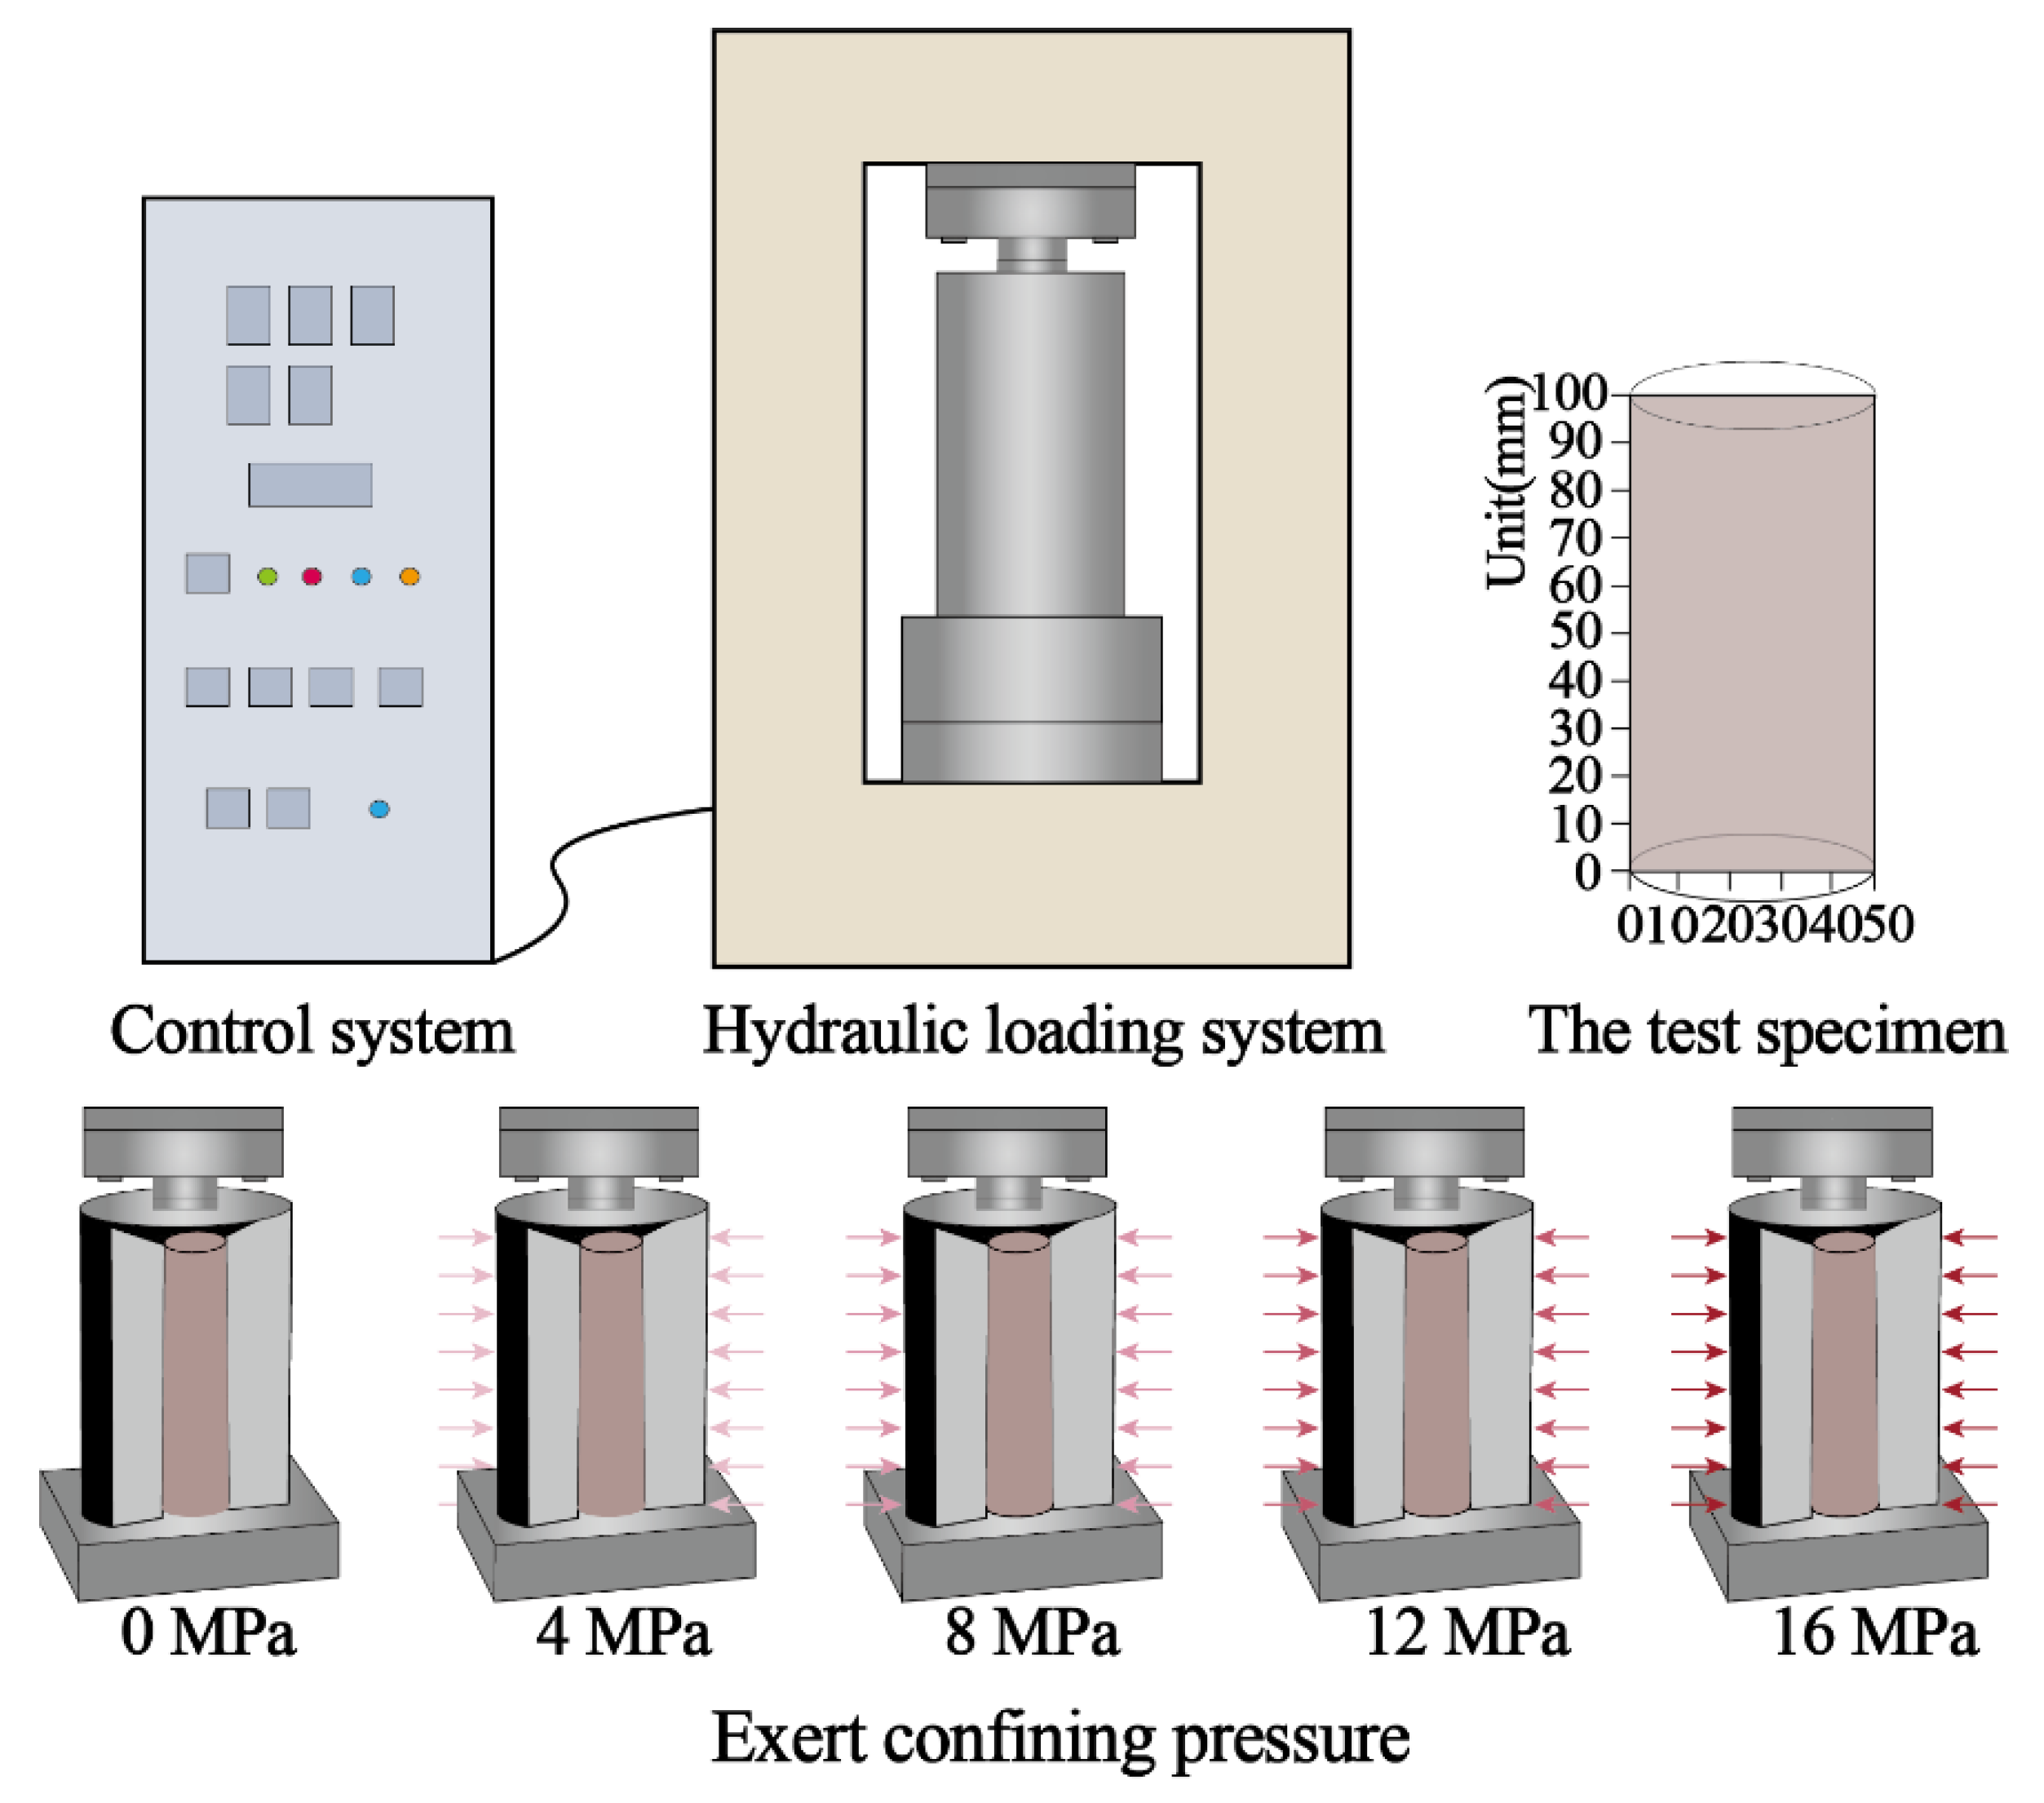
2.2. Experimental Equipment and Experimental Scheme

The rock part of the experiment is carried out in accordance with the industry standards of the People’s Republic of China, Rock Experiment Regulations for Water Conservancy and Hydropower Engineering (SL264-2001), Rock Experiment Regulations for Highway Engineering (JTG E41-2005) and Rock Experiment Method Standard for Engineering (GB/T50266-2013). The uniaxial compressive strength test specimens are generally cylindrical columns with a diameter of 5 cm (48~54 mm) and a height of 10 cm (the ratio of specimen height to diameter is generally 2.0–2.5); under the same water bearing state, no less than three specimens are prepared for each group. Meanwhile, the specimen size selected in this paper meets the standard requirements.
There were 19 groups of laboratory experiments, including five groups of rock physical properties experiment, six groups of uniaxial compression and deformation parameter experiment, four groups of triaxial compression experiment, and four groups of variable angle shear experiment.
According to conventional uniaxial and triaxial loading tests, the minimum uniaxial compressive strength of rock mass is coal rock with a compressive strength of about 20 MPa. In order to simulate the real stress of surrounding rock to the maximum extent, the confining pressures of rock mass were set at 0, 4, 8, 12, and 16 MPa during the triaxial test of surrounding rock. Meanwhile, the triaxial test can reflect the mechanical characteristics of rock mass in the actual stress field. According to the sampling situation, the triaxial test of rock mass is carried out and the loading rate is set as 0.1 mm/min. The relevant physical properties of rock samples tested through experiments are shown in Table 1.

2.3. Uniaxial Compressive Strength Test of Rock Mass

The uniaxial compressive strength, elastic modulus, and Poisson’s ratio of rock mass were obtained through indoor tests of uniaxial compressive strength, elastic modulus, and Poisson’s ratio of rock mass. The tests were carried out in the Laboratory of Structural Mechanics, University of Science and Technology Beijing, China, and a WGE-600 microcomputer was used to control the universal screen test machine (as shown in Figure 3). The elastic modulus and Poisson’s ratio of rock mass can be obtained according to relevant specifications and algorithms.

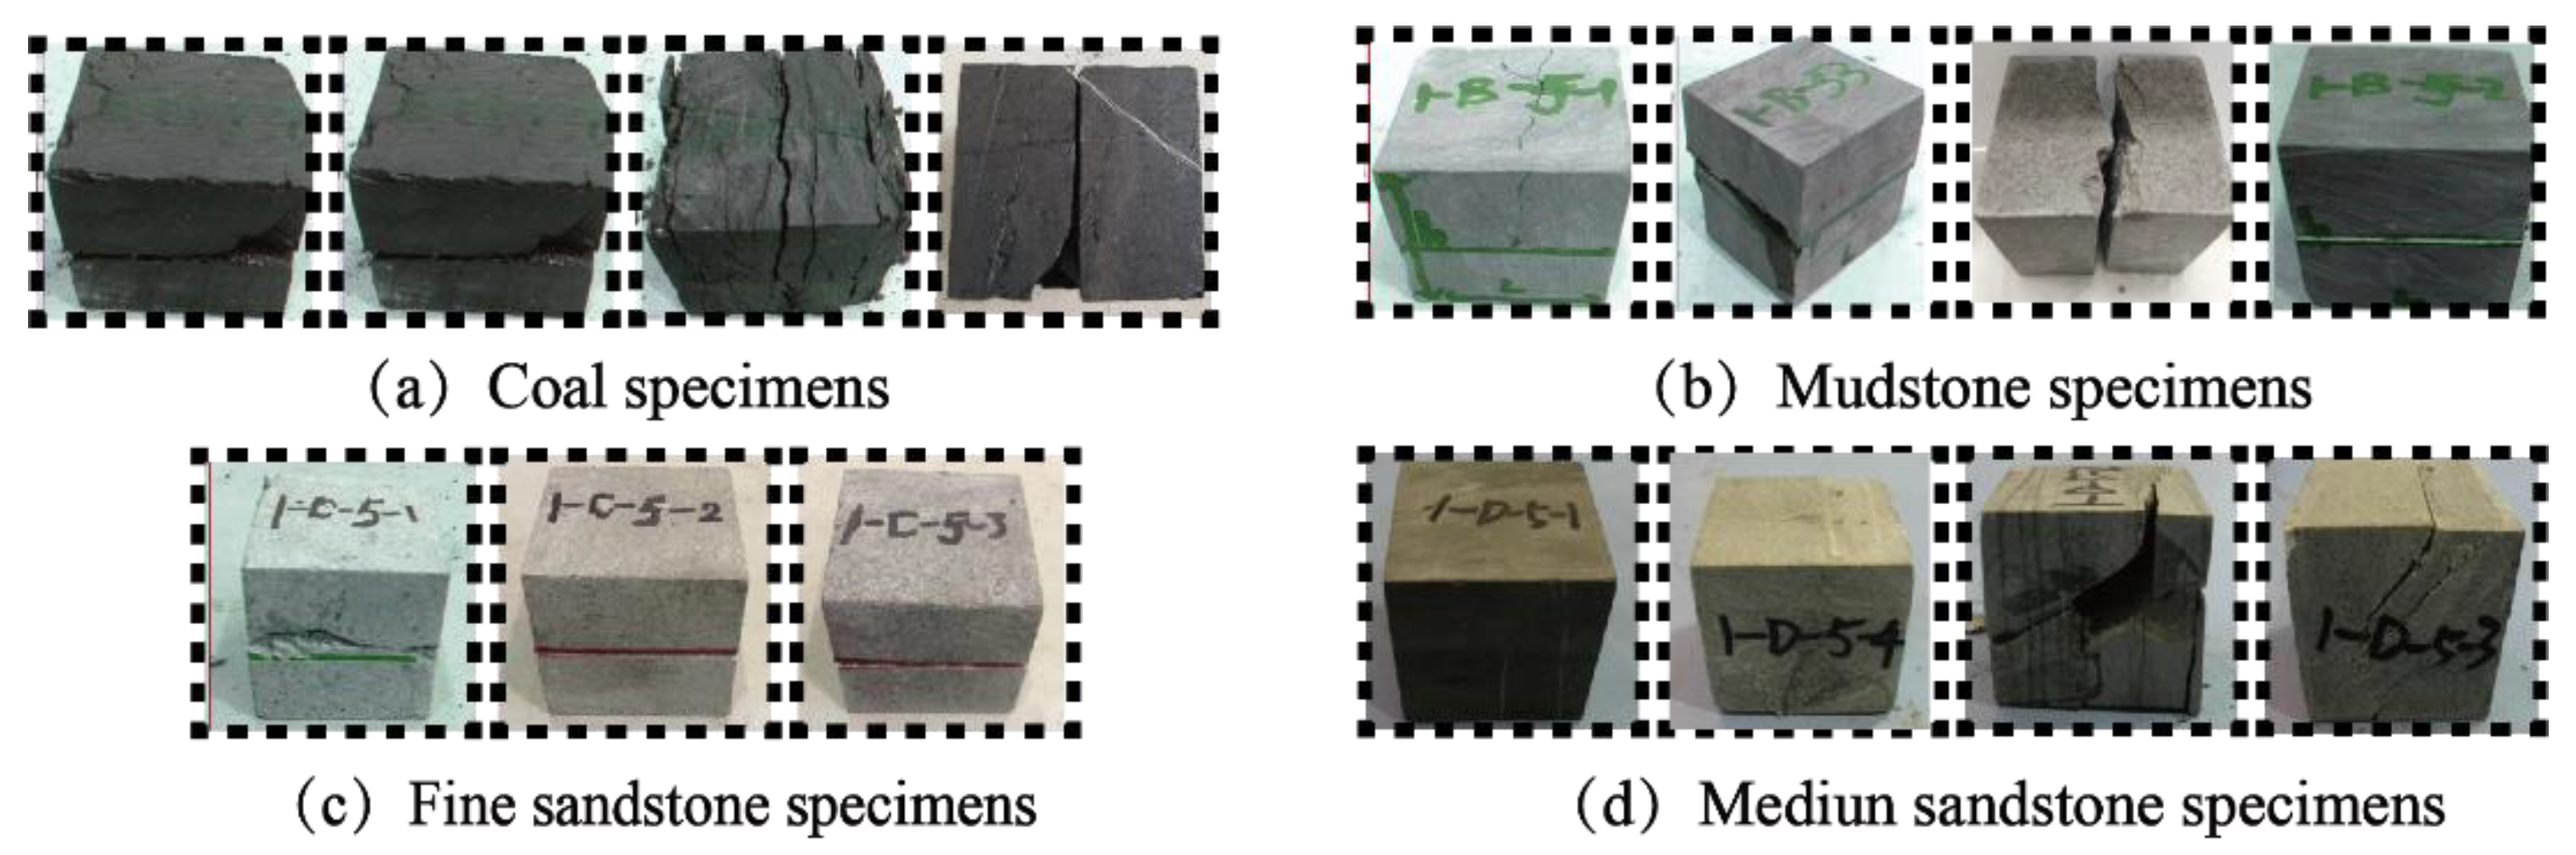
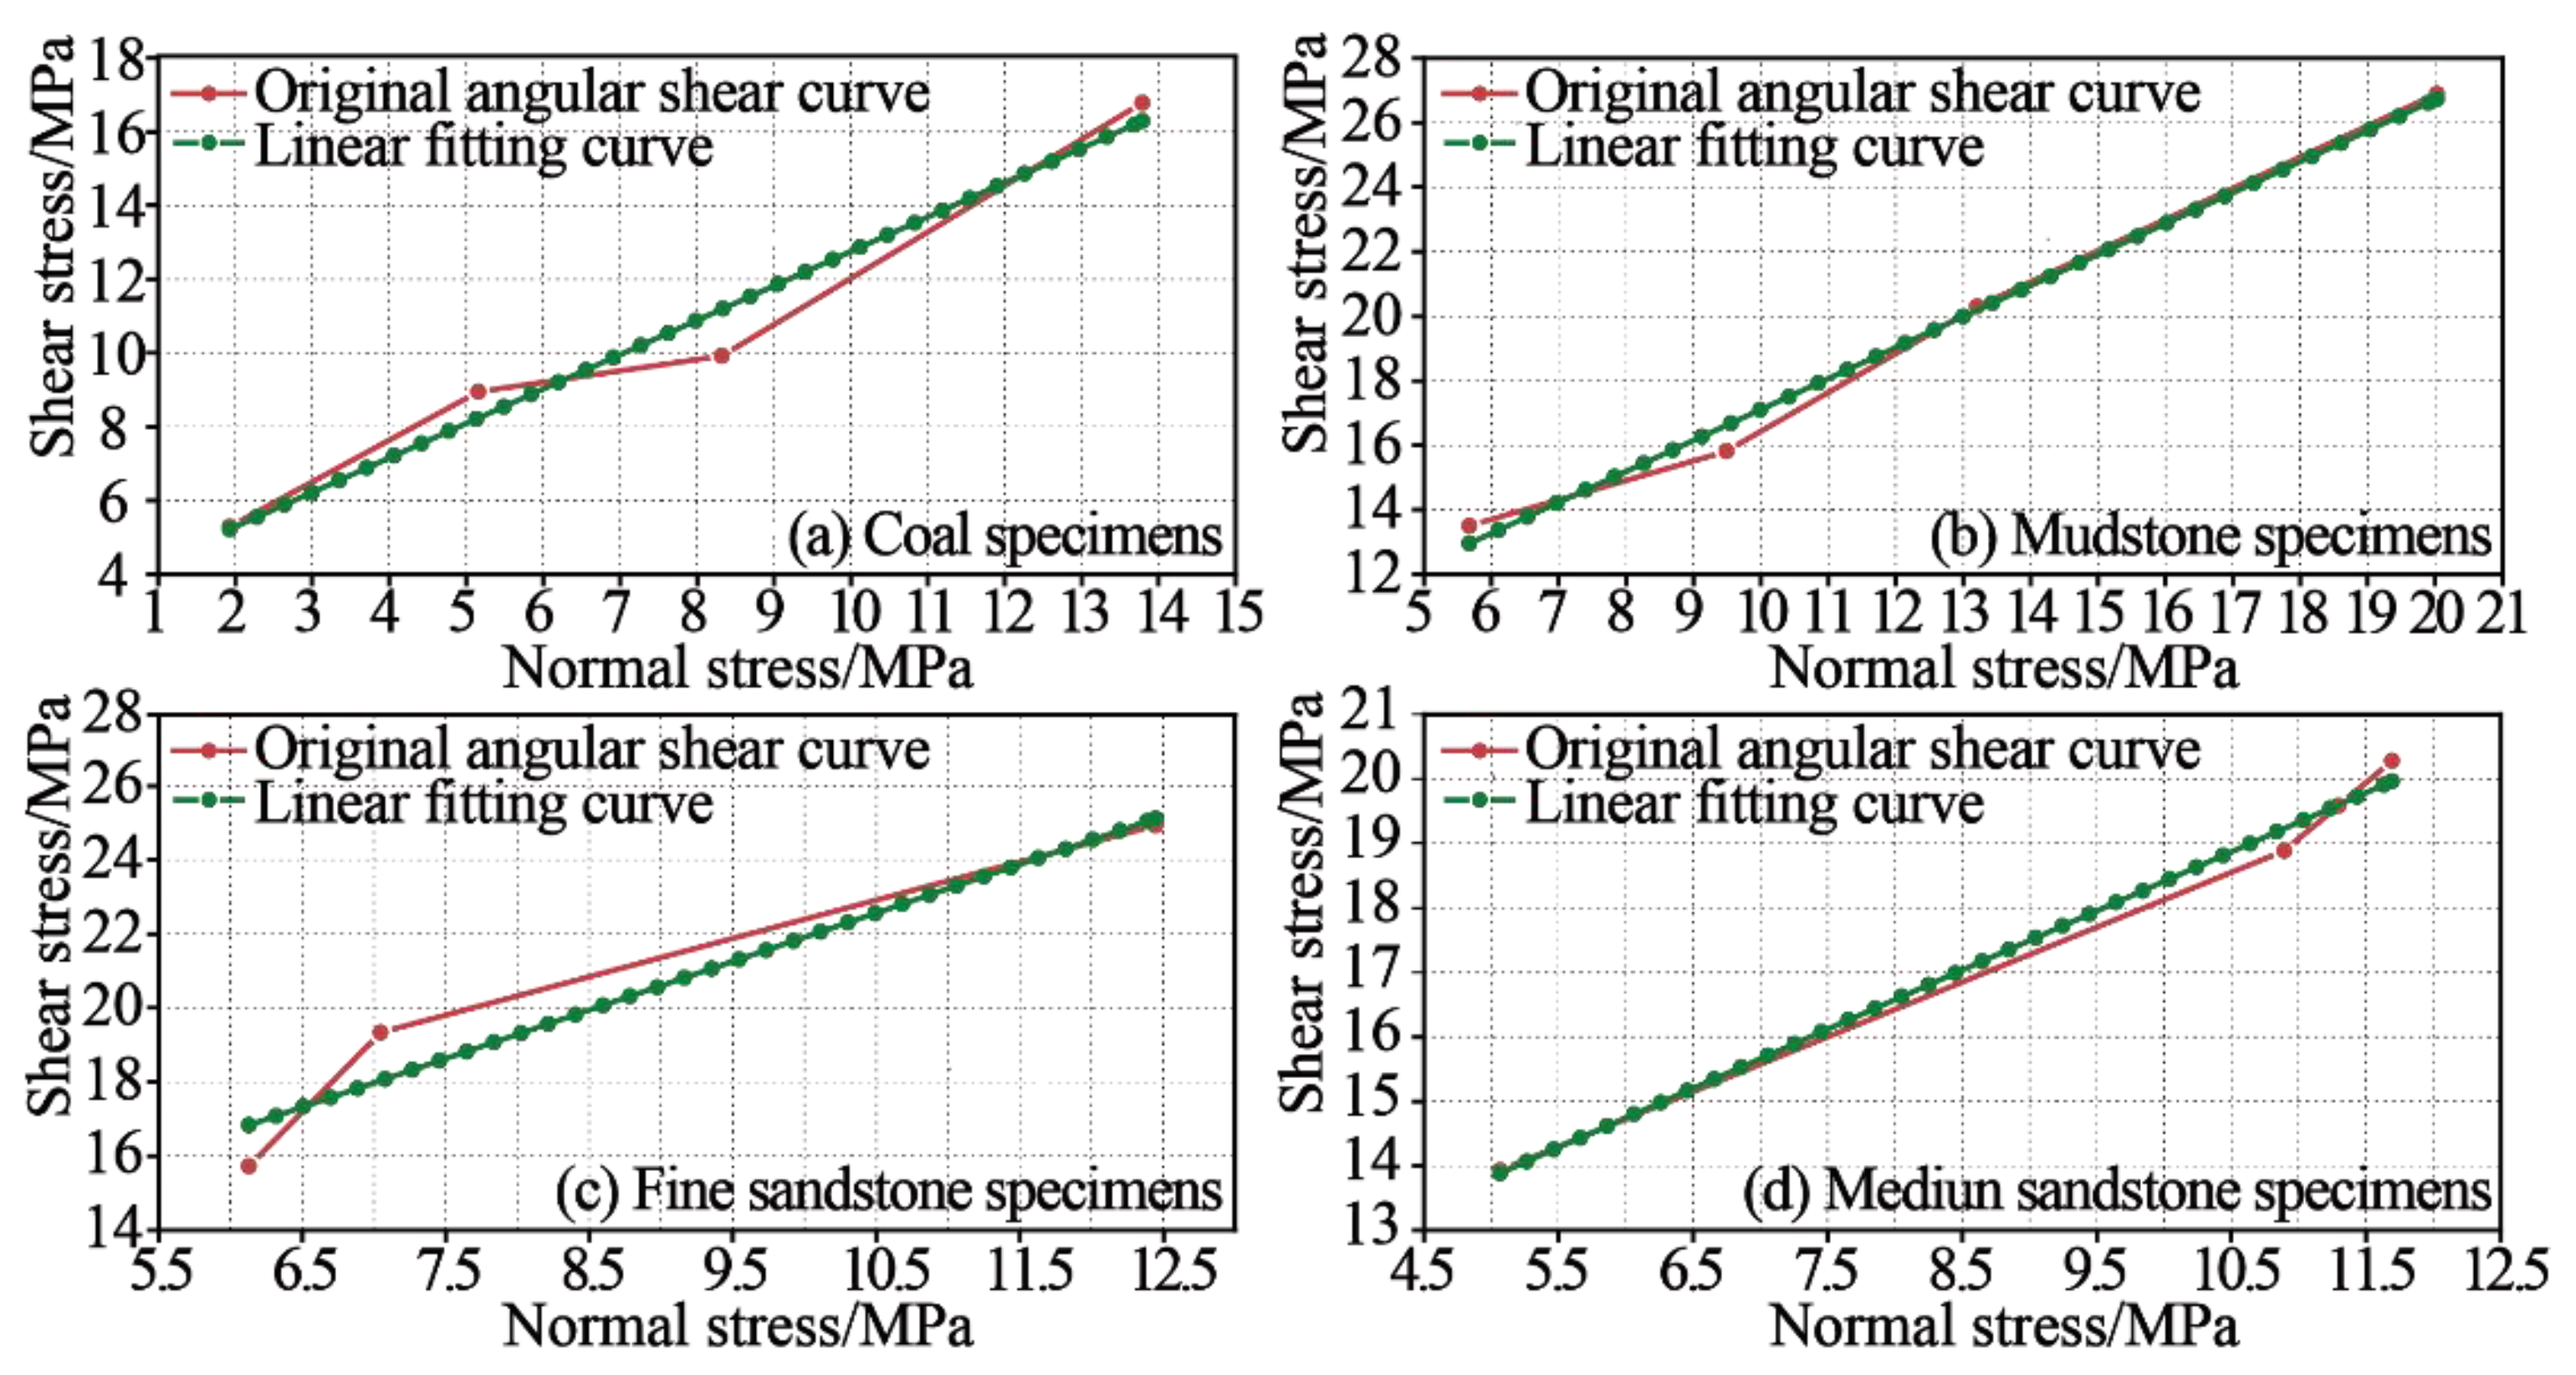
2.4. Shear Test of Rock with Variable Angle Mode

Rock shear test is an experiment to determine the friction angle and cohesion of rock. The method is simple and feasible. Variable angle shear experiment usually adopts the mold change angle of 20°, 30°, and 40°. Then, the internal friction angle and cohesion of the rock mass can be obtained by drawing shear stress and normal stress curves of the failure surface.
The WGE-600 screen display universal experiment machine was also used in this experiment (as shown in Figure 3). Three sets of fixtures (20°, 30°, 40°) were used for variable angle shear specimen, as shown in Figure 4. Among them were the first group of four samples (mudstone), the second group of four samples (coal rock), the third group of three samples (fine sandstone). For the four groups of four samples (medium sandstone), shear strength calculation formula is as follows in Equation (1):
σ = P sin α / A       τ = P cos α / A

3. Results

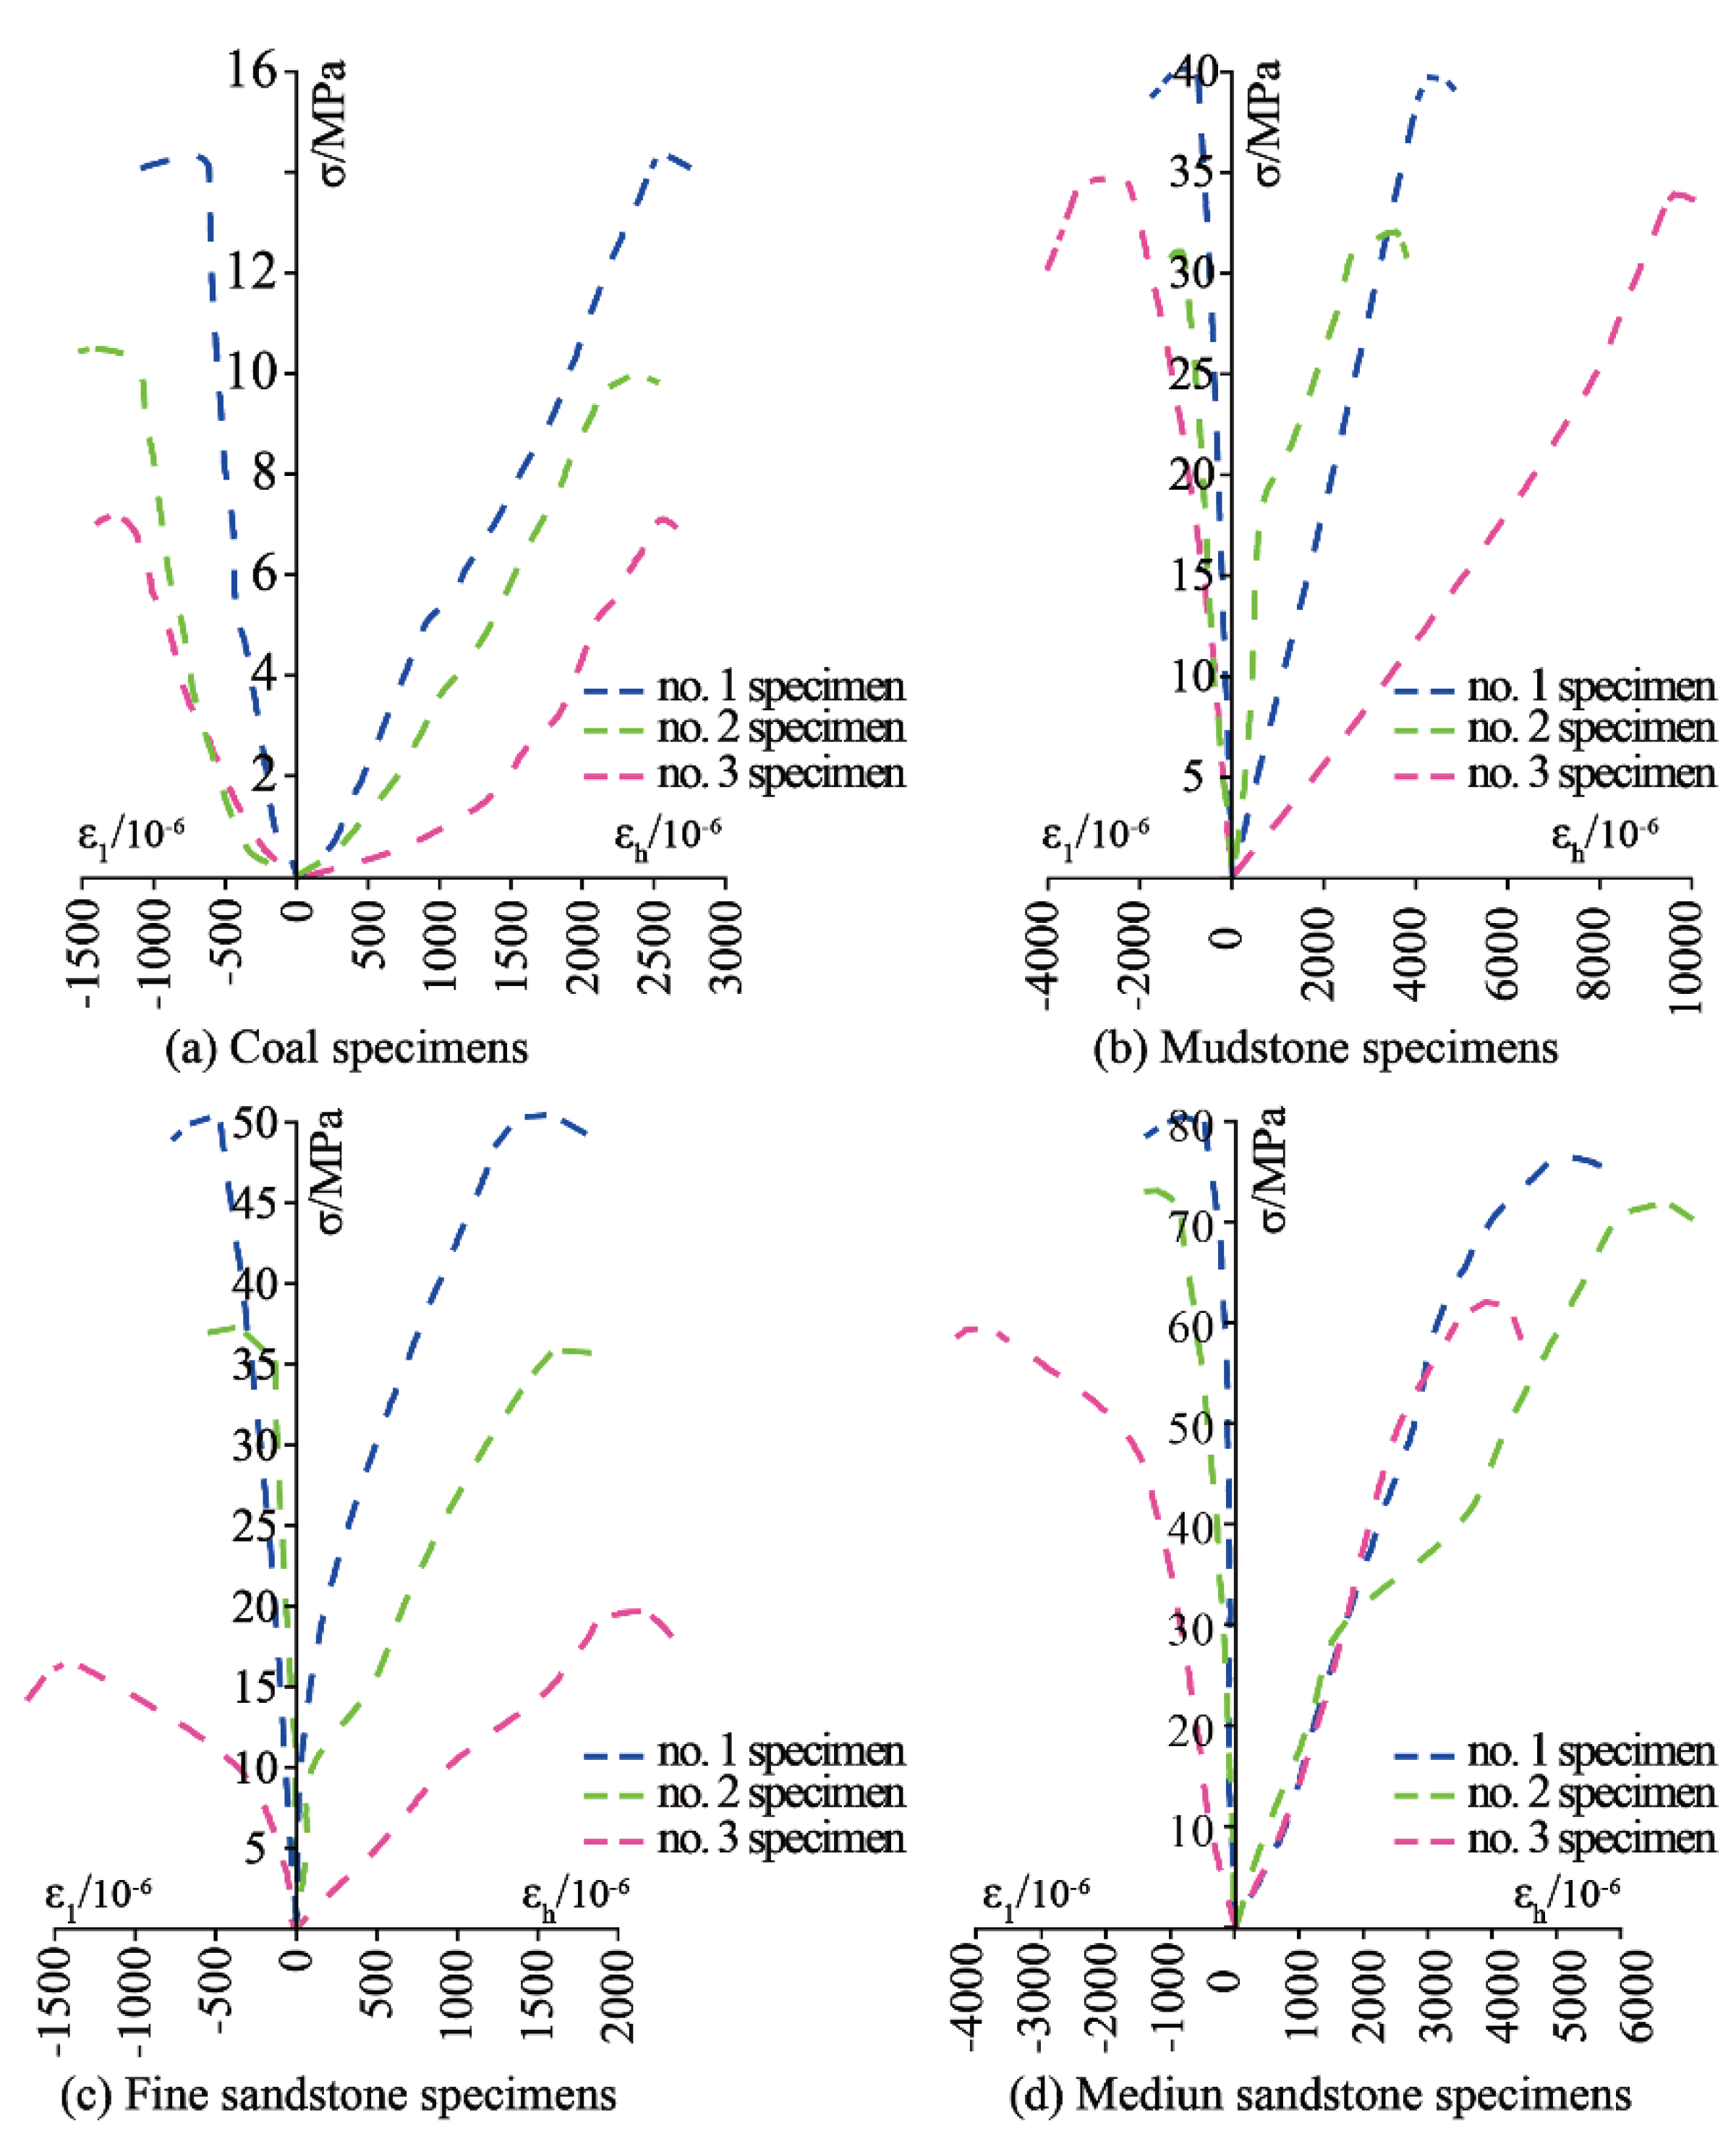
3.1. Analysis of Uniaxial Compressive Strength of Rock Mass

Figure 5 shows the stress–strain curve characteristics of the specimen under uniaxial experiment. According to the experiment, under uniaxial pressure, the strength of medium sandstone is higher, followed by fine sandstone; mudstone is slightly lower than fine sandstone, and coal rock has the lowest strength. According to the experimental data, the uniaxial compressive strength of medium sandstone, fine sandstone, mudstone, and coal rock can reach 80 MPa, 50 MPa, 40 MPa, and 14 MPa, respectively.
Figure 6 is the failure condition of rock sample according to the failure surface of the rock sample. It can be observed that the middle sandstone and fine sandstone mainly present shear failure under uniaxial compression. Figure 6(d-2,c-3) are typical representatives of shear failure, respectively. Some specimens also show tensile failure, but from the point of view of the failure strength of rock, rock mainly bears shear failure, and shear failure strength is also high.
Under uniaxial compression, mudstone and coal rock mainly exhibit splitting failure. Figure 6(b-1,a-1) are the typical representatives of splitting failure, respectively. There are also specimens showing shear failure, but in terms of the failure strength of rock, the rock is mainly subjected to splitting failure, and the shear failure strength is relatively low.

3.2. Analysis of Shear Test Results of Rock with Variable Angle Mode

According to the experimental data (Figure 7 and Figure 8), the relationship between normal stress and shear stress is linearly fitted, and the fitting results are as follows in Equation (2).
{ τ = 0.96 σ + 7.51 ( a ) τ = 0.93 σ + 3.42 ( b ) τ = 0.91 σ + 10.79 ( c ) τ = 0.92 σ + 9.24 ( d )
According to the experimental results and the fitted equation, it can be concluded that the cohesion of mudstone is 7.51 MPa and the internal friction angle is 43.3°, the cohesion of coal rock is 3.42 MPa and the internal friction angle is 40.6°, the cohesion of fine sandstone is 10.8 MPa and the internal friction angle is 30.73°, and the cohesion of medium sandstone is 9.24 MPa. The internal friction angle is 38.74°.

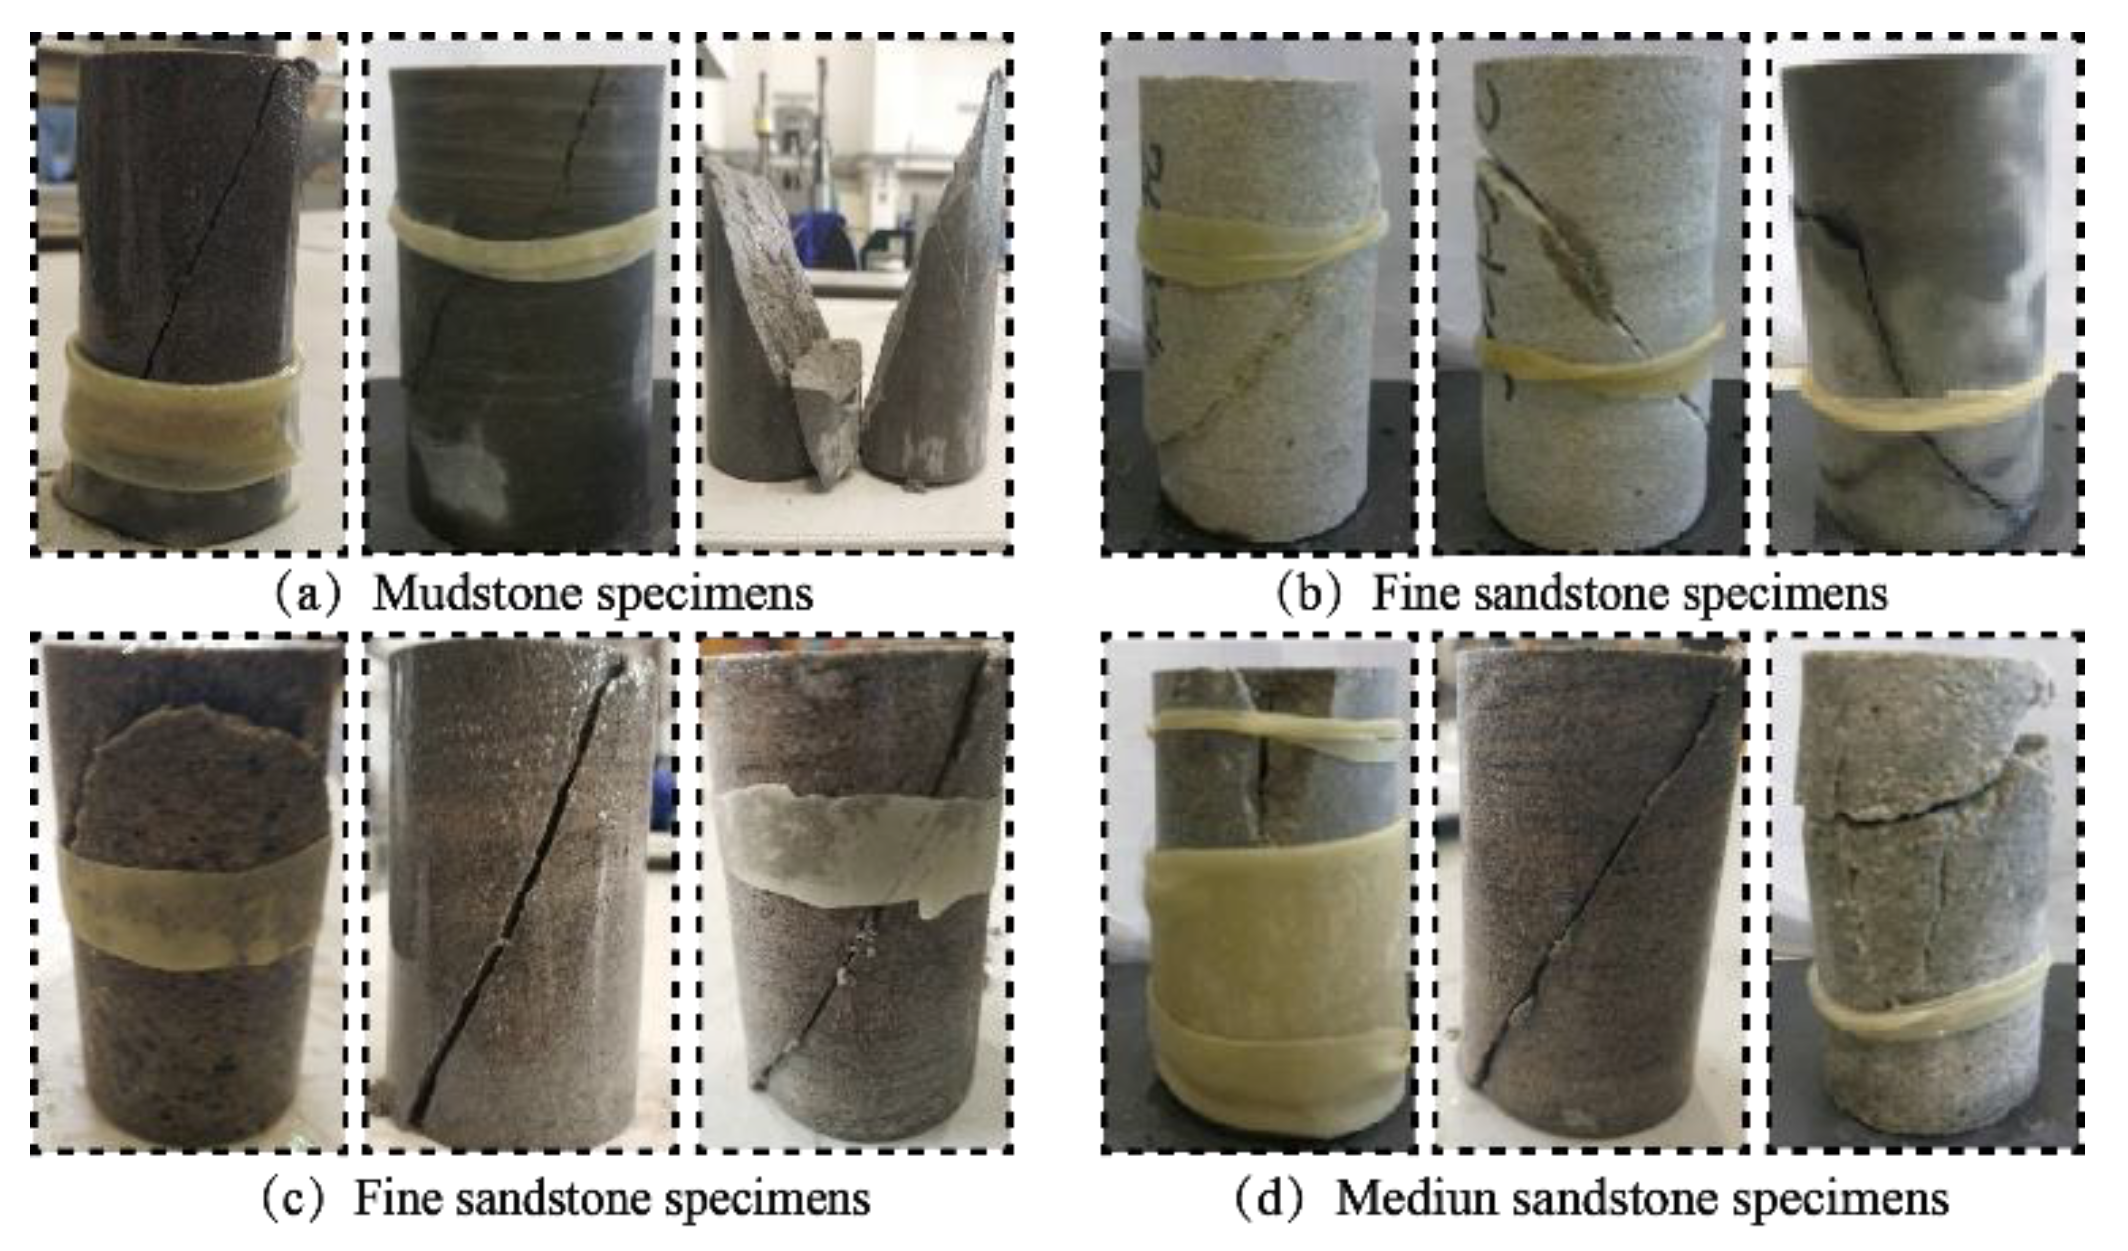
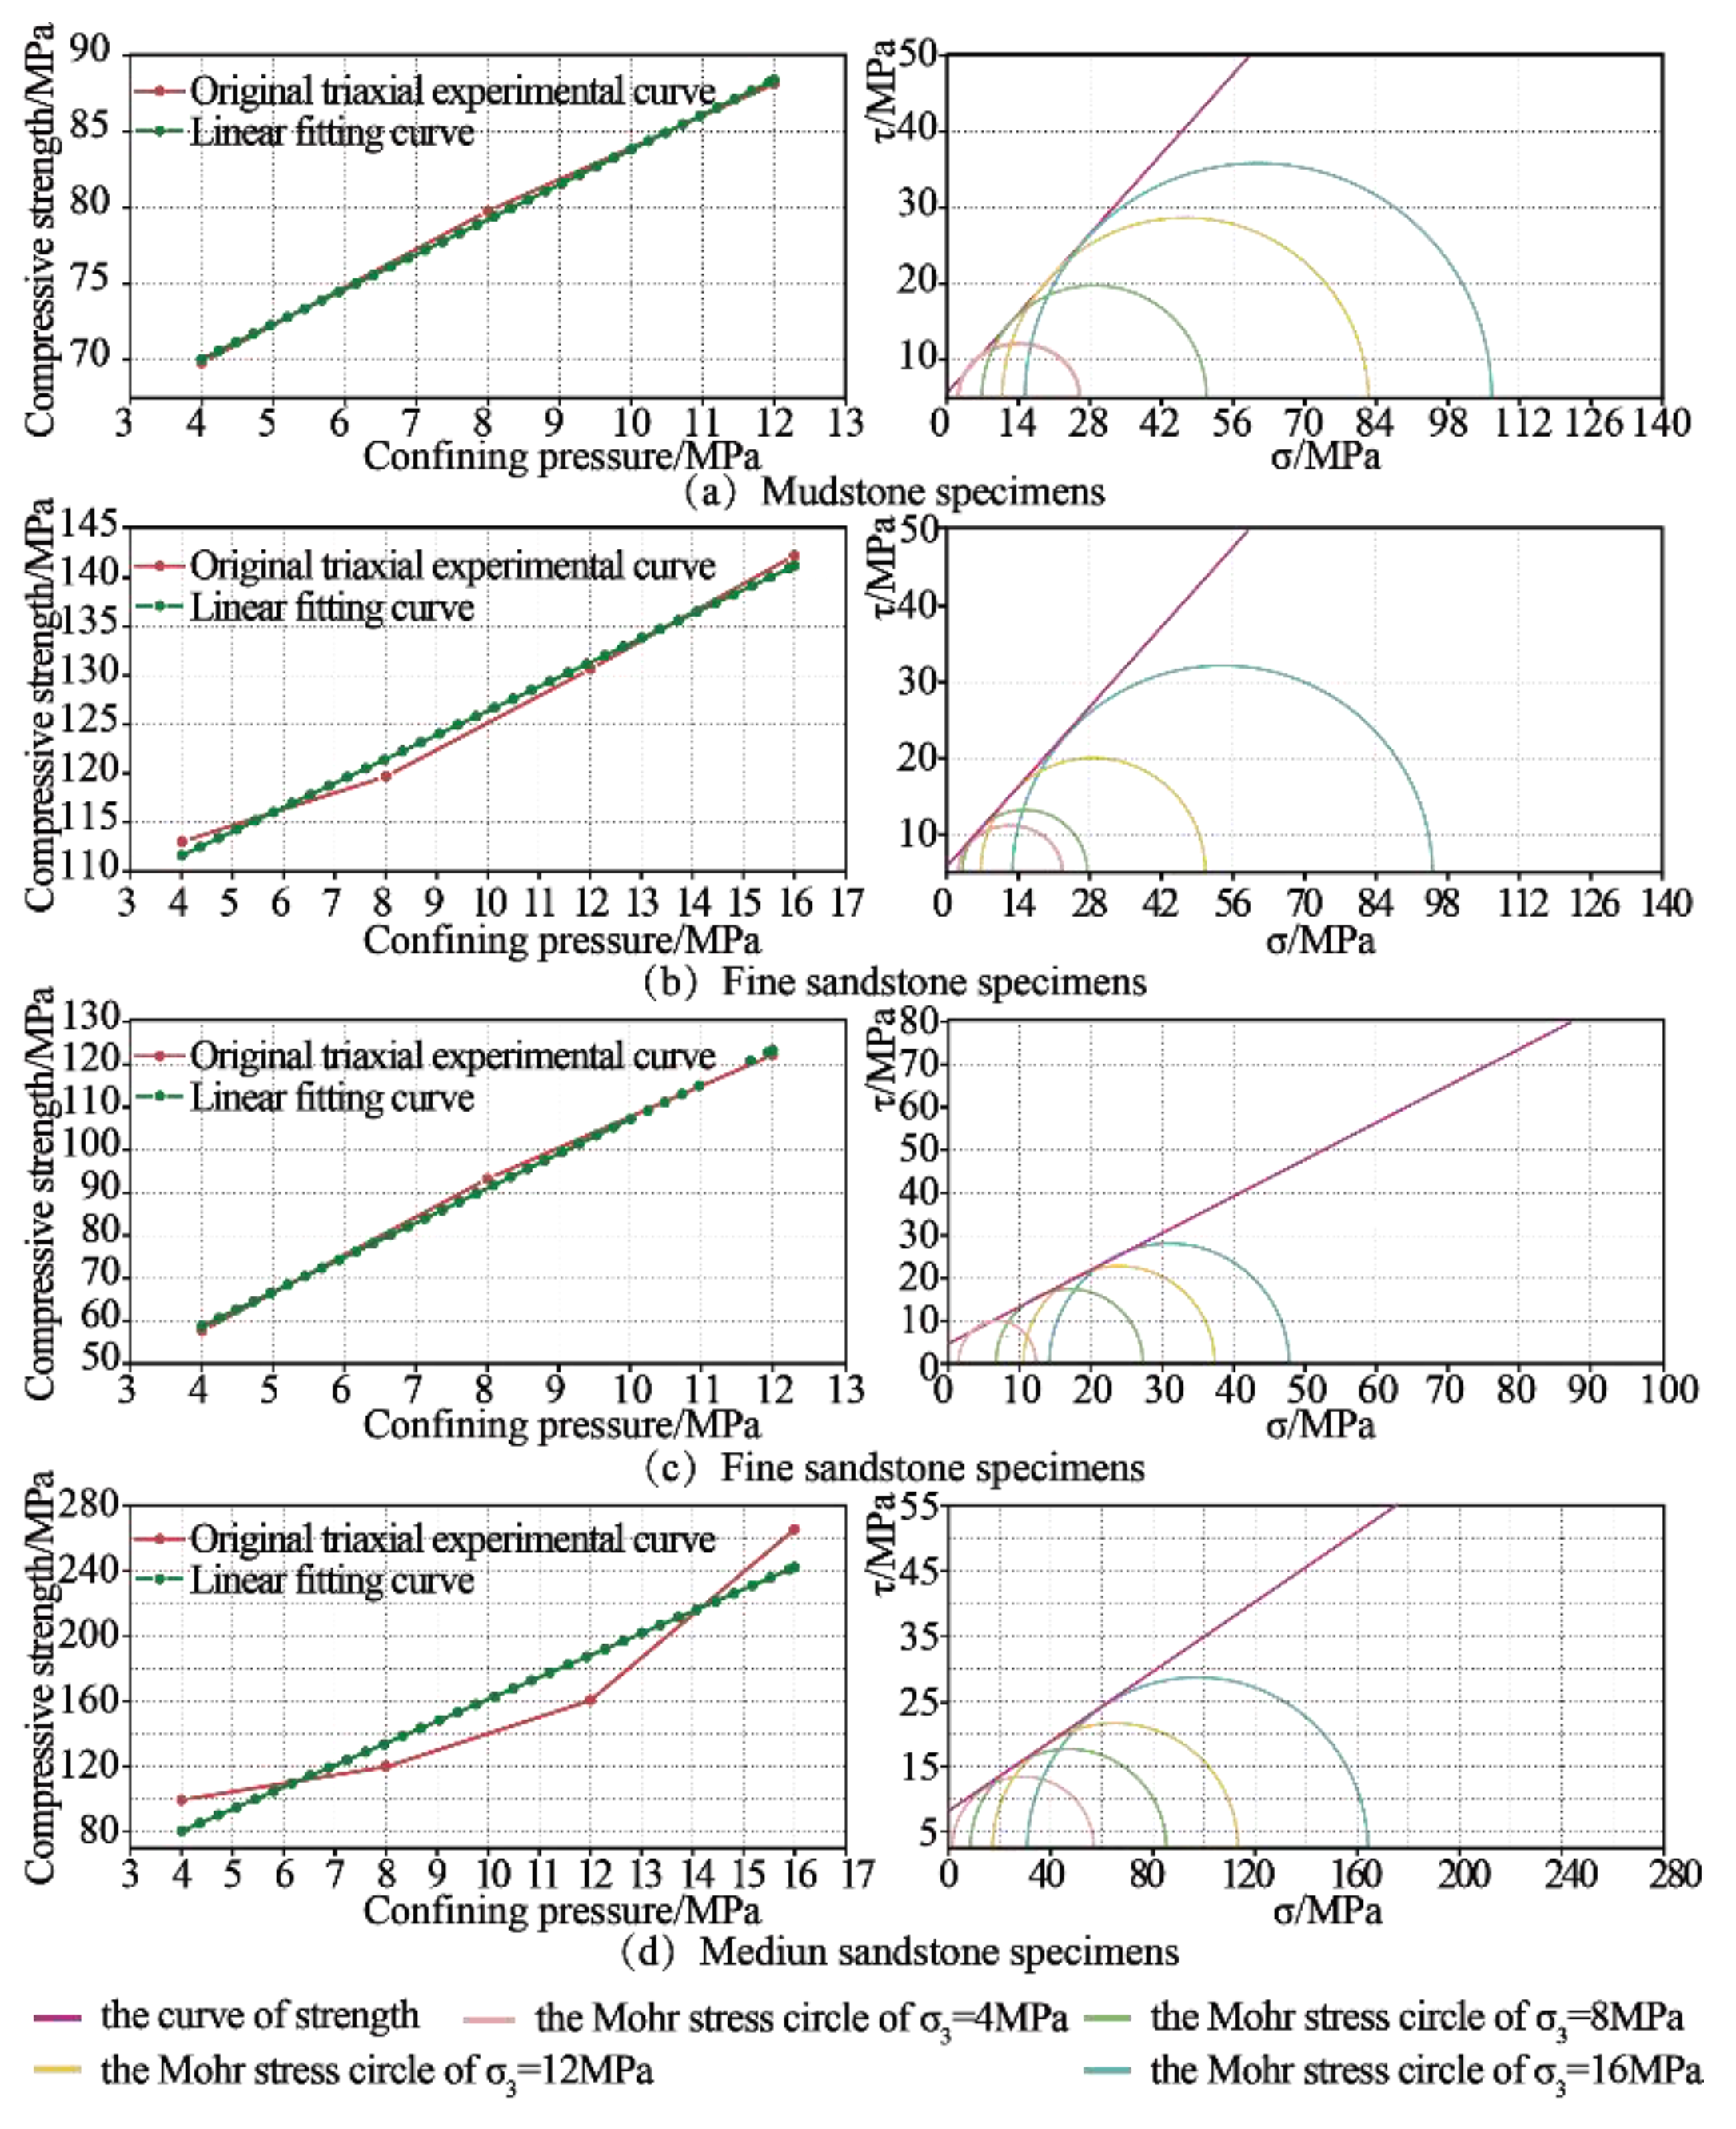
3.3. Rock Mass Mechanical Response under Conventional Triaxial Loading Test

According to the experimental scheme, medium sandstone, mudstone, and fine sandstone were selected for rock triaxial experiment, designed as 0, 4, 8, 12, and 16 MPa, respectively.
According to the triaxial test, the cohesion and internal friction angle of rock mass can be obtained, and the variable angle shear test can also obtain the cohesion and internal friction angle of rock mass. In addition to obtaining some physical and mechanical parameters of rock mass, the triaxial test of rock mass was conducted to analyze the stress–strain curve characteristics of rock mass under triaxial stress environment (as shown in Figure 9). By sorting out the triaxial test results, the relationship between confining pressure and rock compressive strength can be obtained, and linear fitting can be carried out. The fitting results and the axial compressive strength of rock mass are as follows in Equation (3):
σ 1 = P max / A
The relationship between axial pressure and confining pressure can be expressed as follows in Equation (4):
σ 1 = σ 0 + k σ 3
Cohesion and internal friction angle can be expressed as in Equations (5) and (6), as follows:
c = σ c ( 1 sin φ ) 2 cos φ , φ = arcsin k 1 k + 1
{ σ 1 = 4.6 σ 3 + 45.6 ( R 2 = 0.86 ) ( a ) σ 1 = 2.5 σ 3 + 101.7 ( R 2 = 0.98 ) ( b ) σ 1 = 8.3 σ 3 + 23.9 ( R 2 = 0.99 ) ( c ) σ 1 = 5.85 σ 3 + 17 ( R 2 = 0.90 ) ( d )

3.4. Analysis of Rock Mass Fracture Characteristics

When rocks deal with complex stress conditions, their failure mainly presents as shear failure. In this study, the uniaxial test and triaxial test of rock mass were compared and analyzed. In the case of uniaxial compression, rock mass is generally shear failure, and there is a certain tensile failure phenomenon. However, in the case of confining pressure, the failure of rock mass is generally shear failure, and tensile failure rarely occurs. This is because the confining pressure constrains the transverse deformation of rock mass objectively.
The failure form or trace of rock mass is an important method to analyze the confining pressure failure mechanism. Taking the rock mass failure sample of fine sandstone (Figure 10) and stress–strain characteristic curve (Figure 11) as an example, the fracture trace of rock mass under uniaxial compression and triaxial confining pressure is analyzed and the fracture state of rock mass is analyzed.
On the other hand, it can be seen from Figure 12 that, under confining pressure, fine sandstone develops from multiple fractures at the beginning to a single fracture surface, which is manifested as compression shear failure of a single fracture surface. In general, with the increase of confining pressure, the angle of the fracture surface gradually becomes larger. When the confining pressure is 12 MPa, the angle of the fracture surface is about 80°, which significantly increases. From the analysis of the characteristics of the section, the fault surface of the fine sandstone with low confining pressure is relatively smooth. With the increase of confining pressure, the fault surface is more and more coarse, and the local expansion phenomenon is serious, indicating that under the condition of confining pressure, the confining pressure seriously restricts the transverse deformation of the rock, but, in general, the axial deformation of the fine sandstone is more serious.

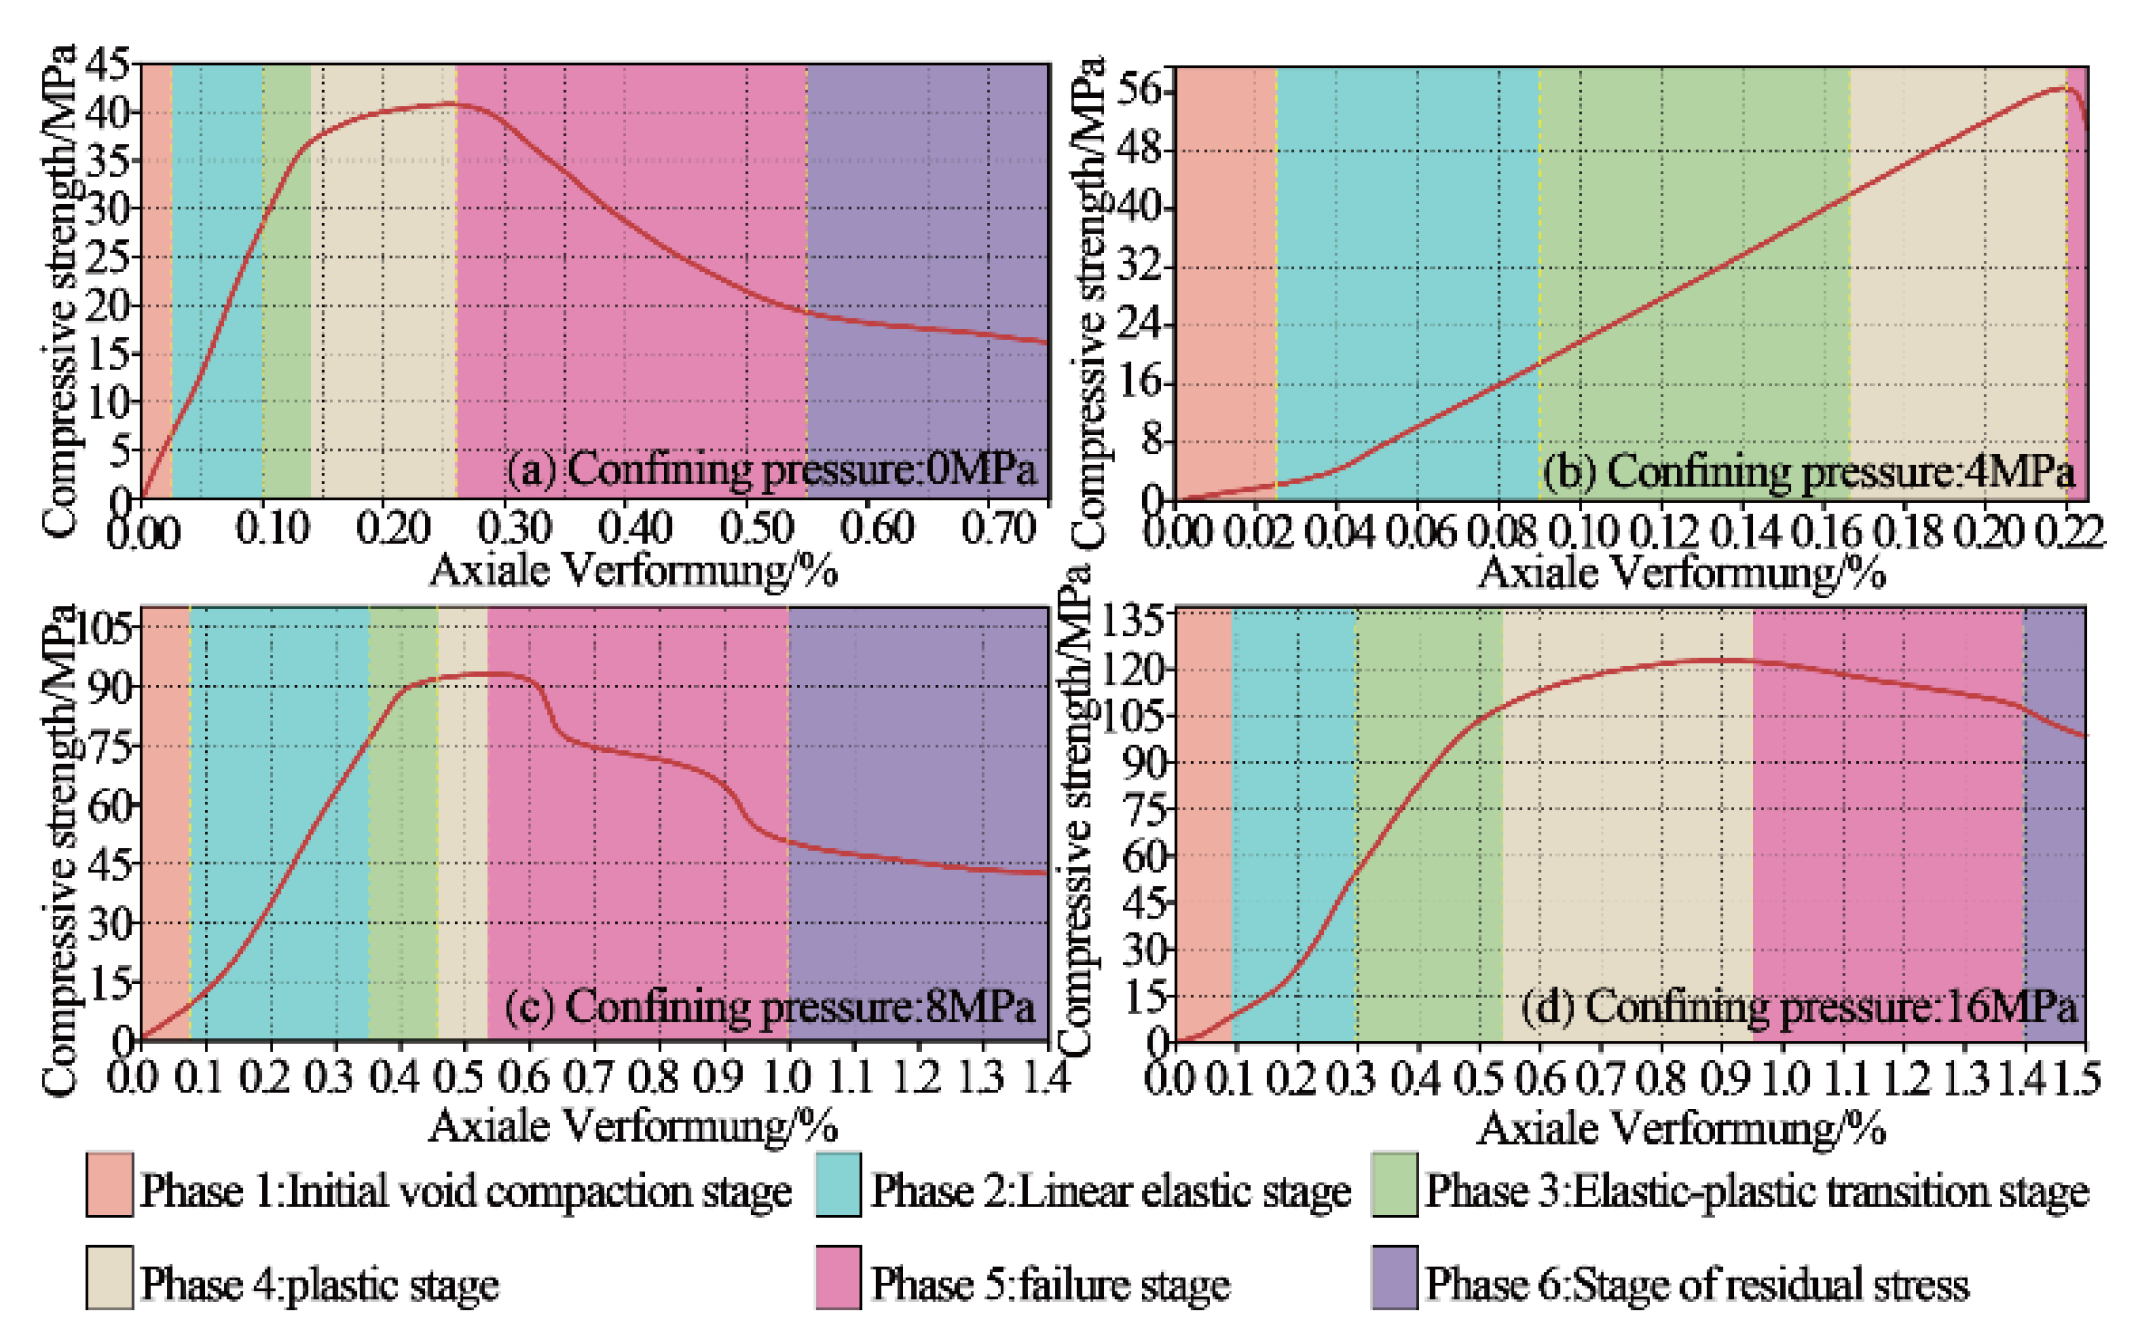
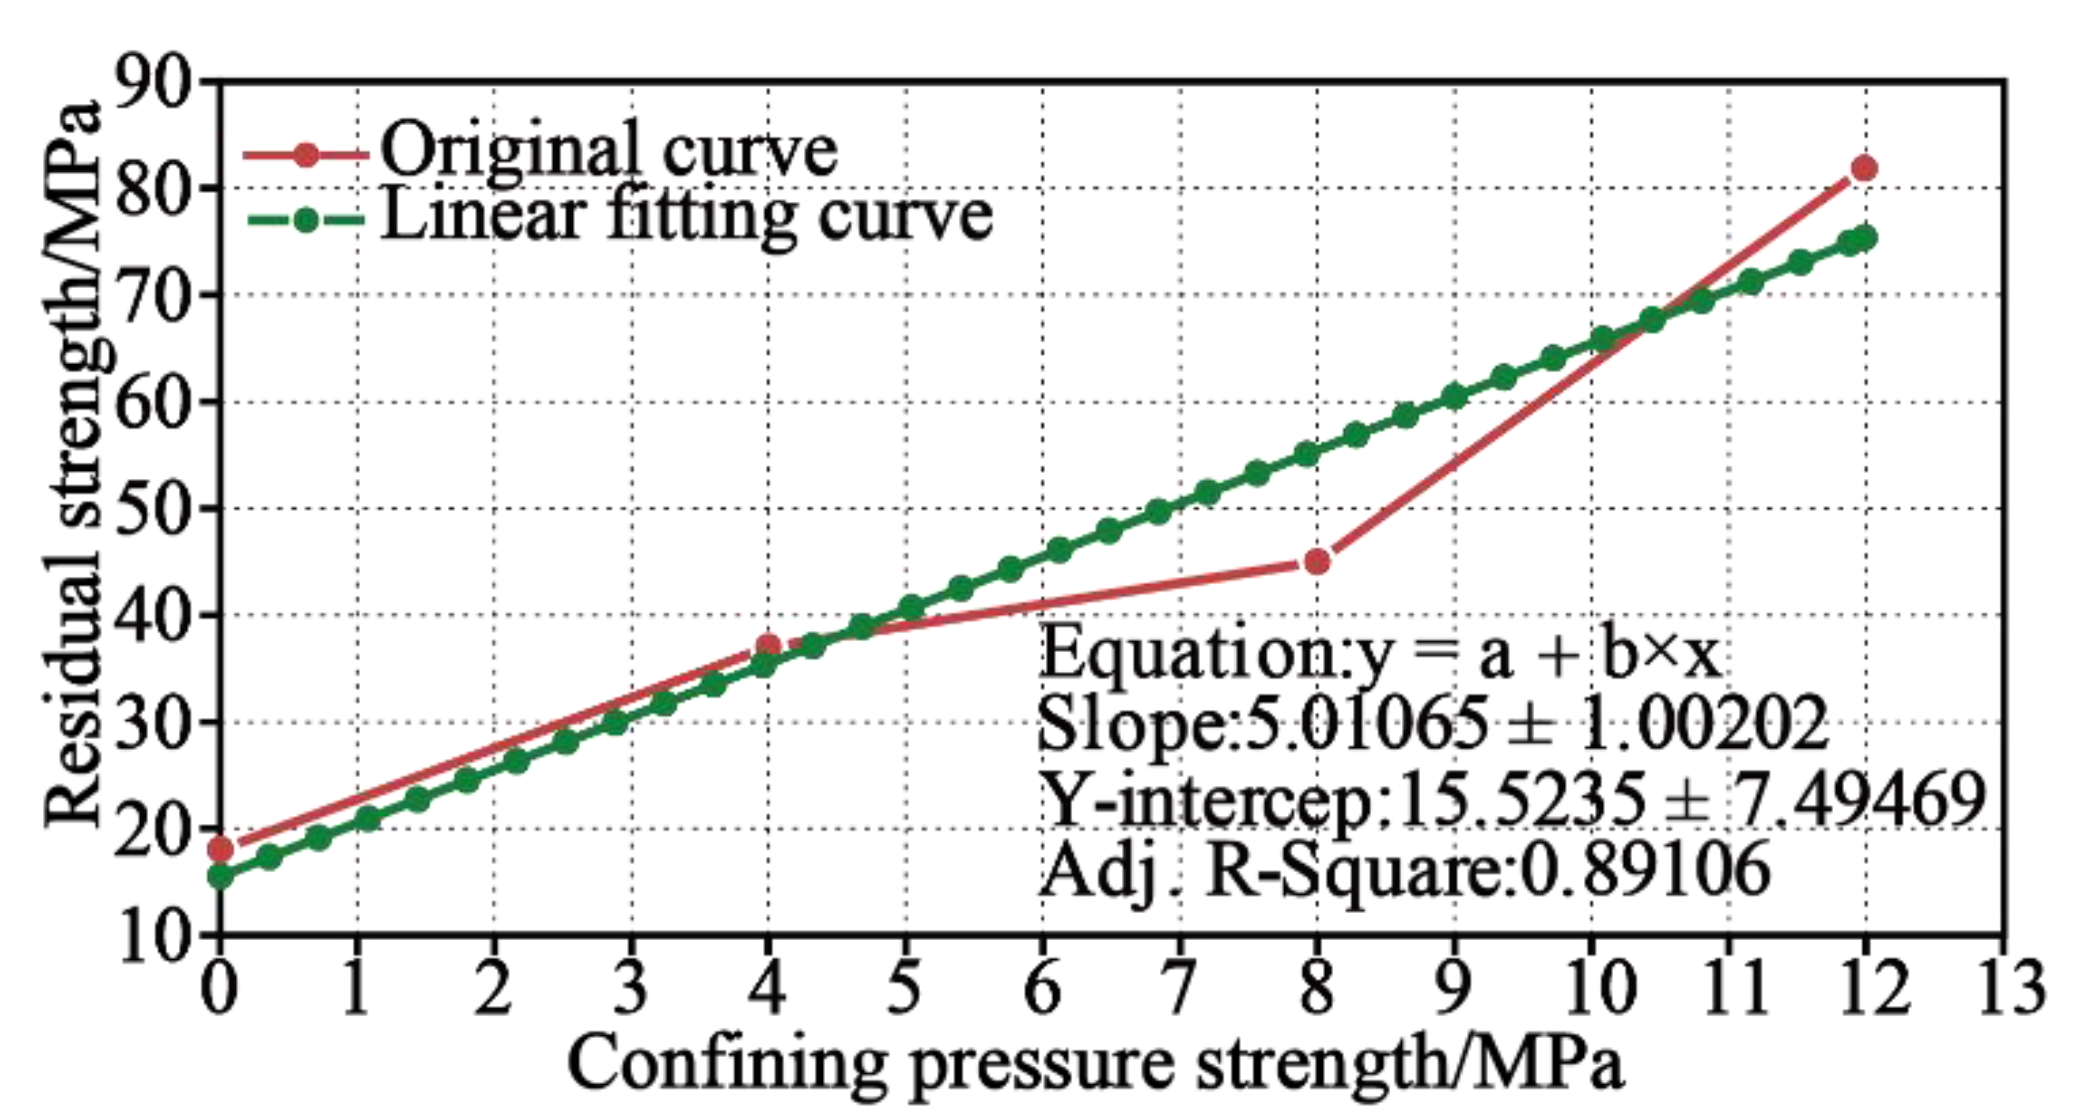
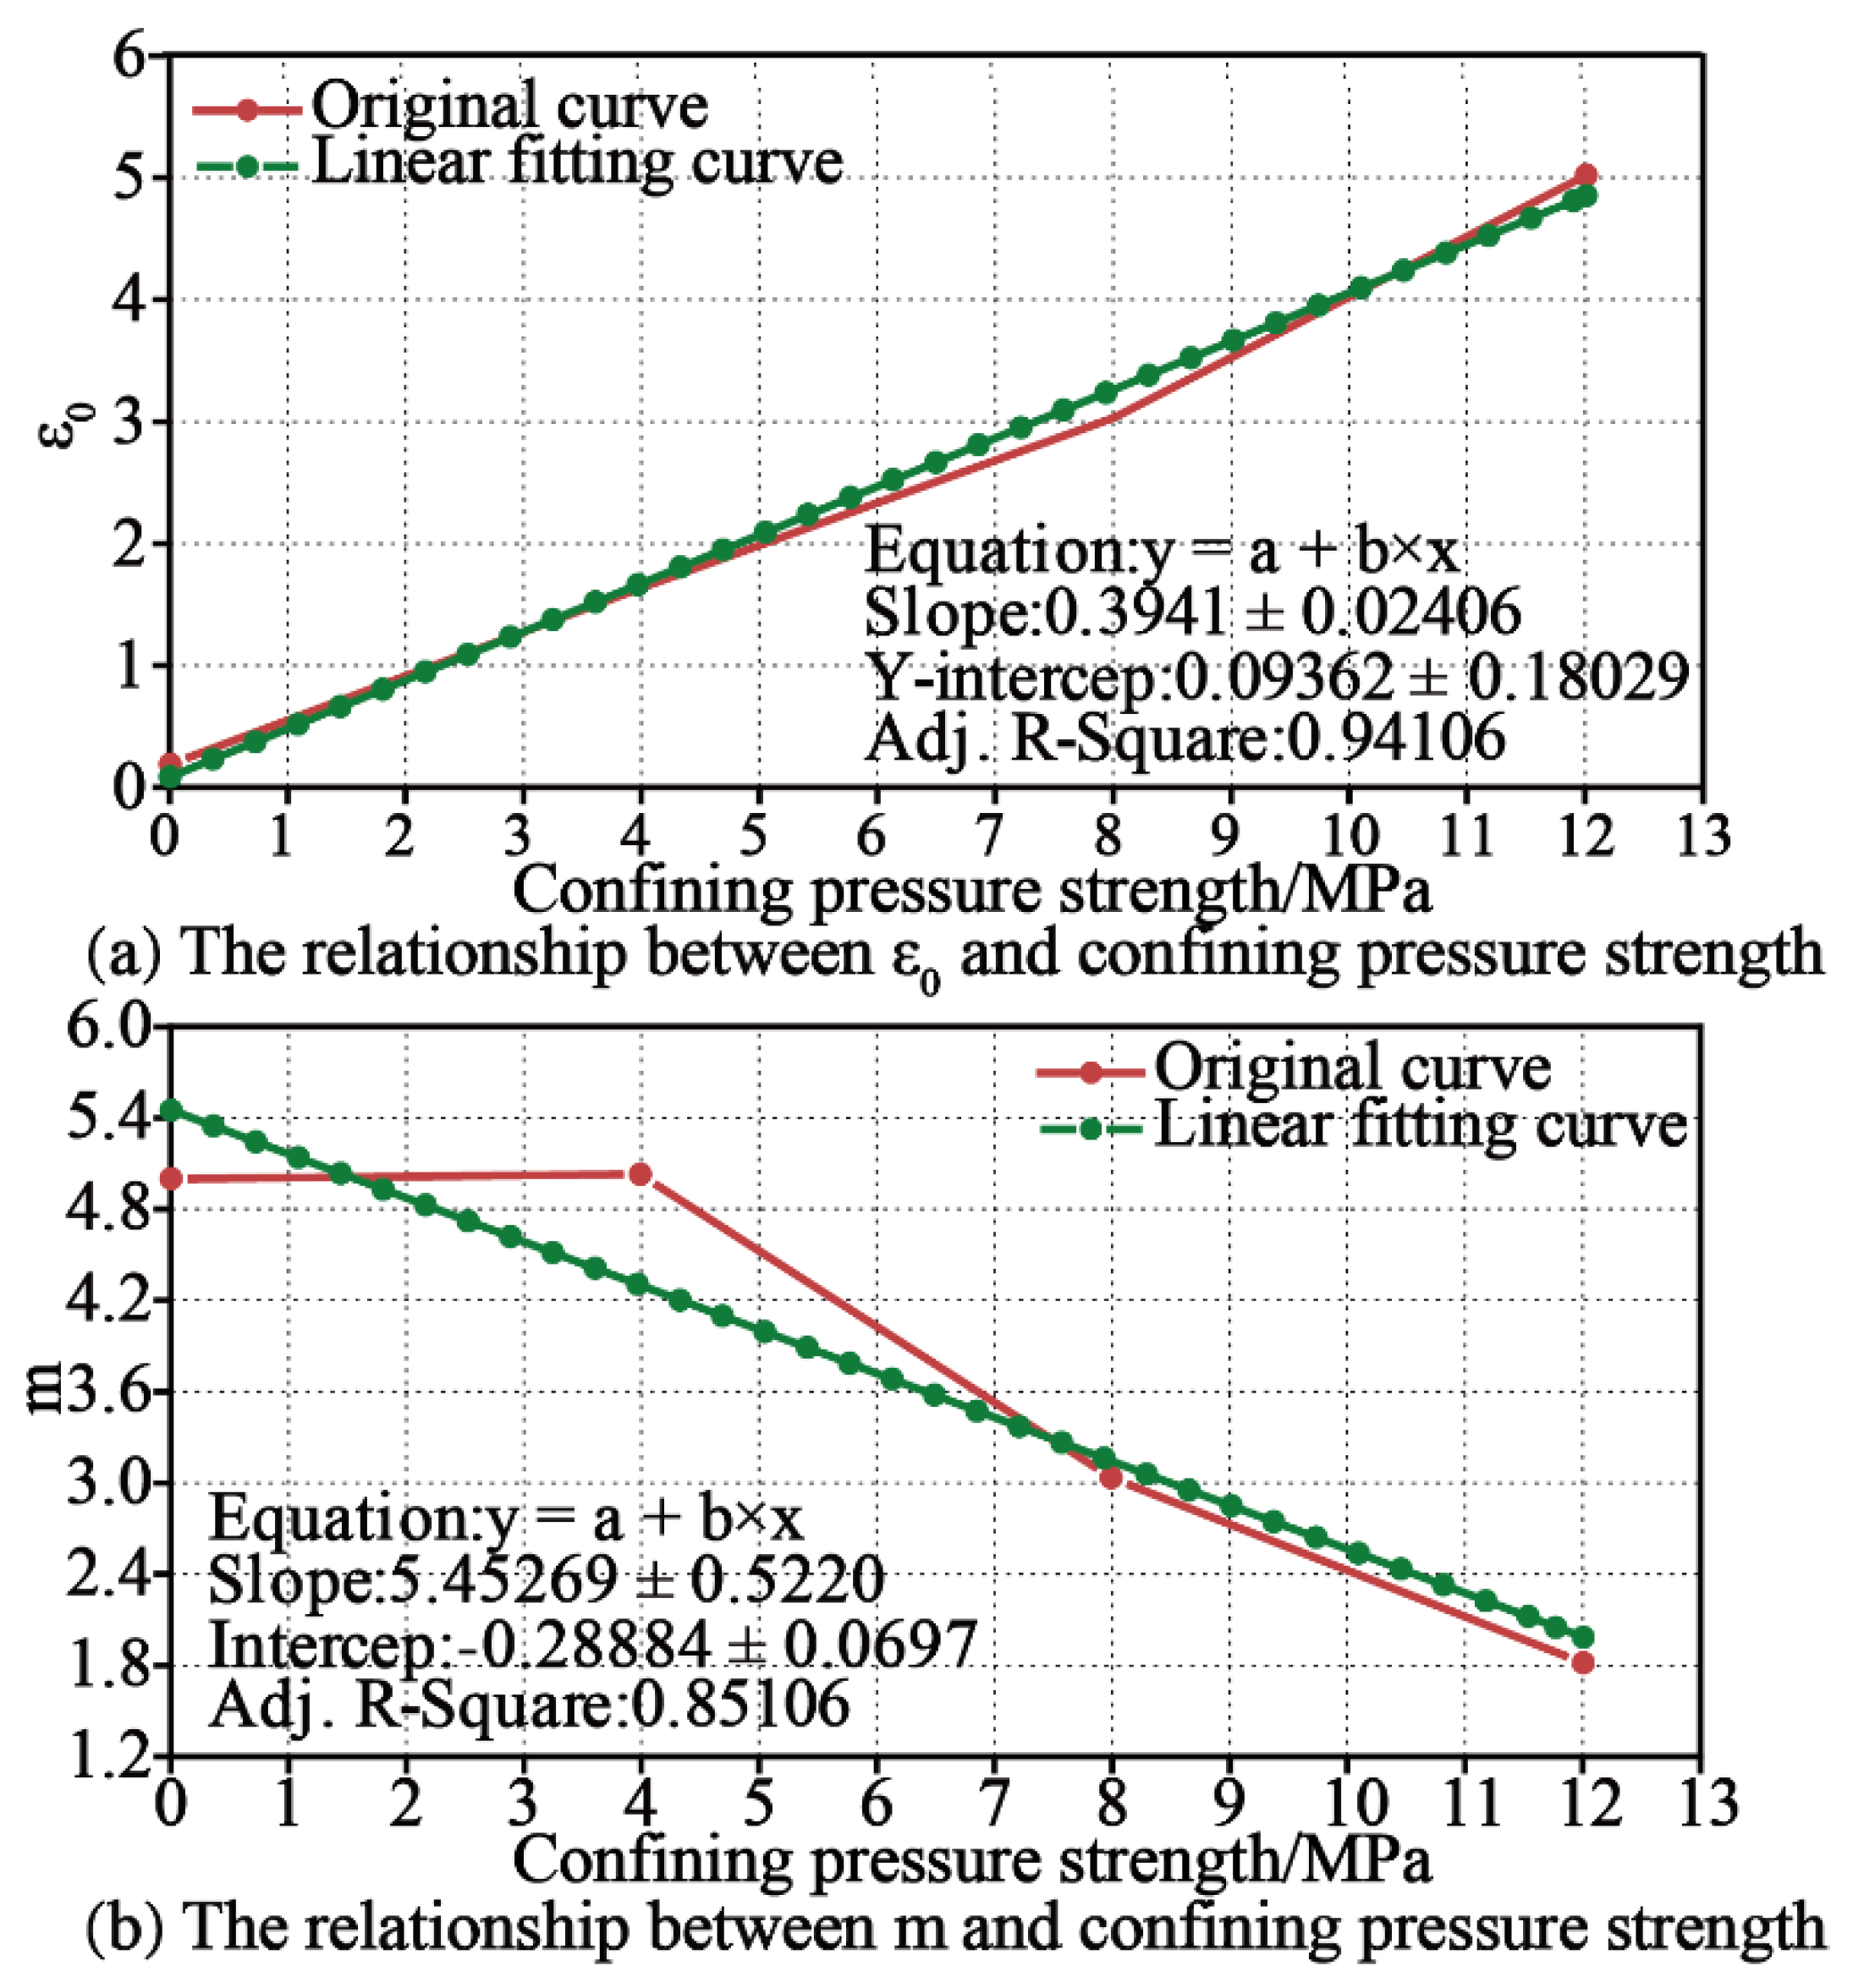
3.5. Stress and Strain Evolution of Rock Mass under Triaxial Stress

According to the indoor triaxial experiment, the characteristics of the total stress–strain curves of fine sandstone under confining pressure can be obtained. We aim to summarize the evolution law of these curves and better reflect the characteristics of rock stress and strain under actual conditions. In this study, statistical damage mechanics were used to quantitatively describe the damage and failure of fine sandstone. In the experimental process, it is assumed that the strength of each micro-element in fine sandstone follows Weibull distribution, and the damage and failure process is continuous. The distribution density function of micro-element strength in fine sand rock mass can be obtained as follows in Equations (7) and (8):
( ε ) = m ε 0 ( ε ε 0 ) m 1 exp [ ( ε ε 0 ) m ]
D = S S m = 0 ε ( ε ) d ε = 1 exp [ ( ε ε 0 ) m ]
Then, at the elastic stage of fine sandstone, the stress–strain curve of fine sandstone can be expressed by the following, Equation (9):
{ σ 1 = ( λ + 2 G ) ε 1 + λ ε 2 + λ ε 3 σ 2 = λ ε 1 + ( λ + 2 G ) ε 2 + λ ε 3 σ 3 = λ ε 1 + λ ε 2 + ( λ + 2 G ) ε 3
where σ 1 is the axial compressive strength, σ 2 and σ 3 are the confining pressures, where σ 2 = σ 3 , λ and G are the Ramet constants, and ε 1 , ε 2 , and ε 3 are the principal strains.
In the loading process of fine sandstone, the influence of hydrostatic pressure is fully considered; that is, the hydrostatic pressure is equal in the three principal stress directions during the loading process, and it is assumed that the deformation caused by hydrostatic pressure is ε s ; then, the expression of stress and strain of fine sandstone is as follows in Equation (10):
{ σ 1 = E ( ε 1 + ε s ) + v ( σ 2 + σ 3 ) σ 2 = E ( ε 2 + ε s ) + v ( σ 1 + σ 3 ) σ 3 = E ( ε 3 + ε s ) + v ( σ 1 + σ 2 )       ε 1 = ε 1 + ε s ε 2 = ε 2 + ε s ε 3 = ε 3 + ε s
In the triaxial experiment of fine sandstone, it is assumed that fine sandstone is continuous, medium, and isotropic. Therefore, for fine sandstone with isotropic anisotropic damage, the related computation is as the following Equation (11):
ε 1 + ε s = 1 E [ σ 1 1 D v ( σ 2 1 D + σ 3 1 D ) ]
In the triaxial experiment, when the oil pressure is not loaded at the beginning of injection, the stresses in the three principal stress directions are equal. Therefore, the deformation ε s caused by hydrostatic pressure can be obtained in the following Equation (12):
σ 3 = E ε s + 2 v σ 3       ε s = σ 3 2 v σ 3 E
At the beginning of the triaxial experiment, the deformation caused by hydrostatic pressure is usually cleared before the experiment, and the data read during the experiment are ε 1 , ε 2 , and ε 3 . In this study, the deformation caused by hydrostatic pressure is fully considered in the establishment of the mechanical model. Then, the expressions of axial pressure and confining pressure received by fine sandstone can be written as follows, in Equation (13):
σ 1 = E ( ε s + ε 1 ) + 2 v σ 3       σ 1 σ 3 = E ε 1
The failure of rock mass can be expressed by a function, and the general failure formula of rock mass is used as the formula of Equation (14), where K is the parameter related to the physical mechanics of fine sandstone, including the cohesion and internal friction angle of fine sandstone.
f ( σ ) K = 0
According to the existing research results, it can be seen that the Mohr Coulomb theory is used to deal with this kind of problem. The expression between principal stresses of the Mohr Coulomb theory can be written in the following Equation (15), and the general formula of the equation can be written as the following Equation (16).
σ 1 σ 3 1 + sin φ 1 sin φ = 2 C cos φ 1 sin φ       ε = ( ε 1 + ε s ) 1 + sin φ 1 sin φ 2 v E σ 3
D = [ ( ( ε 1 + ε s ) ( 1 + sin φ 1 sin φ 2 v ) σ s E ε 0 ) m ]
When fine sandstone is in the elastic stage, it can be considered that fine sandstone has no damage and D = 0:
D = 0 , ε 1 + ε s ( 1 + sin φ 1 sin φ 2 v ) σ 3 E
D = 1 exp [ ( ( ε 1 + ε s ) E ( 1 + sin φ 1 sin φ 2 v ) σ 3 E ε 0 ) m ]
When the failure of fine sandstone occurs, D ≠ 0, the stress–strain equation can be written into the following equation to express the failure degree of fine sandstone, and the relationship between stress and strain can also be obtained by Equation (23).
ε 1 + ε 0 s ( 1 + sin φ 1 sin φ 2 v ) σ 3 E
σ 1 σ 3 = E ε 1 exp [ ( ( ε 1 + ε s ) E ( 1 + sin φ 1 sin φ 2 v ) σ 3 E ε 0 ) m ] d a j i a
σ 1 = E ε 1 exp [ ( ( ε 1 + ε s ) E ( 1 + sin φ 1 sin φ 2 v ) σ 3 E ε 0 ) m ] + σ 3
ε u = ( 1 + sin φ 1 sin φ 2 v ) σ 3 E
σ 1 = E ε 1 exp [ ( ( ε 1 + σ 3 2 v σ 3 E ) E ( 1 + sin φ 1 sin φ 2 v ) σ 3 E ε 0 ) m ] + σ 3
The above equation can be abbreviated as follows:
σ 1 = E ε 1 exp [ ( ε 1 + ε s ε u ε 0 ) m ] + σ 3
The residual strength in fine sandstone can be considered to be approximately a straight line, as follows in Equation (25):
σ 1 σ 3 = σ p
The above equation is the process of establishing the stress–strain equation of fine sandstone under complex stress conditions. For the equation, the solution of the unknowns ε 0 and m has become the key problem of this equation.
For the solution of these unknowns, there are now enough means. For the solution of unknowns, origin fitting method is adopted, and finally the linear law between ε 0 and the confining pressure σ 3 , and m and the confining pressure σ 3 is found. According to the experimental results, the elastic modulus of fine sandstone is 20.85 GPa, Poisson’s ratio is 0.172, cohesion is 7.8 MPa, and internal friction angle is 48.5°. Finally, these parameters are brought into the equations, and the stress–strain relationship equation of fine sandstone under confining pressure can be established uniformly (as shown in Figure 13 and Figure 14).

4. Discussion and Conclusions

In this study, physical property parameters of rock mass, such as density and water absorption, were obtained. Physical and mechanical experiments of rock mass were carried out in the laboratory, and mechanical parameters of rock mass were obtained, such as elastic modulus, Poisson’s ratio, internal friction angle, and cohesion. The main conclusions of this study are as follows:
  • By carrying out physical and mechanical experiments of rock, the elastic modulus, Poisson’s ratio, internal friction angle, and cohesion of coal and rock are obtained. The experimental results show that the compressive strength of the sample is in the order of medium sandstone > fine sandstone > mudstone.
  • The mechanical equation of fine sandstone under triaxial stress is established. On the basis of statistical damage mechanics, this chapter fully considers the influence of hydrostatic pressure in the experimental process, takes hydrostatic pressure as a part of the equation, and establishes a stress–strain equation based on confining pressure, which can describe the mechanical failure characteristics of rock under triaxial stress.
  • There is little difference in the cohesion and internal friction angle of the three rocks, among which mudstone has the lowest cohesion value under triaxial compression, indicating that the triaxial compression shear strength of the three rocks is similar. The cohesion of coal rock is the lowest, indicating that coal rock is easy to be destroyed by shear.

Author Contributions

Methodology, Y.T., H.D., R.Z., J.F. and Z.D.; writing—original draft, H.D.; writing—review and editing, R.Z., J.F. and Z.D. All authors have read and agreed to the published version of the manuscript.

Funding

This work was financially supported by the National Key Research and Development Plan (Grant No. 2018YFC1504902), the National Natural Science Foundation of China (Grant No. 52079068,52090081), the Key Research and Development Plan of Ningxia Hui Autonomous Region (Grant No. 2018BCG01003), the State Key Laboratory of Hydroscience and Engineering (Grant No. 2021-KY-04), and National Natural Science Foundation of China (No. 12102230).

Institutional Review Board Statement

Not applicable.

Informed Consent Statement

Not applicable.

Data Availability Statement

The data used to support the findings of this study are available from the corresponding author upon request.

Acknowledgments

The authors would like to thank the editor and the reviewers for their contributions.

Conflicts of Interest

The authors declare that they have no conflict of interest.

References

  1. Katz, H.A.; Daniels, J.M.; Ryan, S. Slope-area thresholds of road-induced gully erosion and consequent hillslope-channel interactions. Earth Surf. Process. Landforms 2013, 39, 285–295. [Google Scholar] [CrossRef]
  2. Zhang, J.; Li, M.; Taheri, A.; Zhang, W.; Wu, Z.; Song, W. Properties and Application of Backfill Materials in Coal Mines in China. Minerals 2019, 9, 53. [Google Scholar] [CrossRef] [Green Version]
  3. Ye, Q.; Wang, G.; Jia, Z.; Zheng, C.; Wang, W. Similarity simulation of mining-crack-evolution characteristics of overburden strata in deep coal mining with large dip. J. Pet. Sci. Eng. 2018, 165, 477–487. [Google Scholar] [CrossRef] [Green Version]
  4. Dong, L.; Sun, D.; Shu, W.; Li, X. Exploration: Safe and clean mining on Earth and asteroids. J. Clean. Prod. 2020, 257, 120899. [Google Scholar] [CrossRef]
  5. Duan, B.; Xia, H.; Yang, X. Impacts of bench blasting vibration on the stability of the surrounding rock masses of roadways. Tunn. Undergr. Space Technol. 2018, 71, 605–622. [Google Scholar] [CrossRef]
  6. He, M.; Feng, J.; Sun, X. Stability evaluation and optimal excavated design of rock slope at Antaibao open pit coal mine, China. Int. J. Rock Mech. Min. Sci. 2007, 45, 289–302. [Google Scholar] [CrossRef]
  7. Du, S.; Feng, G.; Wang, J.; Feng, S.; Malekian, R.; Li, Z. A New Machine-Learning Prediction Model for Slope Deformation of an Open-Pit Mine: An Evaluation of Field Data. Energies 2019, 12, 1288. [Google Scholar] [CrossRef] [Green Version]
  8. Yu, Y.; Wang, E.; Zhong, J.; Liu, X.; Li, P.; Shi, M.; Zhang, Z. Stability analysis of abutment slopes based on long-term monitoring and numerical simulation. Eng. Geol. 2014, 183, 159–169. [Google Scholar] [CrossRef]
  9. Xu, C.; Liu, X.; Wang, E.; Zheng, Y.; Wang, S. Rockburst prediction and classification based on the ideal-point method of information theory. Tunn. Undergr. Space Technol. 2018, 81, 382–390. [Google Scholar] [CrossRef]
  10. Liu, X.; Wang, S. Mine water inrush forecasting during the mining under waters. Disaster Adv. 2012, 5, 876–881. [Google Scholar]
  11. Lin, P.; Liu, X.; Hu, Y.; Xu, W.; Li, Q. Engineering. Deformation stability analysis of Xiluodu arch dam under stress-seepage coupling condition. Chin. J. Rock Mech. Eng. 2013, 32, 1145–1156. [Google Scholar]
  12. Lin, P.; Liu, X.; Hu, S.; Li, P. Large Deformation Analysis of a High Steep Slope Relating to the Laxiwa Reservoir, China. Rock Mech. Rock Eng. 2016, 49, 2253–2276. [Google Scholar] [CrossRef]
  13. Liu, X.; Han, G.; Wang, E.; Wang, S.; Nawnit, K. Multiscale hierarchical analysis of rock mass and prediction of its mechanical and hydraulic properties. J. Rock Mech. Geotech. Eng. 2018, 10, 694–702. [Google Scholar] [CrossRef]
  14. Hu, B.; Zhao, H.-B.; Wang, S.-J.; Liu, H.-N.; Peng, Y.-D.; Liu, X.-L.; Zhang, X.-P. Pull-out model test for tunnel anchorage and numerical analysis. Rock Soil Mech. 2009, 30, 1575–1582. [Google Scholar]
  15. Liu, C.; Liu, X.; Peng, X.; Wang, E.; Wang, S. Application of 3D-DDA integrated with unmanned aerial vehicle–laser scanner (UAV-LS) photogrammetry for stability analysis of a blocky rock mass slope. Landslides 2019, 16, 1645–1661. [Google Scholar] [CrossRef]
  16. Huang, X.; Liu, Q.; Shi, K.; Pan, Y.; Liu, J. Application and prospect of hard rock TBM for deep roadway construction in coal mines. Tunn. Undergr. Space Technol. 2018, 73, 105–126. [Google Scholar] [CrossRef]
  17. Salmi, E.; Karakus, M.; Nazem, M. Assessing the effects of rock mass gradual deterioration on the long-term stability of abandoned mine workings and the mechanisms of post-mining subsidence–A case study of Castle Fields mine. Tunn. Undergr. Space Technol. 2019, 88, 169–185. [Google Scholar] [CrossRef]
  18. Liu, X.; Wang, S.; Wang, S.; Wang, E.J. Fluid-driven fractures in granular materials. Bull. Eng. Geol. Environ. 2015, 74, 621–636. [Google Scholar] [CrossRef]
  19. Lv, Q.; Wang, E.; Liu, X.; Wang, S. Determining the intrinsic permeability of tight porous media based on bivelocity hydrodynetics. Microfluid. Nanofluid. 2014, 16, 841–848. [Google Scholar] [CrossRef]
  20. Li, J.; Hu, M.; Ding, E.; Kong, W.; Pan, D.; Chen, S. Multi-parameter numerical simulation of dynamic monitoring of rock deformation in deep mining. Int. J. Min. Sci. Technol. 2016, 26, 851–855. [Google Scholar] [CrossRef]
  21. Jing, H.; Wu, J.; Yin, Q.; Wang, K. Deformation and failure characteristics of anchorage structure of surrounding rock in deep roadway. Int. J. Min. Sci. Technol. 2020, 30, 593–604. [Google Scholar] [CrossRef]
  22. Zhang, N.; Yuan, L.; Han, C.; Xue, J.; Kan, J. Stability and deformation of surrounding rock in pillarless gob-side entry retaining. Saf. Sci. 2012, 50, 593–599. [Google Scholar] [CrossRef]
  23. Yu, W.; Liu, F.J. Stability of close chambers surrounding rock in deep and comprehensive control technology. Adv. Civ. Eng. 2018, 2018, 40. [Google Scholar] [CrossRef]
  24. He, H.; Yan, Y.; Qu, C.; Fan, Y. Study and Application on Stability Classification of Tunnel Surrounding Rock Based on Uncertainty Measure Theory. Math. Probl. Eng. 2014, 2014, 1–5. [Google Scholar] [CrossRef]
  25. Chen, S.; Wu, A.; Wang, Y.; Chen, X.; Yan, R.; Ma, H. Study on repair control technology of soft surrounding rock roadway and its application. Eng. Fail. Anal. 2018, 92, 443–455. [Google Scholar] [CrossRef]
  26. He, M.; Gong, W.; Wang, J.; Qi, P.; Tao, Z.; Du, S.; Peng, Y. Development of a novel energy-absorbing bolt with extraordinarily large elongation and constant resistance. Int. J. Rock Mech. Min. Sci. 2014, 67, 29–42. [Google Scholar] [CrossRef]
  27. Sun, X.-M.; He, M.-C. Numerical simulation research on coupling support theory of roadway within soft rock at depth. J. China Univ. Min. Technol. 2005, 34, 166–169. [Google Scholar]
  28. Kang, Y.; Liu, Q.; Gong, G.; Wang, H. Application of a combined support system to the weak floor reinforcement in deep underground coal mine. Int. J. Rock Mech. Min. Sci. 2014, 71, 143–150. [Google Scholar] [CrossRef]
  29. Li, S.; Wang, Q.; Wang, H.; Jiang, B.; Wang, D.; Zhang, B.; Li, Y.; Ruan, G. Model test study on surrounding rock deformation and failure mechanisms of deep roadways with thick top coal. Tunn. Undergr. Space Technol. 2015, 47, 52–63. [Google Scholar] [CrossRef]
  30. Singh, R.; Mallick, M.; Verma, M. Studies on failure behaviour of wire rope used in underground coal mines. Eng. Fail. Anal. 2016, 70, 290–304. [Google Scholar] [CrossRef]
  31. Sasaoka, T.; Shimada, H.; Lin, N.Z.; Takamoto, H.; Matsui, K.; Kramadibrata, S.; Sulistianto, B. Geotechnical issues in the application of rock bolting technology for the development of underground coal mines in Indonesia. Int. J. Min. Reclam. Environ. 2013, 28, 150–172. [Google Scholar] [CrossRef]
  32. Du, Q.; Liu, X.; Wang, E.; Wang, S. Strength Reduction of Coal Pillar after CO2 Sequestration in Abandoned Coal Mines. Minerals 2017, 7, 26. [Google Scholar] [CrossRef]
  33. Liu, X.; Wang, S.; Wang, E. A study on the uplift mechanism of Tongjiezi dam using a coupled hydro-mechanical model. Eng. Geol. 2011, 117, 134–150. [Google Scholar] [CrossRef]
  34. Dai, S.; Liu, X.; Nawnit, K. Experimental Study on the Fracture Process Zone Characteristics in Concrete Utilizing DIC and AE Methods. Appl. Sci. 2019, 9, 1346. [Google Scholar] [CrossRef] [Green Version]
  35. Sun, H.; Liu, X.; Ye, Z.; Wang, E. Experimental investigation of the nonlinear evolution from pipe flow to fissure flow during carbonate rock failures. Bull. Eng. Geol. Environ. 2021, 80, 4459–4470. [Google Scholar] [CrossRef]
  36. Sun, W.; Hao, J.; Liu, Y. A new proposed method for observing fluid in rock fractures using the enhanced X-ray image of digital radiography. Geomech. Geophys. Geo-Energy Geo-Resour. 2021, 8, 1–16. [Google Scholar] [CrossRef]
  37. Liu, H.; Long, Q.; Liu, X.; Ye, Z.; Wang, E.; Du, W. Opencast Mining Technology j. Analysis of hydrogeological characteristics and water control measures of Pingshuo East open-pit mine. Opencast Min. Technol. 2021, 31, 78–91. [Google Scholar]
  38. Jia, S.; Liu, T.; Yan, Y. Technology Innovation and Application j. Analysis of geological environment of pingshuo Group East open-pit Mine. J. Clean. Prod. 2014, 15, 126–127. [Google Scholar]
Figure 1. Location of the study area and geomorphology of the open-pit mine.
Applsci 12 02445 g001
Figure 2. Lithology of the typical borehole.
Applsci 12 02445 g002
Figure 3. WGE-600 Experiment and investigation equipment with microcomputer control displaying of WGE-600.
Applsci 12 02445 g003
Figure 4. Schematic diagram of sample rock samples with different dip angles.
Applsci 12 02445 g004
Figure 5. Stress–strain curves of rock specimens.
Applsci 12 02445 g005
Figure 6. Failure state of rock specimens and samples.
Applsci 12 02445 g006
Figure 7. Coal rock variable angle shear specimen.
Applsci 12 02445 g007
Figure 8. Relation curve for rock shear stress and normal stress.
Applsci 12 02445 g008
Figure 9. Triaxial experimental equipment.
Applsci 12 02445 g009
Figure 10. Prepare rock triaxial test samples.
Applsci 12 02445 g010
Figure 11. Triaxial test curve of mudstone, triaxial test curve of fine sandstone, triaxial test curve of fine sandstone, and triaxial test curve of medium sandstone.
Applsci 12 02445 g011
Figure 12. Total stress–strain curves of fine sandstone (group #3).
Applsci 12 02445 g012
Figure 13. The relations between confining pressure strength and residual strength.
Applsci 12 02445 g013
Figure 14. The relations between unknown parameters and confining pressure strength.
Applsci 12 02445 g014
Table 1. Density and water absorption calculation table.
Serial NumberLithologySpecimen Size
(Width × Length)
Natural QualityFeed Water Quality Drying Quality Soil Natural DensityFull Water DensityDry DensityBibulous Rate
mm × mmgggg/cm3g/cm3g/cm3%
1-A-1-1 Coal 50.249.96214.1216.8209.22.142.182.064.20%
1-A-1-2 50.450.51218217.9208.42.052.042.14.87%
mean value 2.12.112.084.54%
2-B-1-1 Mudstone100.0350.44474.5481.8466.72.382.412.343.24%
2-B-1-2 99.650.5495.9501.9490.32.492.522.462.37%
2-B-1-3 99.6350.2459.7470.1448.42.332.392.284.84%
2-B-1-4 99.3150.46480.3490.7468.72.422.472.364.69%
mean value2.42.452.363.78%
1-C-1-1 Fine sandstone99.3950.42493.7505.6491.62.492.552.482.85%
1-C-1-2 100.1750.5487.9502.3486.62.432.52.433.23%
1-C-1-3 101.2550.61467.5480.34652.32.362.283.29%
1-C-2-4 98.148.84454.66473.58452.682.362.552.373.14%
mean value 2.392.492.393.22%
1-D-1-1 Medium sandstone99.3648.7455.32467.1447.92.712.742.654.61%
1-D-1-2 98.9248.74457.86469.6450.72.552.562.444.19%
1-D-1-3 98.948.9444.78456.2436.52.392.462.354.50%
1-D-1-4 100.148.72451.48463.56442.682.422.432.374.70%
mean value2.422.432.374.70%
Publisher’s Note: MDPI stays neutral with regard to jurisdictional claims in published maps and institutional affiliations.

