
GIS-Based Planning and Web/3D Web GIS Applications for the Analysis and Management of MV/LV Electrical Networks (A Case Study in Tunisia)


Abstract
:1. Introduction
2. Methodoloy
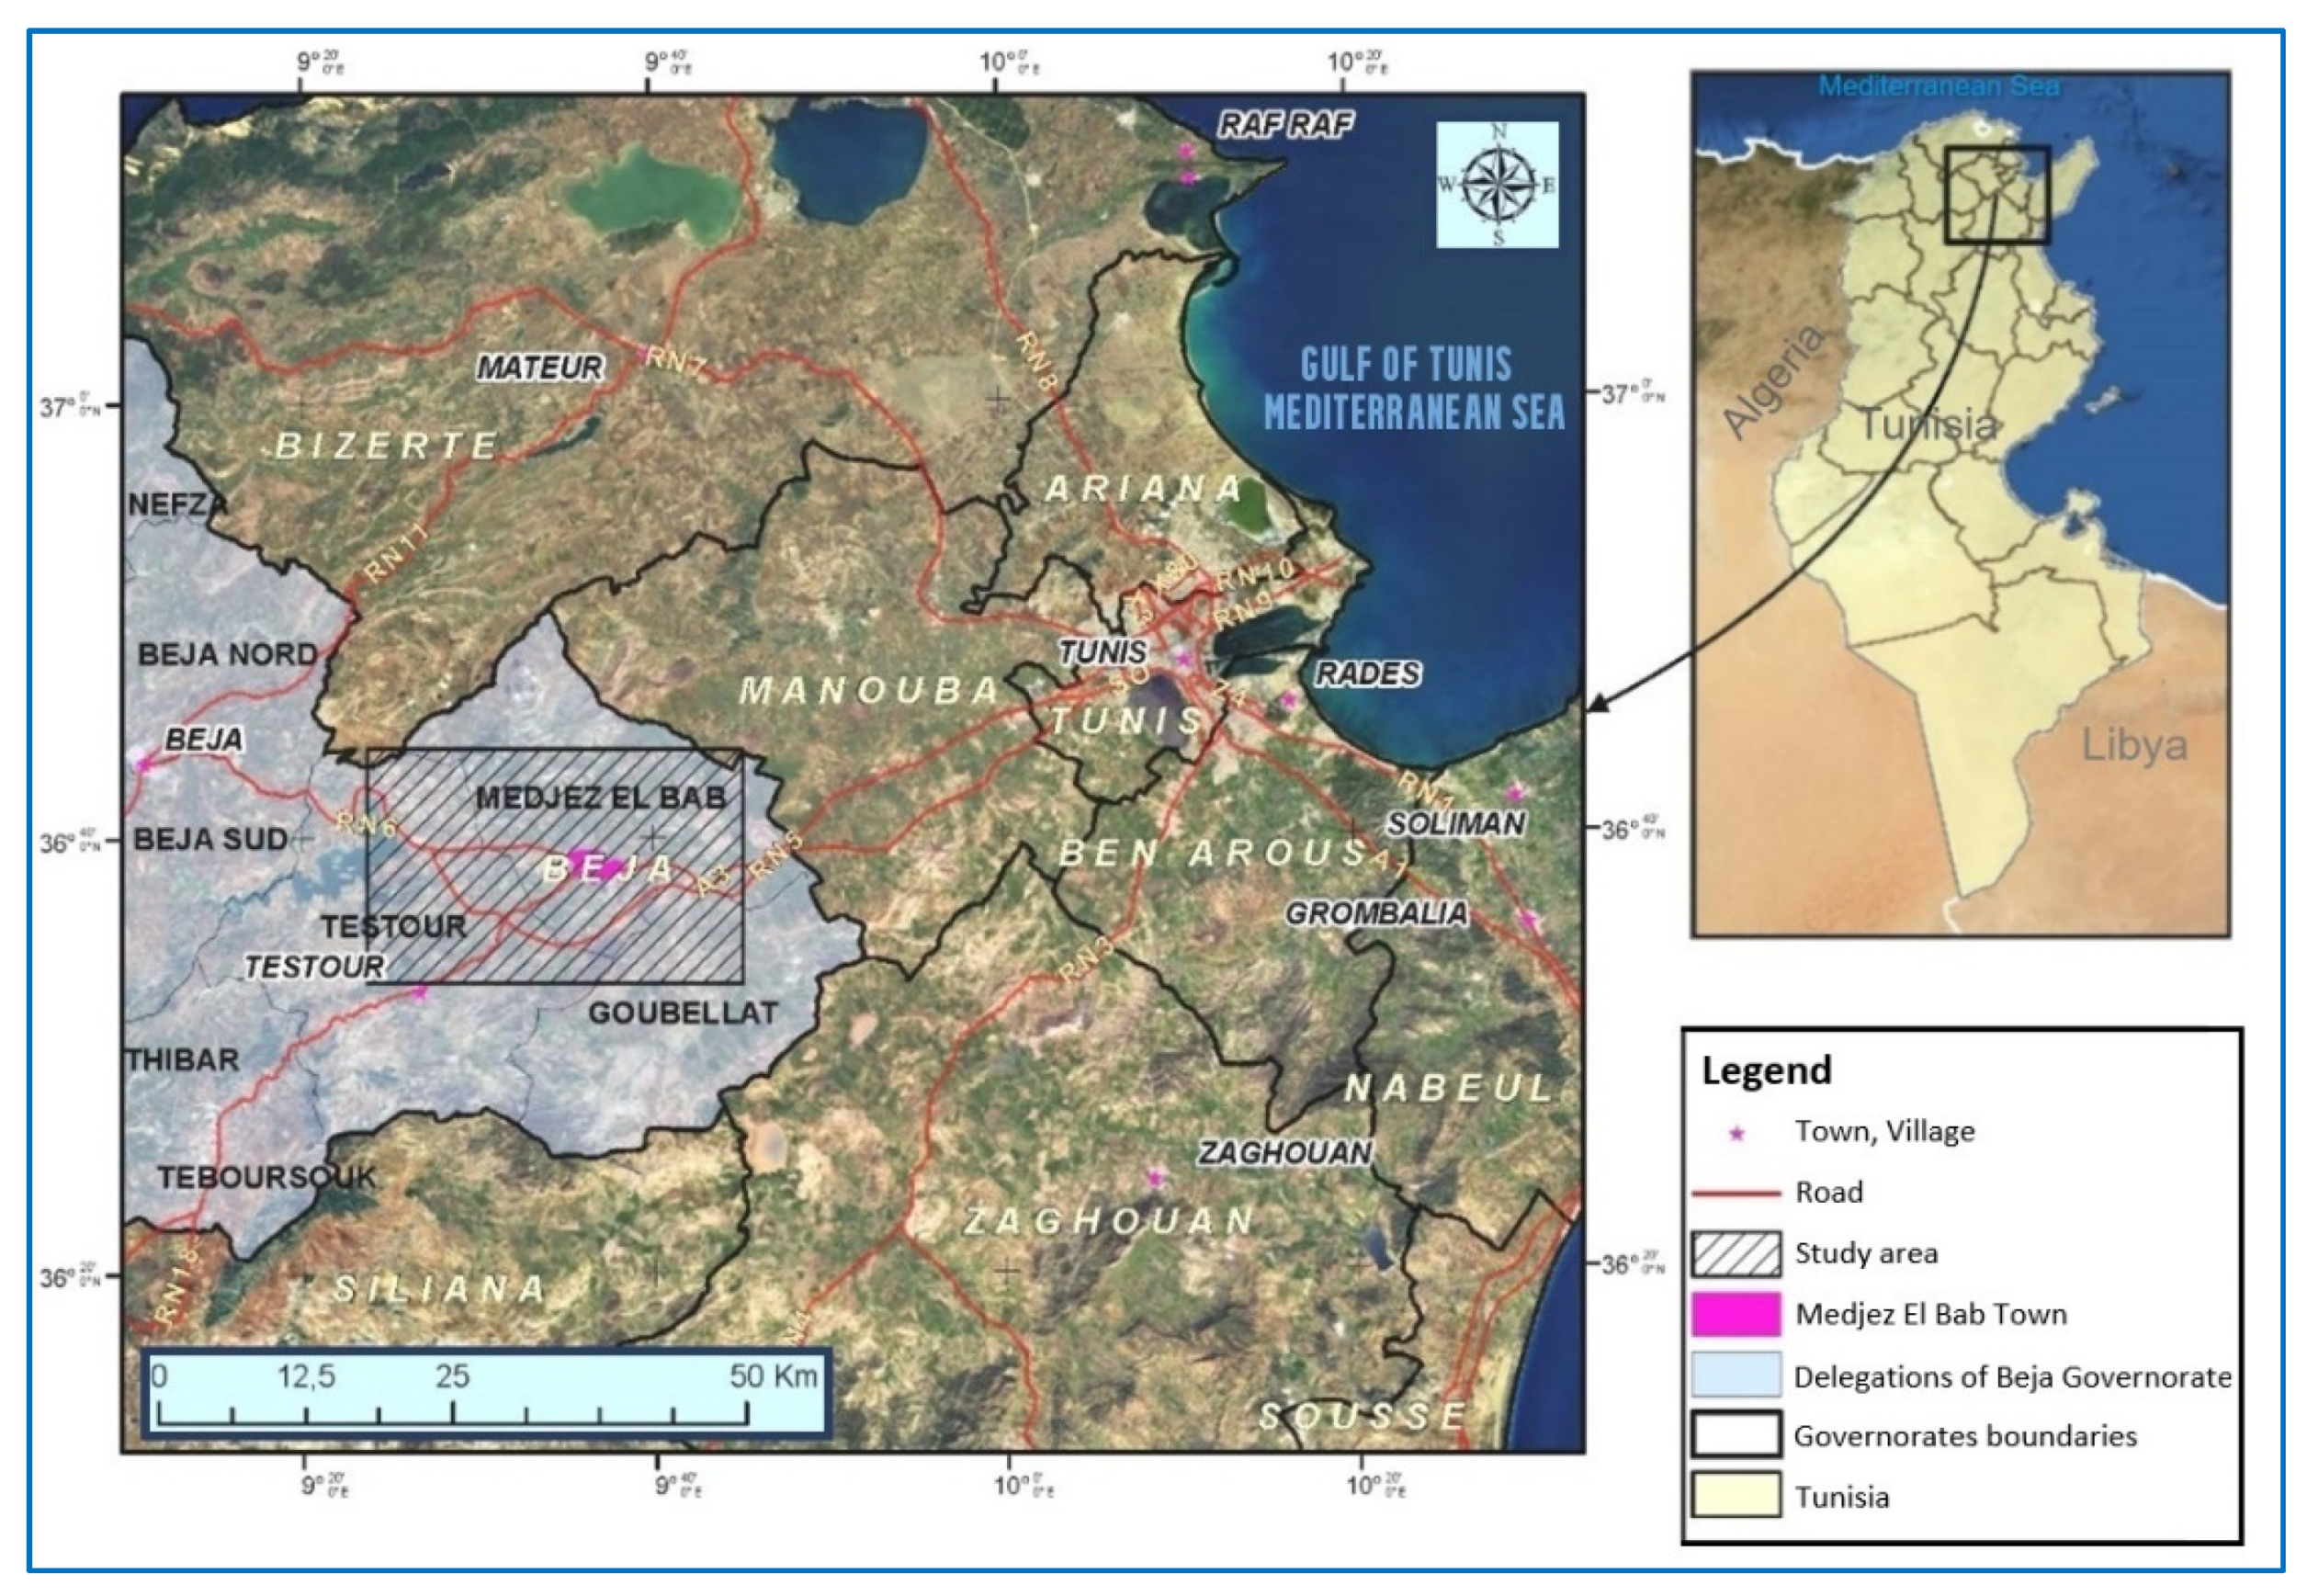
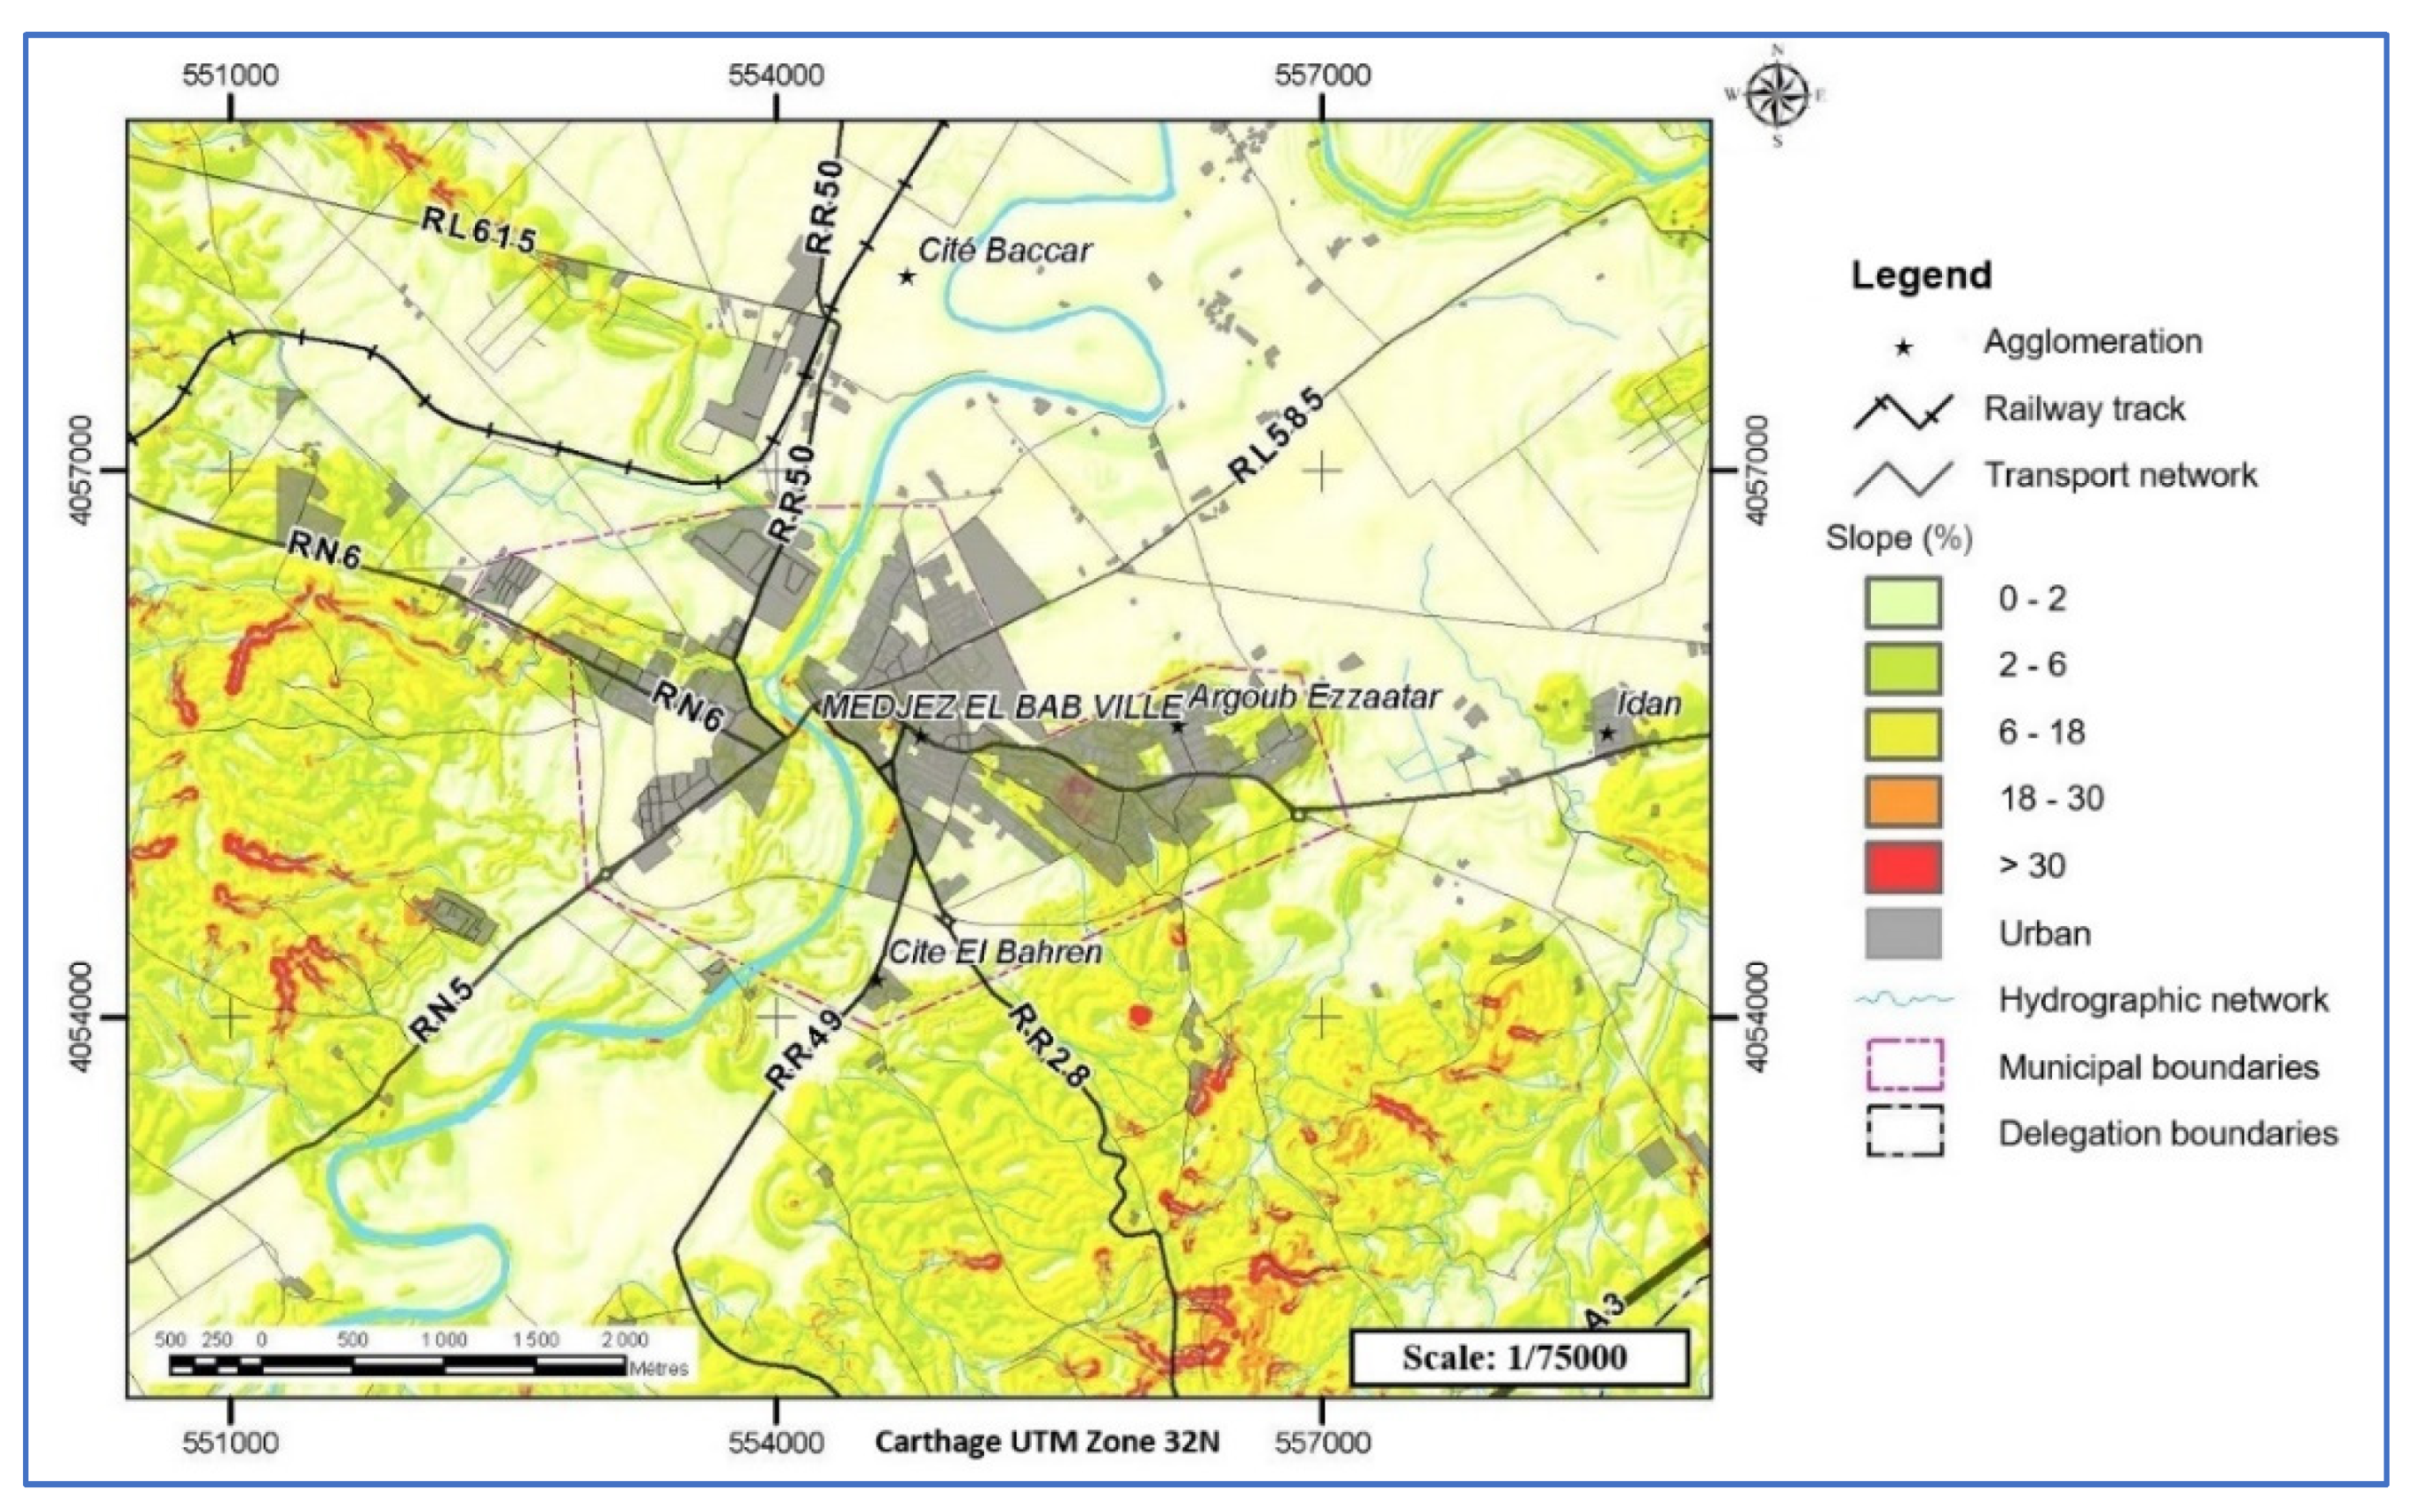
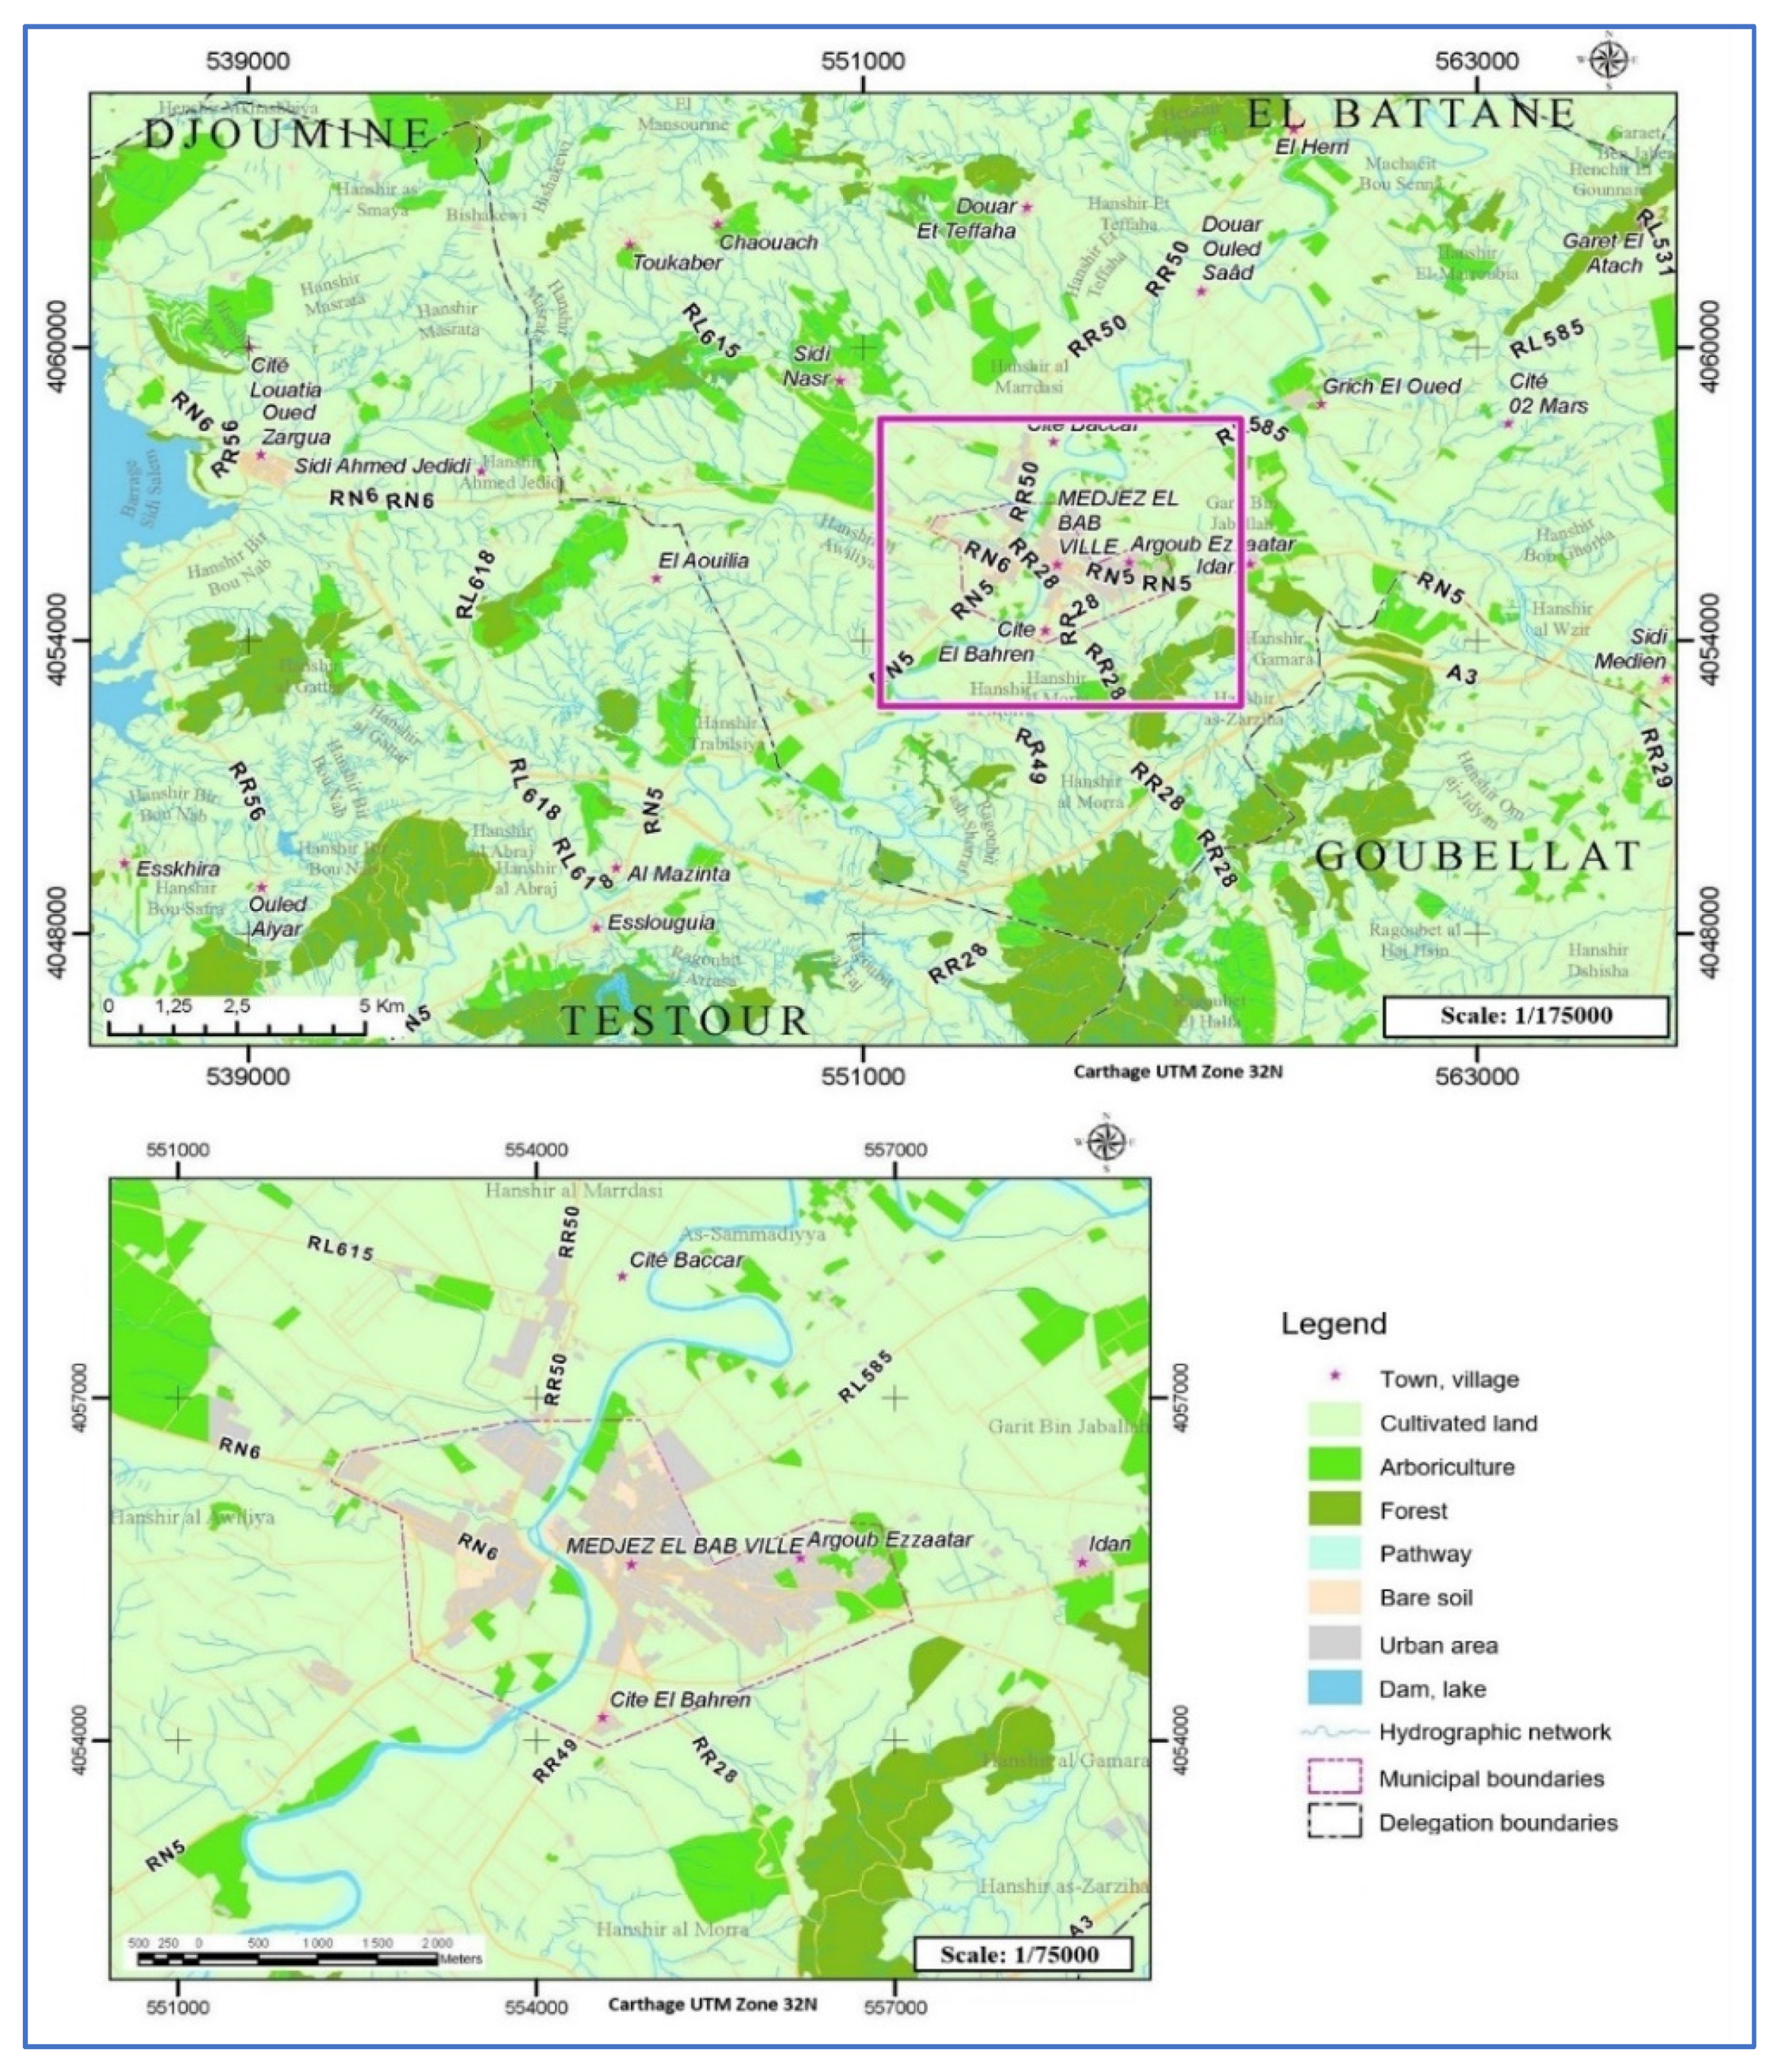
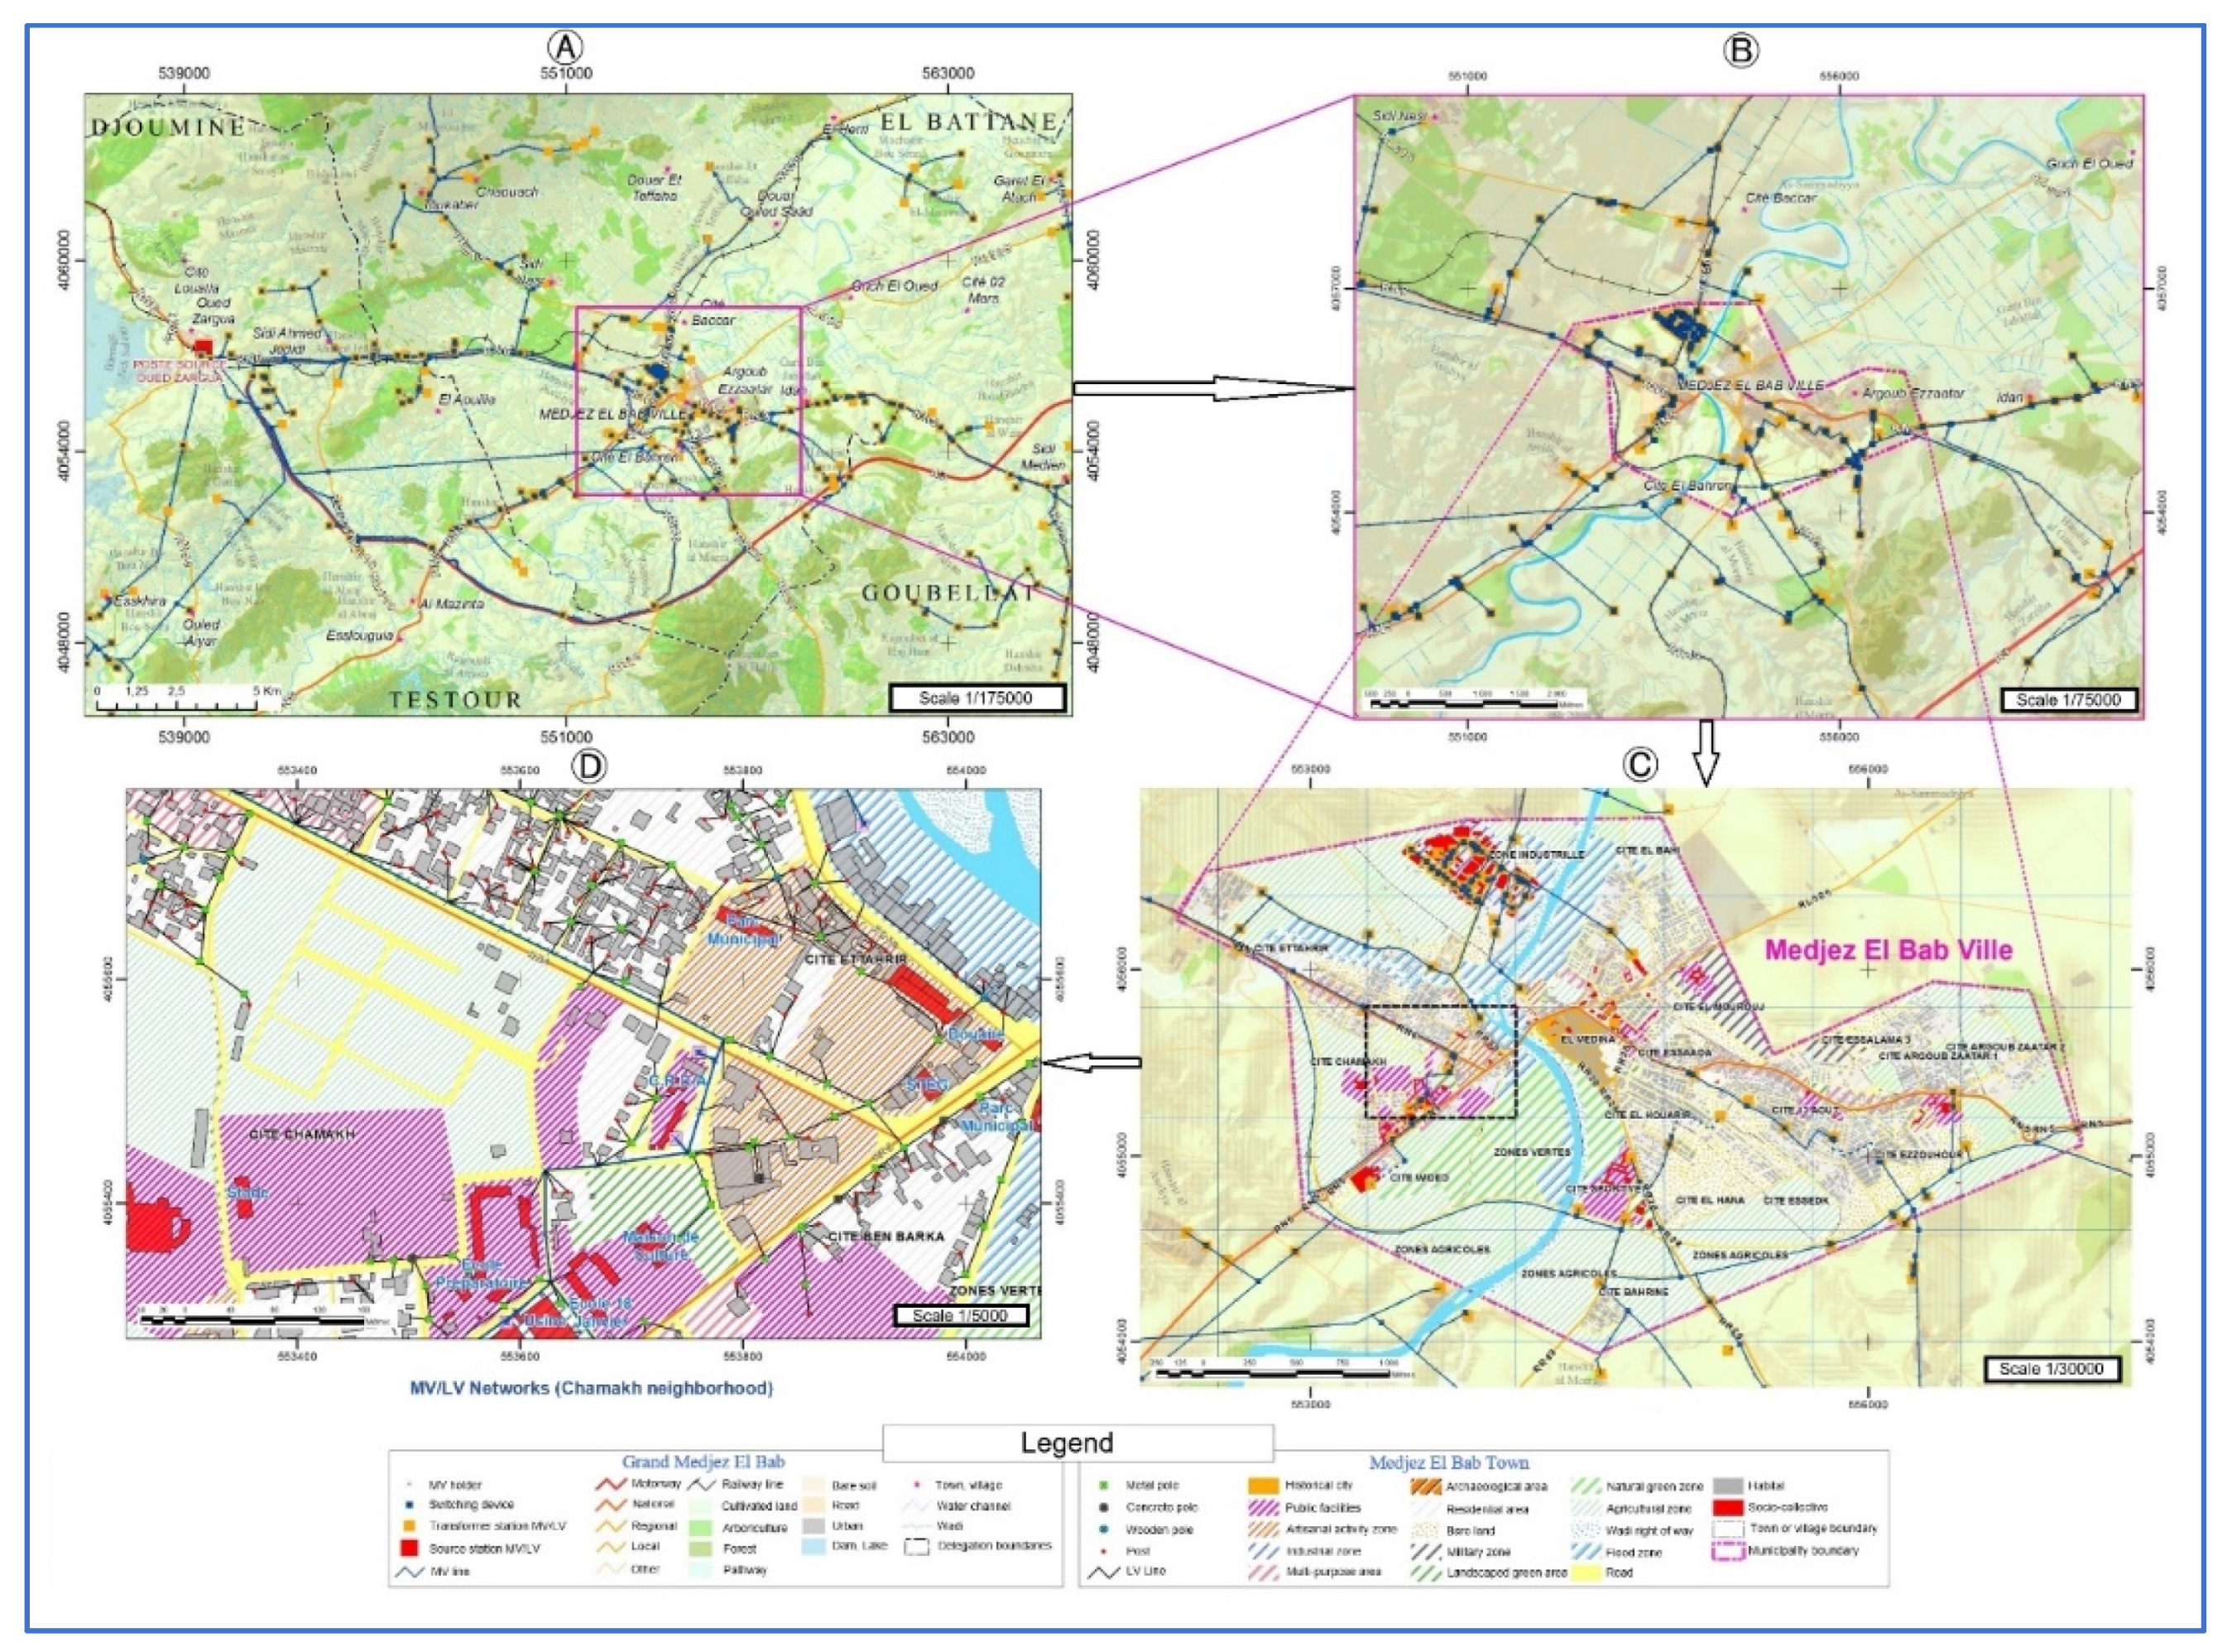
2.1. Study Area
2.2. Planning of the Electrical Networks Using GIS Tools
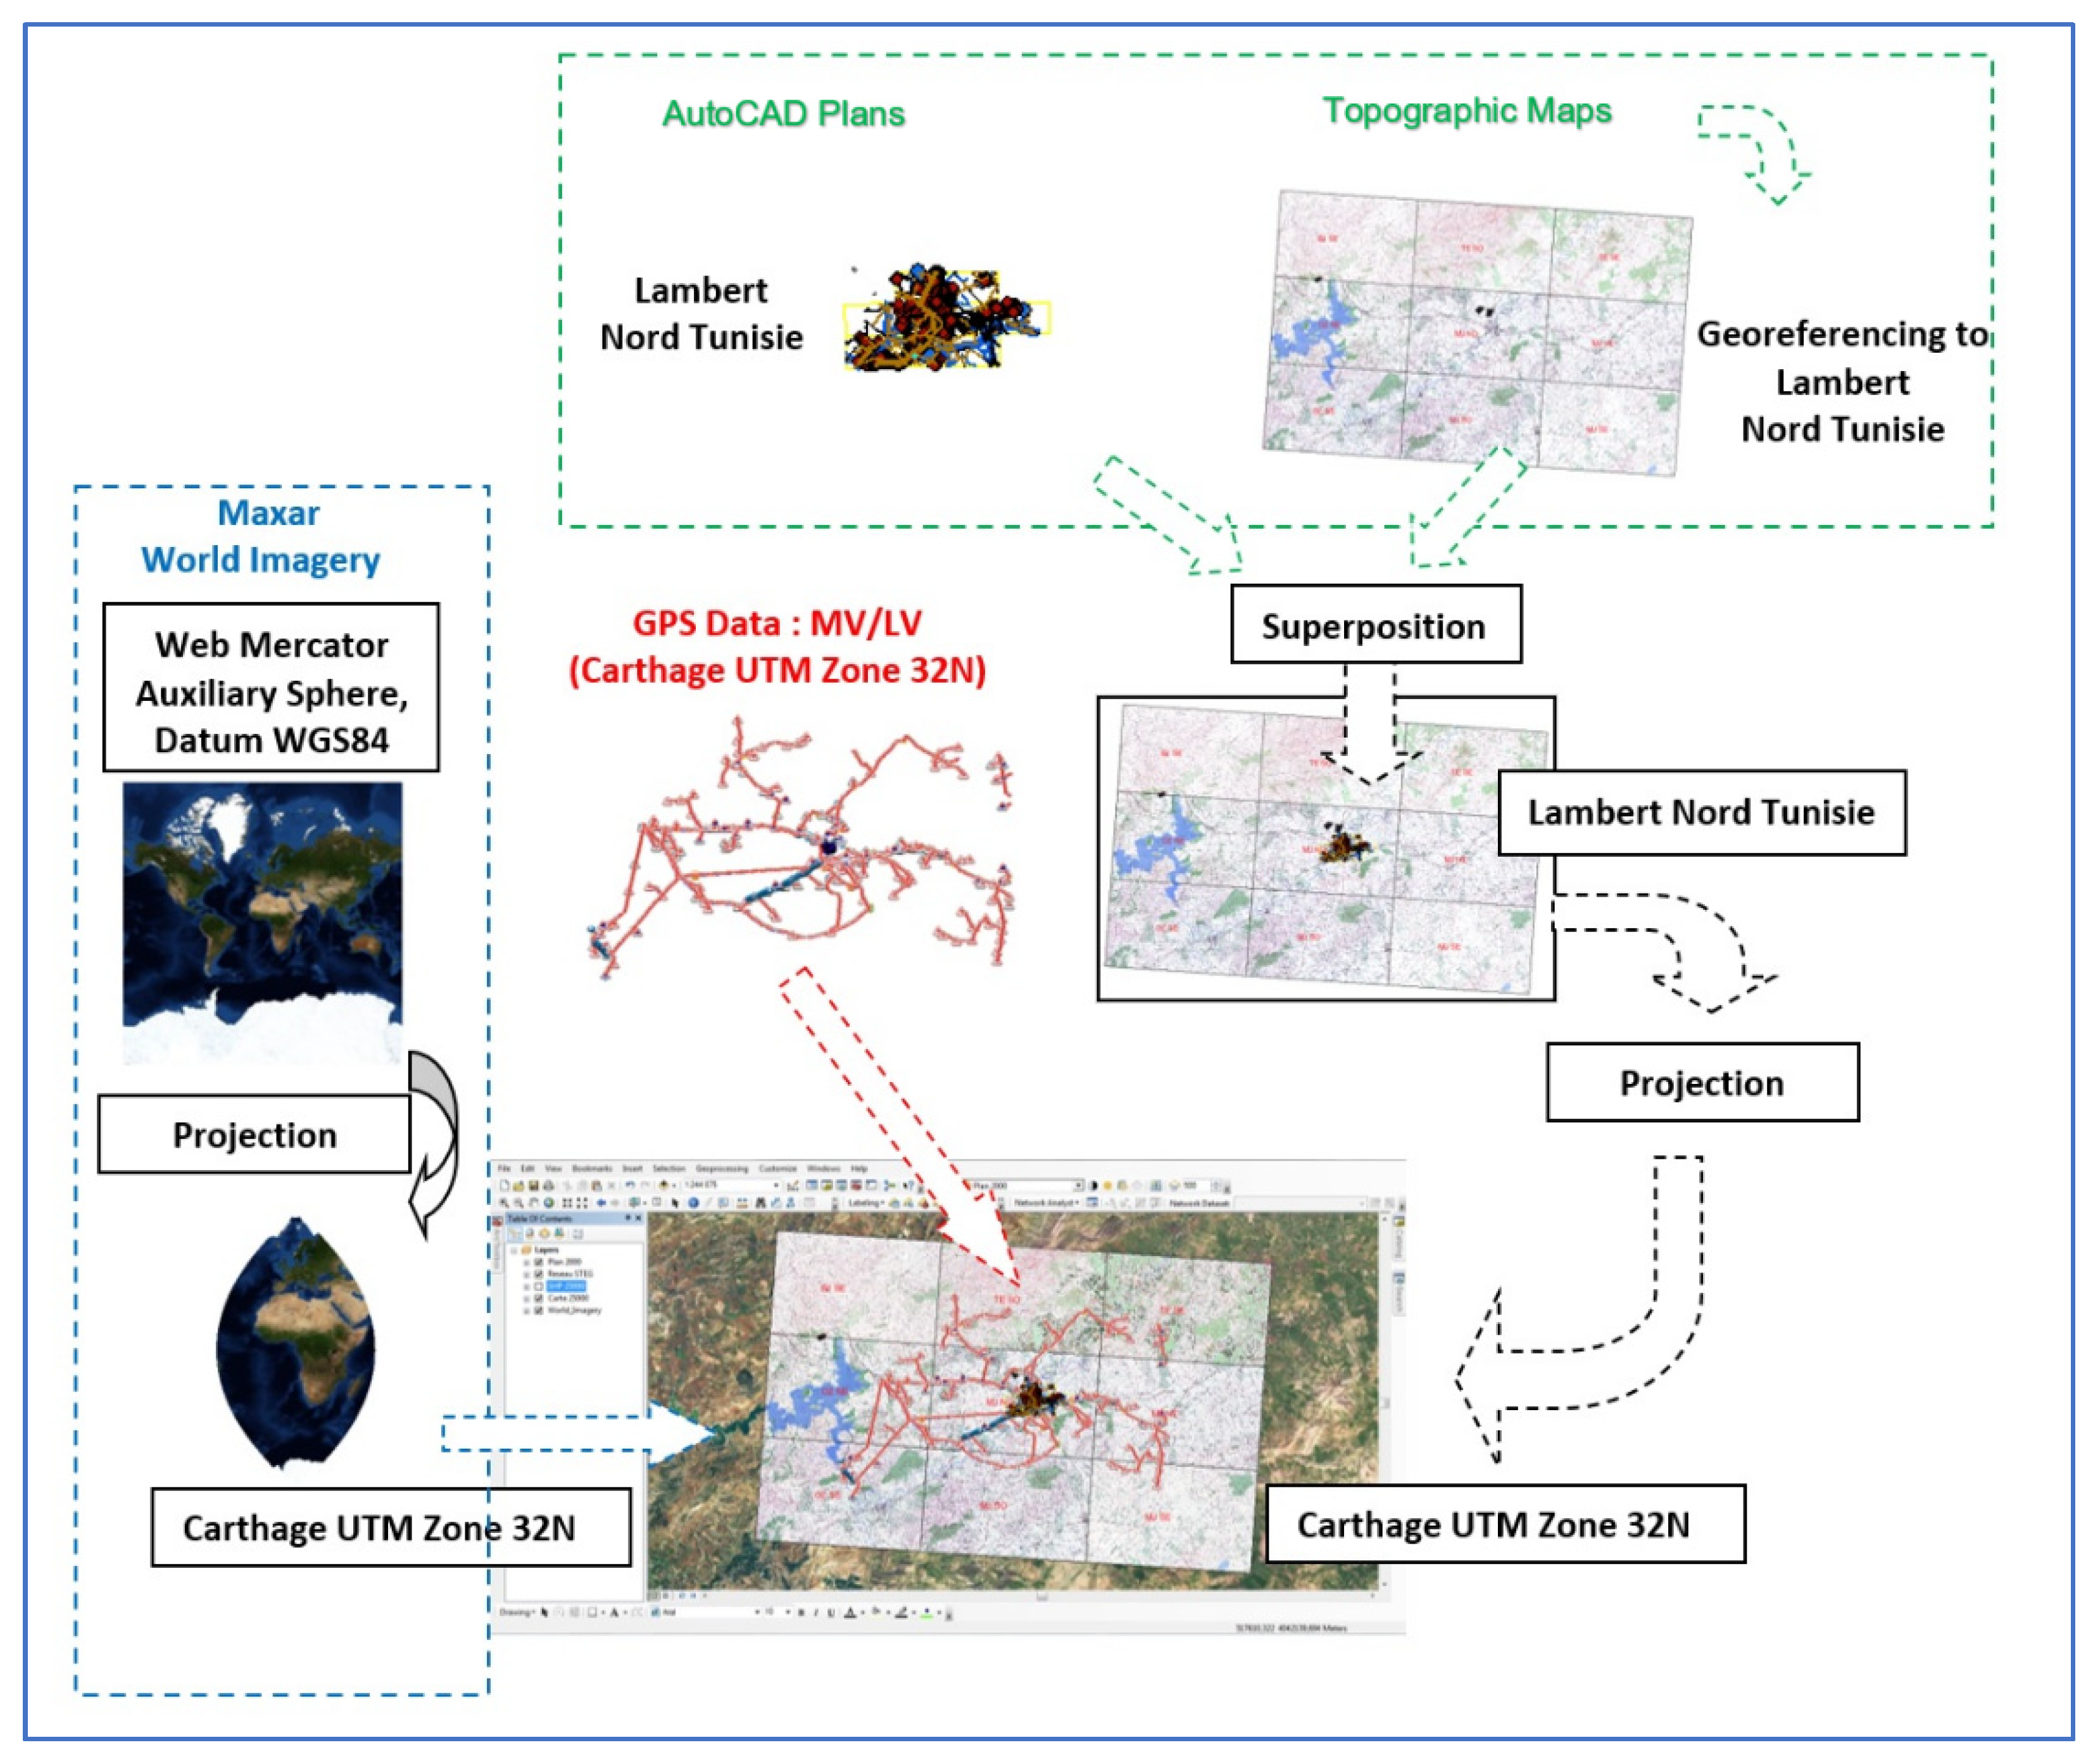
2.2.1. Data Acquisition
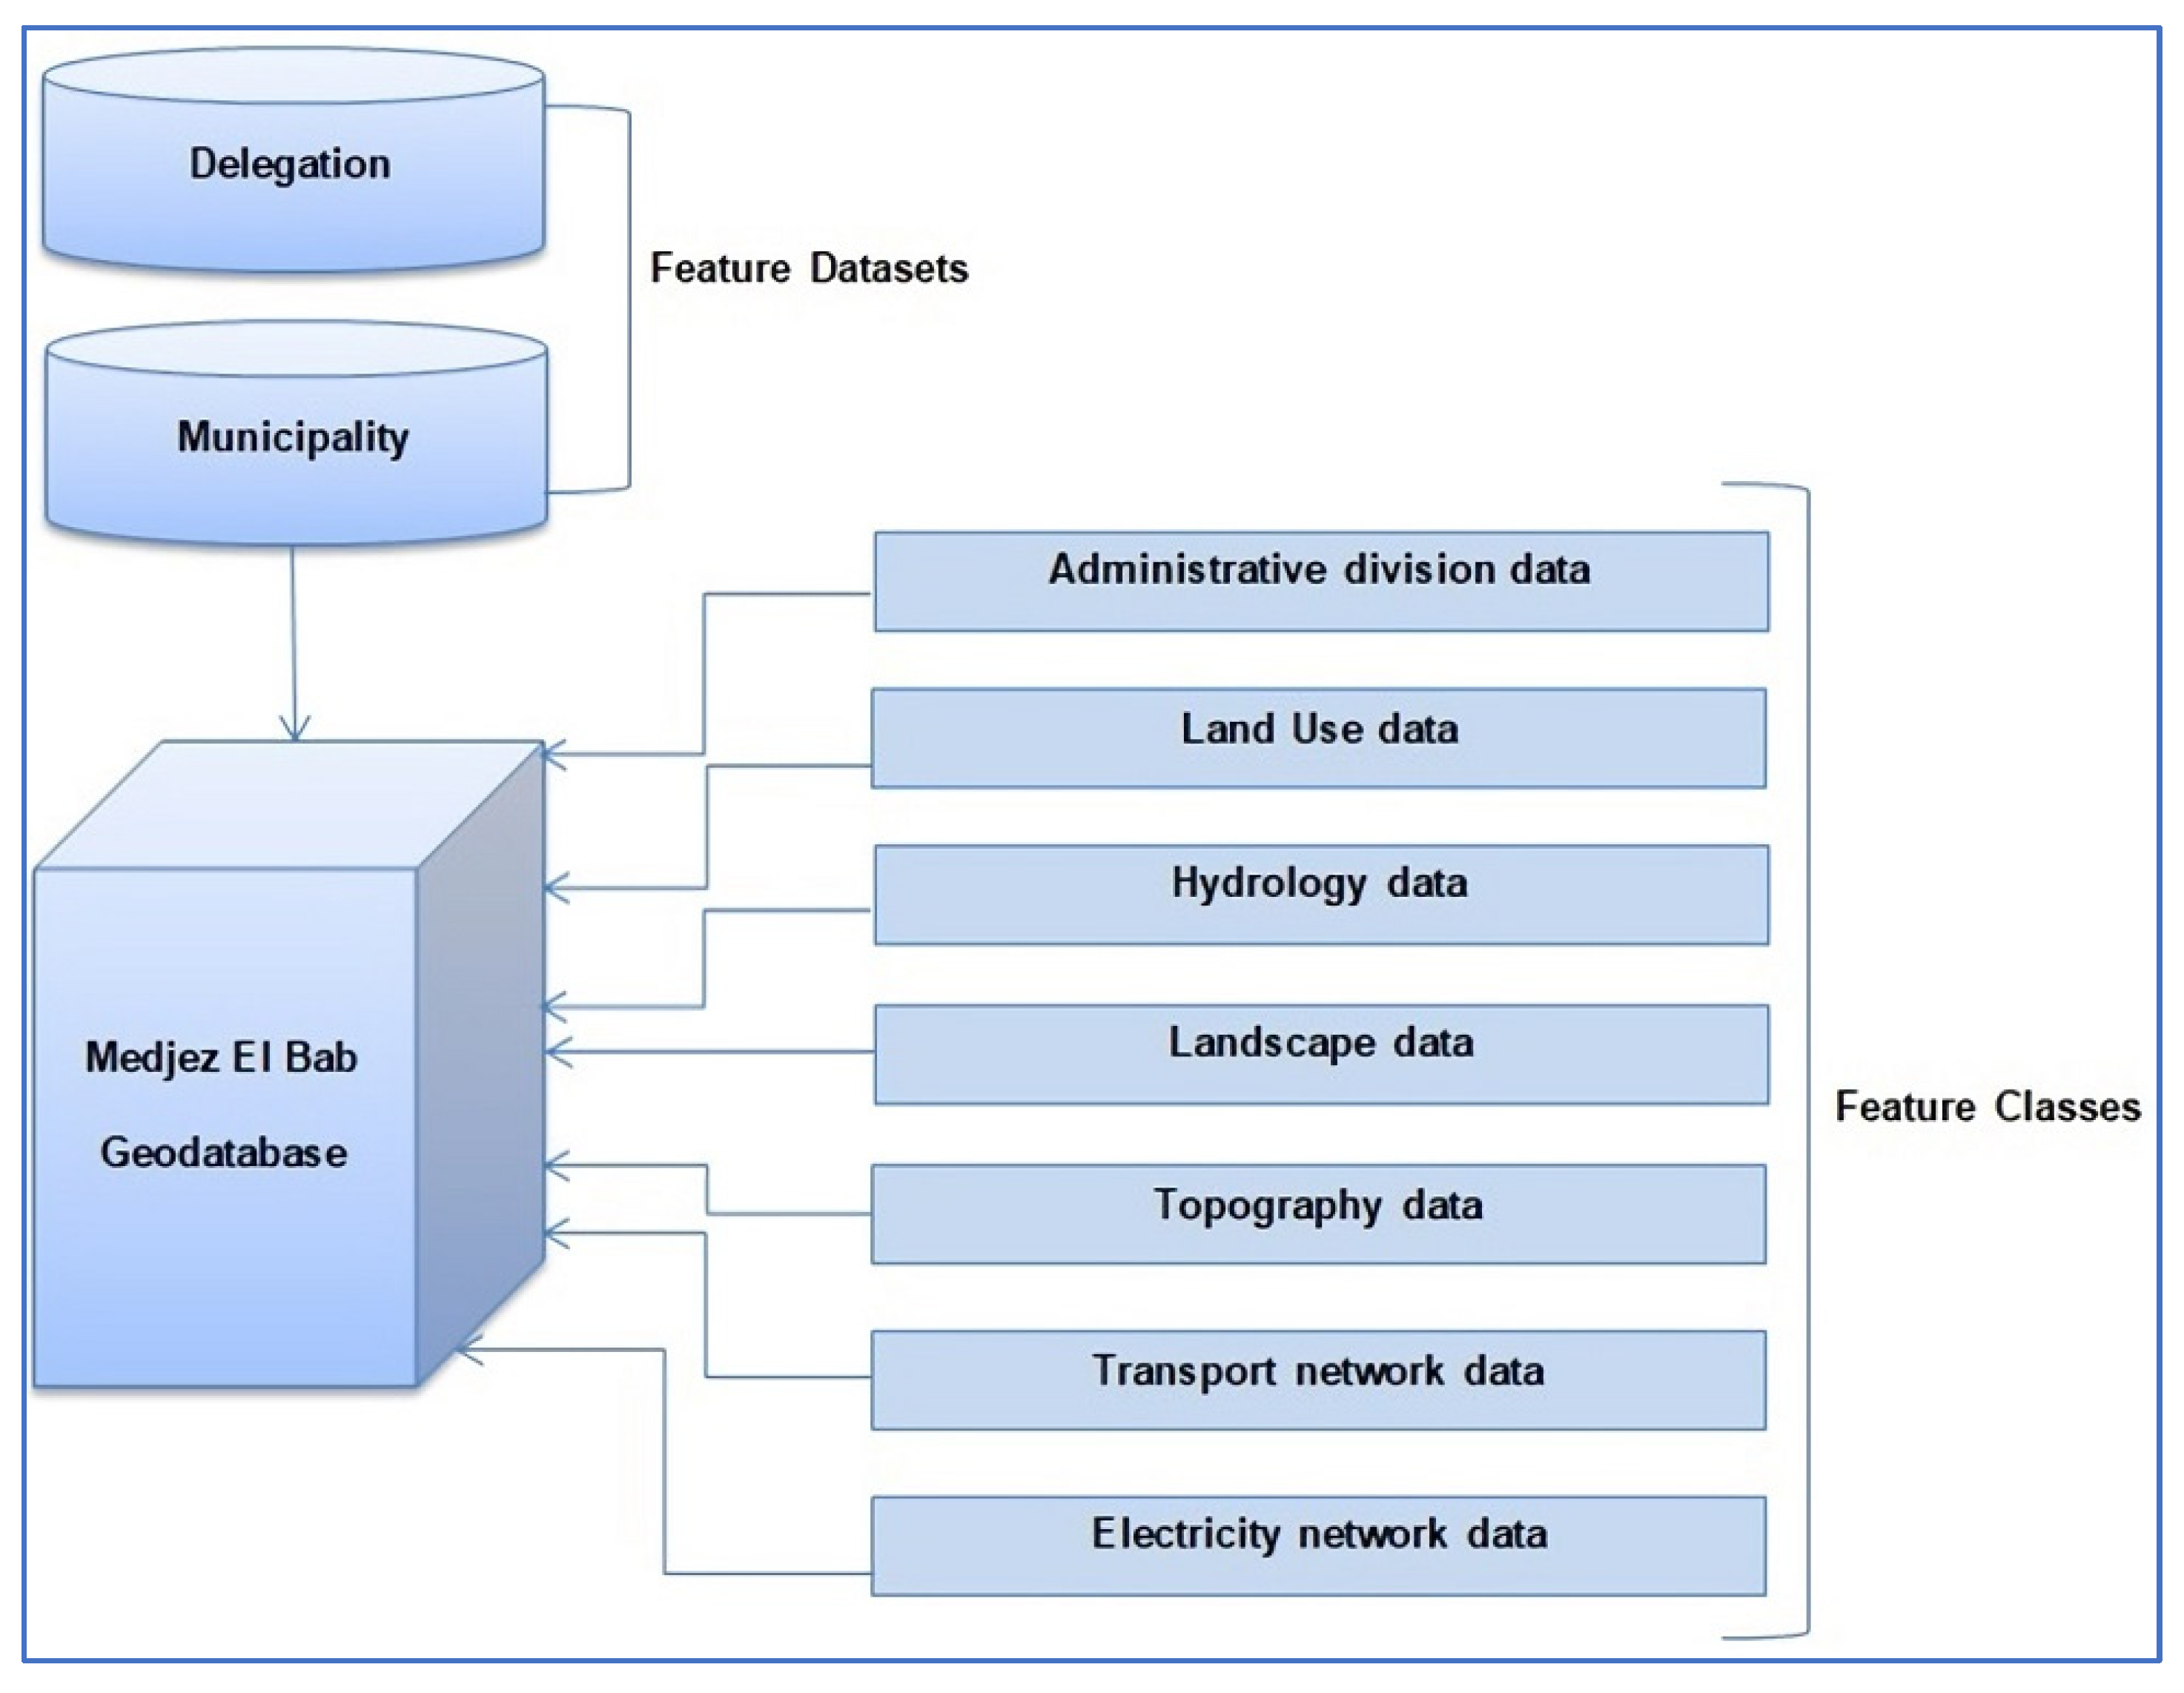
2.2.2. Database Design
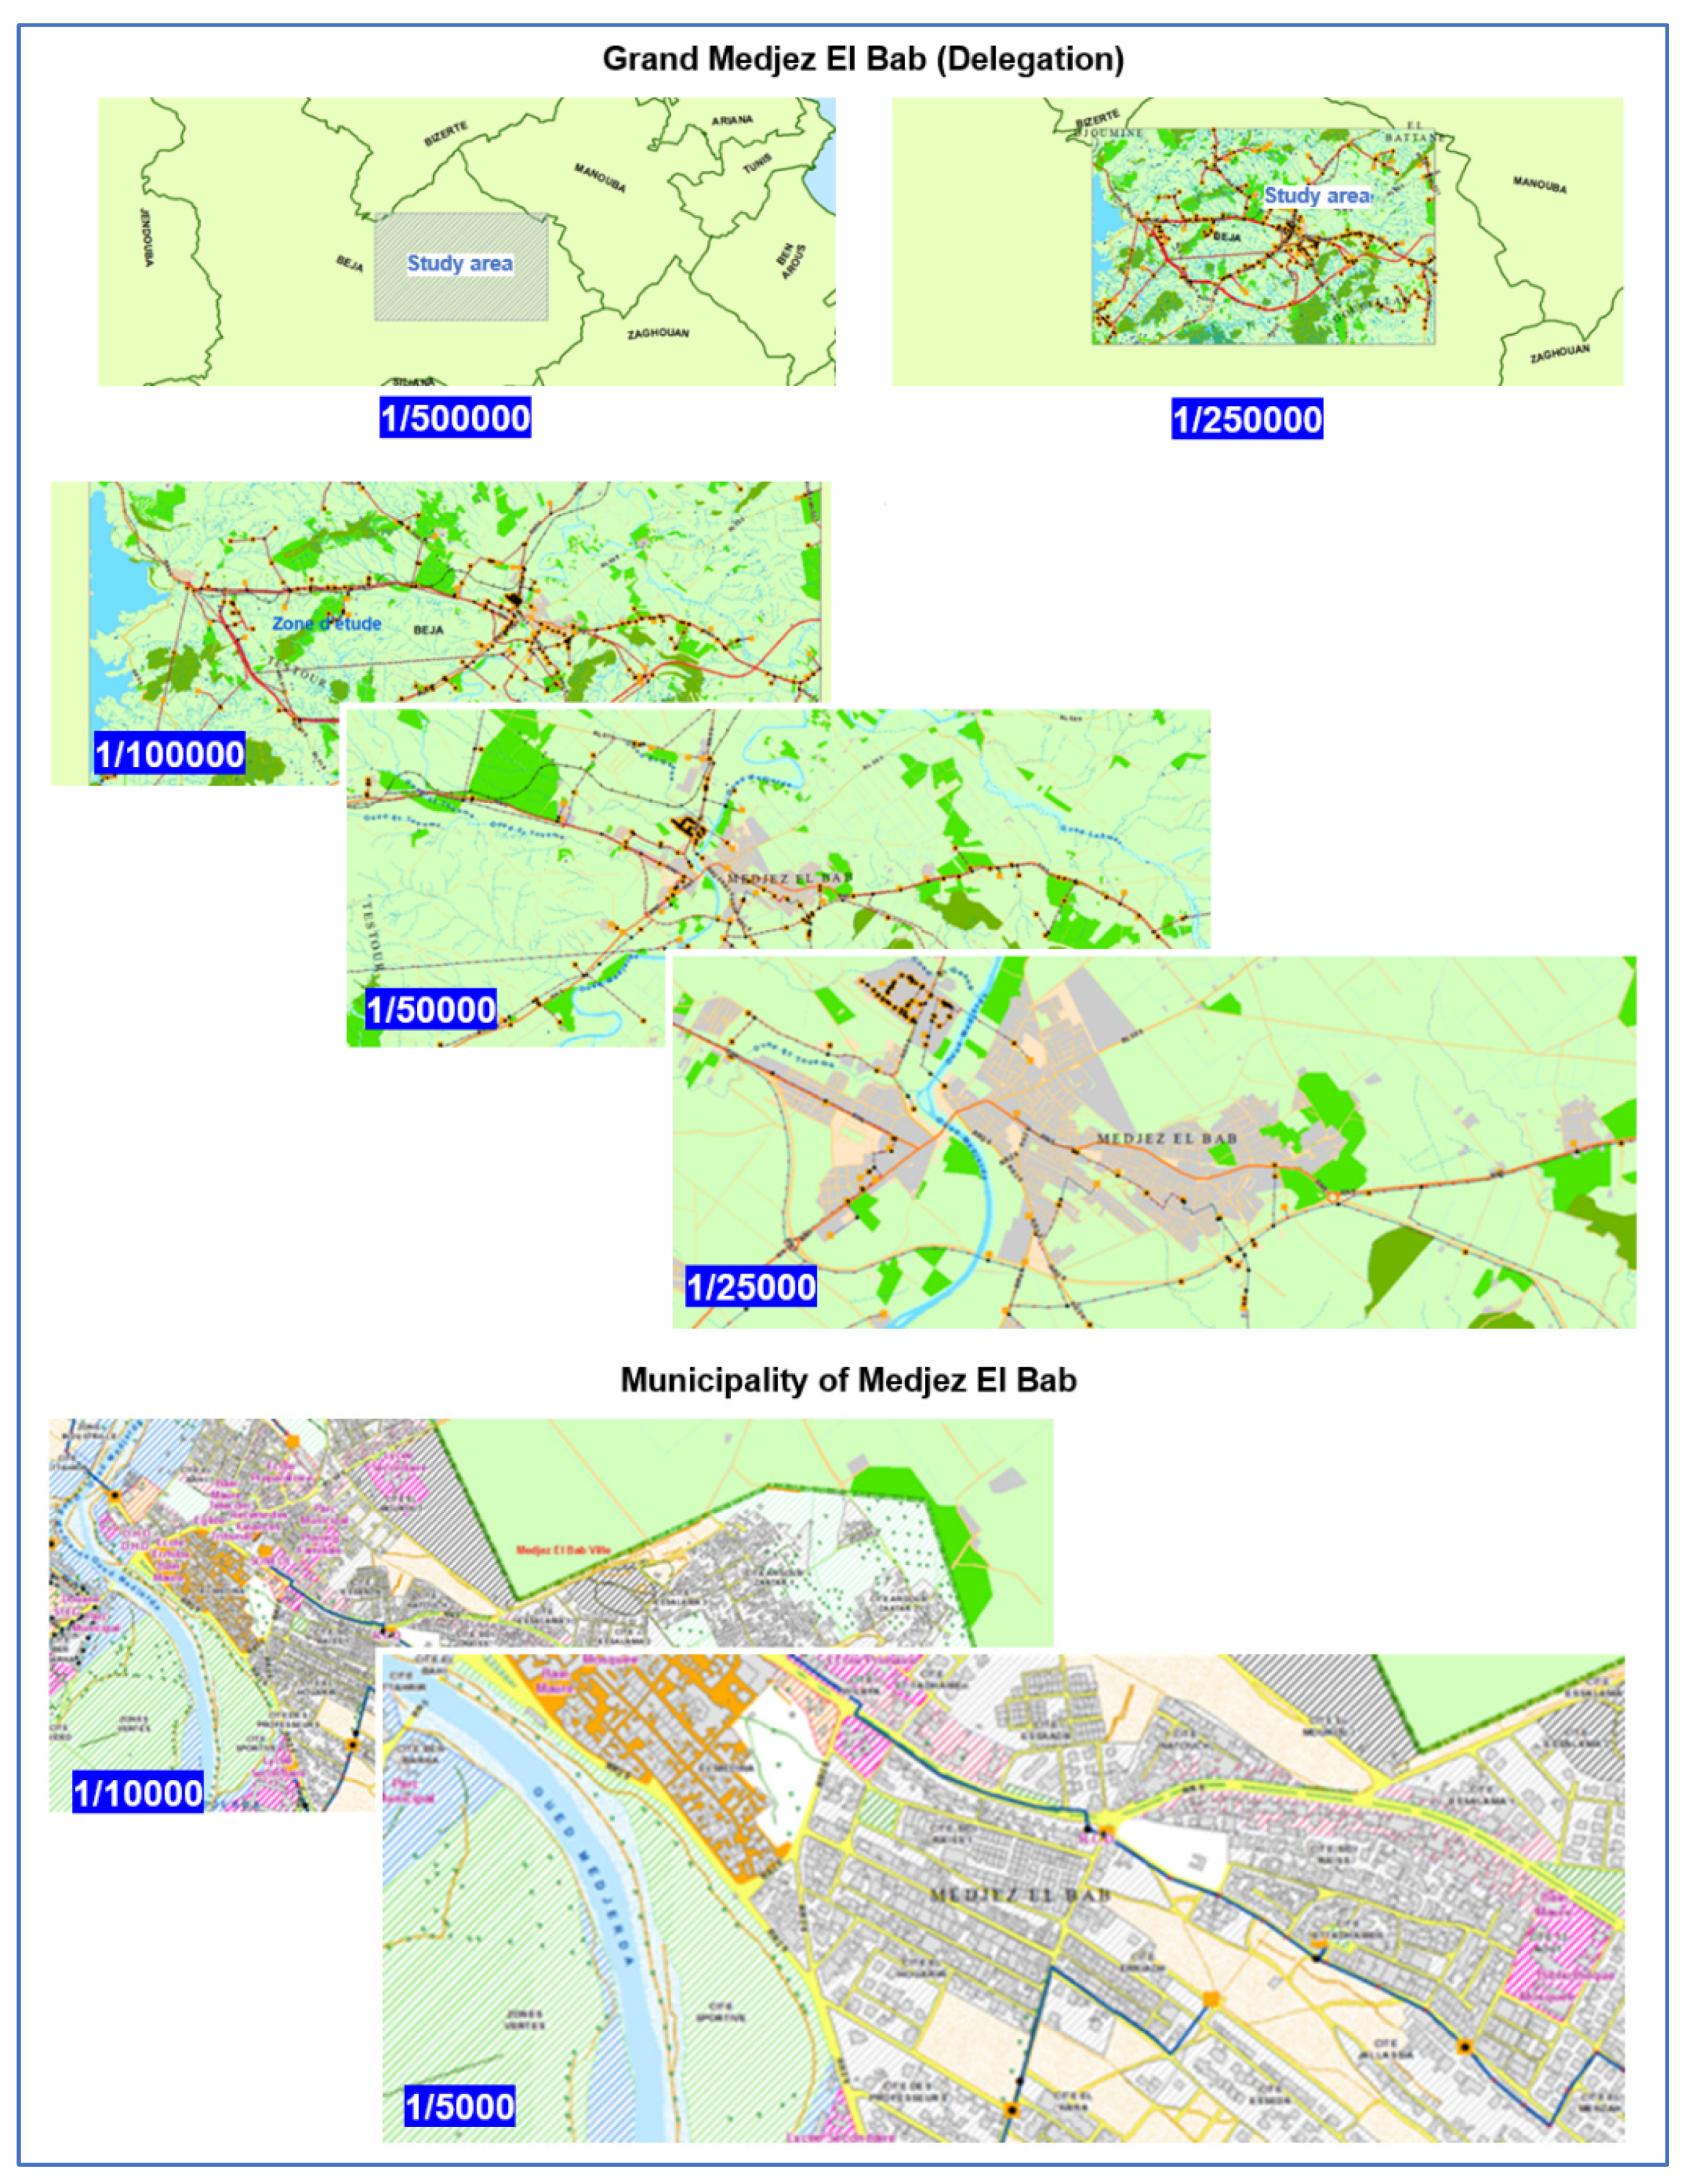
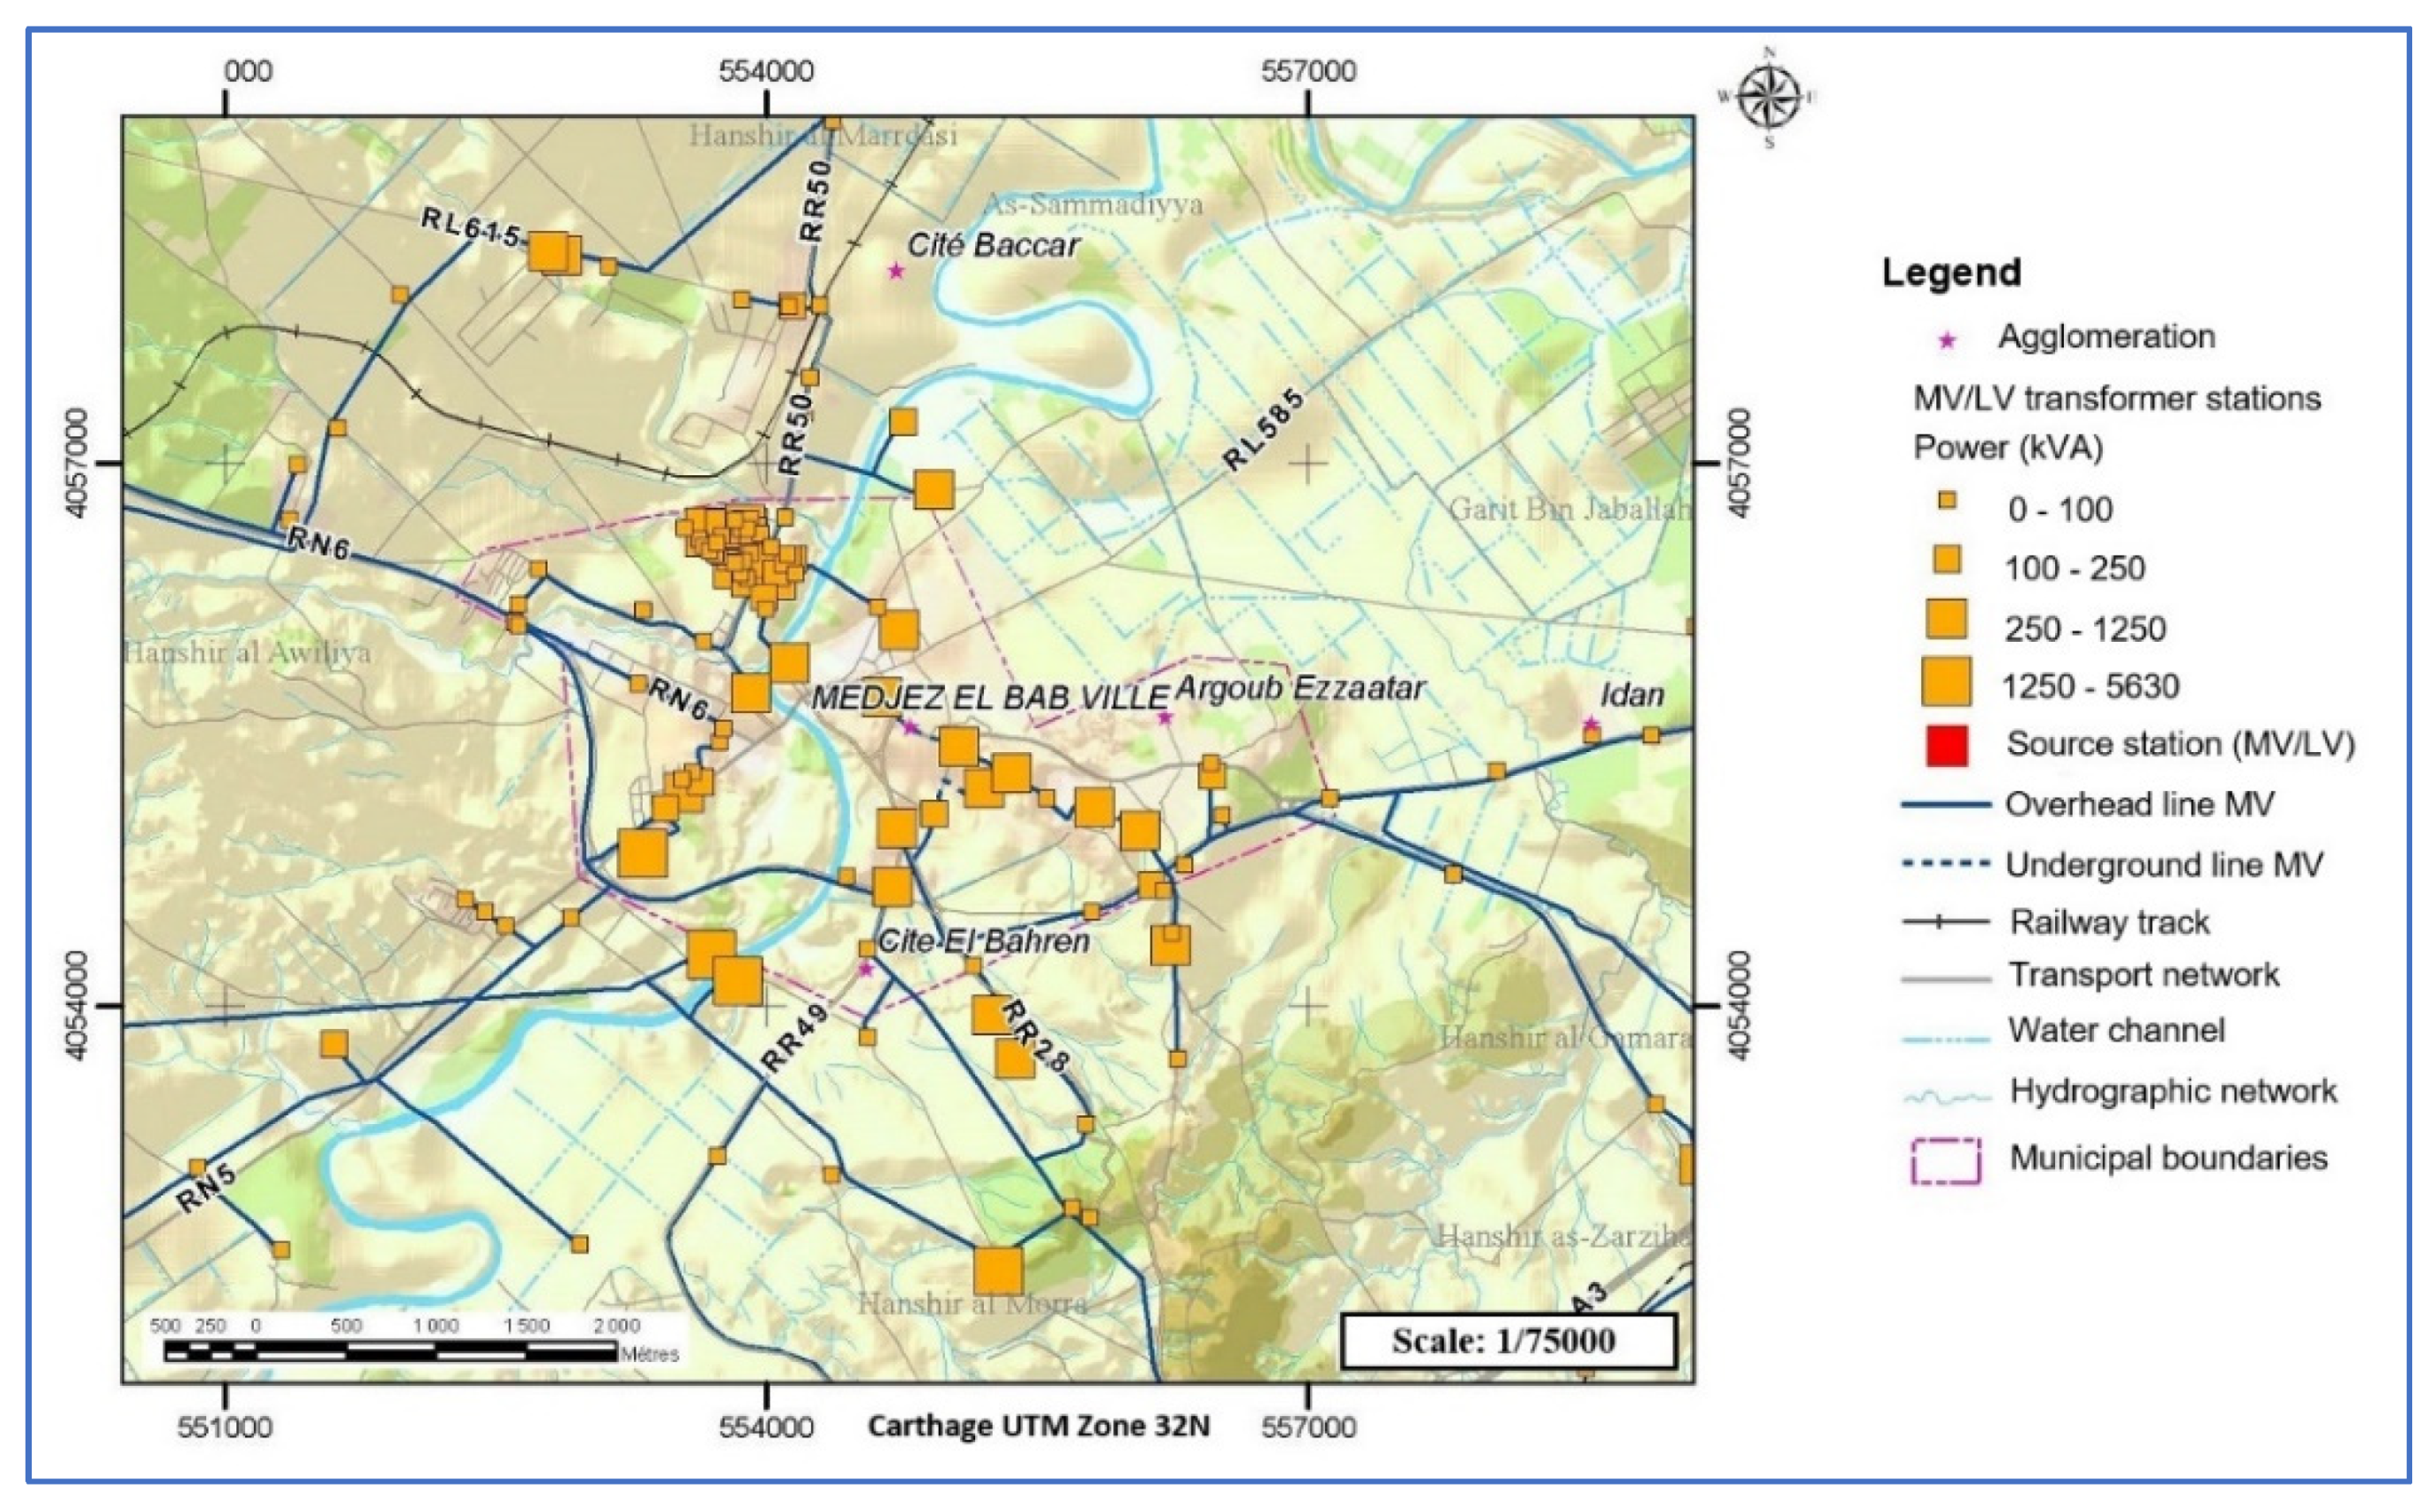
2.2.3. Elaboration of Thematic Maps
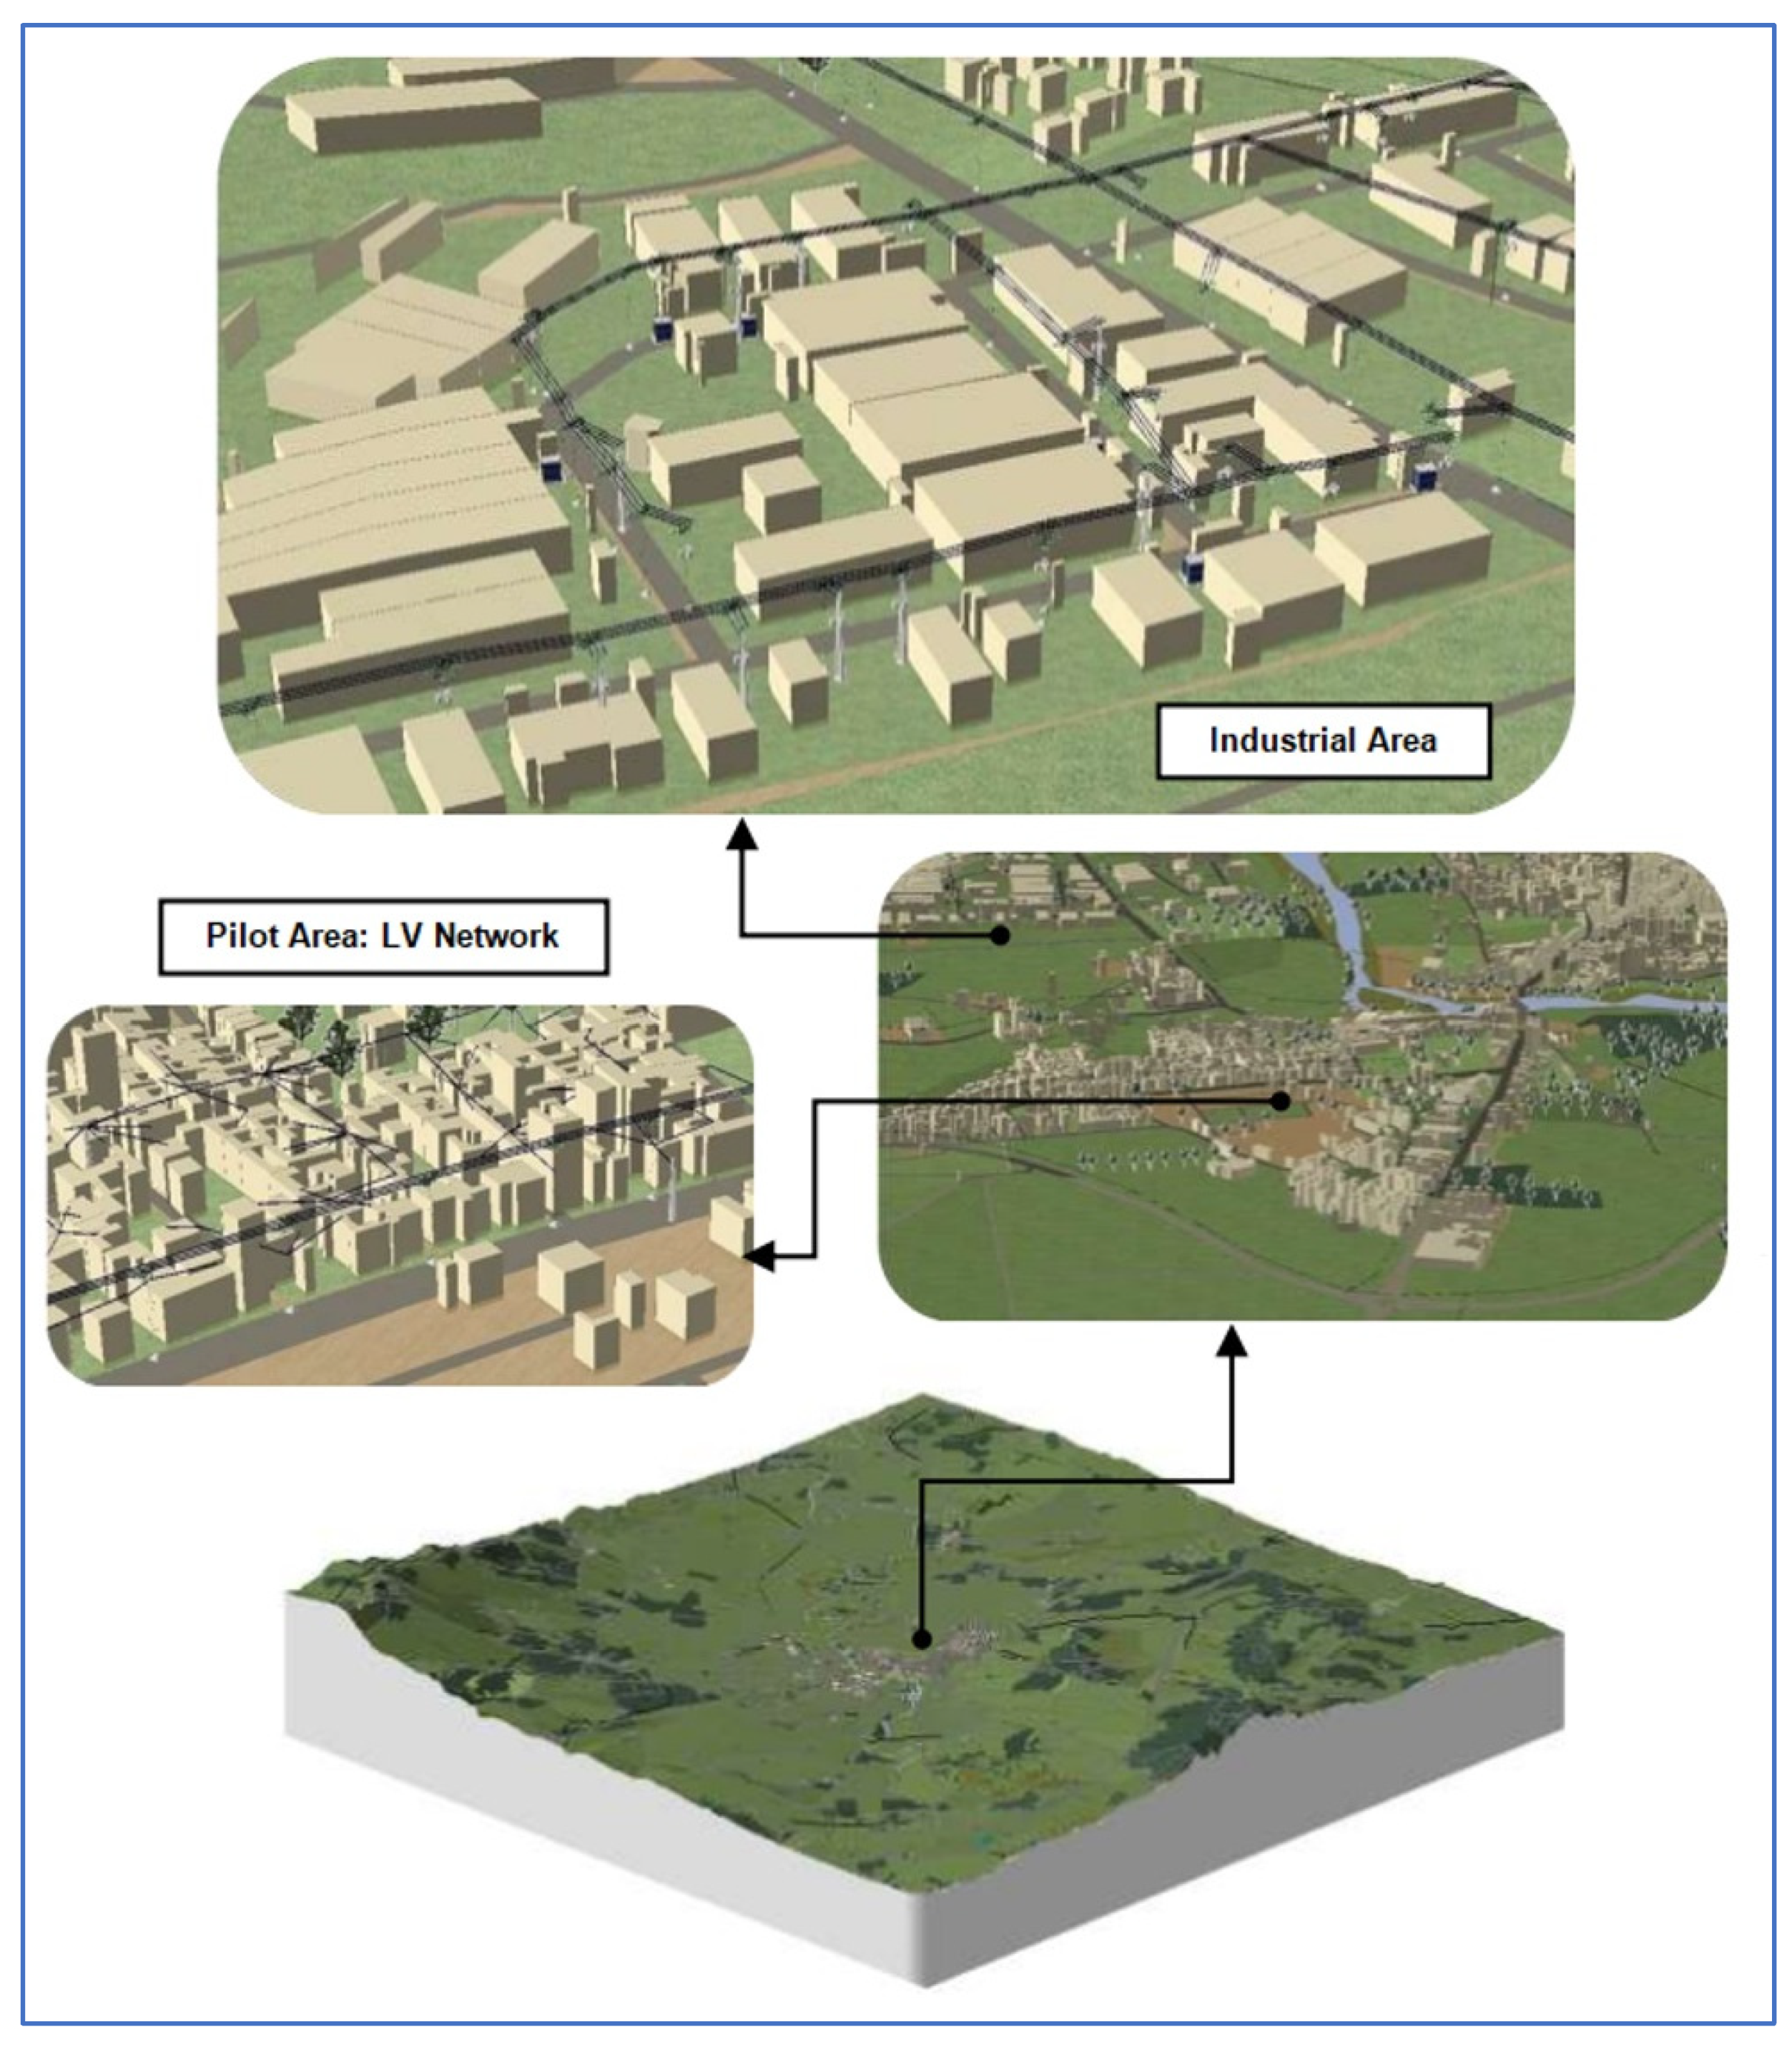
2.2.4. Elaboration of A 3D Virtual City
2.3. Web and 3D Web GIS Applications and Website Development
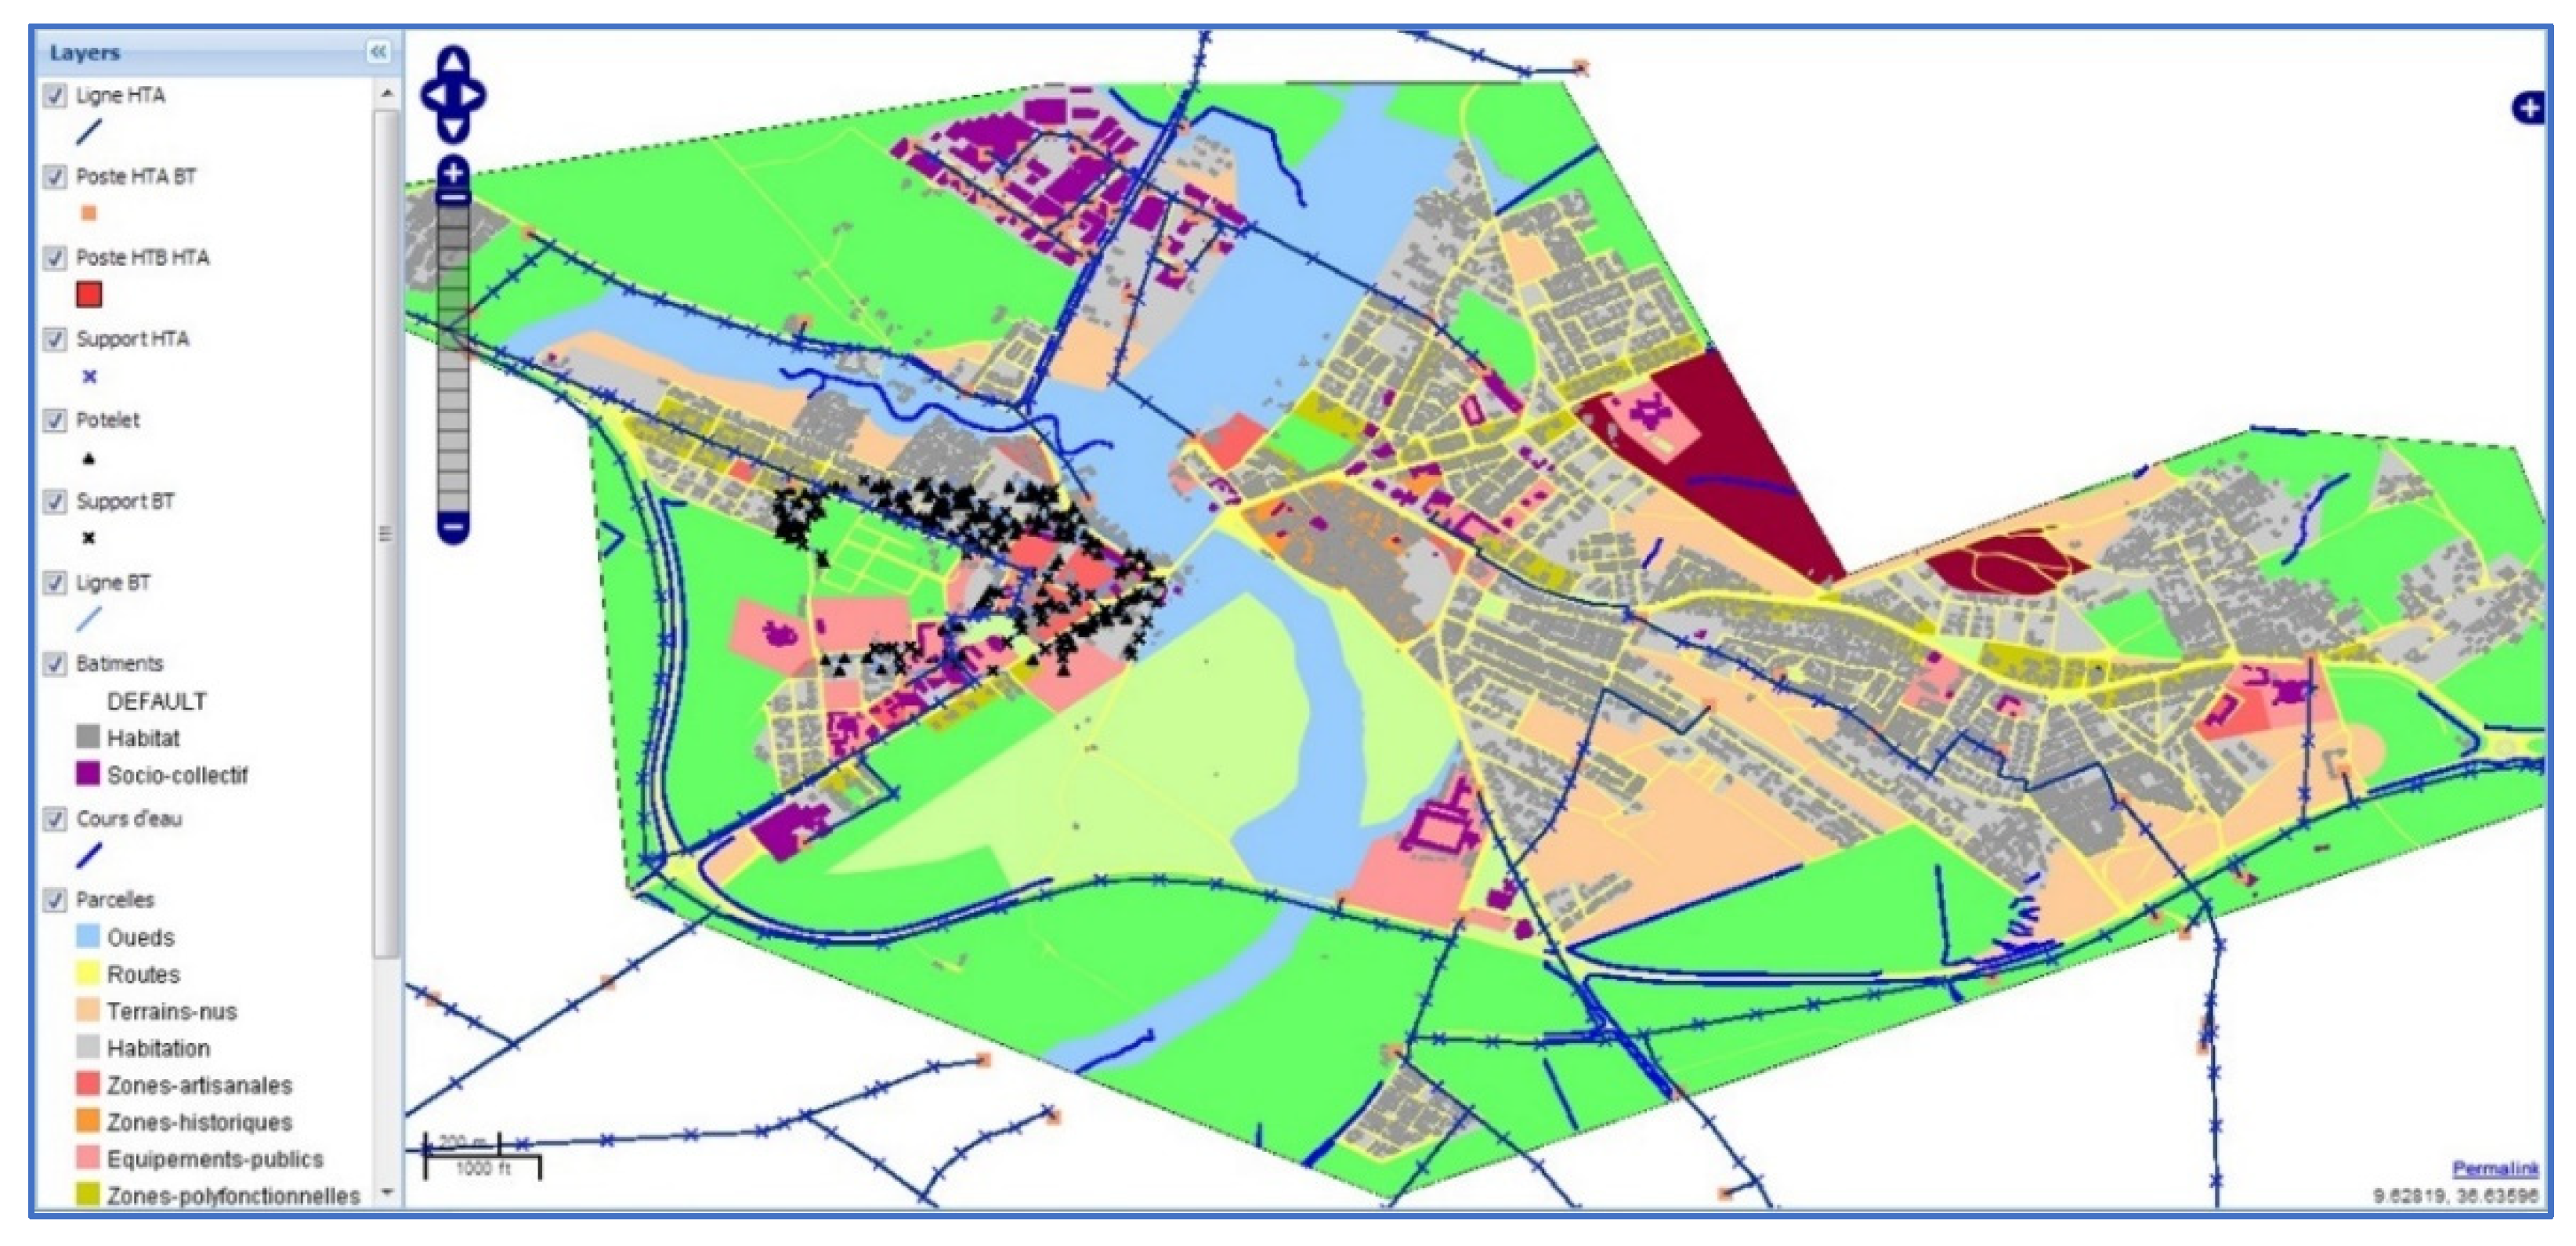
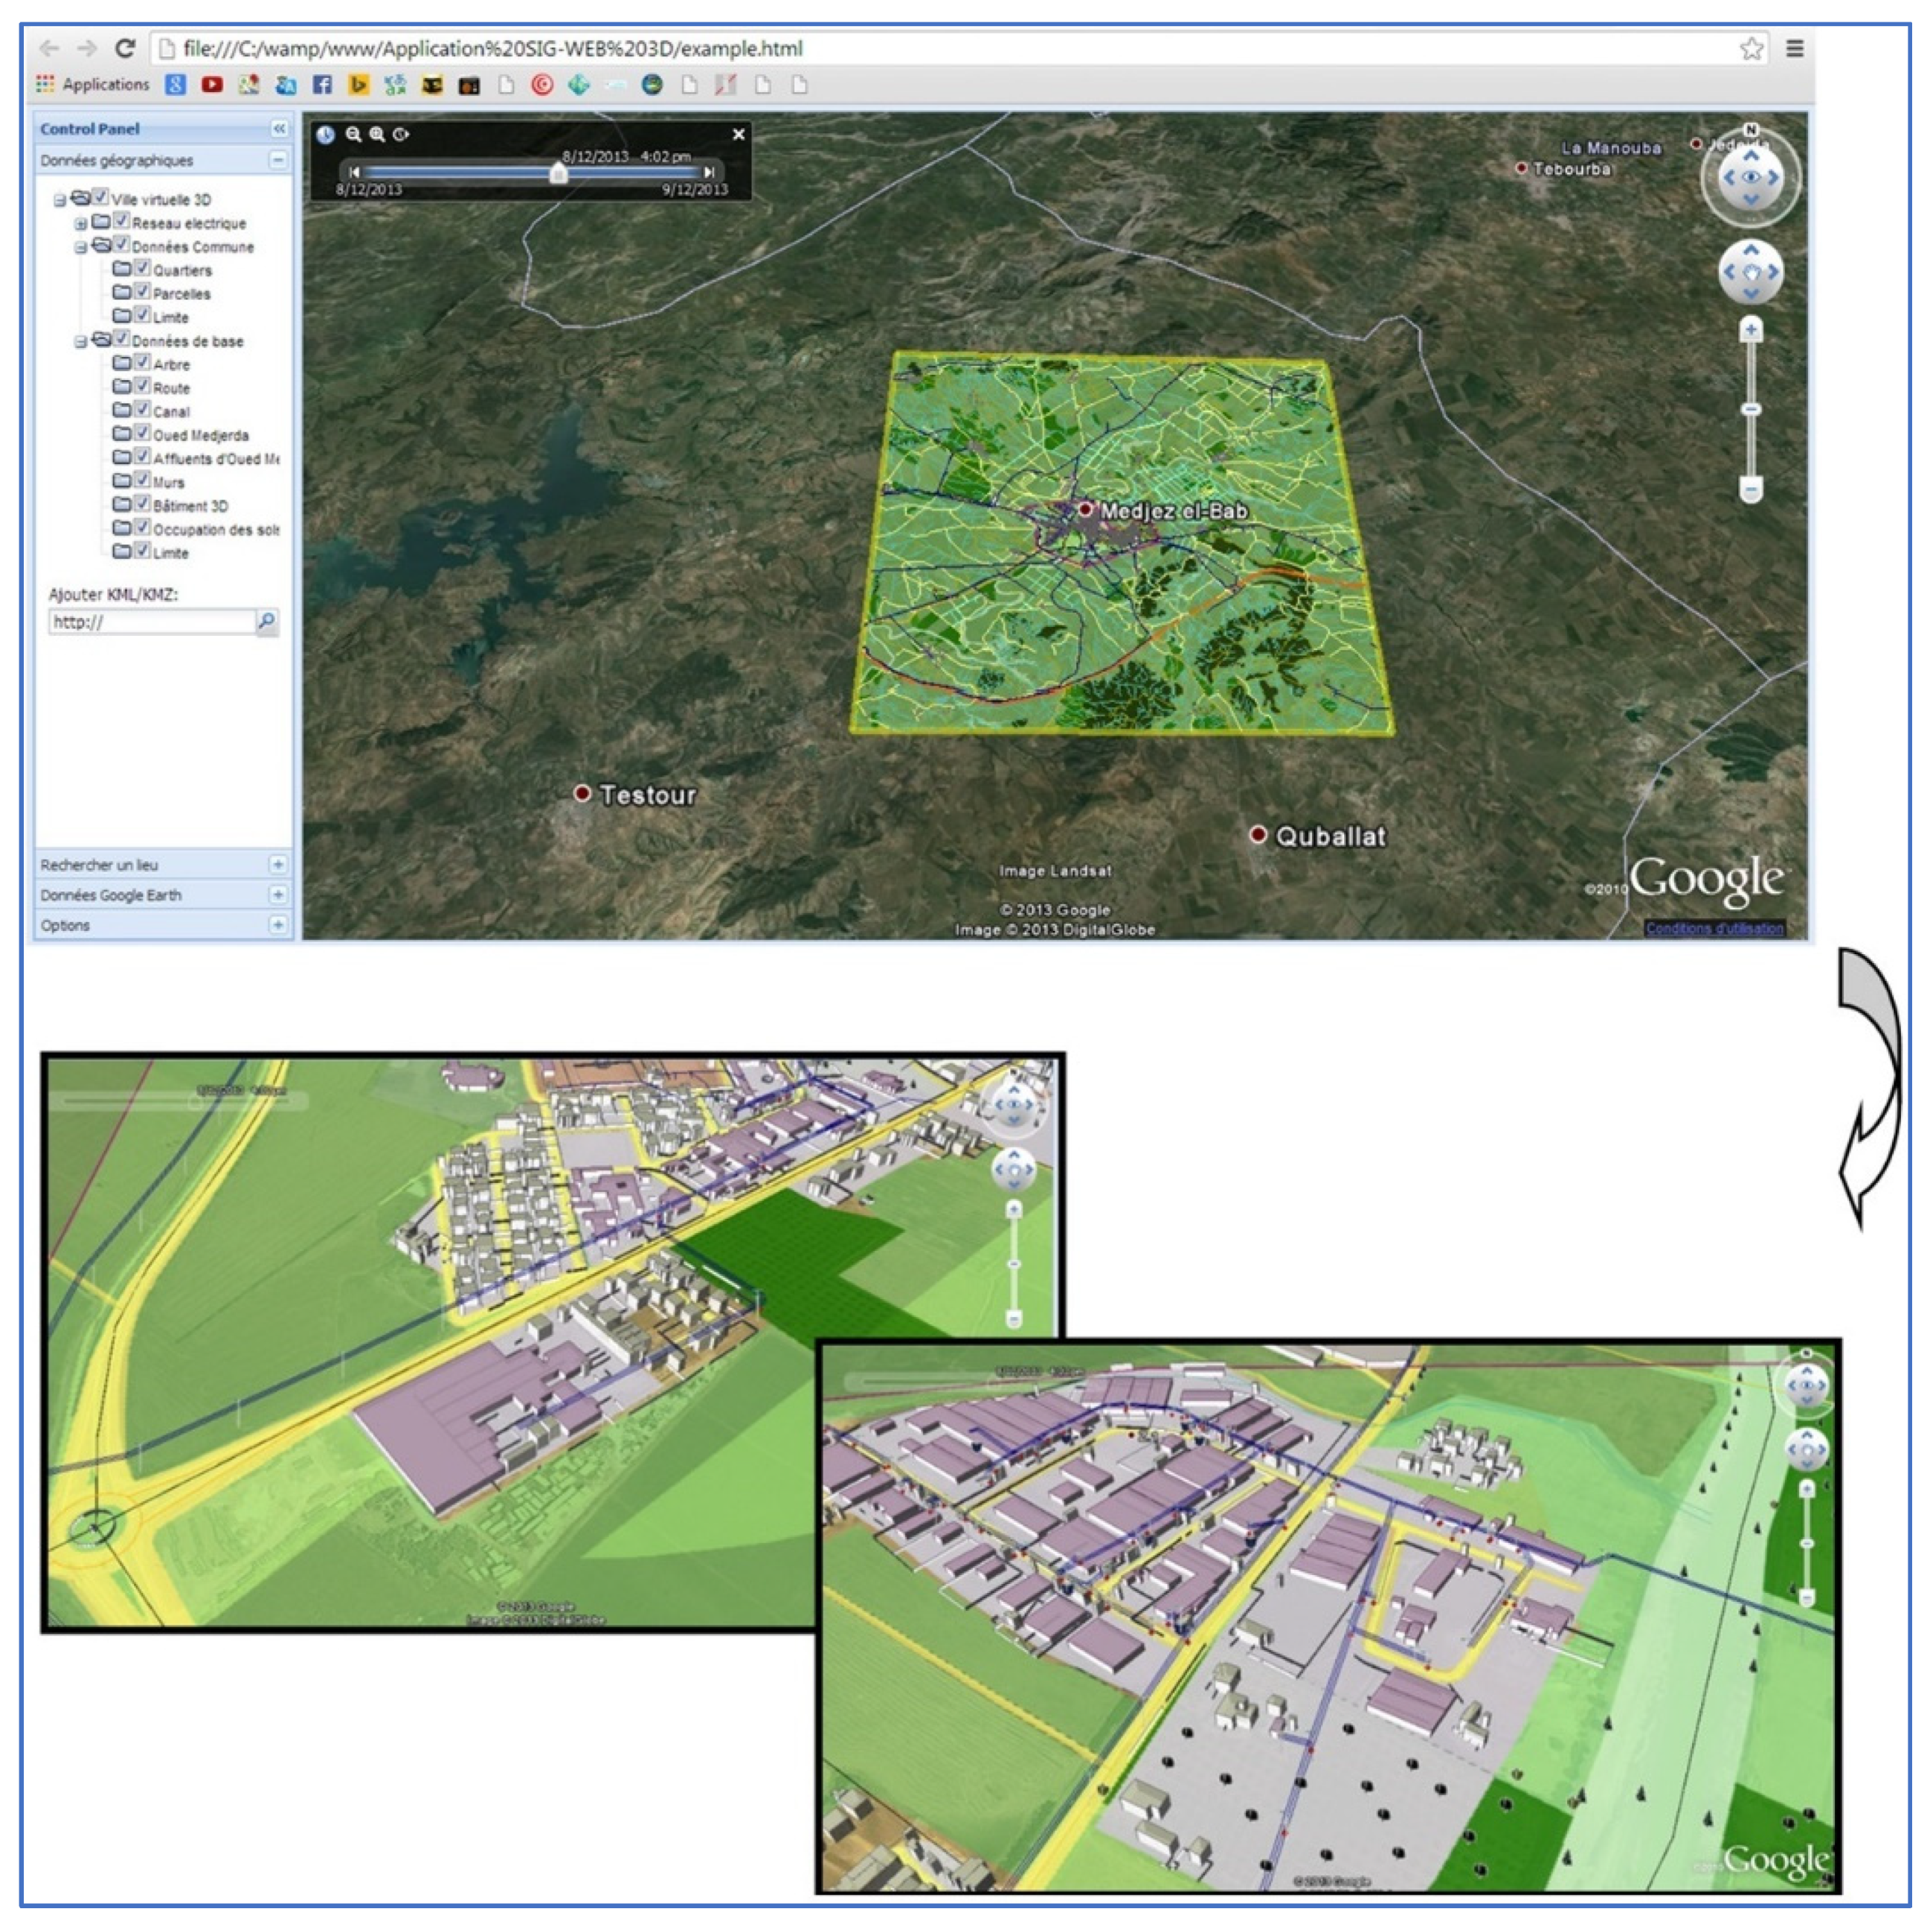
2.3.1. Web and 3D Web GIS Applications
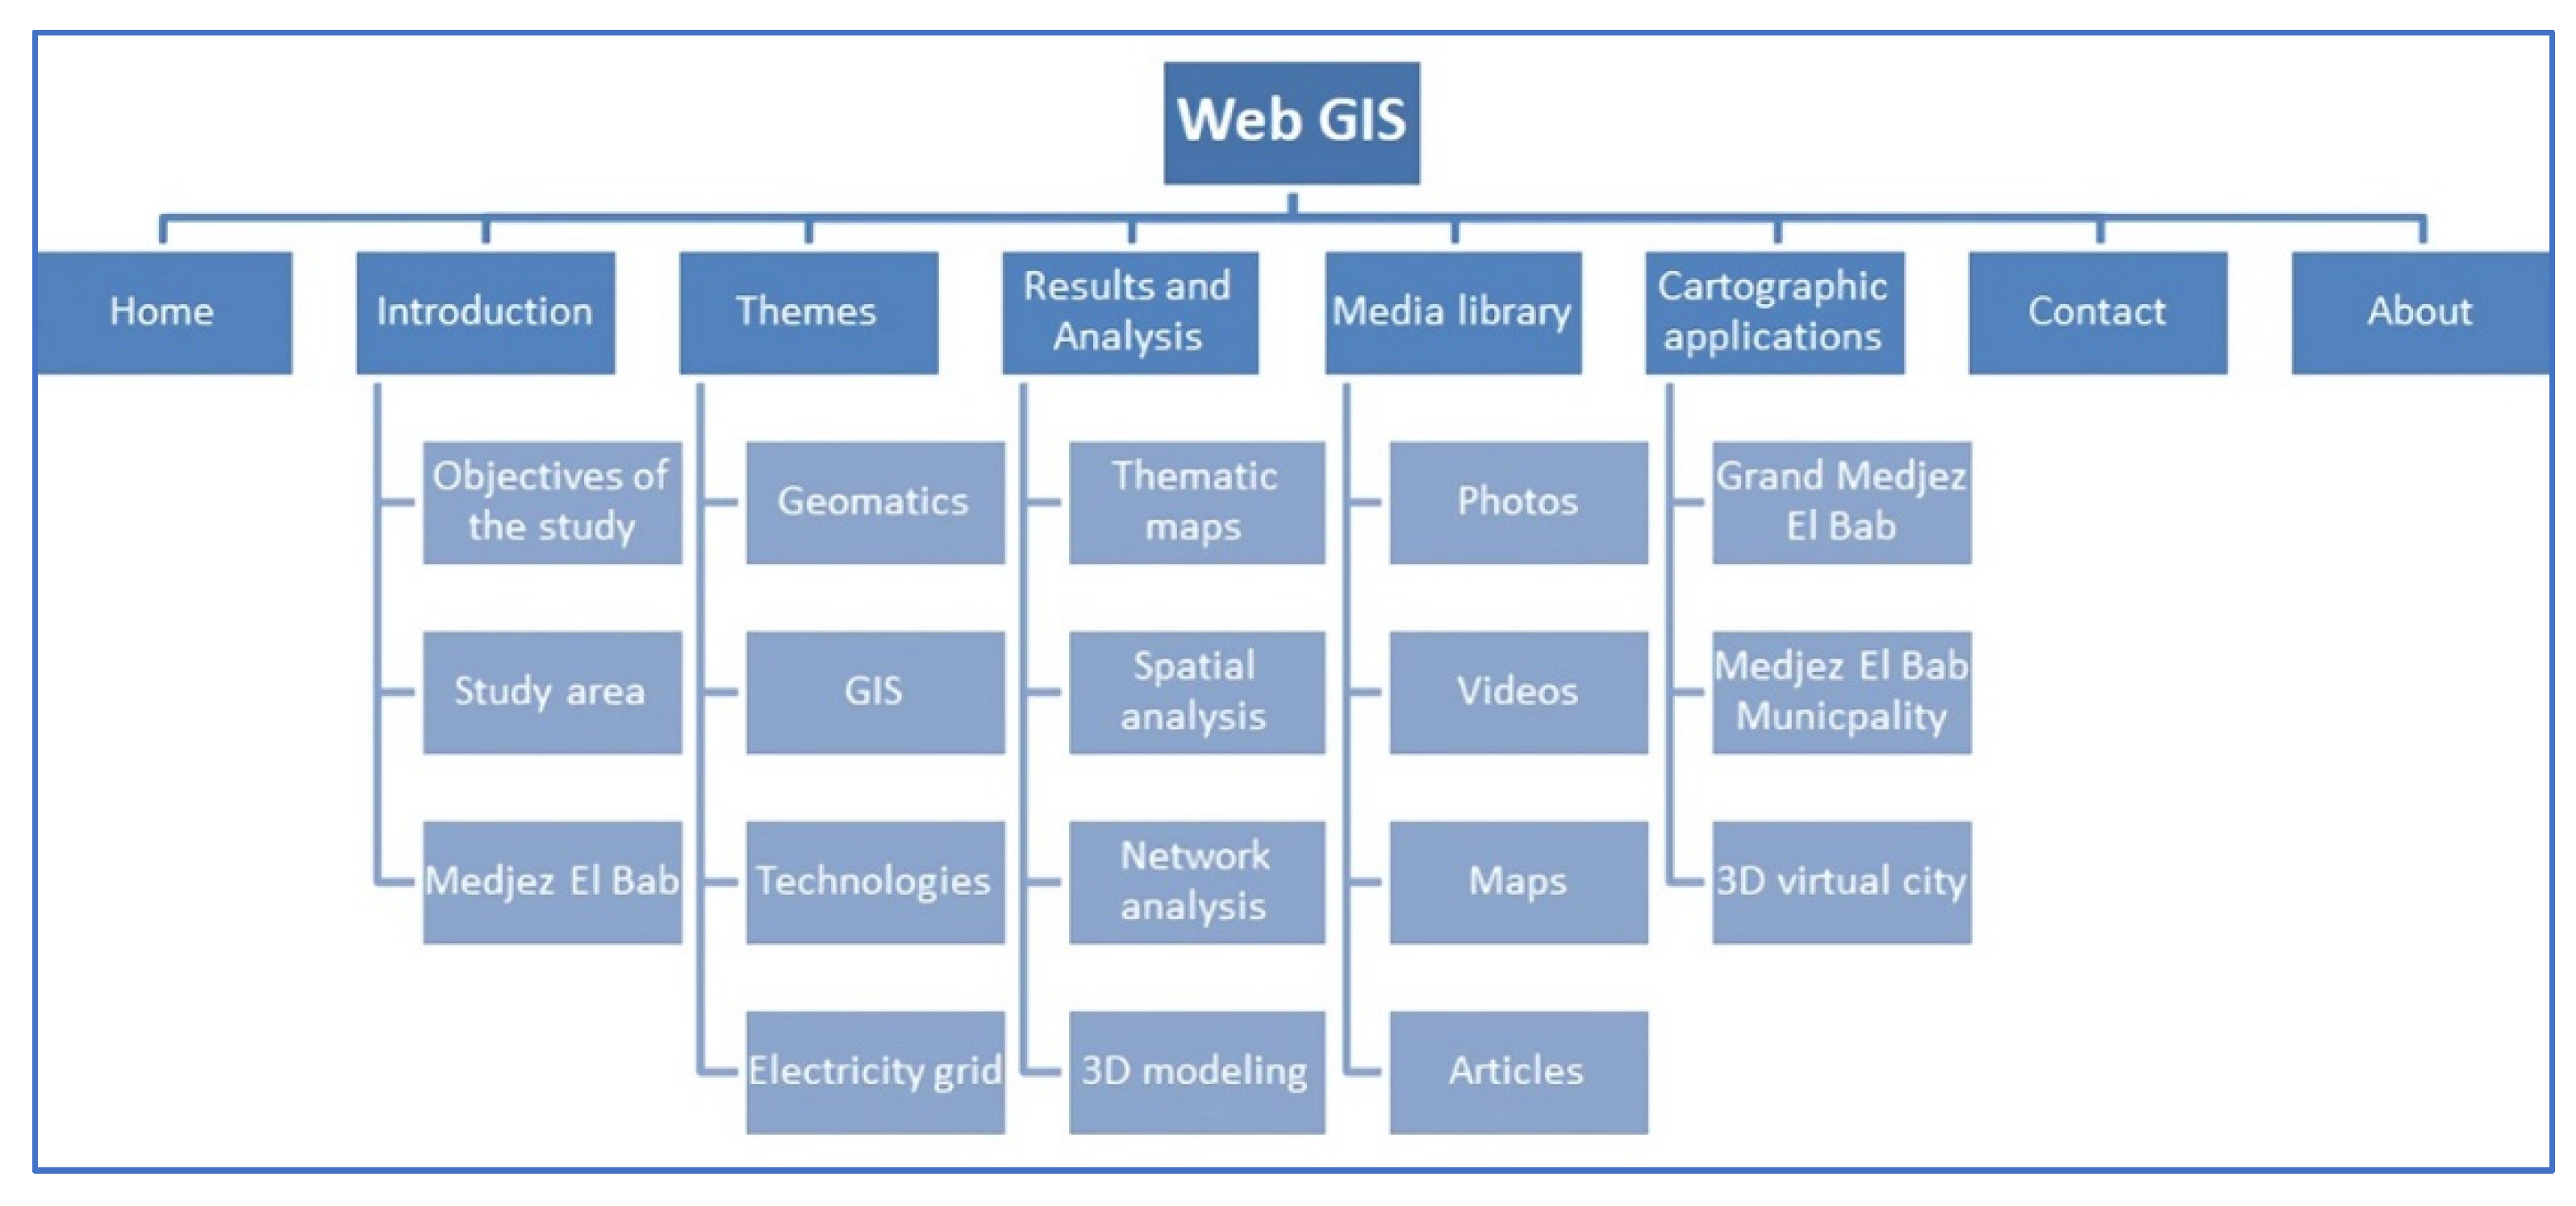
2.3.2. Website Development
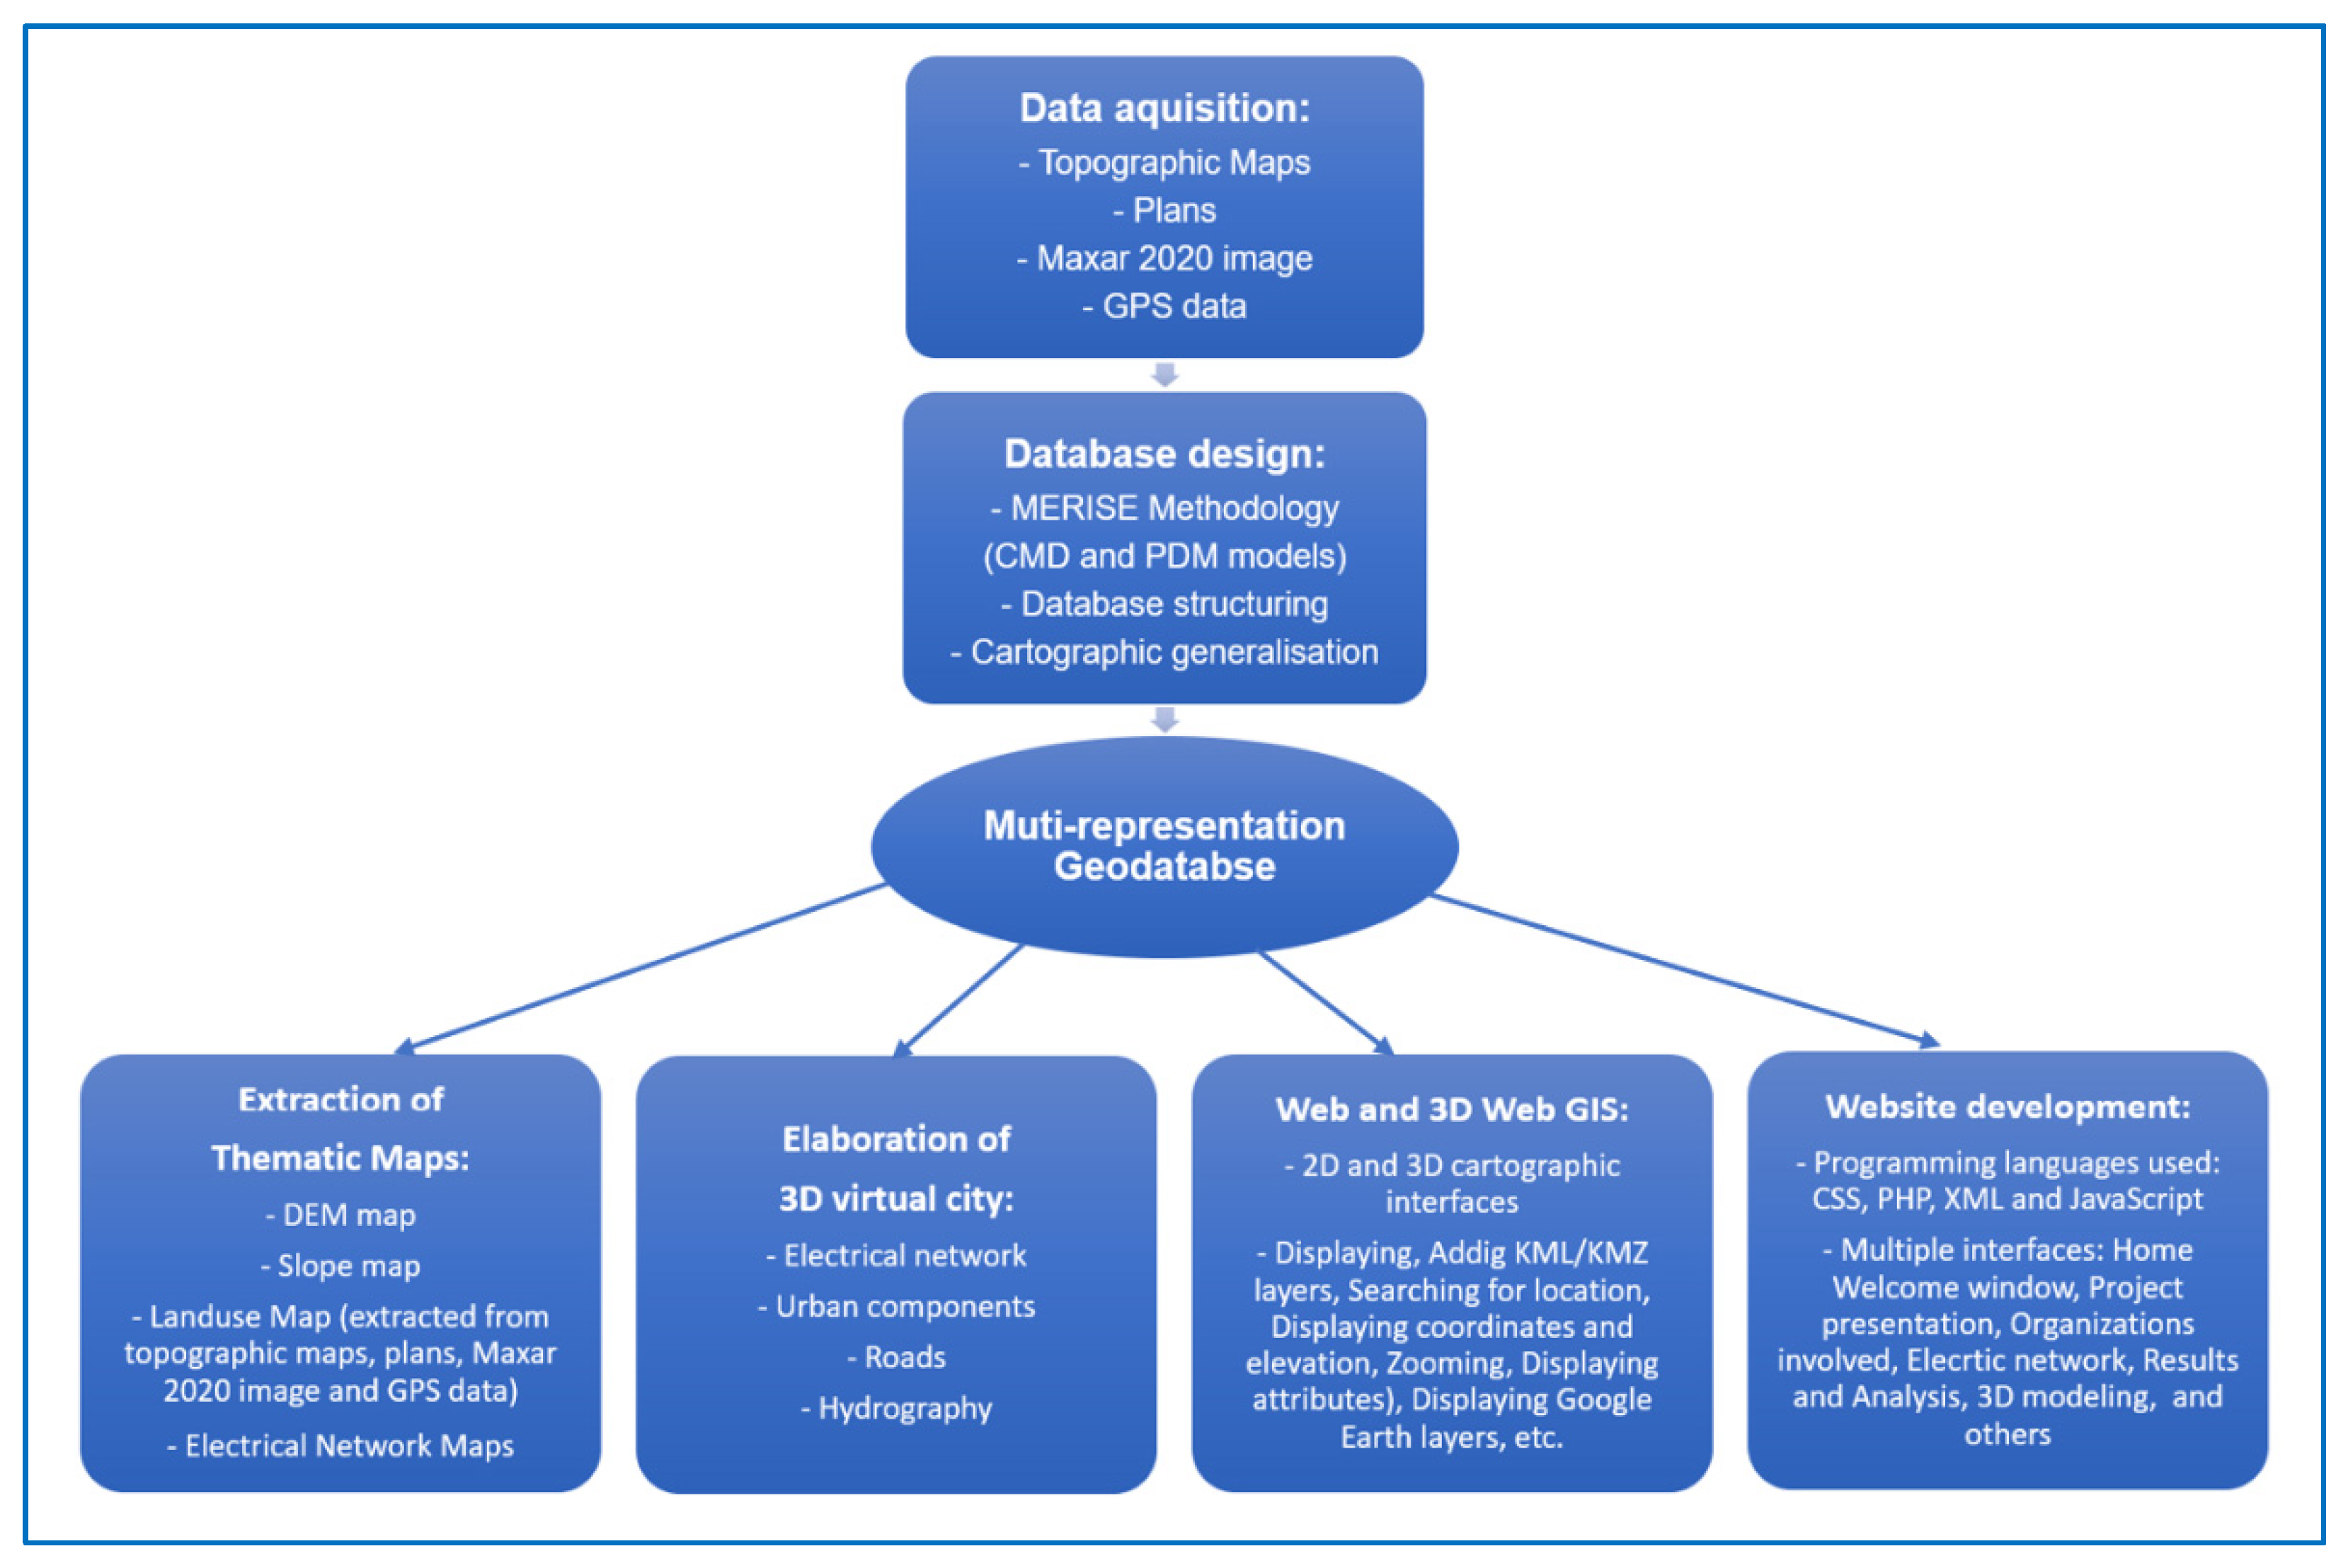
2.4. Methodology Graphical Summary
3. Results and Discussion
4. Conclusions
Author Contributions
Funding
Institutional Review Board Statement
Informed Consent Statement
Data Availability Statement
Conflicts of Interest
References
- Gonen, T. Electrical Power Transmission System Engineering, Analysis and Design, 3rd ed.; CRC Press, Taylor and Francis: New York, NY, USA, 2014. [Google Scholar] [CrossRef]
- Wei, W.; Liu, F.; Mei, S. Charging strategies of EV aggregator under renewable generation and congestion: A normalized nash equilibrium approach. IEEE Trans. Smart Grid 2016, 7, 1630–1641. [Google Scholar] [CrossRef]
- Luo, Z.; Hu, Z.; Song, Y.; Xu, Z.; Lu, H. Optimal coordination of plug-in electric vehicles in power grids with cost-benefit analysis—Part II: A case study in China. IEEE Trans. Power Syst. 2013, 28, 3556–3565. [Google Scholar] [CrossRef]
- Mejía-Alzate, M.L. Análisis Interorganizacional en la Gobernanza Turística de la Ciudad de Colombia. Rev. Lat.-Am. Tur. 2018, 4, 8–22. [Google Scholar] [CrossRef]
- Câmara, A.M.M.; Gilberto, S.D.F.; Marília, S.C. Spatial Analysis and GIS: A Primer; Image Processing Division, National Institute for Space Research (INPE): Rio de Janeiro, Brazil, 2004. [Google Scholar]
- Hamza, M.H.; Added, A.; Rodriguez, R.; Abdeljaoued, S.; Ben Mammou, A. A GIS-based DRASTIC vulnerability and net recharge reassessment in an aquifer of a semi-arid region (Metline-Ras Jebel-Raf Rafaquifer, Northern Tunisia). J. Environ. Manag. 2007, 84, 12–19. [Google Scholar] [CrossRef] [PubMed]
- Gutiérrez Pueblo, J.; Gould, M. SIG: Sistemas de Información Geográfica; Síntesis: Madrid, Spain, 1994. [Google Scholar]
- Steede-Terry, K. Integrating GIS and the Global Positioning System; ESRI: Redlands, CA, USA, 2000. [Google Scholar]
- Mejia Alzate, M.A.; Melo Trujillo, J.D.; Zambrano-Asanza, S.; Padilha-Feltri, A. Spatial-temporal growth model to estimate the adoption of new end-use electric technologies encouraged by energy-efficiency programs. Energy 2020, 191, 116531. [Google Scholar] [CrossRef]
- Mejia Alzate, M.A.; Melo Trujillo, J.D.; Padilha Feltrin, A.; Sánchez Zuleta, C.C.; Fernández Gutiérrez, J.P. Geographical information systems as a Tool to assist the electricity distribution Networks planning. Revista EIA 2018, 15, 71–85. [Google Scholar] [CrossRef] [Green Version]
- Nawaz-ul-Huda, S.; Burke, F.; Azam, M.; Naz, S. GIS for power distribution network: A case study of Karachi, Pakistan. GEOGRAFIA Malays. J. Soc. Space 2012, 8, 60–68. [Google Scholar]
- Kaijuka, E. GIS and rural electricity planning in Uganda. J. Clean. Prod. 2007, 15, 203–217. [Google Scholar] [CrossRef]
- Putz, S. Interactive information services using World Wide Web Hypertext. In Proceedings of the First International Conference on World Wide Web, Geneva, Switzerland, 25–27 May 1994. [Google Scholar]
- Longley, P.A.; Goodchild, M.F.; Maguire, D.J.; Rhind, D.W. Geographic Information Systems and Science, 2nd ed.; Wiley: Chichester, UK, 2005. [Google Scholar]
- Datta, A.; Mohanty, P. Enterprise GIS and Smart Electric Grid for India’s power sector. In Proceedings of the IEEE PES Innovative Smart Grid Technologies Conference (ISGT), Washington, DC, USA, 24–27 February 2013; pp. 1–7. [Google Scholar] [CrossRef]
- Chmit, M. Conception et réalisation d’une application SIG-WEB pour l’analyse et la gestion des réseaux électriques HTA/BT de la ville de Medjez El Bab. Master’s Thesis, Université de Tunis El Manar, Tunis, Tunisia, January 2014. [Google Scholar]
- Zheng, F.M.; Ma, L.; Liu, N.; Chen, J. Assessment for Distribution Network Planning Schemes of Urban Electric Power System. Energy Procedia 2012, 14, 1067–1074. [Google Scholar] [CrossRef] [Green Version]
- Mentis, D.; Welsch, M.; Nerini, F.F.; Broad, O.; Howells, M.; Bazilian, M.; Rogner, H. A GIS-based approach for electrification planning—A case study on Nigeria. Energy Sustain. Dev. 2015, 29, 142–150. [Google Scholar] [CrossRef]
- Candelise, C.; Westacott, P. Can integration of PV within UK electricity network be improved? A GIS based assessment of storage. Energy Policy 2017, 109, 694–703. [Google Scholar] [CrossRef]
- Ashkezari, A.D.; Hosseinzadeh, N.; Chebli, A.; Albadi, M. Development of an enterprise Geographic Information System (GIS) integrated with smart grid. Sustain. Energy Grids Netw. 2018, 14, 25–34. [Google Scholar] [CrossRef]
- Taye, B.; Workineh, T.; Nebey, A.; Kefale, H.A. Rural electrification planning using Geographic Information System (GIS). Cogent Eng. 2020, 7, 1836730. [Google Scholar] [CrossRef]
- Office de la Topographie et du Cadastre OTC Topographic Maps 1/25000: Beja S.E (Feuille N° 18), Tebourba S.E (Feuille N° 19), Tebourba S.O (Feuille N° 19), Oued Ezzarga (Feuille N° 26), Oued Ezzarga (Feuille N° 26), Mjaz al Bab NE (Feuille N° 27), Mjaz al Bab NO (Feuille N° 27), Mjaz al Bab SE (Feuille N° 27), Mjaz al Bab SO (Feuille N° 27), 1982 to 1988. Available online: https://www.otc.nat.tn/ (accessed on 10 February 2022).
- Ben Lassoued, T. Topographic Plans of Medjez El Bab, Scale 1:1000; BETBEL Technical Consultant Office: Tunis, Tunisia, 2006. [Google Scholar]
- Maxar Technologies. Maxar Technologies Awarded Four-Year Global EGD Contract by the U.S. Government for On Demand Access to Mission-Ready Satellite Imagery. Sensor and Systems. 28 August 2019. Available online: https://www.maxar.com (accessed on 10 February 2022).
- Rochfeld, A.; Tardieu, H. MERISE: An information system design and development methodology. Inf. Manag. 1983, 6, 143–159. [Google Scholar] [CrossRef]
- Avison, D. MERISE: A European Methodology for Developing Information Systems. Eur. J. Inf. Syst. 1991, 1, 183–191. [Google Scholar] [CrossRef]
- Sherman, R. Chapter 8: Foundational Data Modeling. In Business Intelligence Guidebook from Data Integration to Analytics; Elsvier: Amsterdam, The Netherlands, 2015; pp. 173–195. [Google Scholar]
- Perkal, J. An Attempt at Objective Generalization: Discussion Papers of The Michigan Inter-University Community of Mathematical Geographers; Proba obiektywnej generalizacji, Geodezja i Karografia; (1958) English translation; 1965; Volume VII, pp. 130–142. Available online: http://www-personal.umich.edu/~copyrght/image/micmg/perkal2/perkal2.pdf (accessed on 18 June 2021).
- Tobler, W.R. Numerical Map Generalization: And, Notes on the Analysis of Geographical Distributions; Department of Geography, University of Michigan: Ann Arbor, MI, USA, 1966; Volume 3, pp. 10–16. [Google Scholar] [CrossRef]
- Nyangweso, D. Cartographic Generalization in Multi-scale Environment: Case study of Lamu County, Kenya. Int. J. Sci. Res. (IJSR) 2013, 5, 804–813. [Google Scholar] [CrossRef]
- Hutchinson, M.F. Calculation of hydrologically sound digital elevation models. In Proceedings of the Third International Symposium on Spatial Data Handling, Sydney, Australia, 17–19 August 1988. [Google Scholar]
- Hutchinson, M.F. A new procedure for gridding elevation and stream line data with automatic removal of spurious pits. J. Hydrol. 1989, 106, 211–232. [Google Scholar] [CrossRef]
- Singh, S.P.; Jain, K.; Mandla, V.R. Virtual 3D city modeling: Techniques and applications. ISPRS-Int. Arch. Photogramm. Remote Sens. Spat. Inf. Sci. 2013, XL-2/W2, 73–91. [Google Scholar] [CrossRef] [Green Version]
- Biljecki, F.; Ledoux, H.; Stoter, J.; Vosselman, G. The variants of an LOD of a 3D building model and their influence on spatial analyses. ISPRS J. Photogramm. Remote Sens. 2016, 116, 42–54. [Google Scholar] [CrossRef] [Green Version]
- Mignard, C.; Nicolle, C. Merging BIM and GIS using ontologies application to urban facility management in ACTIVe3D. Comput. Ind. 2014, 65, 1276–1290. [Google Scholar] [CrossRef]
- Tekdal-Emniyeti, E.; Haefele, K.; Isele, J.; Celik, R.N. 3D documentation of historical sites and buildings for interdisciplinary works; Proc. SPIE 8085. In Videometrics, Range Imaging, and Applications XI; International Society for Optics and Photonics: Bellingham, WA, USA, 2011; p. 80850V. [Google Scholar] [CrossRef]
- Internet World Stats. Usage and Population Statistics. 2020. Available online: http://www.internetworldstats.com/stats.htm (accessed on 18 June 2021).
- Auer, M.; Zipf, A. 3D WebGIS: From Visualization to Analysis. An Efficient Browser-Based 3D Line-of-Sight Analysis. ISPRS Int. J. Geo-Inf. 2018, 7, 279. [Google Scholar] [CrossRef] [Green Version]
- Siddiqueea, M.Z.H.; Strzalkab, A.; Eicker, U. Publication of energy consumption data of Scharnhauser park via Web GIS. In Proceedings of the Conference of the Applied Geoinformatics for Society and Environment, Stuttgart, Germany, 12–17 July 2009; Volume 103. [Google Scholar]
- Von Schwerin, J.; Richards-Rissetto, H.; Remondino, F.; Agugiaro, G.; Girardi, G. The MayaArch3D project: A 3D WebGIS for analyzing ancient architecture and landscapes. Lit. Linguist. Comput. 2013, 28, 736–753. [Google Scholar] [CrossRef] [Green Version]
- Victor, N. Modélisation de l’accessibilité piétonne à Luxembourg-Ville, Rapport de Stage, CEPS/INSTEAD, Master SIG et Gestion de l’Espace, Université Jean Monnet, Saint-Etienne, 54 p. (+ Annexes et Livret Cartographique). 2010. Available online: https://www.academia.edu/12162636/Mod%C3%A9lisation_et_visualisation_de_l_accessibilit%C3%A9_pi%C3%A9tonne_%C3%A0_Luxembourg-ville (accessed on 18 June 2021).
- Lassarre, S.; Bonnet, E.; Bodin, F.; Papadimitriou, E.; Yannis, G.; Golias, J. A GIS-based methodology for identifying pedestrians’ crossing patterns. Comput. Environ. Urban Syst. 2012, 36, 321–330. [Google Scholar] [CrossRef]
- Alemdar, K.D.; Tortum, A.; Kaya, Ö.; Atalay, A. Interdisciplinary evaluation of intersection performances-A microsimulationbased MCDA. Sustainability 2021, 13, 1859. [Google Scholar] [CrossRef]
- Das, D.; Ojha, A.K.; Kramsapi, H.; Baruah, P.P.; Dutta, M.K. Road network analysis of Guwahati city using GIS. SN Appl. Sci. 2019, 1, 906. [Google Scholar] [CrossRef] [Green Version]
- Shafabakhsh, G.A.; Famili, A.; Bahadori, M.S. GIS-based spatial analysis of urban traffic accidents: Case study in Mashhad, Iran. J. Traffic Transp. Eng. 2017, 4, 290–299. [Google Scholar] [CrossRef]
- He, B.; Mo, W.X.; Hu, J.X.; Yang, G.; Lu, G.J.; Liu, Y.Q. Development of power grid Web3D GIS based on Cesium. In Proceedings of the IEEE PES Asia-Pacific Power and Energy Engineering Conference (APPEEC), Xi’an, China, 25–28 October 2016; pp. 2465–2469. [Google Scholar] [CrossRef]
- Jianhui, W.; Xiangnan, M. Design and Research on the Management of the Electricity System of WebGIS; Lecture Notes in Electrical Engineering. In International Conference on Frontier Computing. FC 2020; Singapore, 10–13 July 2020, Chang, J.W., Yen, N., Hung, J.C., Eds.; Springer: Berlin, Germany, 2020; Volume 747. [Google Scholar] [CrossRef]
- Müller, M.F.; Thompson, S.E.; Kelly, M.N. Bridging the Information Gap: A WebGIS Tool for Rural Electrification in Data-scarce Regions. Appl. Energy 2016, 171, 277–286. [Google Scholar] [CrossRef] [Green Version]
- Entriken, R.; Lordan, R. Impacts of extreme events on transmission and distribution systems. In Proceedings of the IEEE Power and Energy Society General Meeting, San Diego, CA, USA, 22–26 July 2012. [Google Scholar] [CrossRef]
- Antoniucci, V.; Bisello, A.; Marella, G. Urban Density and Household-Electricity Consumption: An Analysis of the Italian Residential Building Stock. In Smart and Sustainable Planning for Cities and Regions: SSPCR 2019; Green Energy and Technology; Bisello, A., Vettorato, D., Ludlow, D., Baranzelli, C., Eds.; Springer: Cham, Switzerland, 2021. [Google Scholar] [CrossRef]
- Lasarte, E.; Rubiera, F.; Cuartas, B.M. Energy consumption and urban sprawl: Evidence for the Spanish case. J. Clean. Prod. 2018, 172, 3479–3486. [Google Scholar] [CrossRef]
- Che-Castaldo, J.P.; Cousin, R.; Daryanto, S.; Deng, G.; Feng ML, E.; Gupta, R.K.; Hong, D.; McGranaghan, R.M.; Owolabi, O.O.; Qu, T.; et al. Critical Risk Indicators (CRIs) for the electric power grid: A survey and discussion of interconnected effects. Environ. Syst. Decis. 2021, 41, 594–615. [Google Scholar] [CrossRef]


Publisher’s Note: MDPI stays neutral with regard to jurisdictional claims in published maps and institutional affiliations. |
© 2022 by the authors. Licensee MDPI, Basel, Switzerland. This article is an open access article distributed under the terms and conditions of the Creative Commons Attribution (CC BY) license (https://creativecommons.org/licenses/by/4.0/).
Share and Cite
Hamza, M.H.; Chmit, M. GIS-Based Planning and Web/3D Web GIS Applications for the Analysis and Management of MV/LV Electrical Networks (A Case Study in Tunisia). Appl. Sci. 2022, 12, 2554. https://0-doi-org.brum.beds.ac.uk/10.3390/app12052554
Hamza MH, Chmit M. GIS-Based Planning and Web/3D Web GIS Applications for the Analysis and Management of MV/LV Electrical Networks (A Case Study in Tunisia). Applied Sciences. 2022; 12(5):2554. https://0-doi-org.brum.beds.ac.uk/10.3390/app12052554
Chicago/Turabian StyleHamza, Mohamed Hafedh, and Mohamed Chmit. 2022. "GIS-Based Planning and Web/3D Web GIS Applications for the Analysis and Management of MV/LV Electrical Networks (A Case Study in Tunisia)" Applied Sciences 12, no. 5: 2554. https://0-doi-org.brum.beds.ac.uk/10.3390/app12052554