1. Introduction
The possibility of exploiting the kinetic energy of raindrops by means of piezoelectric vibration energy harvesters has been analyzed since 2008 [
1,
2,
3]. Some studies have focused on the possibility of feeding sensor nodes and small electronic equipment using the mild rainfall that occurs in countries with temperate climates [
4,
5]. Other studies have focused on the possibility of harvesting large amounts of energy from tropical raindrops [
6,
7].
Most of the proposed raindrop harvesters directly exploit the bending strain of beams or membranes hit by the raindrops in order to generate electric energy via the piezoelectric effect [
5,
7]. However, there are some interesting examples of rotational piezoelectric harvesters [
8,
9]. In this case, the raindrops cause the rotation of a small rain-mill that in turn bends a series of piezoelectric cantilevers that generate electrical energy. Regardless of the typology, these rain harvesters generate an AC power that has to be converted into DC power to be stored and exploited by electronic equipment. For this reason several researchers have focused on the development of conditioning circuits [
10,
11,
12]. Moreover, rain generates a series of random impacts, causing transient peaks in AC power. To cope with this effect, specific electronic [
5] and mechanical [
13] solutions have been developed.
The analysis of a raindrop harvester is a fully multi-physical problem. As in other piezoelectric harvesters, there is a coupling between the mechanical domain and the electrical domain, through the direct and inverse piezoelectric effects [
14,
15], but the impact of the raindrop on the wet surface of the harvester also generates a coupling between the fluid-dynamic domain and the mechanical domain (the vibrating harvester). Some researchers have highlighted the effects of the accumulation of water on the harvester surface, with the formation of a water layer [
16,
17,
18]. The presence of the water layer not only modifies the natural frequency and the damping ratio of the harvester [
18] but also modifies impact dynamics. The impact of a raindrop on a dry solid surface generates spreading and splashing phenomena, which dissipate a significant part of the raindrops’ kinetic energy. Conversely, when a raindrop impacts a water layer of sufficient thickness, different phenomena take place [
19]: the formation of a crater, the rising of water surrounding the crater with the formation of a crown, the collapse of the crown, and the formation of water ripples. As a result of the above-mentioned phenomena, the presence of the water layer increases the amount of energy transferred to the harvester. This positive effect ends when the water layer reaches the borders of the harvester and a significant spill phenomenon takes place.
A novel harvester design was proposed by a research group from Padova University in [
20] in order to exploit these phenomena. In the new device, a square-based spoon was fixed to the free end of a cantilever harvester and exposed to rain. A small pool of water was generated in the spoon; hence, after the initial transient stage, the raindrops impacted on a liquid surface. A series of experimental tests carried out in the laboratory using simulated rain showed the following differences when the spoon was empty and when the spoon was filled with water:
The resonance frequency of the harvester strongly decreased due to the presence of the added mass of water in the spoon; this effect is rather intuitive and predictable.
The damping ratio increased due to the presence of water; this effect is predictable as well.
When the impact takes place on the liquid surface, the maximum voltage amplitude is not reached in the first period, but it is reached later.
The impact on the liquid surface leads to a large increase in the generated voltage, with a significant improvement in the performance of the harvester.
The latter two effects cannot be explained by means of a linear model excited by an impulsive force and are not related to the presence of higher-order modes of the cantilever harvester, as discussed in [
20]. To the best of authors’ knowledge, there are no models explaining the increase in generated voltage and the measured waveform. Therefore, this paper focuses on the development of an interpretative model of the interaction between the falling drop and the water surface.
A systematic experimental analysis was carried out in a laboratory environment [
21] in order to analyze the effect of water depth on the resonance frequency, generated voltage, and damping ratio. The results confirmed the findings reported in [
20] and showed a saturation phenomenon in the trend of generated voltage. Voltage increased with water depth but reached a maximum value for a certain depth since larger quantities of water in the spoon led to large spills after the impact. It is worth noting that the tests reported in [
21] were carried out with artificial rain and no test with actual rain was carried out.
This paper is organized as follows. The next section deals with the harvester and the equipment used for experimental tests. In
Section 3 novel experimental results obtained with actual rain are compared with the ones obtained with simulated rain, and the effect of impact position is discussed. In
Section 4 a video analysis is presented and correlated with the measured voltage. The mathematical model of the harvester is developed in
Section 5, including a harvester model and an impact model. The impact model is novel, since the complex fluid motion generated by the raindrop impact is represented by the one-dimensional motion of two concentric water cylinders. The sizes of the oscillating cylinders are derived from the recorded motion of water inside the spoon. A good agreement between the experimental and numerical values of the generated voltage is found. Finally, after a discussion (
Section 6), conclusions are drawn in
Section 7.
2. Experimental Set-Up
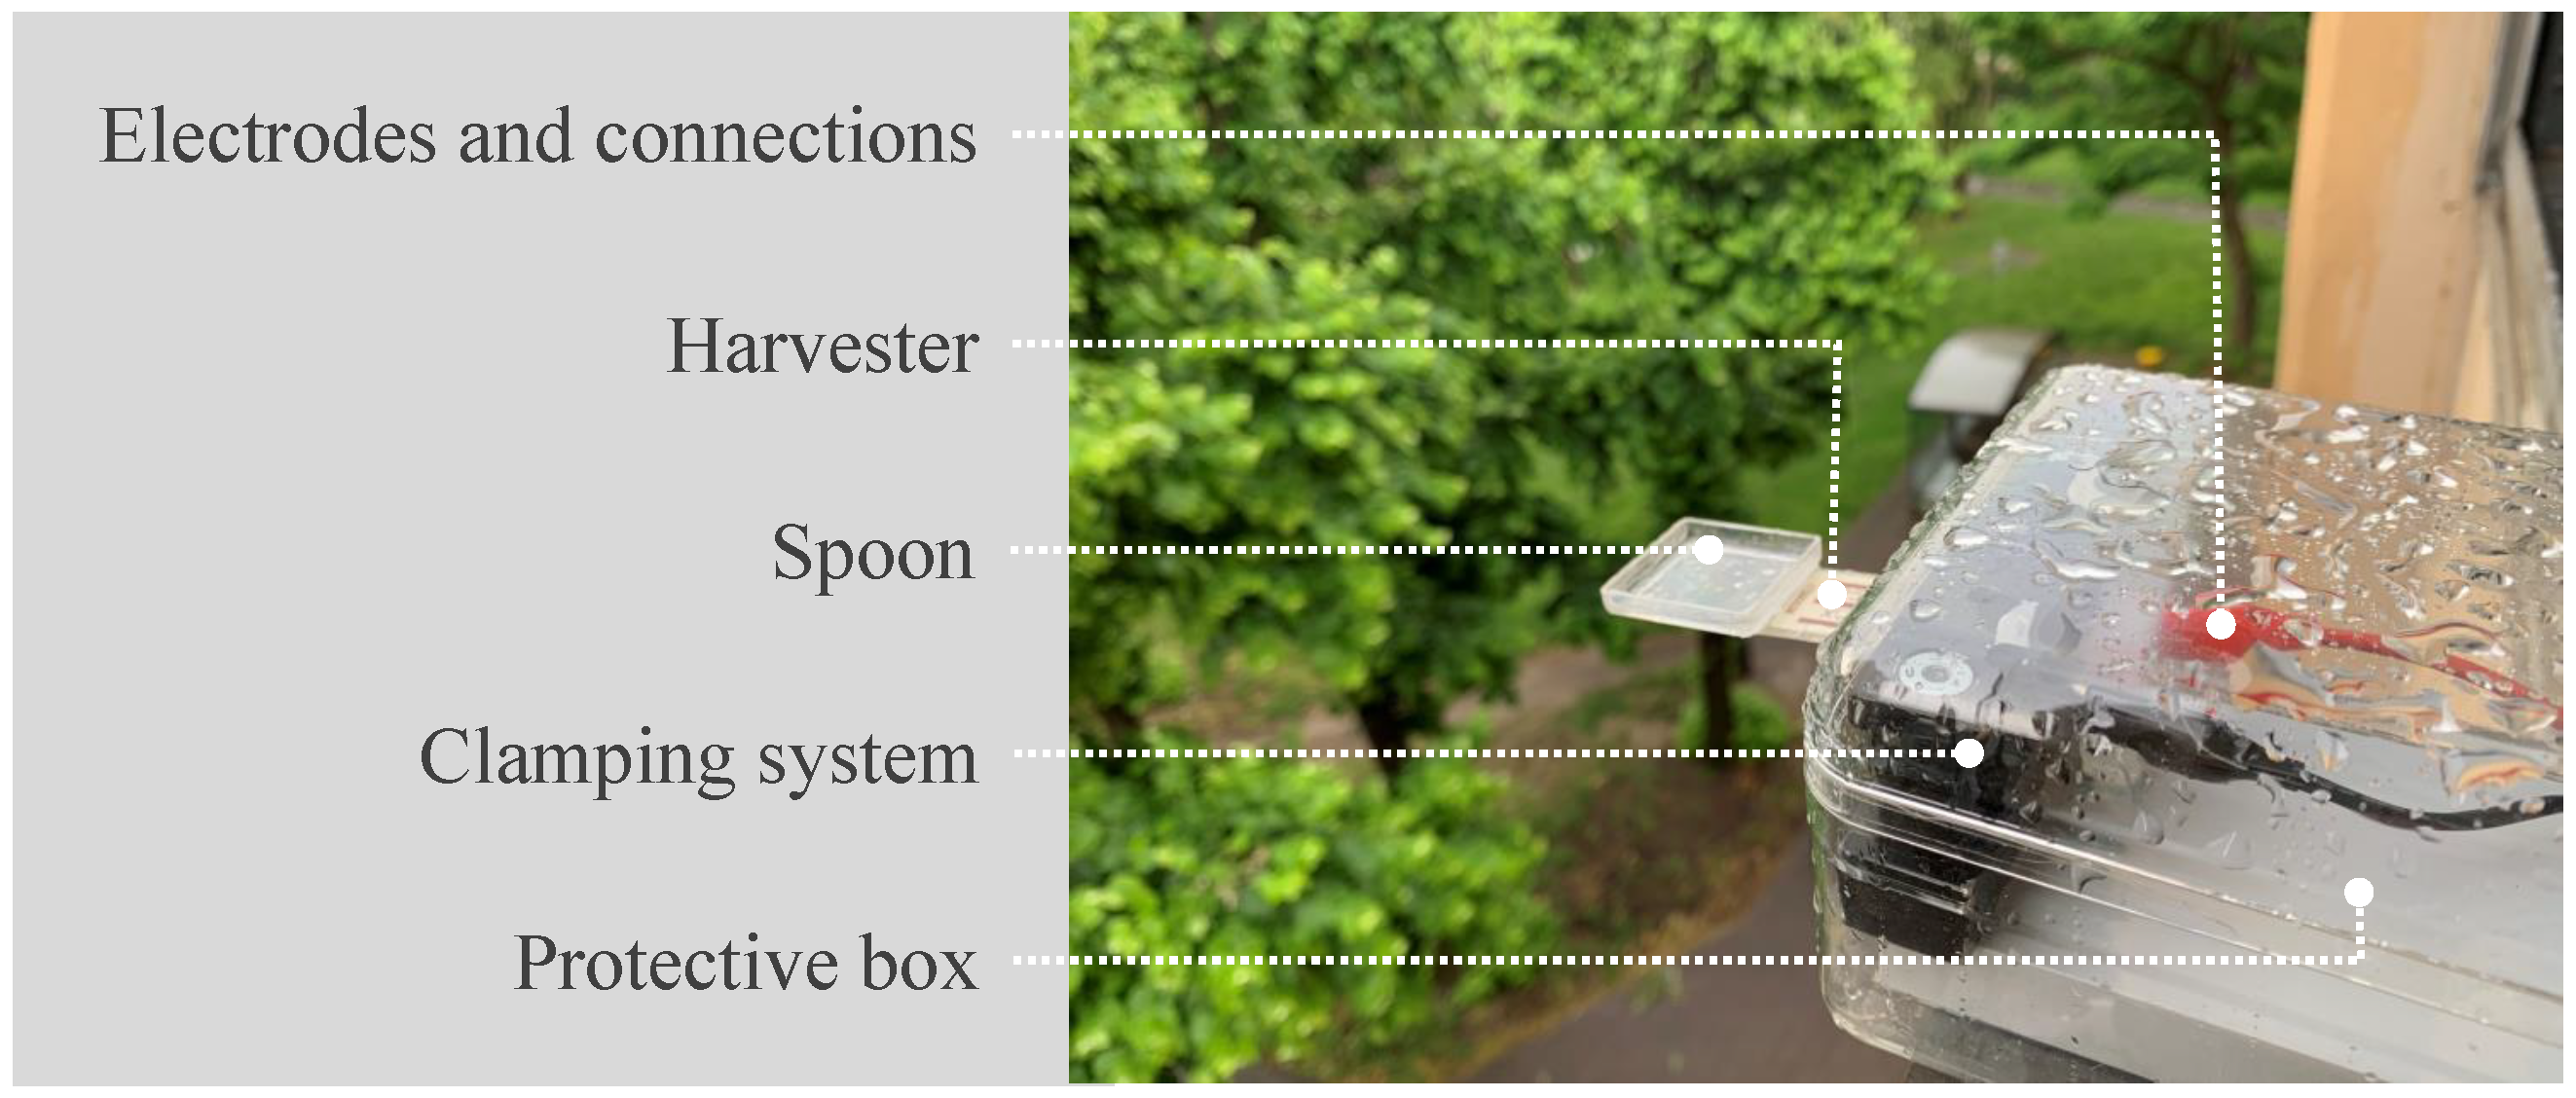
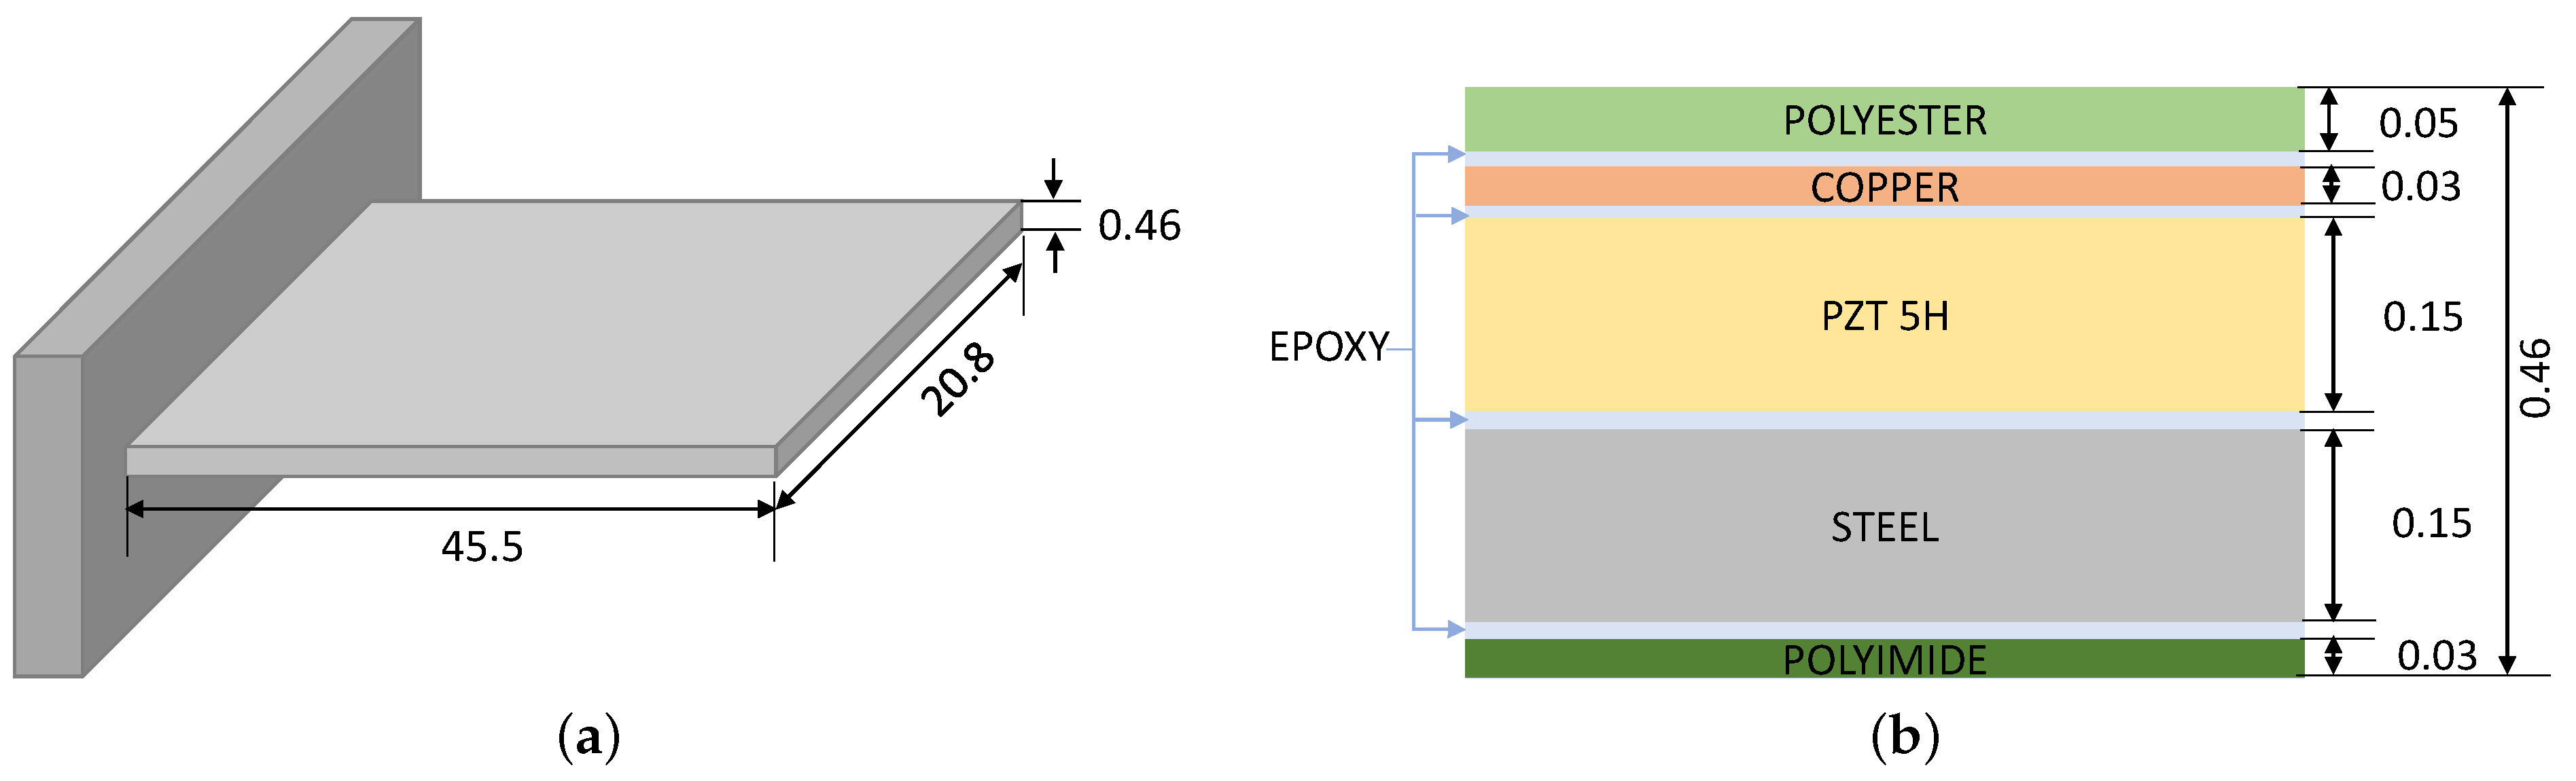
The response of the harvester excited by the impact of raindrops was experimentally measured. The unimorph piezoelectric harvester (Midé PPA-1001), shown in
Figure 1, was constrained in a cantilever configuration using a steel clamp. The geometrical and material parameters of the harvester are summarized in
Appendix A. A square spoon (
mm inside, with 3 mm high walls) was attached at the free end of the cantilever using cyanoacrylate glue. The presence of the spoon allows for a small pool of water in which raindrops can fall: this modifies the impact dynamics as the drop hits a liquid surface instead of a solid one. The clamped end of the harvester—where the electrical contacts are present—is placed inside a plastic box, which provides protection against water splashes.
The response of the harvester consists in the generated voltage, measured by means of an acquisition module for sound and vibration (National Instruments NI9234) and the software SignalExpress. The trigger was set to start the measurements when the absolute value of the generated voltage exceeded V. The voltage was measured for 3 s from the trigger, with a sampling frequency of 2 kHz.
The piezoelectric device was tested in both indoor and outdoor conditions. Indoor tests exploited an intravenous drip set to generate water drops of consistent size; the drop hit the harvester after a 1 m fall. These tests provide repeatable water impacts thanks to the controlled testing environment. Outdoor tests were performed by exposing the harvester to actual raindrops and offering the necessary benchmark for the indoor tests with artificial raindrops. In general, the voltage generated by the impact of a water drop on the harvester qualitatively resembles a damped sinusoidal signal. For this reason, the following three main parameters were selected in order to characterize the time-domain response of the device. The first relevant parameter is the peak-to-peak voltage, i.e., the difference between the maximum and the minimum values of the voltage signal caused by one drop impact. The second parameter is the viscous damping ratio, calculated using the well-known logarithmic decrement method [
22] (which rigorously applies to second-order linear systems). The damping ratio is computed from positive or negative peaks
i and
as:
where
is the amplitude of the
peak and
n is the number of periods considered in the calculation (in the following
). The damping ratio is computed for every peak in the time record, and the mean value of the whole signal is also obtained. The third parameter is the dominant frequency, computed by averaging multiple period measurements obtained from the identified positive and negative peaks.
3. Experimental Results
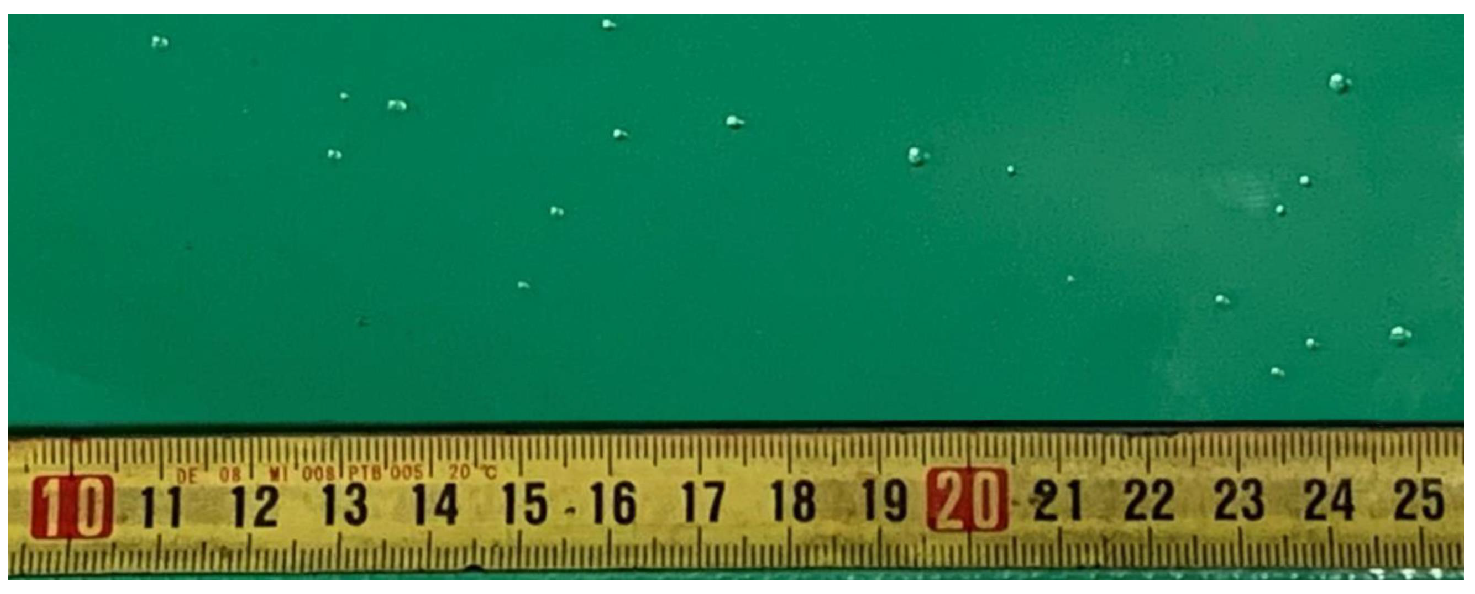
This section describes the results obtained in indoor and outdoor tests, exploiting artificial and real rain, respectively. The tests involve the impact of a drop on the spoon in two conditions: ‘empty spoon’, when the spoon does not contain any water before the impact occurs, and ‘full spoon’, when the spoon contains 2.5 mL of water. Previous studies involving the same harvester prototype showed that this volume of water corresponds to the maximum peak-to-peak voltage generated in indoor tests [
21]. In both tests, some drops of water were collected on a plastic sheet (see
Figure 2), then a picture was taken and the diameter was derived from the picture with a resolution of 10 pixel/mm. Since the drops on the sheet had a hemispherical shape, the diameter of the “flying” drops was calculated considering a spherical drop with the same volume. The drops generated by the intravenous drip set had a mean diameter of 2.03 mm, with a standard deviation of 0.10 mm.
The raindrops collected in the outdoor scenario (about 40 drops) had a mean diameter of 1.93 mm, with a standard deviation of 0.28 mm. Clearly, the size of the artificially-generated raindrops employed in the indoor tests presented a lower dispersion. The outdoor tests were performed in Padova (Italy), with a temperature of 22 °C, 75% humidity, and a 2.3 mm/h rain rate. The tests took a relative short time (1 h) and the rain rate was roughly constant (data from [
23]). In the following, some general features of the harvester responses are discussed first (
Section 3.1), whereas a statistical analysis of the results is provided later (
Section 3.2).
3.1. Time-Domain Analysis
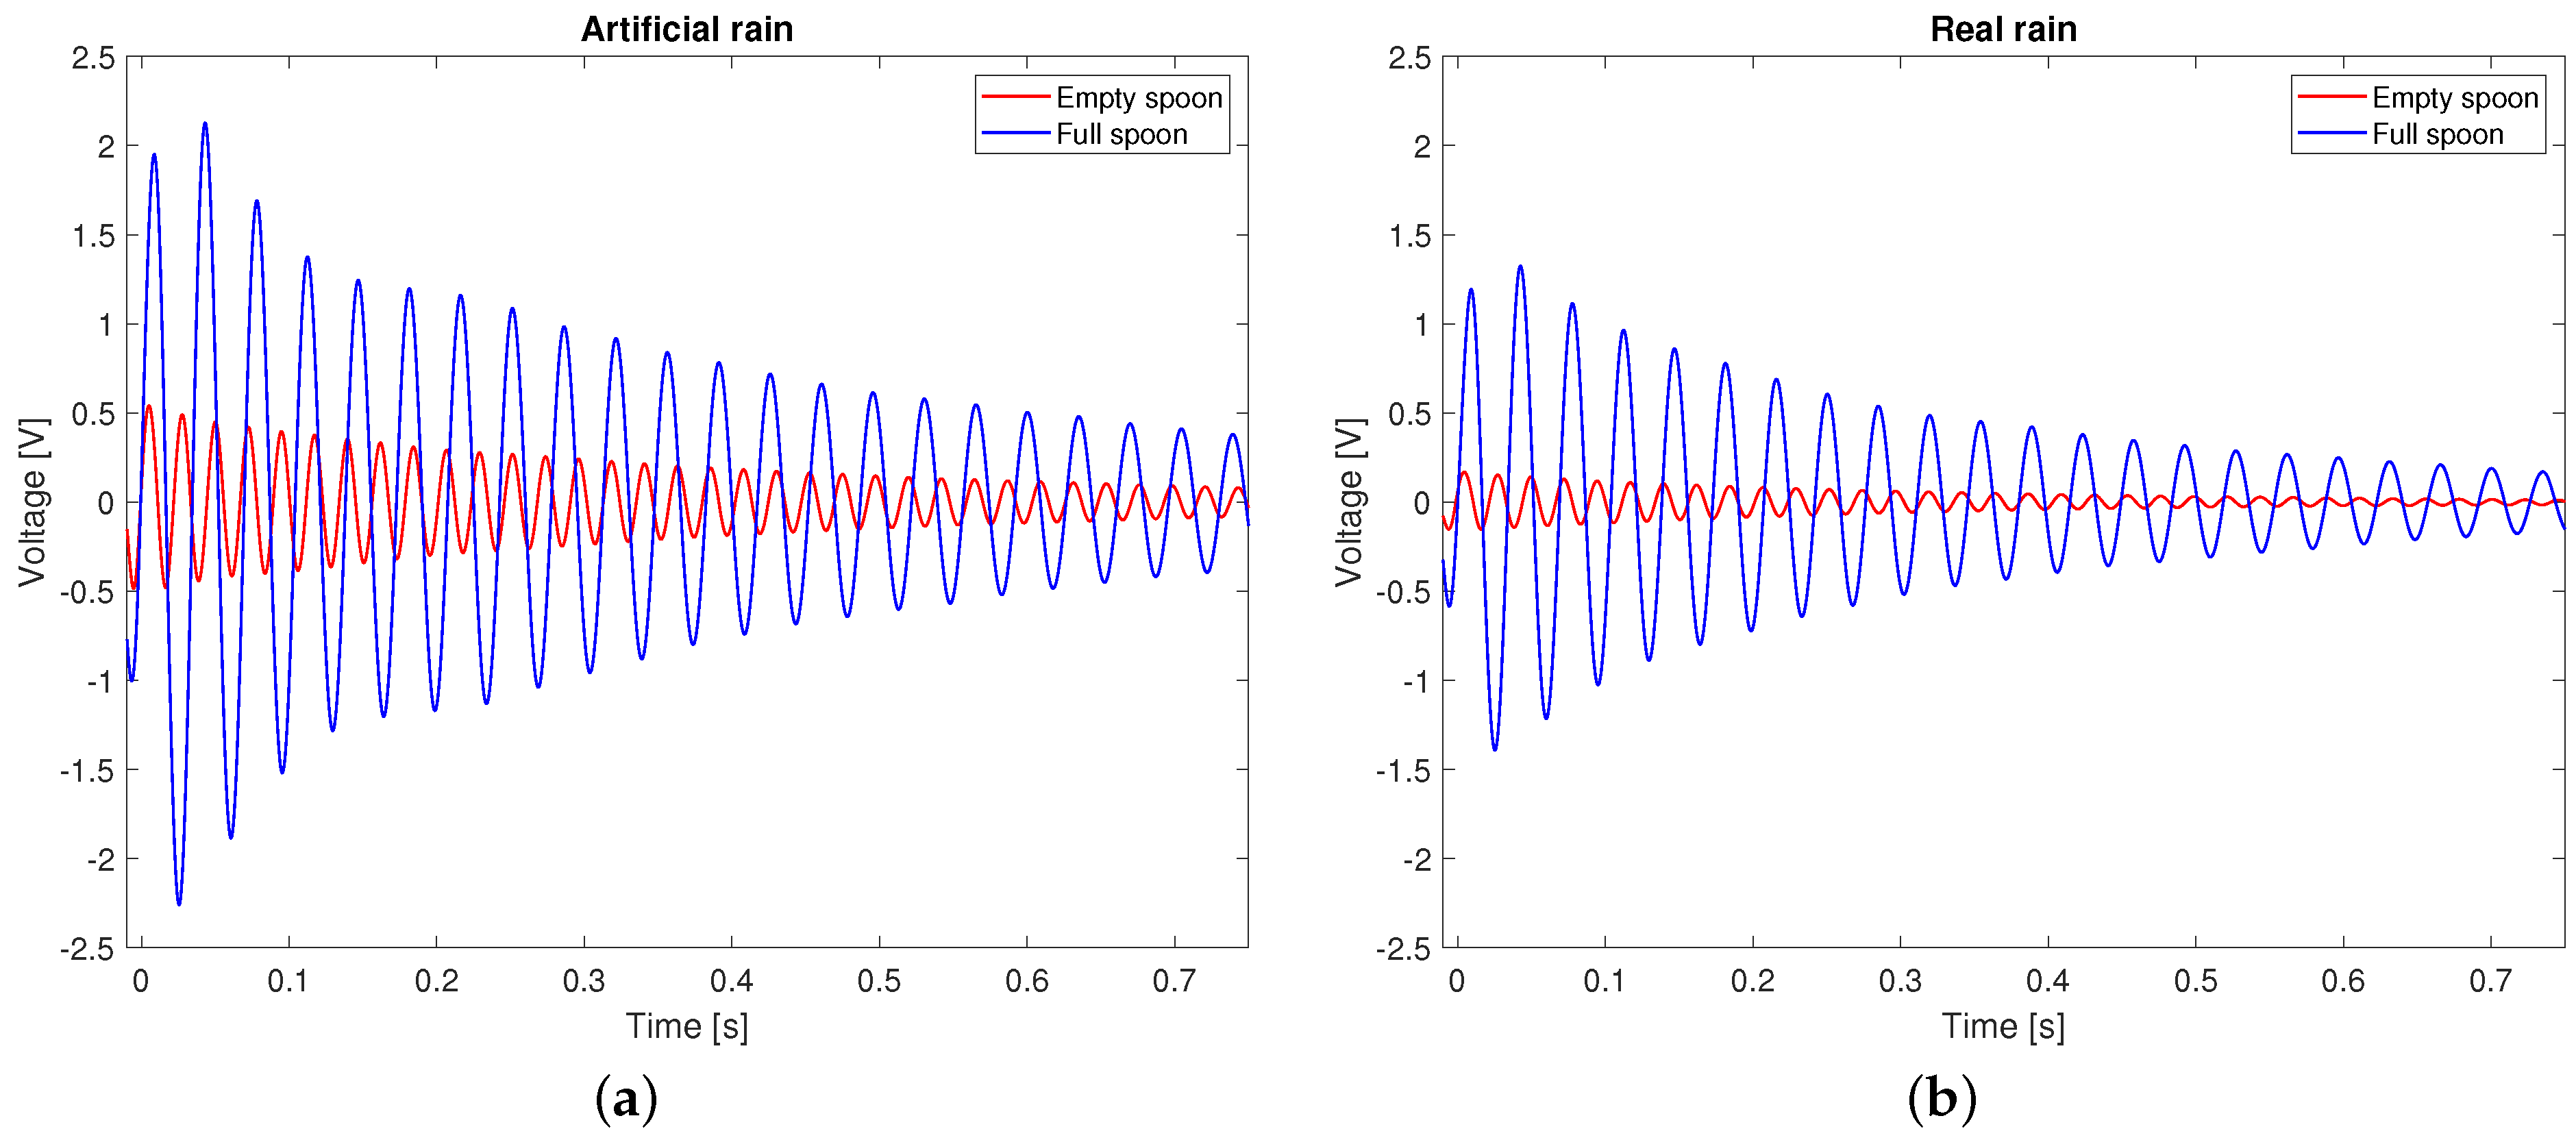
Figure 3 shows examples of the voltage signals measured in the two sets of tests, both with an empty and full spoon. The data selected to represent the indoor scenario correspond to signals with a peak-to-peak voltage close to the mean of all recorded impacts; conversely, the tests selected to represent the outdoor scenario are the ones with the highest peak-to-peak voltage. The reason for this choice resides in the different dispersion of the indoor and outdoor results (see the Statistical Analysis section below).
Indoor and outdoor tests share some common qualitative features. In both testing scenarios, when the drop impacts on the empty spoon the first voltage peaks (positive and negative) are the largest peaks (in absolute value) recorded in the entire response. Conversely, when the drop impacts on the full spoon, the second peaks (positive and negative) are the largest (in absolute value) peaks in the recorded voltage. Additionally, in both indoor and outdoor tests the presence of the pool of water in the spoon allows the generation of a higher voltage. All these effects can be justified by the modified impact dynamics. Finally, all signals are dominated by a single harmonic component: for this reason, the dominant frequency is one of the parameters used to characterize the harvester response.
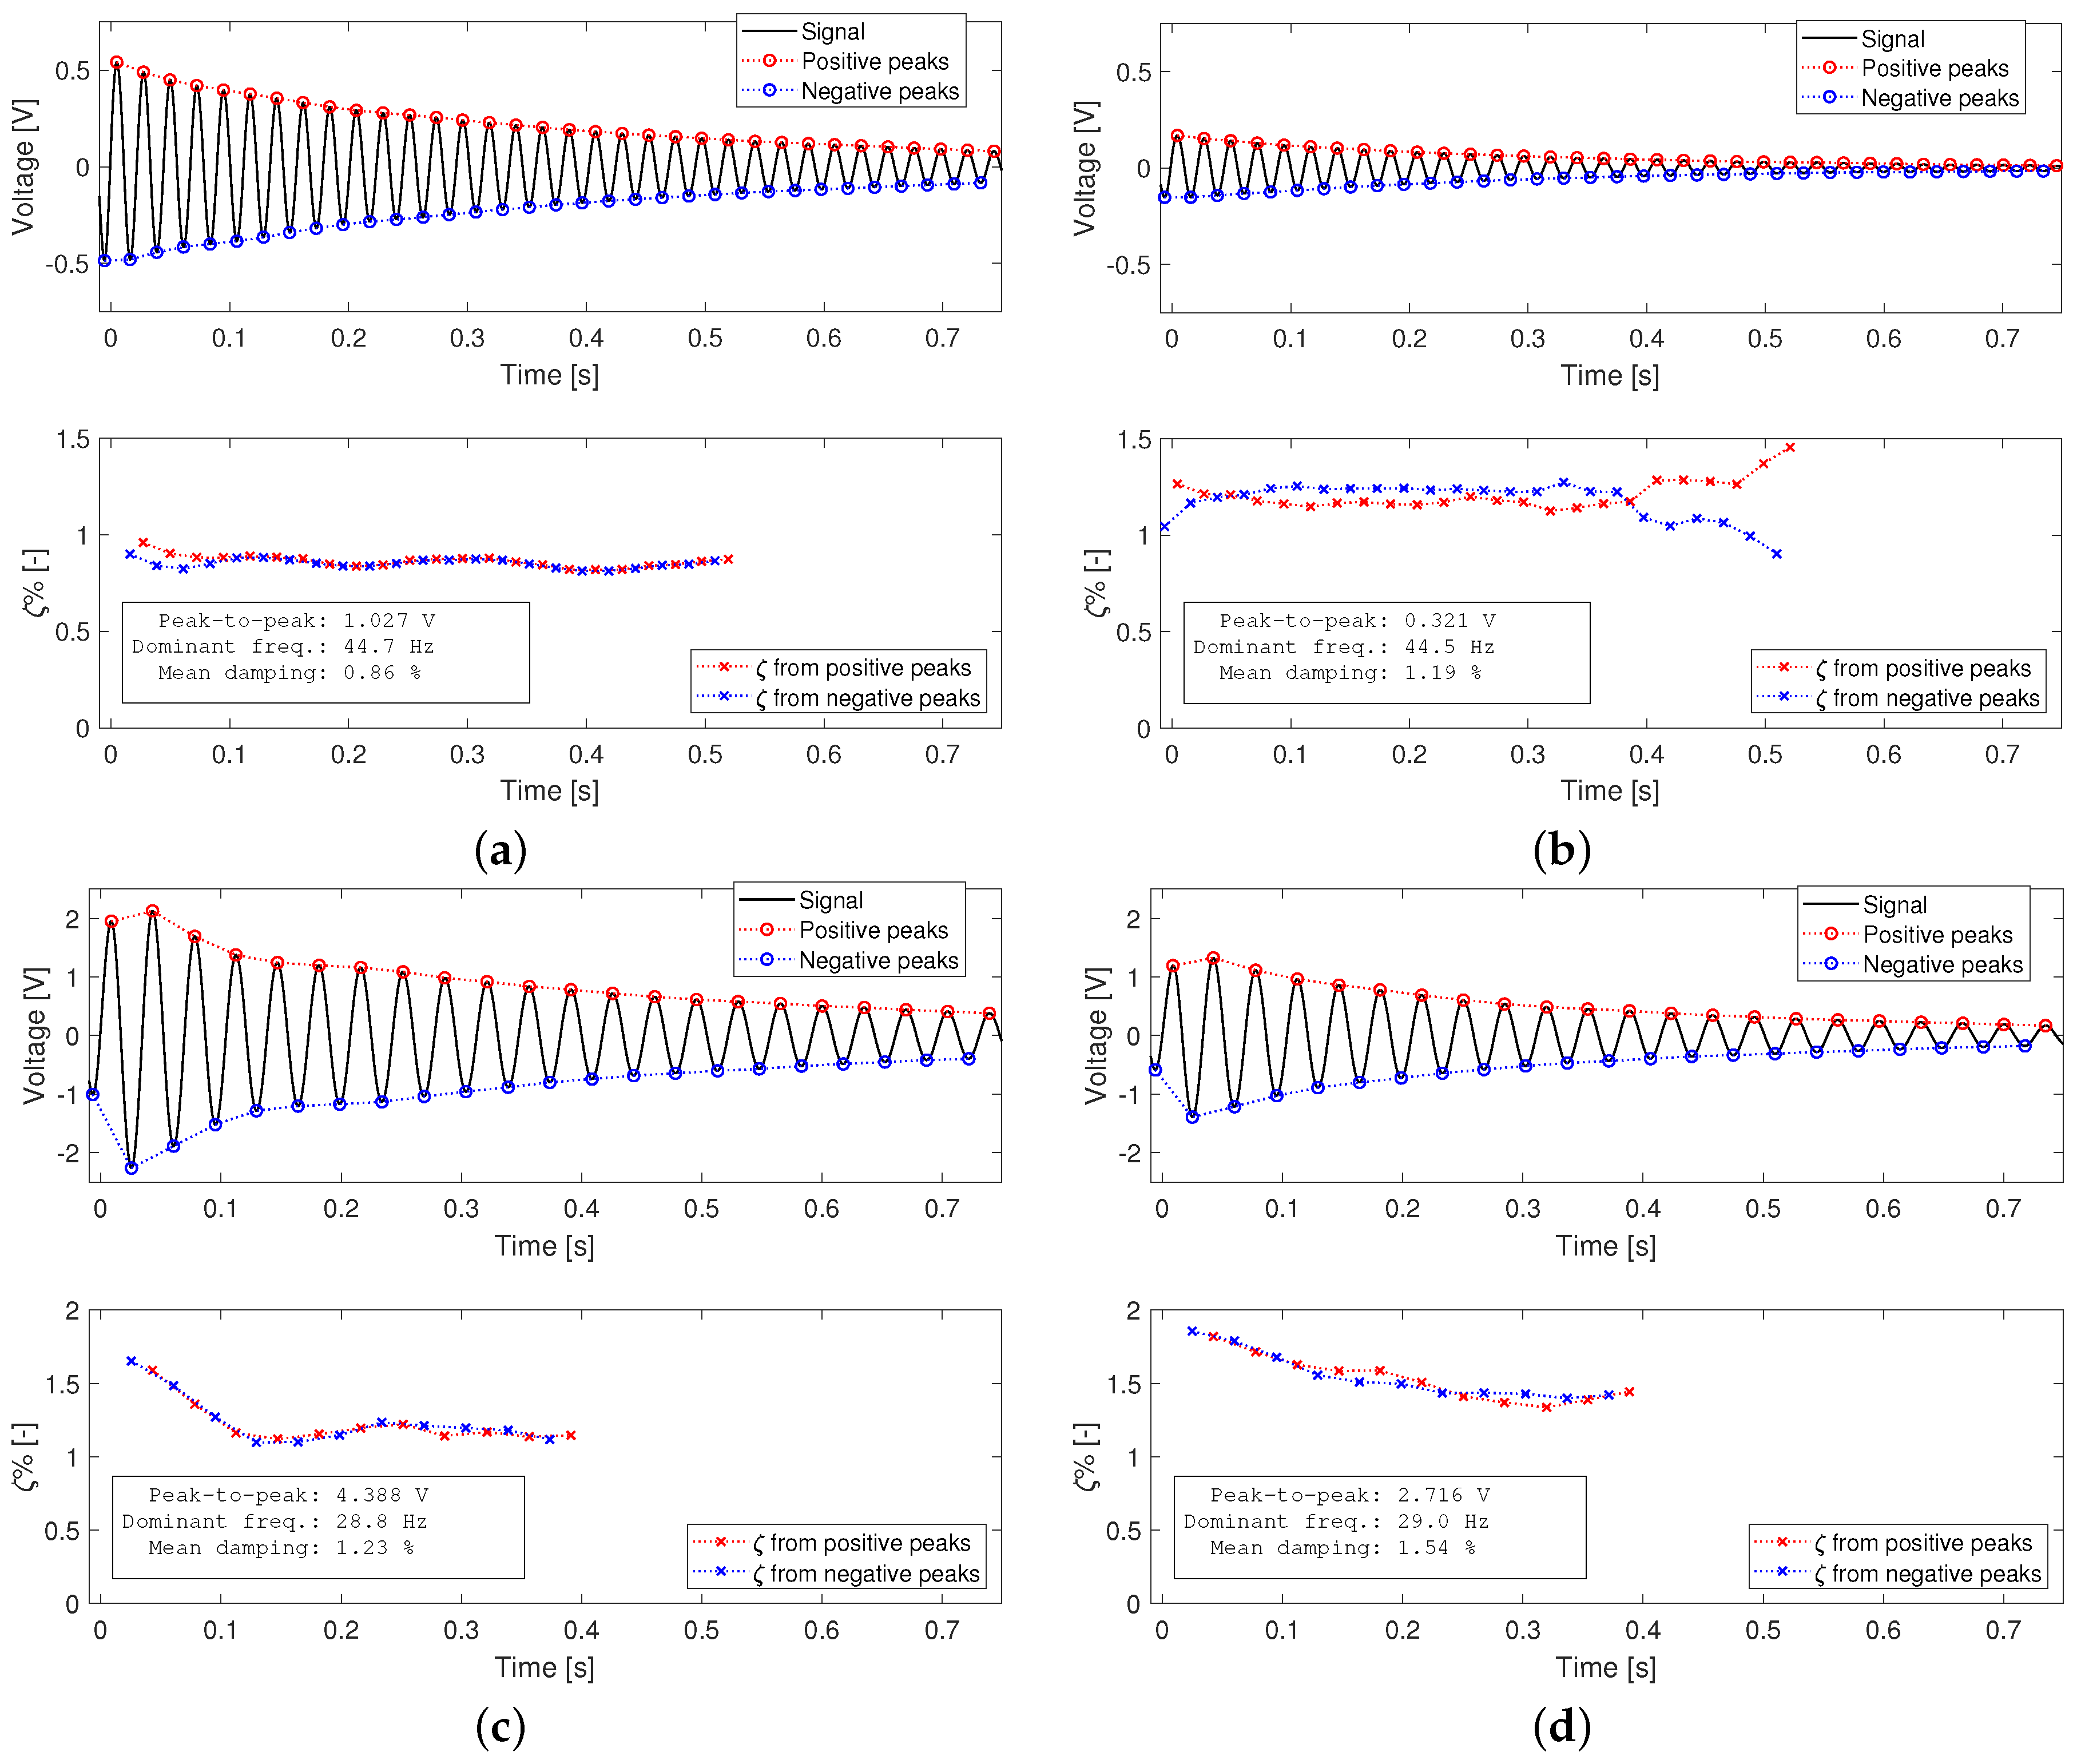
Figure 4 shows an in-depth analysis of the signals of
Figure 3, according to the methodology described in
Section 2. In particular, three parameters are computed from the response to each drop impact: the peak-to-peak voltage, the dominant frequency, and the damping ratio. In addition to the qualitative characteristics discussed previously, it can be noted that the additional mass consisting of the water contained in the spoon causes a lower dominant frequency in the case of the full spoon compared to the case of the empty spoon. The dominant frequency was consistent between indoor and outdoor tests. Moreover, the full spoon caused a higher damping ratio (+43% in the indoor tests, +30% in the outdoor tests). Both indoor and outdoor tests with the empty spoon showed damping ratios that were roughly constant in time. Conversely, owing to the specific waveform, the tests with the full spoon exhibited a roughly constant damping ratio only if the first cycles of vibration were neglected.
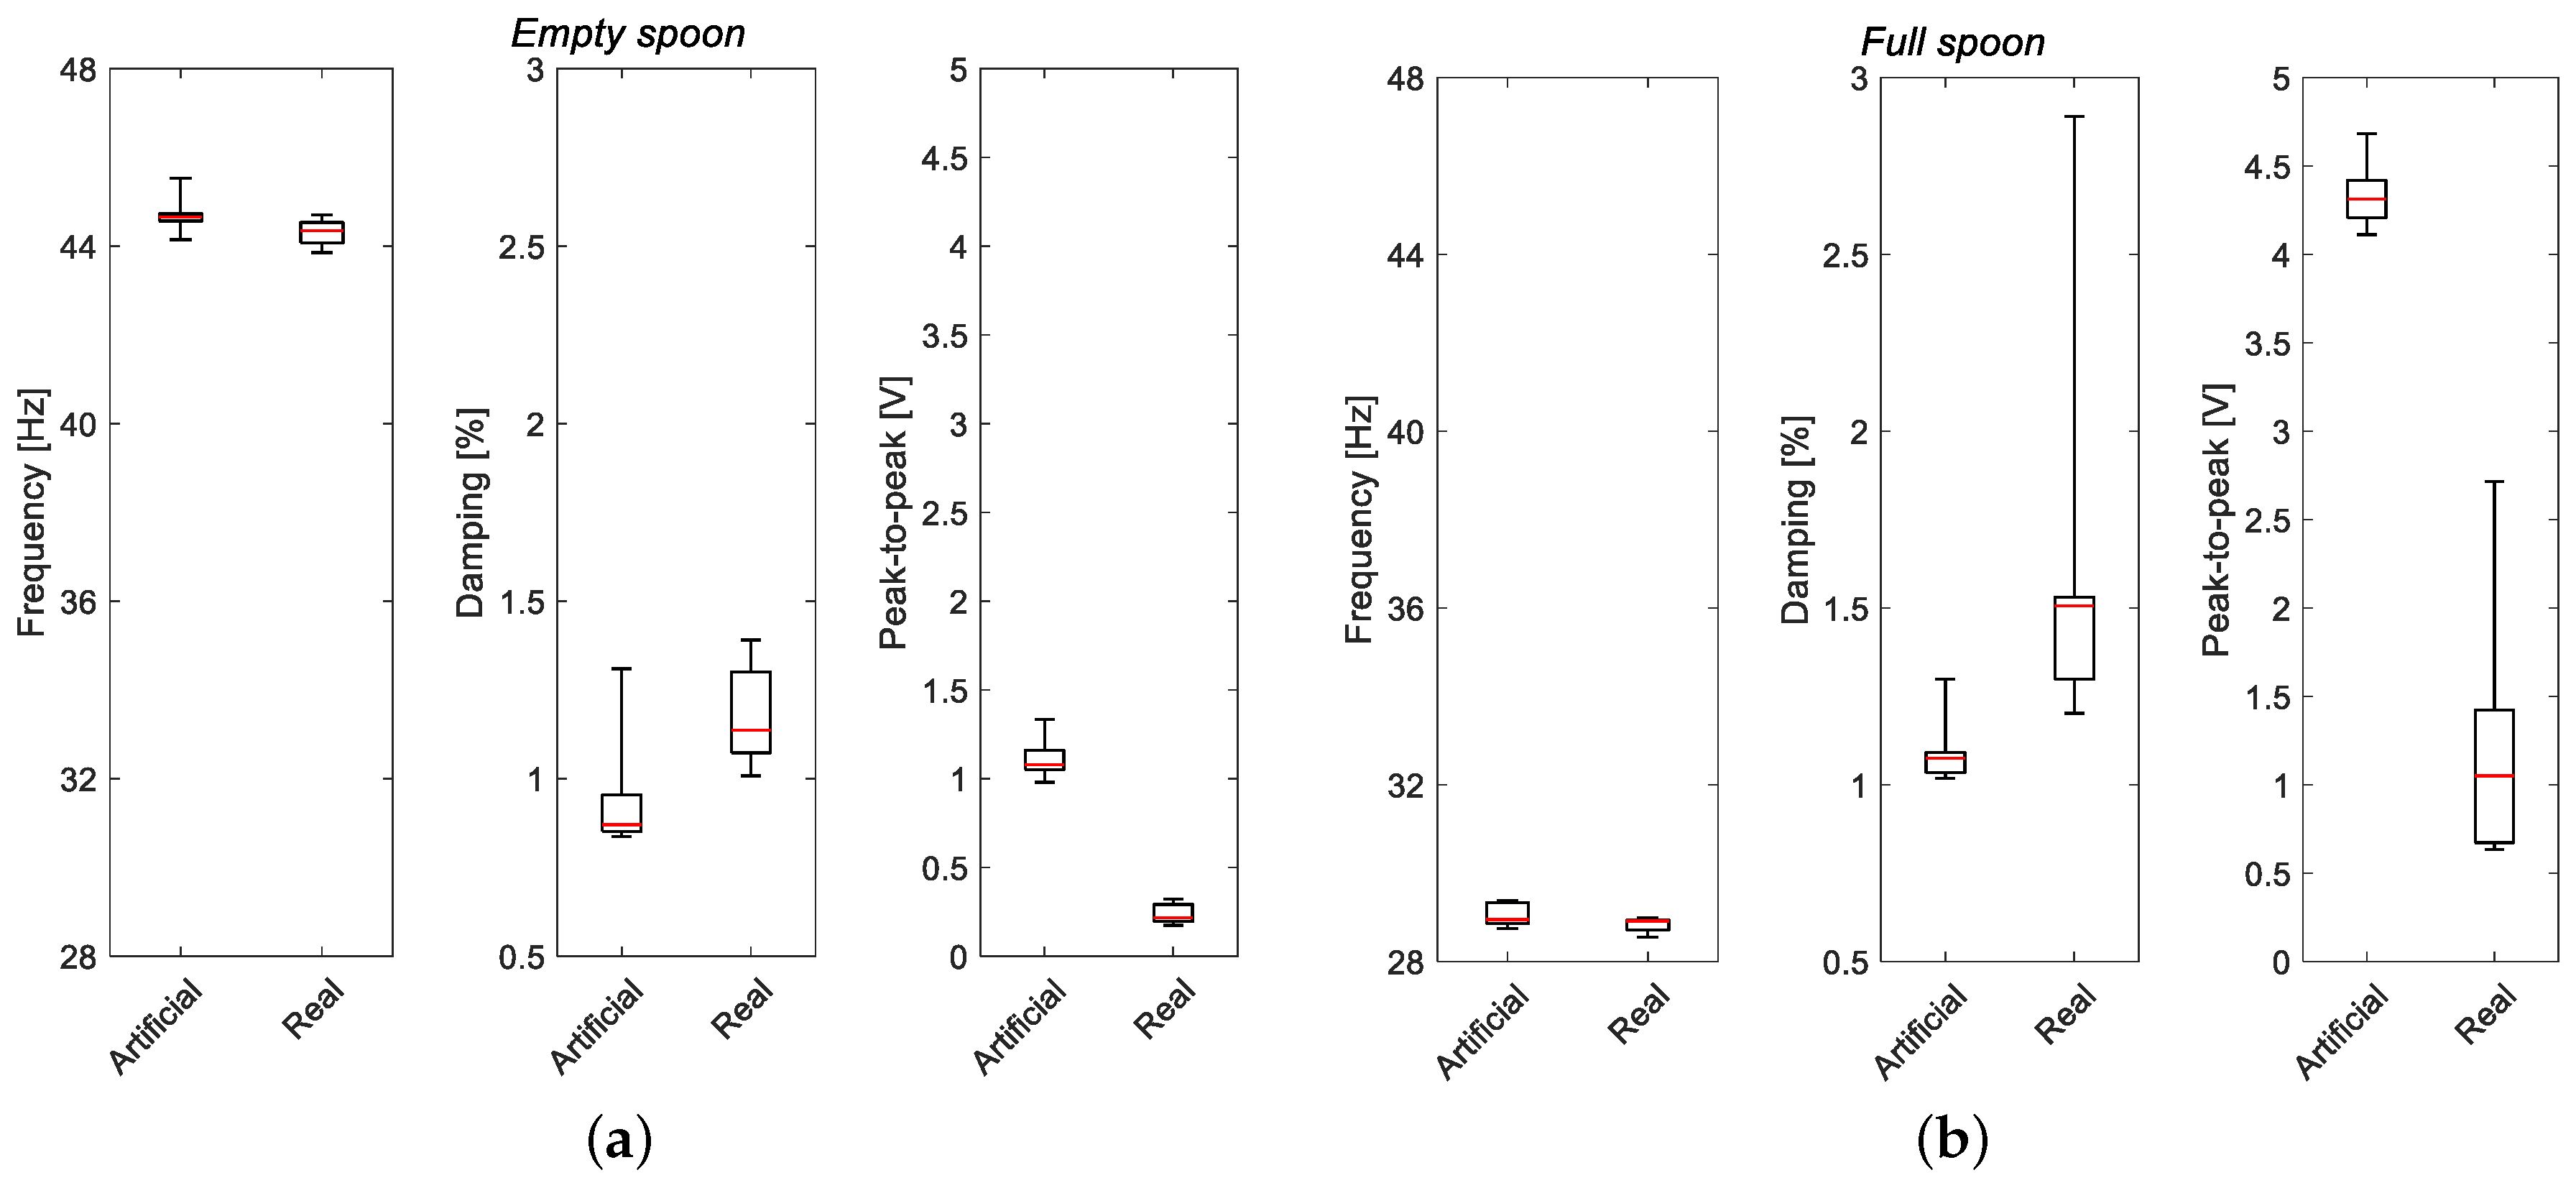
3.2. Statistical Analysis
Figure 5 displays a statistical analysis of the experimental results through box plots representing the four quartiles and the median of the three characteristic parameters of the harvester response, obtained from 10 tests for each configuration. It is straightforward to observe that the dominant frequency had a low dispersion and there was high compatibility between the frequency computed from indoor and outdoor test results. Damping ratios and peak-to-peak voltages showed a higher dispersion. The outdoor tests showed higher damping ratios than the indoor tests, with both the empty and full spoon. Nonetheless, the distributions of indoor and outdoor tests in the same conditions (empty or full spoon) did overlap. Conversely, the peak-to-peak values of indoor and outdoor tests significantly differed and the indoor values were larger. The distribution of the indoor and outdoor values of the peak-to-peak voltage did not overlap. However, it is interesting to note that, in both the indoor and outdoor tests, the observed mean peak-to-peak voltage obtained with the full spoon was larger (by about four times) than the mean peak-to-peak voltage obtained with the empty spon. This result confirms the validity of the harvester with the spoon shown in previous studies [
21] and suggests that the water layer is effective even if the operating conditions are slightly different.
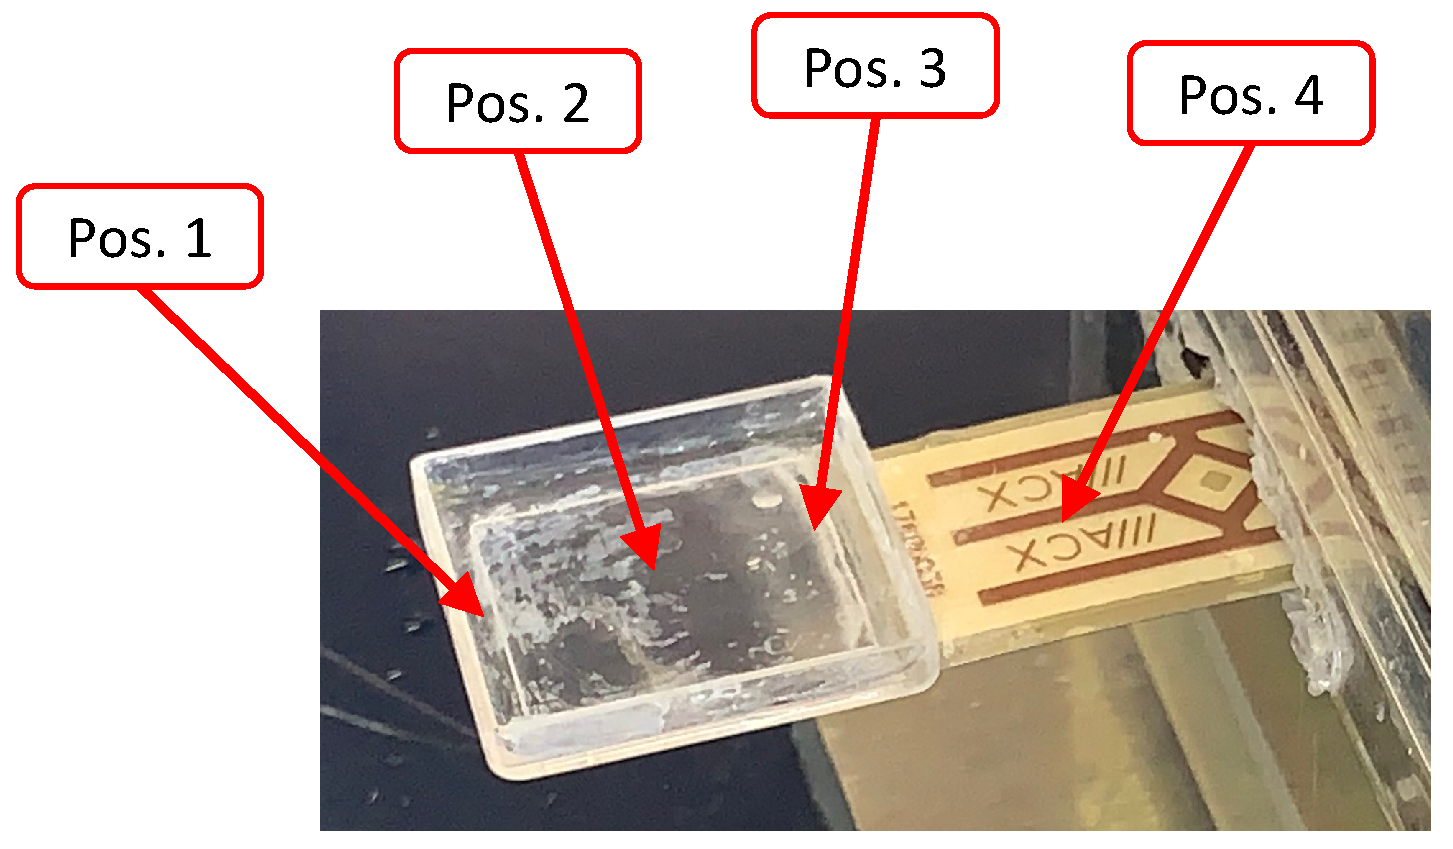
The difference between indoor and outdoor tests can be explained considering that in indoor tests the diameter of the drop was more repeatable and that the impact point of the drop on the harvester was carefully set in the middle of the spoon. The impact point cannot be controlled in outdoor tests. In order to investigate the effect of different impact positions, the response to impacts on various locations of the harvester device was measured using the indoor set-up.
Figure 6 shows the four impact locations selected:
position 1, on the edge of the spoon farthest from the piezoelectric harvester;
position 2, on the center of the spoon;
position 3, on the edge of the spoon closest to the piezo;
position 4, outside of the spoon, on the piezo itself (roughly 10 mm from the glued joint between the harvester and the spoon).
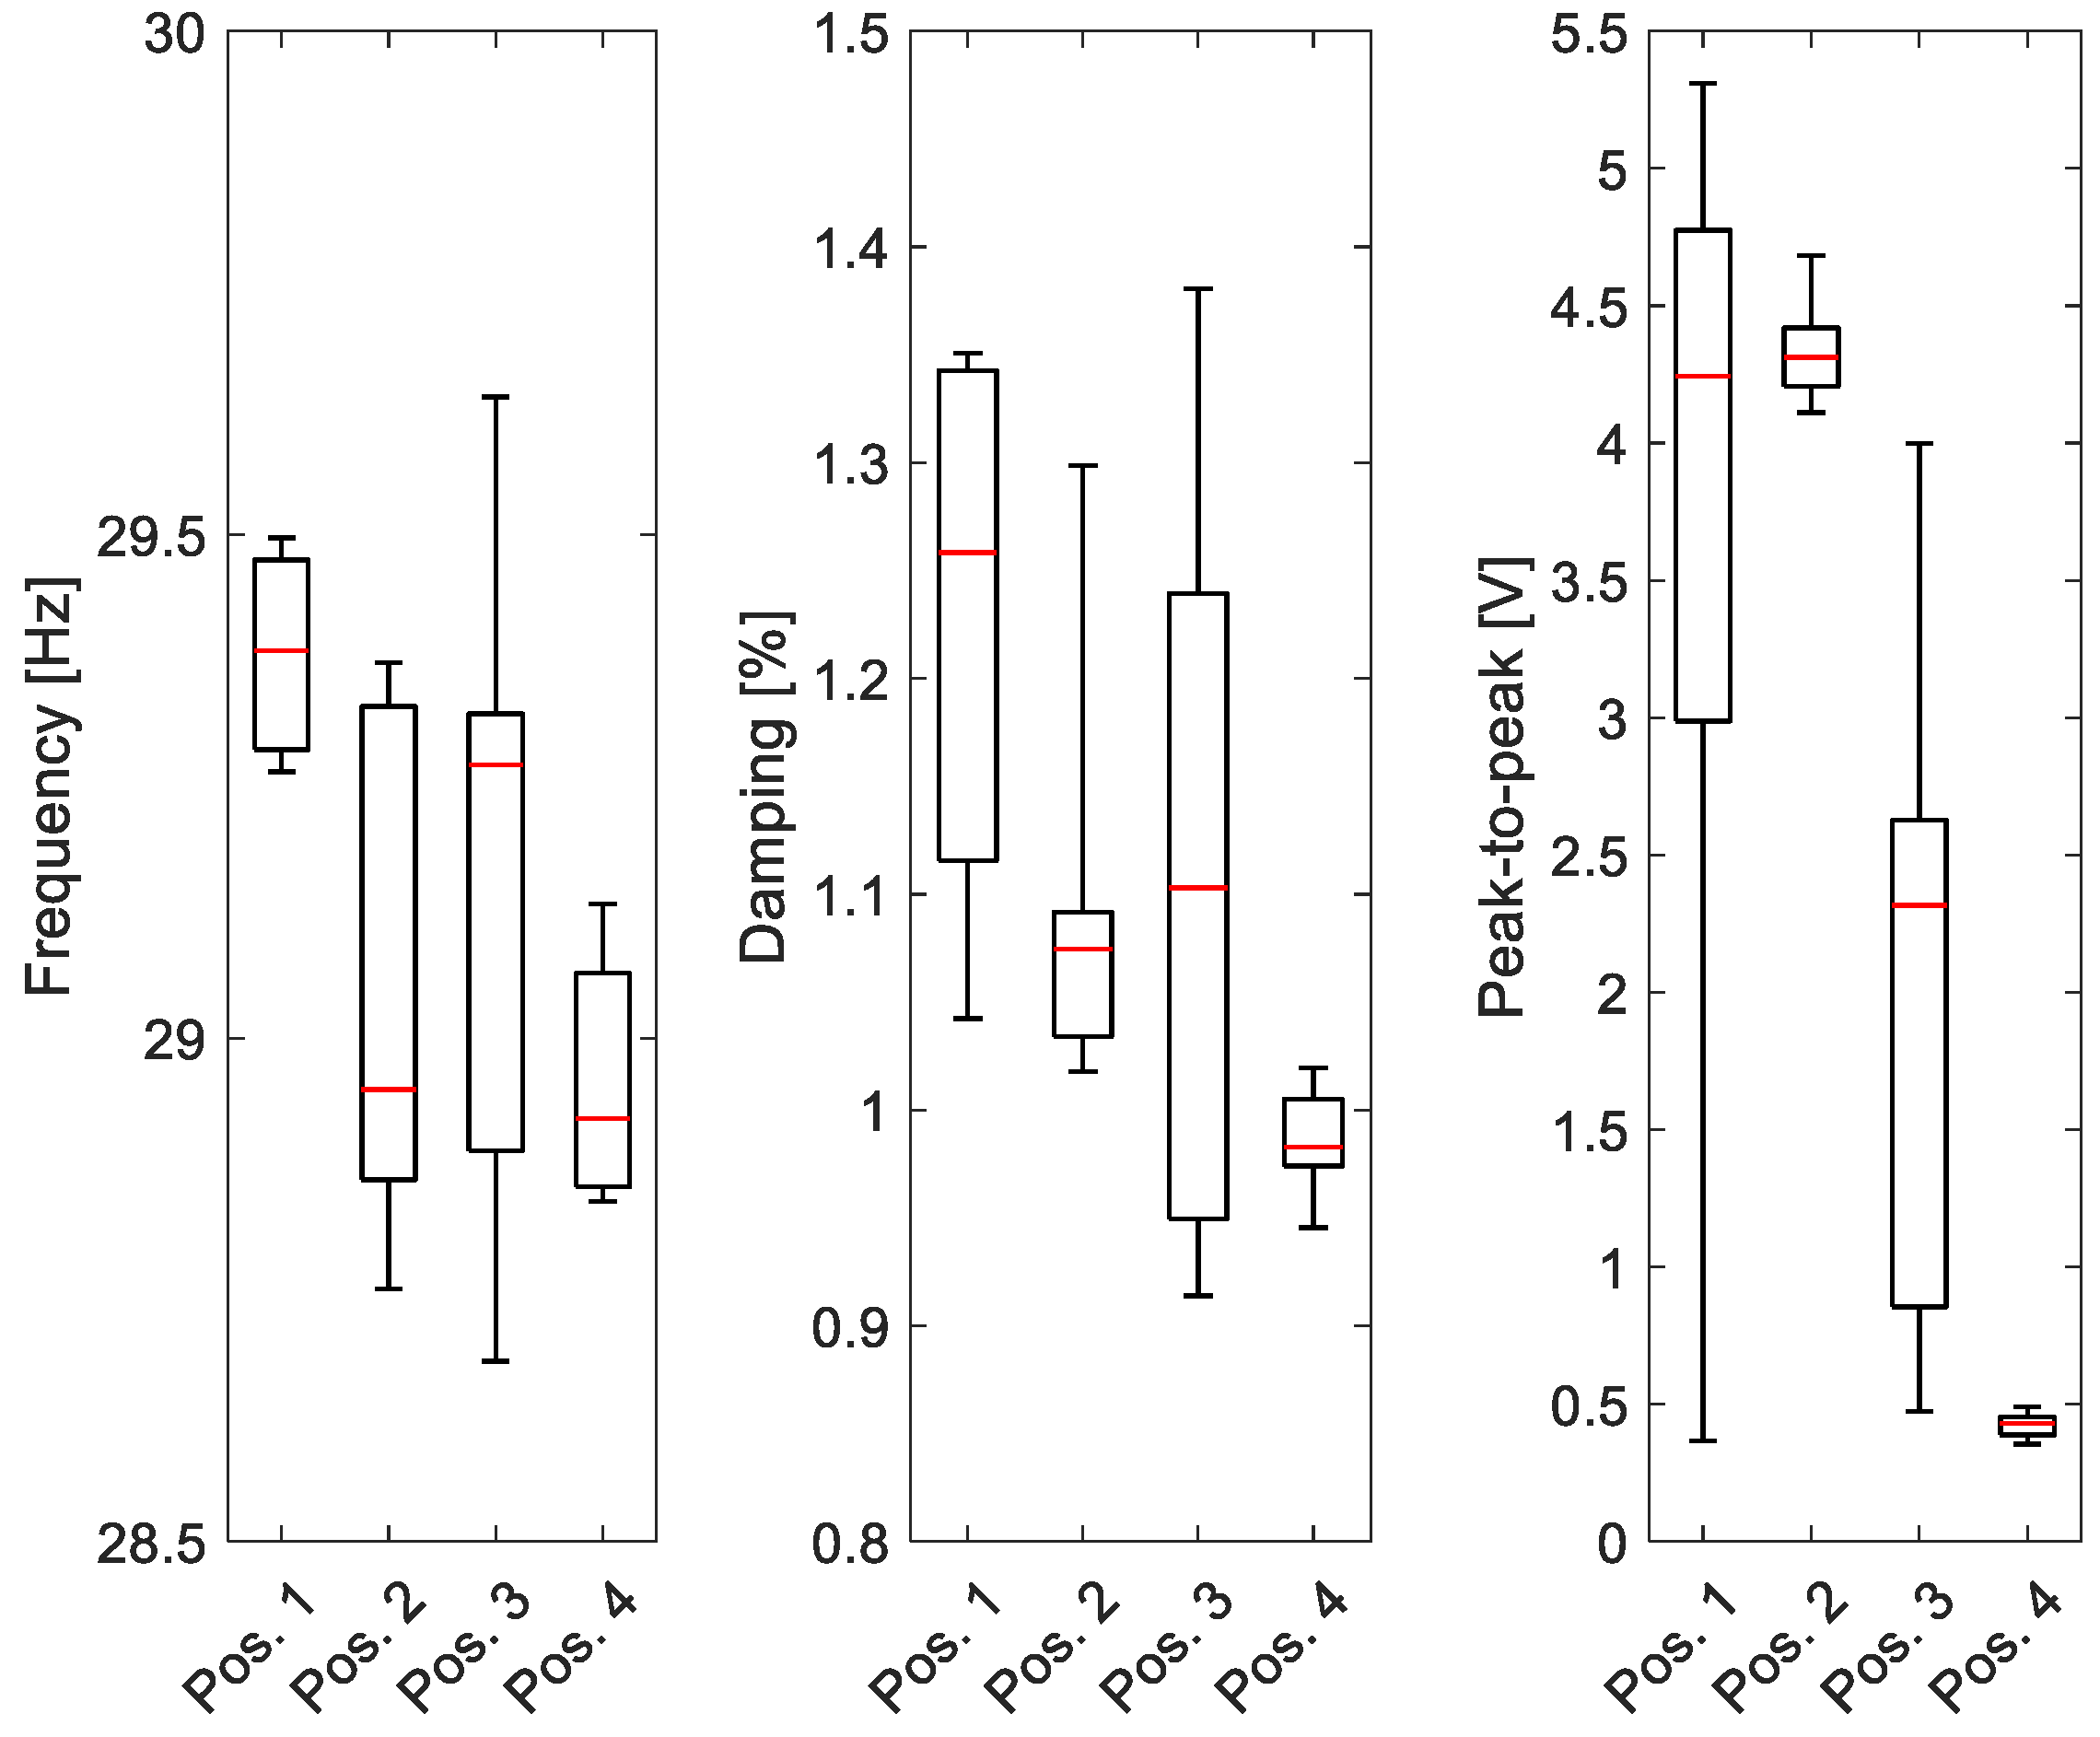
Figure 7 compares the effect of the four different impact positions on the characteristic parameters of the response of the harvester with the full spoon. Again, 10 tests were considered in each configuration. The dominant frequency presented a low dispersion and was marginally affected by the different impact locations. Indeed, the dominant frequency corresponded to the frequency of the first mode of vibration of the device (harvester, spoon, and water pool), which is an intrinsic characteristic of the system. Damping ratio and peak-to-peak voltage showed particularly high dispersion when the impact occurred on the edges of the spoon. In fact, when the impact is set to take place close to the edges, small perturbations can cause a displacement of the falling drop. As a consequence, some impacts may occur slightly inward with respect to the edge of the spoon (hence involving the water pool) and others may take place on the spoon sidewalls (resulting in a ‘dry’ impact, with a worse energy transfer). In general, impacts in position 3 generated lower voltages compared to impacts in position 1, which can be traced back to the lower arm of the impact force. It is particularly interesting to note that, when the impact occurred outside of the spoon, the generated voltage was particularly low, comparable to the lowest values obtained in outdoor tests; additionally, the same was true for some of the tests with the impact on one of the spoon edges. In this experimental study, only impacts in the mid-line of the spoon were considered, because the focus was the development of a 2D harvester model. Nevertheless, it is reasonable to suppose that impacts close to the side edges of the spoon may also lead to a worse energy transfer. Summing up, the discrepancy in generated voltage between indoor and outdoor tests can be only partially attributed to the difference in drop size in the two testing scenarios, since the position of the impact can play an important role. It is reasonable to say that the high dispersion of the peak-to-peak values and the asymmetry of the corresponding distribution obtained in outdoor tests can be caused by a small number of drops leading to ‘optimal’ impacts in the center of the spoon, whereas the majority of impacts occur on ‘sub-optimal’ locations.
4. Video Analysis
During indoor tests, in parallel with voltage measurements, a video analysis of the impact of the drops was performed. The objective of the analysis was to find any correlations between the movement of the water and the voltage peaks. For this analysis, only position 2 of
Figure 6 was considered. Both empty and full spoons were studied, with multiple tests. Camera footage was recorded by means of a Teledyne Dalsa Genie Nano G3-GM10-M0640 camera, with an acquisition rate of 400 fps full-frame, an exposure time of 1000 ms, and Turbo Transfer Mode enabled. The camera was equipped with a telecentric lens Computar TEC-55. To reduce external disturbances, a light source of 625 nm was projected onto the camera sensor by means of a Phlox-LedR-BL-LLUB-Q-1R-24V, a device designed to emit a uniform beam of parallel light rays at a specific wavelength, and the corresponding red filter BP635-43 was installed on the camera lens.
The bending of the harvester, due to the impact of the drop with the dry spoon, was so small as to be nearly imperceptible in the footage (see
Figure 8). Such a small bending directly reflects on the amplitude of the output voltage as found in
Section 3. Since with the empty spoon the drop has no other water to interact with, the collision can be considered inelastic. As a consequence, the voltage rapidly reaches its maximum value and then the damping of the system slowly reduces the amplitude of the response in the subsequent milliseconds.
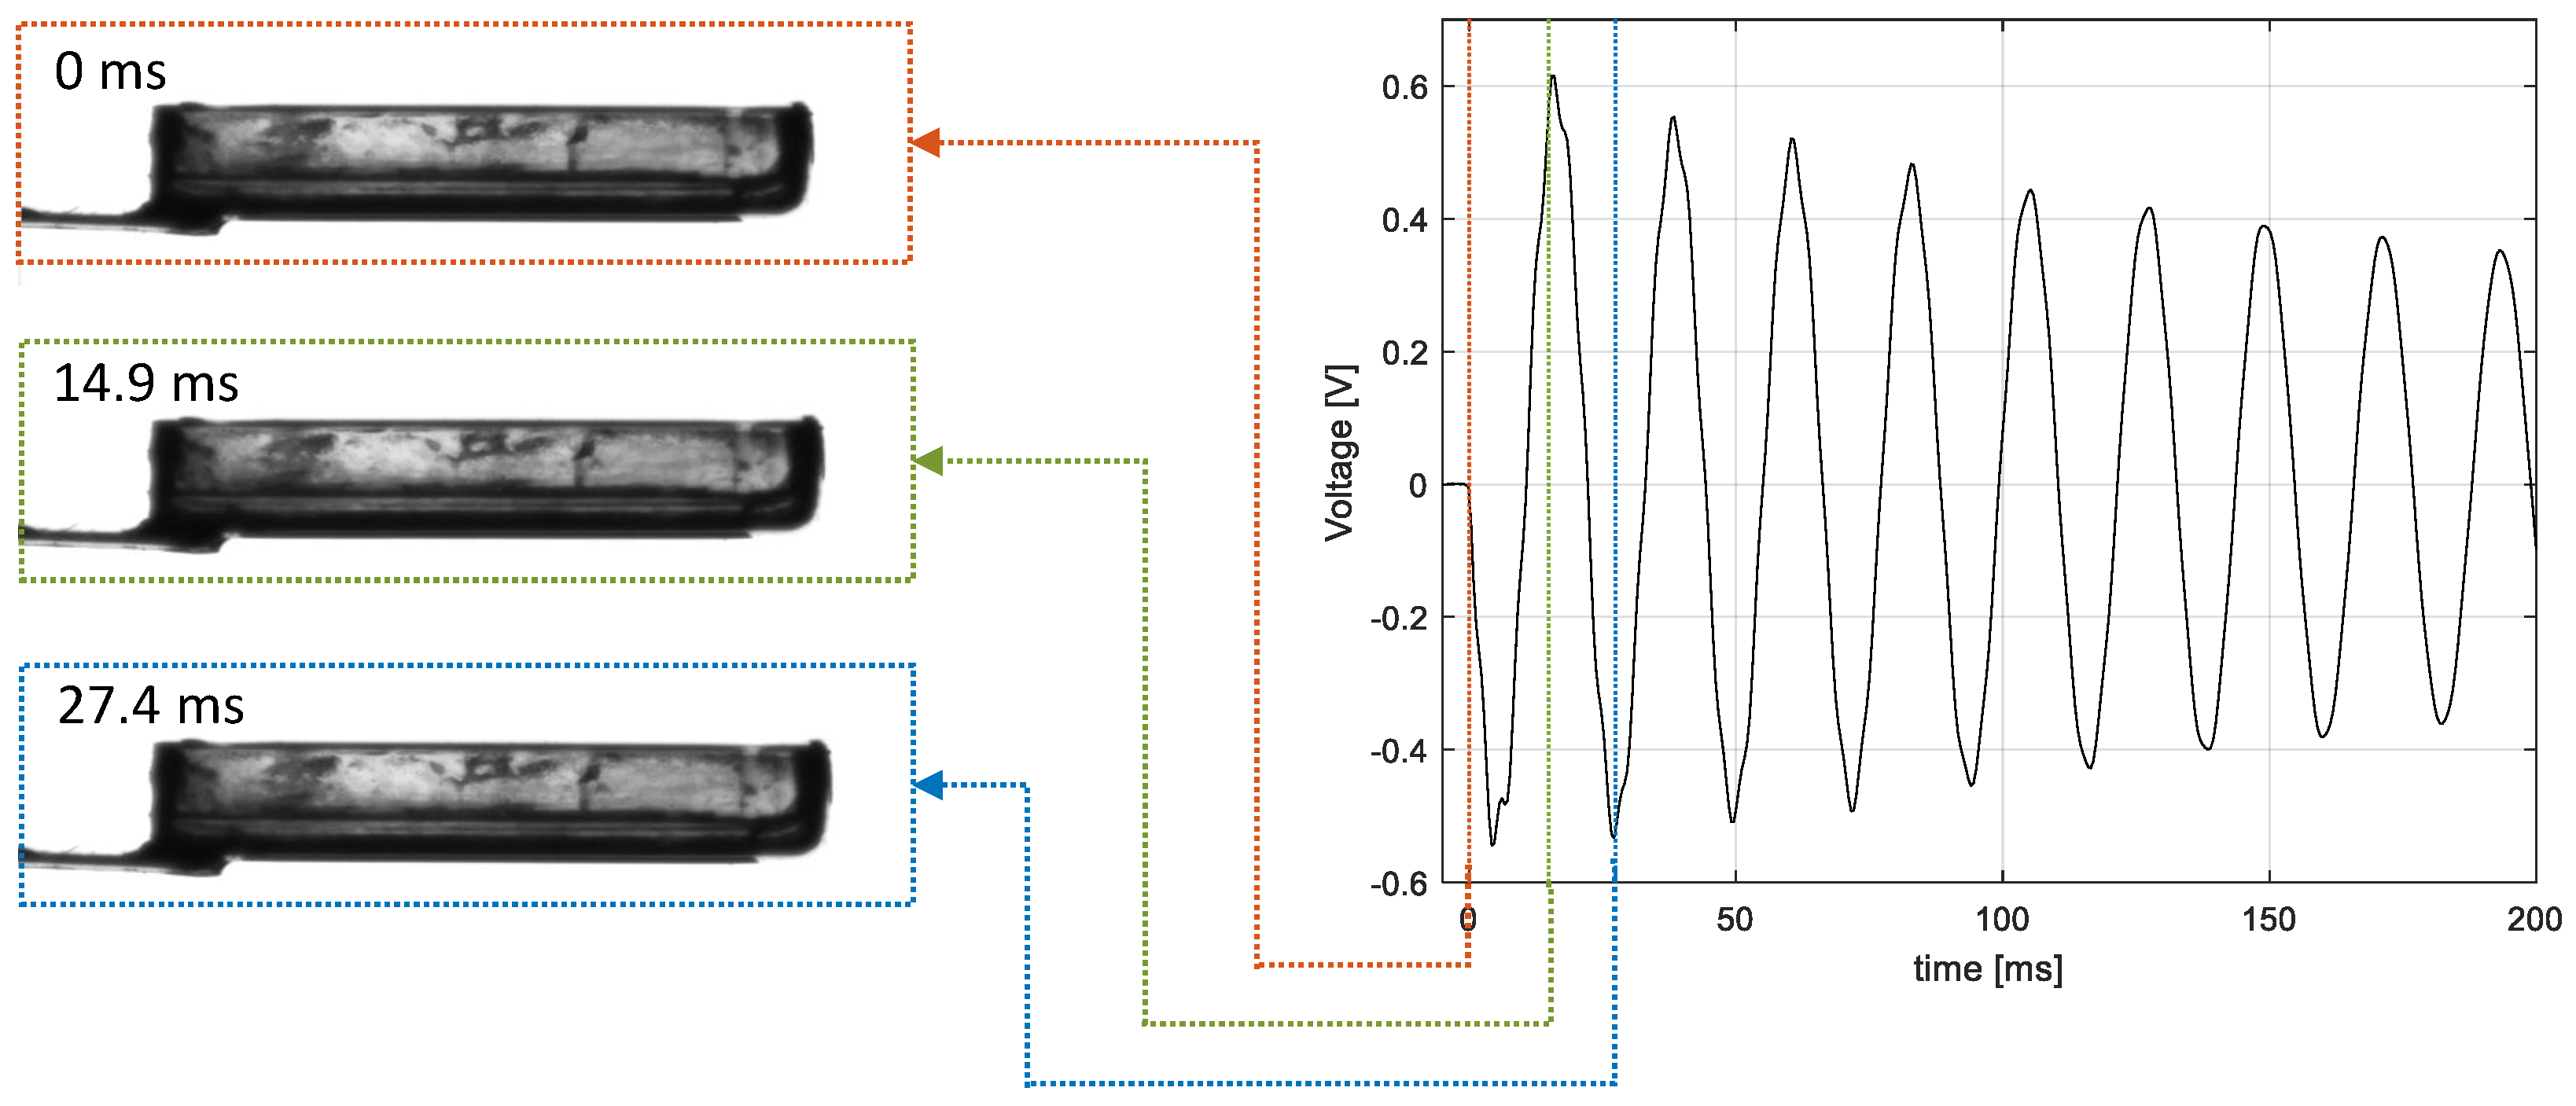
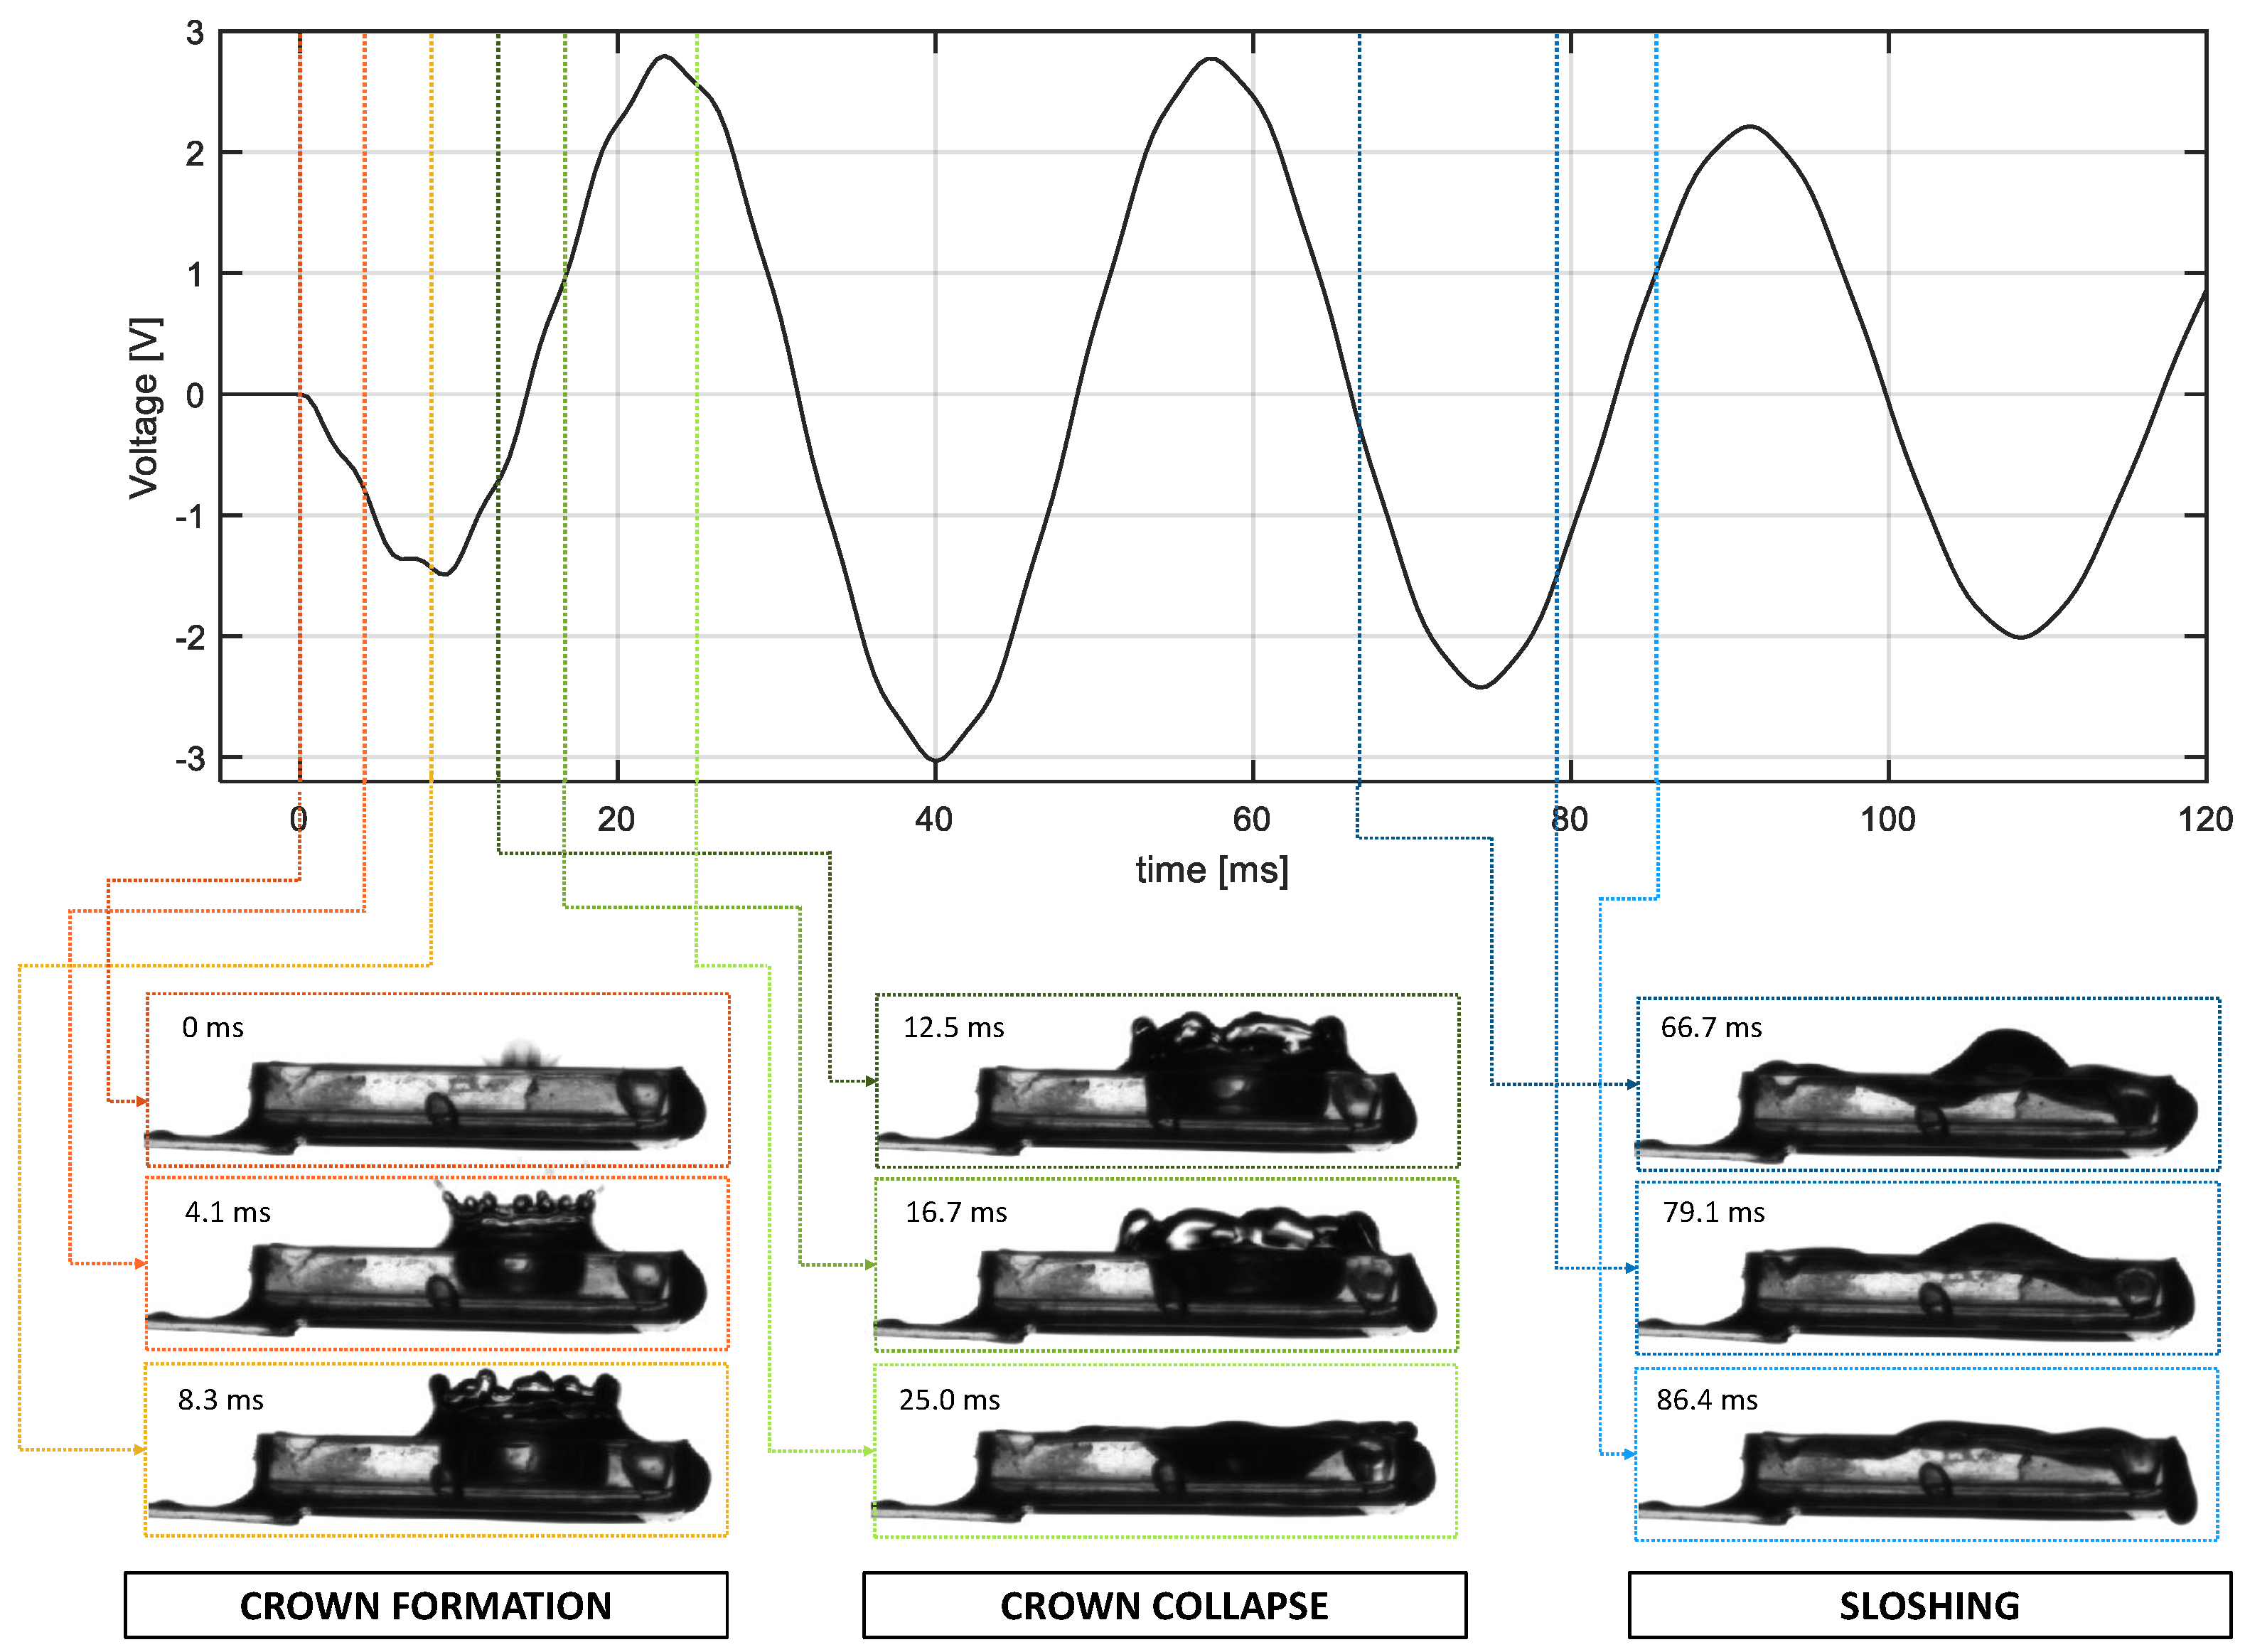
Figure 9 shows the footage of the full spoon, which is much more interesting: the movement of the water and the bending of the harvester are much more noticeable, as well as the output voltage amplitude. Before the water hits the spoon, the harvester is slightly bent under the gravitational force of the 2.5 mL of water. The timeframe for both the footage and the output voltage has been reset at the impact of the drop with the water. When the drop hits the water (0 ms in
Figure 9), at first the impact force moves the spoon downwards, since also the water reacts in a similar manner to a rigid mass. However, in the subsequent milliseconds, the water that interacts with the drop starts moving upwards, whereas a crater is left under the free surface. The movement of the water upwards continues until it reaches its maximum height, and a full crown surrounds the impact site (4.1–8.3 ms in
Figure 9). Then, the crown collapses (from 12.5 to 25 ms in
Figure 9). After the crown collapse, the water mass keeps moving before returning to its initial state. However, at this stage, the water motion is essentially a sloshing motion (see
Figure 9 from 66.7 to 86.4 ms), i.e., the water moves in a direction that is no longer perpendicular to the harvester but parallel. Therefore, the water dynamics no longer affect the dynamics of the harvester, which continues vibrating according to its free response.
5. Interpretative Mathematical Model
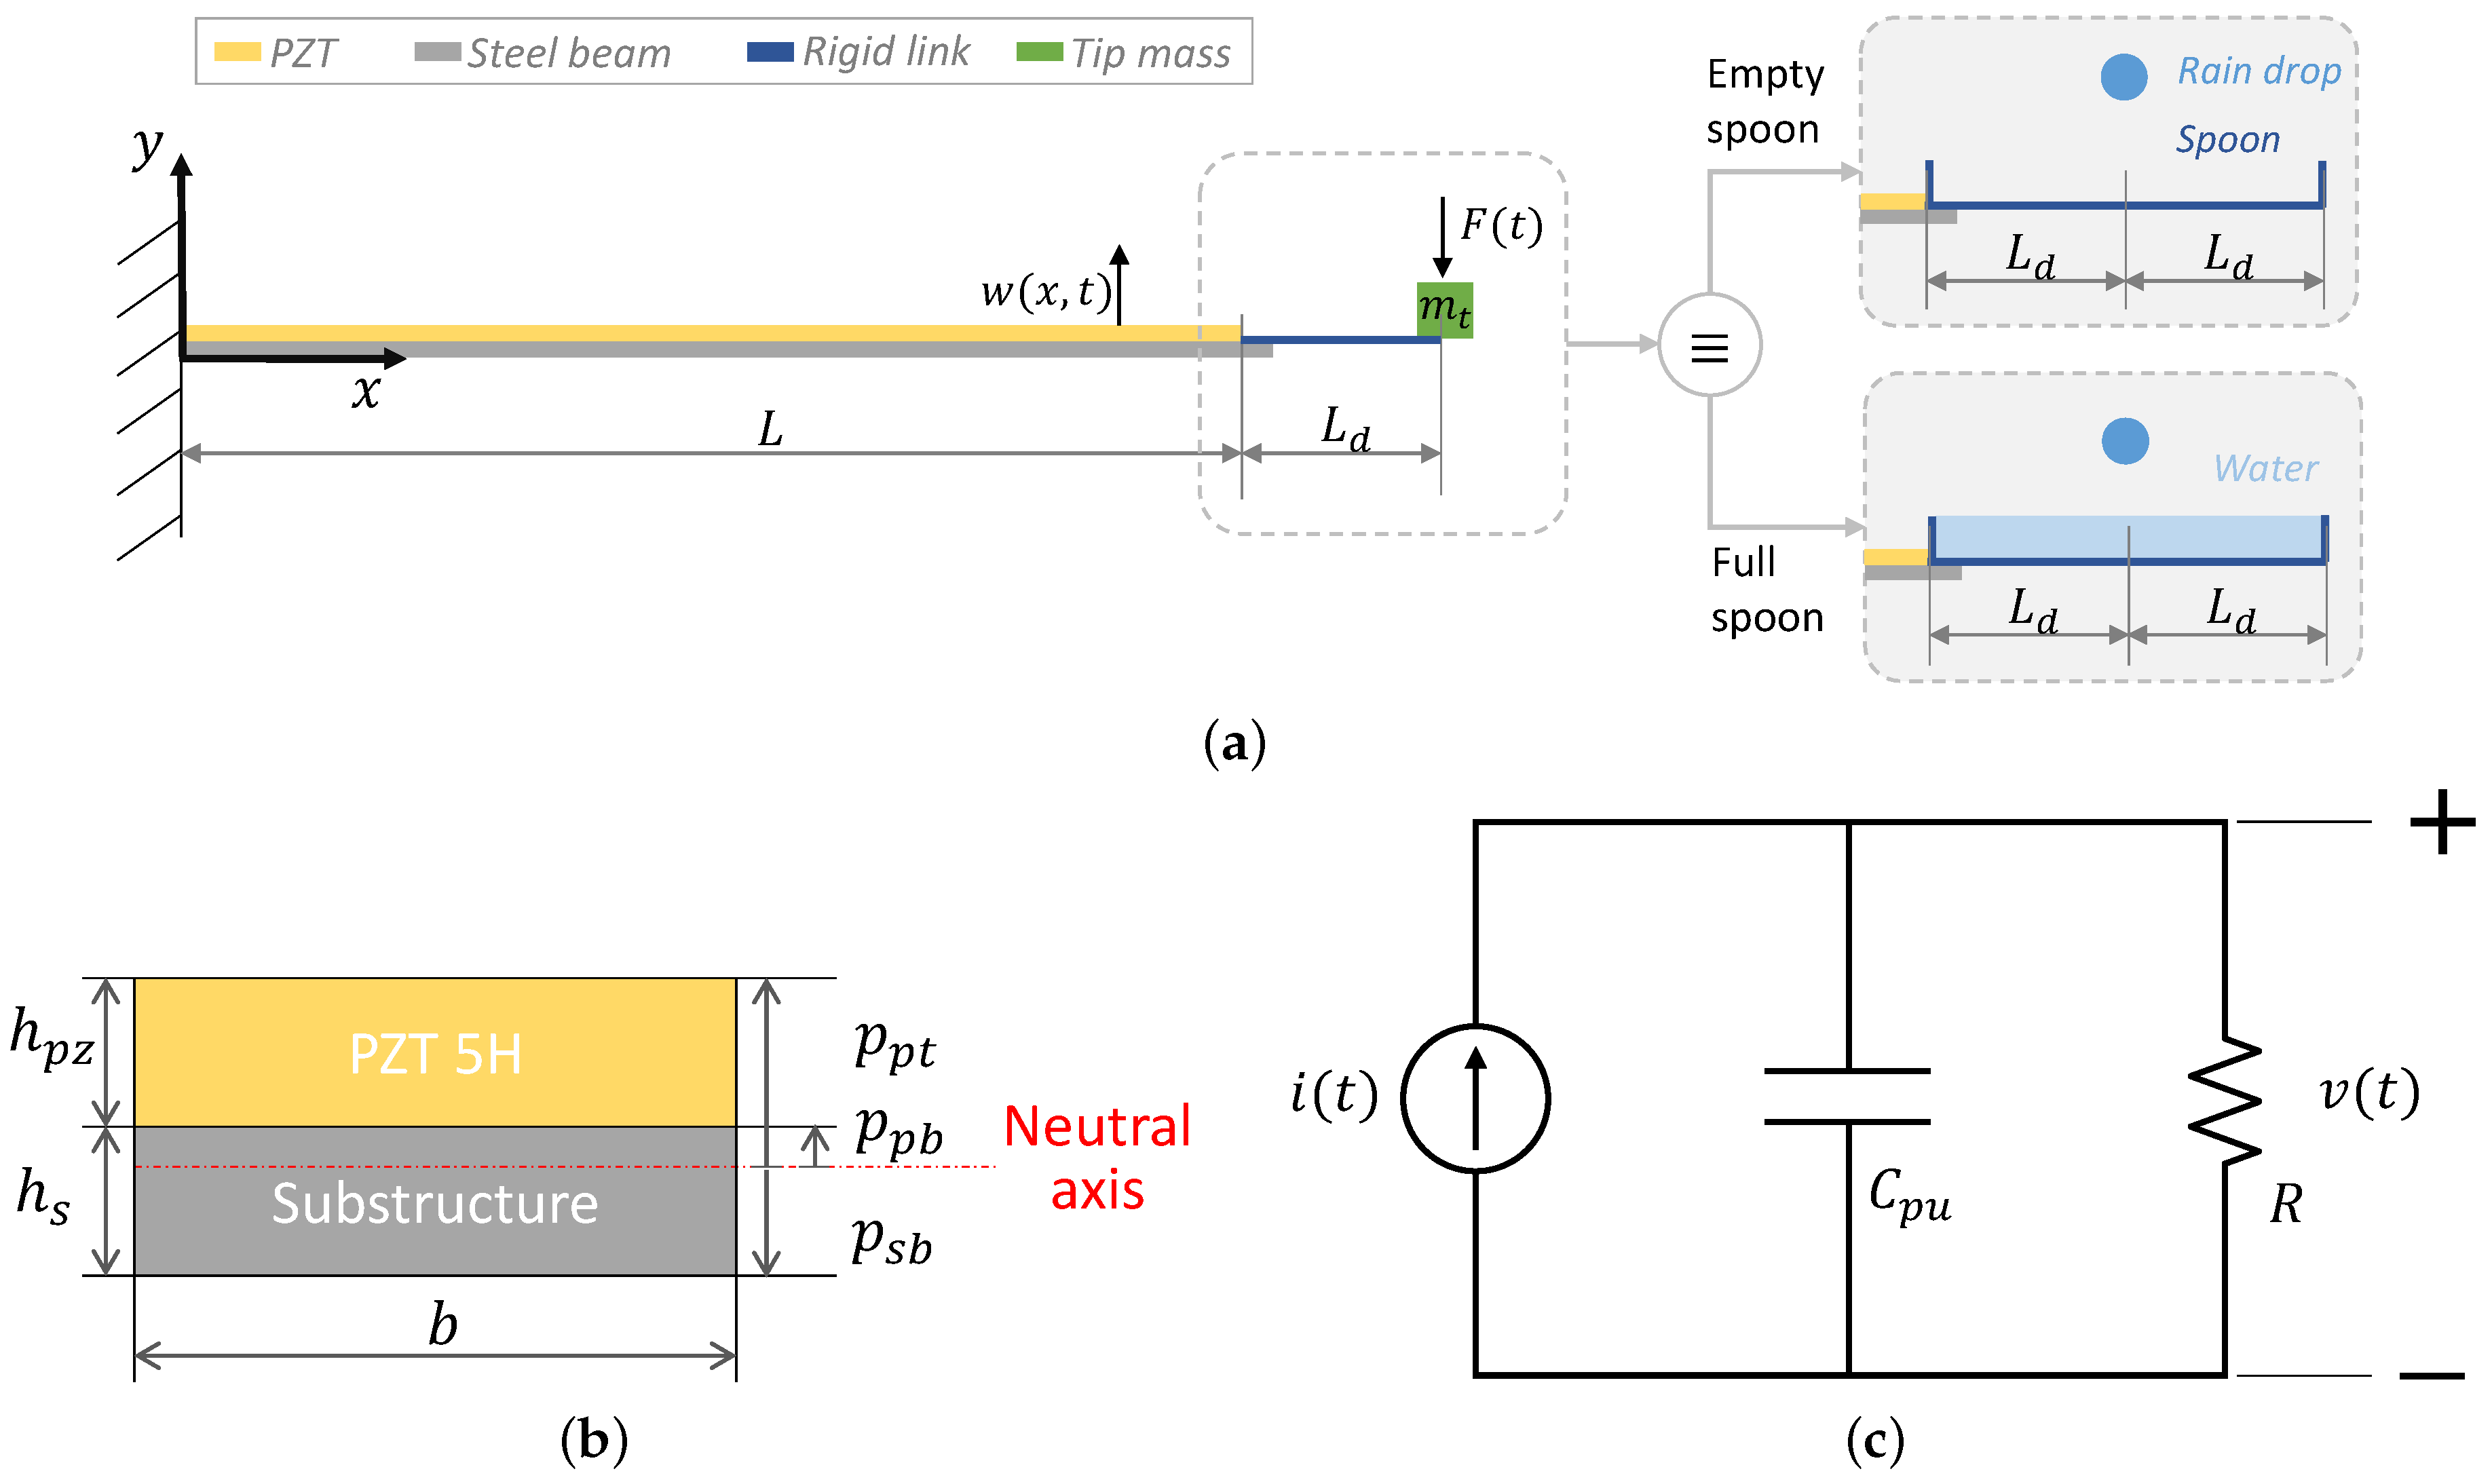
The cantilever harvester used in this experimental study was modeled according to the system schematic shown in
Figure 10. This schematic depicts a composite cross section, including the active piezoelectric layer made of PZT 5H and the structural layer made of steel. The harvester was modeled with the distributed parameter approach of [
24], as modified in [
20] in order to take into account the impulsive force and moment caused by raindrop impact on the spoon. The mechanical problem is described by means of the following partial derivative equation:
where:
is the transverse displacement of any point along the cantilever.
I is the equivalent area moment of inertia of the composite section.
is the bending stiffness of the composite cross section [
25], with
and
denoting the Young’s modulus of the substructure and of the PZT layers, respectively, and
,
, and
indicating the positions from the neutral axis of the PZT layer top, of the PZT layer bottom, and of the substructure layer bottom, respectively (see
Figure 10b).
b is the width of the beam.
L is the cantilever length.
and are the strain rate and air damping coefficients, respectively, which are assumed to satisfy the proportional damping criterion.
is the backward piezoelectric coefficient that couples the mechanical problem with the electrical problem; with piezoelectric constant, and thickness of piezoceramic layer.
is the voltage.
The impact of the drop on the harvester is modeled as a concentrated force
acting on the system at distance
from the fixed base (see
Figure 10a), which corresponds to the middle point of the spoon. Such a force can be transported at the cantilever end
by using an equivalent bending moment, represented by a pair of opposite forces located at distance
h and with a magnitude
. Therefore, the equivalent force acting on the harvester tip
, at the right-hand side of Equation (
3), is:
where
represent Dirac’s delta.
The electrical problem is described by the first-order ordinary differential equation of the circuit shown in
Figure 10c. The charge generation caused by the piezoelectric effect is represented by an equivalent current source
, whereas the capacitive effect related to the electric field in the PZT layer is simulated by a capacitance
. The external electrical load is schematized by a simple resistance
R:
Equations (
3) and (
5) are solved by means of the modal expansion method [
25], by setting:
The absolutely and uniform convergent series of the mass-normalized eigenfunctions (
), representing the vibratory motion of the harvester (
), has been truncated at the first term, i.e.,
, since this approximation is sufficient in most harvesting applications [
20]. The eigenfunctions,
, are determined by solving the eigenvalue problem of a cantilever beam with a concentrated mass,
, and a rotary inertia,
, at the tip [
24]. Therefore, the dynamics of the harvester are represented by means of a single-mode coupled (electro-mechanical) model [
20,
21] as follows:
where:
is the modal coordinate of the harvester for the first vibrational mode.
and are the first and second derivative of the corresponding variables with respect to time t.
is the modal damping.
is the undamped natural angular frequency.
is the modal electromechanical coupling coefficient.
is the modal force given by:
The harvester motion equations in (
7), as well as the force representation in Equations (
4) and (
8), are general models, suitable for describing the harvester dynamics in both the cases analyzed in this study, i.e., a harvester provided with an ‘empty spoon’ and with a ‘full spoon’. Depending on the condition to be modeled, the following model parameters take different values:
, the tip mass is set to be equal to the mass of the spoon if it is empty; otherwise it is equal to the sum of the spoon and the water masses;
, the modal damping, as discussed in
Section 3.2, increases in the presence of water;
, the equivalent force that excites the system must take into account whether the drop impacts on a dry or on a wet surface. The force models for both the cases are described in the following sections.
5.1. Force Model for the Dry Spoon
The force model for a water drop impacting on a dry surface is well known in the literature [
17,
20,
21]. It is represented trough the following impact force:
where
is the drop mass,
is the Heaviside step function, and
is the coefficient of restitution. In Equation (
9),
is the impact velocity of the drop, which can be computed according to [
17] as a function of the falling height
:
where
is the drop radius;
g is the gravity acceleration;
and
are the mass density of the air and of the water, respectively; and
is the drag coefficient of the drop. The impact duration of the impinging water drop in Equation (
9) can be expressed as:
5.2. Force Model for the Wet Spoon
When the raindrop impinges onto a spoon that is full of water, the harvester vibrates at the same frequency at which it would vibrate if the spoon were empty and equipped with a solid mass equal to the water mass. Although the resonance frequency is equal in the two cases, the vibration amplitude of the harvester with the wet spoon is much larger, i.e., the water in the spoon acts as a force amplifier. Although the harvester dynamics are highly affected by the dynamics of the water in the spoon, the vice-versa does not hold: the video analysis discussed in
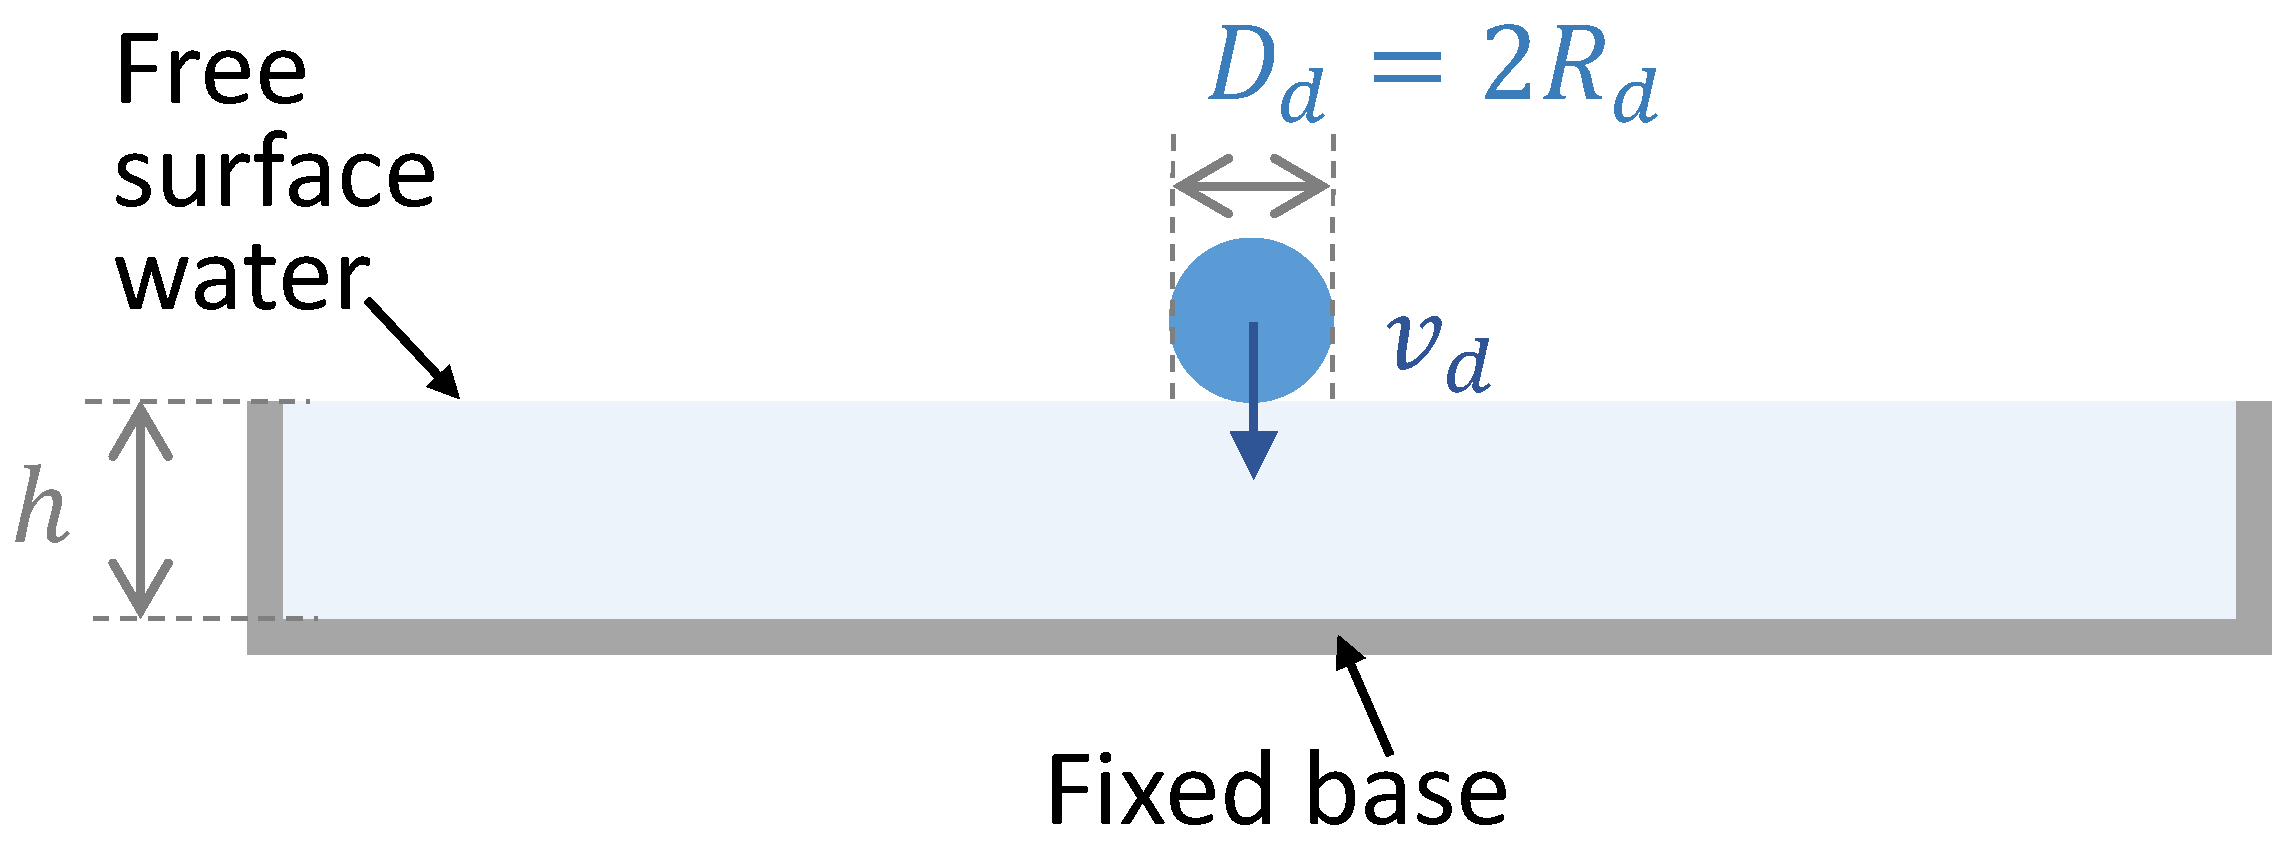
Section 4 showed that the motion of the water is scarcely affected by the vibration of the harvester. Thanks to this experimental evidence, in a first simplified-modeling attempt, it is reasonable to model the water dynamics neglecting the harvester motion, i.e., considering the spoon as fixed (see
Figure 11).
The phenomena related to the impact of a drop on a water surface are affected by the water film depth,
h, significantly [
26]. In particular, the impacts can be divided into three types according to the dimensionless film thickness (
): drop impacts on shallow (
), medium (
), and deep (
) films. Regardless of the film depth, the drop impact on film leads to the formation of a crater below the free surface level of the water, and a crown above it at the circumference of the crater [
27]. If the drop impacts on a medium film—as in the case analyzed—a cylindrical crater with flat-bottom is formed in the water film [
26].
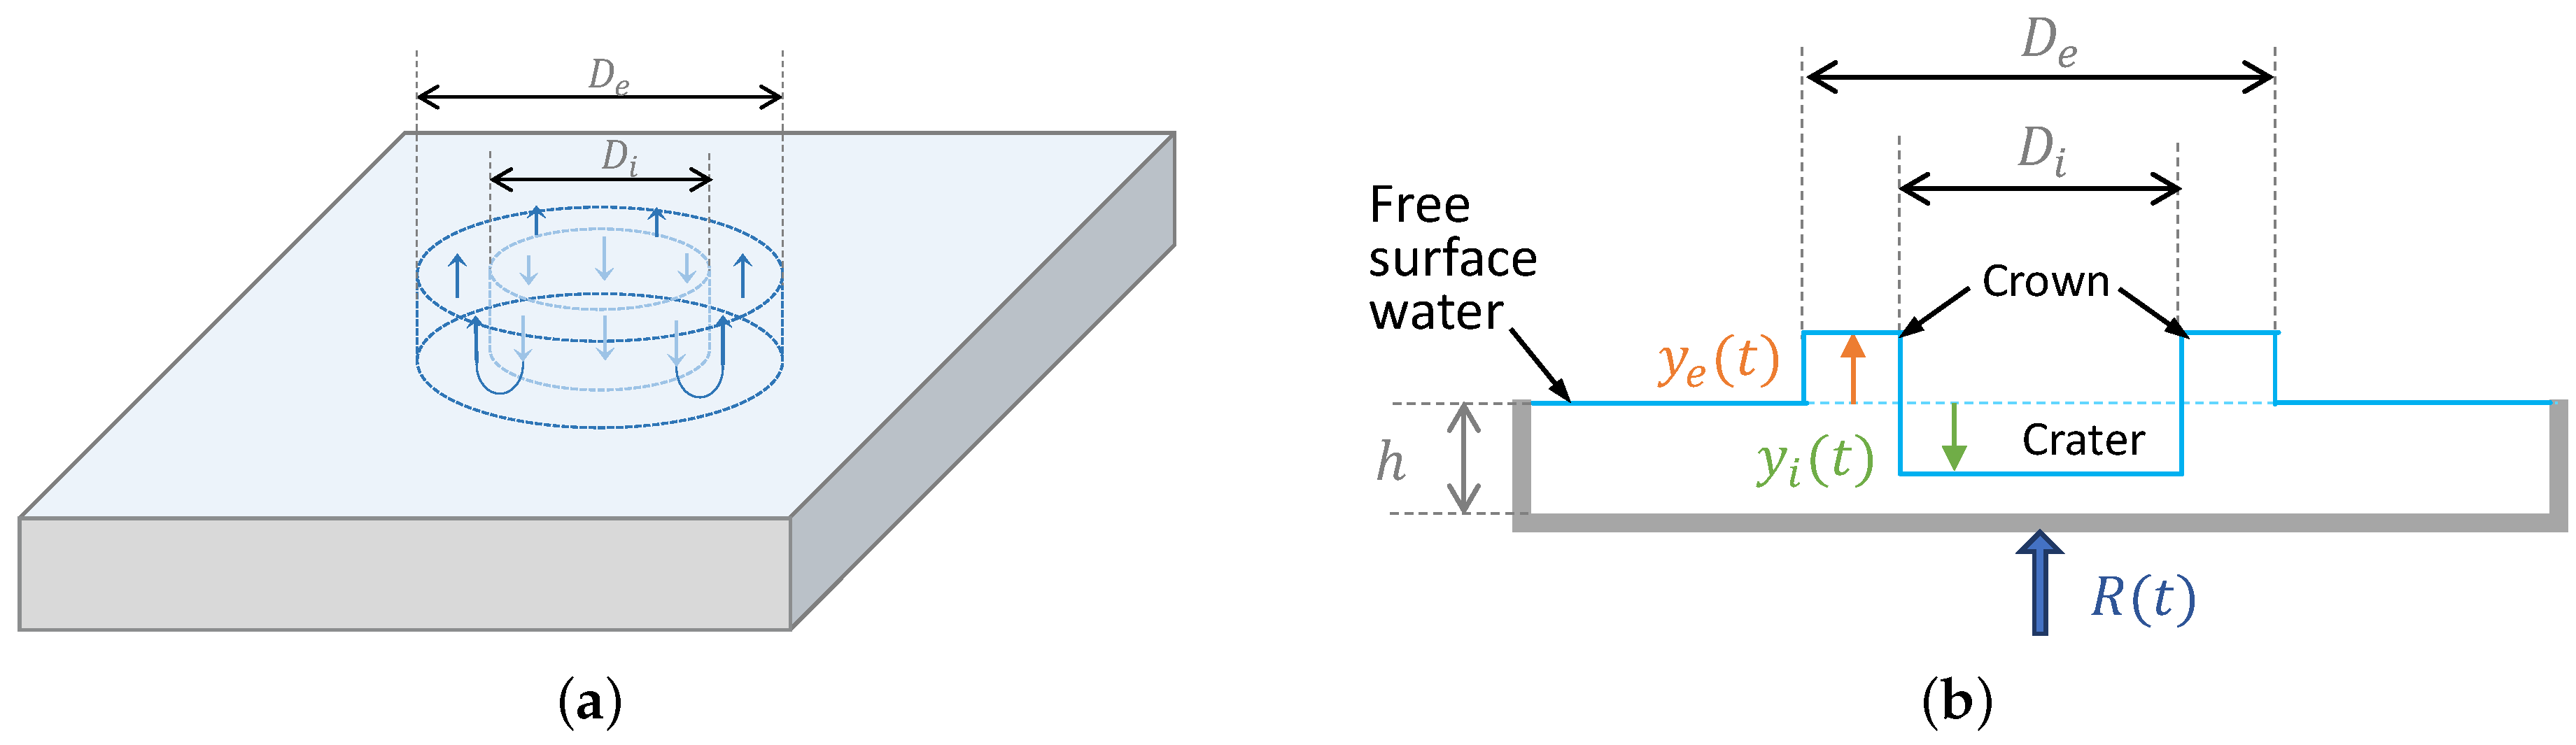
Starting from these results regarding the impact of a drop on a medium film, the complex fluid dynamics of the splash is here simplified in order to infer an easy and computationally inexpensive model describing the macroscopic effect that the water movement has on the harvester. The simplified splashing mechanism is schematically represented in
Figure 12. It is assumed that, as the drop impacts the water, a mass of water included in a cylinder of diameter
starts moving downwards, forming the crater, and concurrently the same amount of water—included in a hollow cylinder of internal diameter
and external diameter
—begins to move upwards, forming the crown. Therefore, this continuity equation holds:
where
, and
are the areas of the crown and of the crater, respectively, wheres
and
are their velocities.
The linear momentum
of the water after the impact of the drop can be expressed as:
where
and
are the masses contained in the external and the internal cylinders, respectively, before the impact, i.e., when
and
. The force
exerted by the spoon on the moving water can be inferred by deriving in time Equation (
13):
In order to simplify the previous equation, it is worthwhile to introduce the relation between
and
that can be inferred from the continuity Equation (
12):
By substituting Equations (
15)–(
17) in Equation (
14), after some mathematical passages, the following equation is obtained:
For the determination of the force it is necessary to know the values of the two areas ( and ), as well as the motion of the crown . The determination of these parameters is discussed in the following subsections.
5.2.1. Determination of the Cylinder Areas
The dimensions of the two unknown areas representing the cavity and the crown can be evaluated using an energy conservation approach [
26]. In this analysis, the maximum depth of the cavity
and the maximum height of the crown
, which occurs when the cavity depth is maximum, are assumed to be known. The first can be equated within a good approximation to the water film thickness
h, since in medium film the residual film thickness (i.e., the water layer under the cavity) is small. The latter,
, can be inferred from experimental data if available, or can be computed exploiting the models available in the literature [
28,
29,
30].
When the maximal values of the crown height and the cavity depth are reached, only a portion
of the initial total energy of the drop
is converted to the gravity
and surface
energy of the cavity and the crown; it holds that:
where the total drop energy is the sum of the kinetic energy
and the surface energy
:
with
indicating the water surface tension. Based on the work of Zhang et al. [
26], who numerically investigated the energy conversion process during the impact process for different film depths, for a medium film during the crown stabilization phase (i.e., the one in which the maximum crown height is reached) the coefficient
in Equation (
19) varies from 0.5 to 0.6.
The gravitational potential energy of the crown and the cavity, i.e., of the displaced water mass, in Equation (
19) is:
where as the surface energy
is given by:
By taking advantage of Equation (
16) and of the areas’ definitions, it is possible to derive the following relations:
The cavity and crown energies can be rewritten as:
When Equations (
20), (
24) and (
25) are substituted into Equation (
19), a quadratic equation in the only unknown
is obtained:
Once Equation (
26) is solved, the other unknown, i.e.,
, can be computed by means of Equation (
23).
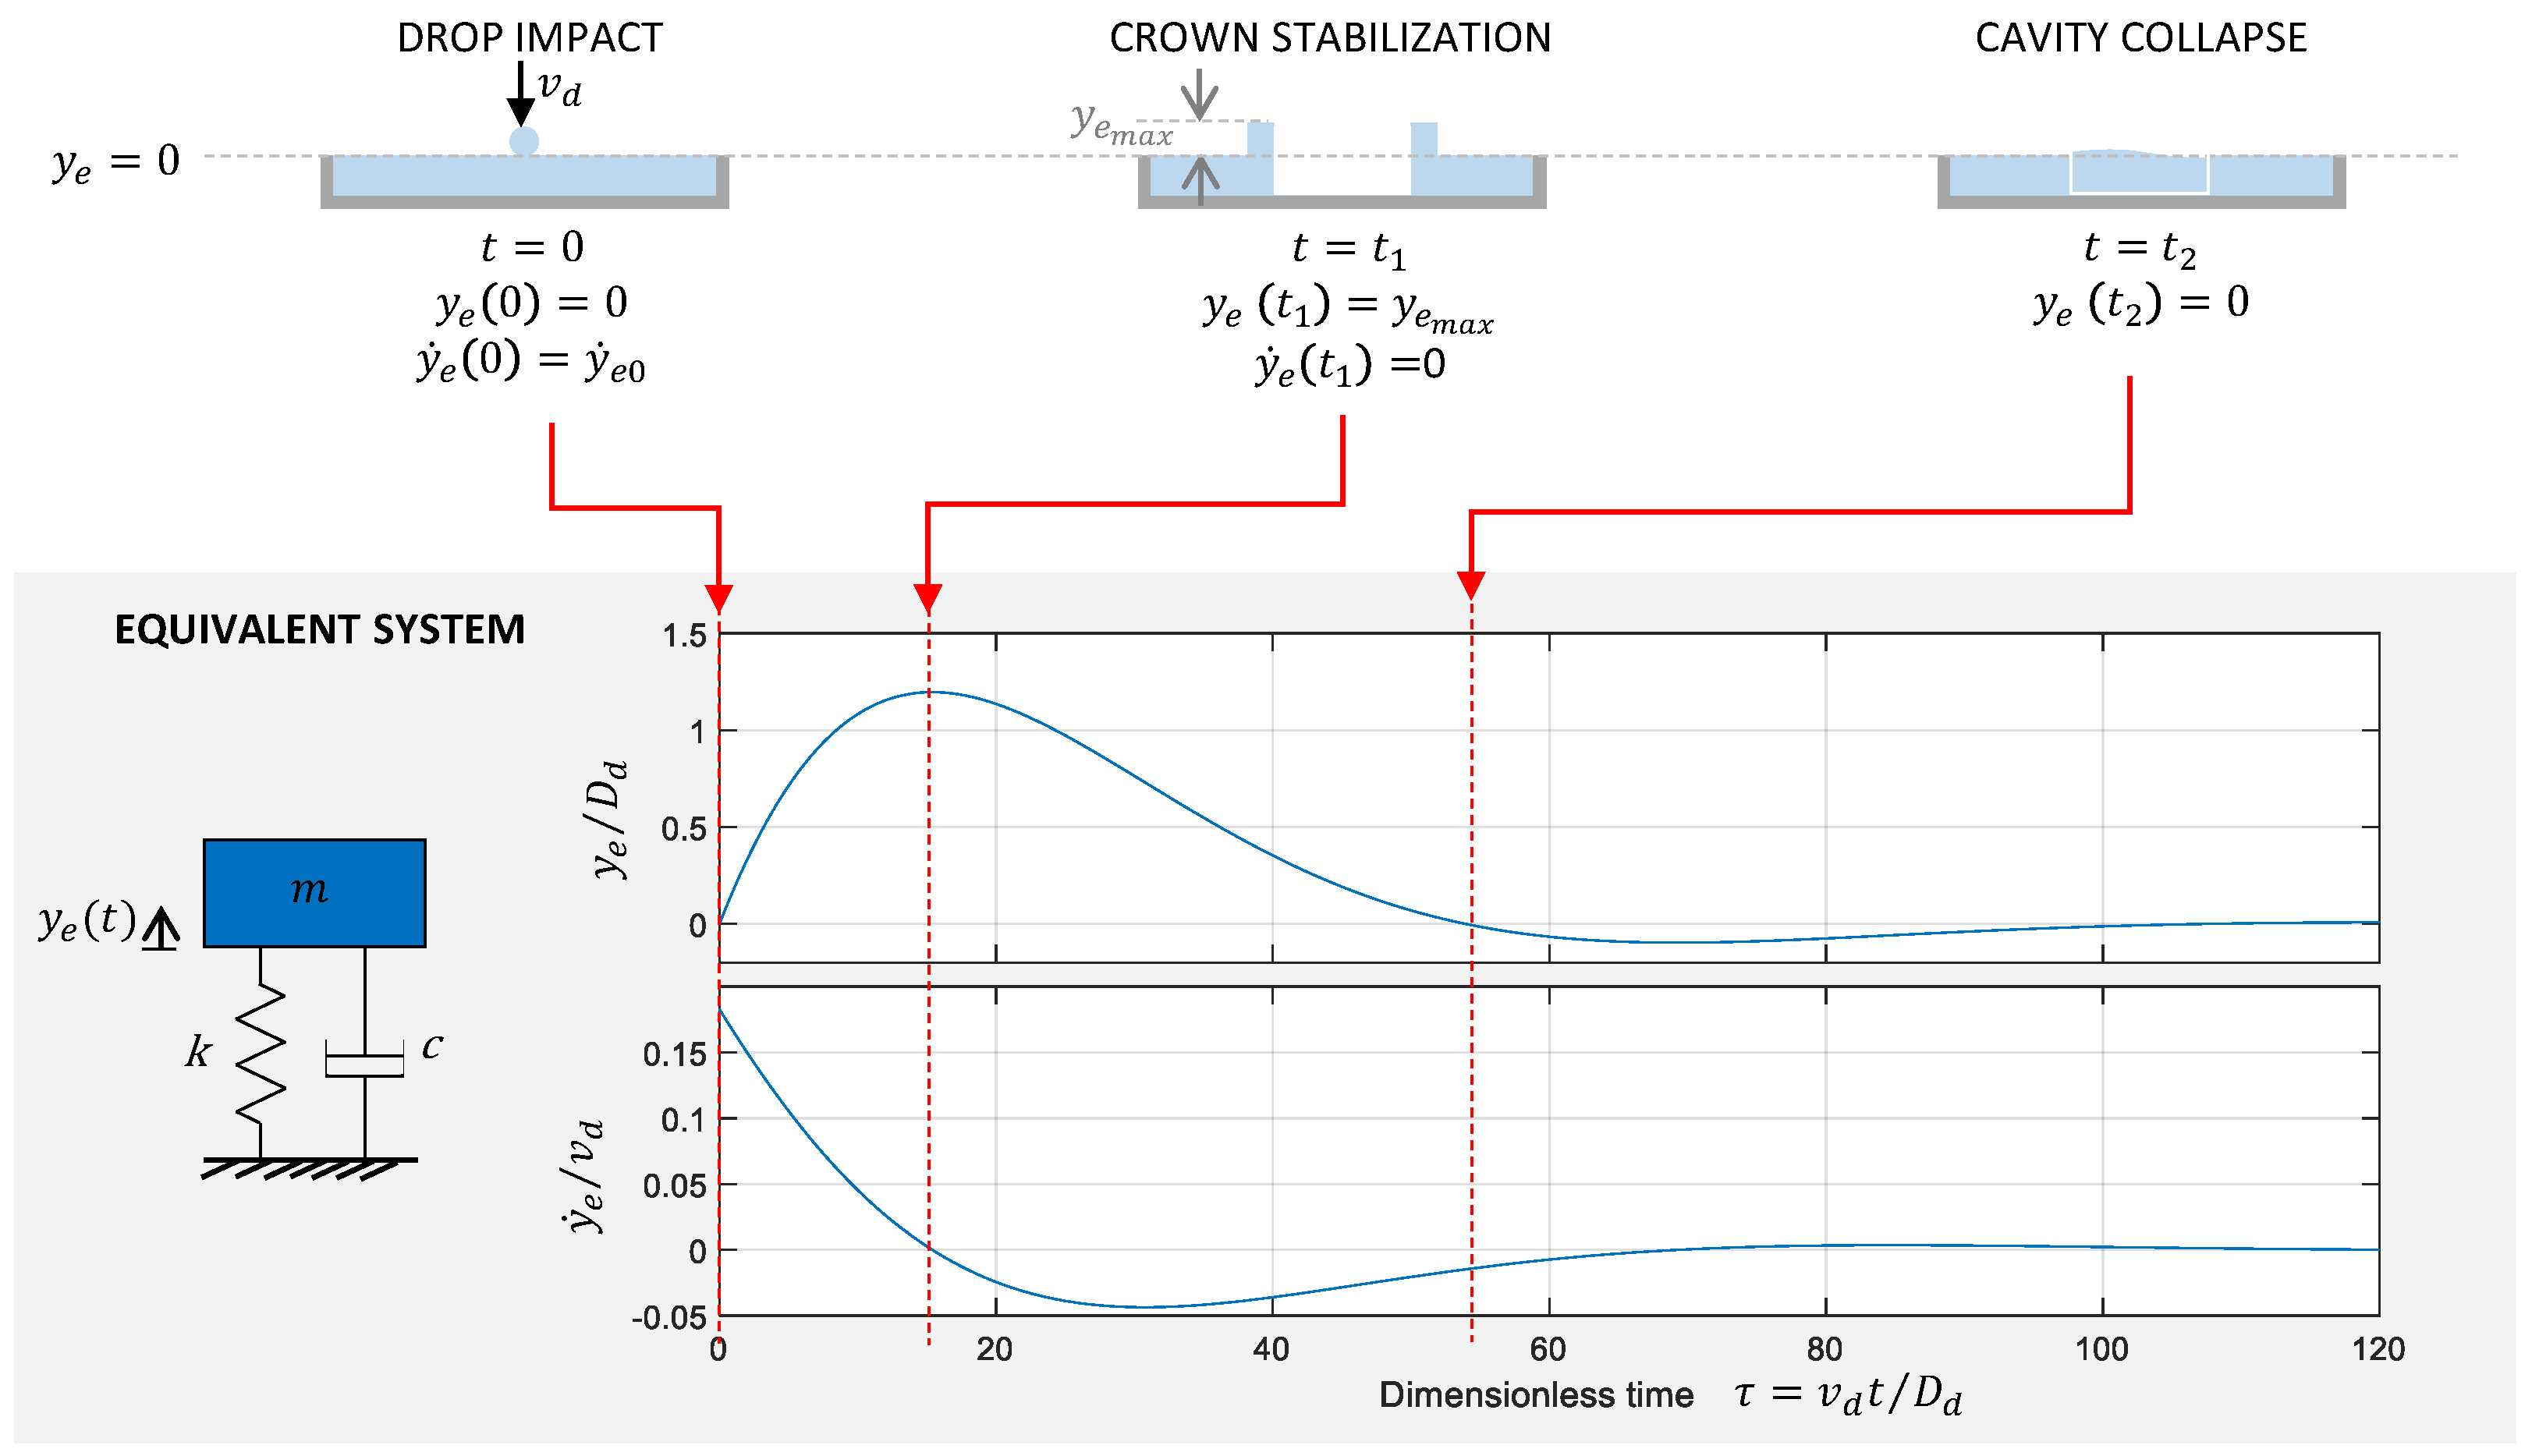
5.2.2. Approximation of the Crown Motion
The implementation in Equation (
18) of an analytical formulation of the actual crown motion is practically impossible. It is a very complicated motion, described by nonlinear dynamic equations involving several interaction phenomena, e.g., water–water, water–air, and water–solid (the spoon) interactions. The goal of the present paper is to find an approximation of the crown motion that is able to represent the main crown movements responsible for harvester excitation, i.e., the maximum elongation and the collapse. To this end, the crown is modeled through a mass-spring-damper system, of which the free response to initial conditions (i.e., the drop impact, which means
and
) can represent the crown evolution. The mass of the system has been set to be equal to the displaced water mass in Equation (
24), i.e.,:
The other system parameters—i.e., the stiffness
k, the viscous damping coefficient
c, and the initial crown velocity
—are determined by imposing three conditions on the free-vibration response of this equivalent system, so that it can match the known information about the crown evolution. Let
and
indicate the instants at which the crown reaches its maximum height and at which it collapses, respectively; the imposed conditions are two for the crown stabilization phase (
and
) and one for the crown collapse phase (
). The time instants
and
, similarly to
, can be inferred from the experimental data if available or using the models available in the literature (e.g., [
29]) for the determination of
, and [
19] for the determination of
.
The parameters of the simplified crown model are found by solving the following system of non-linear equations:
The solution of Equations (
28) makes it possible to compute the force
in Equation (
18) that the harvester exerts on the water and hence the force that acts on the harvester, that is,
.
Figure 13 schematically summarizes the simplified model adopted for describing the crown motion, as well as the imposed conditions, and the resulting motion.
5.3. Model Validation
The mathematical model presented in
Section 5 was implemented in MATLAB. The harvester motion equations in Equation (
7) were cast as a set of first-order differential equations and then discretized through the fourth-order Runge–Kutta method with a time-step of 0.1 ms. The parameters employed for the model implementation are listed in
Table 1. The load resistance value stated in
Table 1 corresponds to the the resistance of the data logger employed for the experimental tests, which was the only resistance in the electric circuit (
R in
Figure 10c). Simulations aimed to verify the effectiveness of the model in approximating the voltage generated by the harvester with either a dry spoon or a wet spoon. The results for both the cases are shown in the following sections.
5.3.1. Empty Spoon
The impact force
was modeled according to Equation (
9). All the parameters necessary for the determination of this force are summarized in
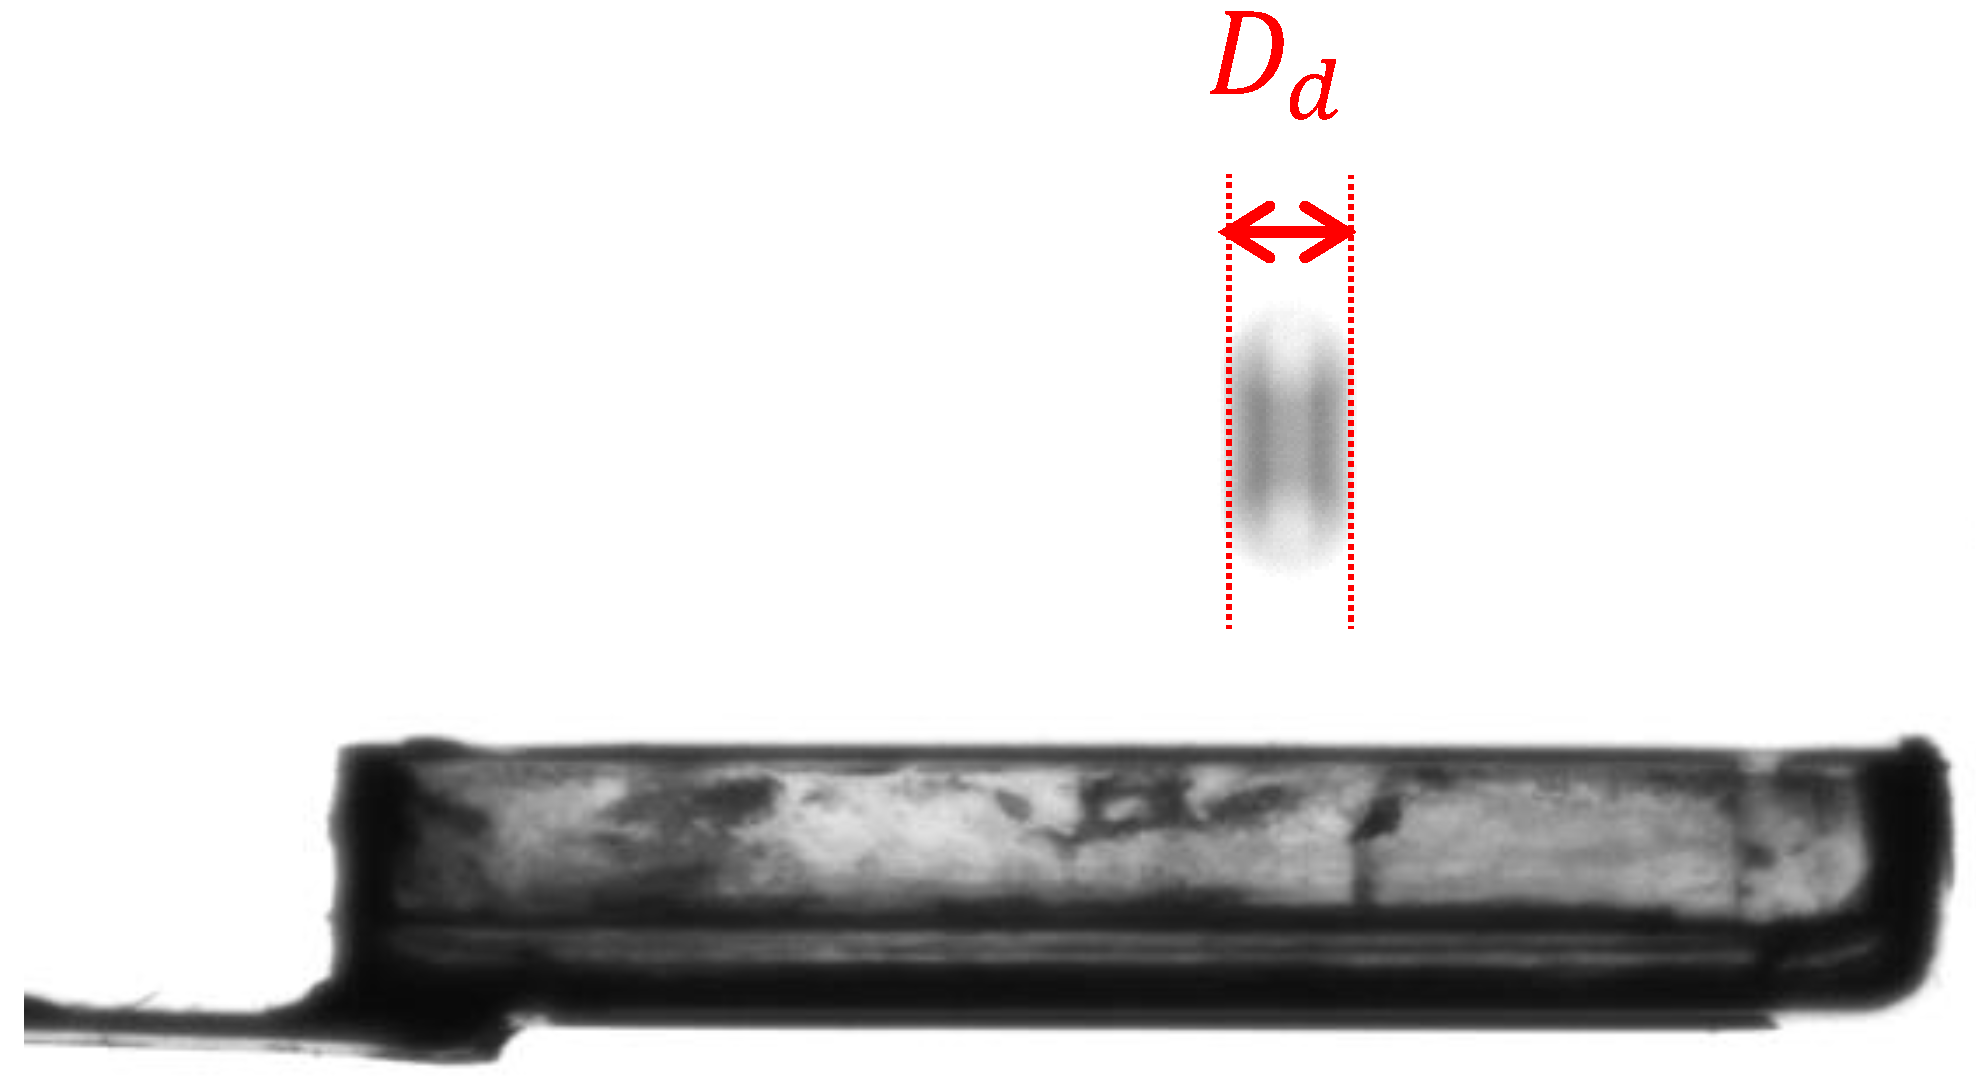
Table 2. They depend on the diameter of the impacting drop
, which was inferred from the footage of the experimental test (see
Figure 14). In the indoor experimental test analyzed here, a drop with a diameter of 2.01 mm impacts on the harvester, falling from a height of 1 m. With these values Equation (
10) gives a drop impact velocity of 4.04 m/s.
Figure 15 shows the harvester voltage estimated using the model with a blue line and its actual values delivered by the experimental test with a red line. Both the waveform and the fast Fourier transform (FFT) of the simulated voltage were in good agreement with the corresponding plots of the measured voltage.
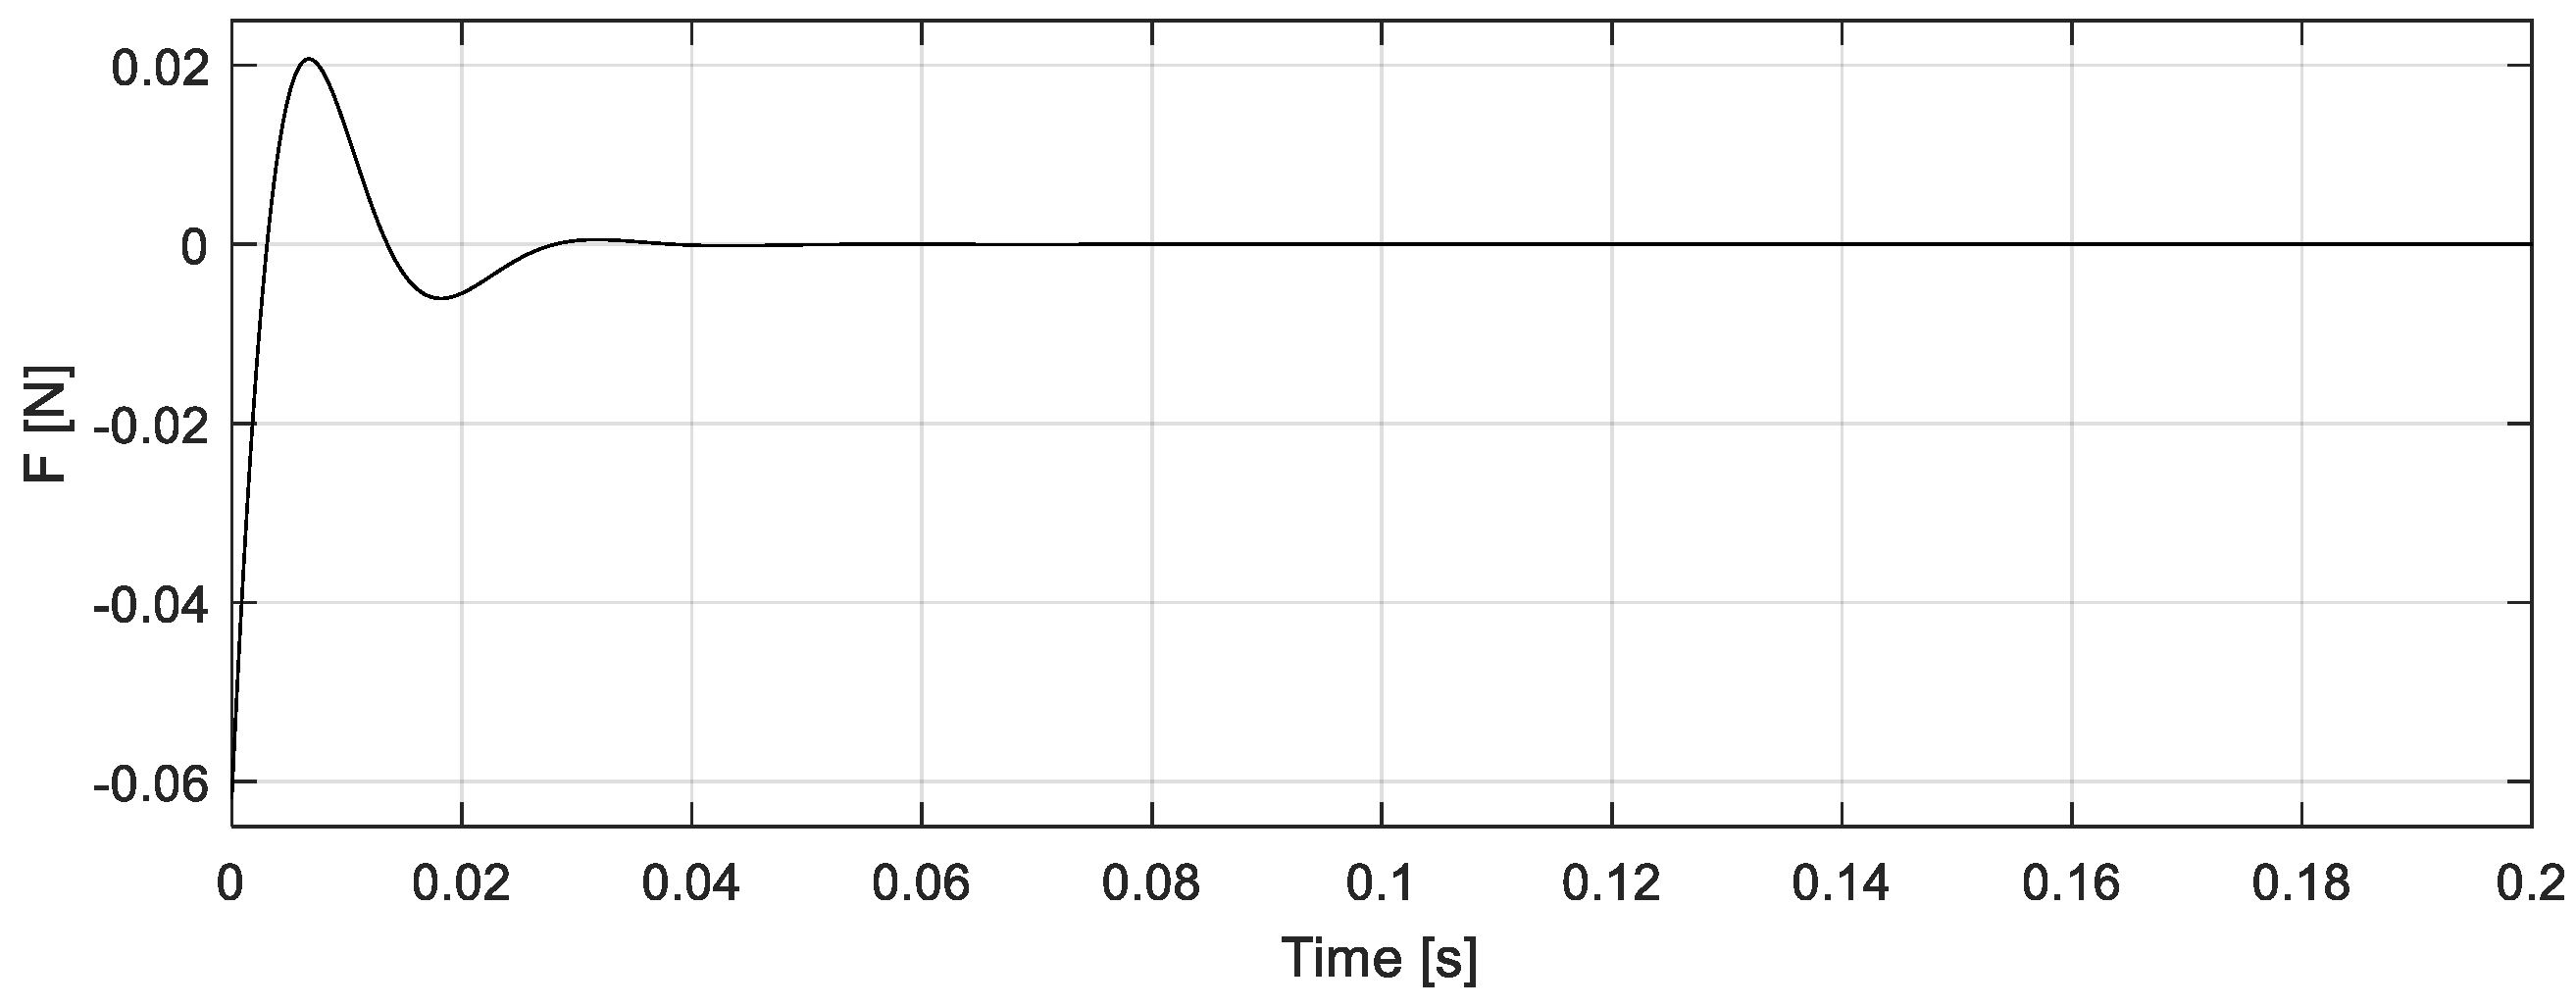
5.3.2. Full Spoon
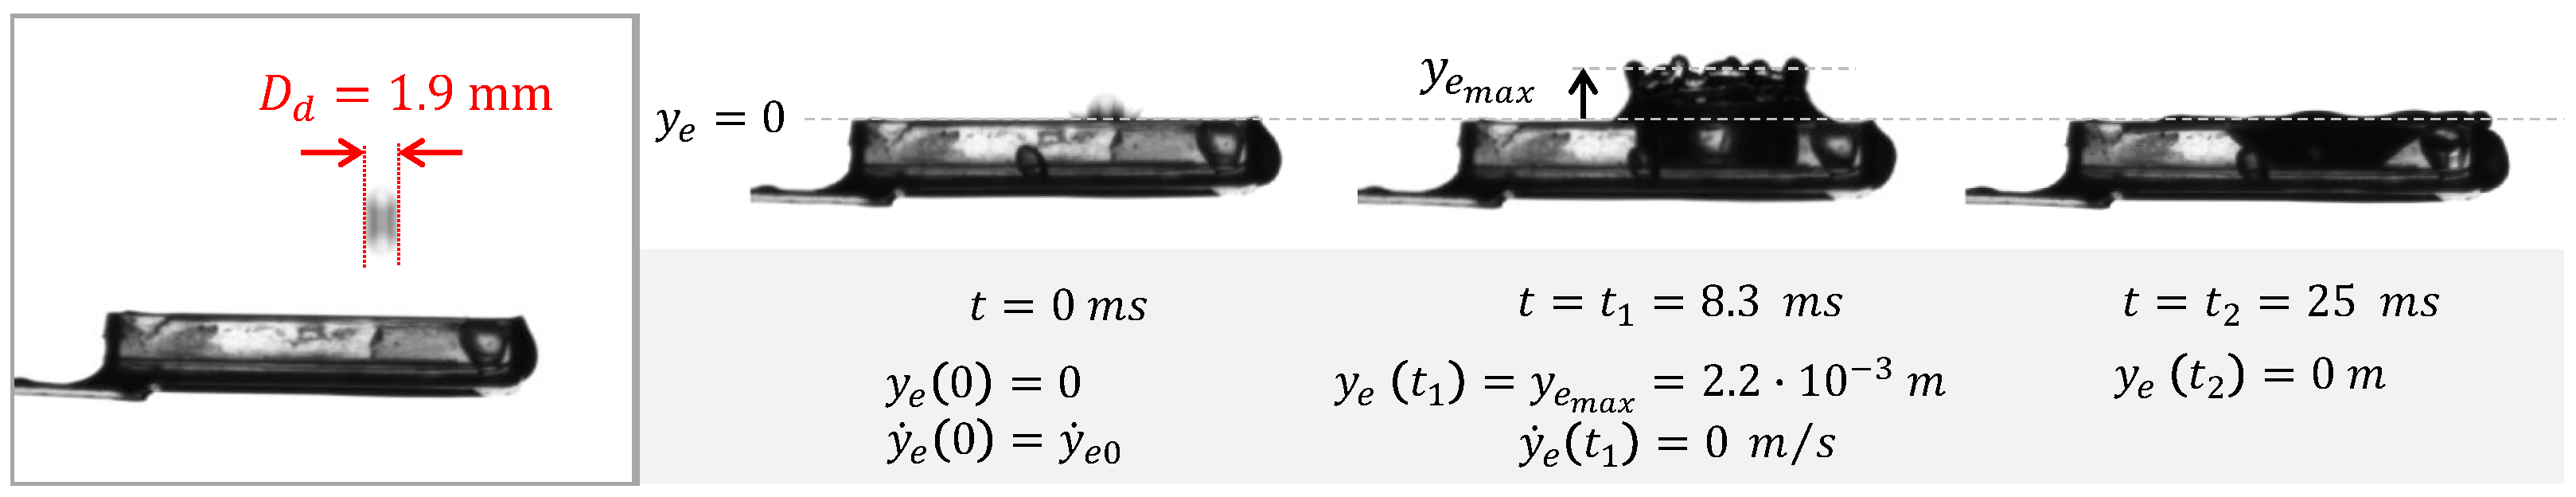
The determination of the force exciting the harvester provided with a spoon full of water requires the knowledge of some system parameters: the maximum crown height and the instant at which it is reached—the instant at which the cavity collapses. As discussed in
Section 5.2, such parameters can be approximated through the models available in the literature or inferred from experimental data, as in the present case (see
Figure 16).
The same indoor experiment shown in
Figure 16 was simulated in MATLAB. Therefore, a drop with a diameter of 1.9 mm falling from a height of 1 m was considered for the computation of the energy balance in Equation (
19), and hence for the determination of the crown (
) and the cavity (
) areas. The equivalent mass-spring-damper system representing the motion of the crown (see
Section 5.2.2) was found using the data in
Figure 16 and by solving the nonlinear Equation (
28) through the fsolve function in MATLAB. The resulting parameters of the equivalent system, together with all the other parameters involved in the force computation, are listed in
Table 3. The equivalent force that acts on the harvester due to the impact of a raindrop on the spoon full of water is shown in
Figure 17.
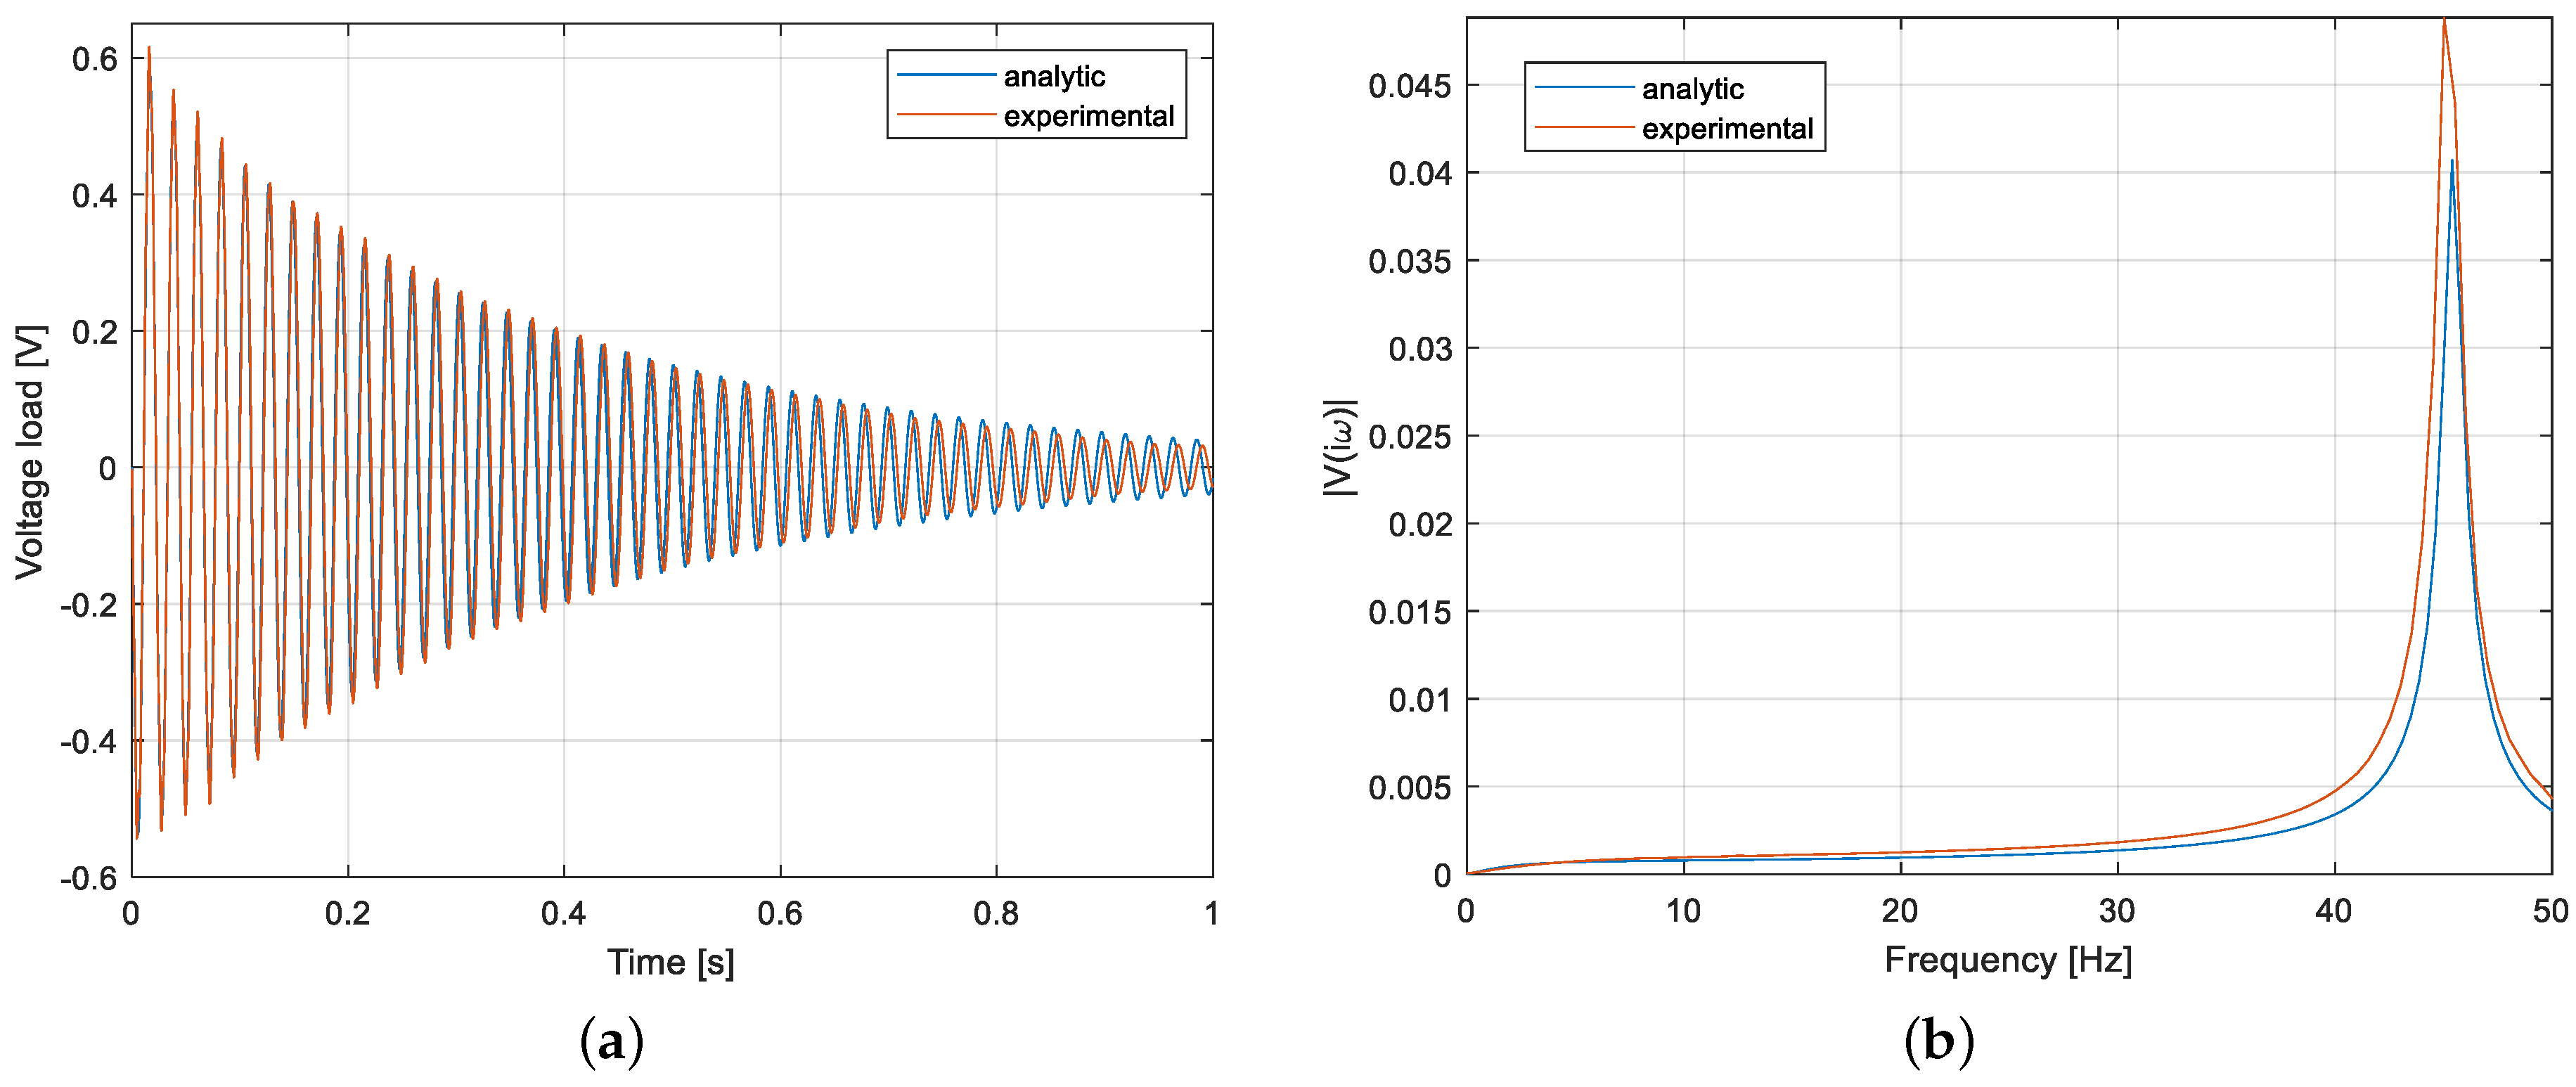
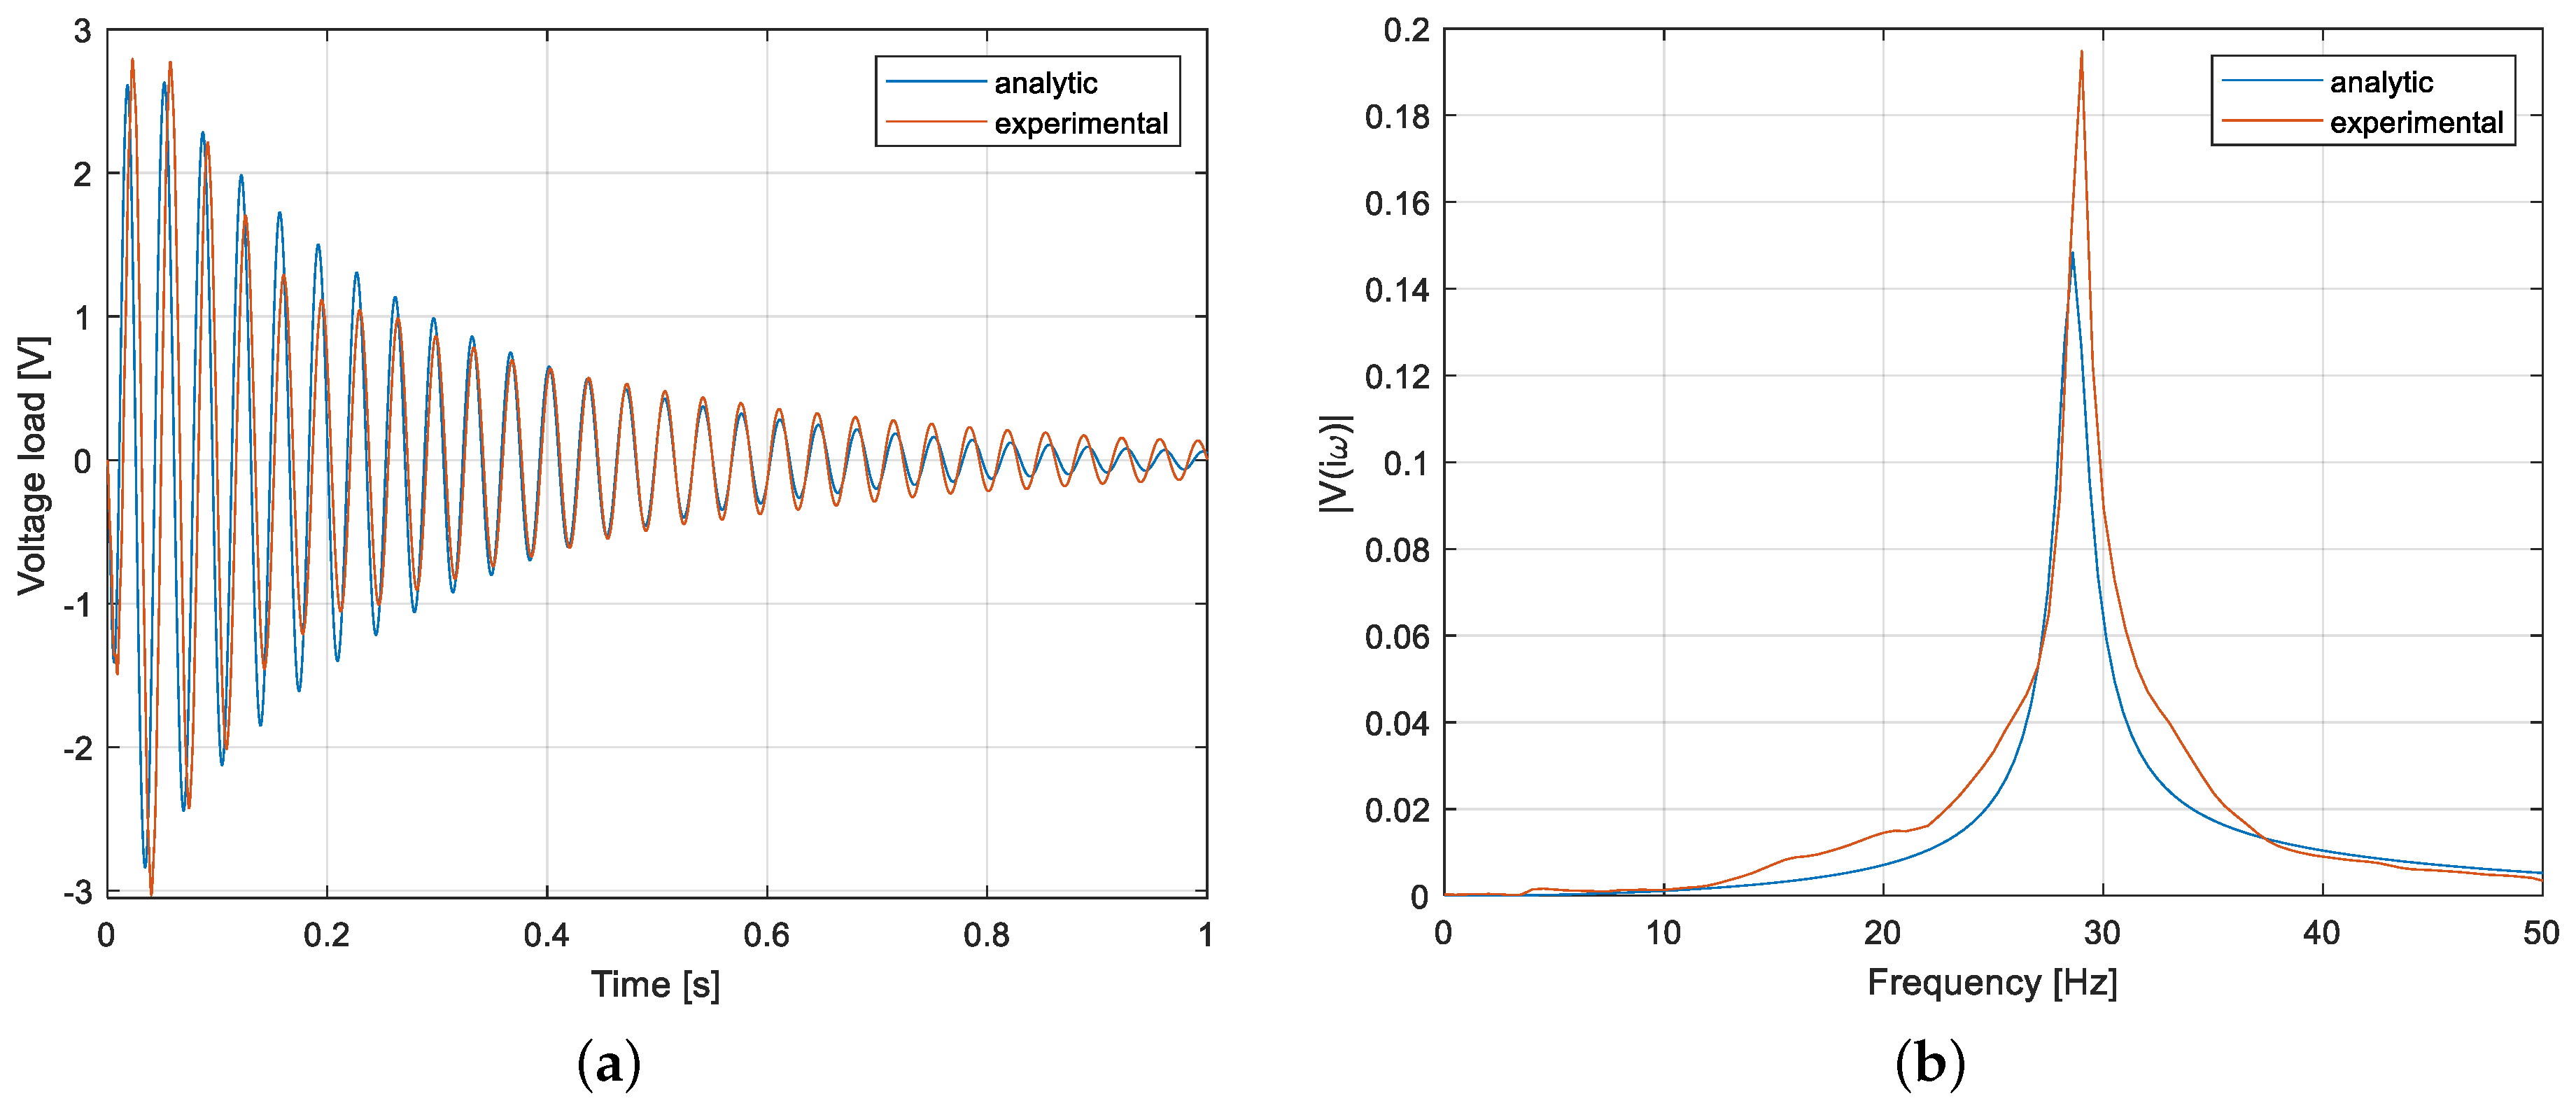
The voltage generated by the harvester excited by this force is represented with a blue line in
Figure 18. The same figure represents the measured voltage with a red line. Comparing the FFT diagrams of the two signals (
Figure 18b), it is apparent that the simulated voltage correctly matches the oscillation frequency. The time histories of the simulated and experimental voltage in
Figure 18a are very similar. In particular, the simulated voltage correctly represents both the amplitude increase with respect to the dry spoon model and the voltage waveform, i.e., the first peak is smaller than the second, as in the experimental results.
6. Discussion
The measurement of the voltage generated by the novel harvester hit by actual rain confirmed the results obtained by means of artificial rain [
21]. Outdoor tests showed a wide dispersion of results, which was related to the variable sizes of actual raindrops, to the presence of wind, to the variable impact position, and to the non-zero initial conditions related to previous impacts. These effects have already been highlighted by other researchers that dealt with cantilever harvesters without spoons [
3,
4,
18].
Video analysis has been extensively used to study the impacts of drops on liquid surfaces [
19] and there are some examples of the use of this technique in the field of raindrop harvesters [
16,
17]. In the framework of this research, video analysis proved to be a powerful tool that made quantitative measurements possible (e.g., of crater height) that were useful for the development of the mathematical model.
The proposed mathematical model allows one to simulate only one raindrop impact along the midline of the harvester, but results are in good agreement with the experimental ones, with a small error in resonance frequency (1.7%) and an acceptable error in peak-to-peak voltage (6%). It is worth noting that nowadays the impact of drops on liquid surfaces can be simulated by means of powerful computational fluid dynamics (CFD) codes. The proposed interpretative model gives approximated results, but it is much simpler than CFD codes, can be quickly integrated with existing harvester models and, hence, is useful for design purposes.
The electrical load that is included in the model is a simple resistance that in the simulations of
Section 5 represents the resistance of the acquisition module (
k
). An estimation of the energy harvested by the device can be made by assuming in the model a resistive load equal to the optimal resistance
[
12], i.e., the one that maximizes the power generated by a harvester with capacitance
and the natural frequency of the first vibrational mode
:
Under such an assumption, the collected energy is:
where the upper limit of the integral
is chosen to take into account the fact that the signal is transient and vanishes after some periods of oscillation. Making use of the parameters in
Appendix A and
Table 1, and of Equations (
32) and (
33), the energy generated by the impact on the empty spoon is 0.15
J; this value is in agreement with the values reported in the literature [
2,
31]. Conversely, the energy generated by the raindrop impacting on the filled spoon is 4.6
J. This result confirms the validity of the novel harvester design.


