
Rio Madeira HVDC System: Commissioning of the Ground Electrode for Bipole 2 at Porto Velho


1
PAIOL Engenharia, Paulinia 13140-000, Brazil
2
IE Madeira, Araraquara 14800-000, Brazil
3
Argo Energia, São Paulo 01000-000, Brazil
*
Author to whom correspondence should be addressed.
Appl. Sci. 2022, 12(7), 3279; https://0-doi-org.brum.beds.ac.uk/10.3390/app12073279
Submission received: 6 November 2021
/
Revised: 13 January 2022
/
Accepted: 20 January 2022
/
Published: 23 March 2022
(This article belongs to the Special Issue DC Grids: Recent Advances and Future Trends)
Abstract
:Featured Application
Commissioning of an HVDC ground electrode.
Abstract
The original ground electrode of the Madeira River HVDC transmission system, bipole 2, was discarded due to the risk of saturation of the transformers in the Converter Substation of Porto Velho, located 15 km away, during the monopolar operation with ground return. After an extensive geophysical survey, a new site was selected, 40 km from the converter substation. For the confirmation of the new site, it was built in the central area of the site, a single-well 47 m deep test electrode, interconnected to the original 15 km electrode line by an additional 40 km long temporary line. A new electrode was then designed. This paper summarizes the test electrode procedure and the activities developed for the new electrode commissioning after its construction, which can be divided into two phases–pre-commissioning and commissioning. The electrode pre-commissioning was performed before its energization for the evaluation of the integrity of its components. The commissioning tests started with electrode energization, employing the electrode line, and an unbalanced bipole operation, which allowed the evaluation of its electrical performance. However, the main objective of the paper is the evaluation of the electrode resistance, which is an essential HVDC electrode parameter.
1. Introduction
The IEC [1], Cigre [2], and EPRI [3] guidelines are the main references for the complete cycle of HVDC ground electrode design, including the pre-design activity of site selection and the post-construction commissioning procedures.
An HVDC transmission system comprises two converter substations, interconnected by the HVDC line, each one requiring a separate grounding electrode for its DC switchyard, which usually is located from 15 km to 100 km away and connected through the electrode line.
The electrodes usually conduct the unbalanced current of the bipole, about 20 A to 40 A, into the ground. In case of the loss of one pole of the HVDC line, the energy can be transmitted by the remaining pole with ground return, using grounding electrodes for the injection into the ground currents that may reach almost 4 kA. Therefore, the ground electrodes add reliability to the energy transmission system.
HVDC electrodes are wide-area grounding systems, designed with cathodic protection technology. They can be considered the most complex of grounding systems, because they are the only kind of grounding that is not built at the place of the grounded installation, requiring a search for the best electrode site. The site selection requires thorough research, based on geographical, geological, and geophysical surveys, to find the site that will allow for the best electrode performance.
The site selection surveys shall be carried out within a radius of some tens of kilometers around the converter substations at the two ends of the HVDC line. The best site at each end is the one with the geoelectric structure that presents the lowest resistivities from the soil surface down to at least mid-crust [4,5,6].
HVDC electrodes are wide-area groundings and the high DC currents travel deep into the ground, comprising a wide interference area. The higher the ground resistivity, the deeper the currents will penetrate the ground and the wider the interference area will be. Therefore, the design of an HVDC ground electrode requires the construction of a deep geoelectric model, which, in the case of a high-resistivity subsurface, will comprise half Earth’s crust. Freire et al. [7] shows that a cratonic structure may require a geoelectric model down to 20 km depth to allow for the calculation of the electrode resistance within a 5% misfit.
Therefore, the development of a 1D geoelectric model of the Earth’s upper crust, as viewed on average from a specific area at the ground surface, about one square kilometer wide, is a basic requirement for the site selection and design of an HVDC electrode. The geoelectric model for this application has specific requirements; it should be detailed within the shallow ground layers, where the electrode is buried, and should be deep, down to mid-crust, to allow for the calculation of the electrode electrical performance.
For the construction of the geoelectric model, a comprehensive geophysical survey shall be conducted, with different techniques for probing the shallow and deep crust layers. The processing of different geophysical datasets to construct a geoelectric model that is valid from the soil surface down to a few kilometers deep is a complex task and not usually within typical geophysical procedures [8,9].
This paper summarizes the test electrode procedure applied for the confirmation of the new site selected for the Rio Madeira HVDC electrode, bipole 2, at Porto Velho, as well the results of the pre-commissioning and commissioning measurements.
As defined by CIGRÉ [2], “Commissioning covers all measures which need to be taken, to assure the correct functioning of both single components of the equipment and the station as a whole”. Electrode commissioning is important for everyone involved in the project:
- The electrode designer needs to ensure for himself, his company, and the customer, that the project has met all expectations;
- The construction contractor shall prove that the system was implanted according to the design;
- The authorities shall register the measured performance of the electrode as part of the approval and/or operation license.
Electrode resistance is an essential performance parameter that is successively calculated during the design process, as more geophysical data are acquired, but is only well-defined after the processing of the commissioning data [5,6,7,8]. The main objective of the paper is the presentation of the methodology for the evaluation of the electrode resistance. The development of this methodology became to be a very complex task because it was not possible to apply the traditional fall-of-potential method for the measurement of the electrode resistance, as recommended by the HVDC guides [1,2,3].
The following reasons limited the use of the fall-of-potential method: the size of the HVDC ground electrode, with 80 wells 67 m deep along a 5 km perimeter; the high-resistivity cratonic environment of the Porto Velho region, which is associated with a very large interference area; and the DC currents, which travel deep into the ground, enhancing the interference area. It is not viable to establish a 40 km long potential line in the search for grounding resistance.
2. The Rio Madeira HVDC Electrode, Bipole 2, at Porto Velho
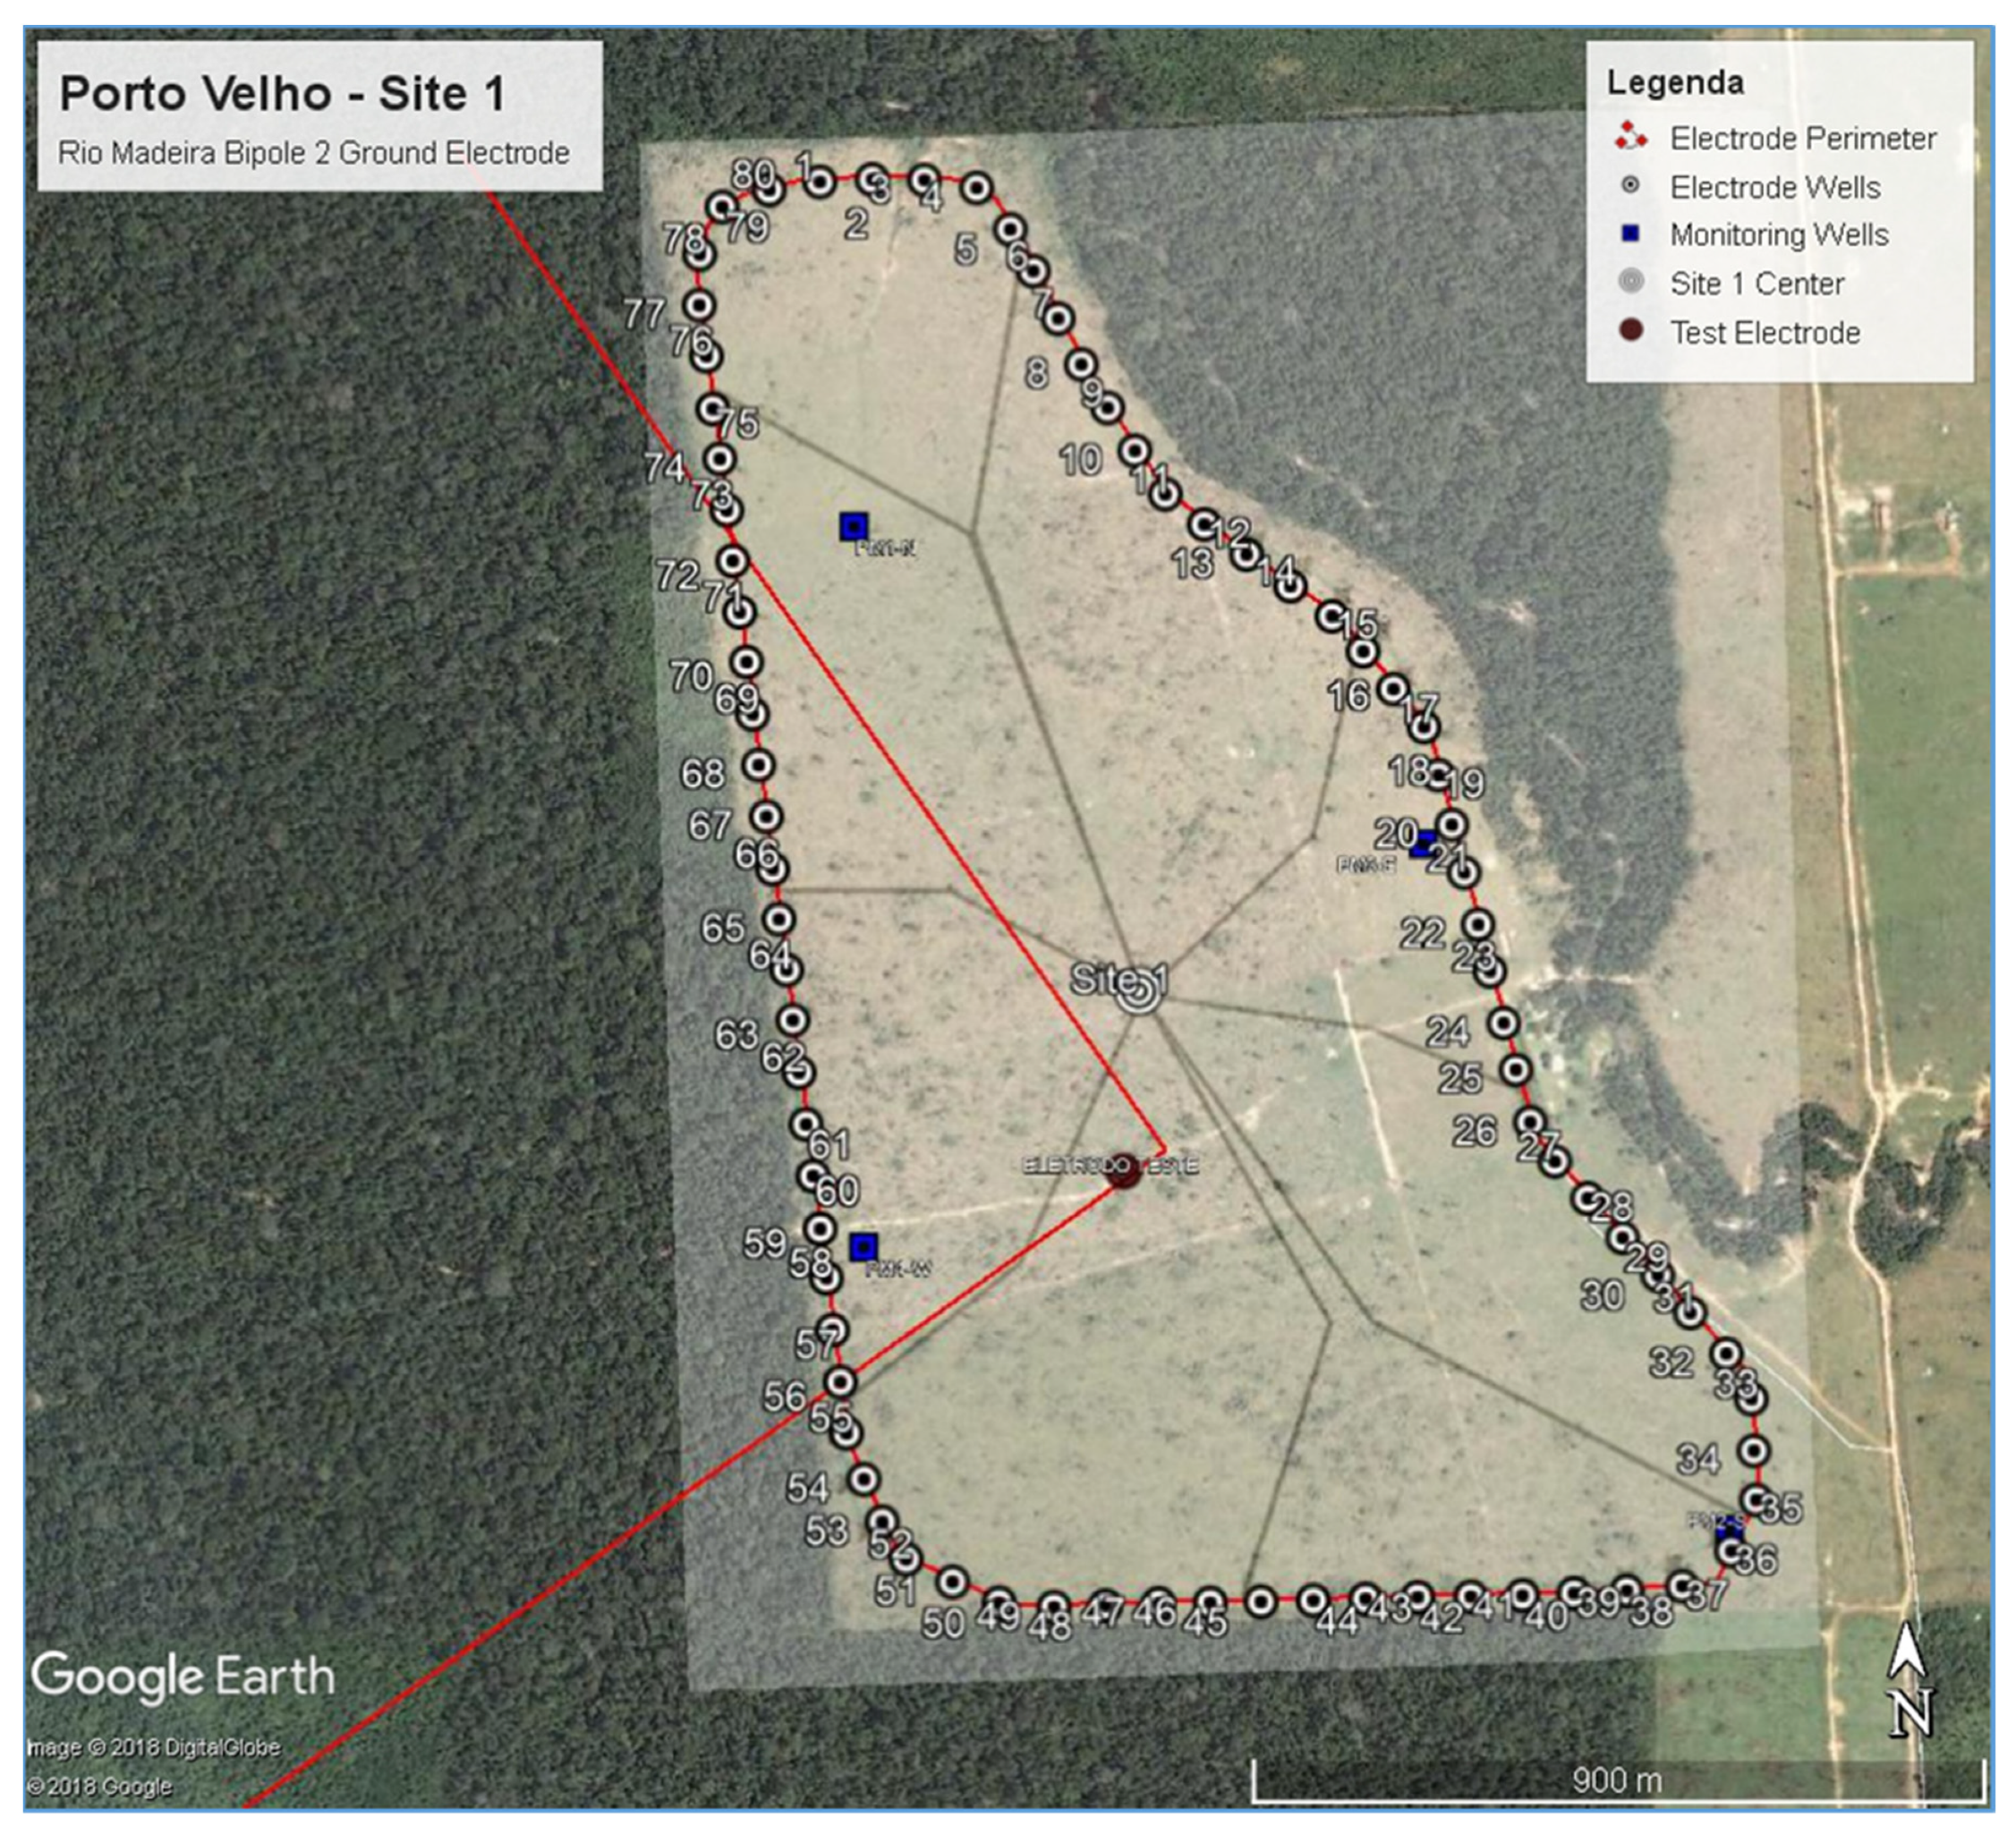
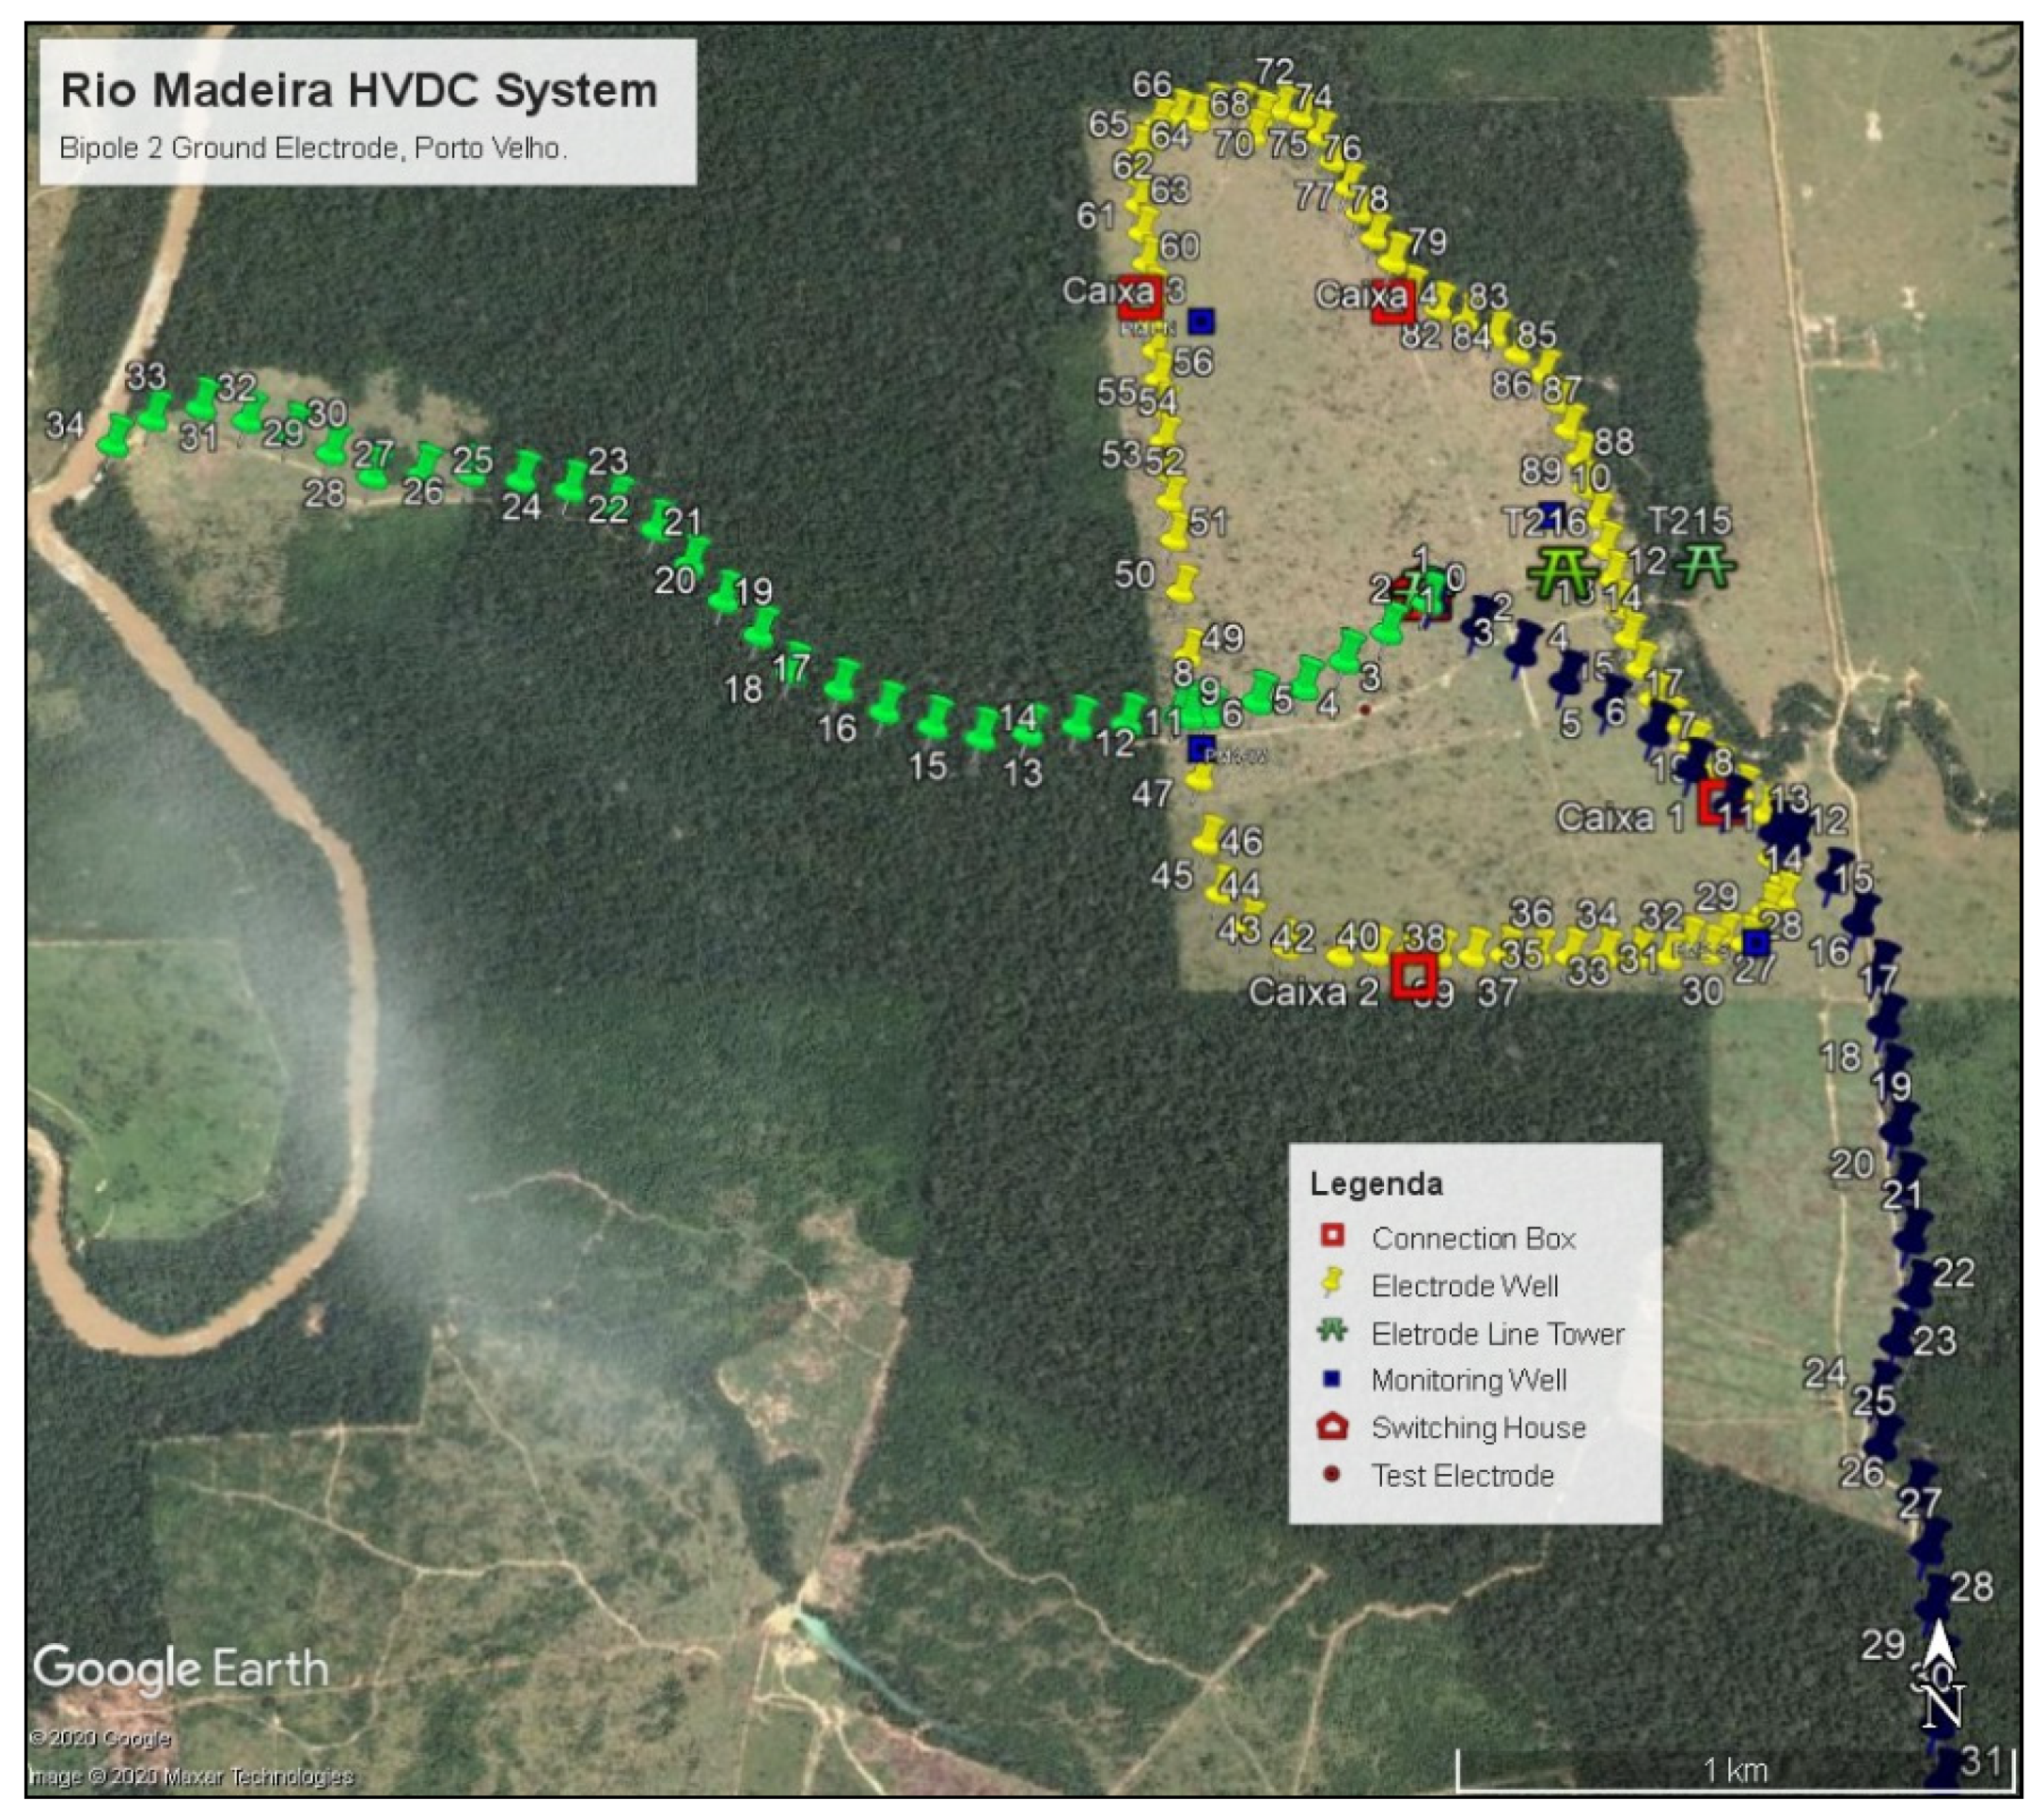
Figure 1 presents the top view of the ground electrode, which is a vertical type, with 80 sub-electrodes, consisting of wells distributed along a 5 km asymmetric perimeter. The electrode is divided into 8 sections, each one with 10 wells, which are connected to a central switching house by 8 section feeders.
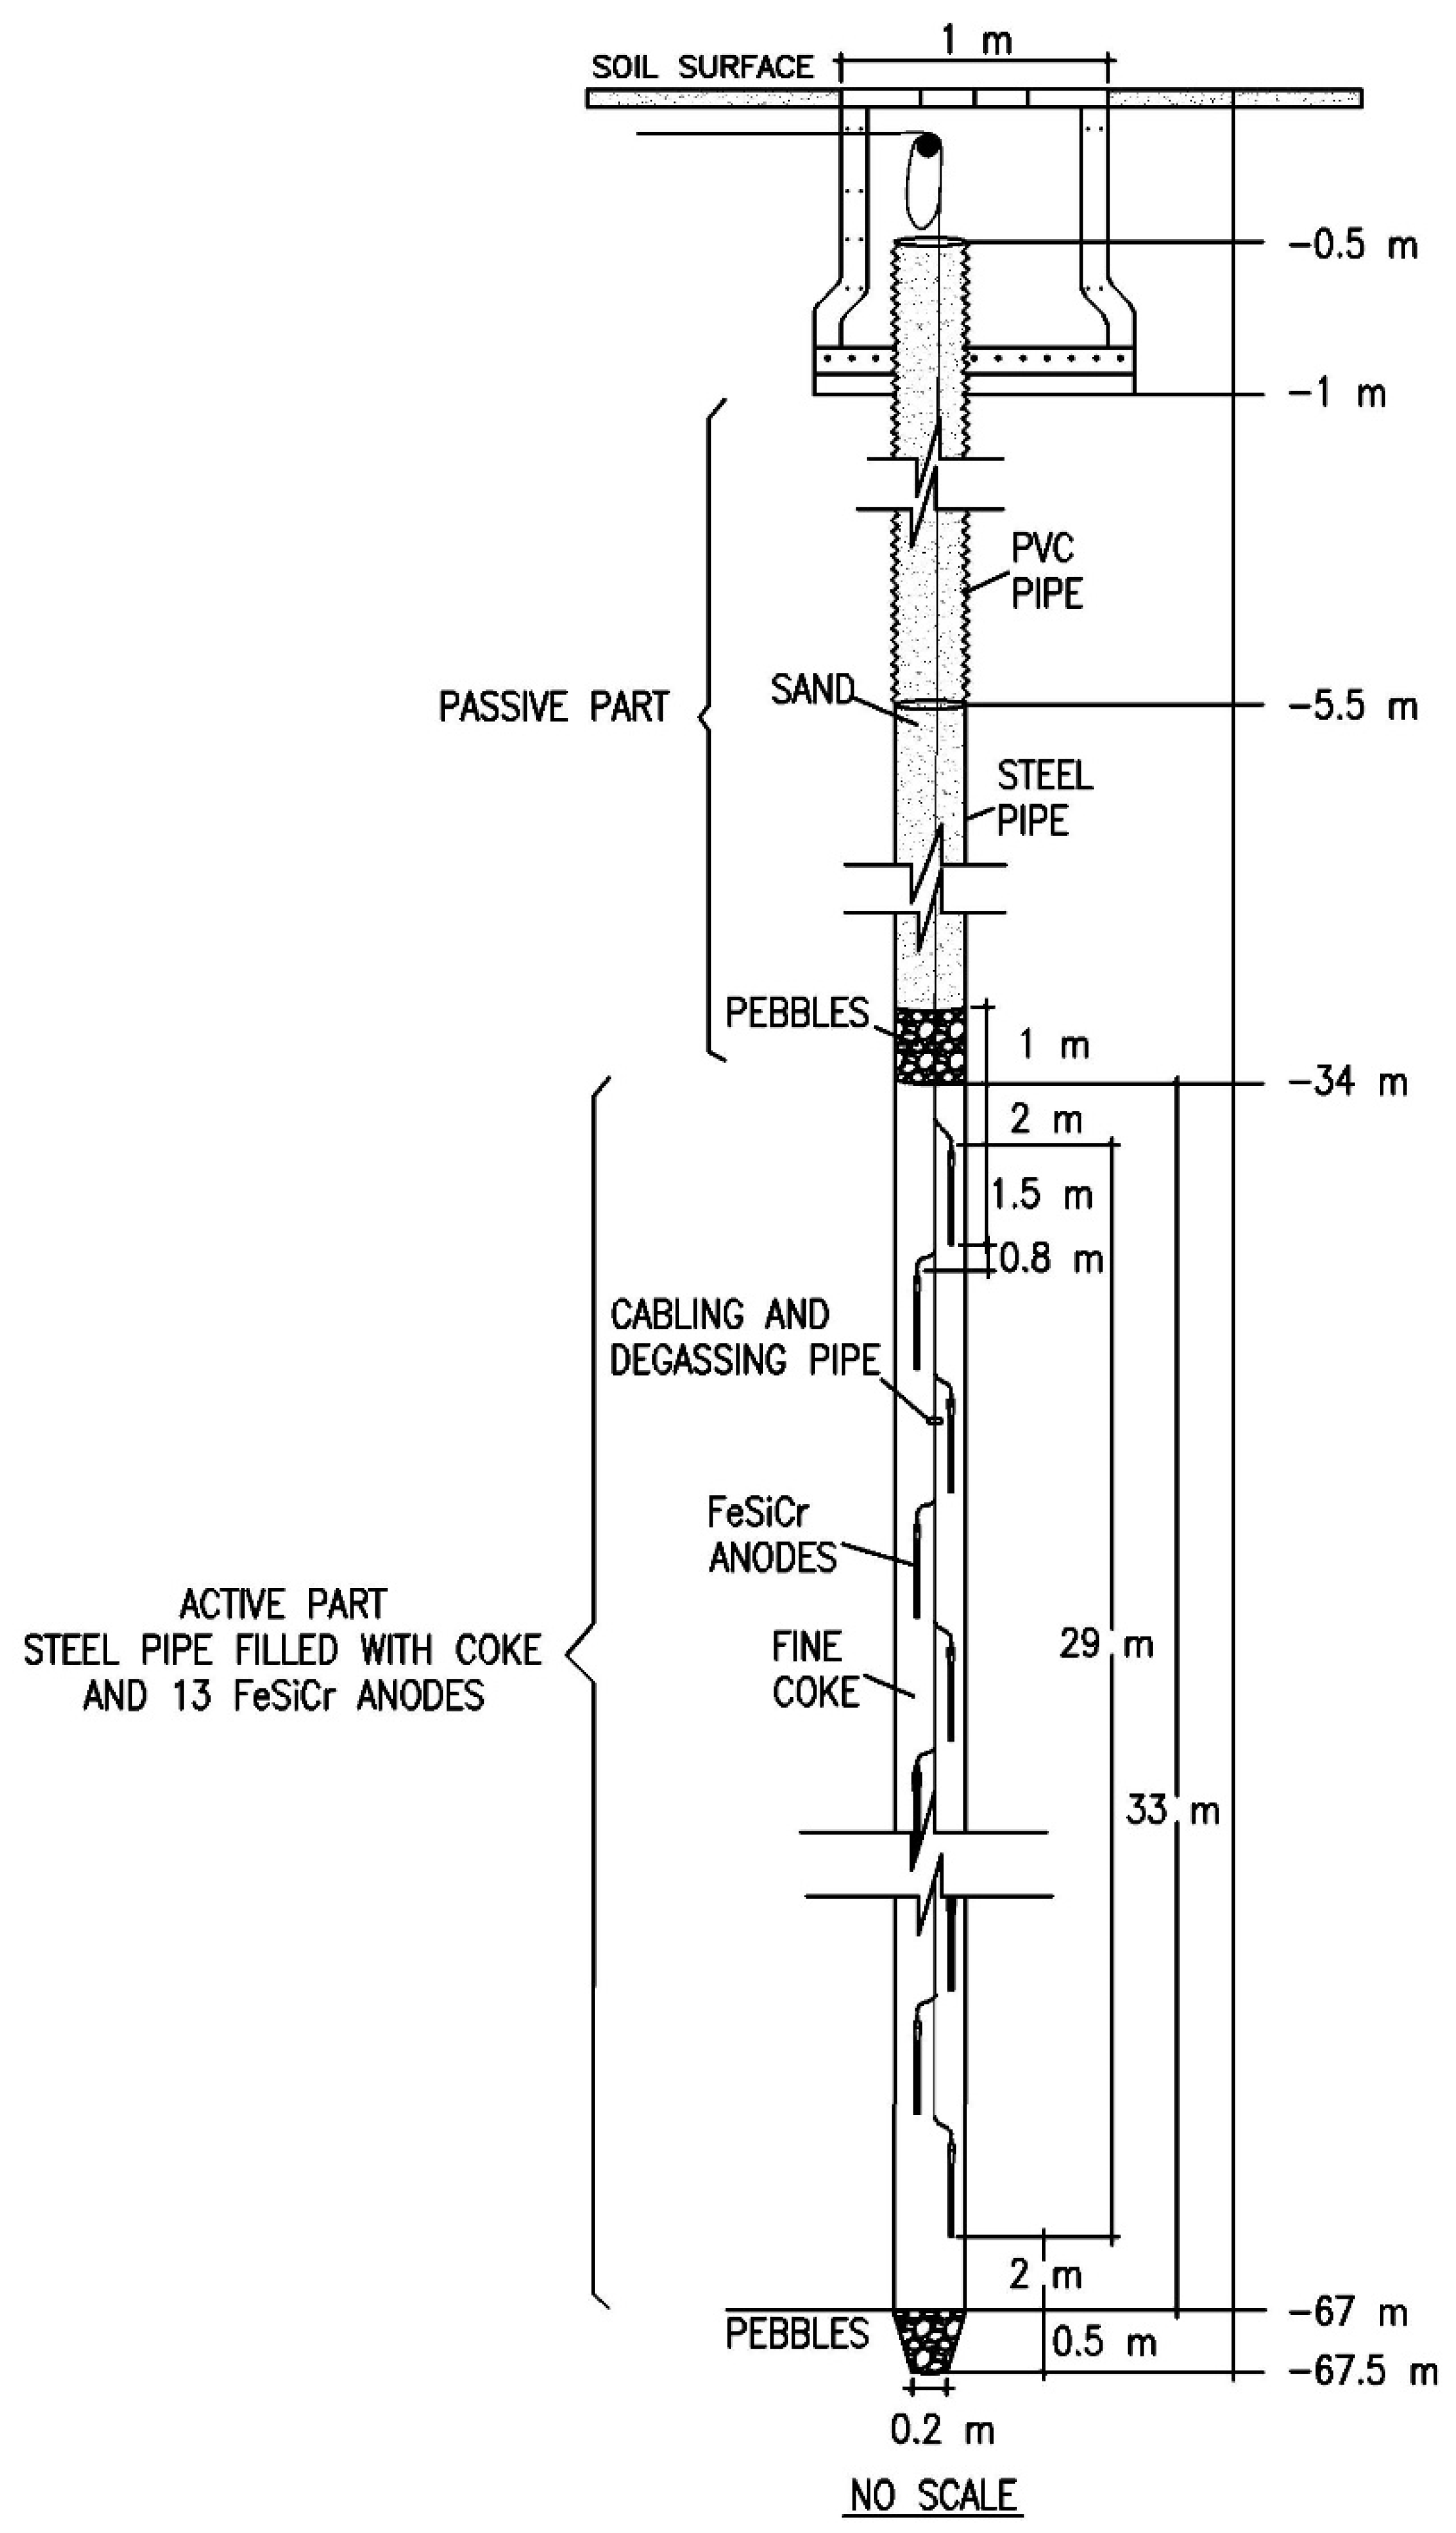
A 32 m deep high-resistivity ground layer required the design of the sub-electrodes with an active part between 32 m and 67 m, as illustrated in Figure 2. The first 6 m of each well is of corrugated plastic pipe, and from 6 m to 67 m depth it has a casing of 13” steel pipes. Each active part of the sub-electrodes is filled with an array of 13 FeSiCr anodes (51 × 1524 mm, 20 kg, 0.25 m2), inside a special fine carbon coke backfill.
The following operational conditions apply for this electrode:
- Bipolar-continuous operation of the electrodes with a maximum unbalance of 40 A;
- Monopolar with ground return of 2625 A × 220 h per year (2.5% of the time);
- Short-time overload current of 1.63 × 2625 A = 4279 A for 1.5 s;
- Long-time overload current of 1.42 × 2625 A = 3727.5 A for 30 min;
- Monopolar with ground return in overload of 3490 A × 5 h (300 min/year).
The following conditions were established for the electrode design:
- Electrode useful life of 35 years, with resistance limited to 0.35 Ω;
- Eight independent sections and ability to work without one section;
- All active parts inside the water-saturated ground layer;
- Utilization of 13” steel pipes for all the well extension, except for the first 5 m on the top;
- Iron rods spaced no more than 2 m, to allow for a uniform current distribution at the coke-ground interface (requirement from Cigré [2]);
- Wells at least 30 m distance from the site perimetric fence and low-lying areas, such as ditches or ponds (environmental rule);
- Current density in the coke-soil interface limited to 1 A/m2 for the nominal monopolar operation.
Regarding superficial current density, the two main references on HVDC ground electrode design present the following recommendations:
- Cigré [2] clause 5.1.3.5 states “A maximum average current density in the range of 0.5 A/m2 to 1 A/m2 is recommended for land electrodes to avoid electro-osmosis”;
- IEC [1] clause 5.1.6 states “For earth electrodes that run in the bipolar mode for long periods or are in soil with high water content, an average current density of 2 A/m2 or higher may be the permissible value for the rated current of one pole”.
3. The Test Electrode
The use of a test electrode is recommended by item 4.4.2 of the Cigré guide [2], as an aid for the confirmation of the electrode site and a preliminary evaluation of the site geoelectric structure.
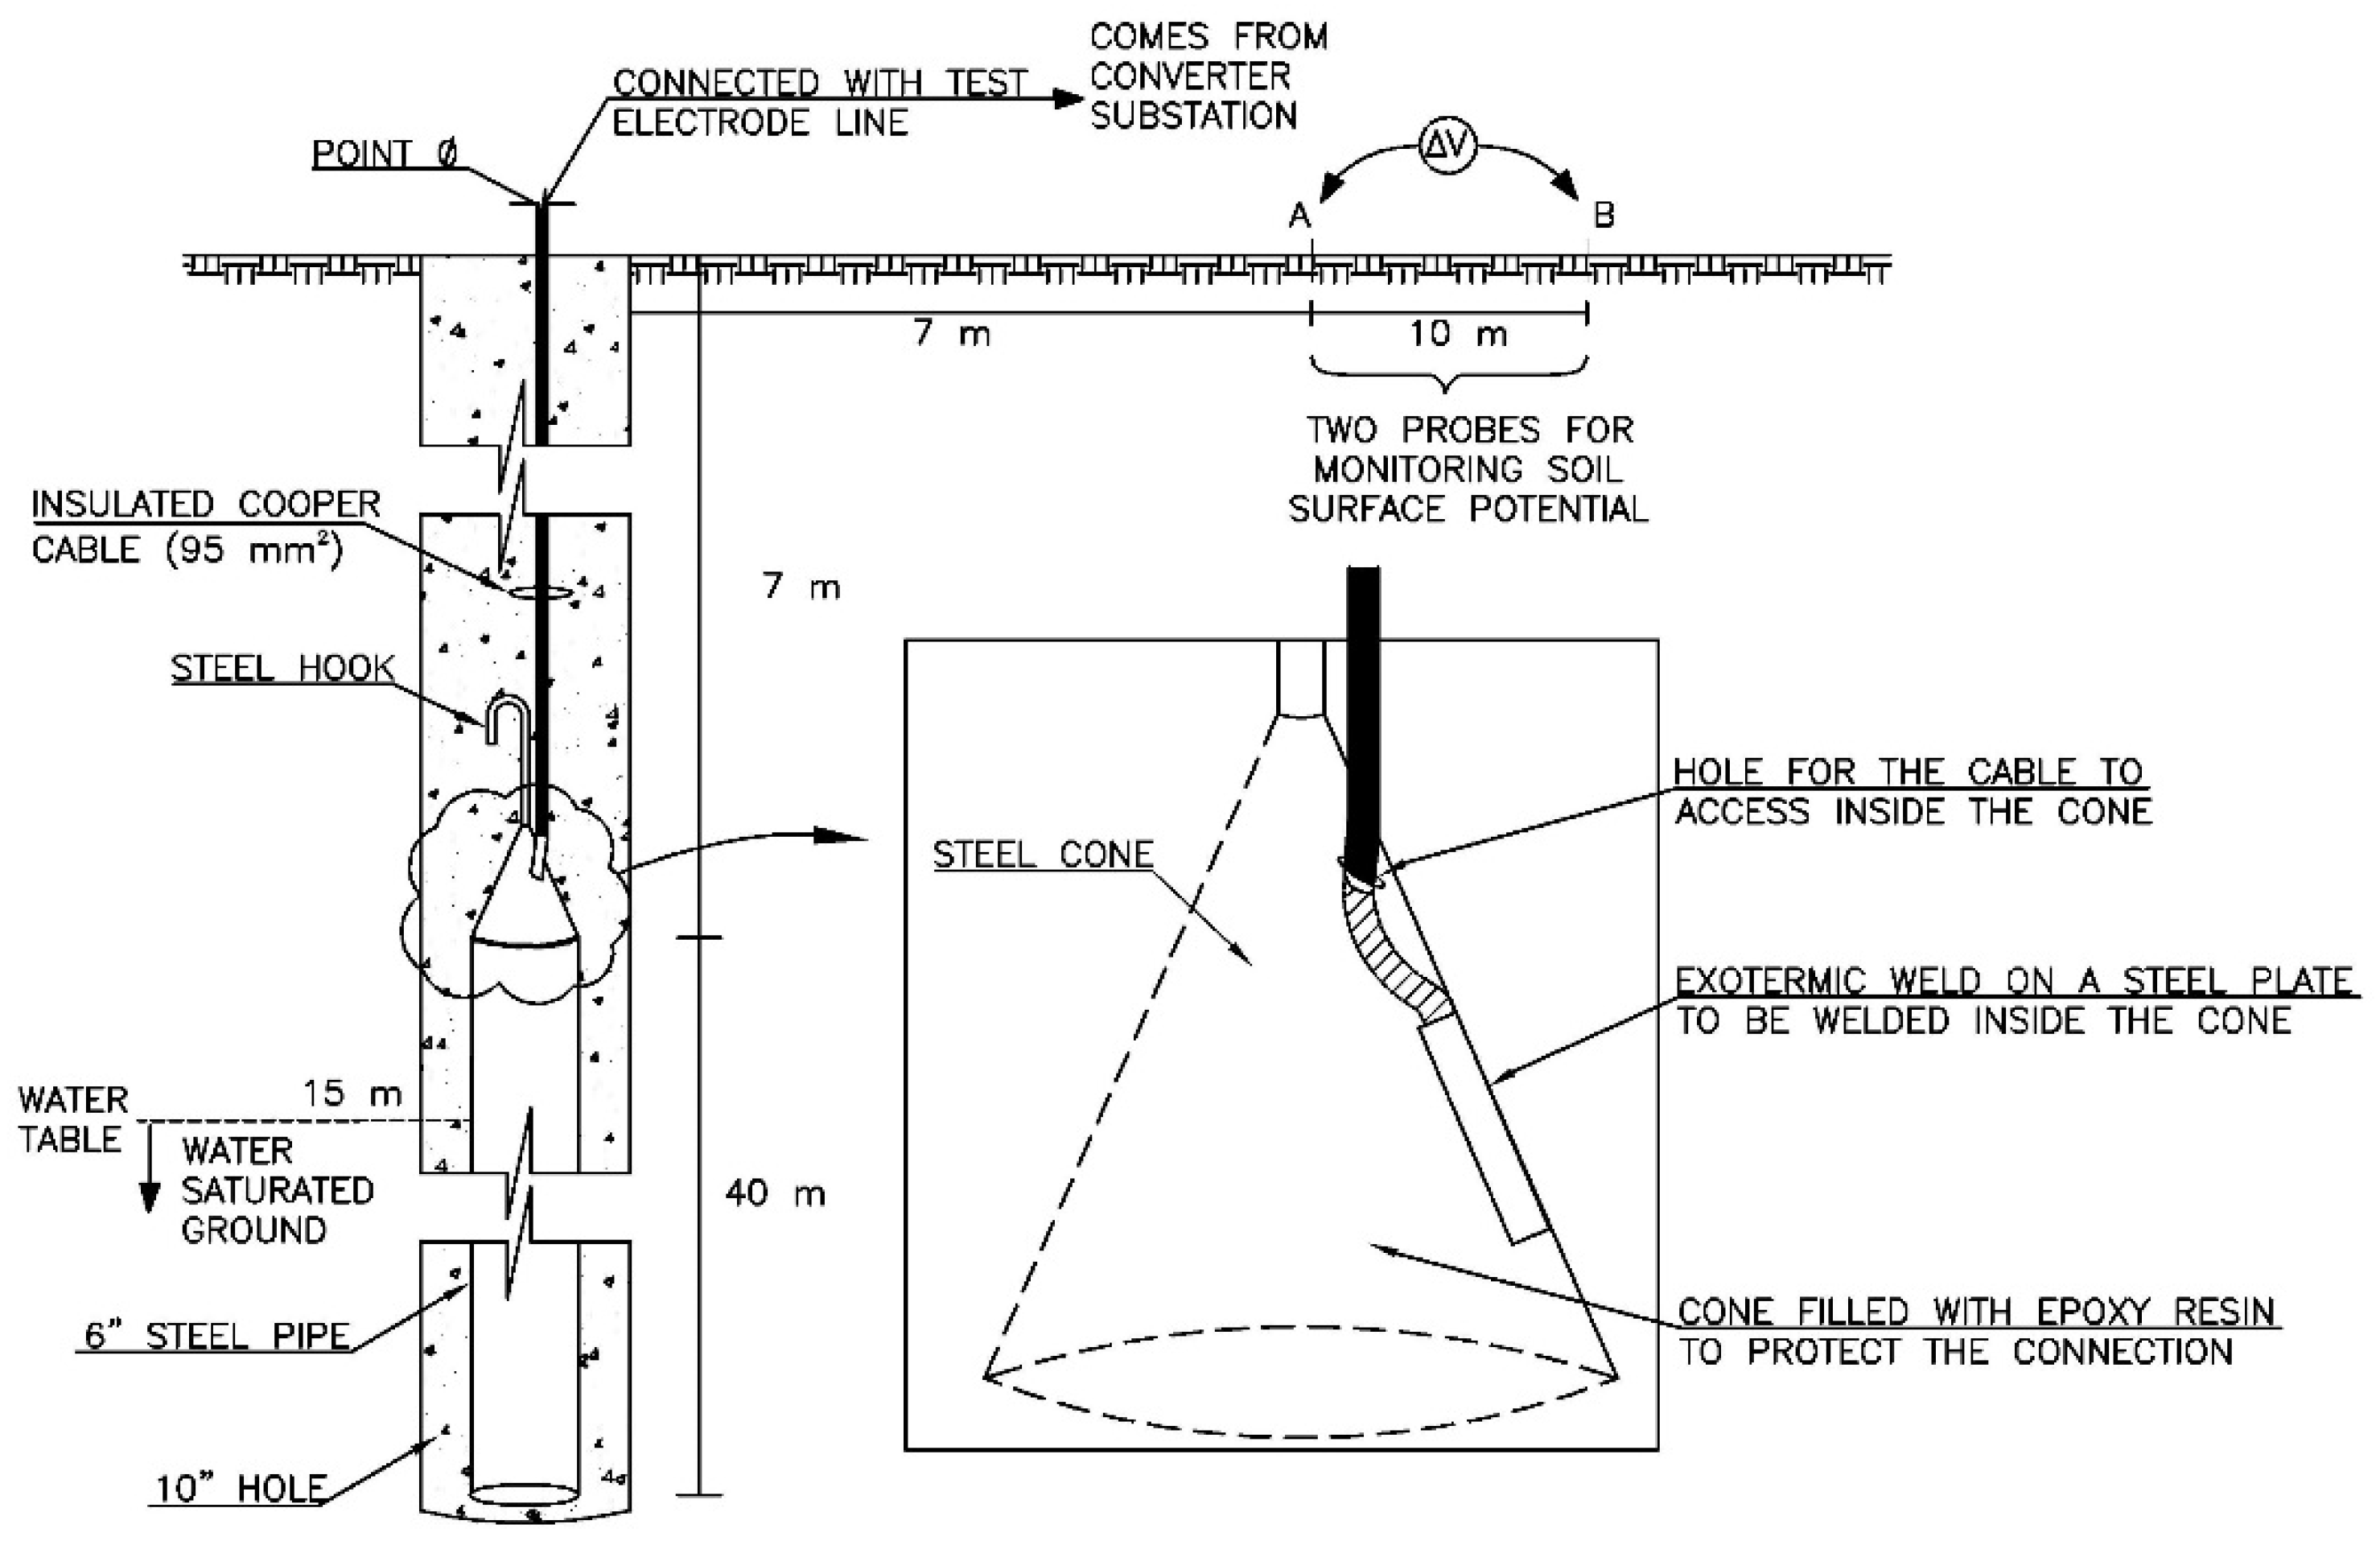
For the test electrode at Porto Velho, a 40 m long and 6” diameter steel pipe was inserted into the ground in the southern part of the electrode, with its top buried 7 m below the soil surface (Figure 3). The location of the test electrode inside the water-saturated ground was an important requirement, to allow for a low-resistance electrode (see location in Figure 1). Therefore, the location of the test electrode was selected in a lower part of the area, where a shallower water level was expected. In fact, at the test electrode location, the water table was only 15 m deep, which means that almost 80% of the test electrode was in the water-saturated ground. The depth of the electrode was limited by a plastic clay layer, which collapsed into the bottom of the well, trapping the electrode end and not allowing it to move either downward or upward.
The unbalanced bipolar operation of bipole 2 allowed for the injection of 246 A in the test electrode, employing a 40 km temporary extension of the original electrode line. From the measured data, the calculated test electrode resistance was 0.95 Ω.
The measured DC current in the 500 kV transformer neutrals at the converter substation was referred to the maximum overload current of 3728 A, totaling 47 A. This total current divided by the 14 grounded neutrals resulted in an average of 3.4 A. This average current is about 10% of the maximum DC neutral current allowed by the transformers’ protection; therefore, no risk of transformer saturation could be expected, demonstrating that the electrode site was well selected.
4. Electrode Pre-Commissioning
The test electrode was used as a central return electrode for injecting a DC current in the switching house busbar. The DC source was a three-phase 220 V/170 kVA diesel generator connected to a three-phase rectifier bridge with a rated capacity of 650 V/300 A. The electrical connections were made with 50 mm2 insulated flexible cables. With this setup, it was possible to inject 116 A into the electrode.
This test allowed for the verification of the integrity of the electrode cabling and revealed an uneven current distribution between sections, wells, and anodes. This uneven current distribution was attributed not only to the asymmetric electrode perimeter and non-centered location of the test electrode, but also to the anisotropy of the ground subsurface, which has a clear 3D structure (not layered, as it is usually considered for the geoelectric models in grounding design).
It should be highlighted that the test electrode was not used for the measurement of the electrode resistance.
5. Electrode Commissioning
A 37 km long extension to the original 21 km electrode line was built for connecting the new electrode to the converter substation. The energization of the new electrode was performed in steps of the nominal current—10%, 20%, 30%, 40%, 50%, and 90%. The following measurements were then collected:
- At the converter substation: DC currents in the neutrals of the 500 kV transformers and the potential difference between the substation grounding grid and the DC neutral bar (connected to the electrode line);
- At the electrode site: step potentials close to the wells’ perimeters, and touch potentials on metallic structures (towers of the electrode line and fences at the switching house and the site perimeter);
- Outside the electrode site: touch potentials on metallic fences, DC currents in the neutrals of distribution transformers, and soil surface potential profiles (in two directions, West and South).
For each measurement type, a spreadsheet was filled out, with general information (date, weather data etc.), specific data (electrode current during the measurement), and the required data: time and location of the measuring point (UTM coordinates) and measured parameter.
At the converter substation, the highest measured neutral current was on one of the bipole 1 converter transformers, with 7.8 A (extrapolated to the nominal current). ABB, the manufacturer of this transformer, reported that the pickup DC current of the saturation protection at the neutral of its transformers is set to 32.5 A. The maximum neutral currents for the bipole 2 transformers are also of this order of magnitude; therefore, the measured neutral currents were significantly lower than the allowed maximum values, indicating a good safety margin and no risk of saturation of the converter transformers.
The next items describe the main findings of the commissioning test. All the parameters here presented were referenced to the electrode nominal current of 2625 A.
5.1. Current Distribution between Sections
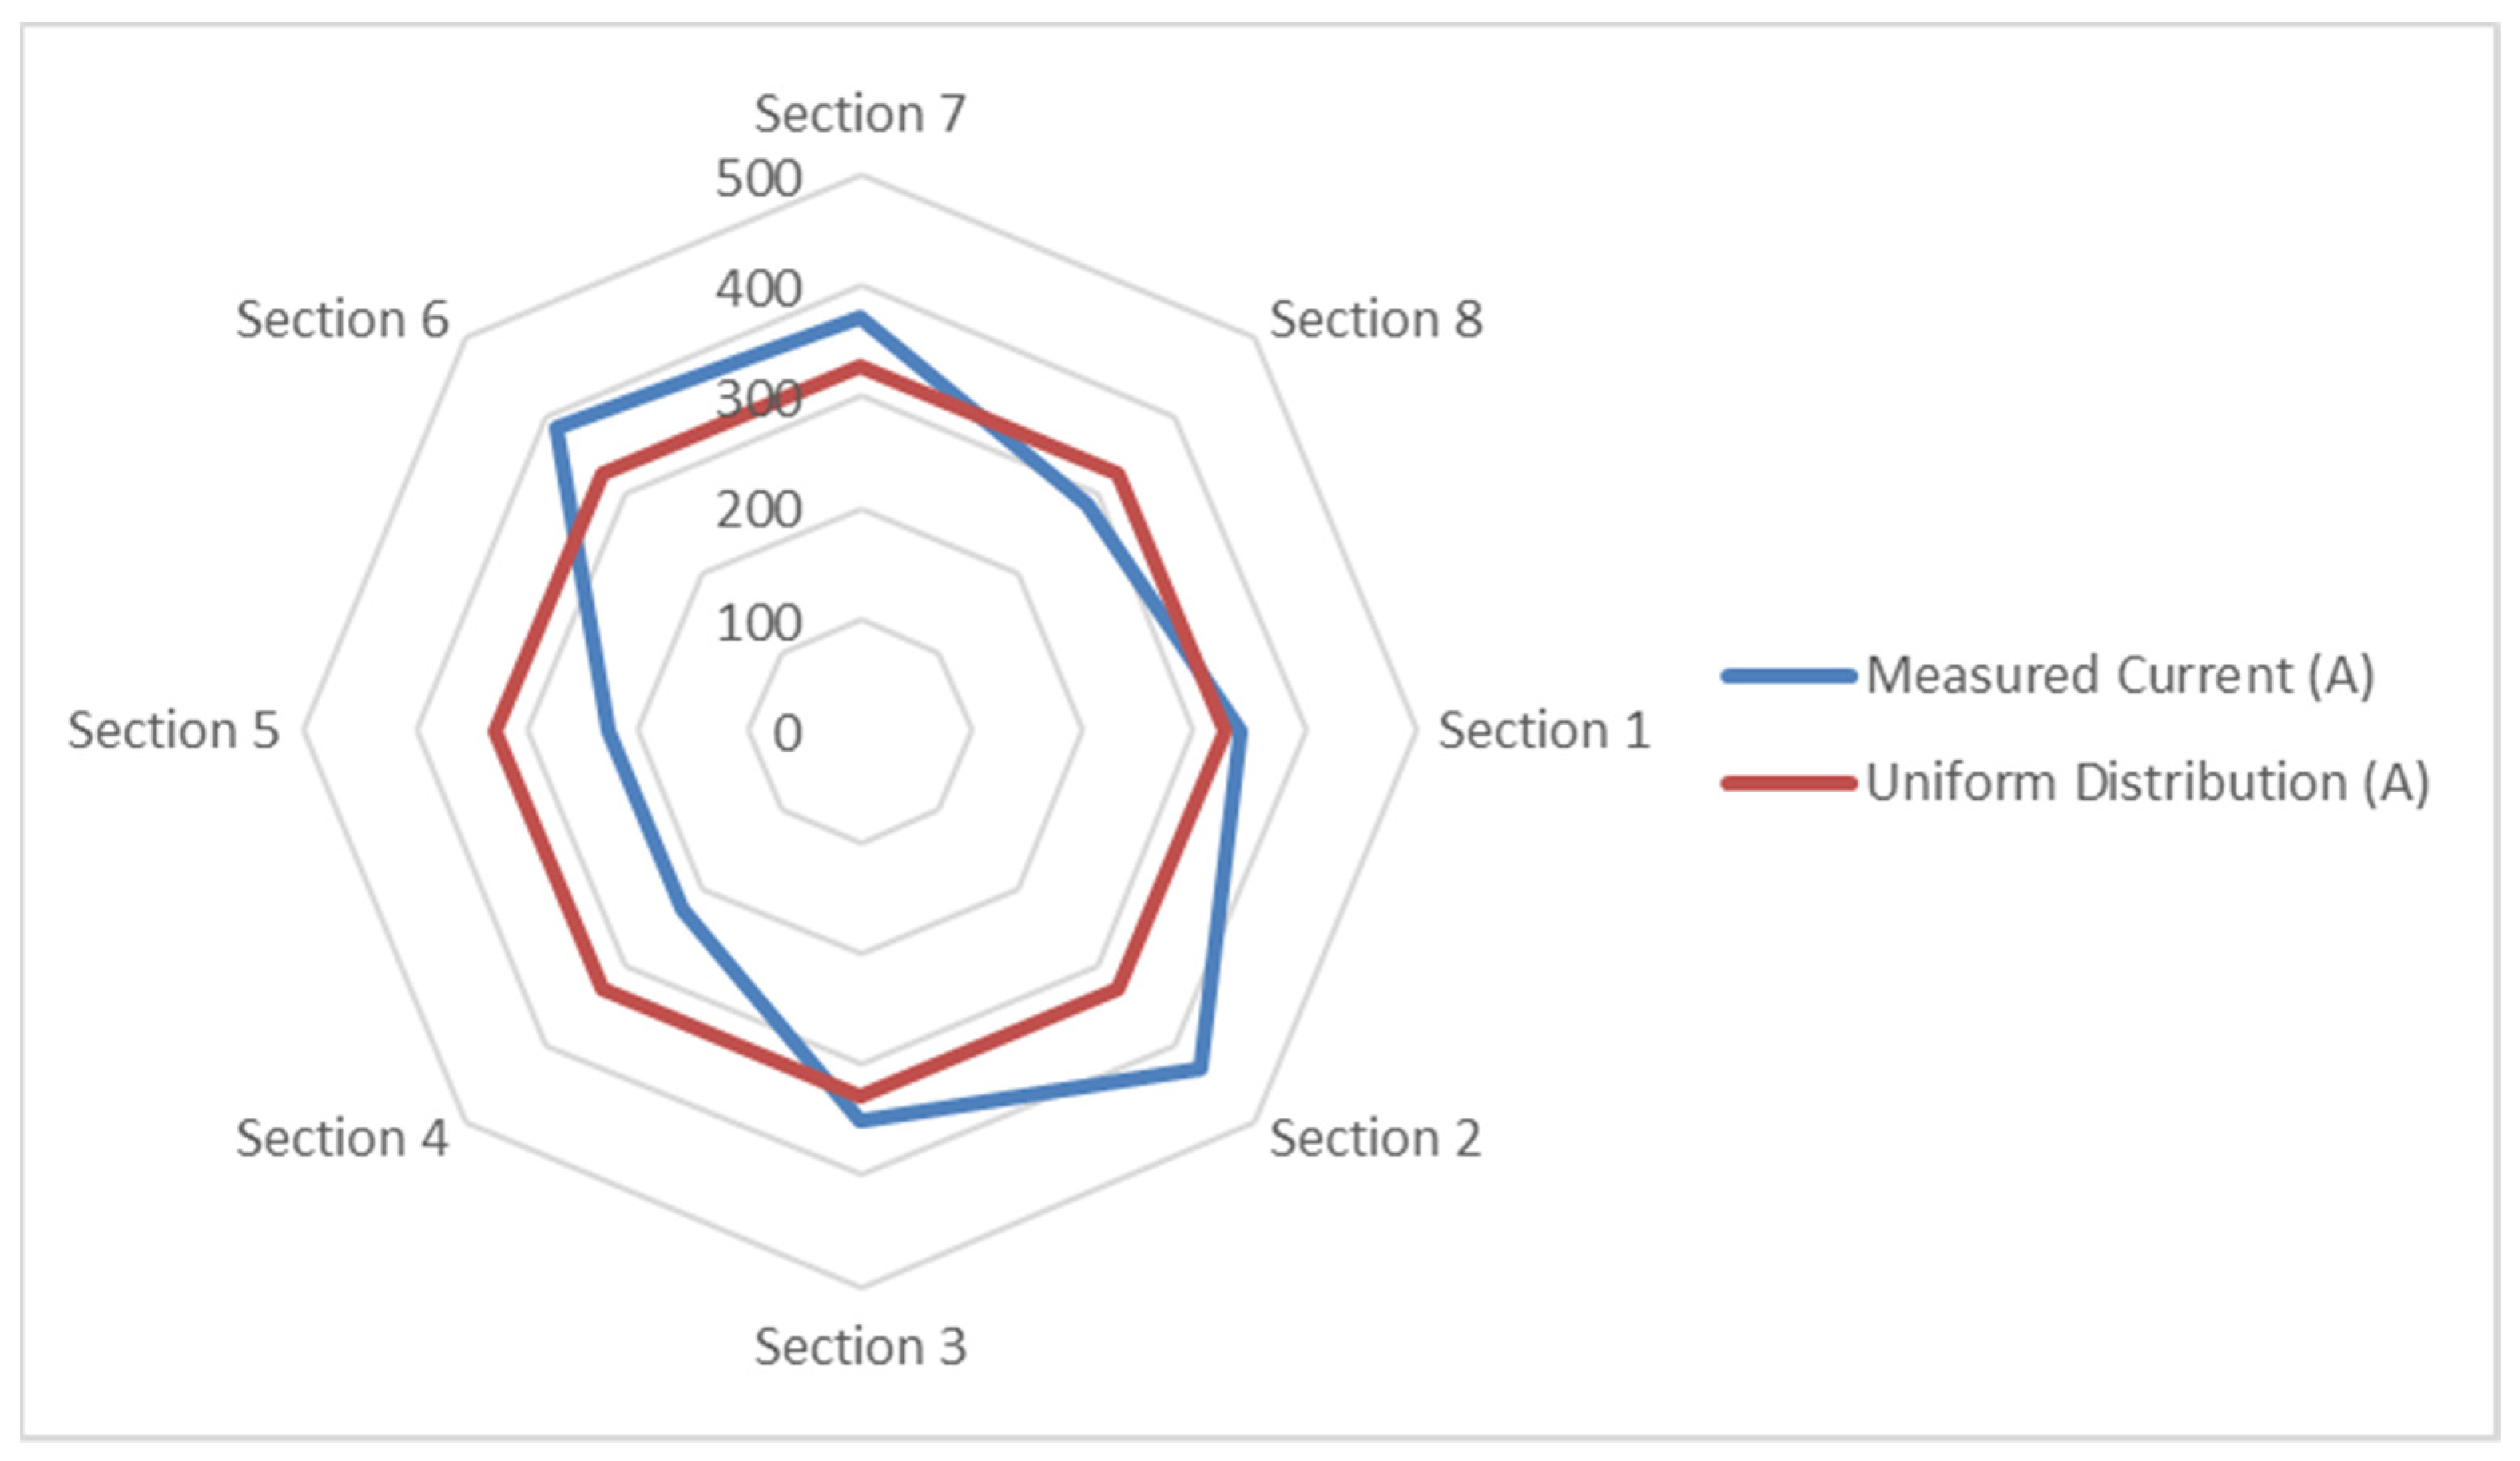
Figure 4 presents the current distribution between the feeders of the eight sections. Only Section 2 exceeded 400 A; no feeder exceeded 500 A, which was the established allowance of 50% above the calculated average feeder current (328 A). This test showed a better current distribution between the sections, as compared with the previous pre-commissioning test, because the latter was affected by the non-centered test electrode location relative to the electrode perimeter.
Unfortunately, the good current distribution between the sections was not replicated for the wells, which shows a wide current distribution. This can be attributed to the regional tectonic setting, with the sedimentary cover above the rocky subsurface formed by meandering streams, which varied its path in the area over thousands of years, forming a complex subsurface with pockets and lenses of varying resistivities.
The step potentials close to the wells’ perimeter and the touch potentials on metallic structures within the electrode site showed exceptionally low values compared to the tolerable limits established by the IEC and Cigré guides [1,2]. This last finding can be attributed to the combination of a dry ground layer at about 33 m depth and the top of the metallic pipe starting 5.5 m below the soil surface.
5.2. Electrode Resistance
At the converter substation, the transient fault recorder registered 3067 V as the average potential of the neutral DC bar to the grounding grid during the commissioning tests. The electrode line has two conductors, AAC 2282.8 MCM, in parallel with a total length of 58 km, resulting in an equivalent resistance of 0.0125 Ω/km (coefficient of variation of resistance with a temperature equal to 0.004). Considering 45 °C as the cable temperature (10 °C above the ambient temperature on the day of the test), the final resistance of the electrode line (REL) was so calculated:
- REL = 58 × [0.0125 × (1 + 0.004 × 25)] = 0.80 Ω.
The total resistance of the electrode line plus the electrode can be thus calculated:
- Rtotal = Vdn/Ielec. = 1.17 Ω.
Discounting the electrode line resistance, the first approach electrode resistance (RE) was calculated:
- RE = Rtotal − REL = 1.17 − 0.80 = 0.37 Ω.
The above-calculated resistance is considered the first approach because of the premise that the DC potential of the grounding grid of the converter substation is equal to zero. However, this is not true, because it was measured as a total of 47 ADC going up in the neutrals of the Y-connected windings of the 500 kV converter transformers, demonstrating that a resistive coupling does exist between the grounding grid of the converter substation and the electrode, despite the 40 km distance in a straight line.
Arruda et al. [10] presents the results of the tests conducted by Eletrobras/IE Madeira (partners of this HVDC project) with the first electrode built, which was only 15 km away from the converter substation. The tests included the measurement of the currents in the neutrals of the converter transformers (329 A) and the net currents in the ground wires of the transmission lines leaving the substation (282 A). The authors calculated the potential induced by the original electrode on the converter substation grounding grid to be 400 V, considering the overload current injection in the electrode. Referring to the nominal electrode current, this ground potential reduces to 300 V.
The ratio between the total measured DC currents in the converter transformer neutrals for the old and new electrodes was 329/47 = 7. Applying this same ratio for inferring the net current leaving the converter substation grounding grid by the ground wires, it can be expected that for the new electrode at nominal current, the DC ground-wire current will be 282/7 = 40 A. Applying to the ground potentials this same factor of 7, the potential of the converter substation grounding grid was inferred to be about 43 V for the nominal electrode current.
This is an approximation; such linearity cannot be expected because the two electrodes have different locations with similar but different geoelectric structures. Considering that the new site has a better subsurface geoelectric structure, it is probable that the induced potential at the converter substation will be a bit lower than the inferred value.
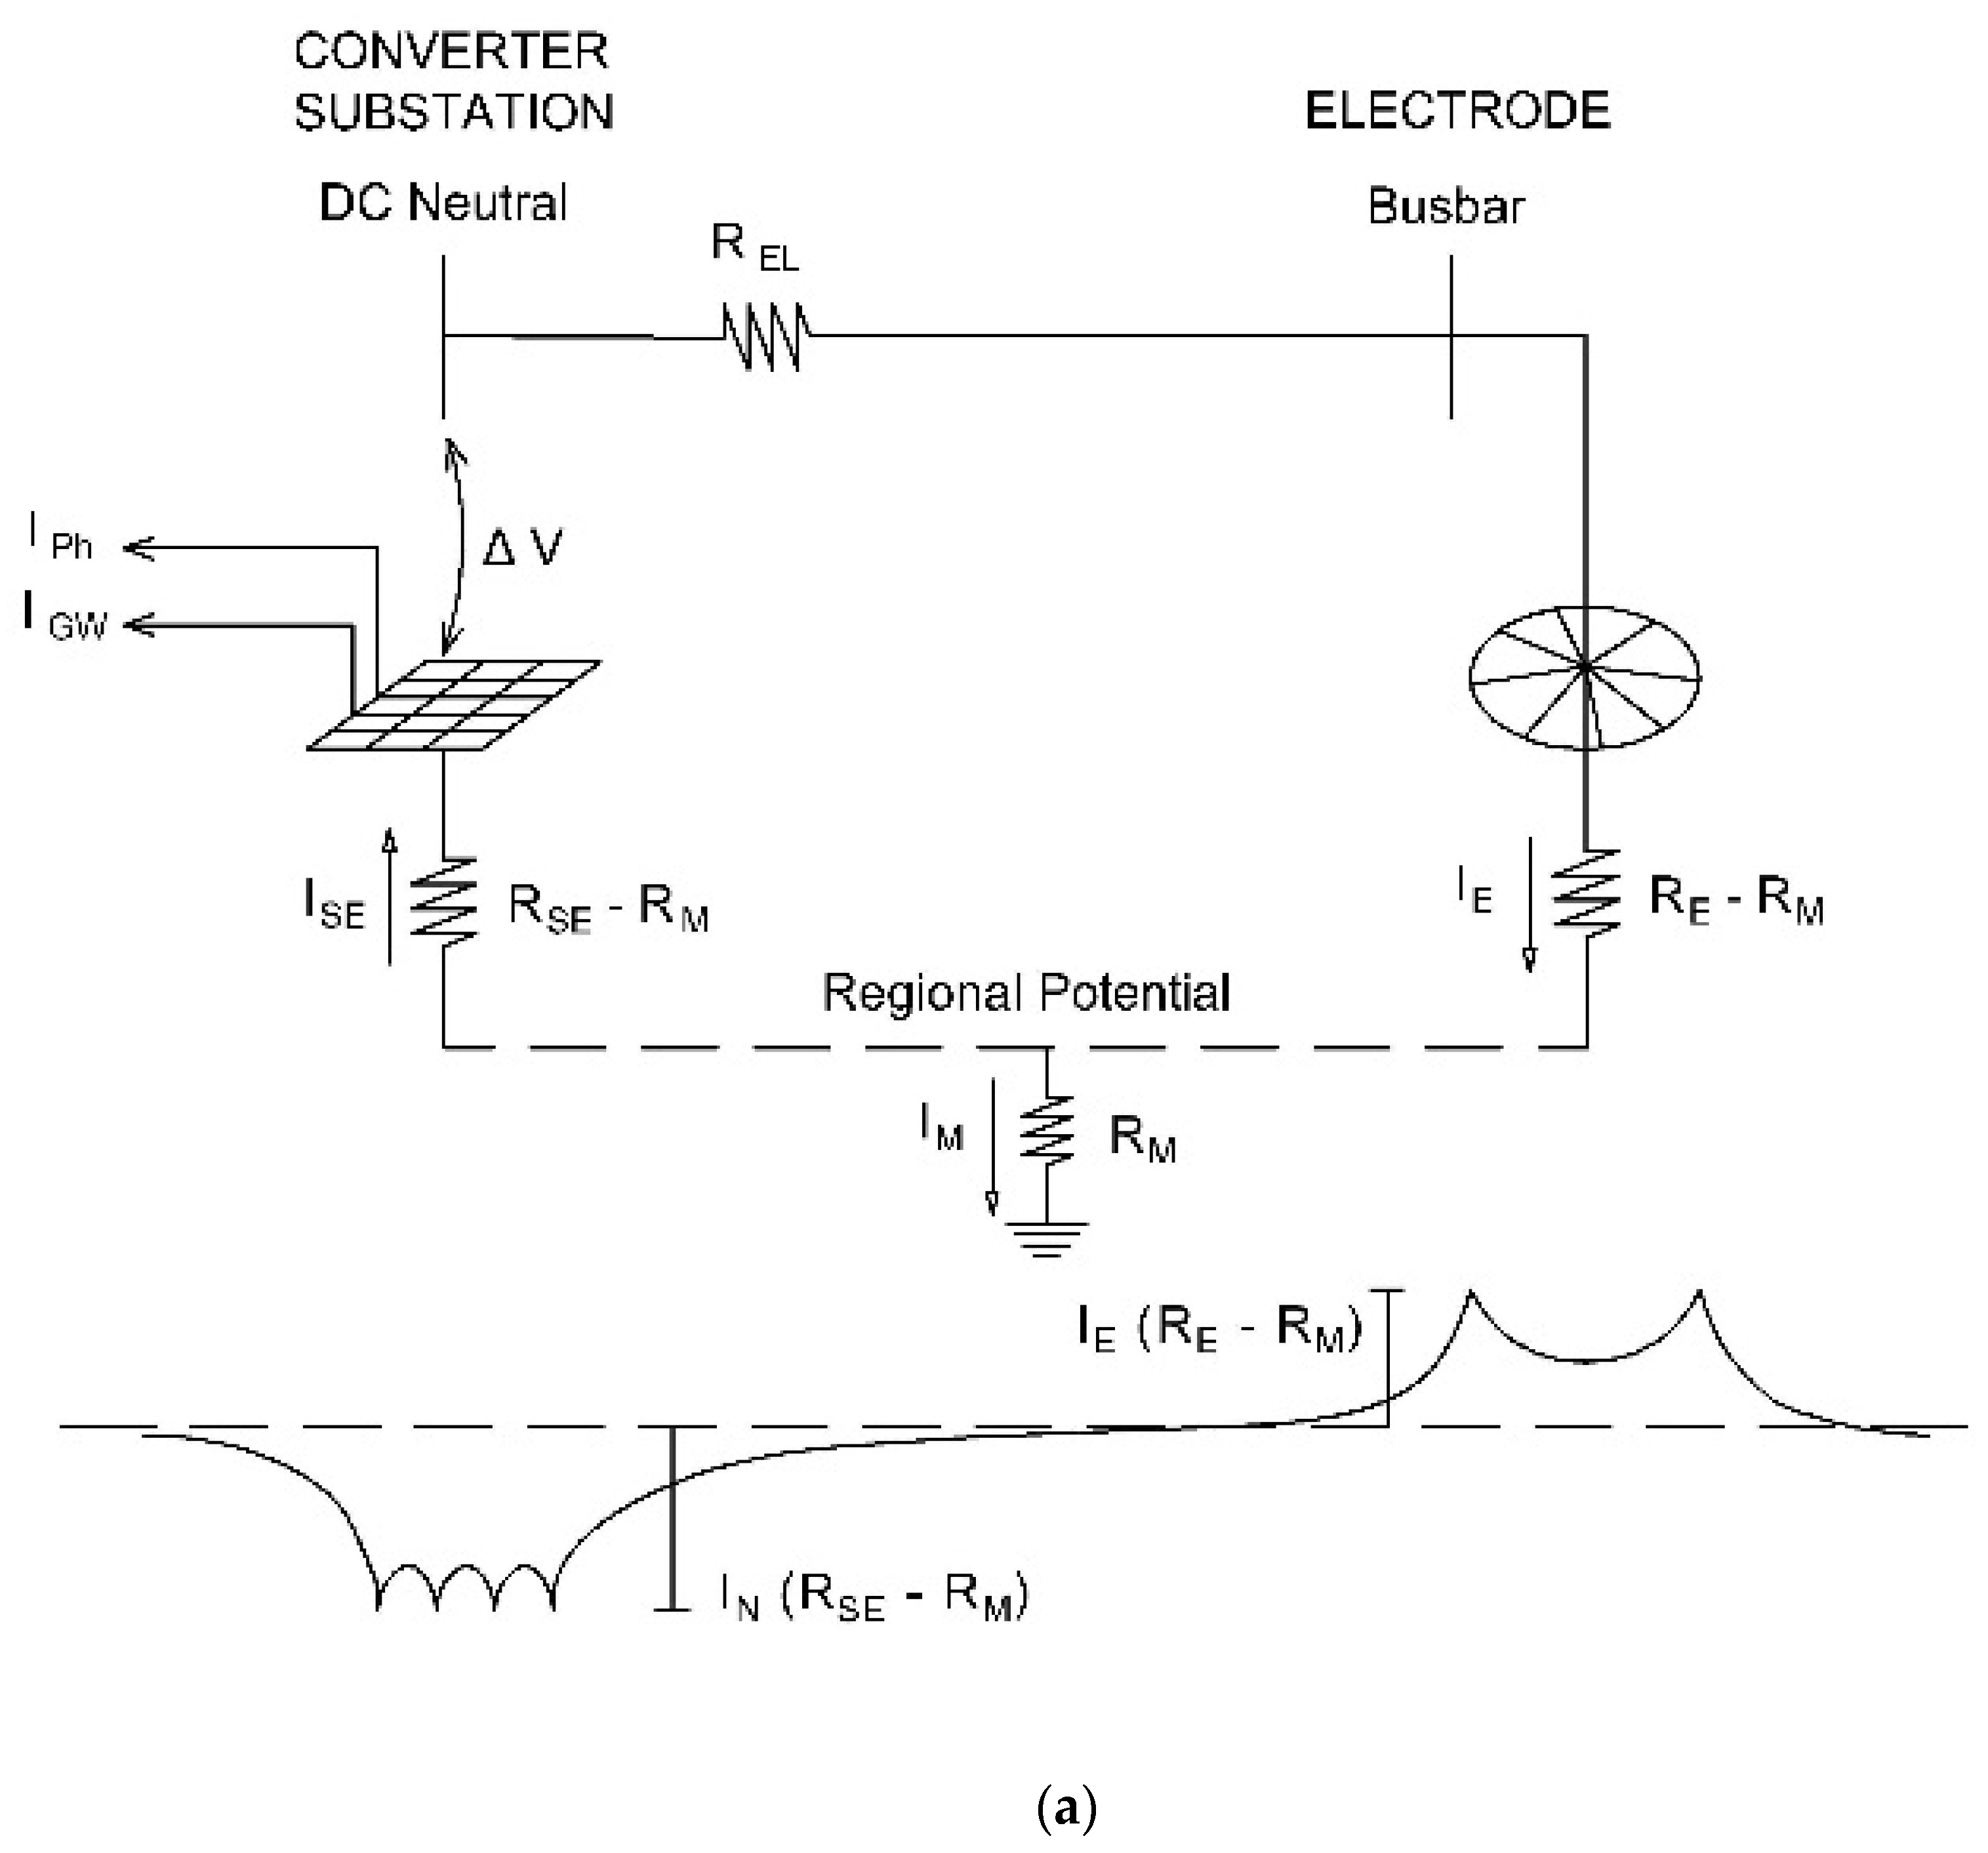
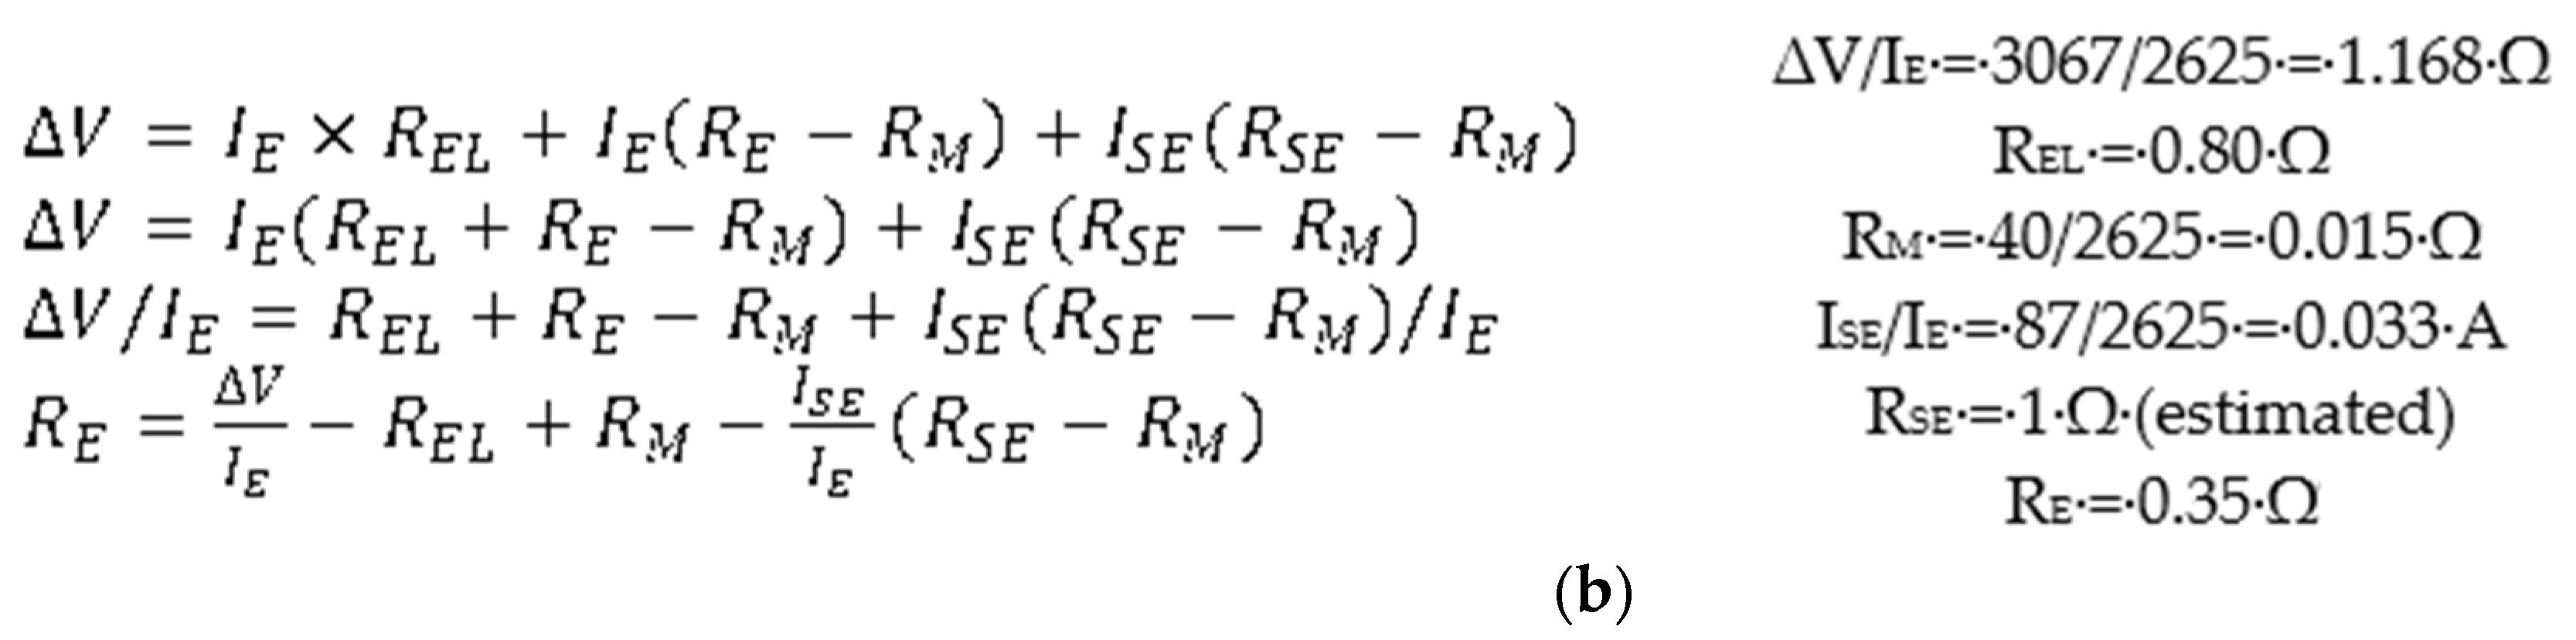
Figure 5a presents the ground loop of the DC current circulation between the electrode and the converter substation, where the two coupled grounding resistances (electrode and substation) were substituted by the equivalent Y connection. Considering the second Kirchhoff law (meshes law), the equations of Figure 5b can be formulated. Applying the inferred parameters (listed below the equations in Figure 5b) in the last equation, the electrode resistance can be calculated as RE = 0.35 Ω.
The difference between the first approach resistance and the adjusted value is only 5%, which is a small deviation. It shall be considered that the high-resistivity regional tectonic setting (cratonic) contributes to a stronger coupling between the electrode and the converter substation. Therefore, it can be concluded that the first approach resistance will be a good value for most of the tectonic settings.
5.3. Soil Surface Potential Profiles
This survey consisted of the sequential measurement of potential differences on the soil surface in the West and South directions, starting at the switching house busbar. The measurements were performed with a DC voltmeter and a pair of non-polarizing Cu/CuSO4 half-cells. The soil surfaces where the half-cells were placed were previously cleaned of weeds, rock fragments, etc. The porous contact of the half-cell with the ground was facilitated by the moist soil due to the rainy weather during the tests.
The potential difference from the busbar to the grounding ring of the switching house was first measured, and then the soil surface potentials were measured according to the following intervals:
- 100 m, from the grounding ring of the switching house to the wells’ perimeter;
- 10 m, from the well perimeter to the site fence;
- 100 m intervals away from the site fence.
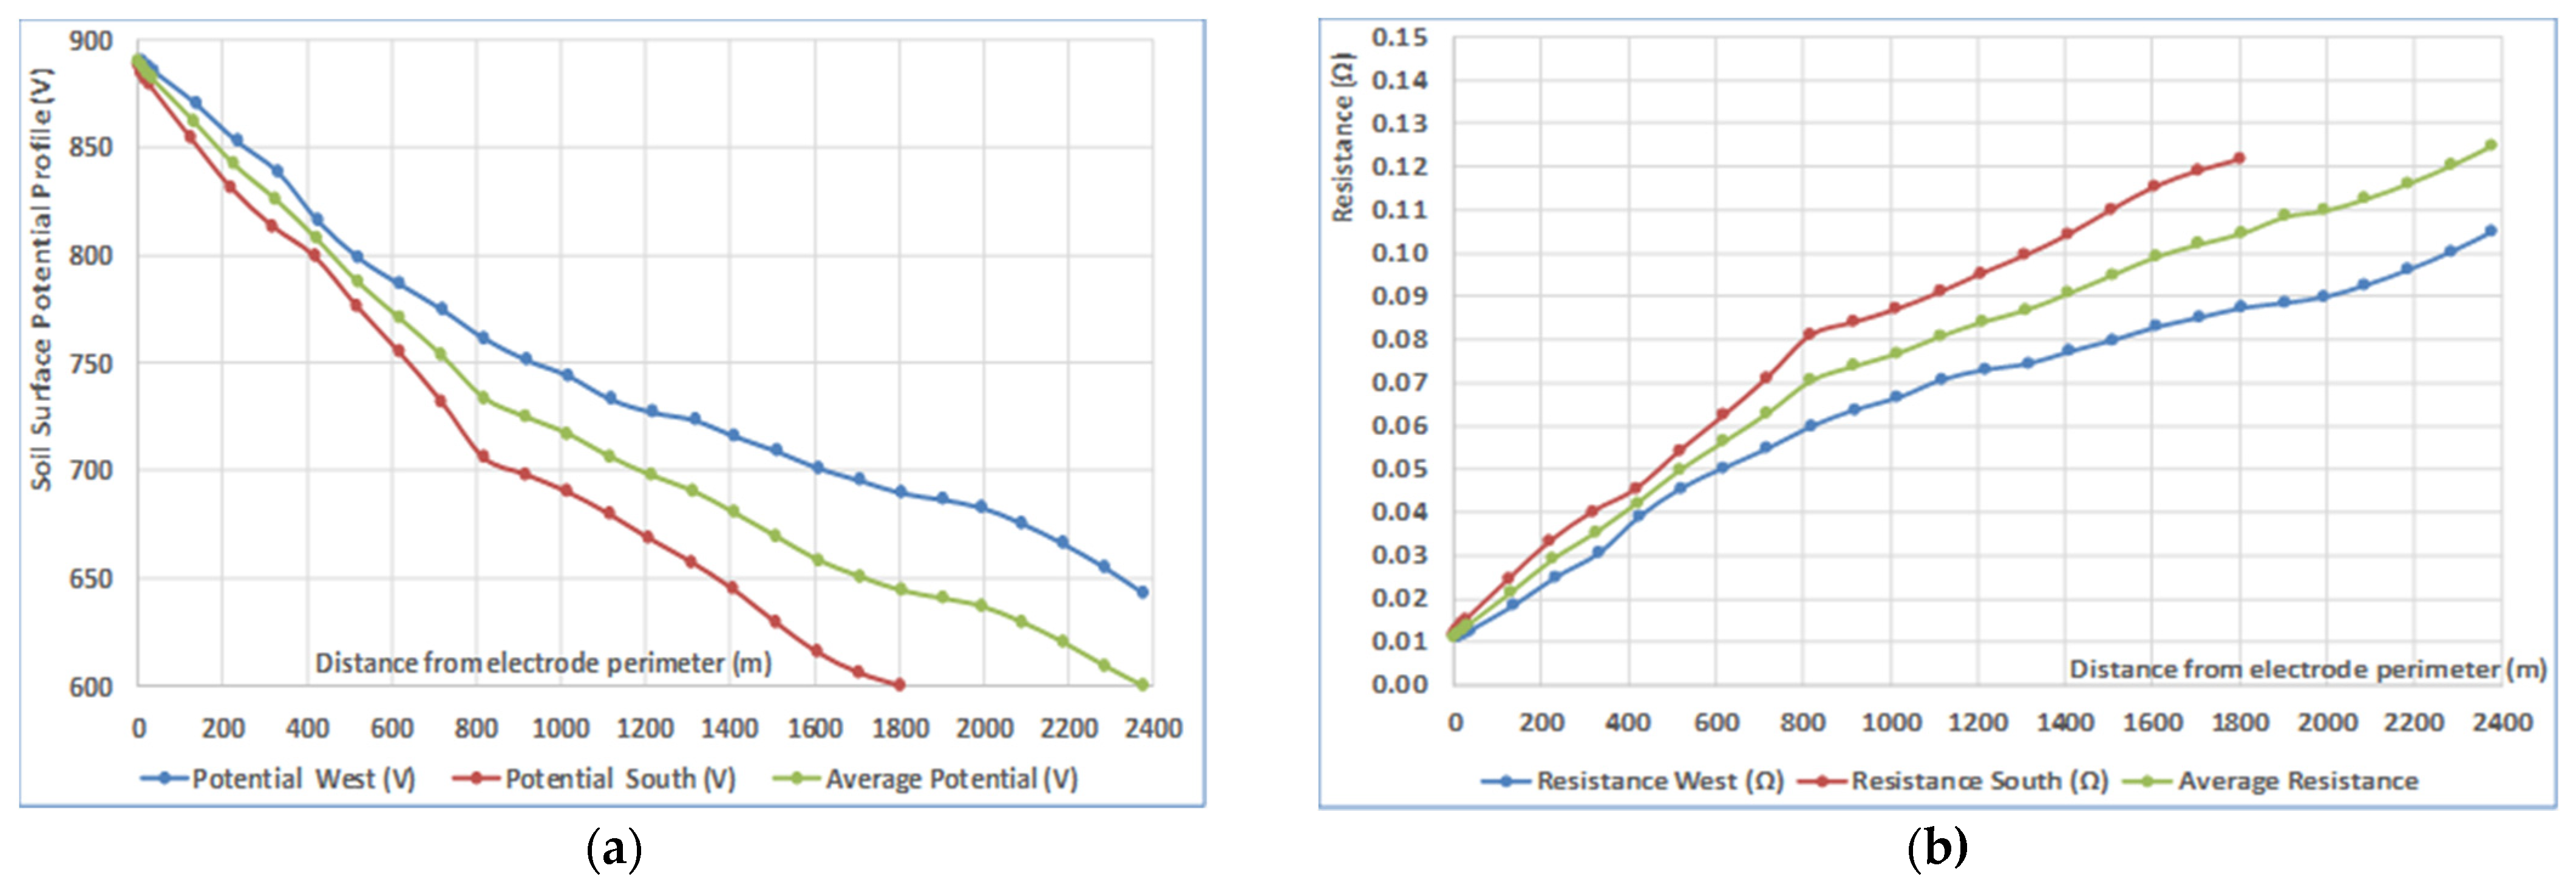
Figure 6 presents the two measurement directions, West and South, and Figure 7a presents the corresponding soil surface potential curves (blue and red), which allowed for the construction of the average profile (green) for the first 2 km from the site perimeter. The three curves are referenced to the nominal current of 2625 A.
Figure 7b presents the three previous potential curves converted to resistance curves, adjusted for the calculated electrode resistance of 0.35 Ω. The average curve (green) corresponds to the expected potential profile for the 1D geoelectric model, which was adopted for the electrode design.
This set of mirrored curves allows for the following findings:
- Figure 7a—as expected, the equipotential curves produced by the injection of DC currents into the ground through the electrode are asymmetric, due to the asymmetry of the electrode perimeter and to the anisotropy of the ground structure;
- Figure 7b—2 km away from the electrode perimeter, the upward trend in the resistance curves is still strong, not allowing for the determination of the electrode resistance through the fall-of-potential method (which requires the stabilization of the apparent resistance curve on the electrode resistance).
6. Discussion
The first finding of this project was that the test electrode proved to be an important tool for the evaluation of the selected site, despite the cost of building a 40 km long temporary electrode line. The preliminary test with the temporary line allowed for the electrode design with the certainty that the site was well selected and there was no risk of saturating the converter transformers. The test electrode was also useful for the preliminary tests of the electrode before its energization.
It is worth noting that the electrode of bipole 1, at Porto Velho, is located almost 60 km away from the converter substation, while this new electrode 2 was built 40 km away from the same converter substation. The bipole 2 electrode site is located within a graben, a faulted and subsided fragment of a high-resistivity cratonic basement, which contributed to a better geoelectric structure.
The commissioning of the new electrode of the Rio Madeira bipole 2, at Porto Velho, was successful and allowed for important findings. The two soil-surface potential profiles were produced from a sequence of potential differences referenced to the electrode busbar, with no reference to the remote ground. Therefore, prior establishment of an electrode resistance was required, to allow for the adjustment of the soil surface potential profile calculated during the design work. The electrode resistance, which is only well defined after the processing of the commissioning data, is thus an essential parameter to be defined by the commissioning procedures [11,12,13,14].
The electrode resistance could not be calculated by using the traditional fall-of-potential method, which requires a measuring line ending close to the remote ground, where the stabilization of the apparent resistance curve on the electrode resistance can be achieved.
For the Porto Velho electrodes, the high-resistivity regional tectonic setting, associated with the border of the South Amazon craton, results in a wide interference area, which would require excessive soil surface potential survey, many kilometers away from the electrode, to achieve the stabilization of the resistance curve. It is nearly impossible to measure a very long soil surface potential profile due to the many obstacles that appear along the measuring line, such as closed forests, private properties, roads, and rivers (such as the one that limited the West measuring line).
In this case, the measurements performed at the converter substation were used as an aid for the calculation of the electrode resistance. For the project here reported, a previous paper was available [10] that reported some useful data acquired during the commissioning of the original electrode. However, these data will not usually be available. Therefore, the geoelectric model applied for the electrode design shall be corrected according to the first approach electrode resistance. This starting value for the electrode resistance can be then used for the estimate of the unknown parameters of the expressions of item 5.2 of this paper, which can be calculated through computer simulation.
The small deviation of 5% between the first approach resistance and the adjusted value is not significant, considering the strong coupling between the electrode and the converter substation grounding grid due to the high-resistivity regional tectonic setting (cratonic). The adjusted value was a bit lower than the first approach value, allowing for the conclusion that the first approach resistance will be an appropriate and conservative value for the calculated resistance of HVDC ground electrodes in general, independent of the tectonic setting of its location.
7. Conclusions
The final activity of the electrode commissioning, not reported in this paper, was the adjustment of the geoelectric model in such a way that the simulated electrode performance matches the data measured in the field. This adjustment is important because the geophysical models are always limited by model restrictions and data inaccuracies, resulting in calculated electrode performance that deviates from the actual performance [12,13].
Therefore, the geoelectric model needs to be adjusted based on the data measured during the electrode commissioning and on simulations of the designed electrode configuration. The electrode resistance (calculated or measured) and the average measured soil surface potential profile (Figure 7a) are important data for the calibration of the final geoelectric model.
For the case of electrodes located within a sedimentary formation, which usually presents lower ground resistivities than the ones found in Porto Velho, it may be possible to measure the electrode resistance by employing the fall-of-potential method. It is worth observing that the measured resistance will be always a partial value, as it is not viable to proceed with the measurements up to the remote ground, a far-away distance where the electrode has no interference on the soil surface potentials.
For the electrode of this paper, located within a high-resistivity cratonic environment, it was not possible to measure its resistance. Therefore, we collected electrical data from different measurements, which allowed for the calculation of the electrode resistance.
The presentation of the geophysical surveys, the data processing for the construction of a deep geoelectric model, and the final adjustment of the geoelectric models are beyond the scope of this paper but are addressed in the references of the paper. References [12,13] present the methodology for the simultaneous adjustment of electrode resistance and the geoelectric model, applying an interactive procedure based on the design and commissioning data of the South electrodes of Rio Madeira bipoles 1 and 2, both located in Araraquara (São Paulo state), within the wide and deep Paraná sedimentary basin.
Author Contributions
Conceptualization and methodology, P.F.; validation and formal analysis, J.K. and G.O.; writing—original draft preparation, P.F.; writing—review and editing, J.K. and G.O.; supervision, project administration and funding acquisition J.K. and G.O. All authors have read and agreed to the published version of the manuscript.
Funding
This research received no external funding.
Institutional Review Board Statement
Not applicable.
Informed Consent Statement
Not applicable.
Conflicts of Interest
The authors declare no conflict of interest.
References
- IEC-TS-62344-2013; General Guidelines for the Design of Ground Electrodes for High-Voltage Direct Current (HVDC) Links. International Electrotechnical Commission: Geneva, Switzerland, 2013.
- Cigré Working Group B4.61. 657-General Guidelines for HVDC Electrode Design; International Council on Large Electric Systems: France, Paris, 2017. [Google Scholar]
- Sibilant, G. EPRI-HVDC Ground Electrode Overview. Electric Power Research Institute: Palo Alto, CA, USA, 2010. [Google Scholar]
- Freire, P.E.F.; Malgaroti, S.; Githinji, J.N.; Pereira, S.Y.; Rizzo, F.; Wubshet, T. HVDC link Kenya-Ethiopia–Ground Electrodes Site Selection. In Proceedings of the Cigré Symposium-South Africa 2015, Paper 104, Cape Town, South Africa, 26–30 October 2015. [Google Scholar]
- Thunehed, H.; Åström, U.; Westman, B. Geophysical and geological pre-investigations for HVDC electrodes. In Proceedings of the 2007 IEEE Power Engineering Society Conference and Exposition in Africa-PowerAfrica, Johannesburg, South Africa, 16–20 July 2007. [Google Scholar]
- Nayak, R.N.; Sasmal, R.P.; Suri, R.; Manglik, A.; Verma, S.K.; Muralidharan, D. Selection of ground electrodes sites using geophysical techniques for resistivity measurements for first ±800 kV HVDC system in India. In Proceedings of the Cigré B4-105 Session 2008, Paris, France, 24–29 August 2008. [Google Scholar]
- Freire, P.E.F.; Pereira, S.Y. HVDC Grounding Electrodes and Tectonic Setting. In Proceedings of the Cigré Bienal Session 2018, Paris, France, 26–31 August 2018. [Google Scholar]
- Magg, T.G.; Mutshler, H.D.; Nyberg, S.; Washborg, J.; Thunehed, H.; Sandberg, B. Caprivi Link HVDC interconnector: Site selection, geophysical investigations, interference impacts and design of the earth electrodes. In Proceedings of the CIGRE B4_302. Paris Session 2010, Paris, France, 22–27 August 2010. [Google Scholar]
- Freire, P.E.F.; Mazzo, L.; Bijarrano, B.; Schnatzer, J.; Pereira, S.Y.; Ayer, J.E.B. Design of Belo Monte HVDC grounding electrode for the Estreito Terminal. In Proceedings of the Cigré Winnipeg 2017 Colloquium, Winnipeg, MB, Canada, 30 September–6 October 2017. [Google Scholar]
- Arruda, C.K.C.; Dart, F.C.; Lugão, P.P.; Kriegshauser, B.; Morais, F.J.B. Investigations on interferences caused by current injection in HVDC ground electrodes at Rio Madeira Complex. In Proceedings of the Ground 2018 & LPE-International Conference on Grounding and Earthing & 8th International Conference on Lightning Physics and Effects, Pirenópolis, Brazil, 20–25 May 2018. [Google Scholar]
- Freire, P.E.F.; Pereira, S.Y. HVDC grounding electrode resistance. In Proceedings of the Ground 2018-International Conference on Grounding and Earthing & 8th International Conference on Lightning Physics and Effects, Pirenópolis, Brazil, 20–25 May 2018. [Google Scholar]
- Freire, P.E.F.; Pereira, S.Y.; Padilha, A.L. Adjustment of a crustal geoelectric model from commissioning data of HVDC ground electrodes: A case study from the Northeastern Paraná Basin, Brazil. J. Appl. Geophys. 2020, 182, 104186. [Google Scholar] [CrossRef]
- Freire, P.E.F.; Pereira, S.Y.; Padilha, A.L. Adjustment of the Geoelectric Model for a Ground Electrode Design—The Case of the Rio Madeira HVDC Transmission System, Brazil. Available online: https://www.researchgate.net/publication/350071951_Adjustment_of_the_Geoelectric_Model_for_a_Ground_Electrode_Design_-_the_case_of_the_Rio_Madeira_HVDC_Transmission_System_Brazil (accessed on 6 November 2021).
- Freire, P.E.F. The Measurement of HVDC Ground Electrodes Resistance. In Proceedings of the Cigré Bienal e-Session 2020, Paris Session 2020, Paris, France, 23–28 August 2020. [Google Scholar]
Figure 1.
The ground electrode of Rio Madeira bipole 2, with its 80 wells along a 5 km asymmetric perimeter. Site 1 is the switching house and the gray lines are the buried section feeders.
Figure 1.
The ground electrode of Rio Madeira bipole 2, with its 80 wells along a 5 km asymmetric perimeter. Site 1 is the switching house and the gray lines are the buried section feeders.

Figure 2.
Well construction, 67 m depth.

Figure 3.
Test-electrode configuration.

Figure 4.
The measured distribution of the electrode current within the section feeders (blue line) and the desired uniform distribution (red line), with reference to the nominal current (2625 A).
Figure 4.
The measured distribution of the electrode current within the section feeders (blue line) and the desired uniform distribution (red line), with reference to the nominal current (2625 A).

Figure 5.
Equivalent circuit of the DC ground loop (a) and application of the second Kirchhoff Law (meshes law) for the solution of the circuit (b).
Figure 5.
Equivalent circuit of the DC ground loop (a) and application of the second Kirchhoff Law (meshes law) for the solution of the circuit (b).


Figure 6.
The two soil-surface potential survey directions–West and South (the West line was limited by a river).
Figure 6.
The two soil-surface potential survey directions–West and South (the West line was limited by a river).

Figure 7.
Measured (blue and red) and average curves (green): (a) the two soil-surface potential profiles; (b) the corresponding resistance curves.
Figure 7.
Measured (blue and red) and average curves (green): (a) the two soil-surface potential profiles; (b) the corresponding resistance curves.

Publisher’s Note: MDPI stays neutral with regard to jurisdictional claims in published maps and institutional affiliations. |
© 2022 by the authors. Licensee MDPI, Basel, Switzerland. This article is an open access article distributed under the terms and conditions of the Creative Commons Attribution (CC BY) license (https://creativecommons.org/licenses/by/4.0/).
Share and Cite
MDPI and ACS Style
Freire, P.; Kalife, J.; Oliveira, G. Rio Madeira HVDC System: Commissioning of the Ground Electrode for Bipole 2 at Porto Velho. Appl. Sci. 2022, 12, 3279. https://0-doi-org.brum.beds.ac.uk/10.3390/app12073279
AMA Style
Freire P, Kalife J, Oliveira G. Rio Madeira HVDC System: Commissioning of the Ground Electrode for Bipole 2 at Porto Velho. Applied Sciences. 2022; 12(7):3279. https://0-doi-org.brum.beds.ac.uk/10.3390/app12073279
Chicago/Turabian StyleFreire, Paulo, Jairo Kalife, and Gil Oliveira. 2022. "Rio Madeira HVDC System: Commissioning of the Ground Electrode for Bipole 2 at Porto Velho" Applied Sciences 12, no. 7: 3279. https://0-doi-org.brum.beds.ac.uk/10.3390/app12073279
Note that from the first issue of 2016, this journal uses article numbers instead of page numbers. See further details here.