
An Image Processing Protocol to Extract Variables Predictive of Human Embryo Fitness for Assisted Reproduction

 , , ,
, , ,
Abstract
:1. Introduction
2. Materials and Methods
2.1. Study Design
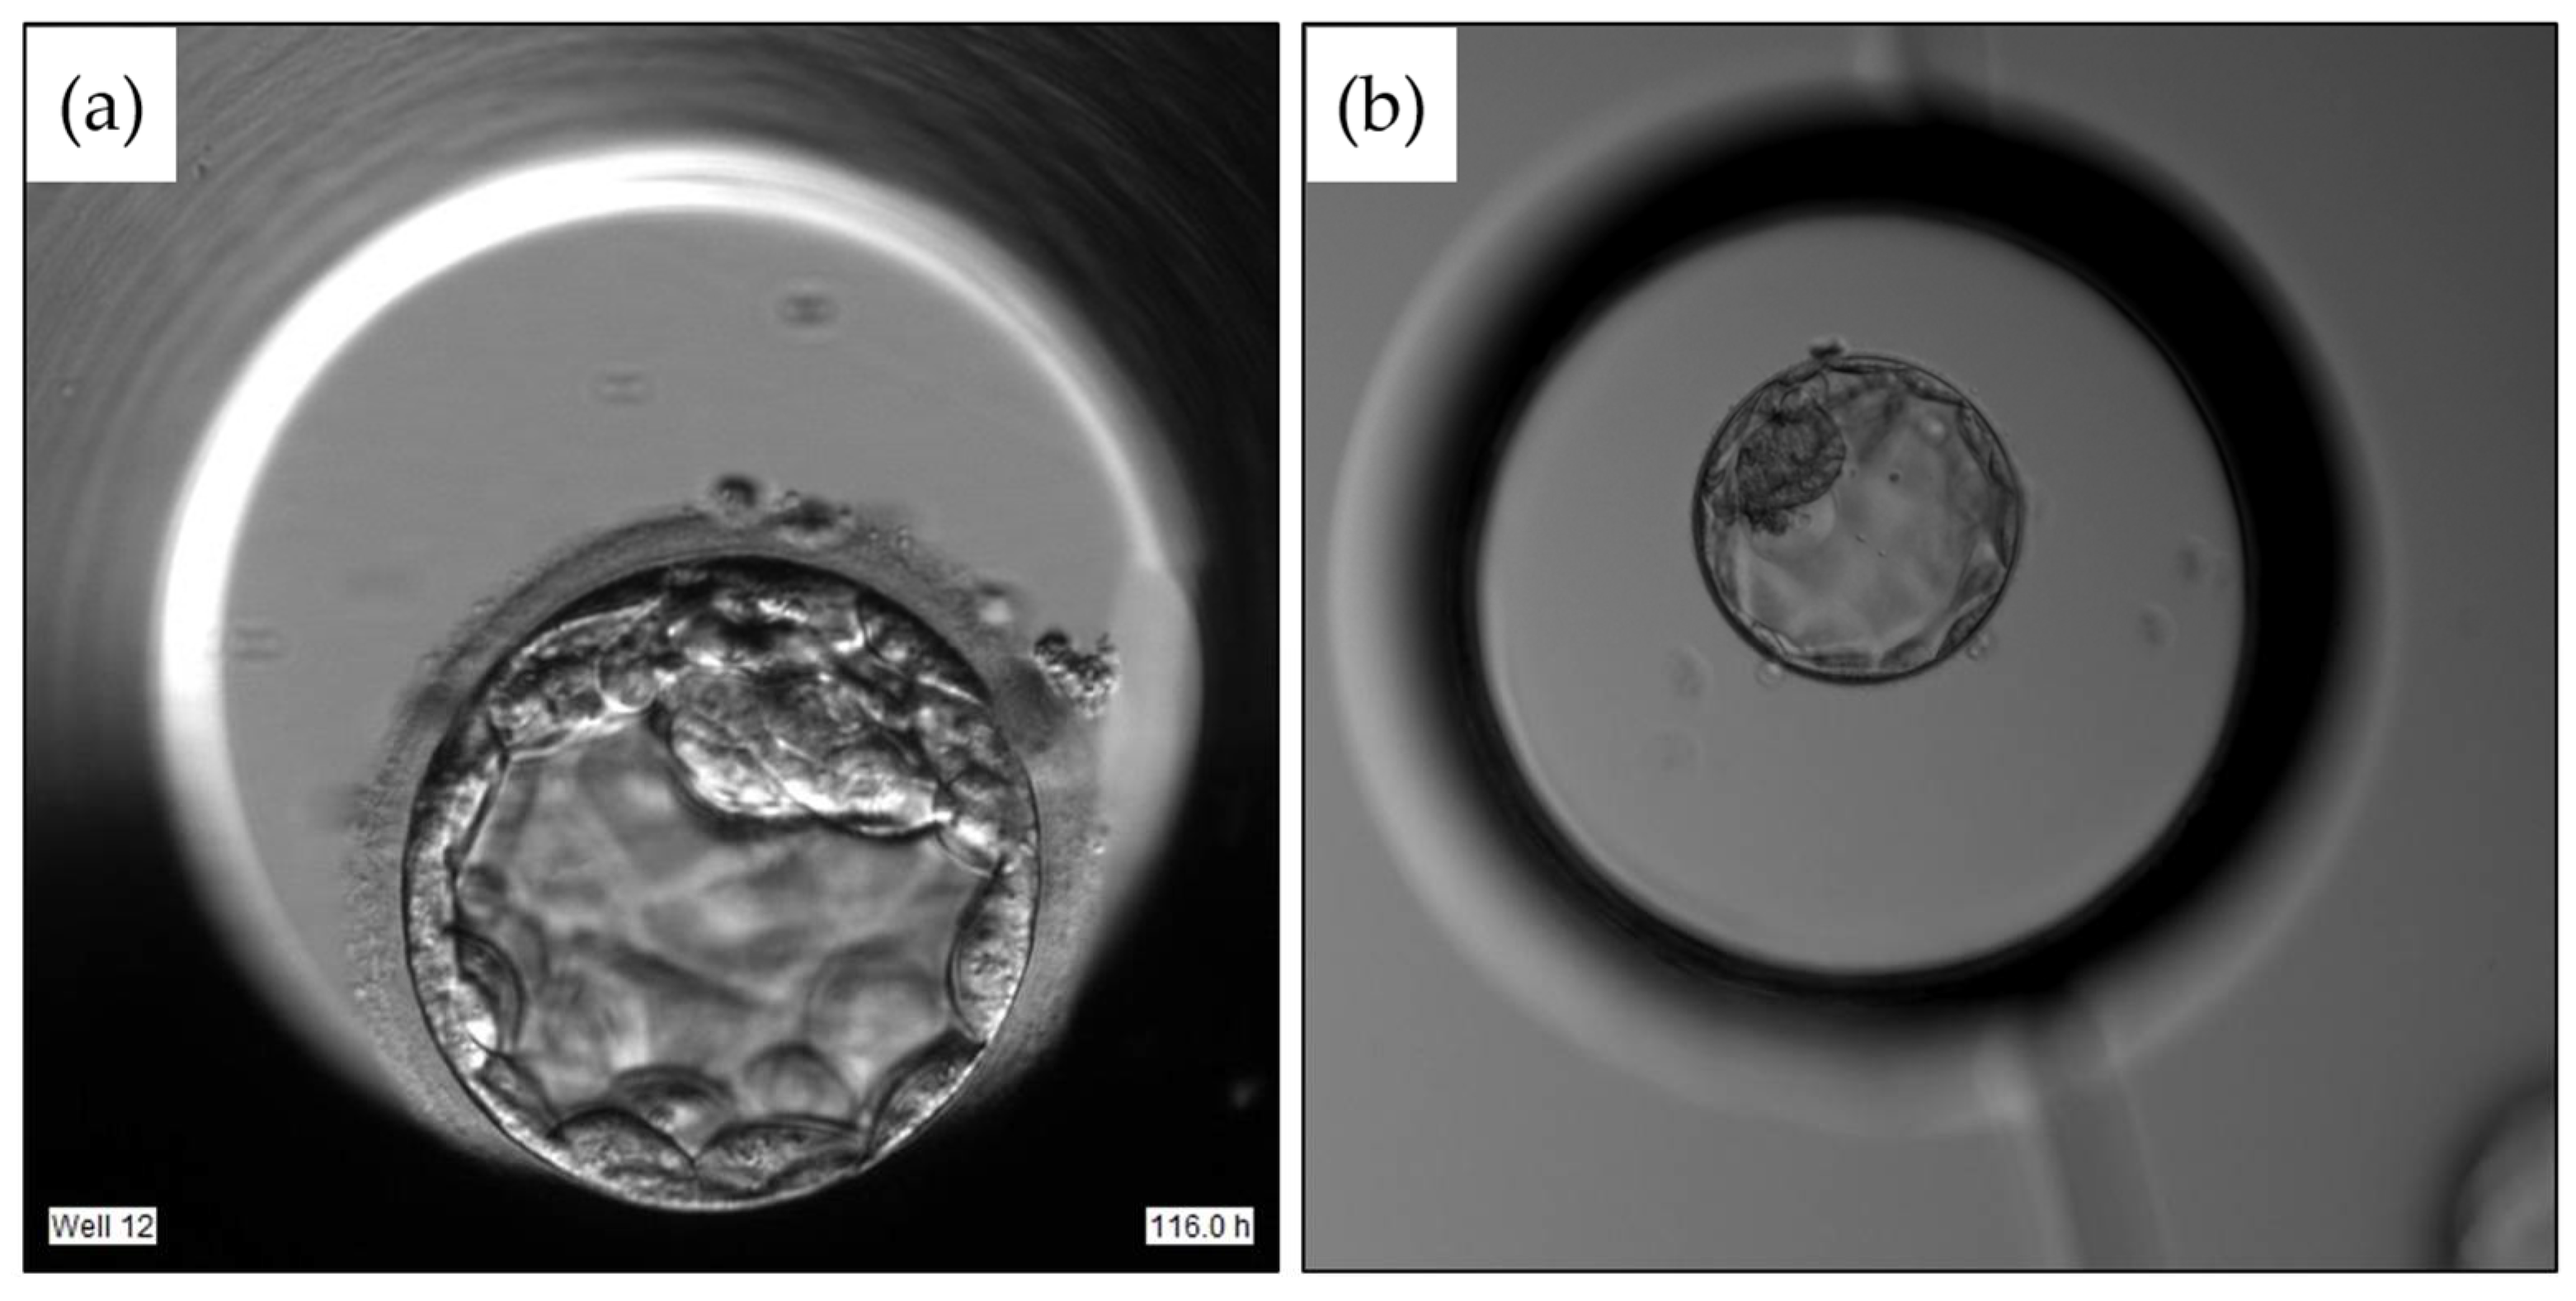
2.2. Image Dataset
2.3. Image Processing and Variable Extraction
2.4. Grayscale Conversion and Image Resizing
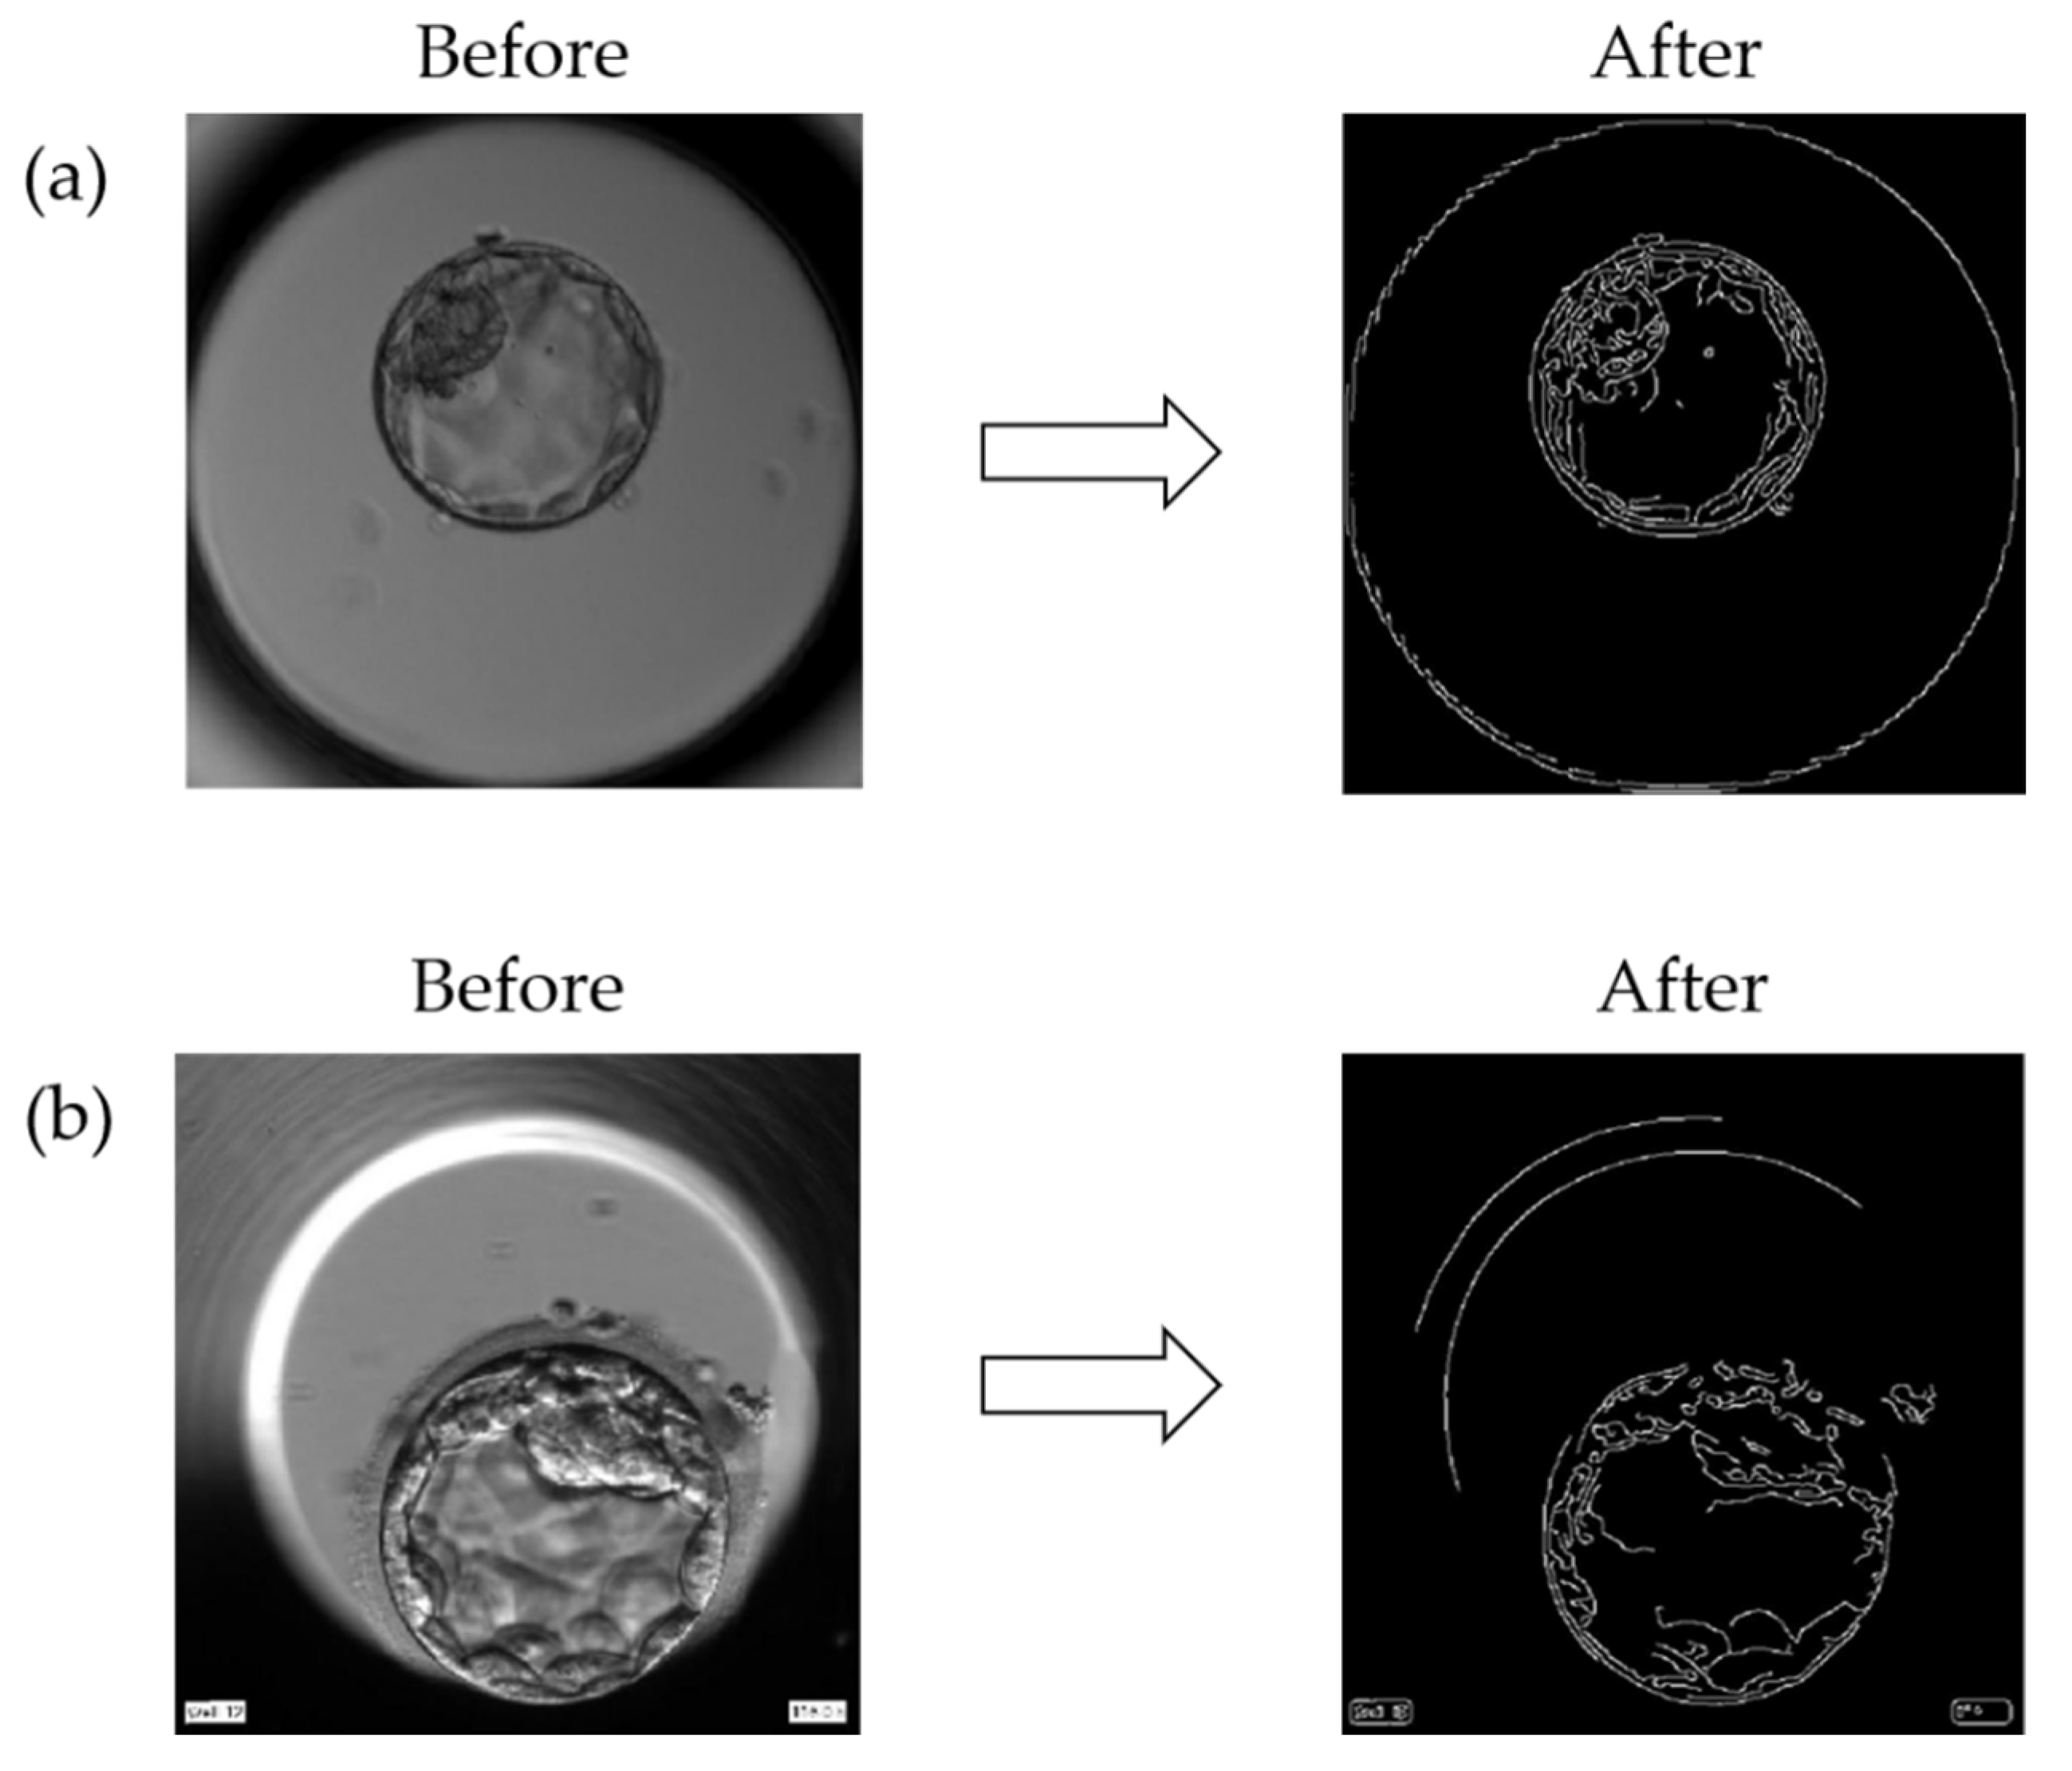
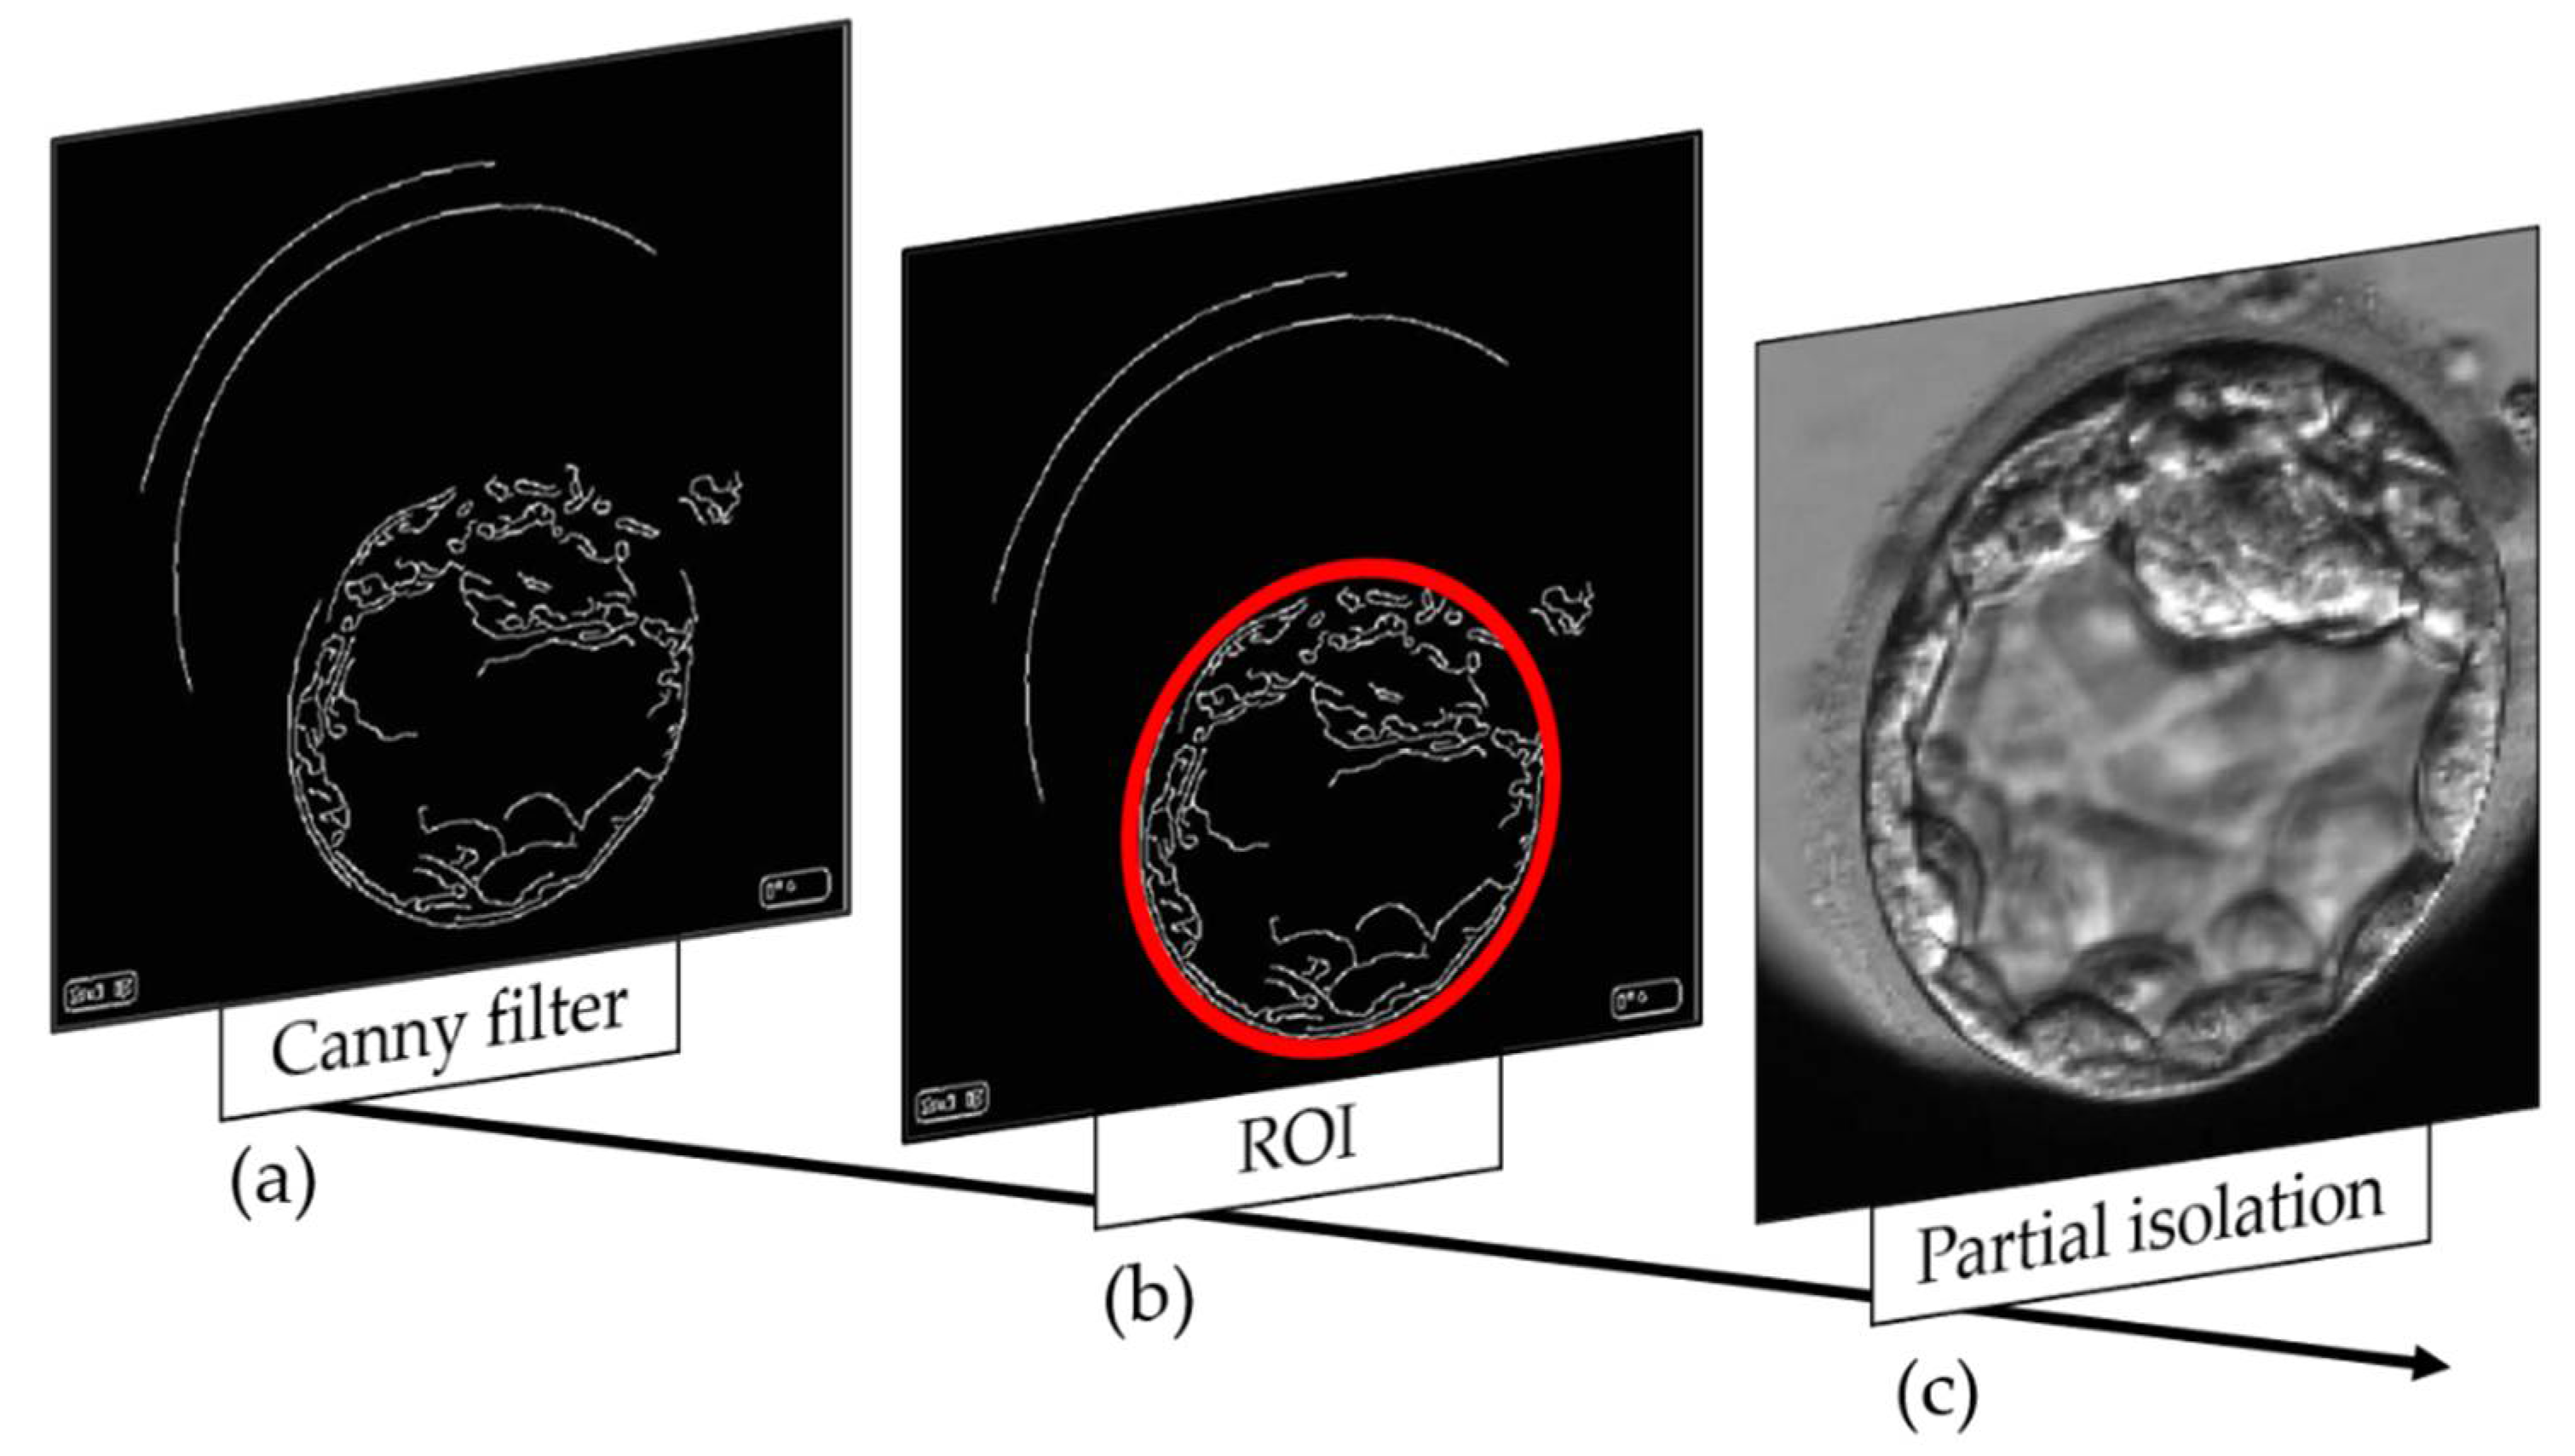
2.5. Canny Filter Application for Edge Detection
2.6. Detection of Circles by the Hough Transform
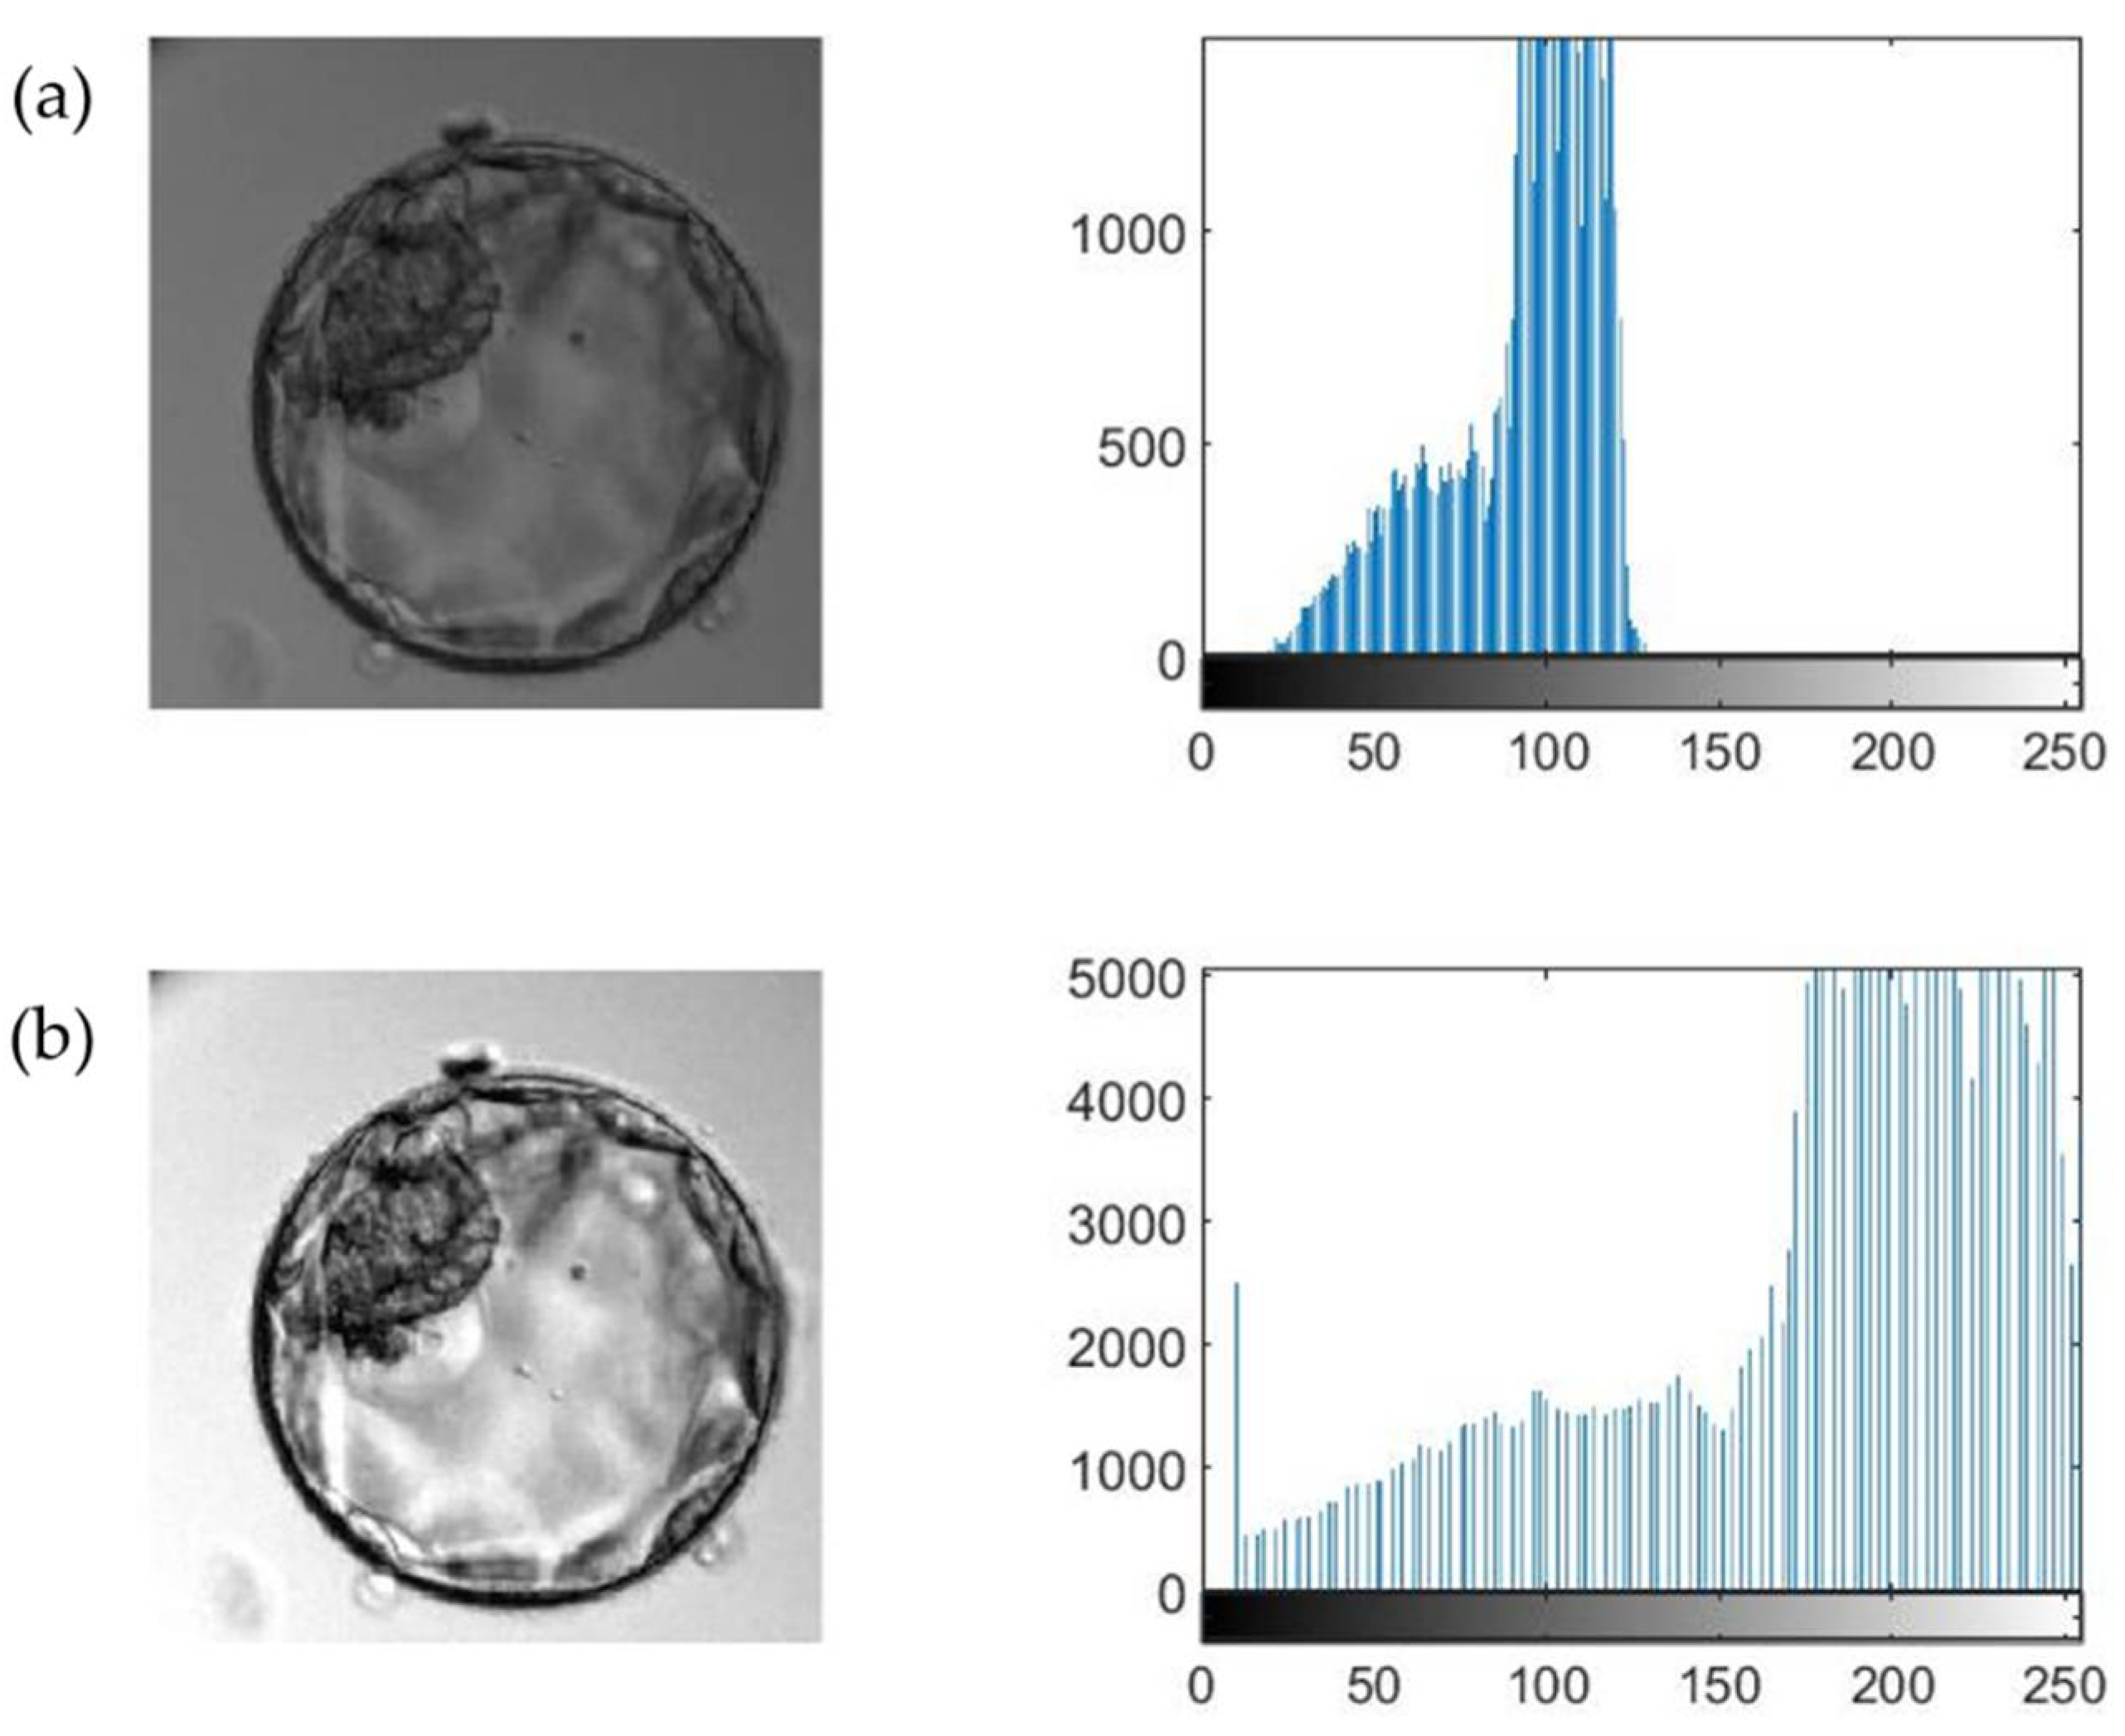
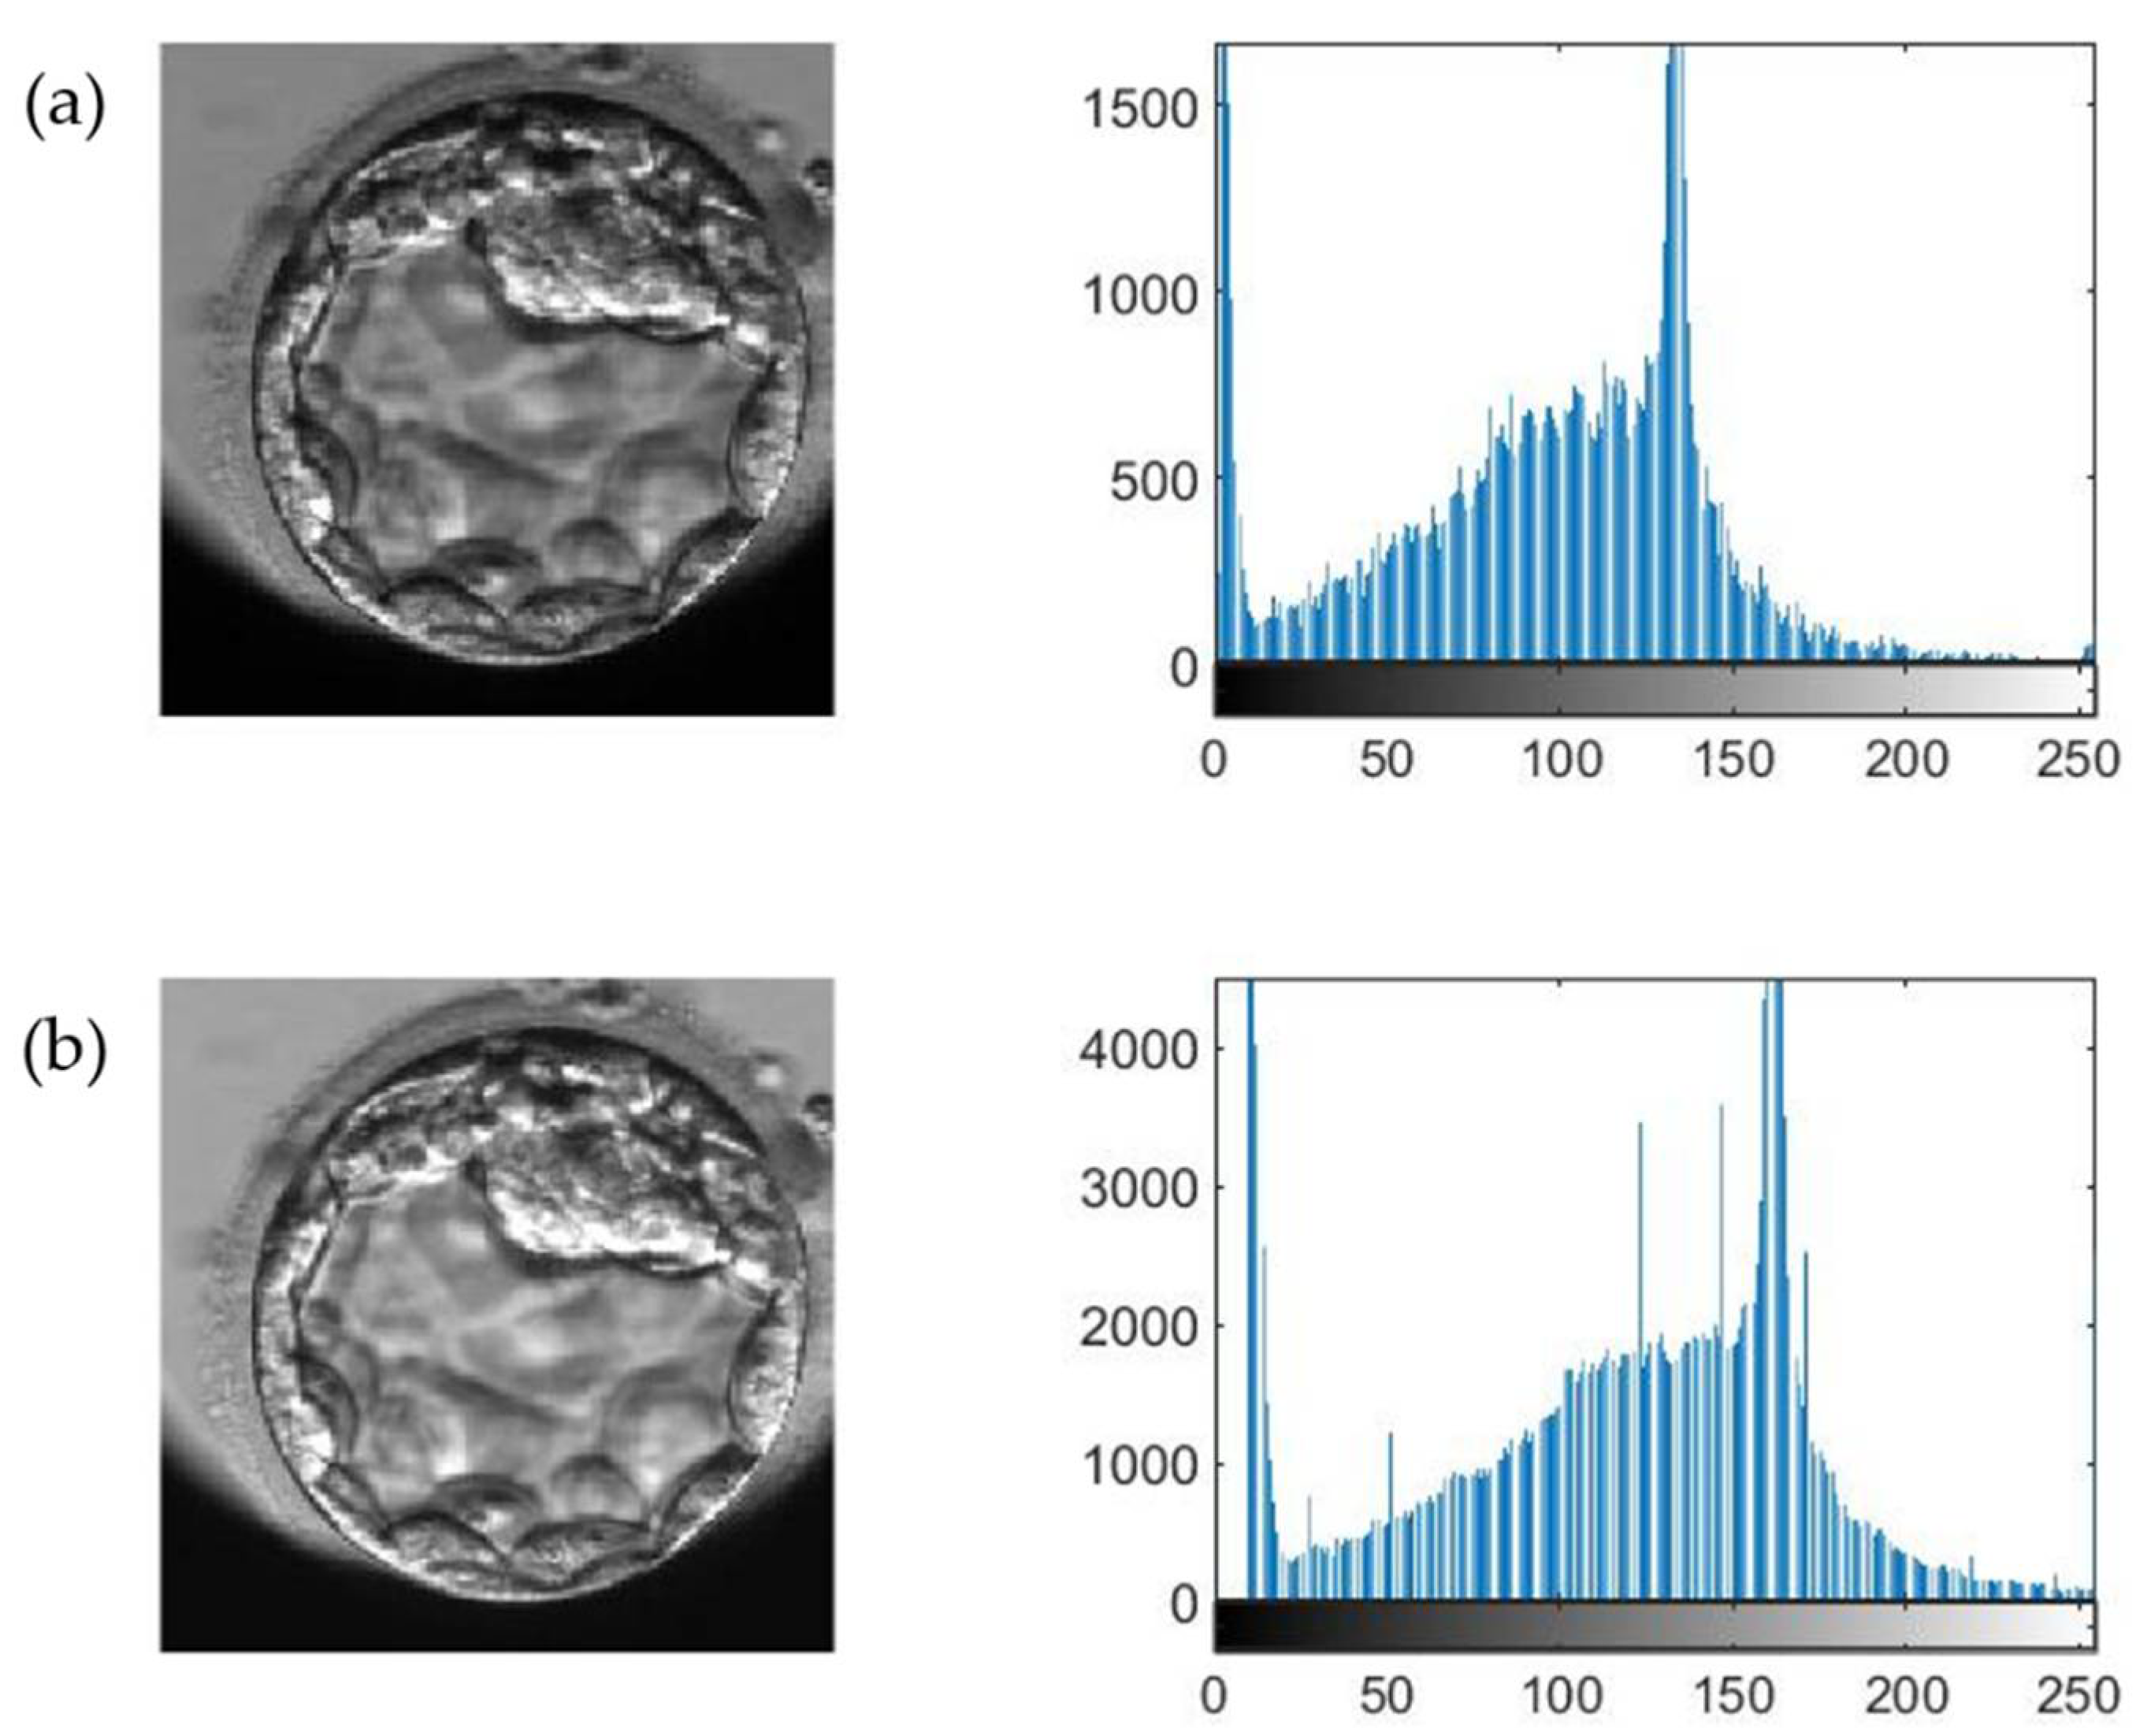
2.7. Histogram Adjustment
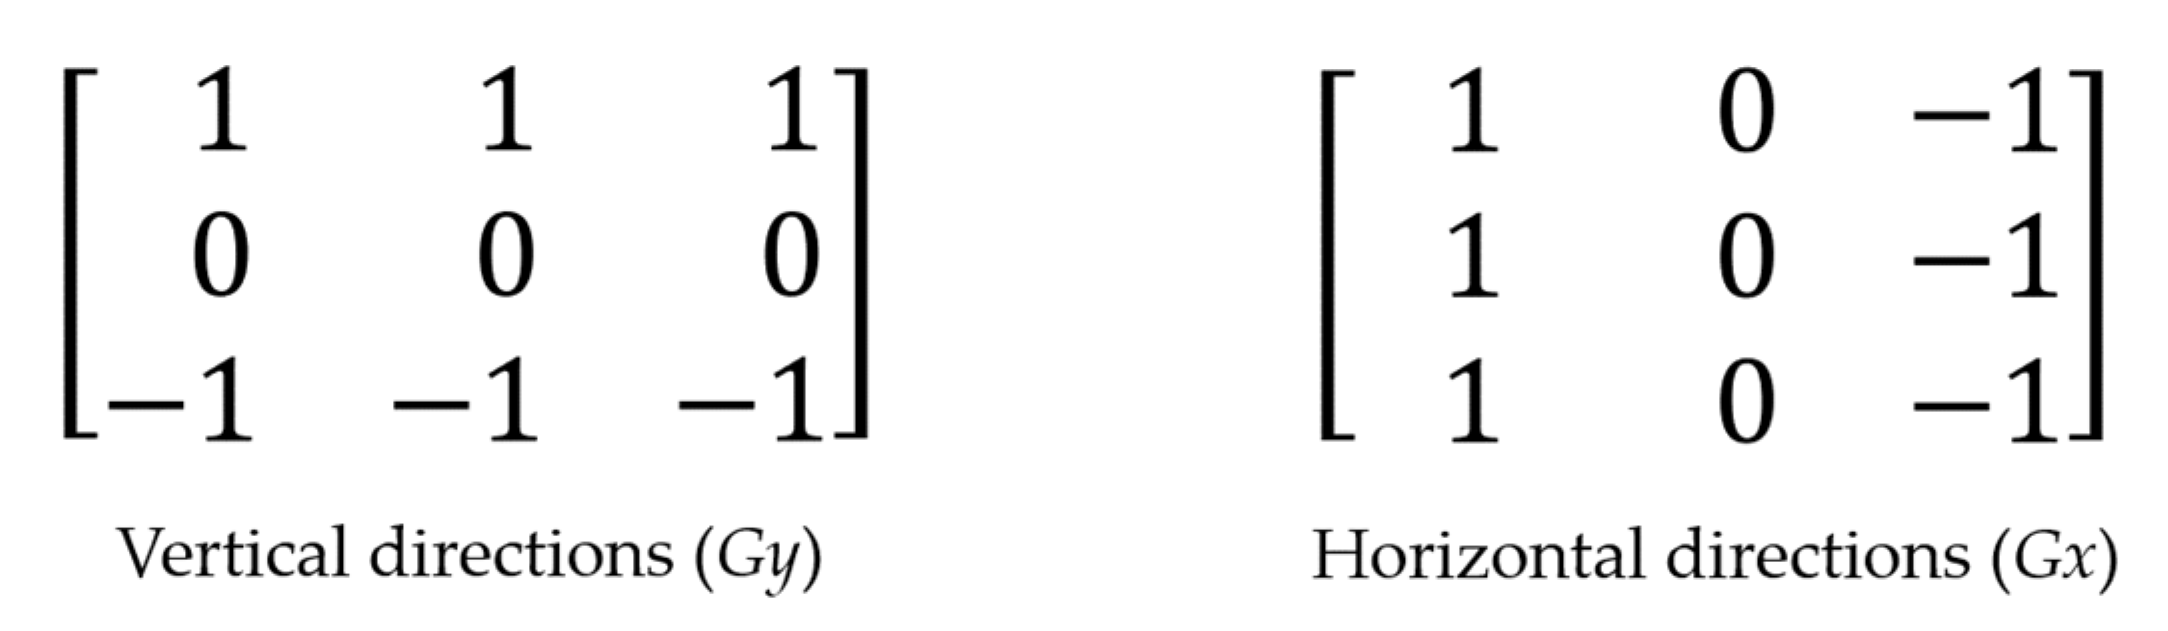
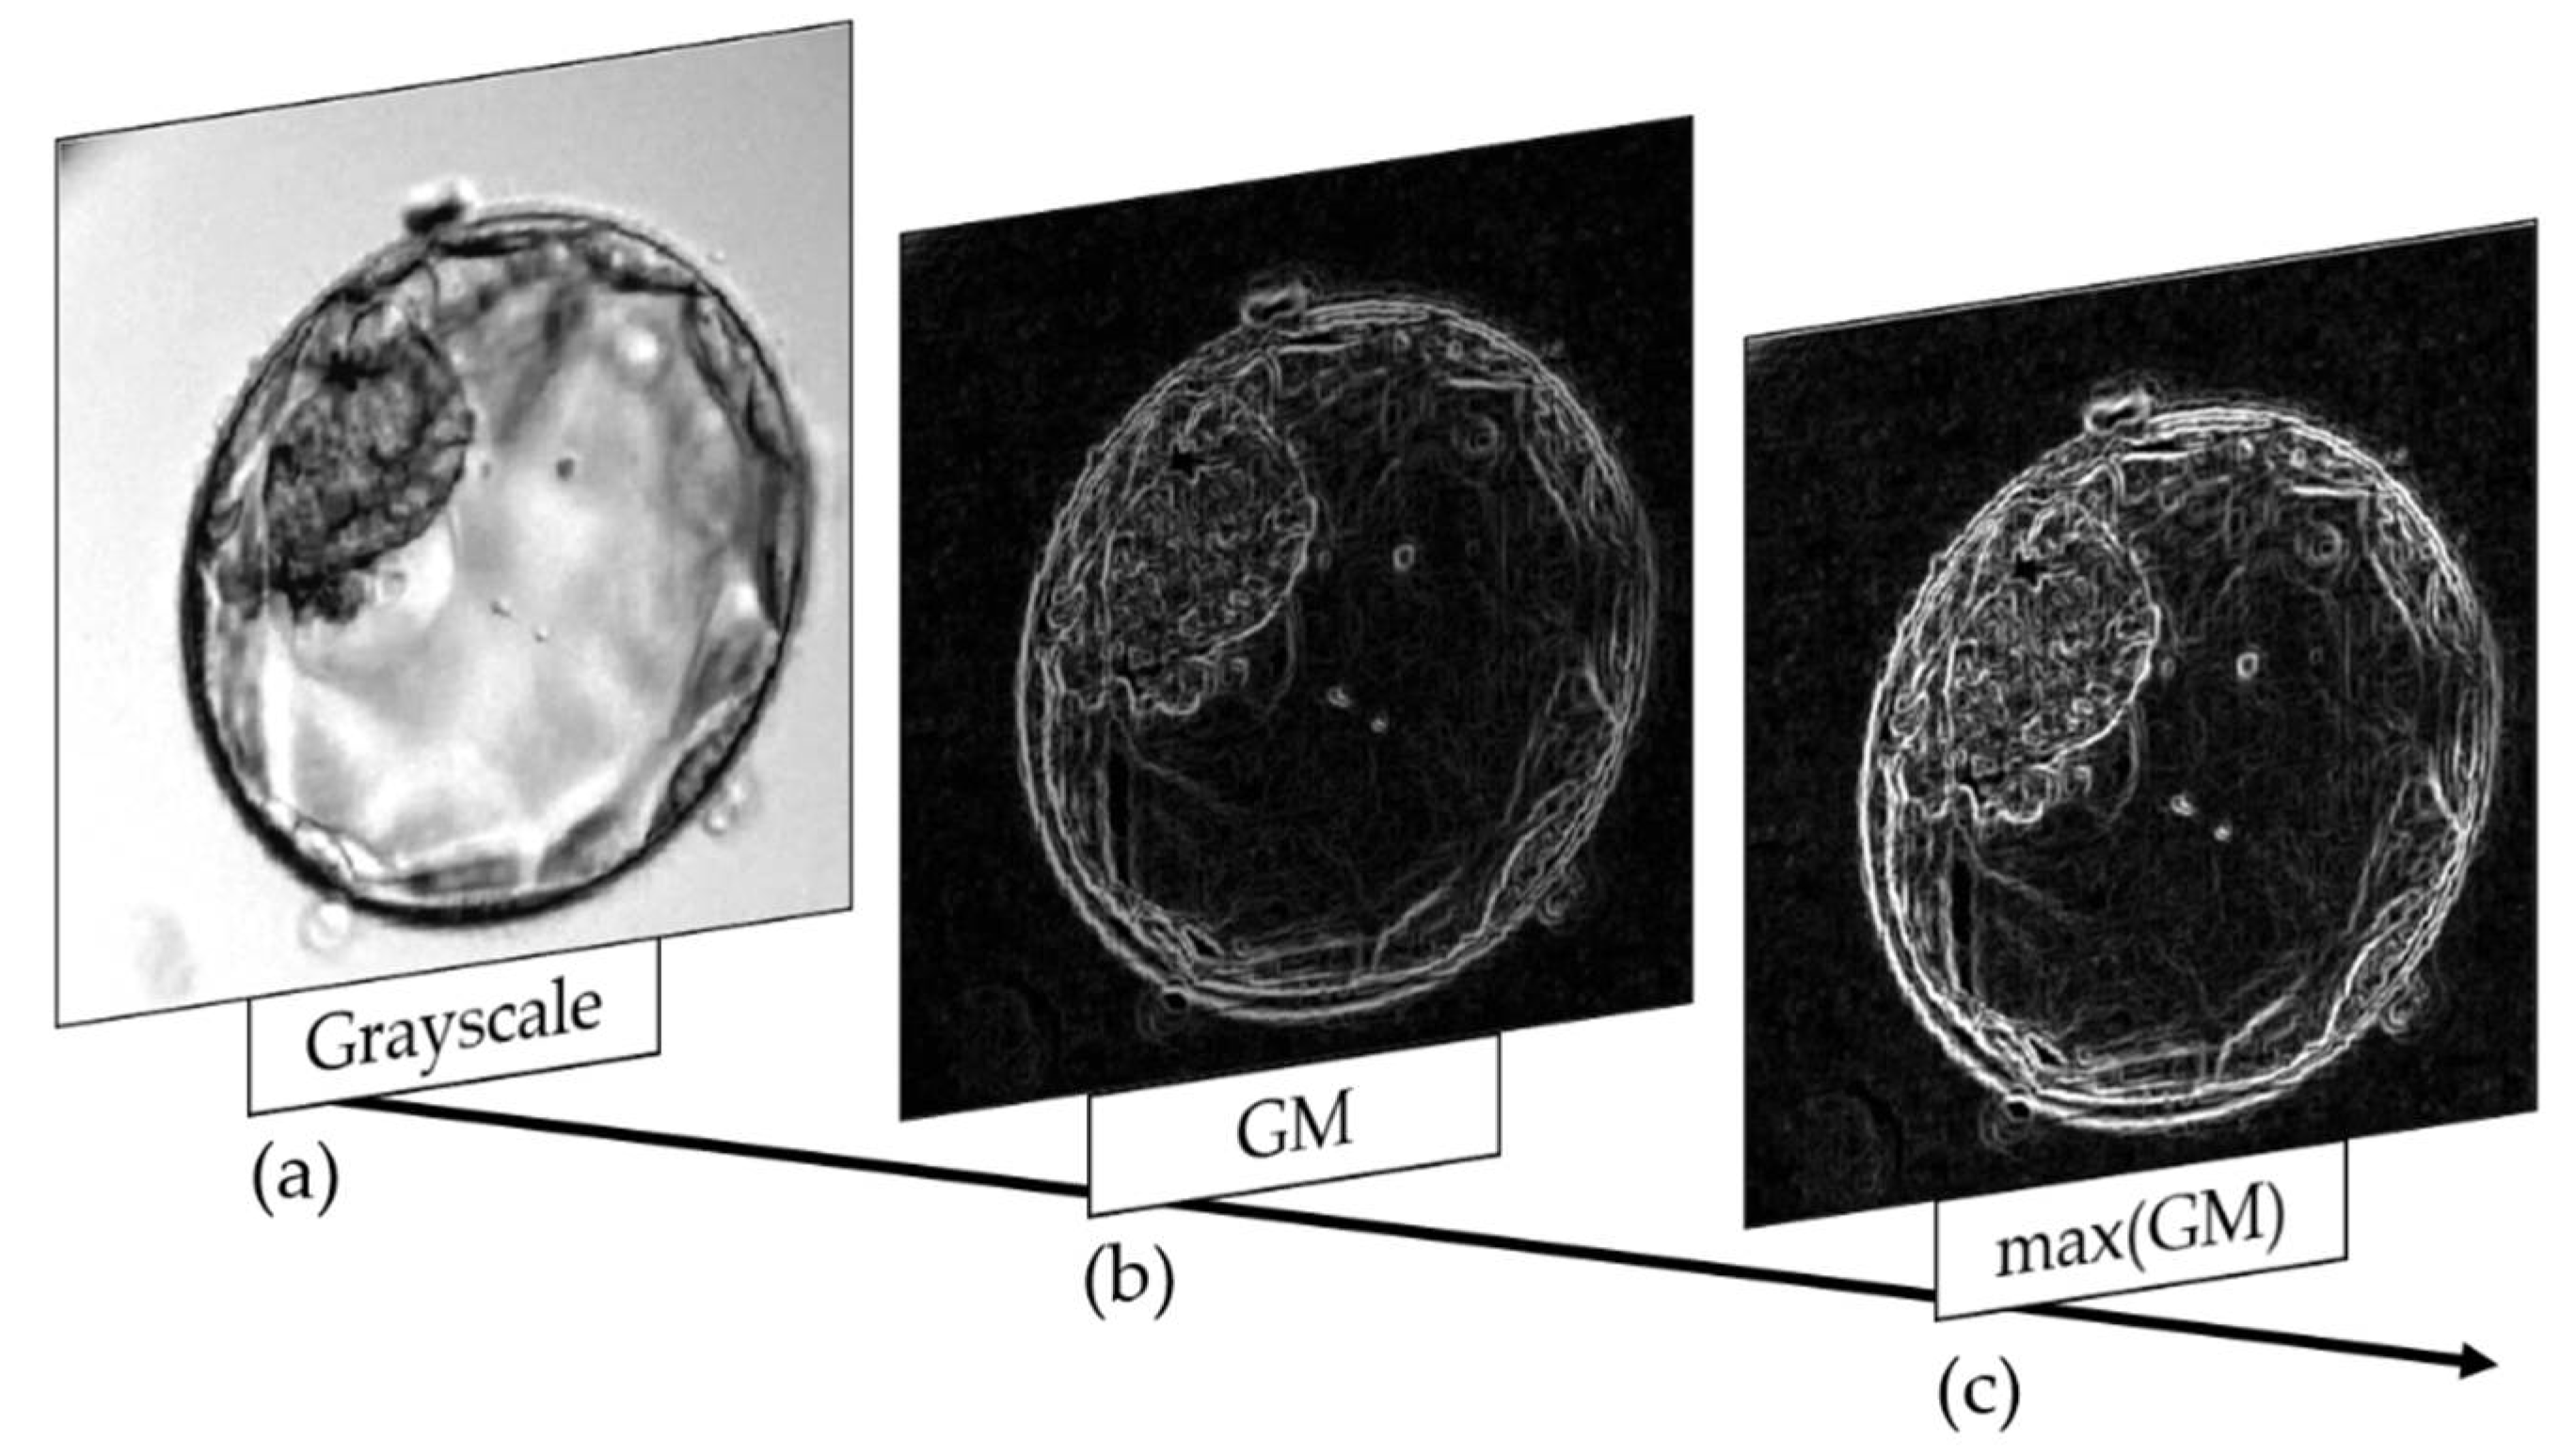
2.8. Maxima of Gradient Magnitude
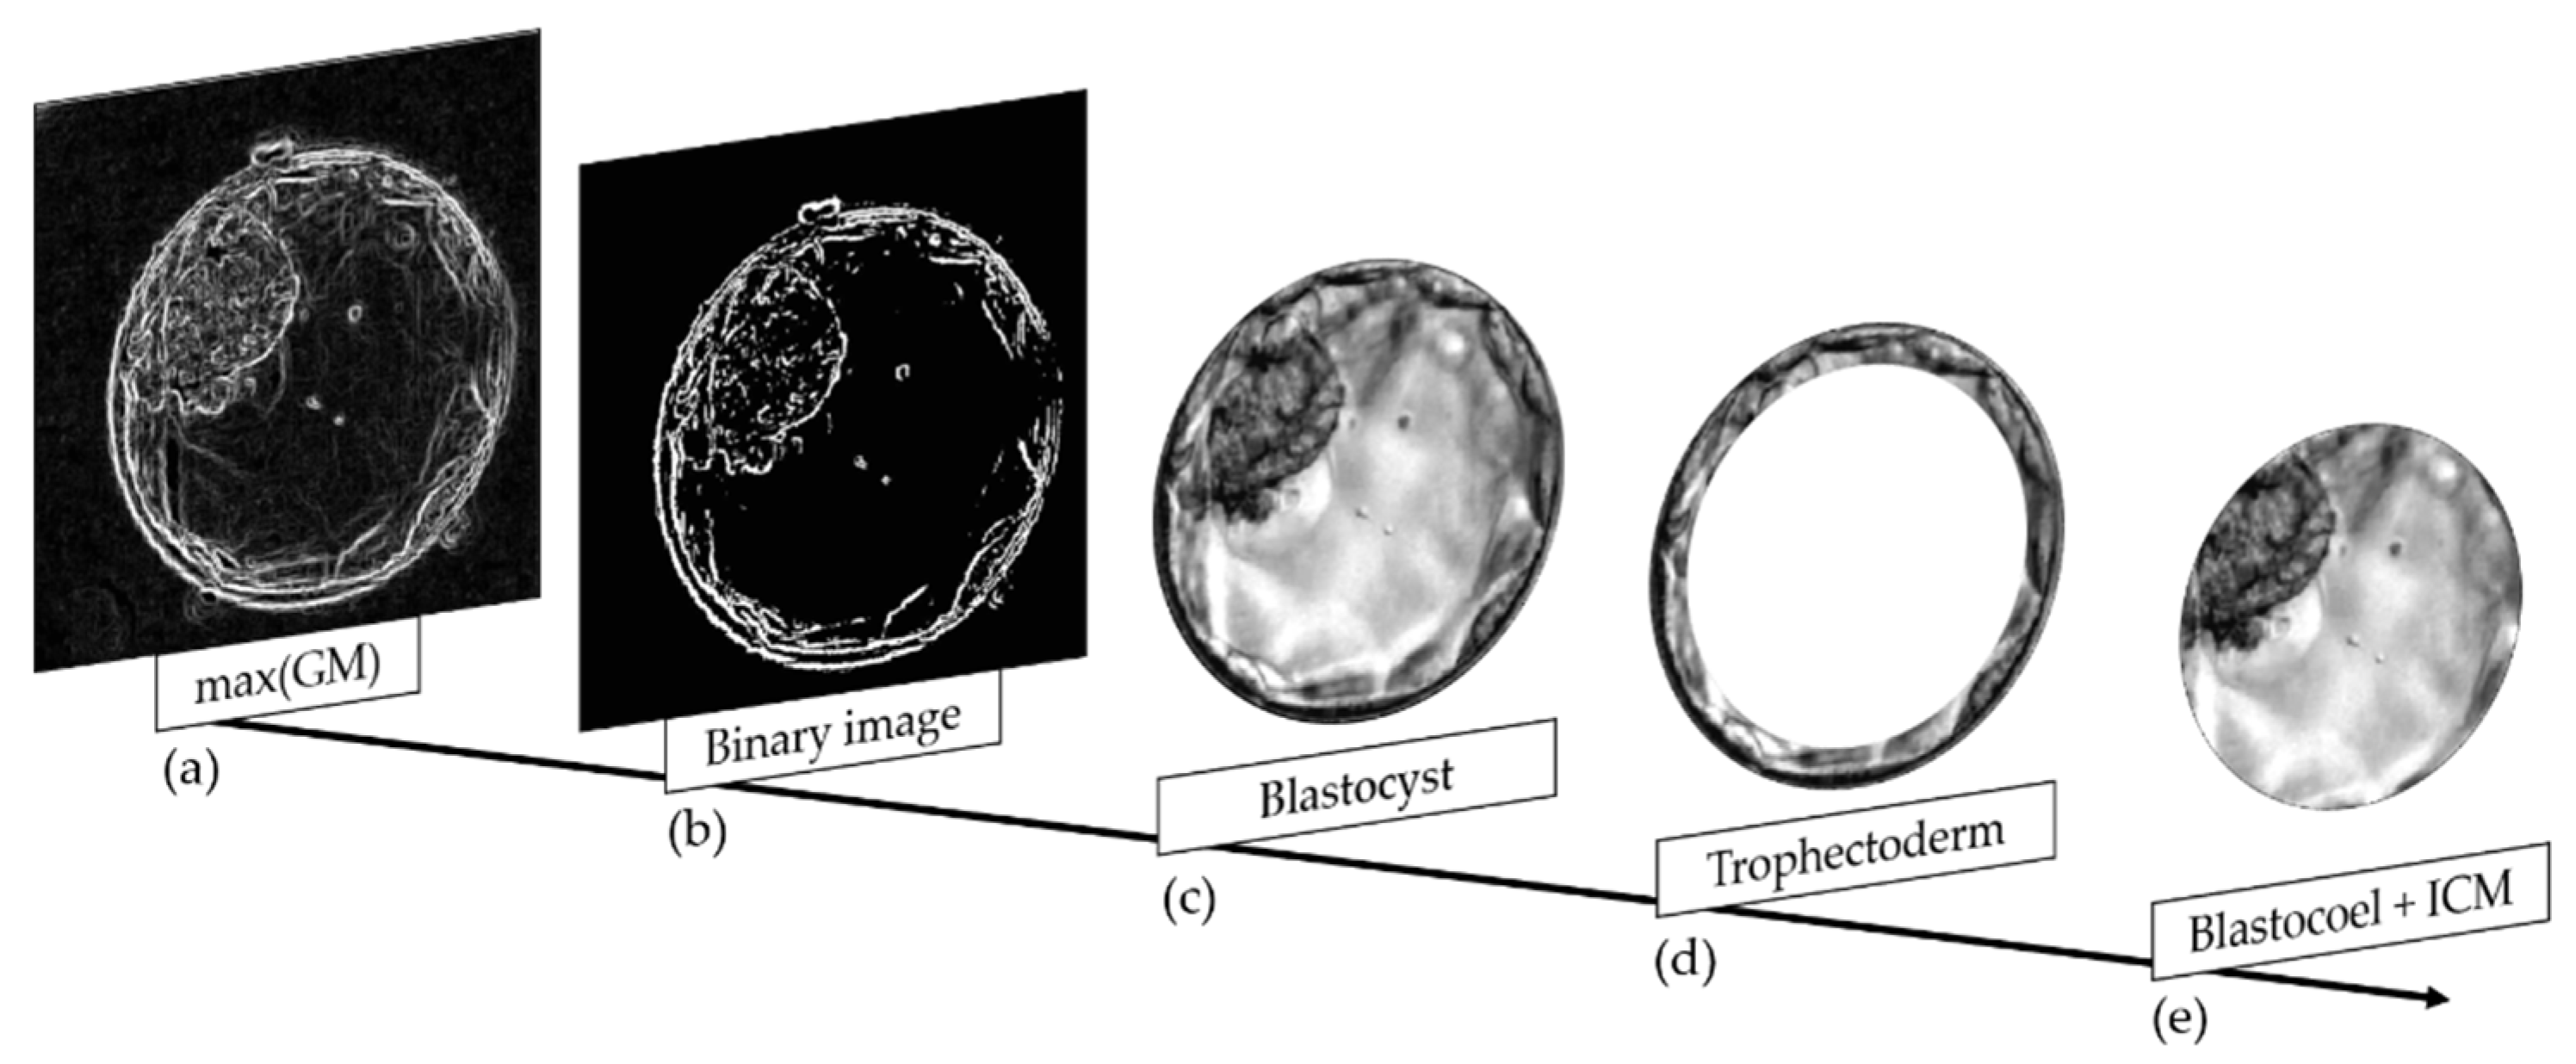
2.9. Binary Image Construction
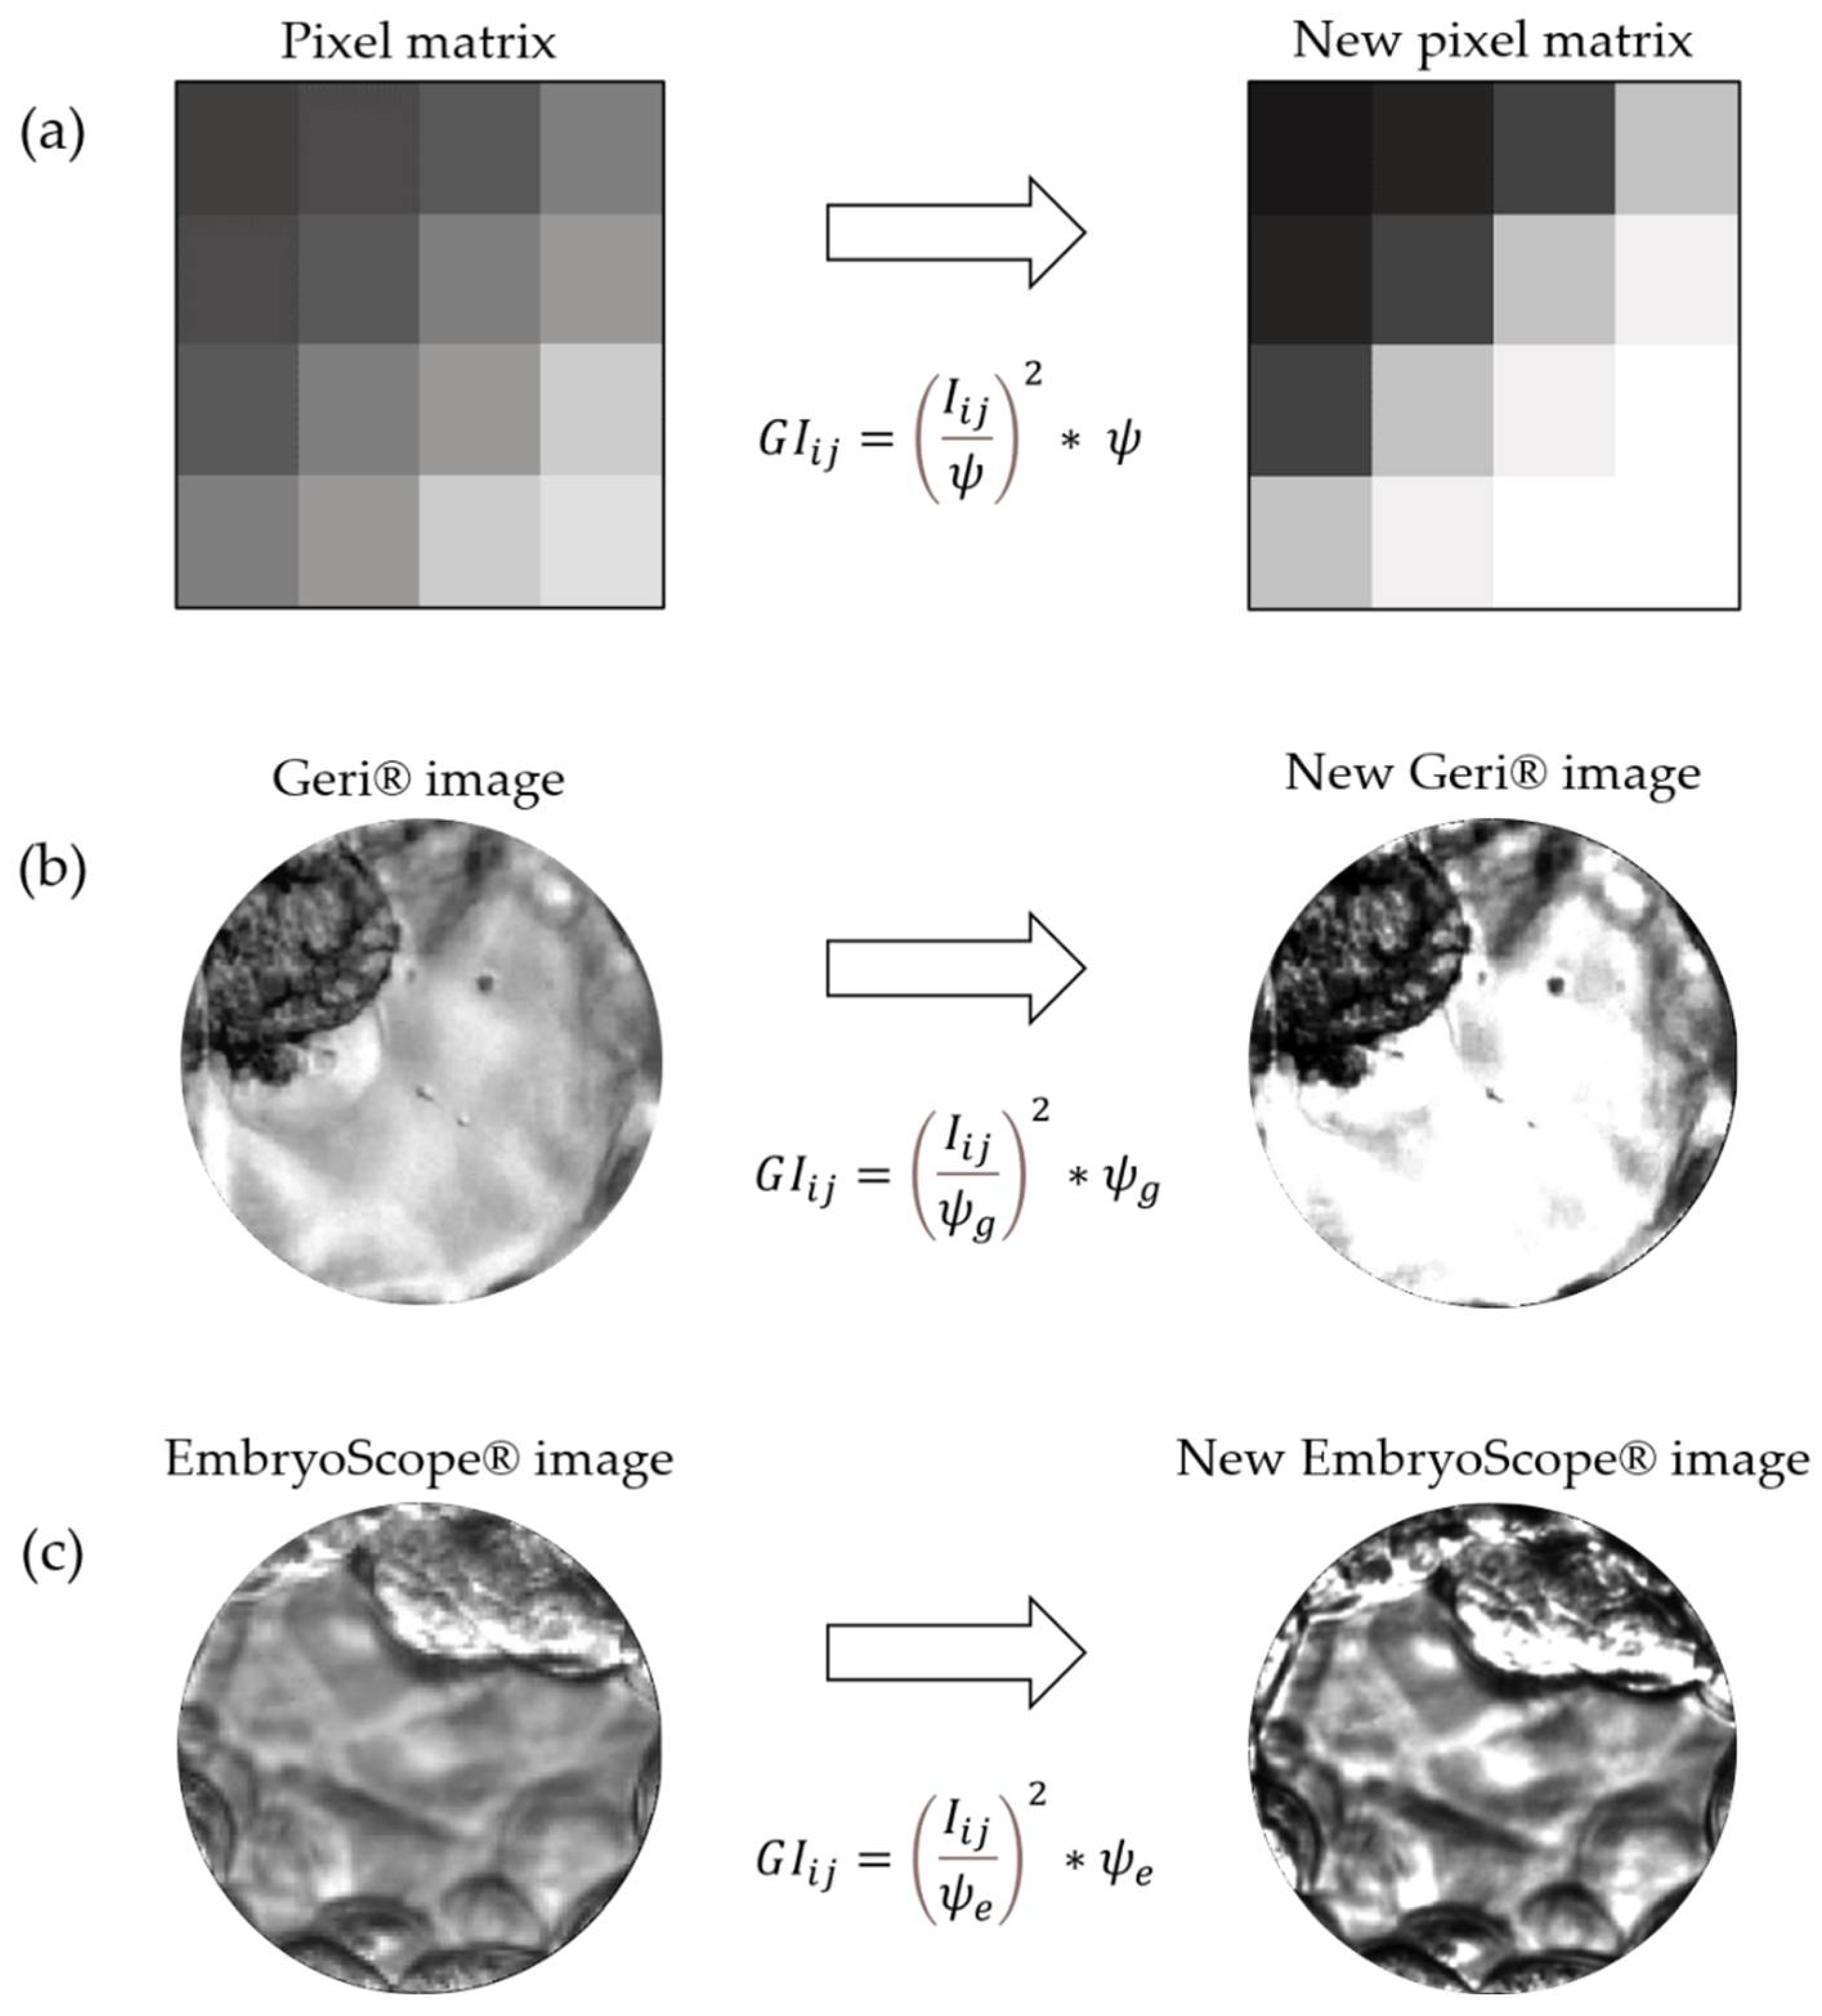
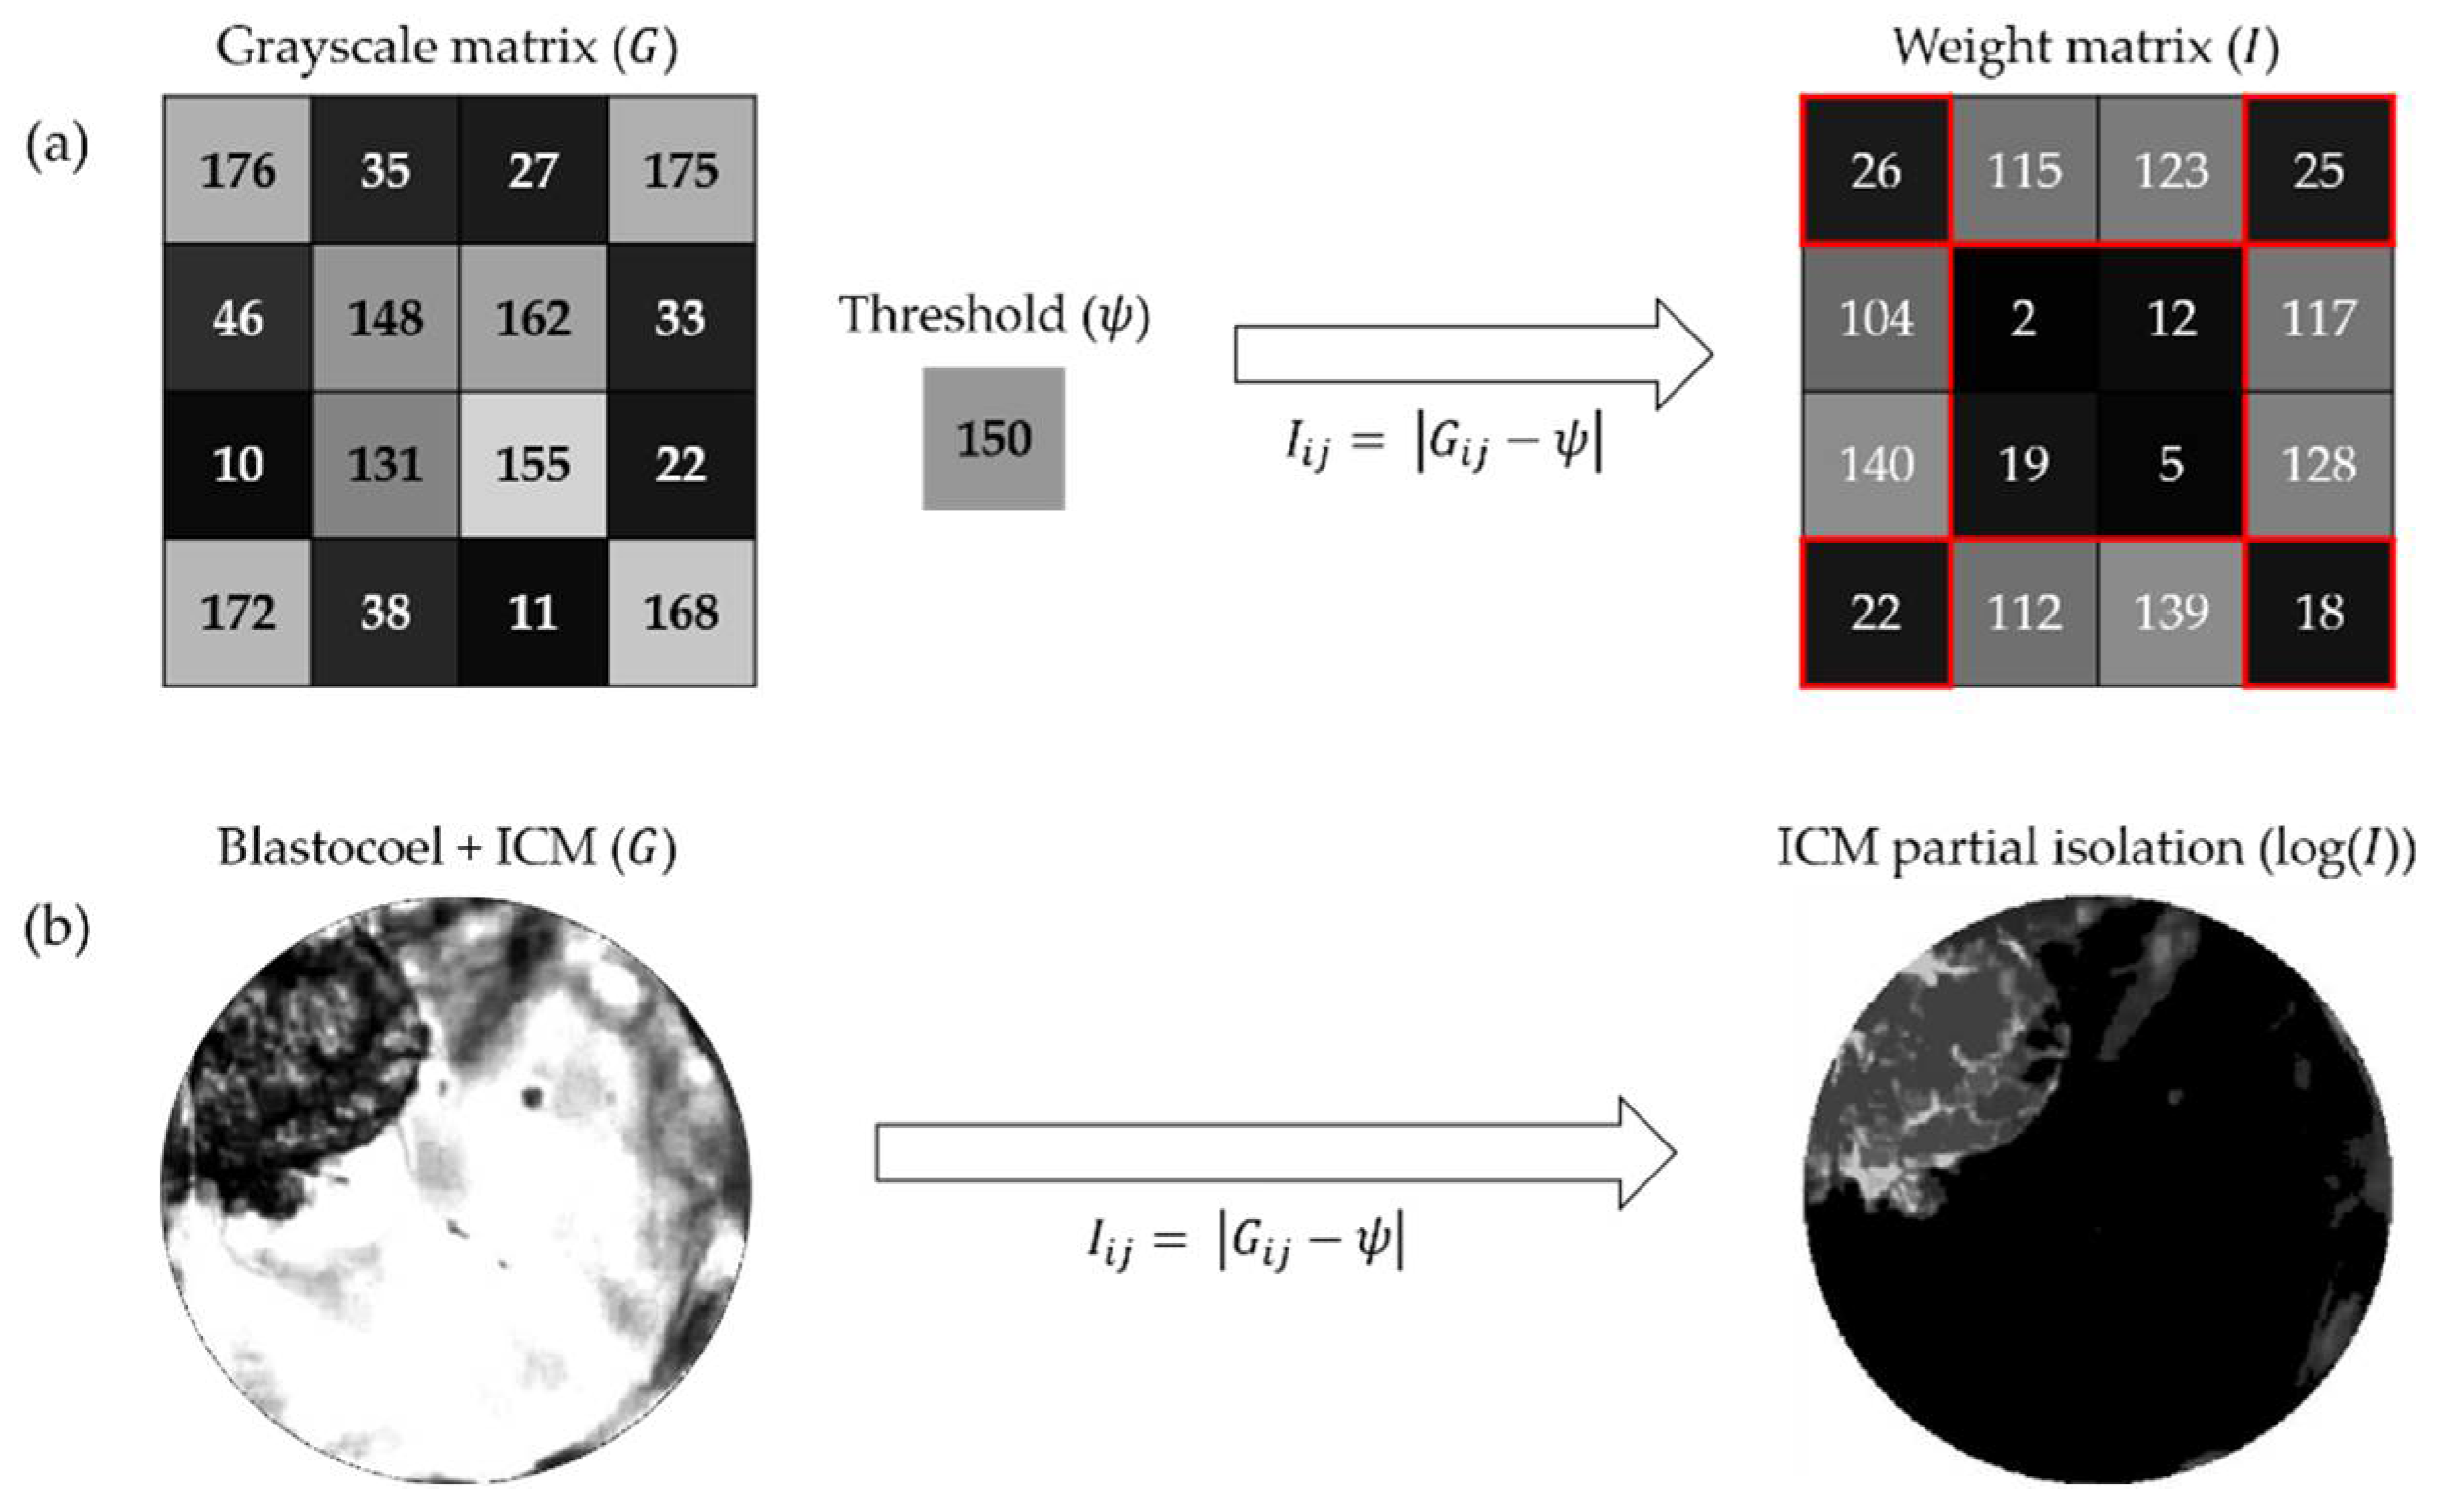
2.10. Grayscale Intensification
- : grayscale pixel matrix.
- : threshold.
- : matrix containing the converted values of .
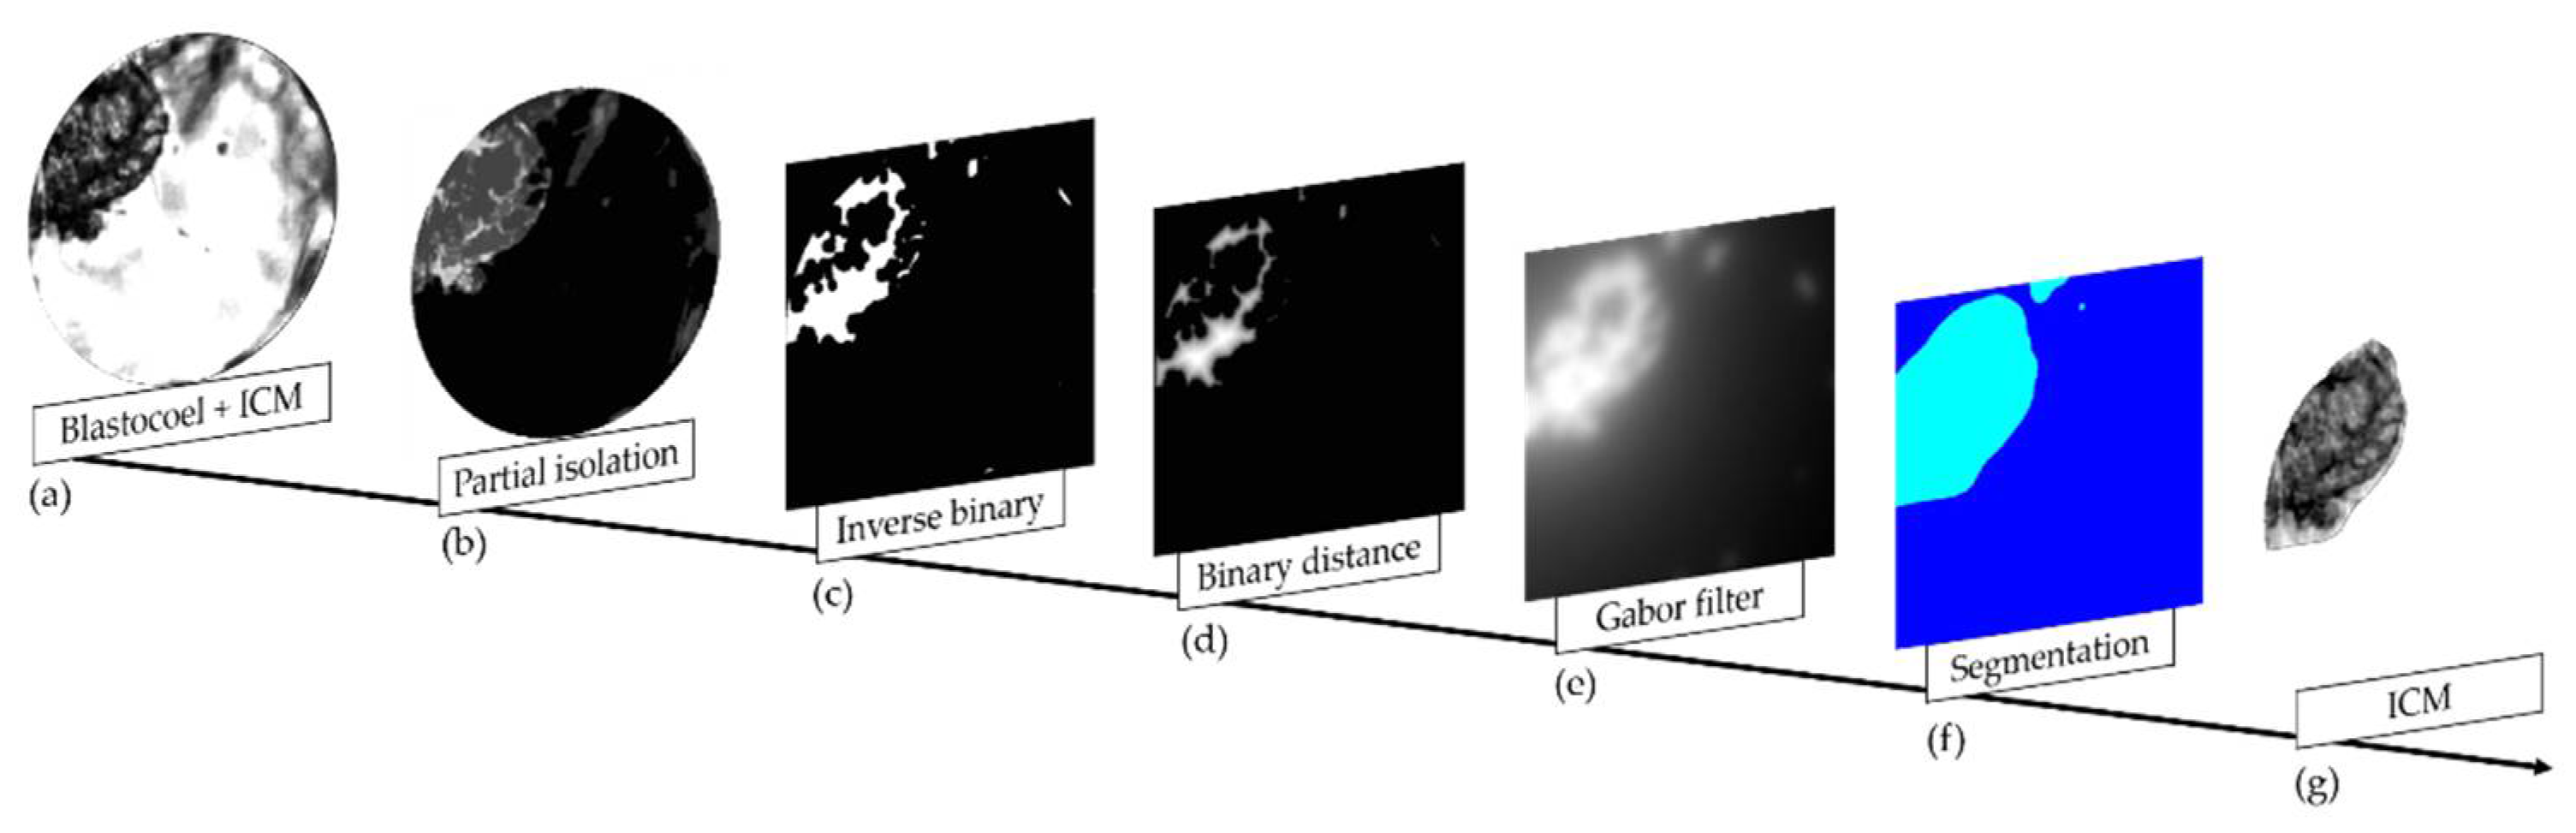
2.11. ICM Partial Isolation Based on the Grayscale
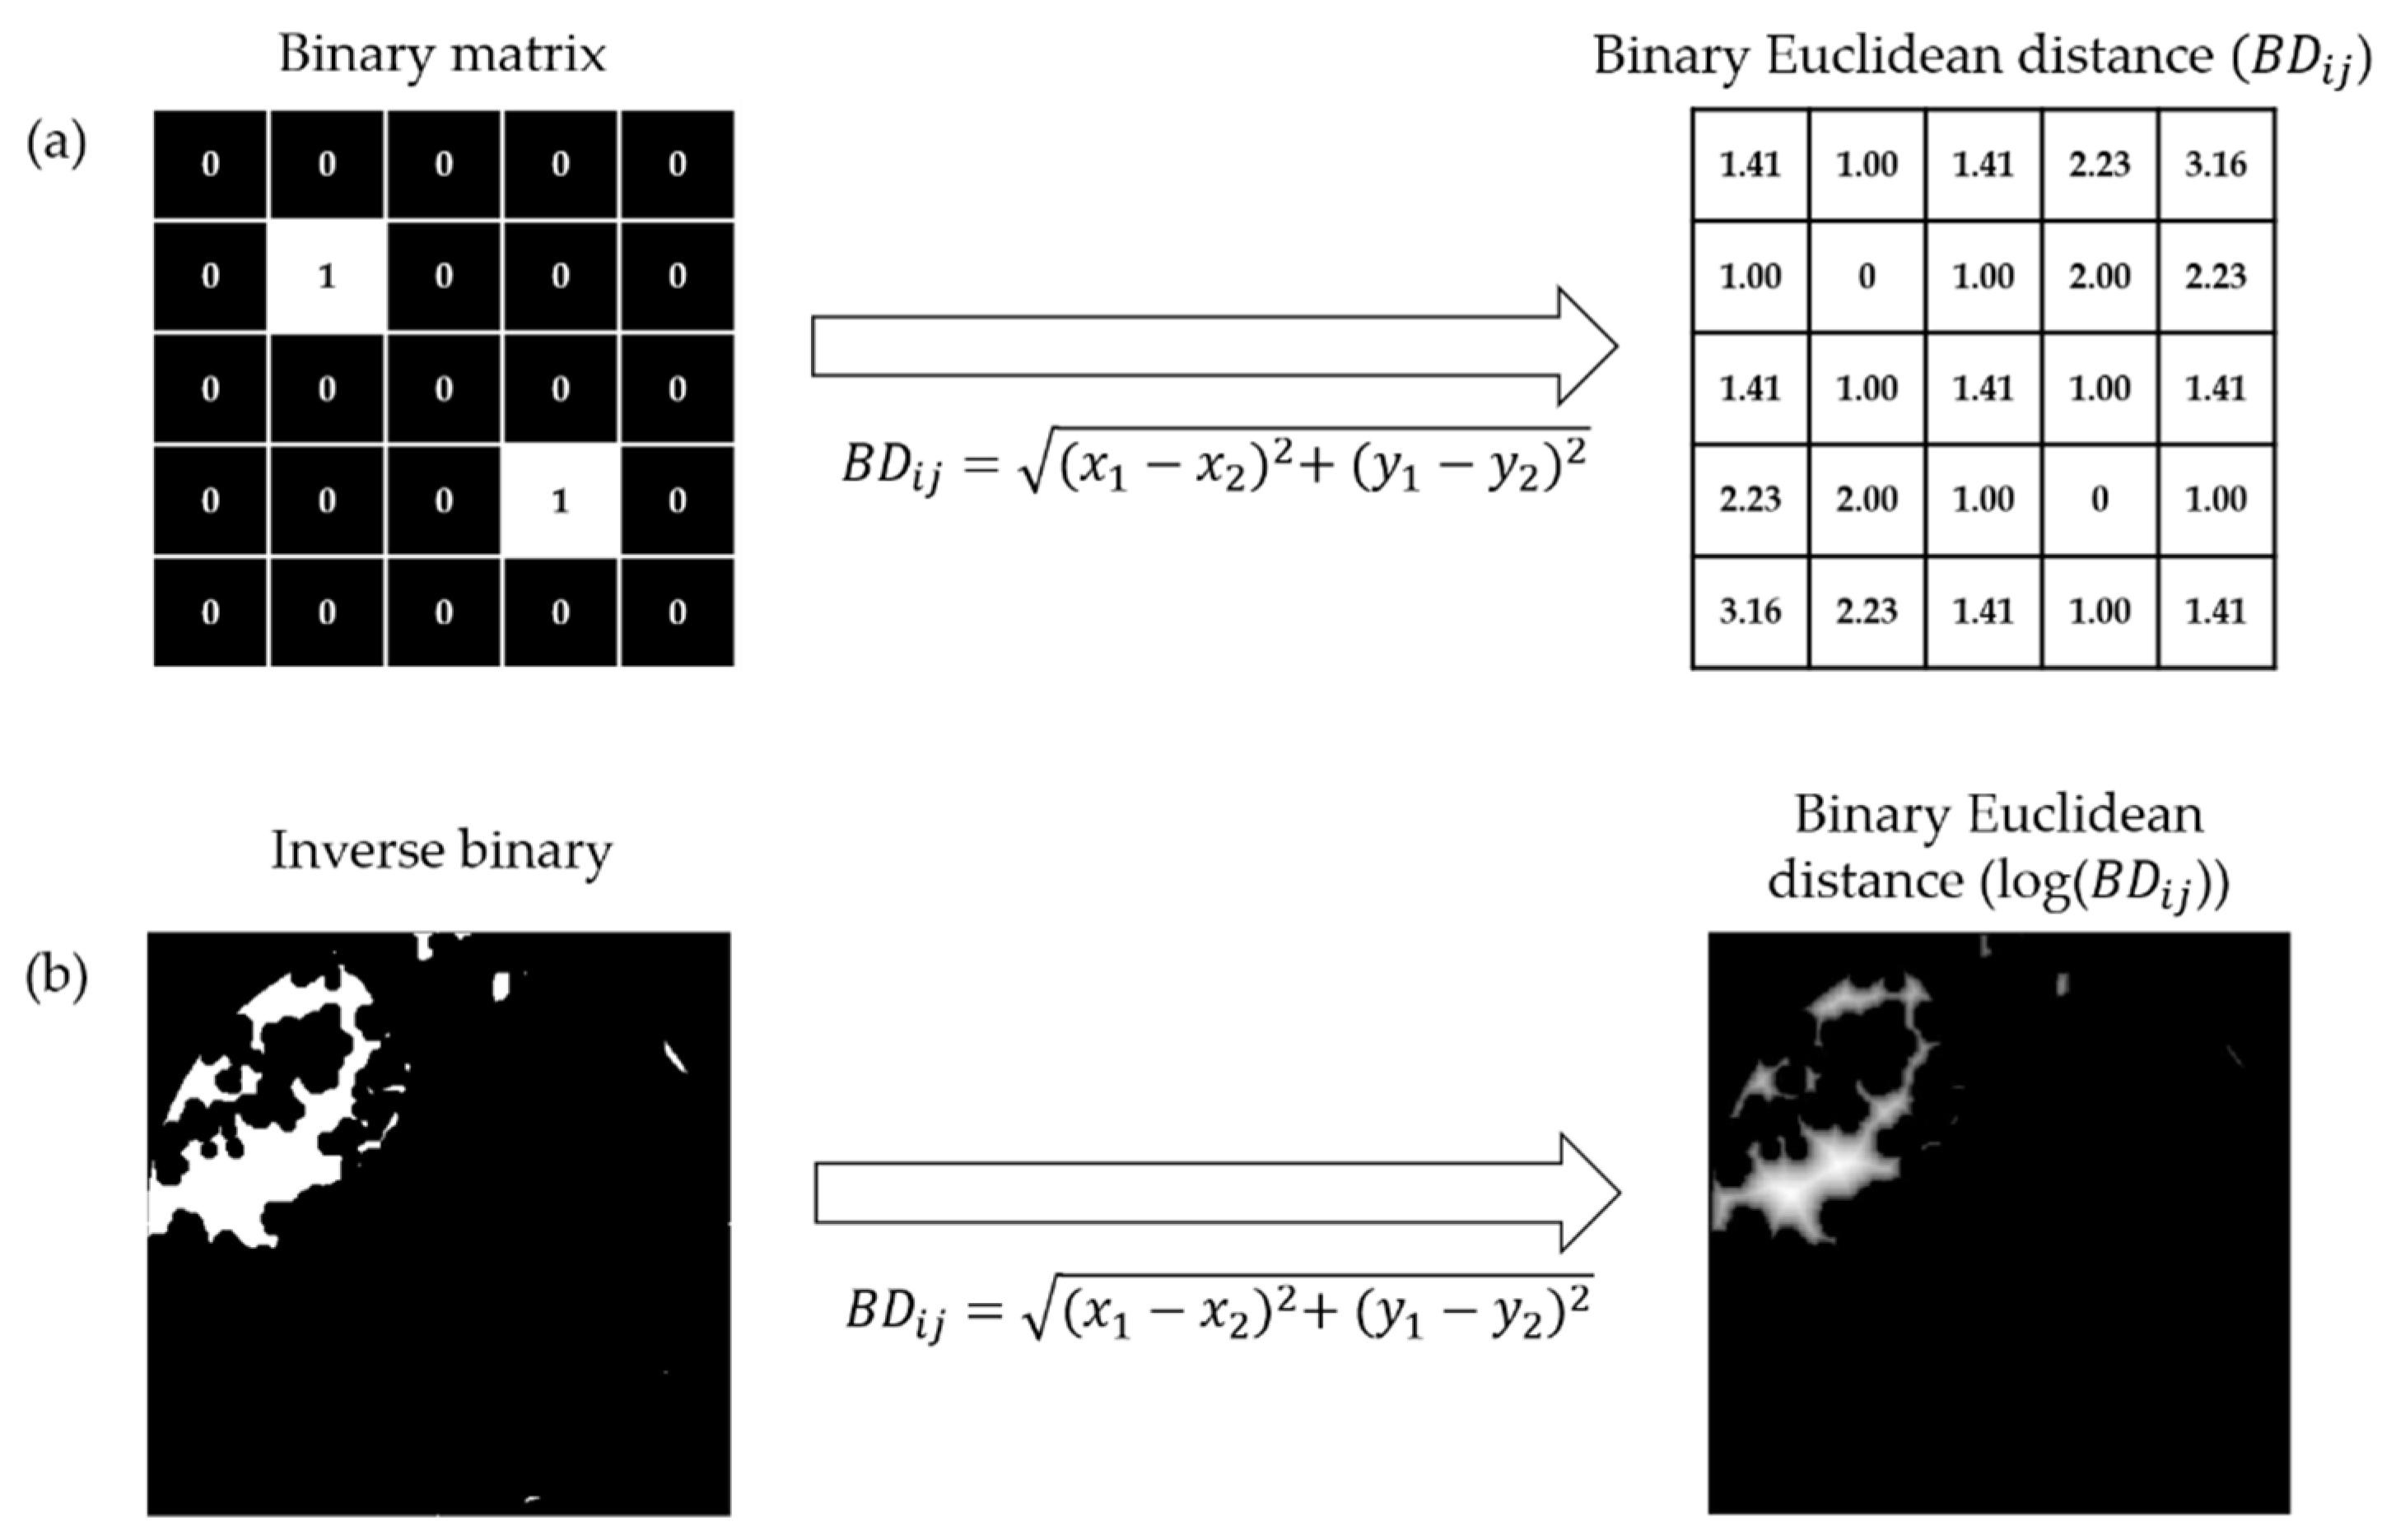
2.12. Determination of Binary Distance
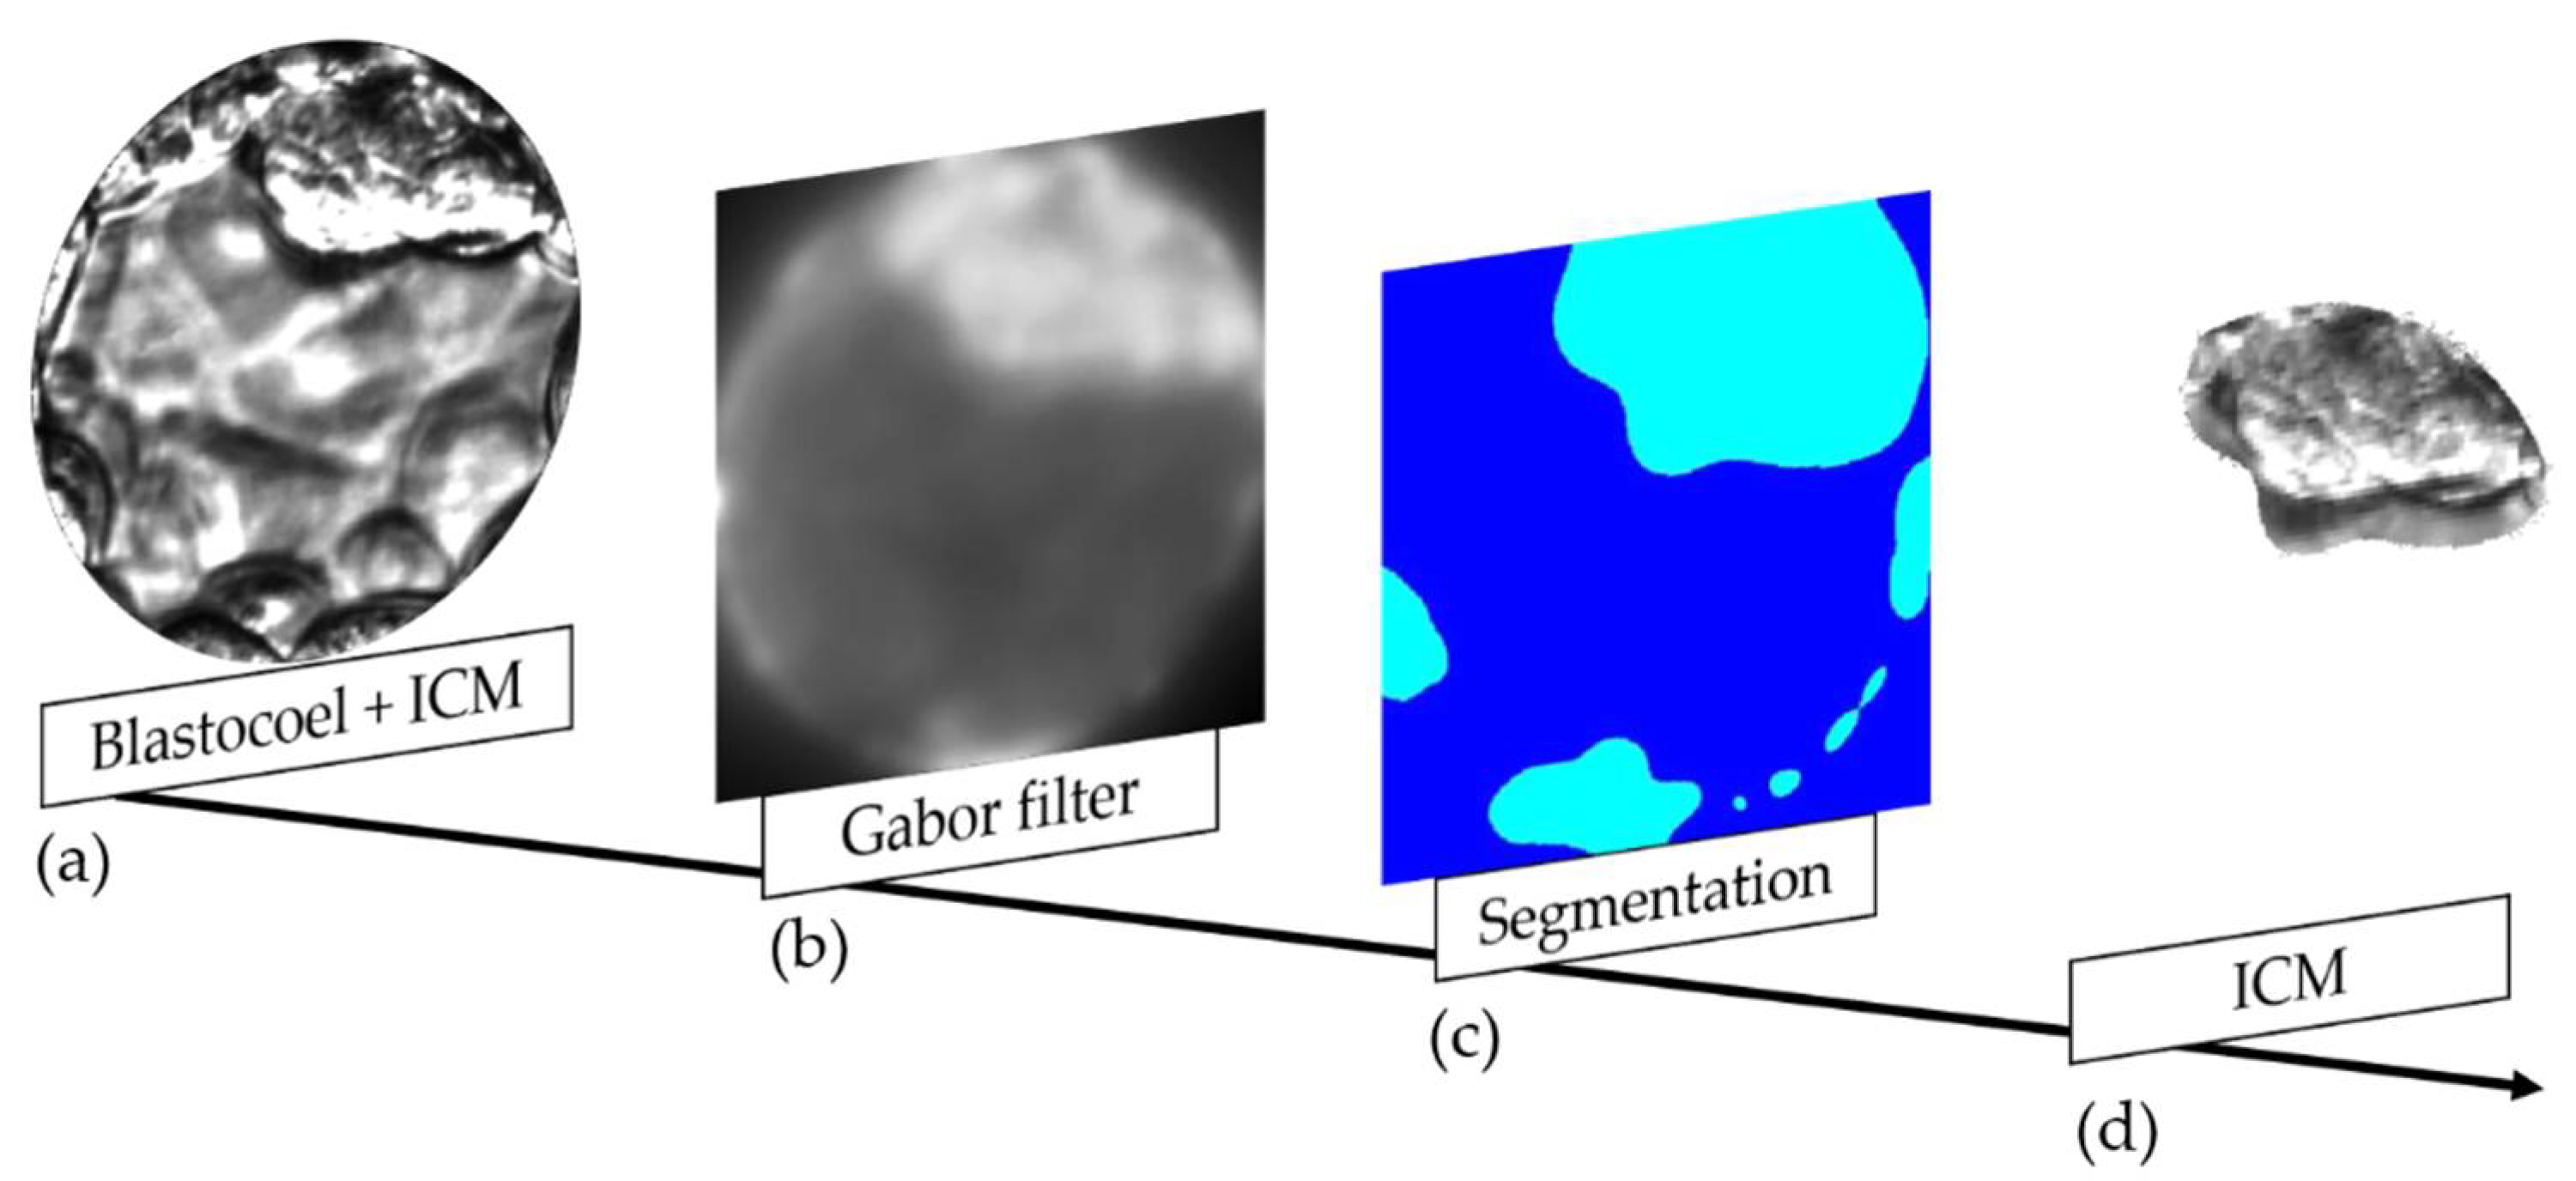
2.13. ICM Isolation by Gabor Filter
2.14. Evaluation of the Image Segmentation
3. Results
Variable Definitions
- 1.
- Texture variation in ICM and blastocoel
- 2.
- Texture similarities in ICM and blastocoel
- 3.
- Uniformity of the gray-level distribution in ICM and blastocoel
- 4.
- Proximity of the grayscale to the GLCM diagonal in ICM and blastocoel
- 5.
- Texture variation in ICM
- 6.
- Texture similarities in ICM
- 7.
- Uniformity of gray-level distribution in ICM
- 8.
- Proximity of the grayscale to the GLCM diagonal in ICM
- 9.
- Texture variation in TE
- 10.
- Texture similarities in TE
- 11.
- Uniformity of the gray-level distribution in TE
- 12.
- Proximity of the grayscale to the GLCM diagonal in TE
- 13.
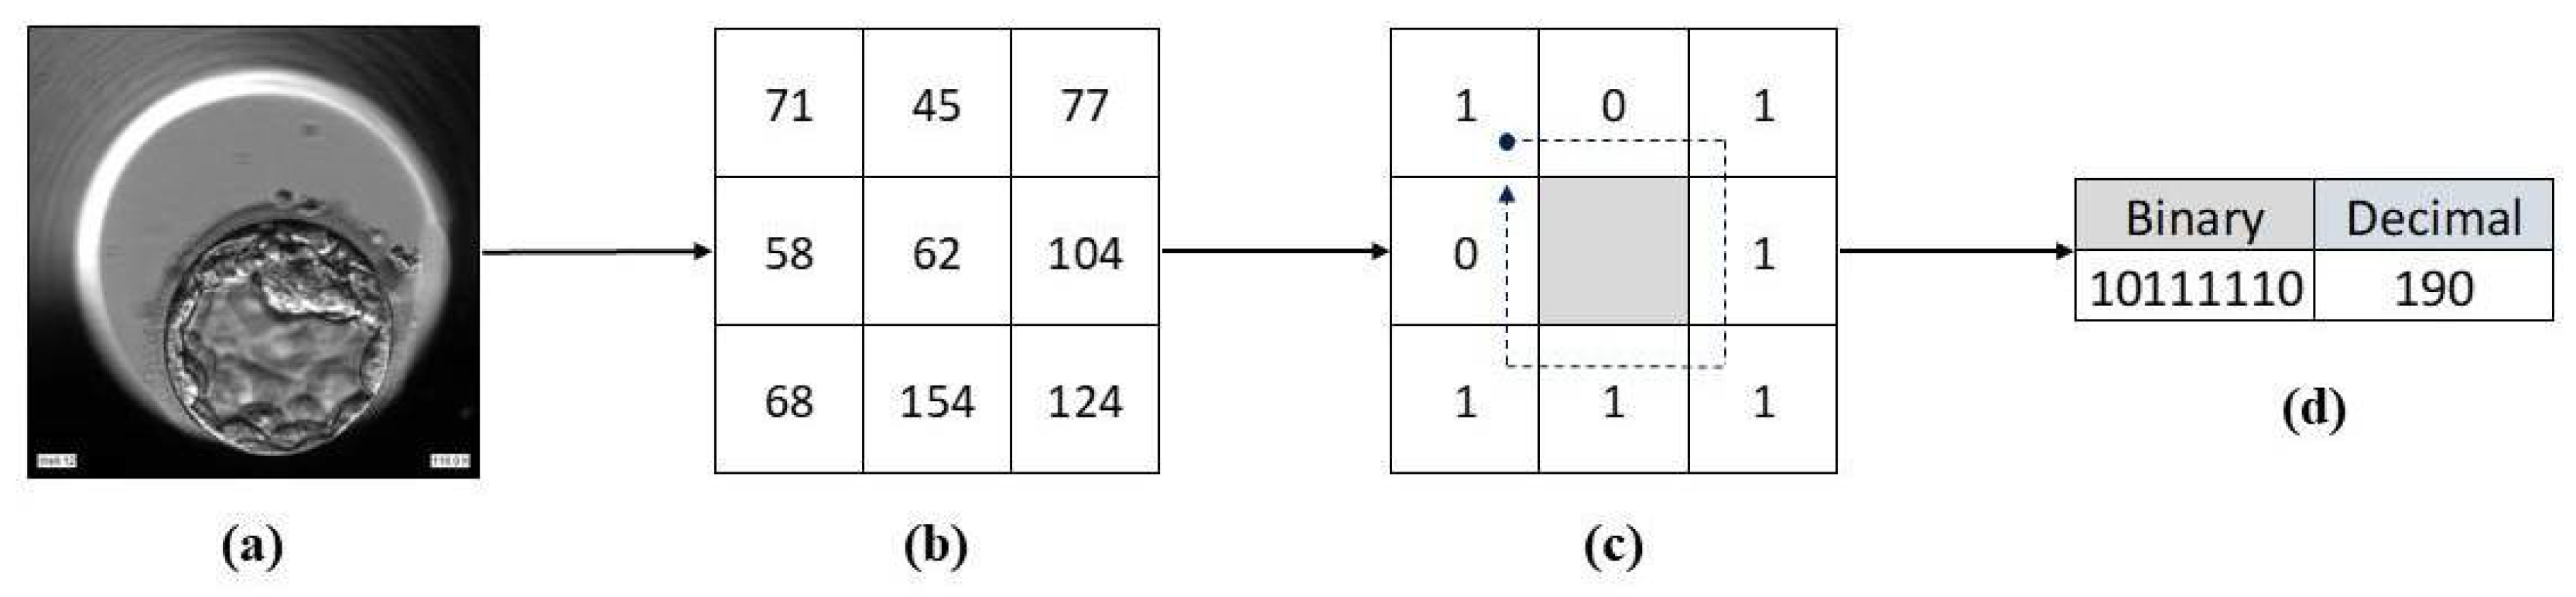
- Local texture descriptor in EX
- 14.
- Local texture descriptor in ICM
- 15.
- Local texture descriptor in TE
- 16.
- Gray-level average in ICM and blastocoel
- 17.
- Gray-level average in TE
- 18.
- Blastocyst gray-level average
- 19.
- Gray-level standard deviation in ICM and blastocoel
- 20.
- Gray-level standard deviation in TE
- 21.
- Modal value in ICM and blastocoel
- 22.
- Modal value in TE
- 23.
- Blastocyst sum of binary image
- 24.
- Blastocyst radius
- 25.
- ICM area
- 26.
- Blastocoel area
- 27.
- Ratio between ICM and blastocoel
- 28.
- Mean luminosity in ICM and blastocoel
- 29.
- Mean luminosity in TE
- 30.
- Brightest region in ICM and blastocoel
- 31.
- Brightest region in TE
- 32.
- Darkest region in ICM and blastocoel
- 33.
- Darkest region in TE
4. Discussion
Supplementary Materials
Author Contributions
Funding
Institutional Review Board Statement
Informed Consent Statement
Data Availability Statement
Conflicts of Interest
References
- Swain, J.; Vermilyea, M.T.; Meseguer, M.; Ezcurra, D.; Fertility AI Forum Group. AI in the treatment of fertility: Key considerations. J. Assist. Reprod. Genet. 2020, 37, 2817–2824. [Google Scholar] [CrossRef] [PubMed]
- Bormann, C.L.; Curchoe, C.L.; Thirumalaraju, P.; Kanakasabapathy, M.K.; Gupta, R.; Pooniwala, R.; Kandula, H.; Souter, I.; Dimitriadis, I.; Shafiee, H. Deep learning early warning system for embryo culture conditions and embryologist performance in the ART laboratory. J. Assist. Reprod. Genet. 2021, 38, 1641–1646. [Google Scholar] [CrossRef] [PubMed]
- Letterie, G. Three ways of knowing: The integration of clinical expertise, evidence-based medicine, and artificial intelligence in assisted reproductive technologies. J. Assist. Reprod. Genet. 2021, 38, 1617–1625. [Google Scholar] [CrossRef] [PubMed]
- Louis, C.M.; Erwin, A.; Handayani, N.; Polim, A.A.; Boediono, A.; Sini, I. Review of computer vision application in in vitro fertilization: The application of deep learning-based computer vision technology in the world of IVF. J. Assist. Reprod. Genet. 2021, 38, 1627–1639. [Google Scholar] [CrossRef] [PubMed]
- Zaninovic, N.; Rosenwaks, Z. Artificial intelligence in human in vitro fertilization and embryology. Fertil. Steril. 2020, 114, 914–920. [Google Scholar] [CrossRef]
- Giscard d’Estaing, S.; Labrune, E.; Forcellini, M.; Edel, C.; Salle, B.; Lornage, J.; Benchaib, M. A machine learning system with reinforcement capacity for predicting the fate of an ART embryo. Syst. Biol. Reprod. Med. 2021, 67, 64–78. [Google Scholar] [CrossRef]
- Chéles, D.S.; Molin, E.A.D.; Rocha, J.C.; Nogueira, M.F.G. Mining of variables from embryo morphokinetics, blastocyst’s morphology and patient parameters: An approach to predict the live birth in the assisted reproduction service. JBRA Assist. Reprod. 2020, 24, 470–479. [Google Scholar] [CrossRef]
- Fernandez, E.I.; Ferreira, A.S.; Cecílio, M.H.M.; Chéles, D.; De Souza, R.C.M.; Nogueira, M.F.G.; Rocha, J.C. Artificial intelligence in the IVF laboratory: Overview through the application of different types of algorithms for the classification of reproductive data. J. Assist. Reprod. Genet. 2020, 37, 2359–2376. [Google Scholar] [CrossRef]
- Yang, S.-H.; Wu, C.-H.; Chen, Y.-C.; Yang, C.-K.; Wu, T.-H.; Chen, P.-C.; Tsai, H.-D. Effect of morphokinetics and morphological dynamics of cleavage stage on embryo developmental potential: A time-lapse study. Taiwan J. Obstet. Gynecol. 2018, 57, 76–82. [Google Scholar] [CrossRef]
- Strouthopoulos, C.; Anifandis, G. An automated blastomere identification method for the evaluation of day 2 embryos during IVF/ICSI treatments. Comput. Methods Programs Biomed. 2018, 156, 53–59. [Google Scholar] [CrossRef]
- Patil, S.N.; Wali, U.V.; Swamy, M.K. Application of vessel enhancement for automated classification of human in vitro-fertilized (IVF) images. In Proceedings of the International Conference on Electrical, Electronics, Communication, Computer and Optimization Techniques (ICEECCOT), Mysuru, India, 9–10 December 2016; pp. 27–36. [Google Scholar]
- Montag, M.; Toth, B.; Strowitzki, T. New approaches to embryo selection. Reprod. Biomed. Online 2013, 27, 539–546. [Google Scholar] [CrossRef] [PubMed]
- Storr, A.; Venetis, C.; Cooke, S.; Kilani, S.; Ledger, W. Inter-observer and intra-observer agreement between embryologists during selection of a single Day 5 embryo for transfer: A multicenter study. Hum. Reprod. 2016, 32, 307–314. [Google Scholar] [CrossRef] [PubMed]
- Friedenthal, J.; Hernandez-Nieto, C.; Roth, R.M.; Slifkin, R.; Gounko, D.; Lee, J.A.; Nazem, T.; Briton-Jones, C.; Copperman, A. Clinical implementation of algorithm-based embryo selection is associated with improved pregnancy outcomes in single vitrified warmed euploid embryo transfers. J. Assist. Reprod. Genet. 2021, 38, 1647–1653. [Google Scholar] [CrossRef] [PubMed]
- Bormann, C.L.; Thirumalaraju, P.; Kanakasabapathy, M.K.; Kandula, H.; Souter, I.; Dimitriadis, I.; Gupta, R.; Pooniwala, R.; Shafiee, H. Consistency and objectivity of automated embryo assessments using deep neural networks. Fertil. Steril. 2020, 113, 781–787. [Google Scholar] [CrossRef] [Green Version]
- Gonzalez, R.C.; Woods, R.E. Digital Image Processing, 3rd ed.; Pearson: Upper Saddle River, NJ, USA, 2007. [Google Scholar]
- Rocha, J.C.; Passalia, F.J.; Matos, F.D.; Maserati, M.P., Jr.; Alves, M.F.; De Almeida, T.G.; Cardoso, B.L.; Basso, A.C.; Nogueira, M.F.G. Methods for assessing the quality of mammalian embryos: How far we are from the gold standard? JBRA Assist. Reprod. 2016, 20, 150–158. [Google Scholar] [CrossRef]
- Gardner, D.K.; Schoolcraft, W.B. In Vitro culture of human blastocysts. In Towards Reproductive Certainty: Fertility and Genetics Beyond; Jansen, R., Mortimer, D., Eds.; Parthenon Press: Carnforth, UK, 1999; pp. 377–388. [Google Scholar]
- Puga-Torres, T.; Blum-Rojas, X.; Blum-Narváez, M. Blastocyst classification systems used in Latin America: Is a consensus possible? JBRA Assist. Reprod. 2017, 21, 222–229. [Google Scholar] [CrossRef] [Green Version]
- Machtinger, R.; Racowsky, C. Morphological systems of human embryo assessment and clinical evidence. Reprod. Biomed. Online 2013, 26, 210–221. [Google Scholar] [CrossRef] [Green Version]
- Rocha, J.C.; Passalia, F.J.; Matos, F.D.; Takahashi, M.B.; Maserati, M.P., Jr.; Alves, M.F.; De Almeida, T.G.; Cardoso, B.L.; Basso, A.C.; Nogueira, M.F.G. Automatized image processing of bovine blastocysts produced in vitro for quantitative variable determination. Sci. Data 2017, 4, 170192. [Google Scholar] [CrossRef]
- Rocafort, E.; Enciso, M.; Leza, A.; Sarasa, J.; Aizpurua, J. Euploid embryos selected by an automated time-lapse system have superior SET outcomes than selected solely by conventional morphology assessment. J. Assist. Reprod. Genet. 2018, 35, 1573–1583. [Google Scholar] [CrossRef]
- Santos Filho, E.; Noble, J.A.; Poli, M.; Griffiths, T.; Emerson, G.; Wells, D. A method for semi-automatic grading of human blastocyst microscope images. Hum. Reprod. 2012, 27, 2641–2648. [Google Scholar] [CrossRef] [Green Version]
- Singh, A.; Au, J.; Saeedi, P.; Havelock, J. Automatic segmentation of trophectoderm in microscopic images of human blastocysts. IEEE Trans. Biomed. Eng. 2015, 62, 382–393. [Google Scholar] [CrossRef] [PubMed]
- Matos, F.D.; Rocha, J.C.; Nogueira, M.F.G. A method using artificial neural networks to morphologically assess mouse blastocyst quality. J. Anim. Sci. Technol. 2014, 56, 15. [Google Scholar] [CrossRef] [PubMed] [Green Version]
- Sciorio, R.; Meseguer, M. Focus on time-lapse analysis: Blastocyst collapse and morphometric assessment as new features of embryo viability. Reprod. Biomed. Online 2021, 43, 821–832. [Google Scholar] [CrossRef] [PubMed]
- Leung, A.S.; Son, W.Y.; Dahan, M.H. Time-lapse imaging of embryos: Current evidence supporting its use. Expert Rev. Med. Devices 2016, 13, 881–883. [Google Scholar] [CrossRef] [Green Version]
- Virmani, J.; Singh, G.P.; Singh, Y. PNN-Based Classification of Retinal Diseases Using Fundus Image. Sens. Health Monit. 2019, 5, 215–242. [Google Scholar]
- The MathWorks Inc. Image Processing ToolboxTM User’s Guide; The MathWorks: Natick, MA, USA, 2019; 1614p. [Google Scholar]
- Santos, L.A. Aplicação do processamento de imagem digital para a detecção de câncer de mama. In Anais da Mostra Nacional de Robótica, Proceedings of the Mostra Nacional de Robótica 2018, João Pessoa, Brazil, 6–10 November 2018; Simões, A.S., Colombini, E.L., Tonidandel, F., Eds.; MNR: Sorocaba, Brasil, 2018; pp. 580–582. (In Portuguese) [Google Scholar]
- Sit, B.; Quraishi, I. A review paper on Hough transform and it’s applications in image processing. Int. J. Innov. Res. Sci. Eng. Technol. 2016, 5, 206–213. [Google Scholar]
- Seifozzakerini, S.; Yau, W.-Y.; Mao, K.; Nejati, H. Hough Transform Implementation for Event-Based Systems: Concepts and Challenges. Front. Comput. Neurosci. 2018, 12, 103. [Google Scholar] [CrossRef] [Green Version]
- Hough, P.V. Method and Means for Recognizing Complex Patterns. U.S. Patent 3,069,654, 18 December 1962. [Google Scholar]
- Al-Ameen, Z. Contrast enhancement of medical images using statistical methods with image processing concepts. In Proceedings of the 6th International Engineering Conference “Sustainable Technology and Development” (IEC), Erbil, Iraq, 26–27 February 2020; pp. 169–173. [Google Scholar]
- Xue, W.; Zhang, L.; Mou, X.; Bovik, A.C. Gradient magnitude similarity deviation: A highly efficient perceptual image quality index. IEEE Trans. Image Process. 2014, 23, 684–695. [Google Scholar] [CrossRef] [Green Version]
- Faraji, M.; Shanbehzadeh, J.; Nasrollahi, K.; Moeslund, T.B. Extremal Regions Detection Guided by Maxima of Gradient Magnitude. IEEE Trans. Image Process. 2015, 24, 5401–5415. [Google Scholar] [CrossRef] [Green Version]
- Yang, L.; Wu, X.; Zhao, D.; Li, H.; Zhai, J. An improved Prewitt algorithm for edge detection based on noised image. In Proceedings of the 4th International Congress on Image and Signal Processing, Shanghai, China, 15–17 October 2011; pp. 1197–1200. [Google Scholar]
- Gonzalez, R.C.; Woods, R.E.; Eddins, S.L. Digital Image Processing Using MATLAB, 3rd ed.; Prentice Hall: Upper Saddle River, NJ, USA, 2003. [Google Scholar]
- Muslihah, I.; Muqorobin, M. Texture Characteristic of Local Binary Pattern on Face Recognition with Probabilistic Linear Discriminant Analysis. Int. J. Comput. Inf. Syst. 2020, 1, 22–26. [Google Scholar] [CrossRef]
- The MathWorks Inc. Computer Vision ToolboxTM User’s Guide; The MathWorks: Natick, MA, USA, 2019; 1504p. [Google Scholar]
- Chen, Q.; Yang, X.; Petriu, E.M. Watershed segmentation for binary images with different distance transforms. In Proceedings of the 3rd IEEE International Workshop on Haptic, Audio and Visual Environments and Their Applications, Ottawa, ON, Canada, 2–3 October 2004; pp. 111–116. [Google Scholar]
- Jain, A.K.; Farrokhnia, F. Unsupervised texture segmentation using Gabor filters. Pattern Recognit. 1991, 24, 1167–1186. [Google Scholar] [CrossRef] [Green Version]
- Kim, S.C.; Kang, T.J. Texture classification and segmentation using wavelet packet frame and Gaussian mixture model. Pattern Recognit. 2007, 40, 1207–1221. [Google Scholar] [CrossRef]
- The MathWorks Inc. Statistics and Machine Learning ToolboxTM User’s Guide; The MathWorks: Natick, MA, USA, 2020; 9684p. [Google Scholar]
- Rocha, J.C.; Passalia, F.J.; Matos, F.D.; Takahashi, M.B.; Ciniciato, D.D.; Maserati, M.P.; Alves, M.F.; De Almeida, T.G.; Cardoso, B.L.; Basso, A.C.; et al. A method based on artificial intelligence to fully automatize the evaluation of bovine blastocyst images. Sci. Rep. 2017, 7, 7659. [Google Scholar] [CrossRef] [PubMed] [Green Version]
- Nogueira, M.F.G.; Guilherme, V.B.; Pronunciate, M.; Dos Santos, P.H.; Da Silva, D.L.B.; Rocha, J.C. Artificial Intelligence-Based Grading Quality of Bovine Blastocyst Digital Images: Direct Capture with Juxtaposed Lenses of Smartphone Camera and Stereomicroscope Ocular Lens. Sensors 2018, 18, 4440. [Google Scholar] [CrossRef] [Green Version]
- Wamaitha, S.E.; Niakan, K.K. Human Pre-gastrulation Development. Curr. Top. Dev. Biol. 2018, 128, 295–338. [Google Scholar] [CrossRef]
- Rocha, J.C.; Nogueira, M.; Zaninovic, N.; Hickman, C. Is AI assessment of morphokinetic data and digital image analysis from time-lapse culture predictive of implantation potential of human embryos? Fertil. Steril. 2018, 110, e373. [Google Scholar] [CrossRef]
- Zaninovic, N.; Rocha, C.J.; Zhan, Q.; Toschi, M.; Malmsten, J.; Nogueira, M.F.G.; Meseguer, M.; Rosenwaks, Z.; Hickman, C. Application of artificial intelligence technology to increase the efficacy of embryo selection and prediction of live birth using human blastocysts cultured in a time-lapse incubator. Fertil. Steril. 2018, 110, e372–e373. [Google Scholar] [CrossRef]
- Alegre, L.; Bori, L.; de los Ángeles Valera, M.; Nogueira, M.F.G.; Ferreira, A.S.; Rocha, J.C.; Meseguer, M. First application of artificial neuronal networks for human live birth prediction on geri time-lapse monitoring system blastocyst images. Fertil. Steril. 2020, 114, e140. [Google Scholar] [CrossRef]
- Van Den Heuvel, T.L.A.; De Bruijn, D.; De Korte, C.L.; Ginneken, B.V. Automated measurement of fetal head circumference using 2D ultrasound images. PLoS ONE 2018, 13, e0200412. [Google Scholar] [CrossRef]
- Huang, C.L.; Lian, M.J.; Wu, Y.H.; Chen, W.M.; Chiu, W.T. Identification of human ovarian adeno-carcinoma cells with cisplatin-resistance by feature extraction of gray Level Co-occurrence matrix using optical images. Diagnostics 2020, 10, 389. [Google Scholar] [CrossRef]
- Nanni, L.; Lumini, A.; Brahnam, S. Local binary patterns variants as texture descriptors for medical image analysis. Artif. Intell. Med. 2010, 49, 117–125. [Google Scholar] [CrossRef] [PubMed]
- Van den Abbeel, E.; Balaban, B.; Ziebe, S.; Lundin, K.; Cuesta, M.J.; Klein, B.M.; Helmgaard, L.; Arce, J.C. Association between blastocyst morphology and outcome of single-blastocyst transfer. Reprod. Biomed. Online 2013, 27, 353–361. [Google Scholar] [CrossRef] [PubMed] [Green Version]


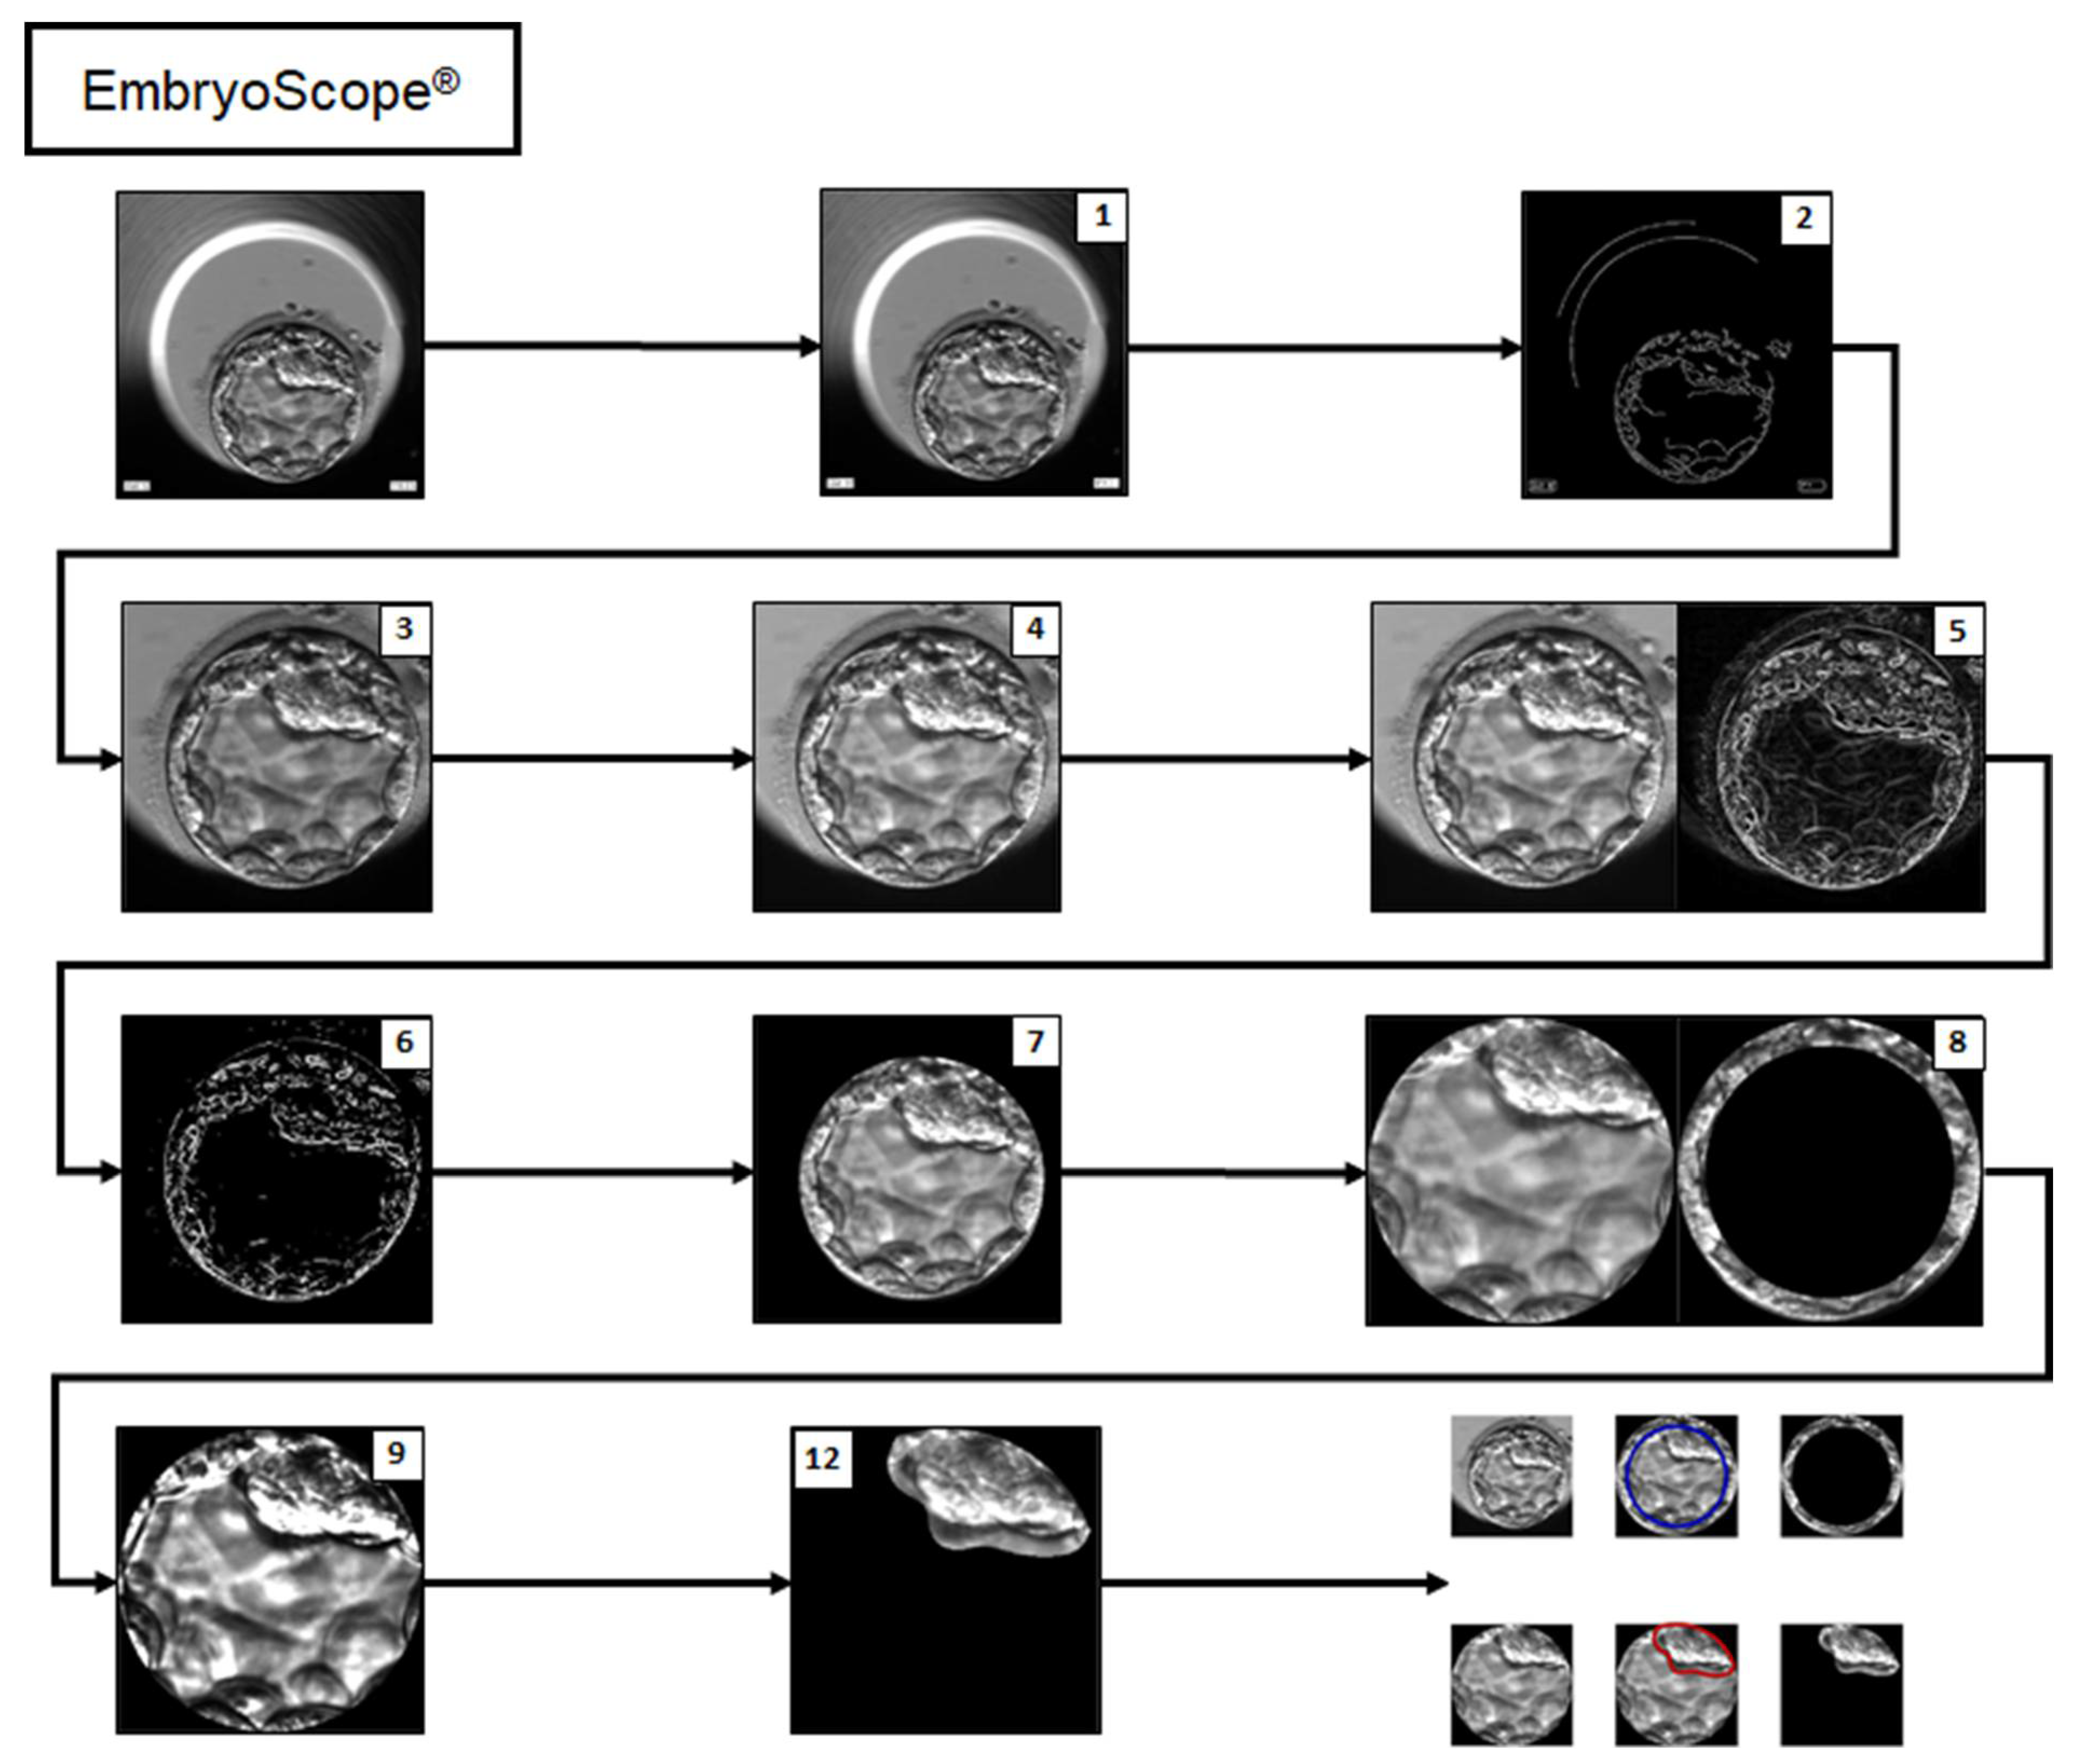
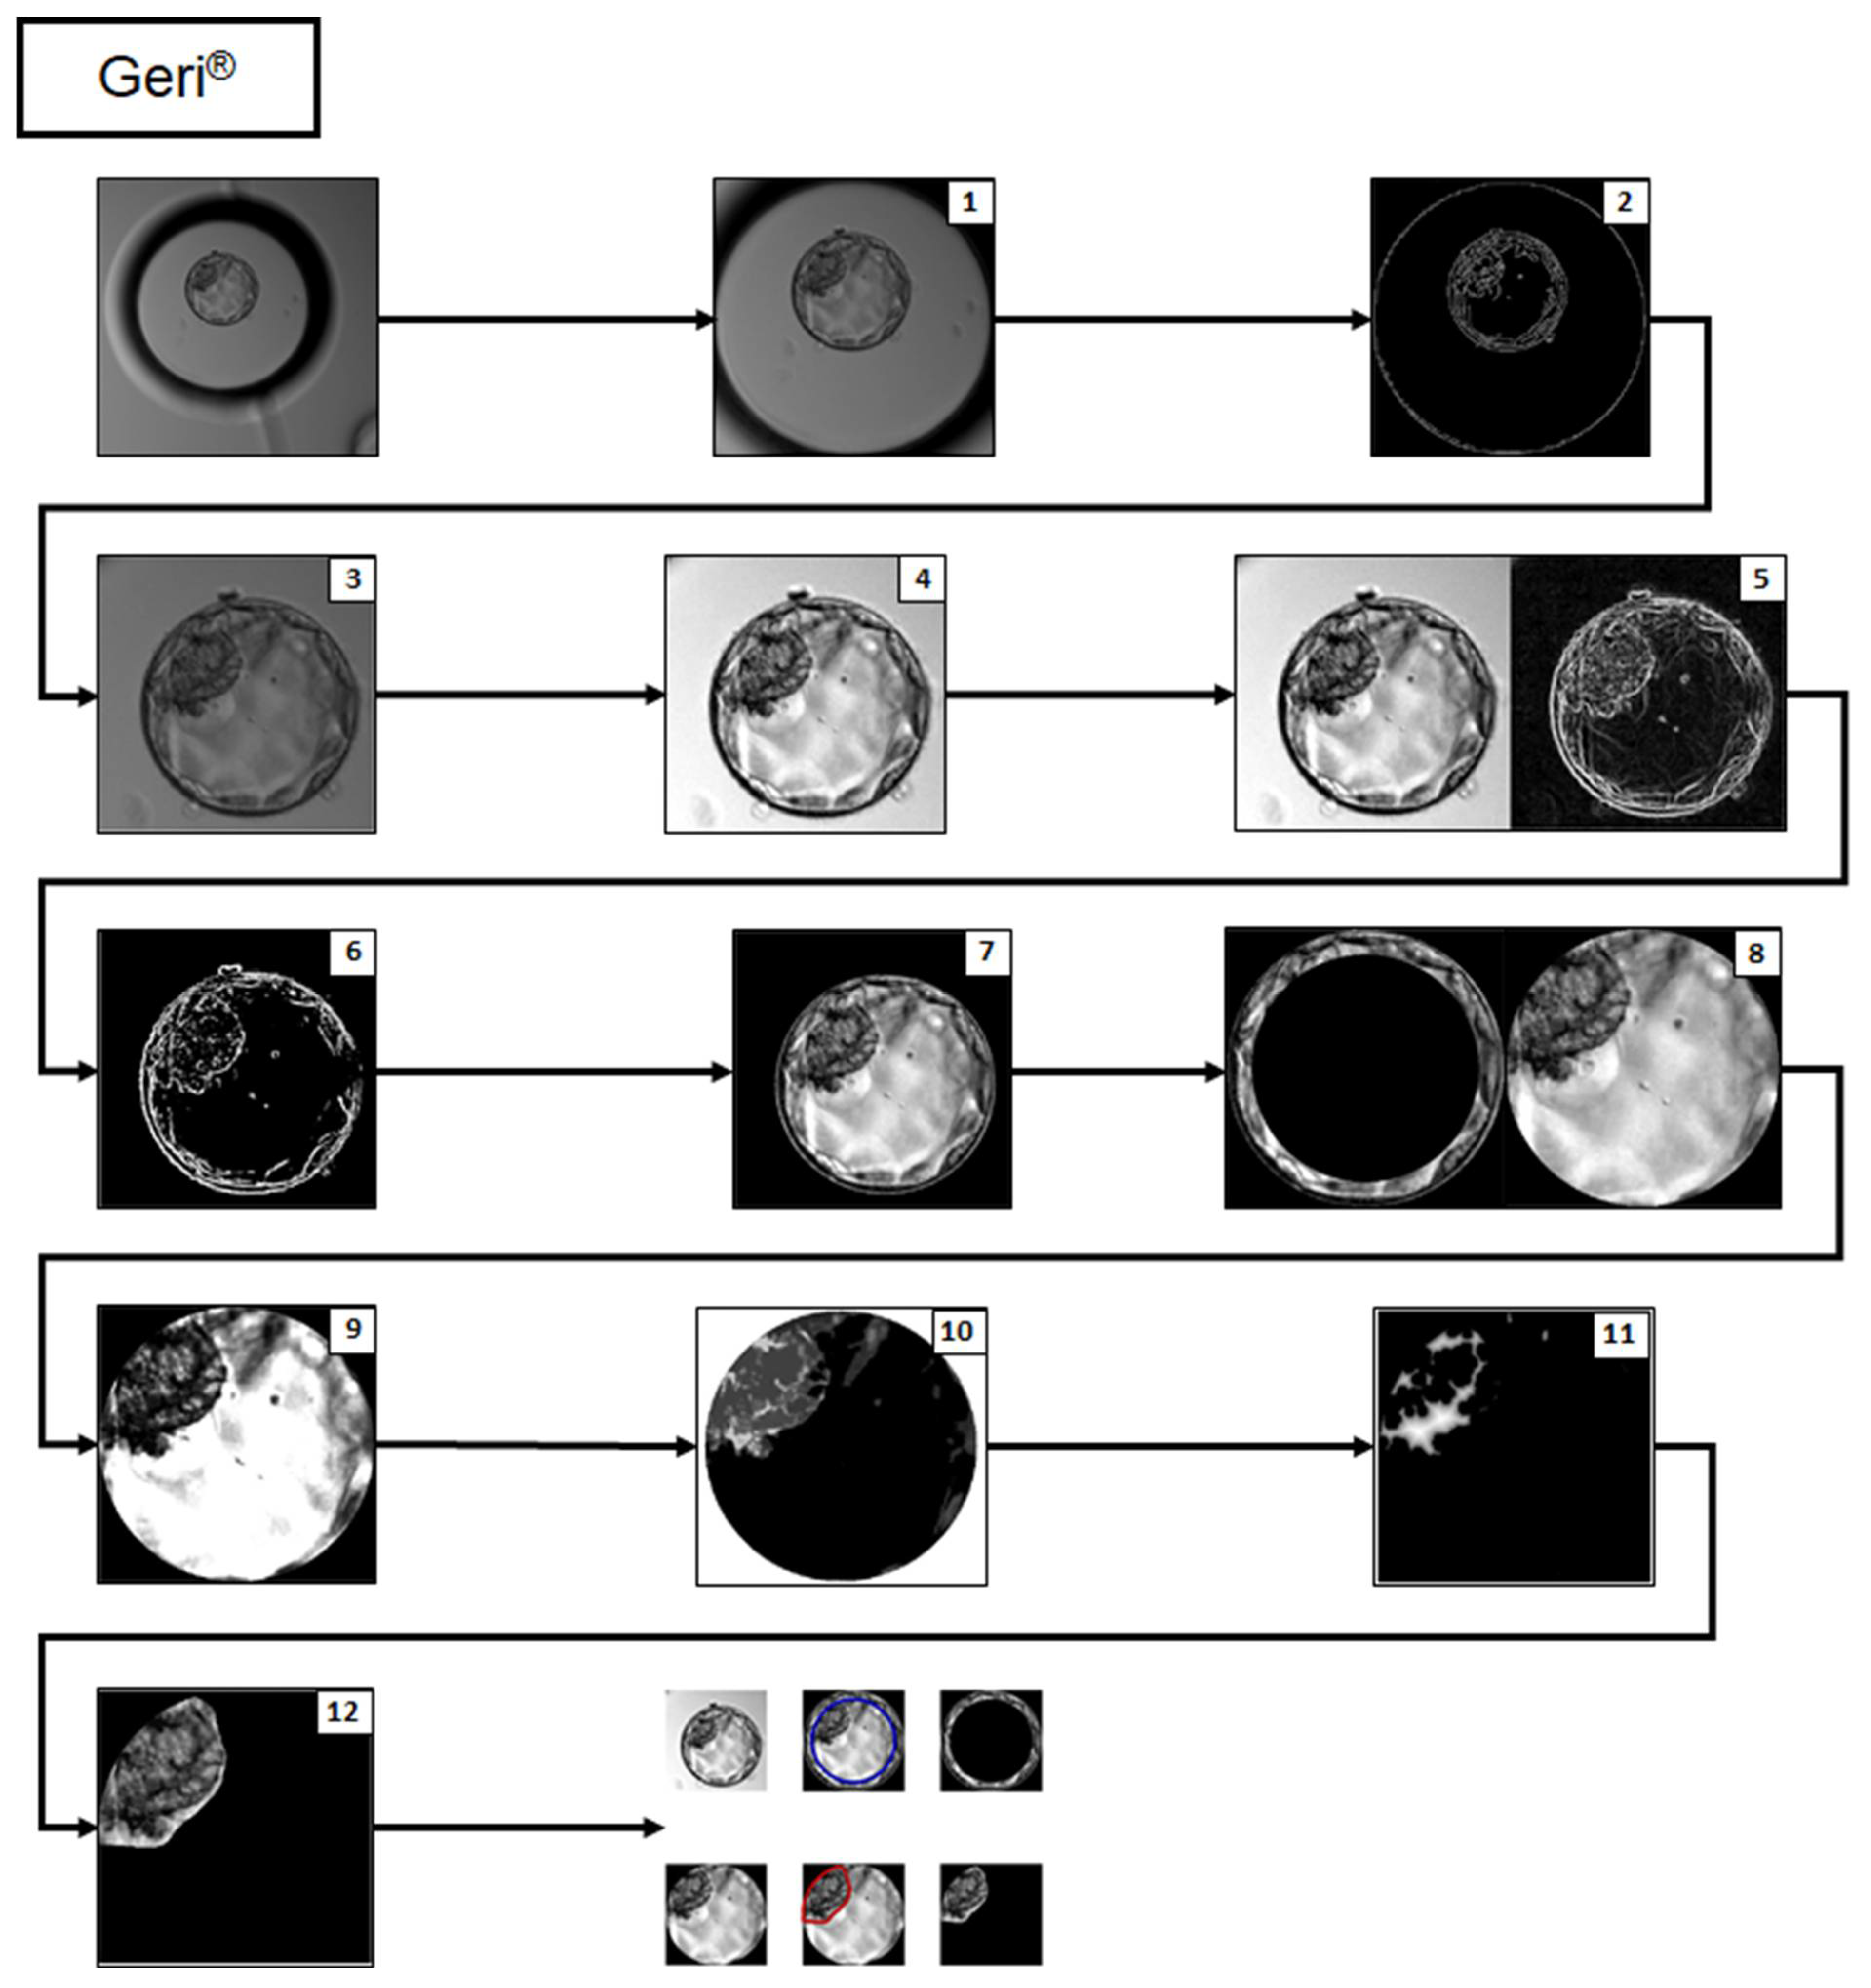
| Segmentation Step | Embryo Scope® | Geri® | Variable Extraction | |
|---|---|---|---|---|
| 1 | Conversion of the input image to grayscale | X | X | - |
| 2 | Edge detection using a Canny filter | X | X | - |
| 3 | Partial embryo isolation | X | X | - |
| 4 | Histogram adjustment (contrast, stretching, and tone) | X | X | - |
| 5 | Prewitt adjustment | X | X | - |
| 6 | Binary conversion | X | X | - |
| 7 | Isolation of the whole blastocyst | X | X | Measurement of the area and radius of the blastocyst by equations using the Matlab® Image Processing ToolboxTM |
| 8 | TE and blastocoel + ICM isolation | X | X | Variables describing TE and the blastocoel + ICM using the Matlab® Image Processing ToolboxTM, local binary pattern (LBP) algorithm, and gray-level cooccurrence matrix (GLCM) |
| 9 | Threshold adjustment | X | X | - |
| 10 | Segmentation based on the grayscale | X | - | |
| 11 | Determination of the binary distance | X | - | |
| 12 | ICM isolation | X | X | Variables describing the ICM using the Matlab® Image Processing ToolboxTM, LBP algorithm, and GLCM |
Publisher’s Note: MDPI stays neutral with regard to jurisdictional claims in published maps and institutional affiliations. |
© 2022 by the authors. Licensee MDPI, Basel, Switzerland. This article is an open access article distributed under the terms and conditions of the Creative Commons Attribution (CC BY) license (https://creativecommons.org/licenses/by/4.0/).
Share and Cite
Chéles, D.S.; Ferreira, A.S.; de Jesus, I.S.; Fernandez, E.I.; Pinheiro, G.M.; Dal Molin, E.A.; Alves, W.; de Souza, R.C.M.; Bori, L.; Meseguer, M.; et al. An Image Processing Protocol to Extract Variables Predictive of Human Embryo Fitness for Assisted Reproduction. Appl. Sci. 2022, 12, 3531. https://0-doi-org.brum.beds.ac.uk/10.3390/app12073531
Chéles DS, Ferreira AS, de Jesus IS, Fernandez EI, Pinheiro GM, Dal Molin EA, Alves W, de Souza RCM, Bori L, Meseguer M, et al. An Image Processing Protocol to Extract Variables Predictive of Human Embryo Fitness for Assisted Reproduction. Applied Sciences. 2022; 12(7):3531. https://0-doi-org.brum.beds.ac.uk/10.3390/app12073531
Chicago/Turabian StyleChéles, Dóris Spinosa, André Satoshi Ferreira, Isabela Sueitt de Jesus, Eleonora Inácio Fernandez, Gabriel Martins Pinheiro, Eloiza Adriane Dal Molin, Wallace Alves, Rebeca Colauto Milanezi de Souza, Lorena Bori, Marcos Meseguer, and et al. 2022. "An Image Processing Protocol to Extract Variables Predictive of Human Embryo Fitness for Assisted Reproduction" Applied Sciences 12, no. 7: 3531. https://0-doi-org.brum.beds.ac.uk/10.3390/app12073531