
Long-Term Trend of the Levels of Ambient Air Pollutants of a Megacity and a Background Area in Korea


1
Department of Chemical Engineering and Materials Science, Ewha Womans University, Seoul 03760, Korea
2
Department of Environmental Science and Engineering, Ewha Womans University, Seoul 03760, Korea
3
National Institute of Environmental Research, Incheon 22689, Korea
*
Authors to whom correspondence should be addressed.
Appl. Sci. 2022, 12(8), 4039; https://0-doi-org.brum.beds.ac.uk/10.3390/app12084039
Submission received: 30 December 2021
/
Revised: 7 April 2022
/
Accepted: 14 April 2022
/
Published: 16 April 2022
(This article belongs to the Special Issue Advances in Gaseous and Particulate Air Pollutants Measurement)
Abstract
:It is imperative to understand the changes of the levels of air pollutants in Northeast Asia with respect to the changes of the emissions of air pollutants. In this study, we analyzed long-term trends of both the chemical composition of fine particles and gaseous species in Seoul, a megacity, and Baengnyeong Island, a background area located in the Yellow Sea of Republic of Korea (South Korea) from 2012 to 2019. Long-term changes of the concentrations of air pollutants were analyzed using the Mann–Kendall trend test and Sen’s slope. Since the SO2 emissions in this region have been significantly reduced during last decade, NO3− has become the major species of fine particles instead of SO42−. Seoul and Baengnyeong Island are rich in NH4+ in the atmosphere, and due to the SO2 emission reduction, the balance of ammonia–nitric acid–sulfuric acid has been changed, and the concentration of NO3− has increased. This trend is more obvious in Baengnyeong Island than Seoul due to the lower local emissions in Baengnyeong Island. As a result of this study, it is possible to confirm that concentrations of air pollutants and the majority of aerosols affecting PM2.5 concentrations in Northeast Asia have changed according to the changes in emissions in this region.
1. Introduction
Northeast Asia is a region with a huge amount of air pollutant emissions and thus has been one of the worst regions in the world in terms of air quality. Countries in the region have made great efforts to manage air quality and have obtained significant achievements. For example, the air qualities in the metropolitan areas of Seoul, Republic of Korea (South Korea) in the recent 30 years [1] and Beijing, China [2] in the last 20 years have continuously improved. In addition, based on various monitoring and estimation study results, it is verified that the emissions of most air pollutants, such as sulfur oxides and nitrogen oxides, have decreased in the region. For example, in China, the emission reduction rates markedly accelerated after the year 2013, confirming the effectiveness of China’s Clean Air Action that was implemented since 2013. Compared to 2010, SO2 decreased by 62%, and NOx decreased by 17% [3]. As the emissions of air pollutants in the region have decreased, the concentration of air pollutants in the region has also decreased. For example, in the background areas in the area, the levels of air pollutants in Gosan, Jeju Island, Korea [4] and in Cape Hedo, Okinawa, Japan [5] have clearly demonstrated the decrease of air pollutants in the region.
Baengnyeong Island is one of the representative regional background sites. It is located in the Yellow Sea and is affected by the air pollution in South and North Korea and China. On Baengnyeong Island, several studies have been conducted to understand the transboundary transport of air pollutants in this region and to identify the characteristics of ambient air pollutants in this area. Lee et al. [6] measured PM1 using a High Resolution Time of Flight Aerosol Mass Spectrometer (HR-ToF-AMS) on Baengnyeong Island in 2011 and reported that organic matter and SO42− were the major components of PM1 in Baengnyeong Island. Ban et al. [7] analyzed the ion component data measured by an Ambient Ion Monitor (AIM) from 2013 to 2014 on Baengnyeong Island and also reported that SO42− was the dominant species. Jo et al. [8] analyzed the characteristics of ambient air pollutants on Baengnyeong Island using WRF-Chem models and measurement data between 2014 and 2016. They reported that the major chemical species of fine particles changed from SO42− to NO3− because of the changes in the emission trends in the region.
As summarized, so far, a few studies on air quality have been conducted in Seoul and on Baengnyeong Island. However, in most of them, the period was limited, and the measurements were not simultaneously carried out in both areas. In addition, there have been few studies simultaneously analyzing and comparing the air quality in metropolitan areas and background areas in the region. In this study, by analyzing long-term air pollutant measurement data measured in Seoul and on Baengnyeong Island between 2012 and 2019, we studied (1) the trends of changes in the concentrations of major air pollutants including SO42− and NO3− and their precursor gaseous species in Seoul and Baengnyeong Island, (2) the similarities and differences between the two areas by comparing the results in both areas, and (3) whether the concentrations of air pollutants in both areas, the megacity and background area, were actually changing according to the changes of emissions in Northeast Asia.
2. Data and Methods
2.1. Sampling Site
Since 2009, the Korean Ministry of Environment (KMOE) has been operating six intensive atmospheric monitoring sites (namely, Baengnyeong Island, Seoul, Daejeon, Gwangju, Ulsan, and Jeju Island). In order to examine long-term changes in atmospheric aerosol concentrations, we selected and analyzed data from Seoul, the capital of South Korea, representing the megacity urban area, and Baengnyeong Island was selected as the background area. In this study, we analyzed the data of measurements from January 2012 to December 2019 (8 years) from both stations.
The intensive monitoring site in Seoul is located in Bulgwang-dong, Eunpyeong-gu, northwest Seoul (37°61′ N, 126°93′ E), adjacent to the Bukhansan National Park to the north and the suburban area to the northwest. To the south and southeast in downtown Seoul, there are residential areas and heavy traffic areas [9]. The Baengnyeong Island Monitoring Station (37.97° N, 124.63° E) was built in 2007, and it is playing a role in identifying the current state of air pollution in the background area of South Korea. Baengnyeong Island mostly comprises mountain areas, and many of the residents are engaged in agriculture and the fishing industry. In particular, the Baengnyeong Island Monitoring station is operated for the purpose of identifying the status of air pollutants from outside of South Korea, because it does not have much of its own emission sources, and it is geographically adjacent to China and North Korea [6,7,10]. The most specific meteorological condition in Northeast Asia is the dominant westerlies, except in summer [11,12], and Baengnyeong Island is strongly influenced by emissions from China or North Korea [6,7,13]. Hourly concentrations of PM2.5, water-soluble ions, organic and elemental carbon, elemental constitutions in PM2.5 and relative humidity (RH) were measured at these sites.
2.2. Sampling and Chemical Analysis
PM2.5 mass concentrations were continuously monitored with an hourly time resolution (1 h) using the β-ray absorption method (BAM1020, MetOne Instrument Inc., Grants Pass, OR, USA) with a flow rate of 16.7 L min−1 with a PM2.5 Very Sharp Cut Cyclone (VSCC) instrument. The time-resolved chemical composition of PM2.5 was measured on an hourly basis using an ambient ion monitor (AIM, URG Corporation, Chapel Hill, NC, USA) for ionic species. In the case of AIM, the air was put into the denuder via a PM2.5 inlet at a flow rate of 16.7 L min−1 to collect gaseous pollutants. The samples collected during an hour were separately injected into a cation and anion ion chromatograph (Dionex IonPacAG18/AS18; IonPacCGA 12, CS12A, Dionex Corporation, Sunnyvale, CA, USA). Equivalent ratio and ion mass balance equations were considered to validate the data accuracy for ion data.
Carbonaceous components in PM2.5 were monitored by an OC/EC analyzer hourly with the modified NIOSH method 5040 (SECOC Analyzer, Sunset Laboratory Inc., Portland, OR, USA). The instruments were equipped with PM2.5 cyclone for the sampler inlet and organic denuders to remove gaseous organic carbons. Samples were collected for 45 min at an 8 L min−1 flow rate on 47 mm quartz filters (TISSUQUARTZ, Gelman Sciences, Ann Arbor, MI, USA). After the sample collection, the oven was purged with helium and heated to 850 °C by a stepped temperature ramp, in which thermally desorbed organic compounds and pyrolysis products were put into a manganese dioxide (MnO2) oxidizing oven. The carbon fragments, converted to CO2 gas in an MnO2 oven, were measured directly by a self-contained non-dispersive infrared (NDIR) detector system. A second temperature ramp was then initiated in an oxidizing gas stream, and any elemental carbon was oxidized off the filter and put into the oxidizing oven. The elemental carbon (EC) was then detected in the same manner as the organic carbon (OC). Details of sampling and measurement are reported elsewhere [9,10,14]. Furthermore, hourly measured concentrations of gaseous pollutant concentrations including SO2, CO, NO2 and O3 were attained by the air pollution monitoring network near the intensive atmospheric monitoring sites of Seoul and Baengnyeong Island [15].
2.3. Methods
2.3.1. The Mann–Kendall Test and Sen’s Slope
Non-parametric statistical techniques should be applied to data of the general atmospheric environment where the range of change over time is large and observations do not follow a normal distribution [16,17]. One of the non-parametric statistical techniques, the Mann–Kendall test, is commonly employed to detect monotonic trends in series of environmental data such as climate data, hydrological data, water quality data and air quality data [18,19,20,21]. Since the data used in this study were measured at the same point for a relatively long time period with the same measurement and analysis methods, time series analyses could be applied statistically to the whole data series. In this study, Mann–Kendall trend analysis was applied to both sites.
The presence or absence of a tendency was confirmed through trend analysis, and the degree of the tendency was judged by the slope of Sen’s slope. The Sen’s slope estimator is the non-parametric procedure for estimating the slope of a trend in a sample of multiple time periods, as developed by Sen [22]. It has been widely used in hydro-meteorological time series analysis [23,24,25]. In summary, the Mann–Kendall method is a trend test, and Sen’s slope is a slope calculation method. Sen’s slope is not calculated for any pollutant with a non-significant trend detected in the Mann–Kendall test.
In this study, the trend package in R was used for the Mann–Kendall test and Sen’s slope analysis [26]. For the quality assurance and quality control of data, the standards and methods suggested by the National Institute of Environment Research (NIER), Korea were used. In order to secure the reliability of statistical data, statistical analysis was conducted only on the days when more than 75% of the data were obtained. Details about QA/QC are shown elsewhere [10,27]. The hourly data were used for the trend analyses.
2.3.2. Sulfur Oxidation Ratio (SOR) and Nitrogen Oxidation Ratio (NOR)
The Sulfur Oxidation Ratio (SOR) and Nitrogen Oxidation Ratio (NOR) are the oxidation ratios that describe the conversion process of sulfur and nitrogen in the modified forms of the gas–particle distribution factors [28,29]. In this study, these ratios are defined as follows [30]:
where n is the concentrations of the chemical species in μmol m−3.
SOR = nSO42−/(nSO42− + nSO2)
NOR = nNO3−/(nNO3− + nNO2)
Larger values of SOR and NOR mean that higher fractions of sulfur or nitrogen exist in the particle phase rather than in the gas phase, and it can be considered that more of the oxidation process has progressed in the atmosphere. Thus, higher values of SOR and NOR in a site mean the observed particles in the atmosphere have a greater age.
3. Results and Discussion
3.1. Annual Levels of Atmospheric Aerosols and Gaseous Species
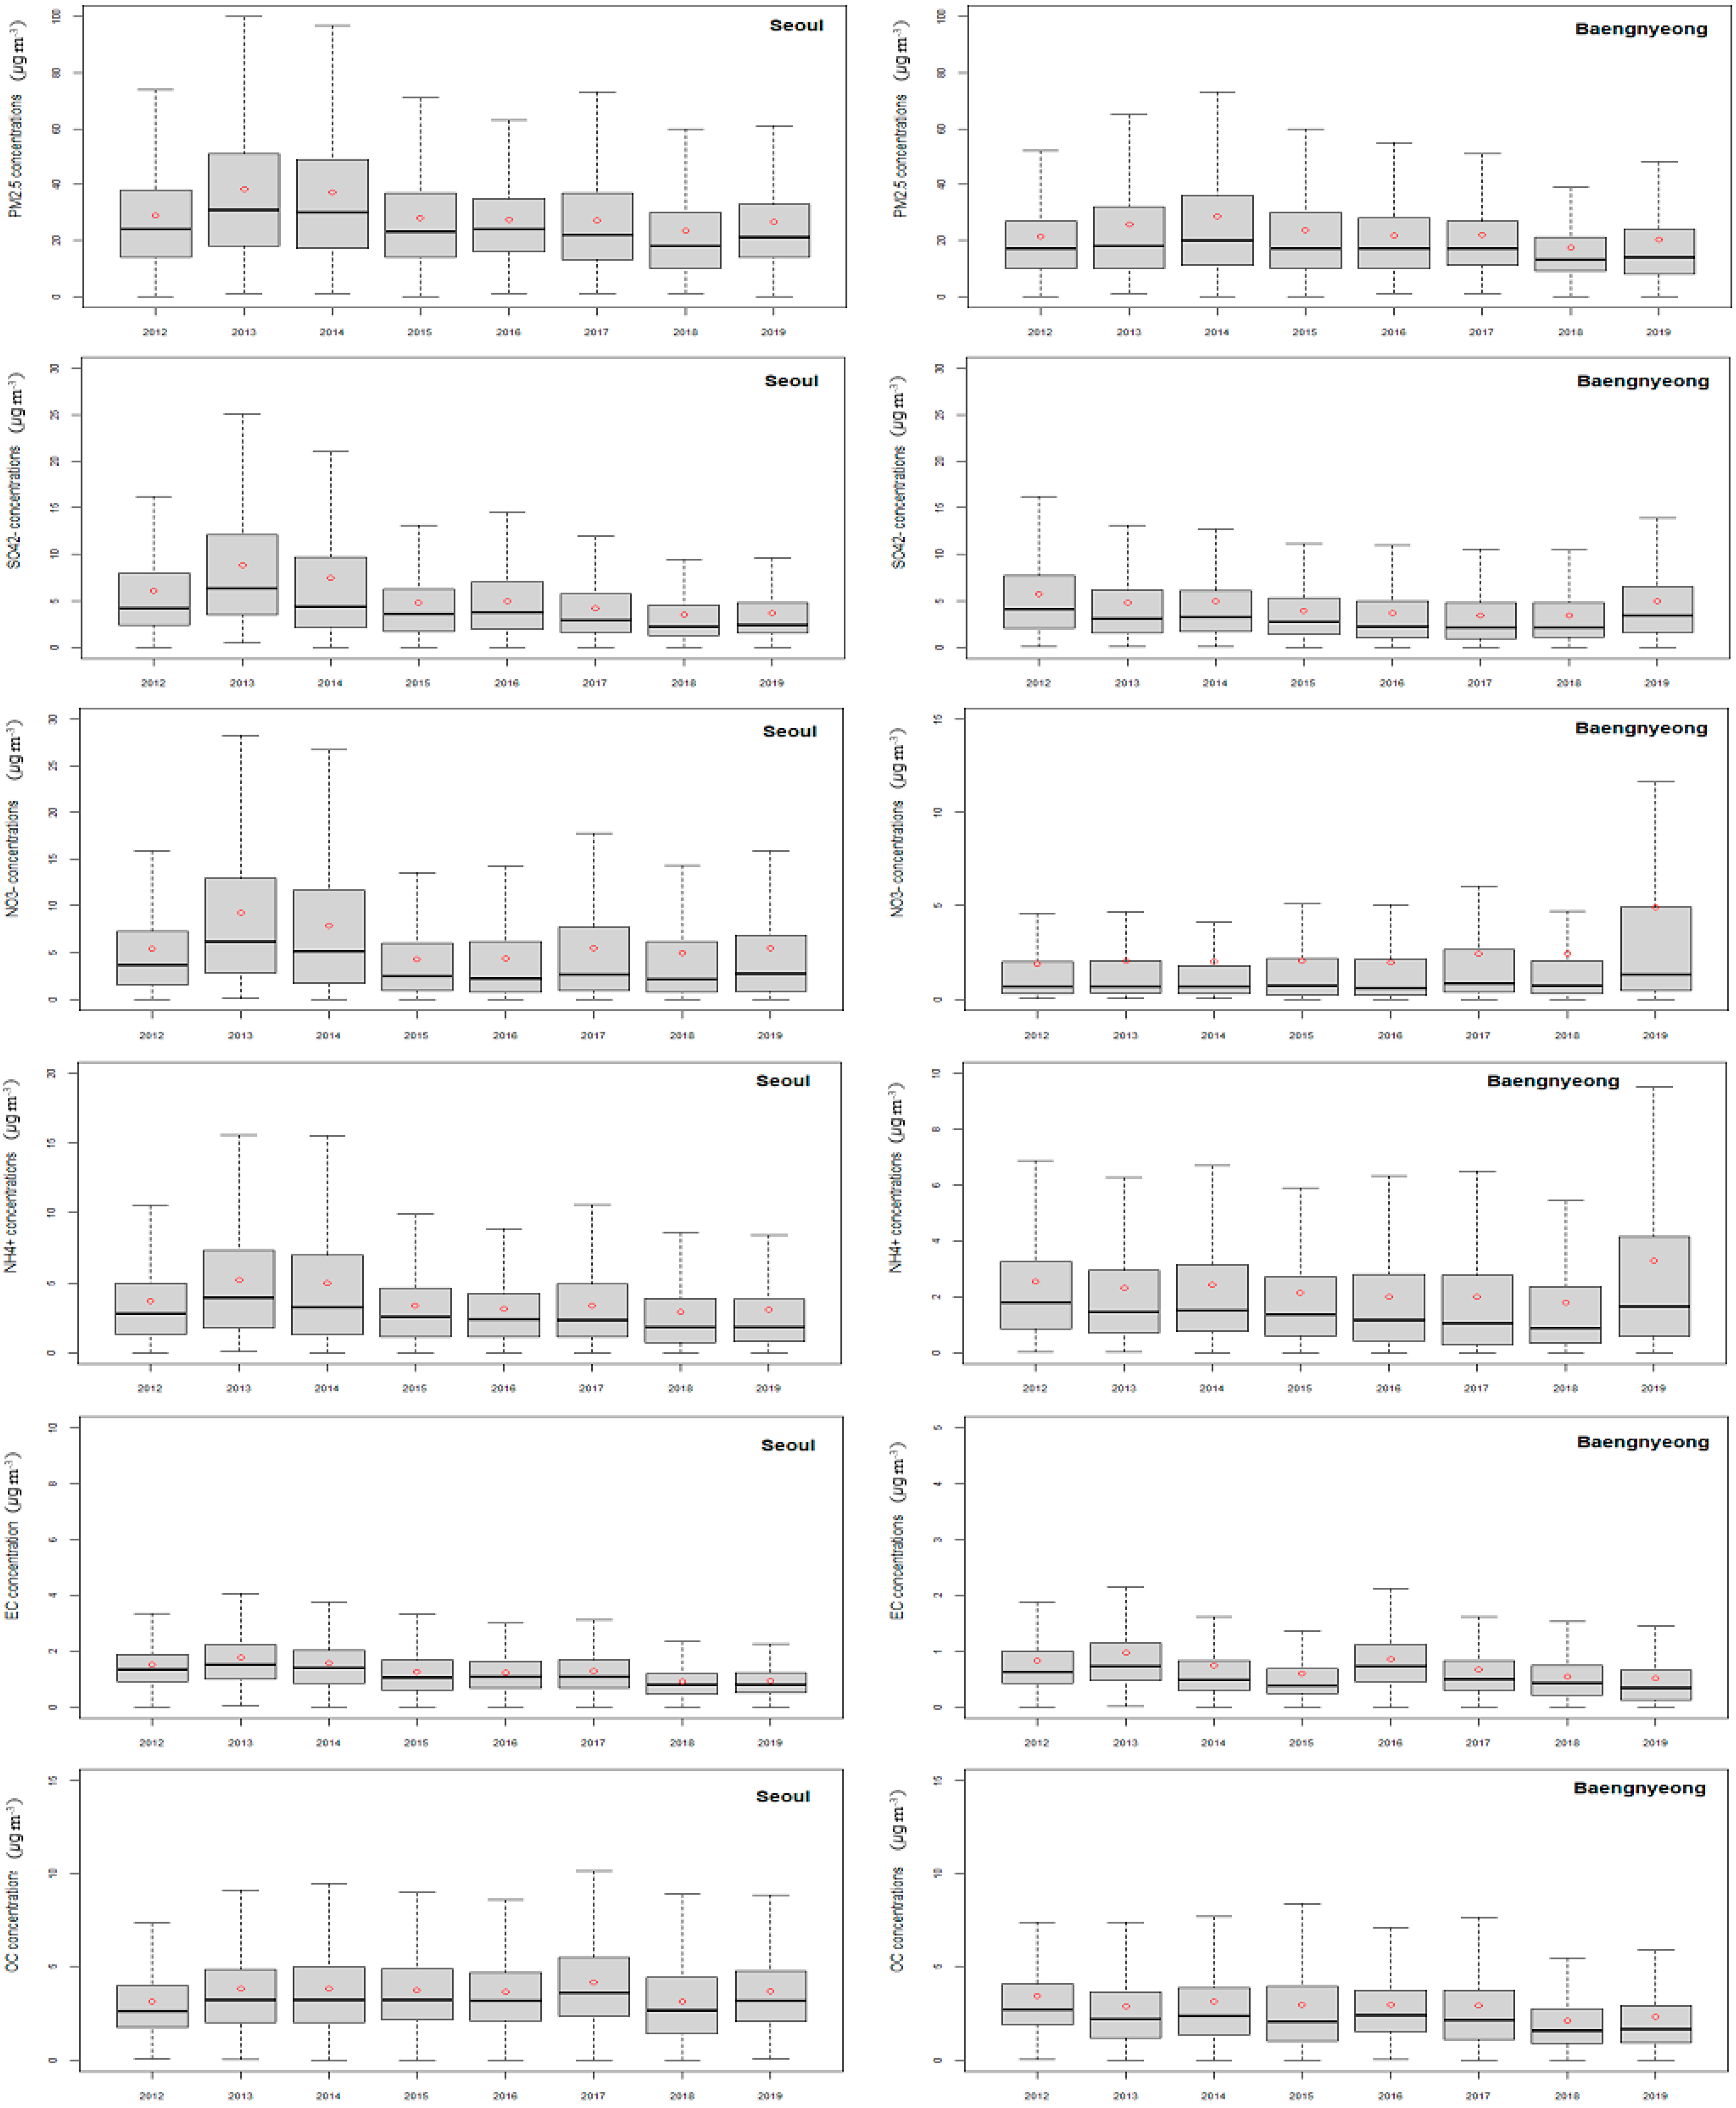
Table 1 shows the annual mean concentrations of major air pollutants measured in Seoul and Baengnyeong Island between 2012 and 2019. In addition, Figure 1 shows the annual mean (red circle), median, minimum, maximum and the interquartile ranges of PM2.5, SO42−, NO3−, NH4+, EC and OC. Most aerosol species have shown a general decreasing trend over the past eight years. The aerosol concentrations in Seoul increased until 2013 and then started to decrease since 2014. Unlike other components, OC did not decrease and showed a slight increasing trend of around 3~4 μg m−3 in average.
On Baengnyeong Island, the maximum annual mean PM2.5 concentration was 28.7 μg m−3 in 2014 and has decreased since 2015. The annual mean concentrations of SO42− and NH4+ kept decreasing from 2012 to 2018. Unlike other pollutants, the NO3− concentration is increasing steadily. The annual mean NO3− concentration was 1.86 μg m−3 in 2012 and kept increasing to 4.92 μg m−3 in 2019. The annual mean EC concentration was on a declining trend from 0.97 μg m−3 in 2014 to 0.51 μg m−3 in 2019, although the concentration briefly increased in 2016. The annual mean OC concentration remained stagnant at around 3 μg m−3 and decreased slightly after 2018. The annual mean concentrations of aerosol species were higher in Seoul than Baengnyeong Island. Furthermore, the deviations of the annual mean concentrations of each pollutant were larger in Seoul.
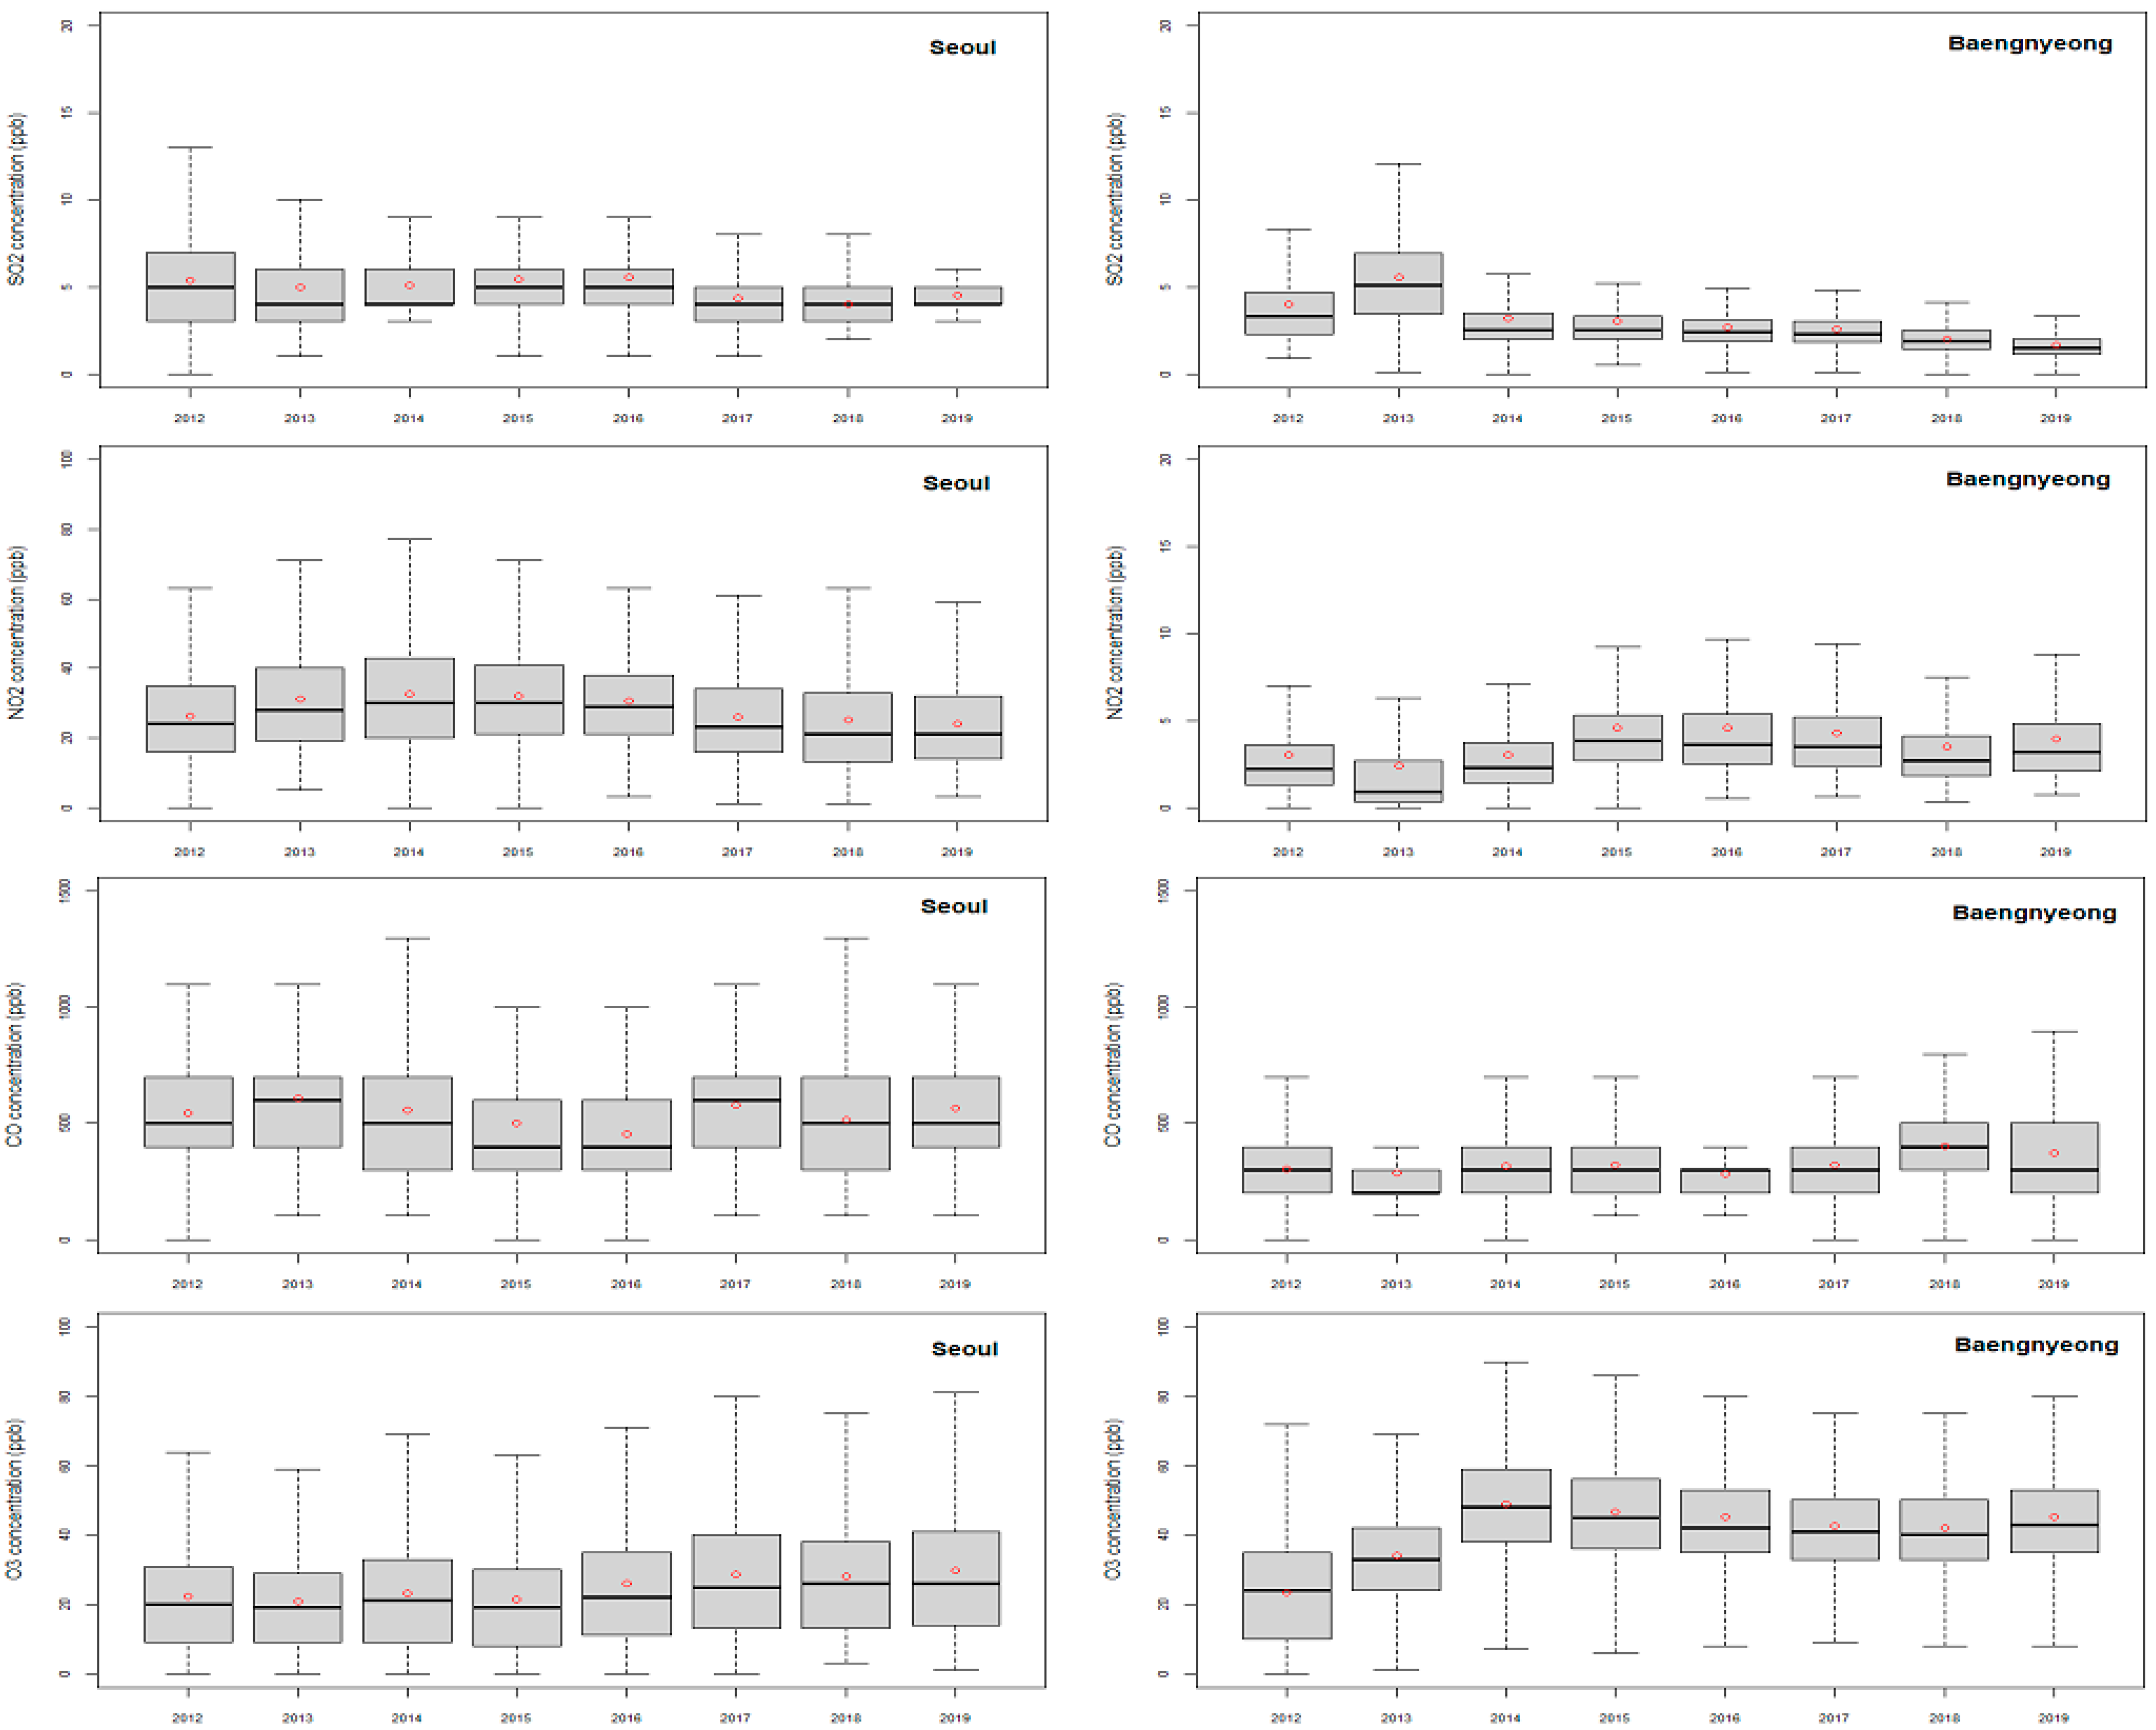
Figure 2 shows the annual levels of gaseous species measured in Seoul and on Baengnyeong Island. The annual mean SO2 concentration in Seoul showed a slight decreasing tendency around 5 ppb. In the case of NO2, the annual mean concentration showed a maximum of 32.5 ppb in 2014 and showed a decreasing trend to 23.9 ppb in 2019. The annual mean O3 concentrations increased by 22.3 ppb in 2012 to 29.6 ppb in 2019. On Baengnyeong Island, the annual mean SO2 concentration was 5.54 ppb in 2013 and has been continuously decreasing, reaching 1.66 ppb in 2019. In contrast, NO2 showed a clear increasing trend. The annual mean concentration of NO2 was 2.99 ppb in 2012 and increased to 3.96 ppb in 2019. In the case of O3, the annual mean concentration increased significantly from 2012 to 2014, from 23.3 ppb to 49.1 ppb, and since then, the concentration has been maintained at over 40 ppb.
3.2. Trend Analysis of Atmospheric Aerosols and Gaseous Species
In Section 3.1, the changes in the concentrations of particulate and gaseous air pollutants over 8 years measured in Seoul and on Baengnyeong Island were shown. The Mann–Kendall test, which can examine long-term concentration change trends using measurement data, was performed in order to understand the degree of concentration changes more accurately.
Table 2 summarizes the results of the Mann–Kendall test and Sen’s slope estimation for ambient aerosols between 2012 and 2019. All the air pollutants except for OC showed a statistically significant decrease in Seoul. OC showed neither an increase nor a decrease. On Baengnyeong Island, all air pollutants showed a statistically significant decrease, except for NO3−, which showed an increasing trend. Among the decreasing species, the Sen’s slope for PM2.5 was the highest and the Sen’s slope for EC was the lowest in both sites.
Table 3 shows the results of the Mann–Kendall test and Sen’s slope estimation for ambient gaseous pollutants between 2012 and 2019. Seoul and Baengnyeong Island showed quite different results. In Seoul, all gaseous air pollutants except O3 showed a statistically significant decrease, whereas Baengnyeong Island showed a statistically significant increase in all gaseous air pollutants except for SO2. Based on satellite information, Bhardwaj et al. [31] reported that the concentrations of SO2 and CO, and the value of AOD (550 nm) have decreased in the North China Plain, the Yellow Sea and South Korea. In particular, the decreasing rates for SO2 were the largest among the analyzed species. Souri et al. [32] also used satellite data and reported that tropospheric NO2 variability between 2010 and 2014 over the Yellow Sea showed a slight decrease. Thus, the trend analysis result in this study for the gaseous species might be affected by emissions from local areas or North Korea, and further study is warranted.
The degree of concentration changes was compared using Sen’s slope. The change in SO2 was smaller in Seoul than on Baengnyeong Island. However, in the case of SO42−, the decrease in concentration in Seoul was larger than on Baengnyeong Island during the same period. If other conditions were the same in both areas, this leads us to guess that there is another source of SO2 emission around Seoul, or the conversion rate from SO2 to SO42− on Baengnyeong Island would be higher than in Seoul.
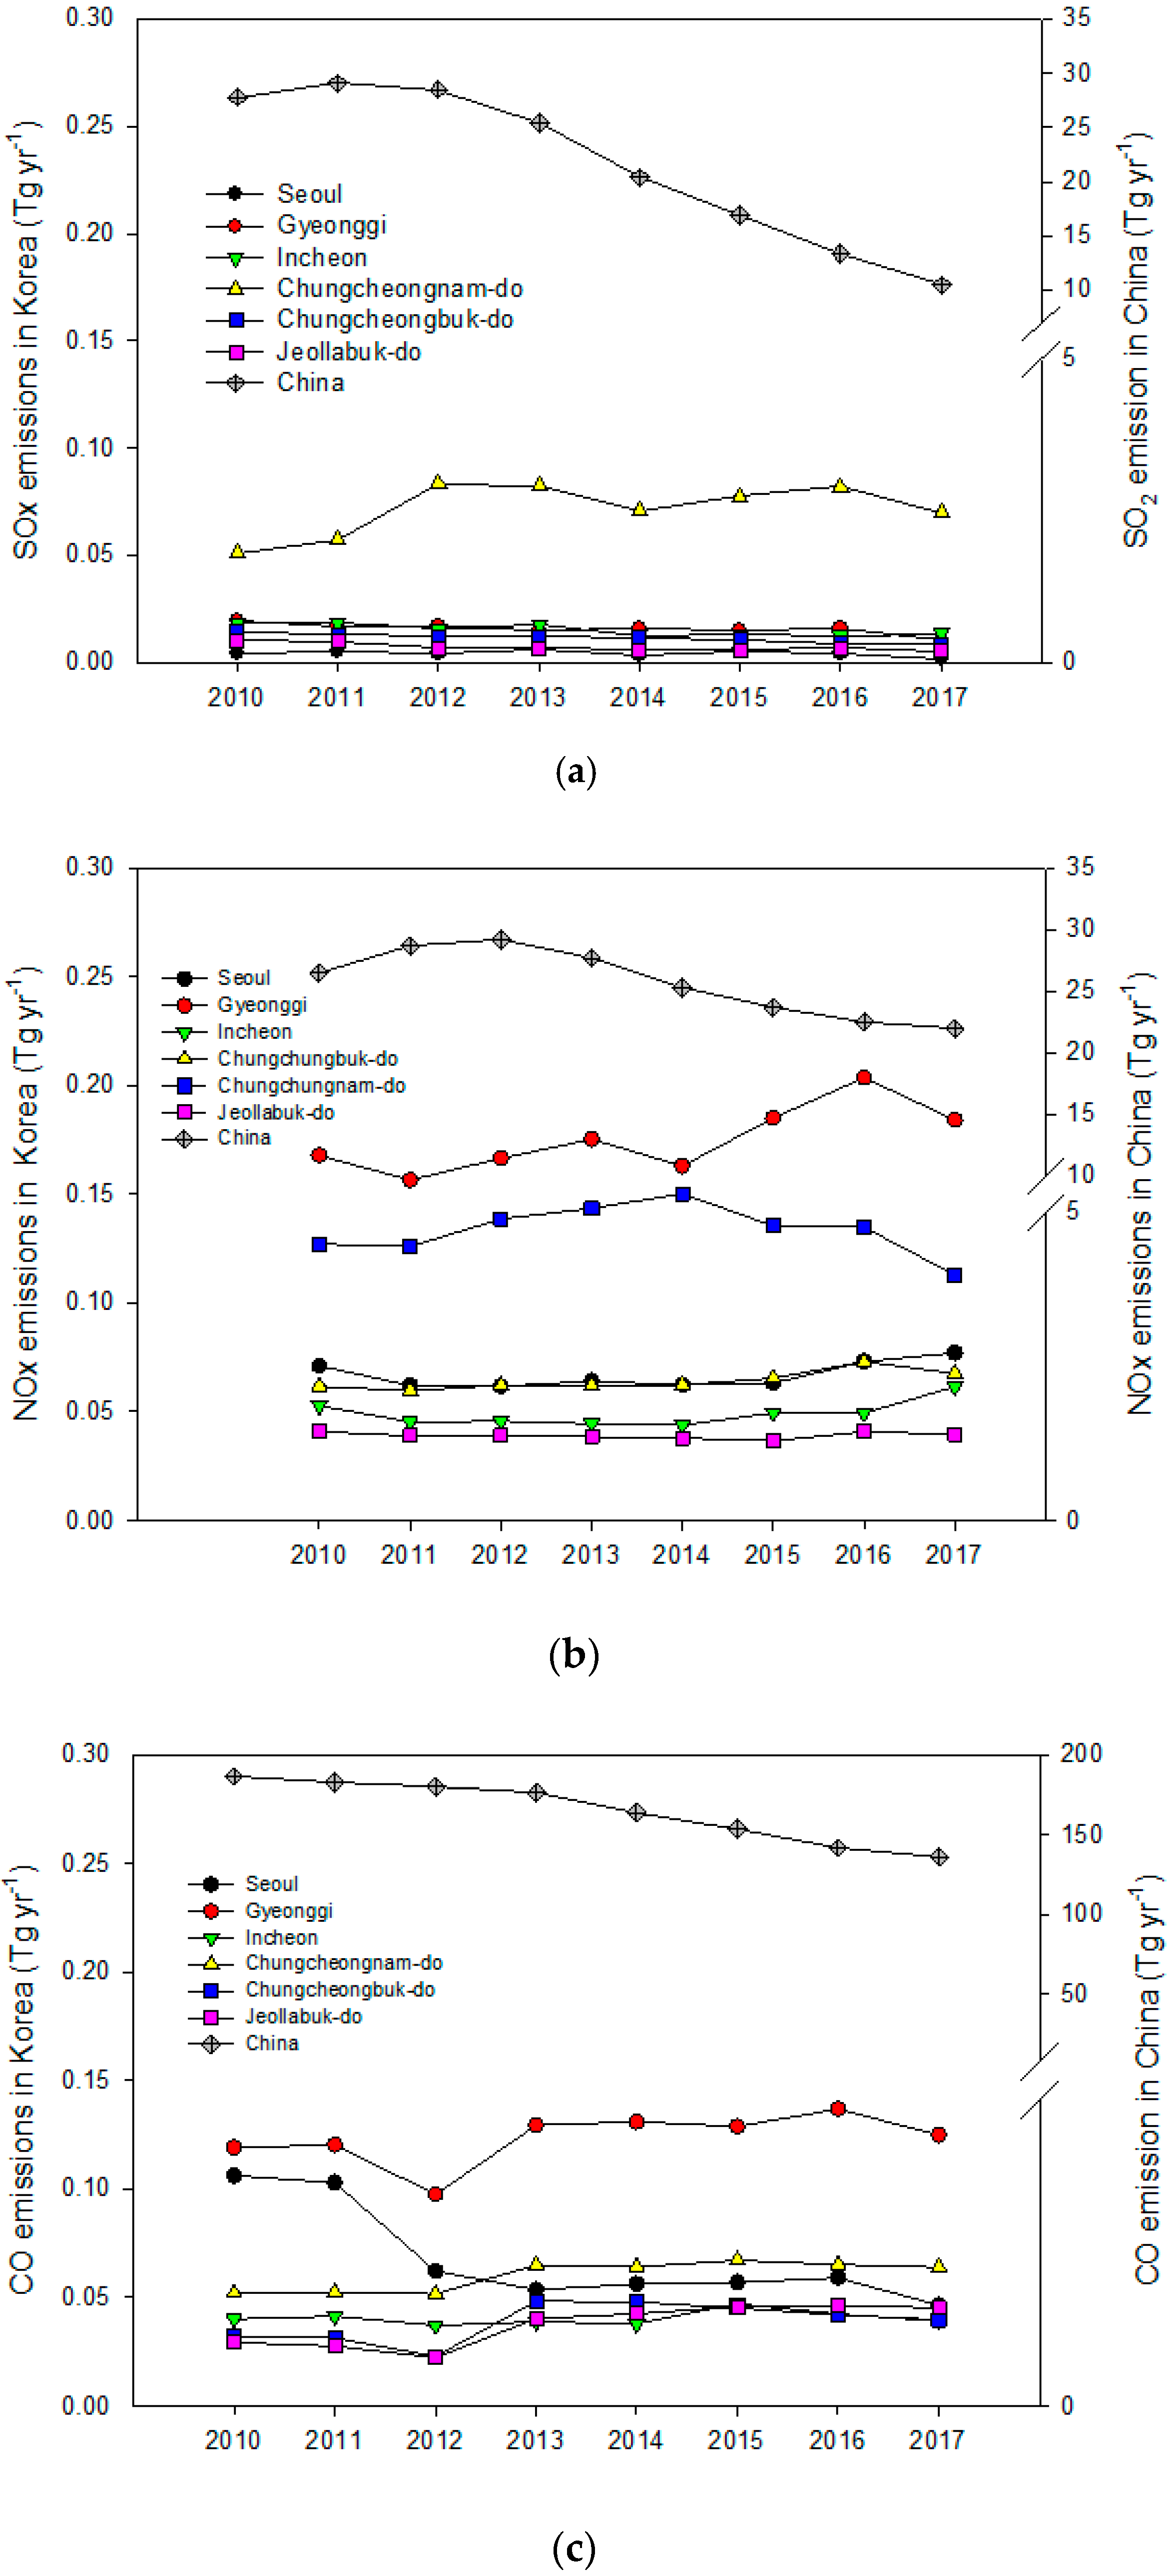
Figure 3 shows the changes in SOx, NOx and CO emissions from China, the metropolitan areas of South Korea (Seoul, Gyeonggi Incheon), and Chungcheongnam-do, Chungcheongbuk-do and Jeollabuk-do, in the western part of Korea, from 2010 to 2017. The Chinese emission data are from Zheng et al. [3], and the Korean emission data are from the Clean Air Policy Support System (CAPSS) estimated by NIER, Korea [33].
The SO2 emissions in China and the metropolitan areas of South Korea were all on a downward trend. Only in Chungcheongnam-do were SO2 emissions found to be on the rise. Large-scale coal-fired power plants and industrial complexes are located in Chungcheongnam-do, where SO2 can flow into Seoul. Recently, some studies have reported on the observation of high concentrations of SO2 and SO42− in the Chungcheongnam-do region of South Korea and their effect on air quality in the Seoul metropolitan area [34,35]. This is probably one of the reasons why SO2 did not decrease remarkably in Seoul, unlike Baengnyeong Island.
The NOx emissions in China are also on a downward trend, but the reduced amount was the smallest among the gaseous pollutants. The NOx emissions from the metropolitan areas of South Korea showed a small increase. The CO emissions in China also decreased, and the CO emissions in Seoul decreased by half. In the other metropolitan areas of South Korea, CO emissions were slightly increased or remained at similar amounts.
As shown in Table 3, the concentrations of NO2 and CO tended to decrease in Seoul, but on Baengnyeong Island, they increased. If we explain these results in relation to the emissions of gaseous pollutants from China and South Korea, Baengnyeong Island seem to be influenced from both sides. In South Korea, NO2 and CO are increasing slightly in the metropolitan areas. However, the absolute value of the increase is small compared to the emission amount of China. Actually, the concentrations of all gaseous pollutants in Seoul are showing a decreasing trend. Most of the emissions from China are on a decreasing trend, but the absolute amount is still large. Baengnyeong Island is located between China and the Korean Peninsula, and it is more adjacent to North Korea than the metropolitan areas of South Korea. However, data on emissions of air pollutants from North Korea are very limited, and further study is warranted.
3.3. Changes in Ion Species Fraction According to PM2.5 Concentration
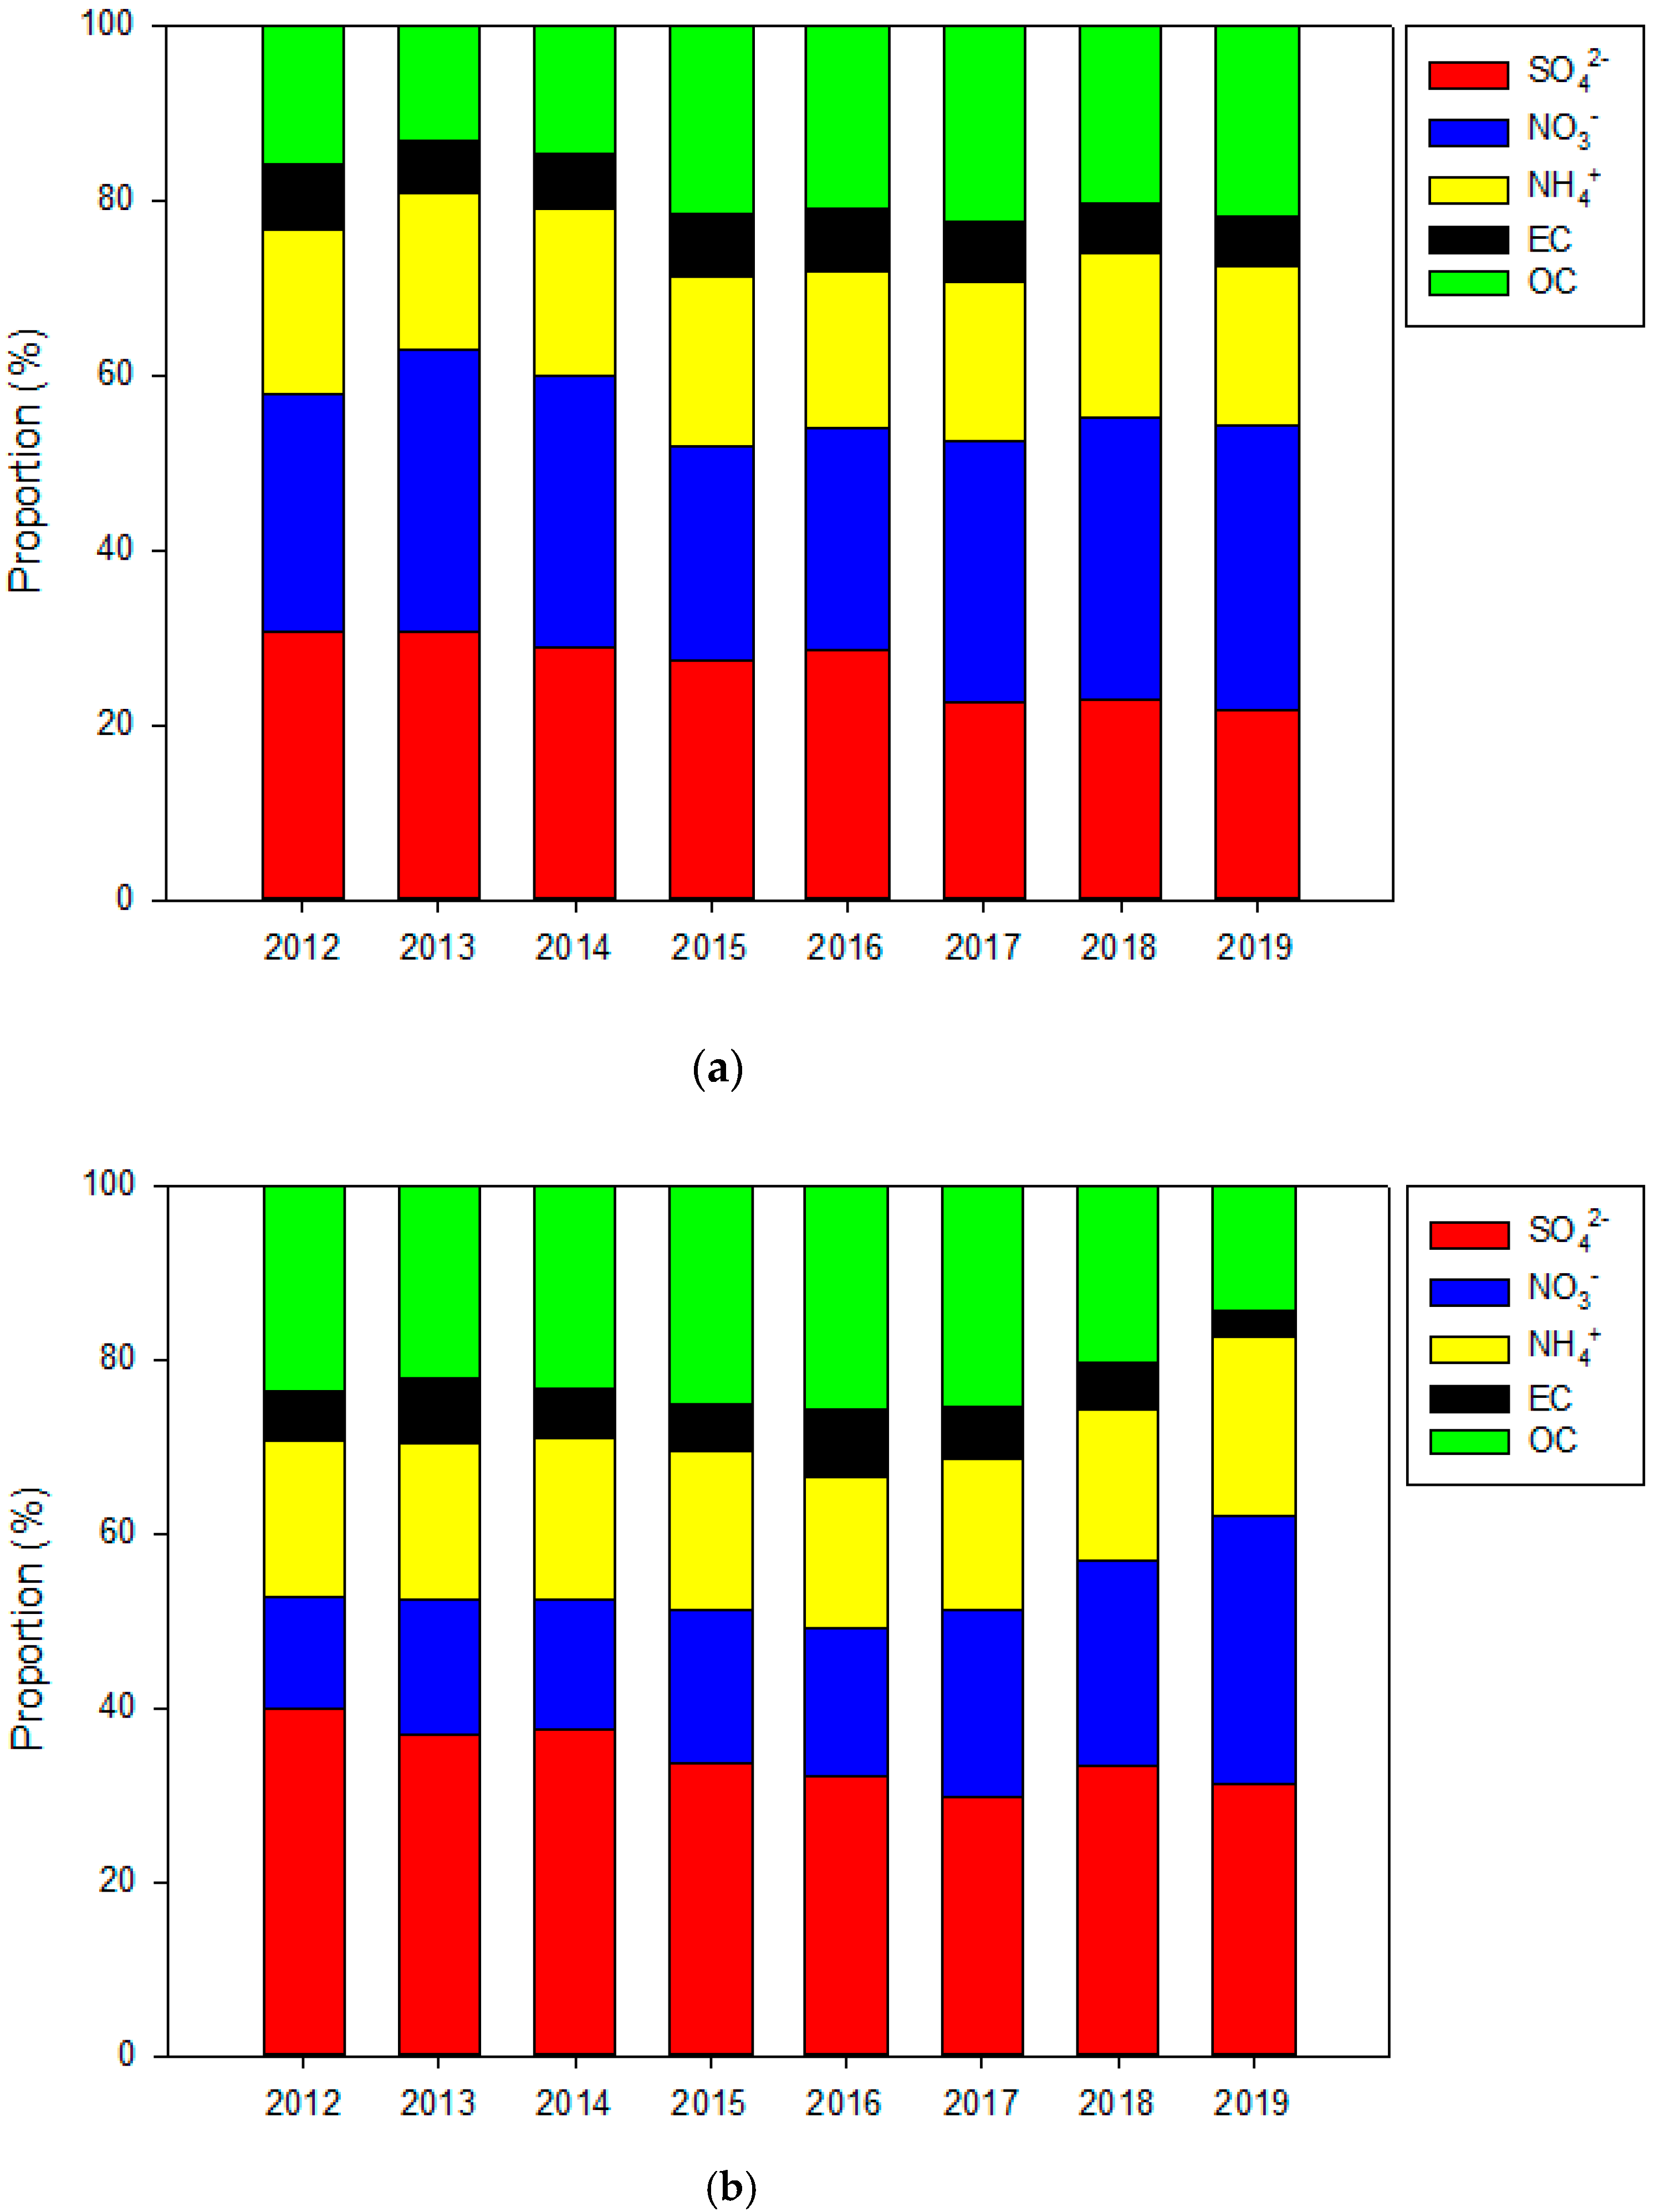
Figure 4 shows the changes of the proportions of major aerosol species in PM2.5 in Seoul and Baengnyeong Island from 2012 to 2019. In Seoul, the proportion of SO42− has steadily decreased since 2012. The proportion of NO3− has steadily increased since 2013, although the proportion decreased slightly in 2015. On Baengnyeong Island, from 2012 to 2018, the proportion of SO42− steadily decreased, and the proportion of NO3− steadily increased. This trend on Baengnyeong Island was similar to that of Seoul; however, the tendency was much clearer than in Seoul. The proportions of NH4+ at both sites did not change greatly. The proportions of EC at both sites decreased, and the proportion of OC is increasing in Seoul.
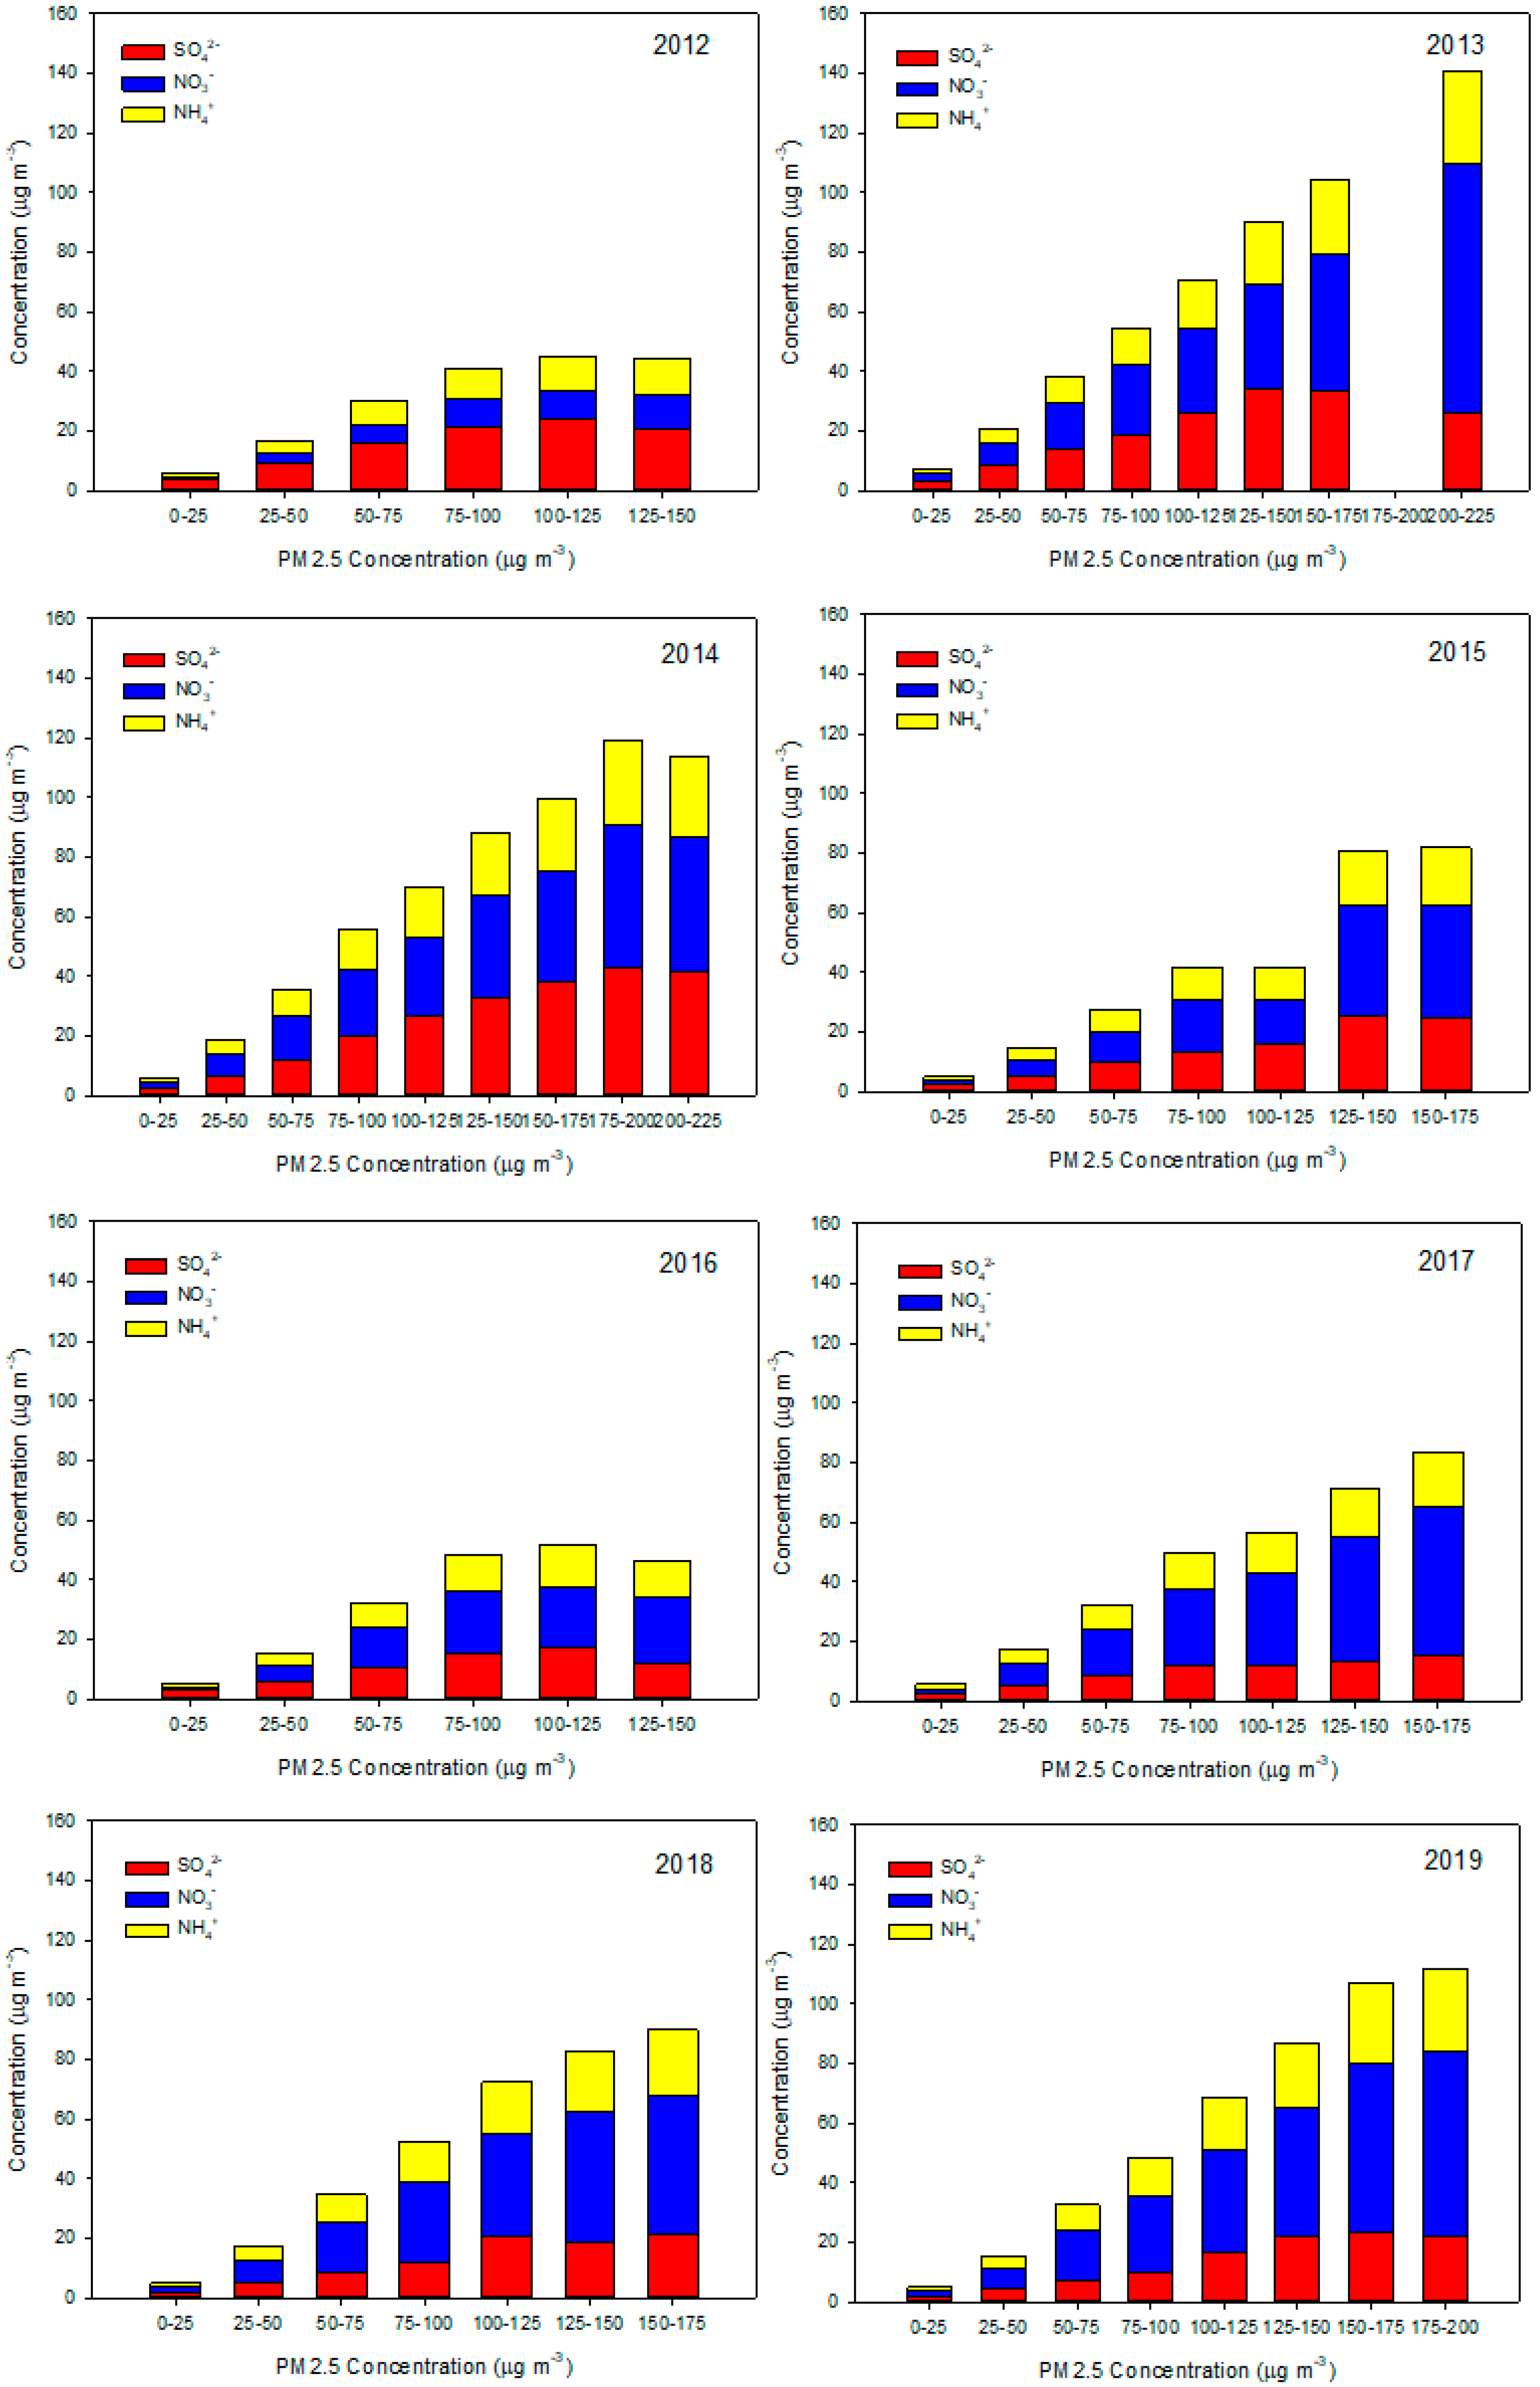
Figure 5 and Figure 6 show the changes in the concentrations of major inorganic ions classified by the PM2.5 concentration level at both sites from 2012 to 2019, respectively. Through this analysis, it is possible to examine which ion became major species as the concentration of PM2.5 increased and which pollutants significantly contributed to the occurrence of high PM2.5 events. Furthermore, it is possible to understand the temporal changes of the major ion species contributing to high PM2.5 episodes. The PM2.5 concentration was divided into sections for every 25 μg m−3. In Seoul, the SO42− concentration increased significantly as the concentration of PM2.5 increased until 2012, but after 2013, the NO3− concentration increased significantly as the concentration of PM2.5 increased. On Baengnyeong Island, the trend was similar to Seoul, but the most significant species changed in 2014. The SO42− concentration increased as the concentration of PM2.5 increased until 2014, but after 2015, the NO3− concentration increased most as the concentration of PM2.5 increased.
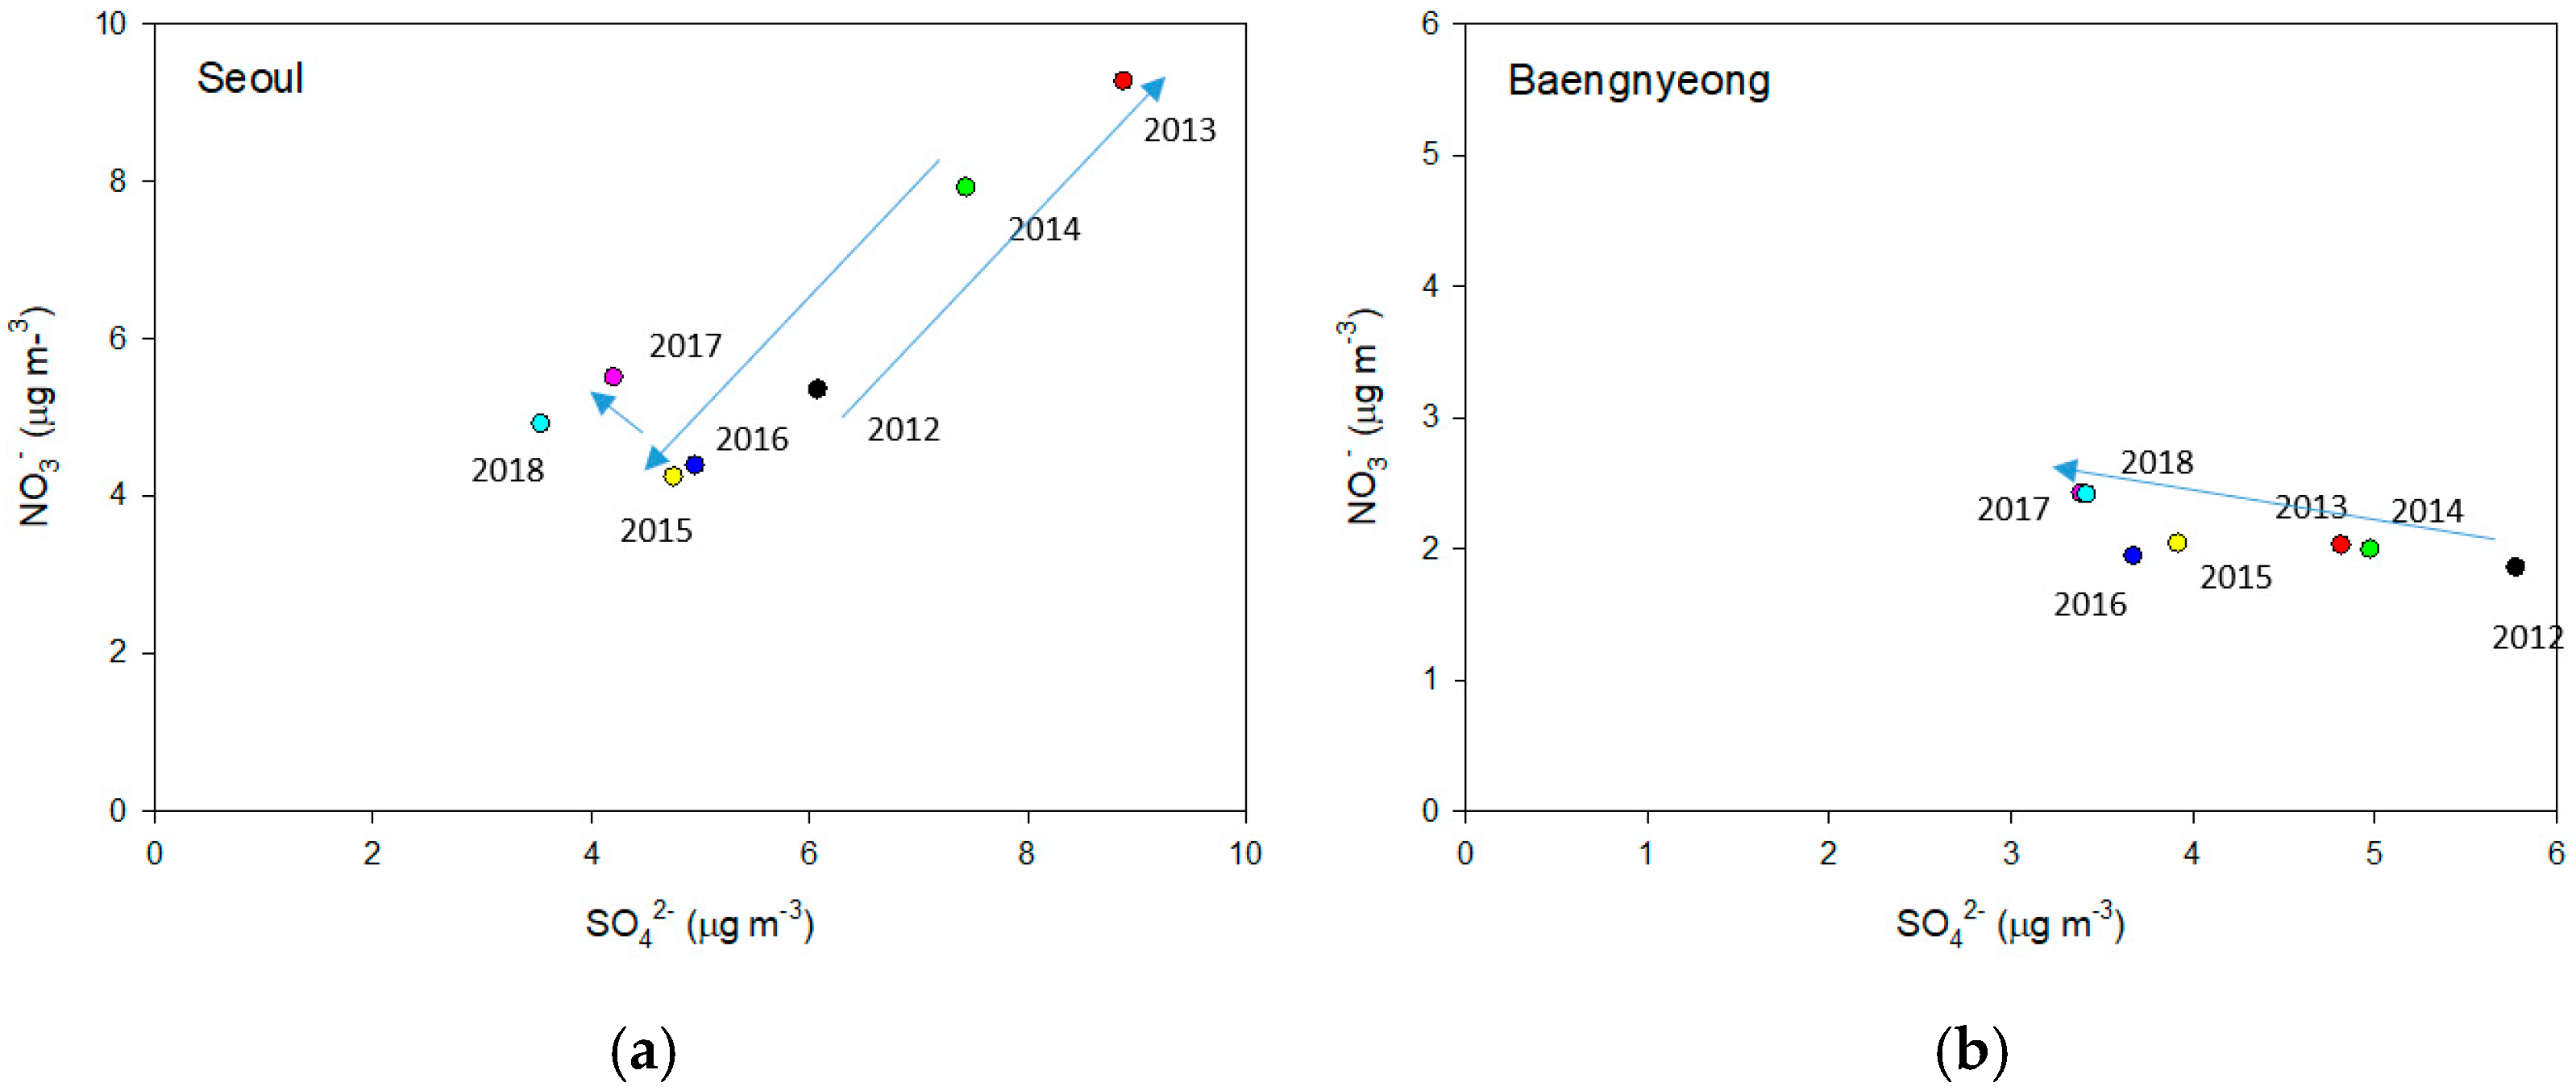
Uno et al. (2020) pointed out that the major ion components contributing to the PM concentrations in downwind areas of China, such as South Korea and Japan, are changing from SO42− to NO3− according to changes of the emission trend in China. Figure 7 shows the changes in SO42− and NO3− concentrations in Seoul and on Baengnyeong Island, similar to the analysis of Uno et al. (2020). In Seoul, SO42− and NO3− increased together in 2012 but showed a decreasing trend until 2016. Since then, SO42− has decreased slightly and NO3− has slightly increased. On Baengnyeong Island, SO42− decreased and NO3− showed a continuous increase from 2012 to 2018. Lee et al. [6] and Ban et al. [7] revealed that before 2014, SO42− showed the highest concentration among ion components in the atmosphere in Baengnyeong Island. In addition, the ratio of NH4+ to SO42− was below 1, indicating that it was slightly acidic. However, after 2014, the most abundant ion component changed to NO3− on Baengnyeong Island, and it has developed an NH4+ surplus status [8]. It has been shown that the concentration of NO3− has been increasing recently instead of SO42−. Since Seoul is a metropolitan area, it may have its own regional influence, as we discussed in Section 3.2, but Baengnyeong Island, which has no major source of pollution, is thought to clearly reflect the changes of the emissions from China.
3.4. SOR and NOR in Seoul and on Baengnyeong Island According to PM2.5 Concentration and RH
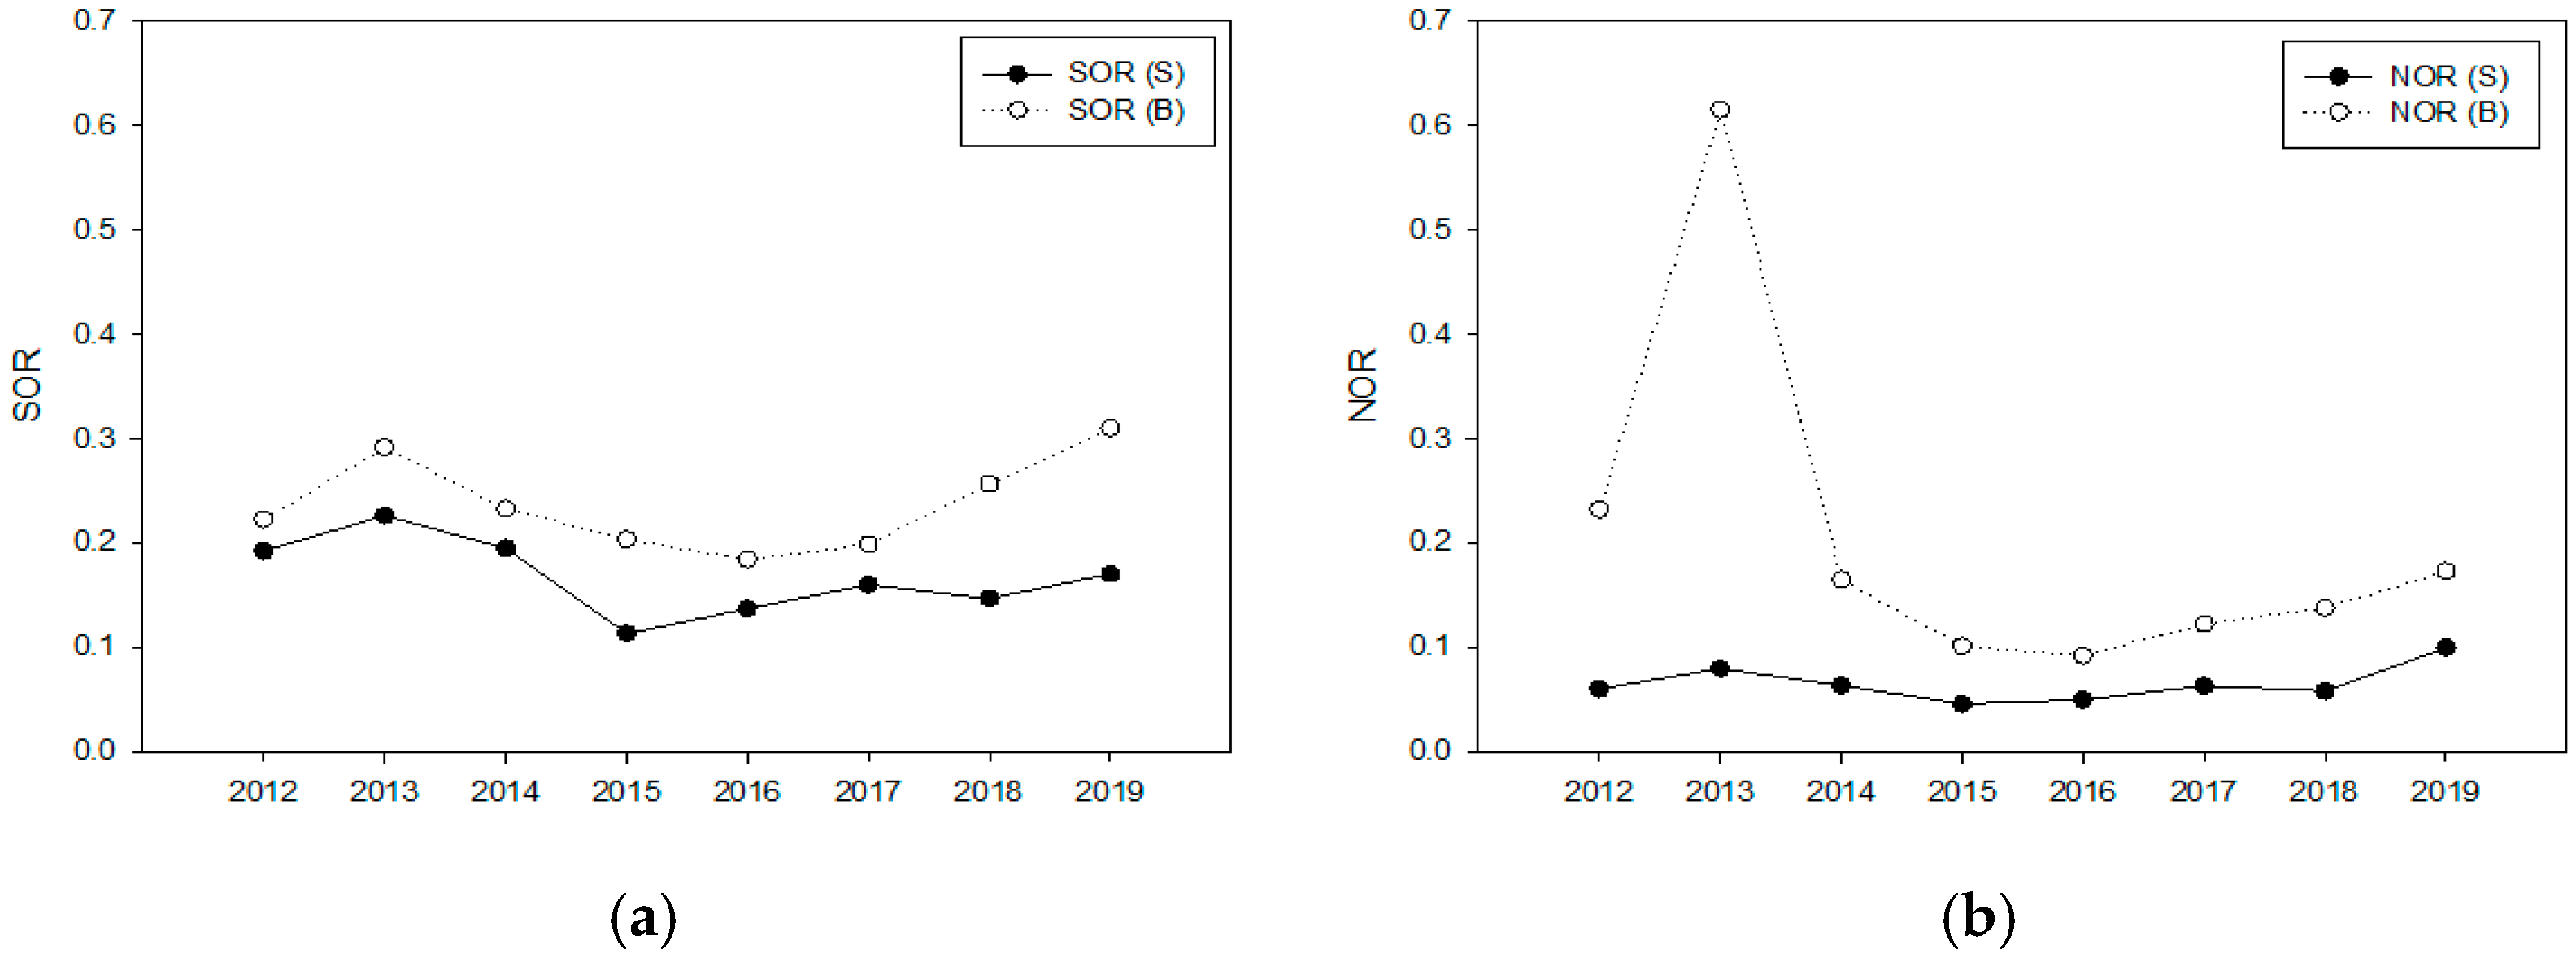
Figure 8 shows the changes in SOR and NOR in Seoul and on Baengnyeong Island from 2012 to 2019. SOR and NOR are indicators of the degree of oxidation of sulfur and nitrogen [7,36,37]. In both SOR and NOR, Baengnyeong Island showed higher values than Seoul throughout the measurement period. This means that the degree of the partitioning status of sulfur and nitrogen species to the particle phase in the atmosphere of Baengnyeong Island is greater than Seoul. As shown in Section 3.1, the concentrations of both SO42− and NO3− in Seoul were higher than Baengnyeong Island. Nevertheless, the smaller SOR and NOR values in Seoul mean that Seoul has higher SO2 and NO2 concentrations compared to Baengnyeong Island. Therefore, in the case of Seoul, as consistently mentioned in Section 3.2, it can be expected that the local influence is significant compared to Baengnyeong Island.
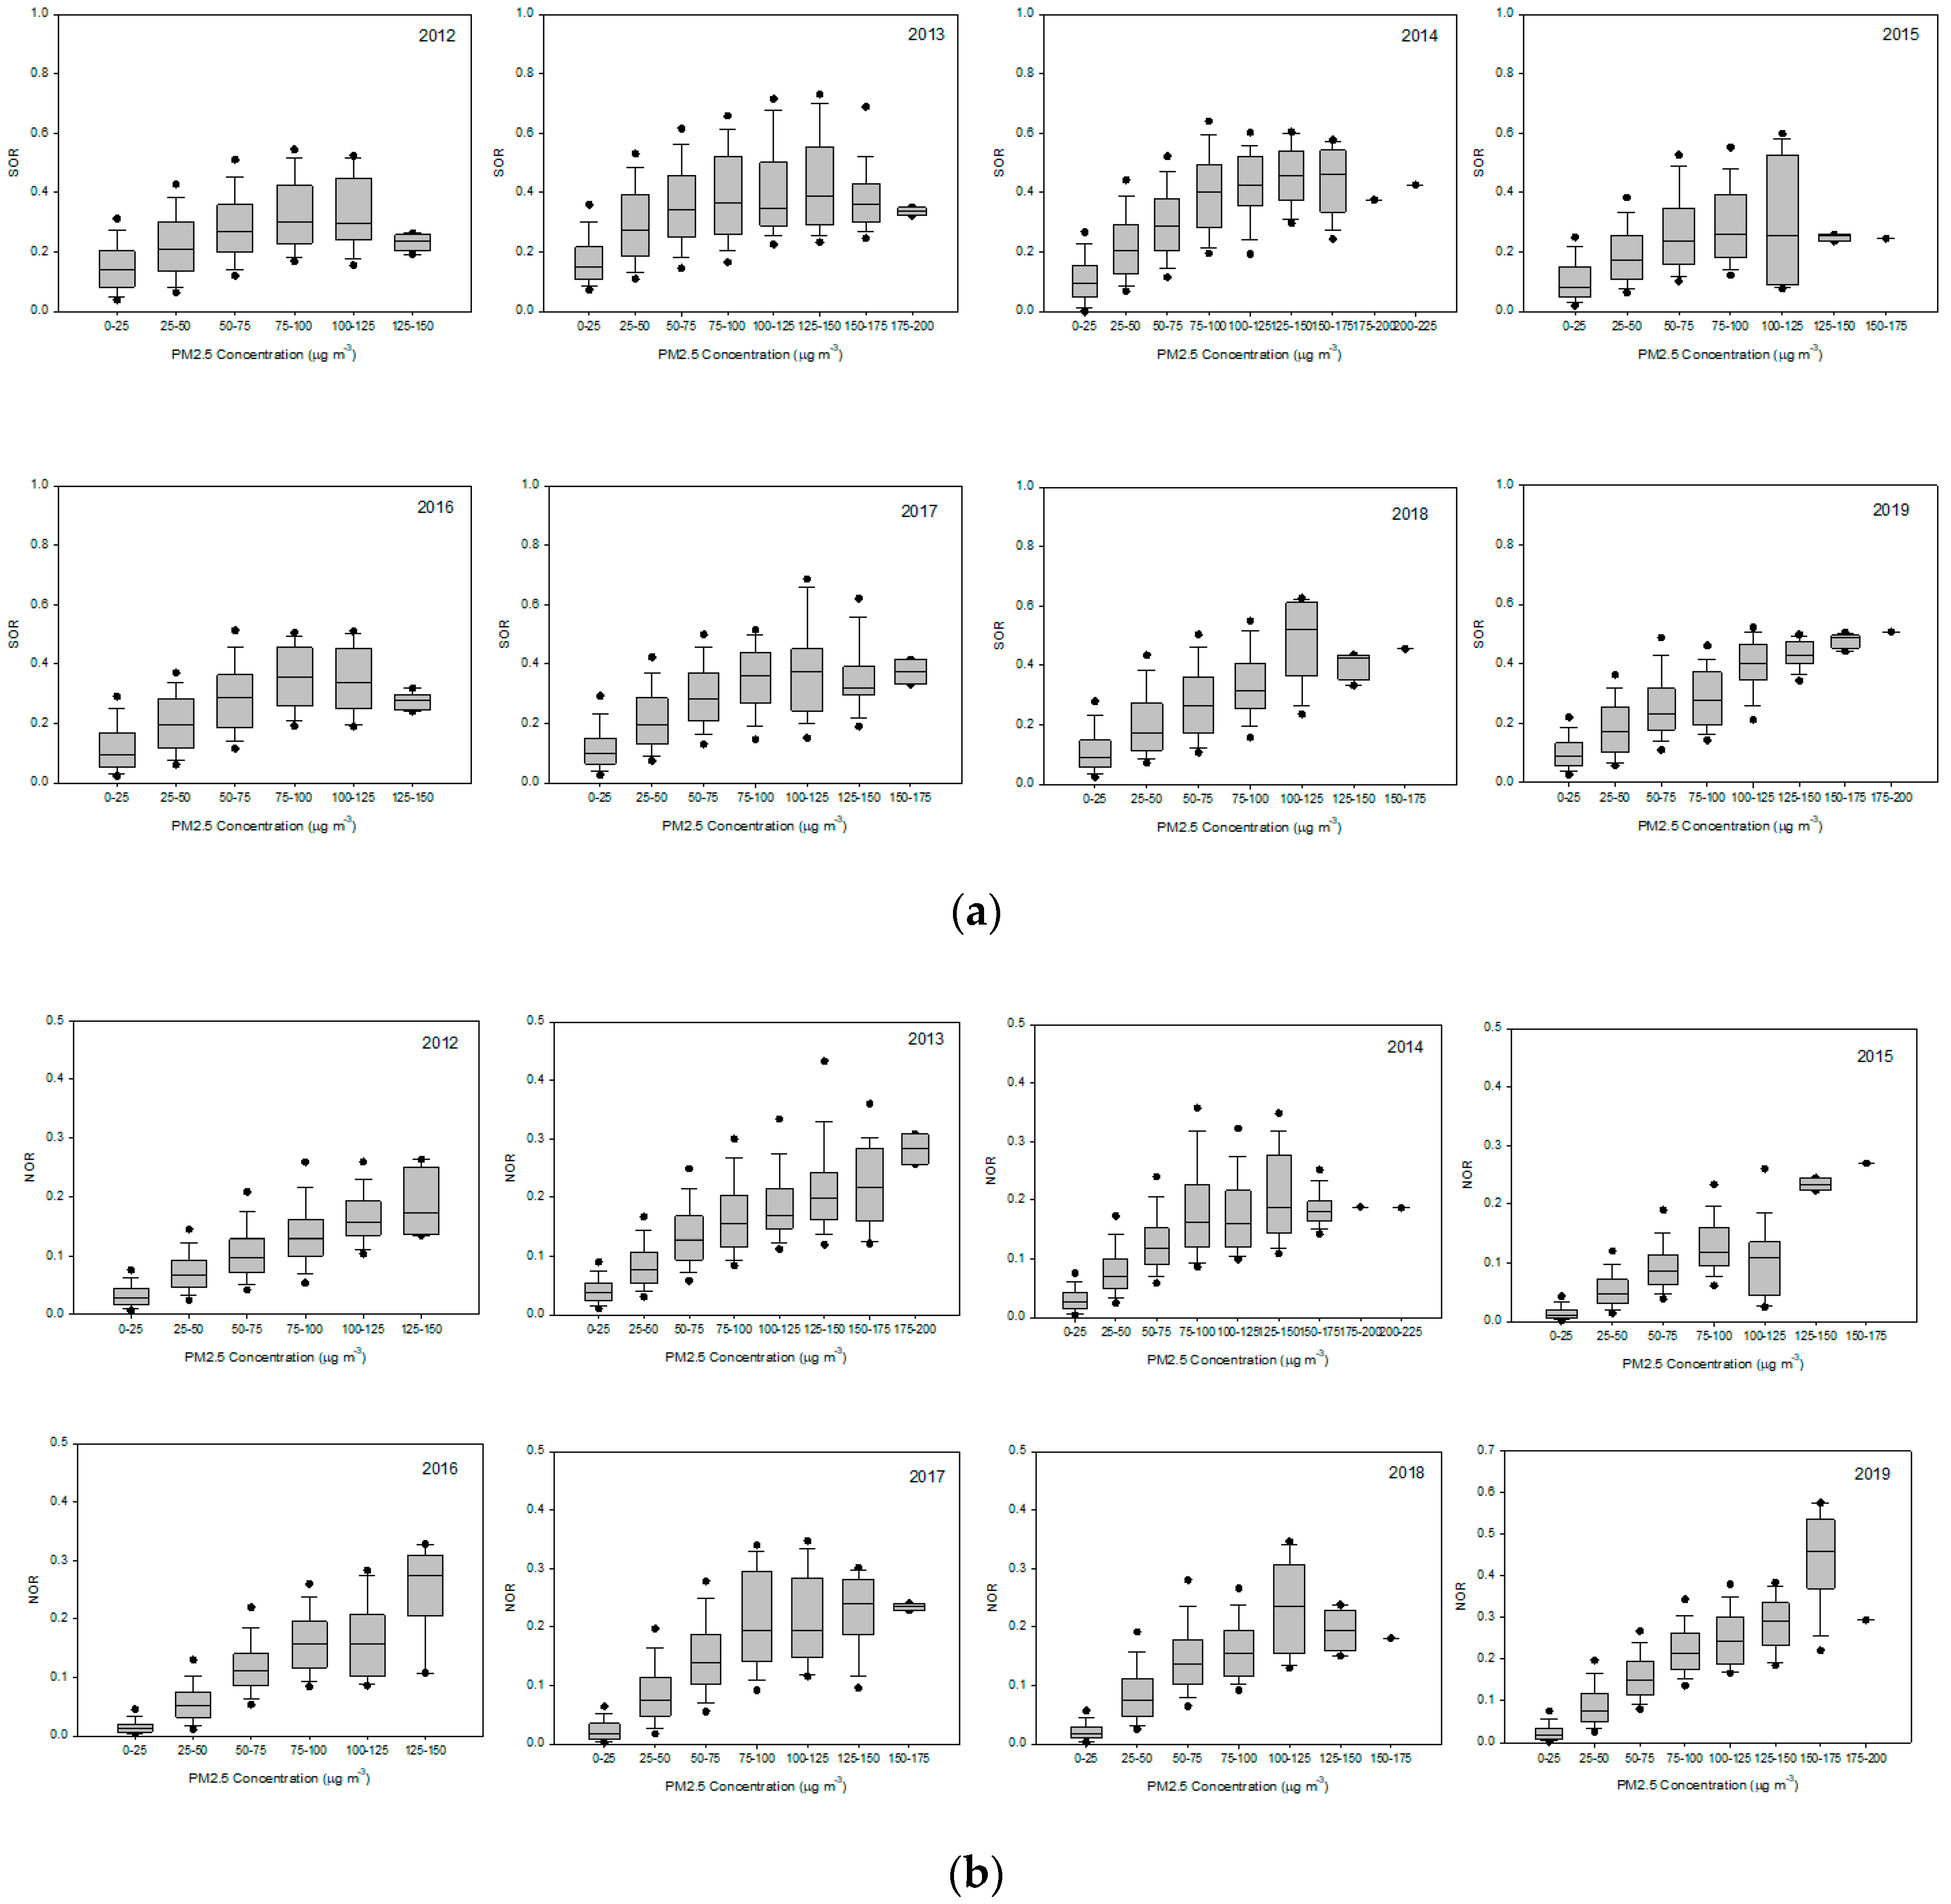
Figure 9 and Figure 10 show the annual changes of SOR and NOR classified by the PM2.5 concentration level at both sites. Generally, the SOR in Seoul increased until the PM2.5 concentration was smaller than 125 μg m−3, but SOR values did not increase greatly with higher concentration levels of PM2.5. However, NOR in Seoul tends to increase gradually with the increase of PM2.5 concentration, even in the higher concentration levels over 125 μg m−3.
On Baengnyeong Island, similar to Seoul, the SOR increases until the concentration of PM2.5 reaches 125 μg m−3, but it tended to decrease after the peak. The values of SOR were larger than that of Seoul. The NOR of Baengnyeong Island, similar to Seoul, showed a linear increase as the concentration of PM2.5 increased. The fact that the SOR and NOR values of Baengnyeong Island were larger than those of Seoul is consistent with the results shown in Figure 8. It is thought that the aerosols in Bangnyeong were of a greater age than Seoul.
The tendencies of SOR are determined by the concentration of SO2 and the state of SO42− that either formed at the measurement area or migrated from outside. In the case of NOR, even when NO2 stopped increasing, the concentration of NO3− continued to increase as the PM concentration increased. This is thought to be due to the steady inflow of NO3−, which oxidizes already even there is a high PM2.5 event in addition to the effect of local emissions. This trend was the same for both Seoul and Baengnyeong Island. In addition, the larger increase of NOR than SOR when a high concentration of PM2.5 occurred might be interpreted to the larger contribution of NO3− than SO42− in the high PM2.5 events in recent years, as shown in Section 3.3.
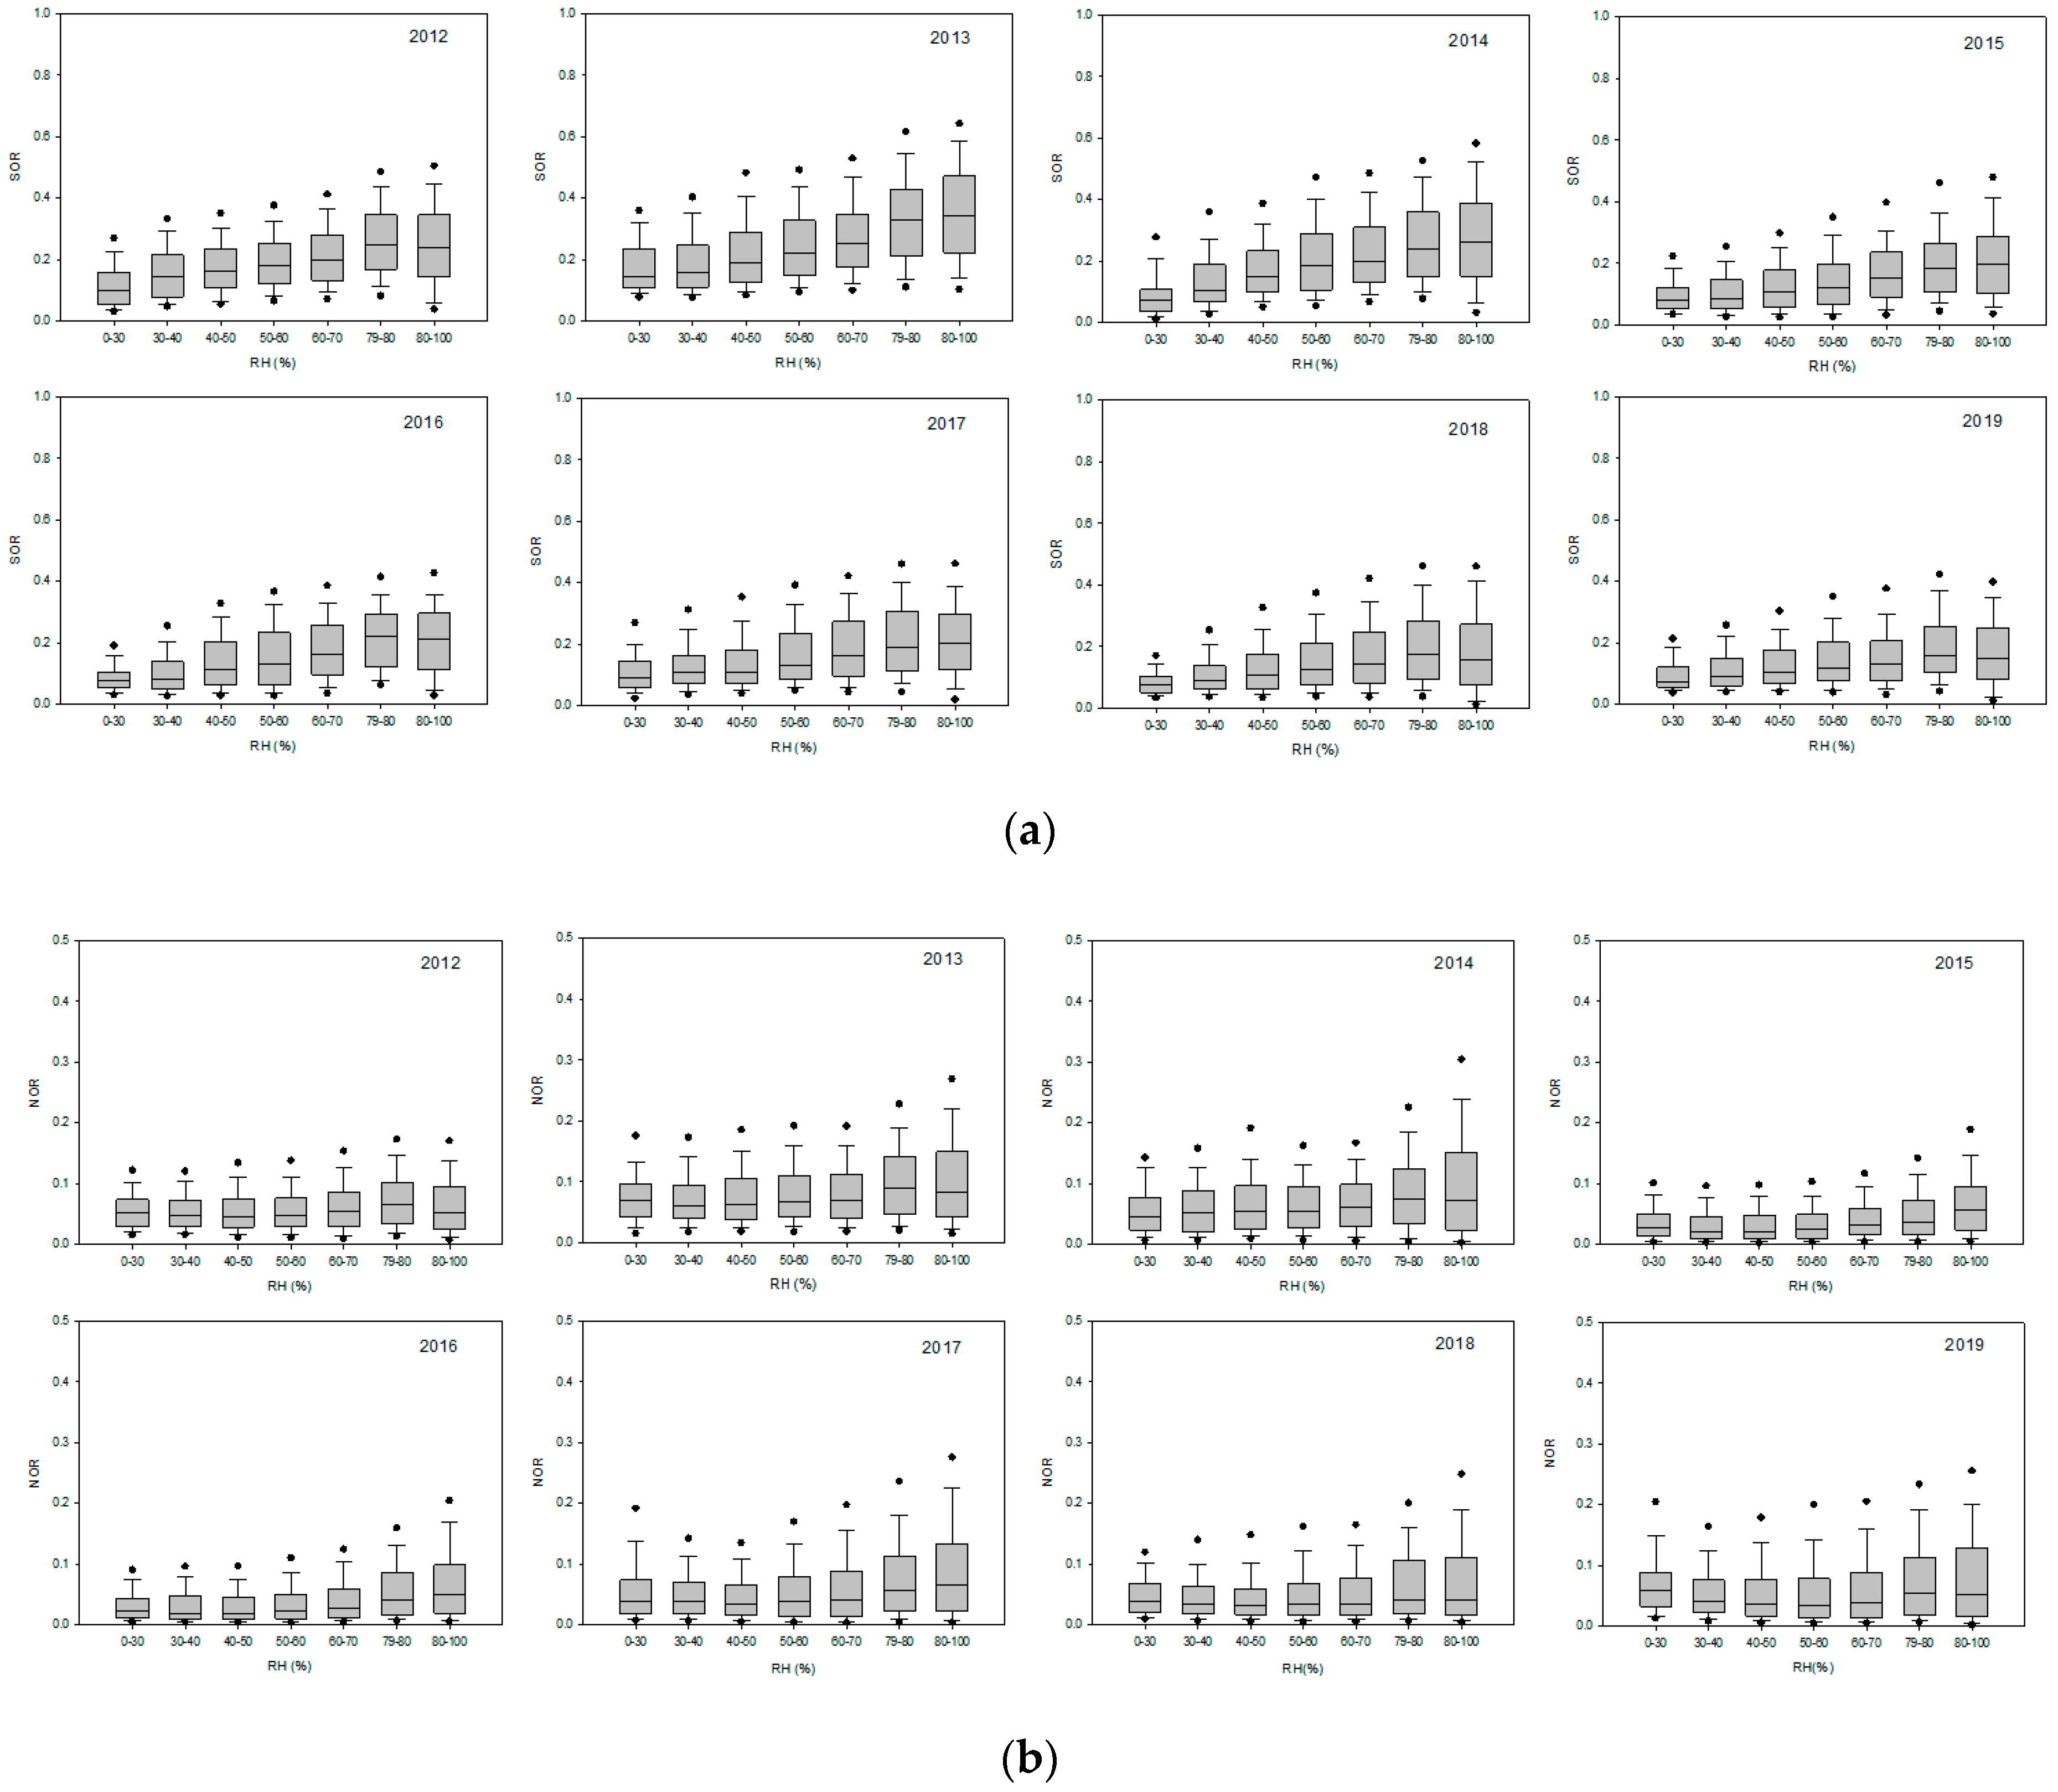
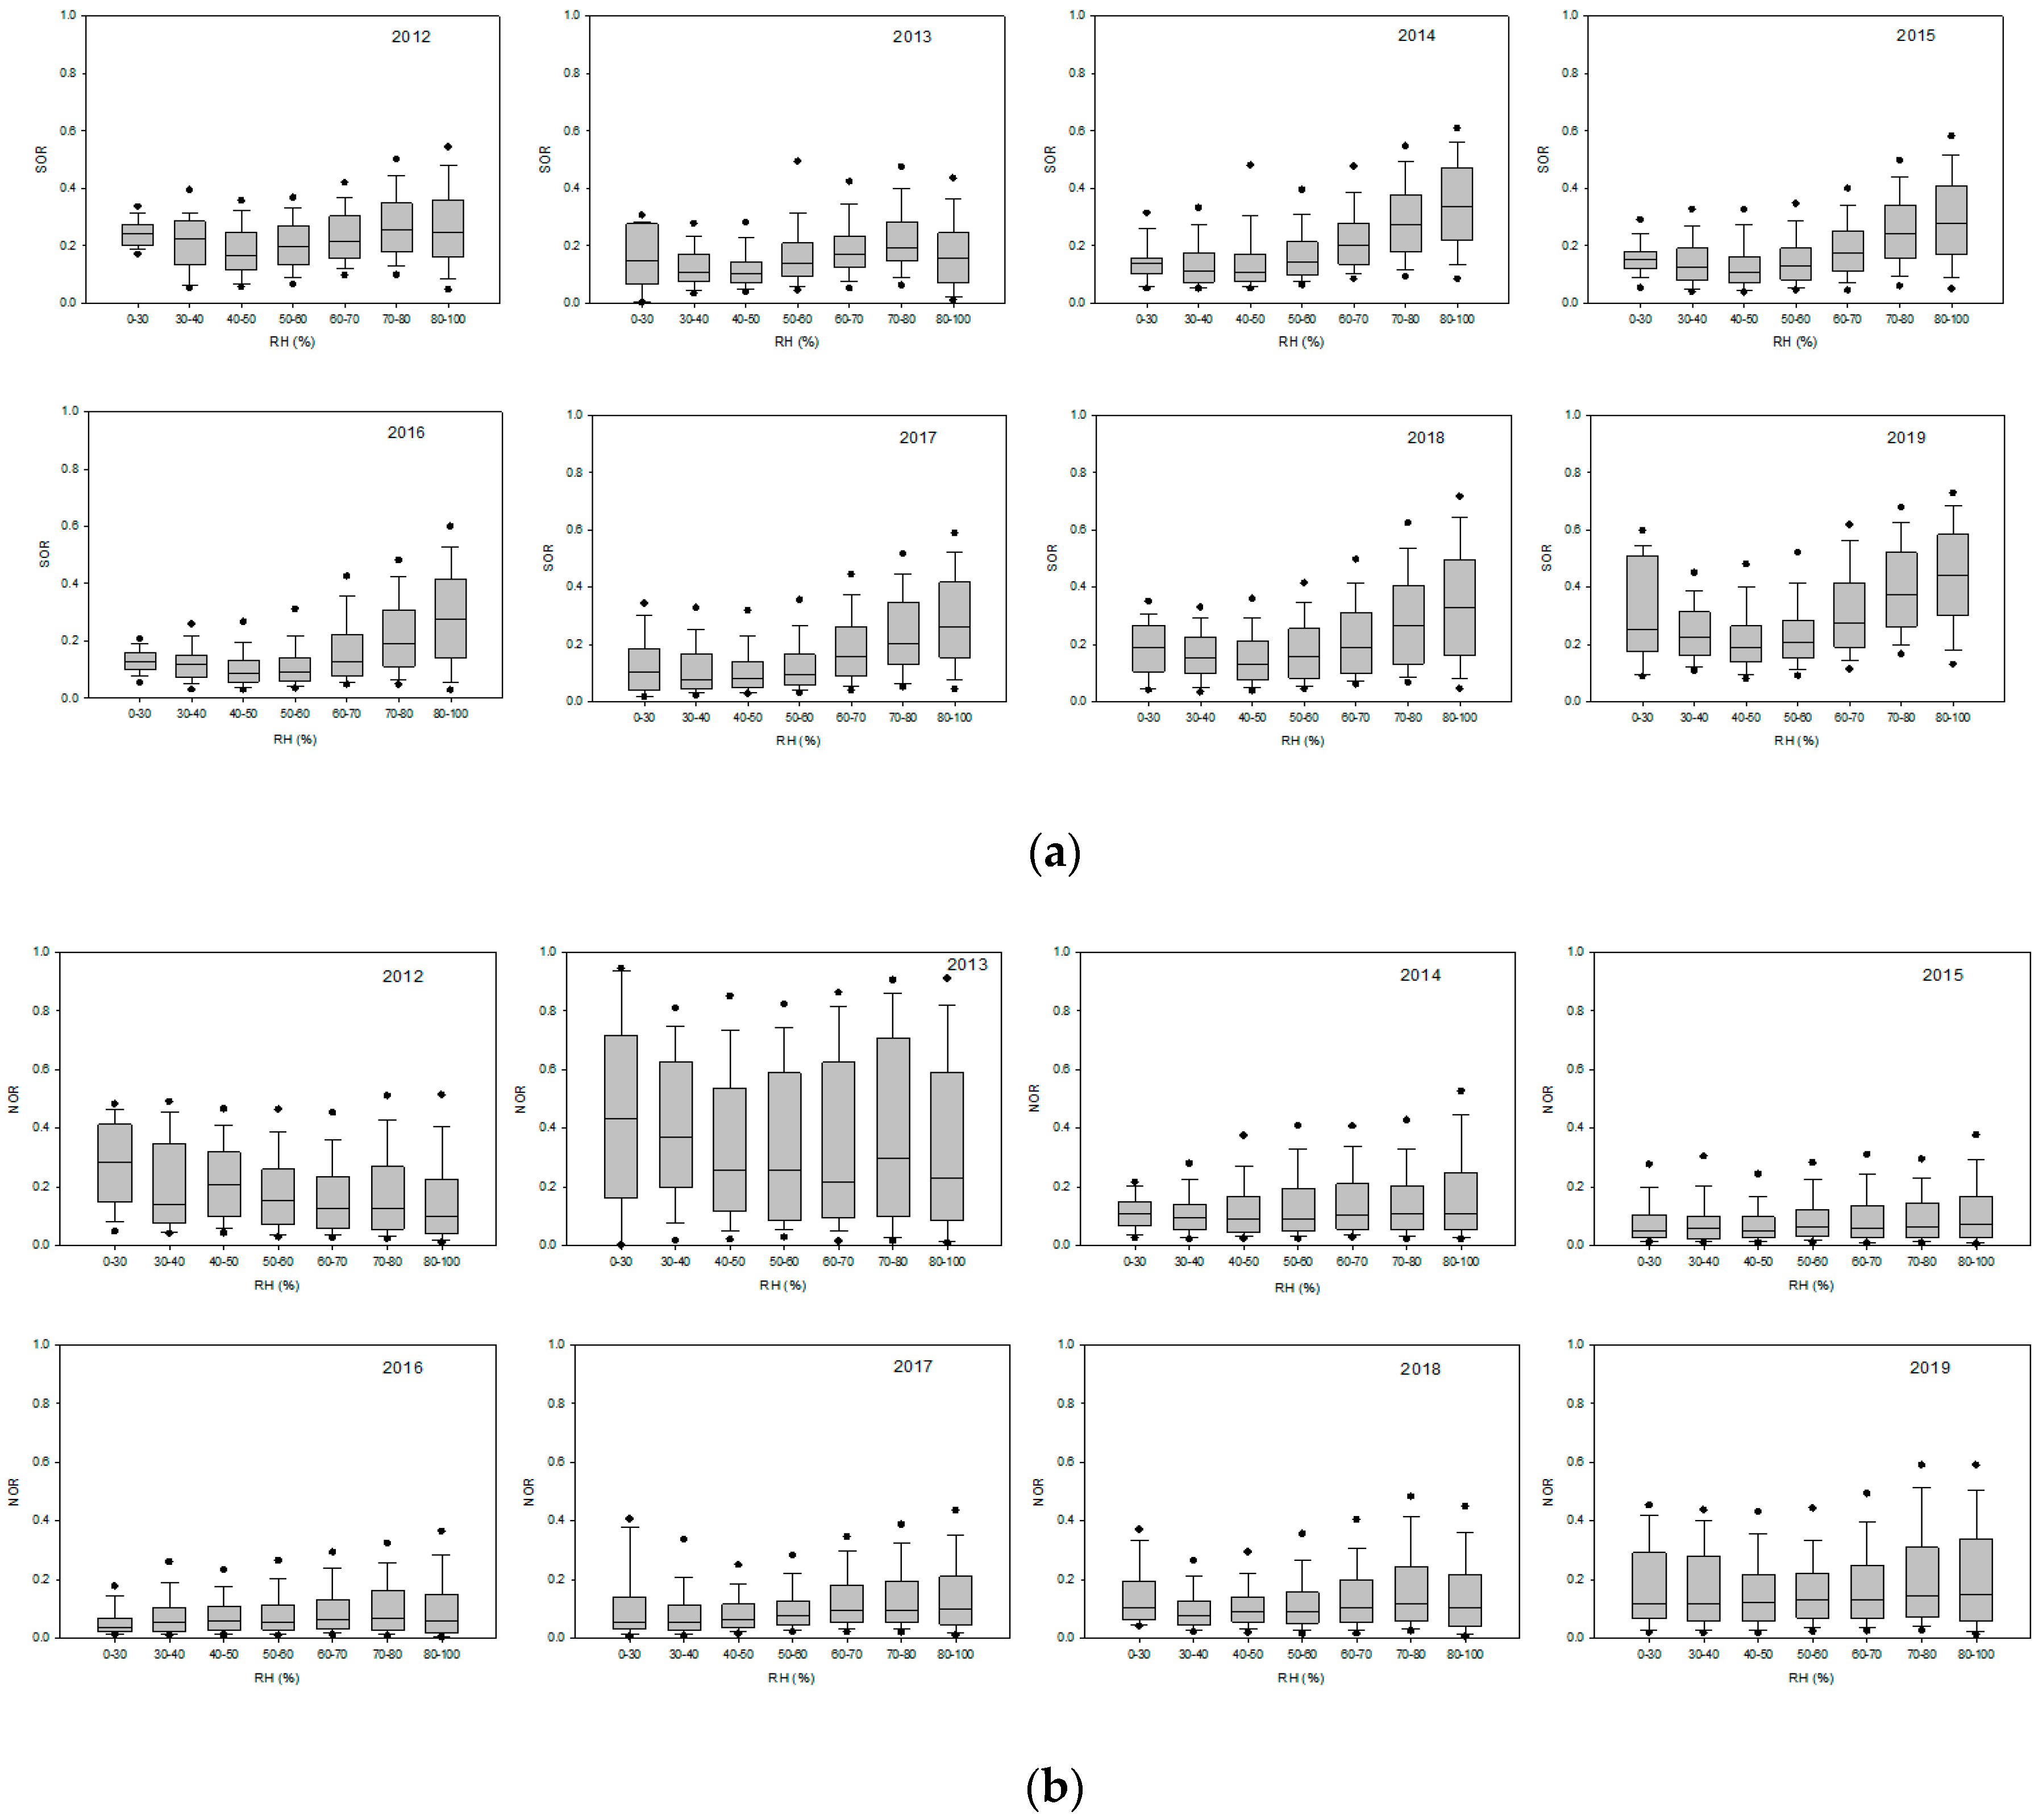
Figure 11 and Figure 12 show the changes in SOR and NOR according to RH changes in Seoul and Baengnyeong Island. As observed in many previous studies [38], SOR at both sites showed a tendency to increase as RH increased. The increase in SOR according to changes in RH was larger on Baengnyeong Island than in Seoul. The effect of humidity seems to be more evident than that of Seoul, because Baengnyeong is an island region. However, neither NOR in Seoul nor on Baengnyeong Island showed a clear correlation with RH.
3.5. The Equivalent Ratios of Ion Components in Seoul and on Baengnyeong Island
In order to calculate the equivalence ratio, the mass concentrations of SO42−, NO3− and NH4+ (unit: μg m−3) were recalculated into the equivalent concentrations (unit: μeq m−3) considering molecular weight and valency. Table 4 and Table 5 show the annual changes in equivalence ratios of NH4+, SO42− and NO3− in Seoul and Baengnyeong Island. Both in Seoul and on Baengnyeong Island, the ratios of NH4+ to SO42− increased; that is, the SO42− concentration decreased compared to NH4+. On the other hand, the ratios of NH4+ to NO3− decreased, because the NO3− concentration increased compared to NH4+ over the last 8 years. Until 2014, the ratios of NH4+ to the sum of SO42− and NO3− in Seoul and Baengnyeong were below 1, so they were all in a weakly acidic state. However, since 2015, the NH4+-rich state has been maintained. This is consistent with the existing research results of [6,8] carried out on Baengnyeong Island.
As explained in the study by Zheng et al. [3], the SO2 emissions in China have decreased since 2011, the SO42− concentration in Northeast Asia has also decreased, and the surplus total NH4+ came to react with NO3−. For this reason, when high PM2.5 events have occurred in recent years, the NO3− concentration has increased significantly instead of SO42−. By analyzing long-term data measured in Seoul and on Baengnyeong Island, we were able to confirm these trends once again. By analyzing the long-term data measured in Seoul and on Baengnyeong Island, it was possible to confirm the change in the concentration of air pollutants in the downwind area according to the change in China’s emissions.
4. Summary and Conclusions
It is important to find out the changes of the levels of air pollutants in Northeast Asia with respect to the changes of the emissions of air pollutants. In this study, we analyzed long-term trends of the chemical composition of fine particles and gaseous species in Seoul, a megacity, and on Baengnyeong Island, a background area located in the Yellow Sea of Republic of Korea (South Korea) from 2012 to 2019. Using the Mann–Kendall trend test and Sen’s slope, long-term changes of the concentrations of air pollutants were analyzed. Changes in major ion components in the atmosphere and the equivalence ratios were examined in relation to changes in the emissions of air pollutants in this area. Compared with previous studies using short-term measurement data or modeling results, this study used long-term actual high temporal resolution measurement data both in Seoul and on Baengnyeong Island.
In Seoul, most of the air pollutants, including PM2.5, showed a decreasing trend over the past 8 years. The major air pollutants including PM2.5 on Baengnyeong Island also showed a decreasing trend; however, NO3− showed a tendency to increase. Compared to Baengnyeong Island, Seoul has a larger decrease in SO42− but a smaller decrease in SO2. To consider the change in emissions around Seoul metropolitan area, the SO2 emissions in the Chungcheongnam-do region, which has large-scale coal-fired power plants and industrial complexes, is on the rise, and this may affect the SO2 concentration of Seoul.
Both in Seoul and on Baengnyeong Island, when the concentration of PM2.5 increased, the proportion of NO3− increased more than the SO42− proportion, and NOR increased more rapidly than SOR. That is, the contribution of NO3− rather than SO42− to the high-concentration PM2.5 has been increasing. As explained in the study by Uno et al. (2020), according to the changes in the air pollutant emissions in this region, NO3− formed the majority of the aerosol proportions in this region. Seoul and Baengnyeong Island are rich in NH4+ in the atmosphere, and due to the SO2 emission reduction, the balance of ammonia–nitric acid–sulfuric acid has changed and the concentration of NO3− is increasing. This trend is more obvious on Baengnyeong Island than in Seoul due to the lower local emissions on Baengnyeong Island. As a result of this study, it was possible to confirm that concentrations of air pollutants and the majority of aerosols affecting PM2.5 concentrations in Northeast Asia have changed according to the change in emissions in this region.
Author Contributions
Conceptualization, N.-K.K. and J.-Y.L.; methodology, N.-K.K. and J.-Y.L.; software, N.-K.K.; validation, N.-K.K. and J.-Y.L.; formal analysis, N.-K.K.; investigation, N.-K.K.; resources, J.-Y.L.; data curation, N.-K.K. and H.-J.S.; writing—original draft preparation, N.-K.K.; writing—review and editing, Y.-P.K. and J.-Y.L.; visualization, N.-K.K.; supervision, Y.-P.K.; project administration, J.-Y.L.; funding acquisition, H.-J.S., Y.-P.K. and J.-Y.L. All authors have read and agreed to the published version of the manuscript.
Funding
This research was funded by the Ministry of Science and ICT (2020M3G1A1114537), the Ministry of Science and ICT (2019M1A2A2103953a) and the National Institute of Environmental Research, Korea (NIER-2021-03-02-013).
Institutional Review Board Statement
Not applicable.
Informed Consent Statement
Not applicable.
Data Availability Statement
Not available.
Acknowledgments
This research was supported by the FRIEND (Fine Particle Research Initiative in East Asia Considering National Differences) Project through the National Research Foundation of Korea (NRF) funded by the Ministry of Science and ICT (2020M3G1A1114537), Technology Development Program to Solve Climate Changes through the National Research Foundation of Korea (NRF) funded by the Ministry of Science and ICT (2019M1A2A2103953a) and the National Institute of Environmental Research, Korea (NIER-2021-03-02-013).
Conflicts of Interest
The authors declare no conflict of interest.
References
- Kim, Y.P.; Lee, G. Trend of Air Quality in Seoul: Policy and Science. Aerosol Air Qual. Res. 2018, 18, 2141–2156. [Google Scholar] [CrossRef] [Green Version]
- UNEP. A Review of 20 Years’ Air Pollution Control in Beijing; UNEP: Gigiri Nairobi, Kenya, 2019. [Google Scholar]
- Zheng, B.; Tong, D.; Li, M.; Liu, F.; Hong, C.; Geng, G.; Li, H.; Li, X.; Peng, L.; Qi, J.; et al. Trends in China’s anthropogenic emissions since 2010 as the consequence of clean air actions. Atmos. Chem. Phys. 2018, 18, 14095–14111. [Google Scholar] [CrossRef] [Green Version]
- Kim, N.K.; Kim, Y.P.; Kang, C.H. Long-term trend of aerosol composition and direct radiative forcing due to aerosols over Gosan: TSP, PM10, and PM2.5 data between 1992 and 2008. Atmos. Environ. 2011, 45, 6107–6115. [Google Scholar] [CrossRef]
- Shimada, K.; Takami, A.; Ishida, T.; Taniguchi, Y.; Hasegawa, S.; Chan, C.K.; Kim, Y.P.; Lin, N.-H.; Hatakeyama, S. Long-term Measurements of Carbonaceous Aerosol at Cape Hedo, Okinawa, Japan: Effects of Changes in Emissions in East Asia. Aerosol Air Qual. Res. 2021, 21, 2000505. [Google Scholar] [CrossRef]
- Lee, T.; Choi, J.; Lee, G.; Ahn, J.; Park, J.S.; Atwood, S.A.; Schurman, M.; Choi, Y.; Chung, Y.; Collett, J.L. Characterization of aerosol composition, concentrations, and sources at Baengnyeong Island, Korea using an aerosol mass spectrometer. Atmos. Environ. 2015, 120, 297–306. [Google Scholar] [CrossRef]
- Ban, J.; Park, T.; Park, S.M.; Shin, H.-J.; Lim, Y.-J.; Choi, J.; Lee, M.-D.; Lee, S.-B.; Kim, J.; Lee, T. The Ionic Composition and Acidity of PM2.5 at Baengnyeong Island during the High Concentration Episodes (2013~2014). J. Korean Soc. Atmos. Environ. 2018, 34, 780–791. [Google Scholar] [CrossRef]
- Jo, Y.-J.; Lee, H.-J.; Jo, H.-Y.; Woo, J.-H.; Kim, Y.; Lee, T.; Heo, G.; Park, S.-M.; Jung, D.; Park, J.; et al. Changes in inorganic aerosol compositions over the Yellow Sea area from impact of Chinese emissions mitigation. Atmosph. Res. 2020, 240, 104948. [Google Scholar] [CrossRef]
- Shin, H.J.; Park, S.-M.; Park, J.S.; Song, I.H.; Hong, Y.D. Chemical Characteristics of High PM Episodes Occurring in Spring 2014, Seoul, Korea. Adv. Meteorol. 2016, 2016, 2424875. [Google Scholar] [CrossRef] [Green Version]
- NIER. 2017 Annual Report of Intensive Air Quality Monitoring Station; NIER: Incheon, Korea, 2018. [Google Scholar]
- Kang, S.; Lee, S.H.; Cho, N.; Aggossou, C.; Chun, J. Dust and sandstorm: Ecosystem perspectives on dryland hazards in Northeast Asia: A review. J. Ecol. Environ. 2021, 45, 25. [Google Scholar] [CrossRef]
- Kim, M.J. Changes in the Relationship between Particulate Matter and Surface Temperature in Seoul from 2002–2017. Atmosphere 2019, 10, 238. [Google Scholar] [CrossRef] [Green Version]
- Park, T.; Ban, J.; Kang, S.; Ghim, Y.S.; Shin, H.-J.; Park, J.S.; Park, S.M.; Moon, K.J.; Lim, Y.-J.; Lee, M.-D.; et al. Chemical Characteristics of PM1 using Aerosol Mass Spectrometer at Baengnyeong Island and Seoul Metropolitan Area. J. Korean Soc. Atmos. Environ. 2018, 34, 430–446. [Google Scholar] [CrossRef]
- Park, S.-S.; Jung, S.-A.; Gong, B.-J.; Cho, S.-Y.; Lee, S.-J. Characteristics of PM2.5 Haze Episodes Revealed by Highly Time-Resolved Measurements at an Air Pollution Monitoring Supersite in Korea. Aerosol Air Qual. Res. 2013, 13, 957–976. [Google Scholar] [CrossRef]
- AirKorea. Available online: https://www.airkorea.or.kr/web (accessed on 16 May 2019).
- Mann, H.B. Nonparametric Tests against Trend. Econometrica 1945, 13, 245–259. [Google Scholar] [CrossRef]
- Kendall, M.G. Rank Correlation Methods, 4th ed.; Charles Griffin: London, UK, 1975. [Google Scholar]
- Chaudhuri, S.; Dutta, D. Mann-Kendall trend of pollutants, temperature and humidity over an urban station of India with forecast verification using different ARIMA models. Environ. Monit. Assess 2014, 186, 4719–4742. [Google Scholar] [CrossRef]
- Gocic, M.; Trajkovic, S. Analysis of changes in meteorological variables using Mann-Kendall and Sen’s slope estimator statistical tests in Serbia. Glob. Planet. Chang. 2013, 100, 172–182. [Google Scholar] [CrossRef]
- Garrido, A.; Jiménez-Guerrero, P.; Ratola, N. Levels, trends and health concerns of atmospheric PAHs in Europe. Atmos. Environ. 2014, 99, 474–484. [Google Scholar] [CrossRef]
- Liao, K.; Yu, J.Z. Abundance and sources of benzo[a]pyrene and other PAHs in ambient air in Hong Kong: A review of 20-year measurements (1997–2016). Chemosphere 2020, 259, 127518. [Google Scholar] [CrossRef]
- Sen, P.K. Estimates of the Regression Coefficient Based on Kendall’s Tau. J. Am. Stat. Assoc. 1968, 63, 1379–1389. [Google Scholar] [CrossRef]
- Lettenmaier, D.P.; Wood, E.F.; Wallis, J.R. Hydro-climatological trends in the continental United States, 1948–1988. J. Clim. 1994, 7, 586–607. [Google Scholar] [CrossRef] [Green Version]
- Yue, S.; Hashino, M. Temperature trends in Japan: 1900–1996. Theor. Appl. Climatol. 2003, 75, 15–27. [Google Scholar] [CrossRef]
- Yunling, H.; Yiping, Z. Climate Change from 1960 to 2000 in the Lancang River Valley, China. Mt. Res. Dev. 2005, 25, 341–348. [Google Scholar] [CrossRef] [Green Version]
- Pohlert, T. Non-Parametric Trend Tests and Change-Point Detection; Creative Commons Corporation: Los Angeles, CA, USA, 2020. [Google Scholar]
- NIER. 2020 Annual Report of Air Quality in Korea; NIER: Incheon, Korea, 2019. [Google Scholar]
- Grosjean, D.; Friedlander, S.K. Gas-Particle Distribution Factors for Organic and Other Pollutants in the Los Angeles Atmosphere. J. Air Pollut. Control Assoc. 1975, 25, 1038–1044. [Google Scholar] [CrossRef] [Green Version]
- Khoder, M.I. Atmospheric conversion of sulfur dioxide to particulate sulfate and nitrogen dioxide to particulate nitrate and gaseous nitric acid in an urban area. Chemosphere 2002, 49, 675–684. [Google Scholar] [CrossRef]
- Yu, G.-H.; Park, S.-S.; Park, J.S.; Park, S.M.; Song, I.H.; Oh, J.; Shin, H.J.; Lee, M.D.; Lim, H.B.; Kim, H.W.; et al. Pollution Characteristics of PM2.5 Observed during Winter and Summer in Baengryeongdo and Seoul. J. Korean Soc. Atmos. Environ. 2018, 34, 38–55. [Google Scholar] [CrossRef]
- Bhardwaj, P.; Ki, S.J.; Kim, Y.H.; Woo, J.H.; Song, C.K.; Park, S.Y.; Song, C.H. Recent changes of trans-boundary air pollution over the Yellow Sea: Implications for future air quality in South Korea. Environ. Pollut. 2019, 247, 401–409. [Google Scholar] [CrossRef]
- Souri, A.H.; Choi, Y.; Jeon, W.; Woo, J.H.; Zhang, Q.; Kurokawa, J.i. Remote sensing evidence of decadal changes in major tropospheric ozone precursors over East Asia. J. Geophys. Res. Atmos. 2017, 122, 2474–2492. [Google Scholar] [CrossRef]
- Clean Air Policy Support System (CAPSS). Available online: https://www.air.go.kr/en/jbgg/sub03 (accessed on 16 May 2019).
- Kim, S.; Kim, O.; Kim, B.-U.; Kim, H.C. Impact of Emissions from Major Point Sources in Chungcheongnam-do on Surface Fine Particulate Matter Concentration in the Surrounding Area. J. Korean Soc. Atmos. Environ. 2017, 33, 159–173. [Google Scholar] [CrossRef] [Green Version]
- Son, S.-C.; Park, S.; Bae, M.; Kim, S. A Study on Characteristics of High PM2.5 Pollution Observed around Large-scale Stationary Sources in Chungcheongnam-do Province. J. Korean Soc. Atmos. Environ. 2020, 36, 669–687. [Google Scholar] [CrossRef]
- Squizzato, S.; Masiol, M.; Brunelli, A.; Pistollato, S.; Tarabotti, E.; Rampazzo, G.; Pavoni, B. Factors determining the formation of secondary inorganic aerosol: A case study in the Po Valley (Italy). Atmos. Chem. Phys. 2013, 13, 1927–1939. [Google Scholar] [CrossRef] [Green Version]
- Kim, Y.; Seo, J.; Kim, J.Y.; Lee, J.Y.; Kim, H.; Kim, B.M. Characterization of PM2.5 and identification of transported secondary and biomass burning contribution in Seoul, Korea. Environ. Sci. Pollut. Res. Int. 2018, 25, 4330–4343. [Google Scholar] [CrossRef]
- Kong, L.; Feng, M.; Liu, Y.; Zhang, Y.; Zhang, C.; Li, C.; Qu, Y.; An, J.; Liu, X.; Tan, Q.; et al. Elucidating the pollution characteristics of nitrate, sulfate and ammonium in PM2.5 in Chengdu, southwest China, based on 3-year measurements. Atmos. Chem. Phys. 2020, 20, 11181–11199. [Google Scholar] [CrossRef]
Figure 1.
The annual levels of major atmospheric aerosols. The annual mean (red circle), minimum, interquartile range (Q1), median, interquartile range (Q3) and maximum values are shown.
Figure 1.
The annual levels of major atmospheric aerosols. The annual mean (red circle), minimum, interquartile range (Q1), median, interquartile range (Q3) and maximum values are shown.

Figure 2.
The annual levels of gaseous species. The annual mean (red circle), minimum, interquartile range (Q1), median, interquartile range (Q3) and maximum values are shown.
Figure 2.
The annual levels of gaseous species. The annual mean (red circle), minimum, interquartile range (Q1), median, interquartile range (Q3) and maximum values are shown.

Figure 3.
Emissions of SOx, NOx and CO in China and South Korea. (a) SOx (SO2), (b) NOx and (c) CO.

Figure 4.
Changes of the proportions of major aerosol species in PM2.5: (a) Seoul; (b) Baengnyeong Island.
Figure 4.
Changes of the proportions of major aerosol species in PM2.5: (a) Seoul; (b) Baengnyeong Island.

Figure 5.
Changes in the concentrations of major ion components according to PM2.5 concentration in Seoul.
Figure 5.
Changes in the concentrations of major ion components according to PM2.5 concentration in Seoul.

Figure 6.
Changes in the concentrations of major ion components according to PM2.5 concentration on Baengnyeong Island.
Figure 6.
Changes in the concentrations of major ion components according to PM2.5 concentration on Baengnyeong Island.

Figure 7.
The changes in SO42− and NO3− concentrations: (a) Seoul; (b) Baengnyeong Island.

Figure 8.
The changes in SOR and NOR in Seoul and Baengnyeong: (a) SOR; (b) NOR.

Figure 9.
Changes in the SOR and NOR according to PM2.5 concentration in Seoul: (a) SOR; (b) NOR.

Figure 10.
Changes in the SOR and NOR according to PM2.5 concentration on Baengnyeong Island: (a) SOR; (b) NOR.
Figure 10.
Changes in the SOR and NOR according to PM2.5 concentration on Baengnyeong Island: (a) SOR; (b) NOR.

Figure 11.
Changes in the SOR and NOR according to RH in Seoul: (a) SOR; (b) NOR.

Figure 12.
Changes in the SOR and NOR according to RH on Baengnyeong Island: (a) SOR; (b) NOR.


Table 1.
The annual mean concentrations of major air pollutants between 2012 and 2019.
| Year | Atmospheric Aerosols (μg m−3) | Gaseous Species (ppb) | |||||||||
|---|---|---|---|---|---|---|---|---|---|---|---|
| PM2.5 | SO42− | NO3− | NH4+ | EC | OC | SO2 | NO2 | CO | O3 | ||
| Seoul | 2012 | 28.8 | 6.07 | 5.36 | 3.70 | 1.52 | 3.13 | 5.37 | 26.4 | 545 | 22.3 |
| 2013 | 38.3 | 8.88 | 9.28 | 5.19 | 1.76 | 3.80 | 4.97 | 31.1 | 608 | 20.9 | |
| 2014 | 37.3 | 7.43 | 7.93 | 4.95 | 1.56 | 3.82 | 5.11 | 32.5 | 557 | 23.2 | |
| 2015 | 28.0 | 4.75 | 4.25 | 3.35 | 1.26 | 3.73 | 5.43 | 31.9 | 501 | 21.5 | |
| 2016 | 27.4 | 4.95 | 4.40 | 3.16 | 1.23 | 3.64 | 5.55 | 30.5 | 454 | 25.9 | |
| 2017 | 27.0 | 4.20 | 5.52 | 3.39 | 1.28 | 4.15 | 4.33 | 25.9 | 581 | 28.5 | |
| 2018 | 23.3 | 3.54 | 4.93 | 2.91 | 0.90 | 3.12 | 4.01 | 25.1 | 517 | 28.1 | |
| 2019 | 26.5 | 3.65 | 5.50 | 3.06 | 0.93 | 3.68 | 4.52 | 23.9 | 569 | 29.6 | |
| Baeng-nyeong Island | 2012 | 21.5 | 5.77 | 1.86 | 2.55 | 0.82 | 3.43 | 4.02 | 2.99 | 303 | 23.3 |
| 2013 | 25.9 | 4.81 | 2.03 | 2.33 | 0.97 | 2.88 | 5.54 | 2.41 | 287 | 33.9 | |
| 2014 | 28.7 | 4.97 | 2.00 | 2.44 | 0.74 | 3.12 | 3.20 | 3.04 | 317 | 49.1 | |
| 2015 | 23.7 | 3.92 | 2.04 | 2.14 | 0.60 | 2.96 | 2.99 | 4.57 | 322 | 46.7 | |
| 2016 | 21.8 | 3.67 | 1.95 | 1.99 | 0.86 | 2.97 | 2.70 | 4.56 | 284 | 45.3 | |
| 2017 | 22.0 | 3.39 | 2.43 | 1.98 | 0.67 | 2.91 | 2.53 | 4.28 | 319 | 42.6 | |
| 2018 | 17.5 | 3.41 | 2.42 | 1.79 | 0.55 | 2.11 | 2.00 | 3.48 | 401 | 42.1 | |
| 2019 | 20.3 | 4.99 | 4.93 | 3.29 | 0.51 | 2.31 | 1.66 | 3.96 | 372 | 45.4 | |
Table 2.
The results of the Mann–Kendall test and Sen’s slope estimation for ambient aerosols between 2012 and 2019.
Table 2.
The results of the Mann–Kendall test and Sen’s slope estimation for ambient aerosols between 2012 and 2019.
| S-Value | Z-Value | p-Value | Trend | Sen’s Slope (μg m−3 y−1) | Change (Based on 2012) (μg m−3 y−1) | ||
|---|---|---|---|---|---|---|---|
| Seoul | PM2.5 | −5.0 × 10⁵ | −10.55 | <2.2 × 10⁻¹⁶ | Down (▼) | −0.0038 | −1.1 × 10⁻¹ |
| SO42− | −4.4 × 10⁵ | −14.95 | <2.2 × 10⁻¹⁶ | Down (▼) | −0.0016 | −9.7 × 10⁻³ | |
| NO3− | −2.6 × 10⁵ | −8.669 | <2.2 × 10⁻¹⁶ | Down (▼) | −0.0011 | −5.9 × 10⁻³ | |
| NH4+ | −2.8 × 10⁵ | −9.694 | <2.2 × 10⁻¹⁶ | Down (▼) | −0.0008 | −3.0 × 10⁻³ | |
| EC | −4.2 × 10⁵ | −17.14 | <2.2 × 10⁻¹⁶ | Down (▼) | −0.0004 | −6.1 × 10⁻⁴ | |
| OC | −3.1 × 10³ | −0.125 | 0.9 | No trend | − | − | |
| Baeng-nyeong Island | PM2.5 | −2.9 × 10⁵ | −8.200 | <2.2 × 10⁻¹⁶ | Down (▼) | −0.0027 | −5.8 × 10⁻² |
| SO42− | −2.1 × 10⁵ | −7.605 | <2.2 × 10⁻¹⁶ | Down (▼) | −0.0007 | −4.0 × 10⁻³ | |
| NO3− | 9.9 × 10⁵ | 3.627 | <2.2 × 10⁻¹⁶ | Up (▲) | 0.0001 | 1.9 × 10⁻⁴ | |
| NH4+ | −1.4 × 10⁵ | −5.174 | <2.2 × 10⁻¹⁶ | Down (▼) | −0.0002 | −5.1 × 10⁻⁴ | |
| EC | −3.2 × 10⁵ | −11.92 | <2.2 × 10⁻¹⁶ | Down (▼) | −0.0001 | −8.2 × 10⁻⁵ | |
| OC | −2.4 × 10⁵ | −8.778 | <2.2 × 10⁻¹⁶ | Down (▼) | −0.0005 | −1.7 × 10⁻³ |
Table 3.
The results of the Mann–Kendall test and Sen’s slope estimation for ambient gaseous pollutants between 2012 and 2019.
Table 3.
The results of the Mann–Kendall test and Sen’s slope estimation for ambient gaseous pollutants between 2012 and 2019.
| S-Value | Z-Value | p-Value | Trend | Sen’s Slope (ppb y−1) | Change (Based on 2012) (ppb y−1) | ||
|---|---|---|---|---|---|---|---|
| Seoul | SO2 | −4.6 × 10⁵ | −10.70 | <2.2 × 10⁻¹⁶ | Down (▼) | −0.0004 | −2.1 × 10⁻³ |
| NO2 | −4.5 × 10⁵ | −9.877 | <2.2 × 10⁻¹⁶ | Down (▼) | −0.0027 | −7.1 × 10⁻² | |
| CO | −8.6 × 10⁴ | −1.979 | 5.253 × 10⁻¹³ | Down (▼) | −0.0118 | −6.4 | |
| O3 | 4.8 × 10⁵ | 11.11 | <2.2 × 10⁻¹⁶ | Up (▲) | 0.0036 | 8.0 × 10⁻² | |
| Baeng-nyeong Island | SO2 | −1.2 × 10⁶ | −29.46 | <2.2 × 10⁻¹⁶ | Down (▼) | −0.0010 | −4.0 × 10⁻³ |
| NO2 | 2.8 × 10⁵ | 7.486 | <2.2 × 10⁻¹⁶ | Up (▲) | 0.0004 | 1.2 × 10⁻³ | |
| CO | 3.0 × 10⁵ | 7.108 | <2.2 × 10⁻¹⁶ | Up (▲) | 0.0249 | 7.5 | |
| O3 | 5.4 × 10⁵ | 12.67 | <2.2 × 10⁻¹⁶ | Up (▲) | 0.0052 | 1.2 × 10⁻¹ |
Table 4.
The annual equivalent ratio in Seoul.
| Year | NH4+ (μeq m−3) /SO42− (μeq m−3) | NH4+ (μeq m−3) /NO3− (μeq m−3) | NH4+ (μeq m−3) /Σ SO42− and NO3− (μeq m−3) |
|---|---|---|---|
| 2012 | 1.327 | 1.757 | 0.9586 |
| 2013 | 1.3679 | 1.5337 | 0.9092 |
| 2014 | 1.4881 | 1.8863 | 0.9747 |
| 2015 | 1.6142 | 1.833 | 1.0837 |
| 2016 | 1.5469 | 1.6618 | 1.0213 |
| 2017 | 1.8686 | 1.4178 | 1.0275 |
| 2018 | 1.8945 | 1.5126 | 1.0583 |
| 2019 | 2.3263 | 1.5887 | 1.0981 |
Table 5.
The annual equivalent ratio on Baengnyeong Island.
| Year | NH4+ (μeq m−3) /SO42− (μeq m−3) | NH4+ (μeq m−3) /NO3− (μeq m−3) | NH4+ (μeq m−3) /Σ SO42− and NO3− (μeq m−3) |
|---|---|---|---|
| 2012 | 1.1399 | 2.1693 | 0.9244 |
| 2013 | 1.1032 | 1.837 | 0.8784 |
| 2014 | 1.3089 | 2.0892 | 0.9675 |
| 2015 | 1.5127 | 1.815 | 1.0453 |
| 2016 | 1.3416 | 1.9612 | 1.0274 |
| 2017 | 1.6611 | 1.8944 | 1.0903 |
| 2018 | 1.6317 | 1.5413 | 1.005 |
| 2019 | 2.0804 | 1.5172 | 1.0294 |
Publisher’s Note: MDPI stays neutral with regard to jurisdictional claims in published maps and institutional affiliations. |
© 2022 by the authors. Licensee MDPI, Basel, Switzerland. This article is an open access article distributed under the terms and conditions of the Creative Commons Attribution (CC BY) license (https://creativecommons.org/licenses/by/4.0/).
Share and Cite
MDPI and ACS Style
Kim, N.-K.; Kim, Y.-P.; Shin, H.-J.; Lee, J.-Y. Long-Term Trend of the Levels of Ambient Air Pollutants of a Megacity and a Background Area in Korea. Appl. Sci. 2022, 12, 4039. https://0-doi-org.brum.beds.ac.uk/10.3390/app12084039
AMA Style
Kim N-K, Kim Y-P, Shin H-J, Lee J-Y. Long-Term Trend of the Levels of Ambient Air Pollutants of a Megacity and a Background Area in Korea. Applied Sciences. 2022; 12(8):4039. https://0-doi-org.brum.beds.ac.uk/10.3390/app12084039
Chicago/Turabian StyleKim, Na-Kyung, Yong-Pyo Kim, Hye-Jung Shin, and Ji-Yi Lee. 2022. "Long-Term Trend of the Levels of Ambient Air Pollutants of a Megacity and a Background Area in Korea" Applied Sciences 12, no. 8: 4039. https://0-doi-org.brum.beds.ac.uk/10.3390/app12084039
Note that from the first issue of 2016, this journal uses article numbers instead of page numbers. See further details here.