
The Impact of Rising Reservoir Water Level on the Gravity Field and Seismic Activity in the Reservoir Area: Evidence from the Impoundment of the Three Gorges Reservoir (China)


Abstract
:1. Introduction
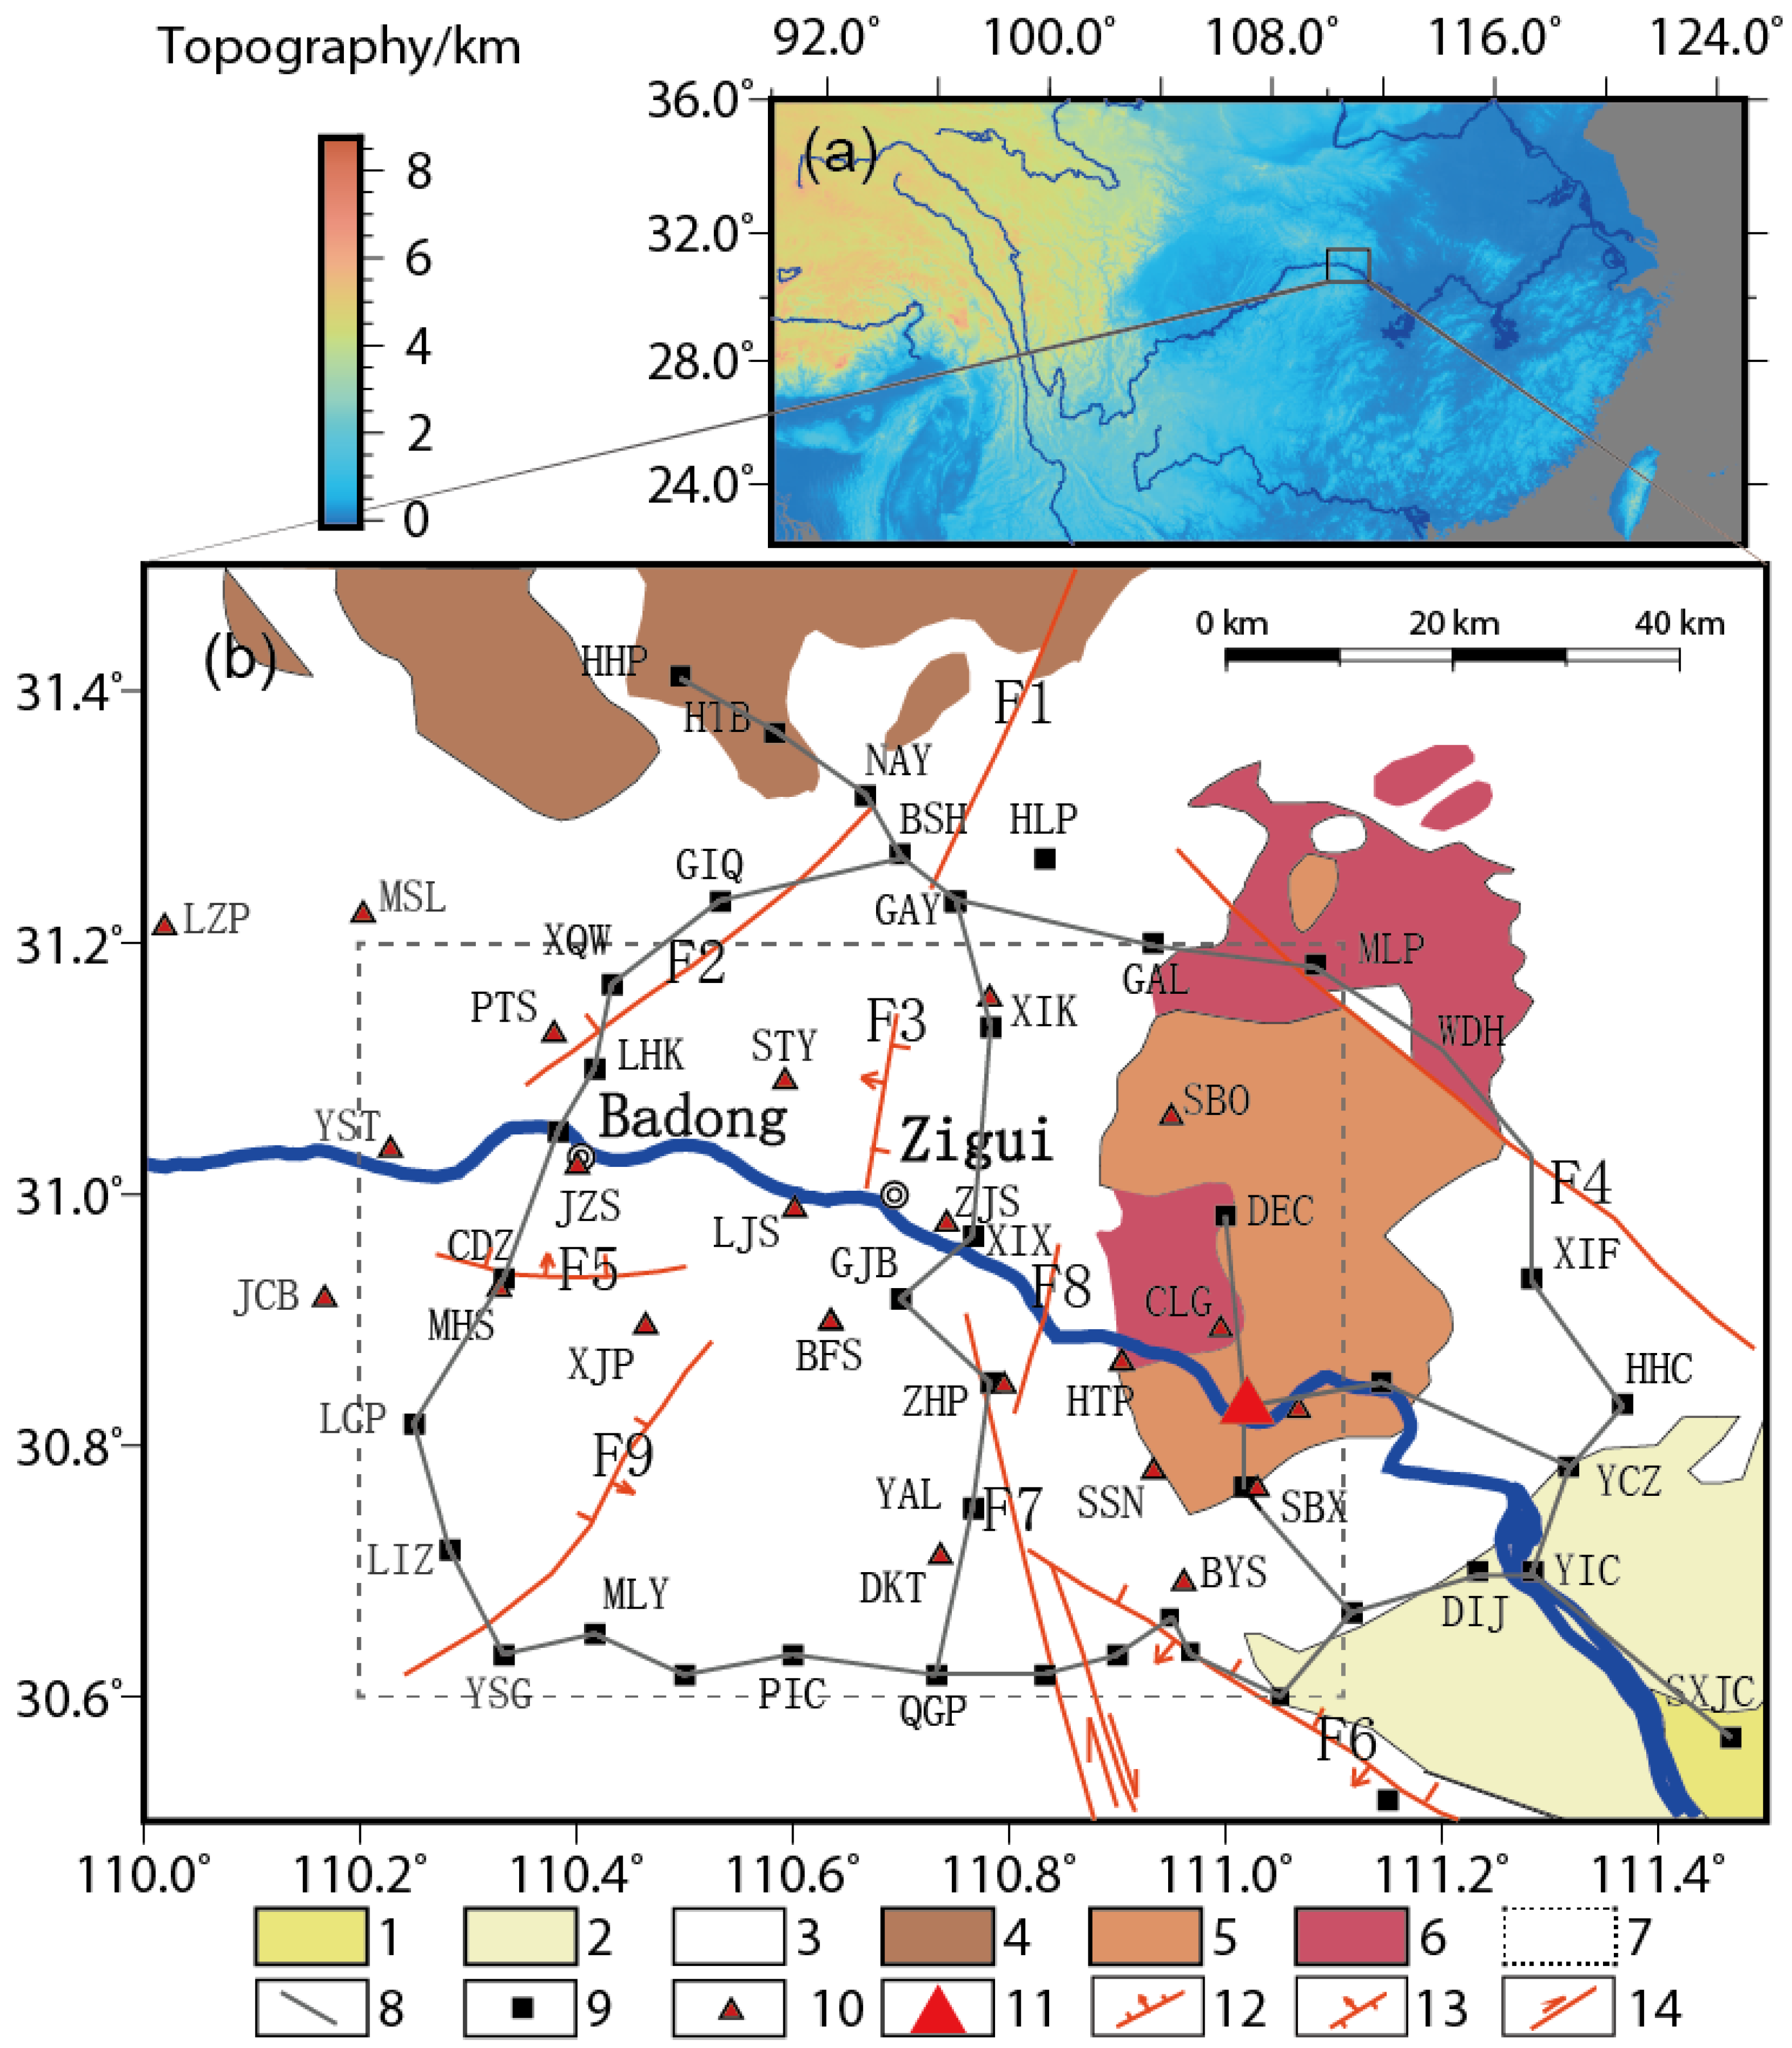
2. Geological Structure Characteristics of the Reservoir’s Head Area
3. Data and Methods
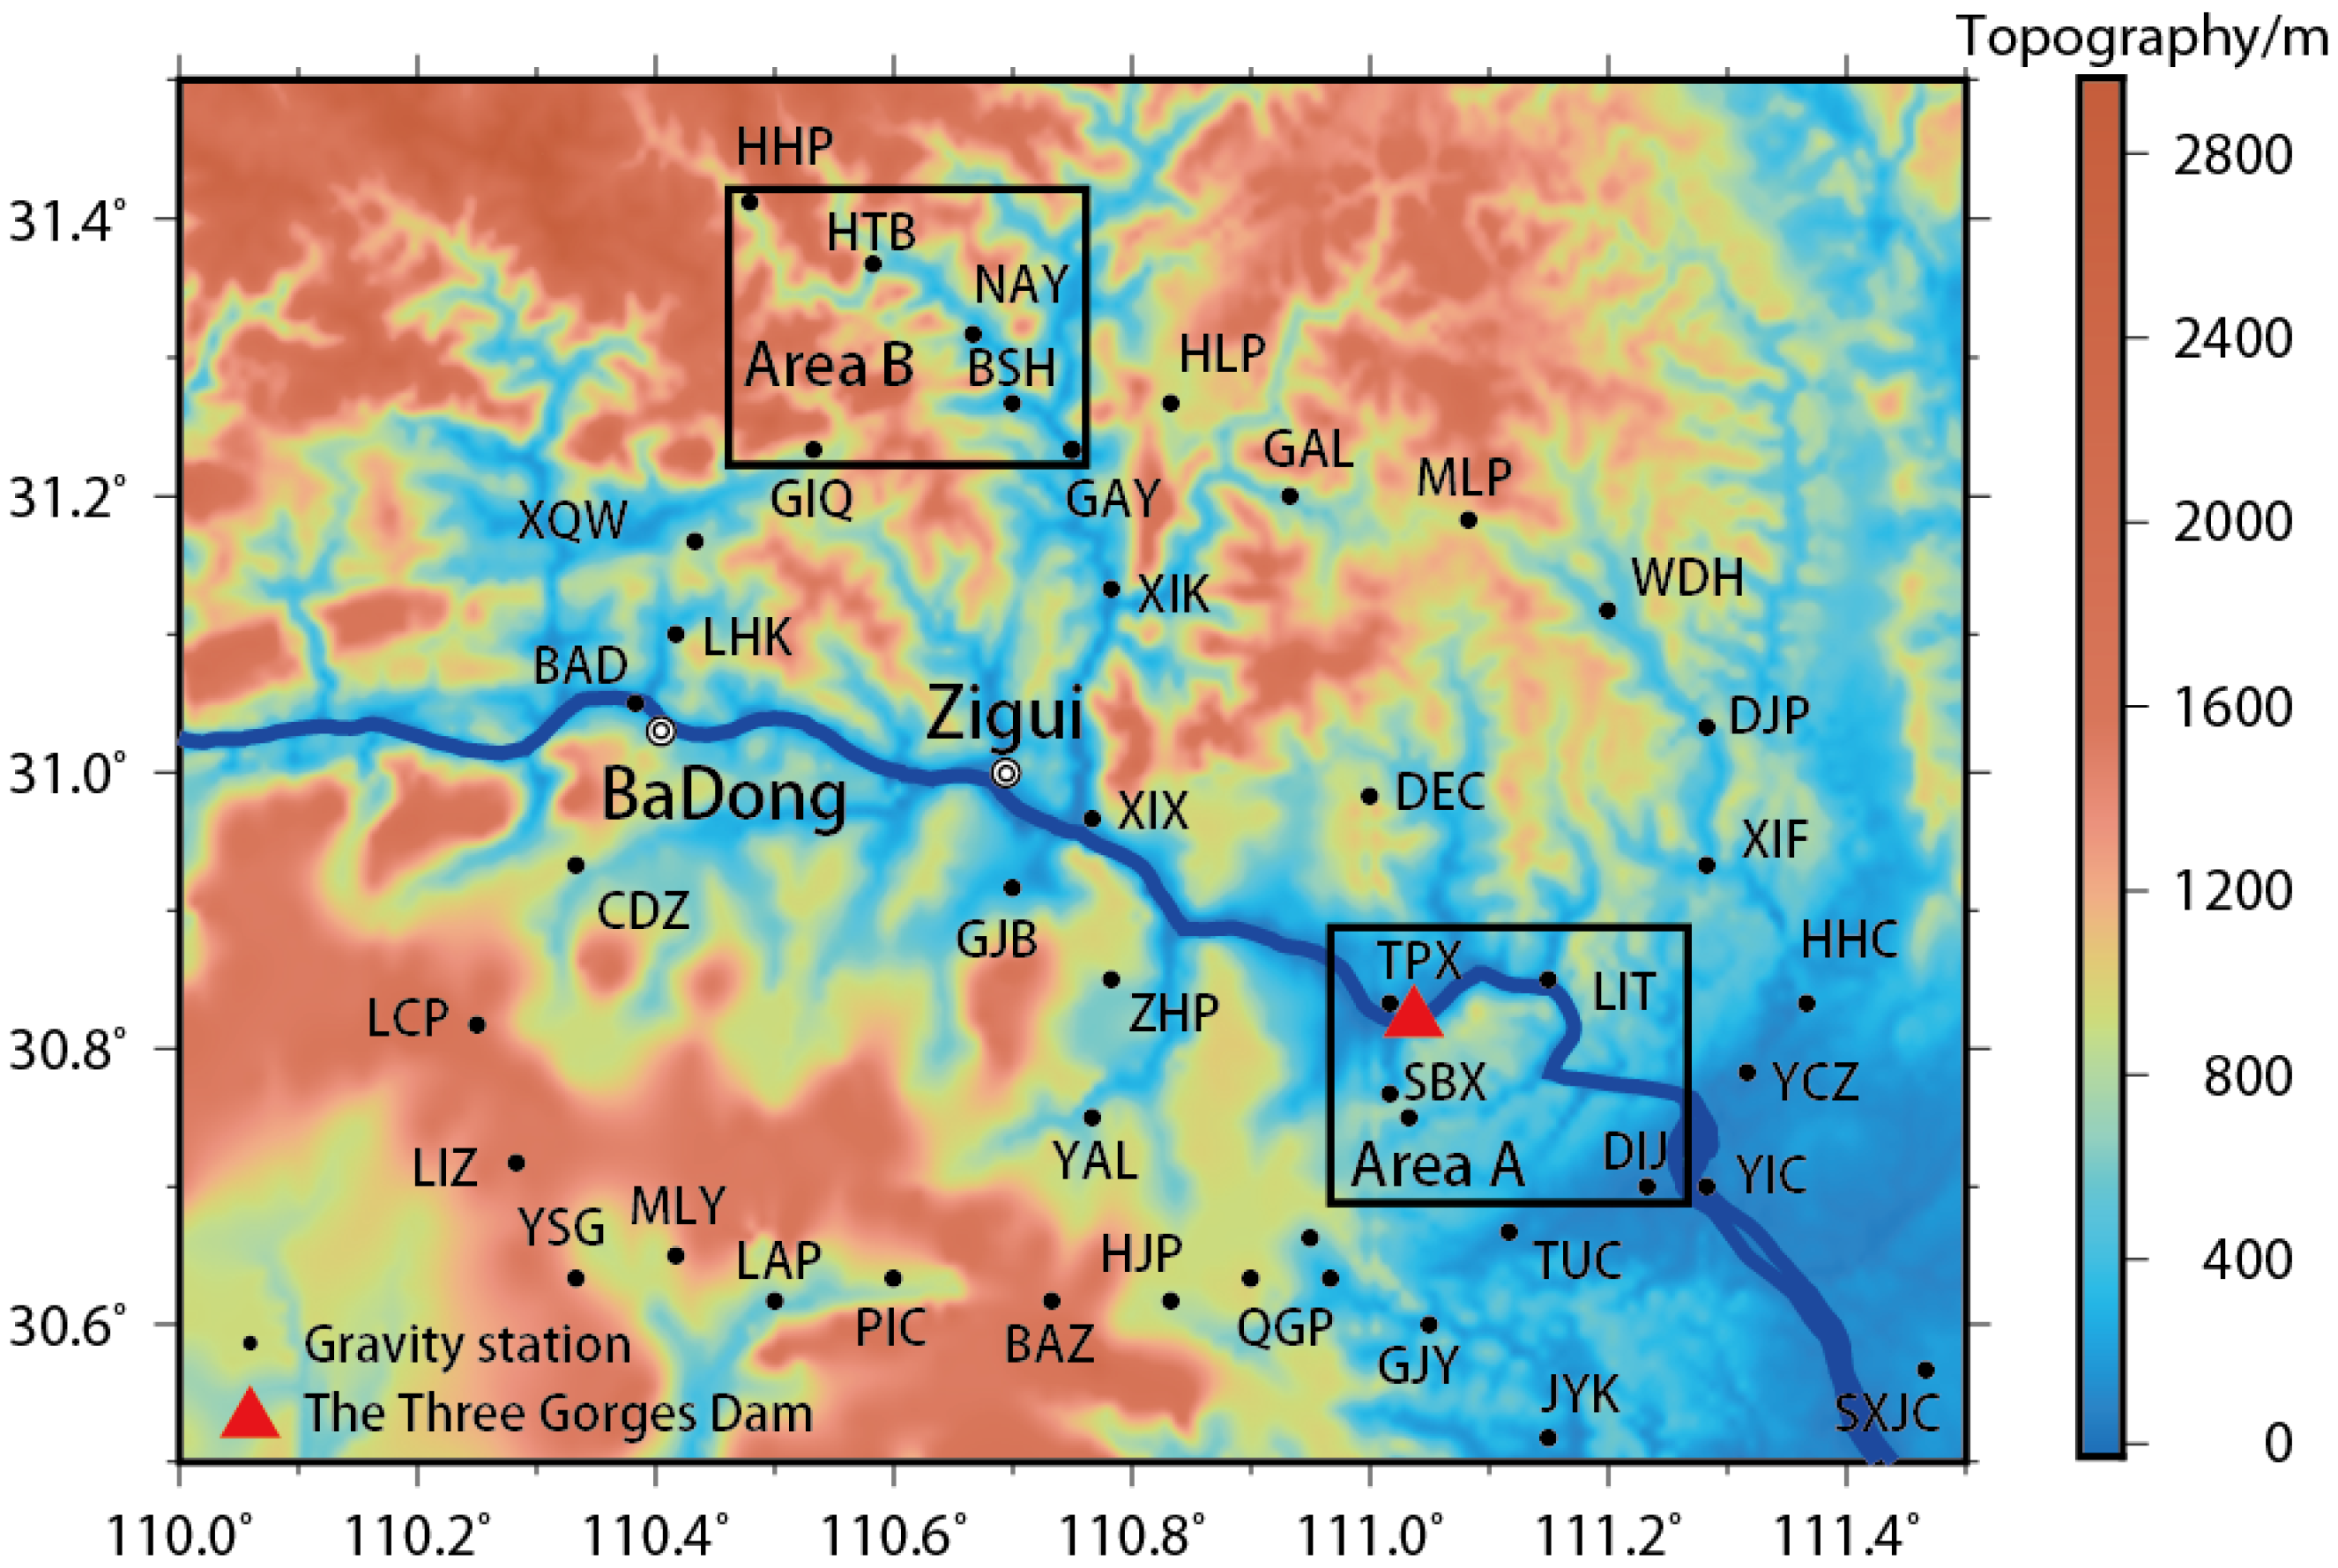
3.1. Gravity Surveying and Data Adjustment
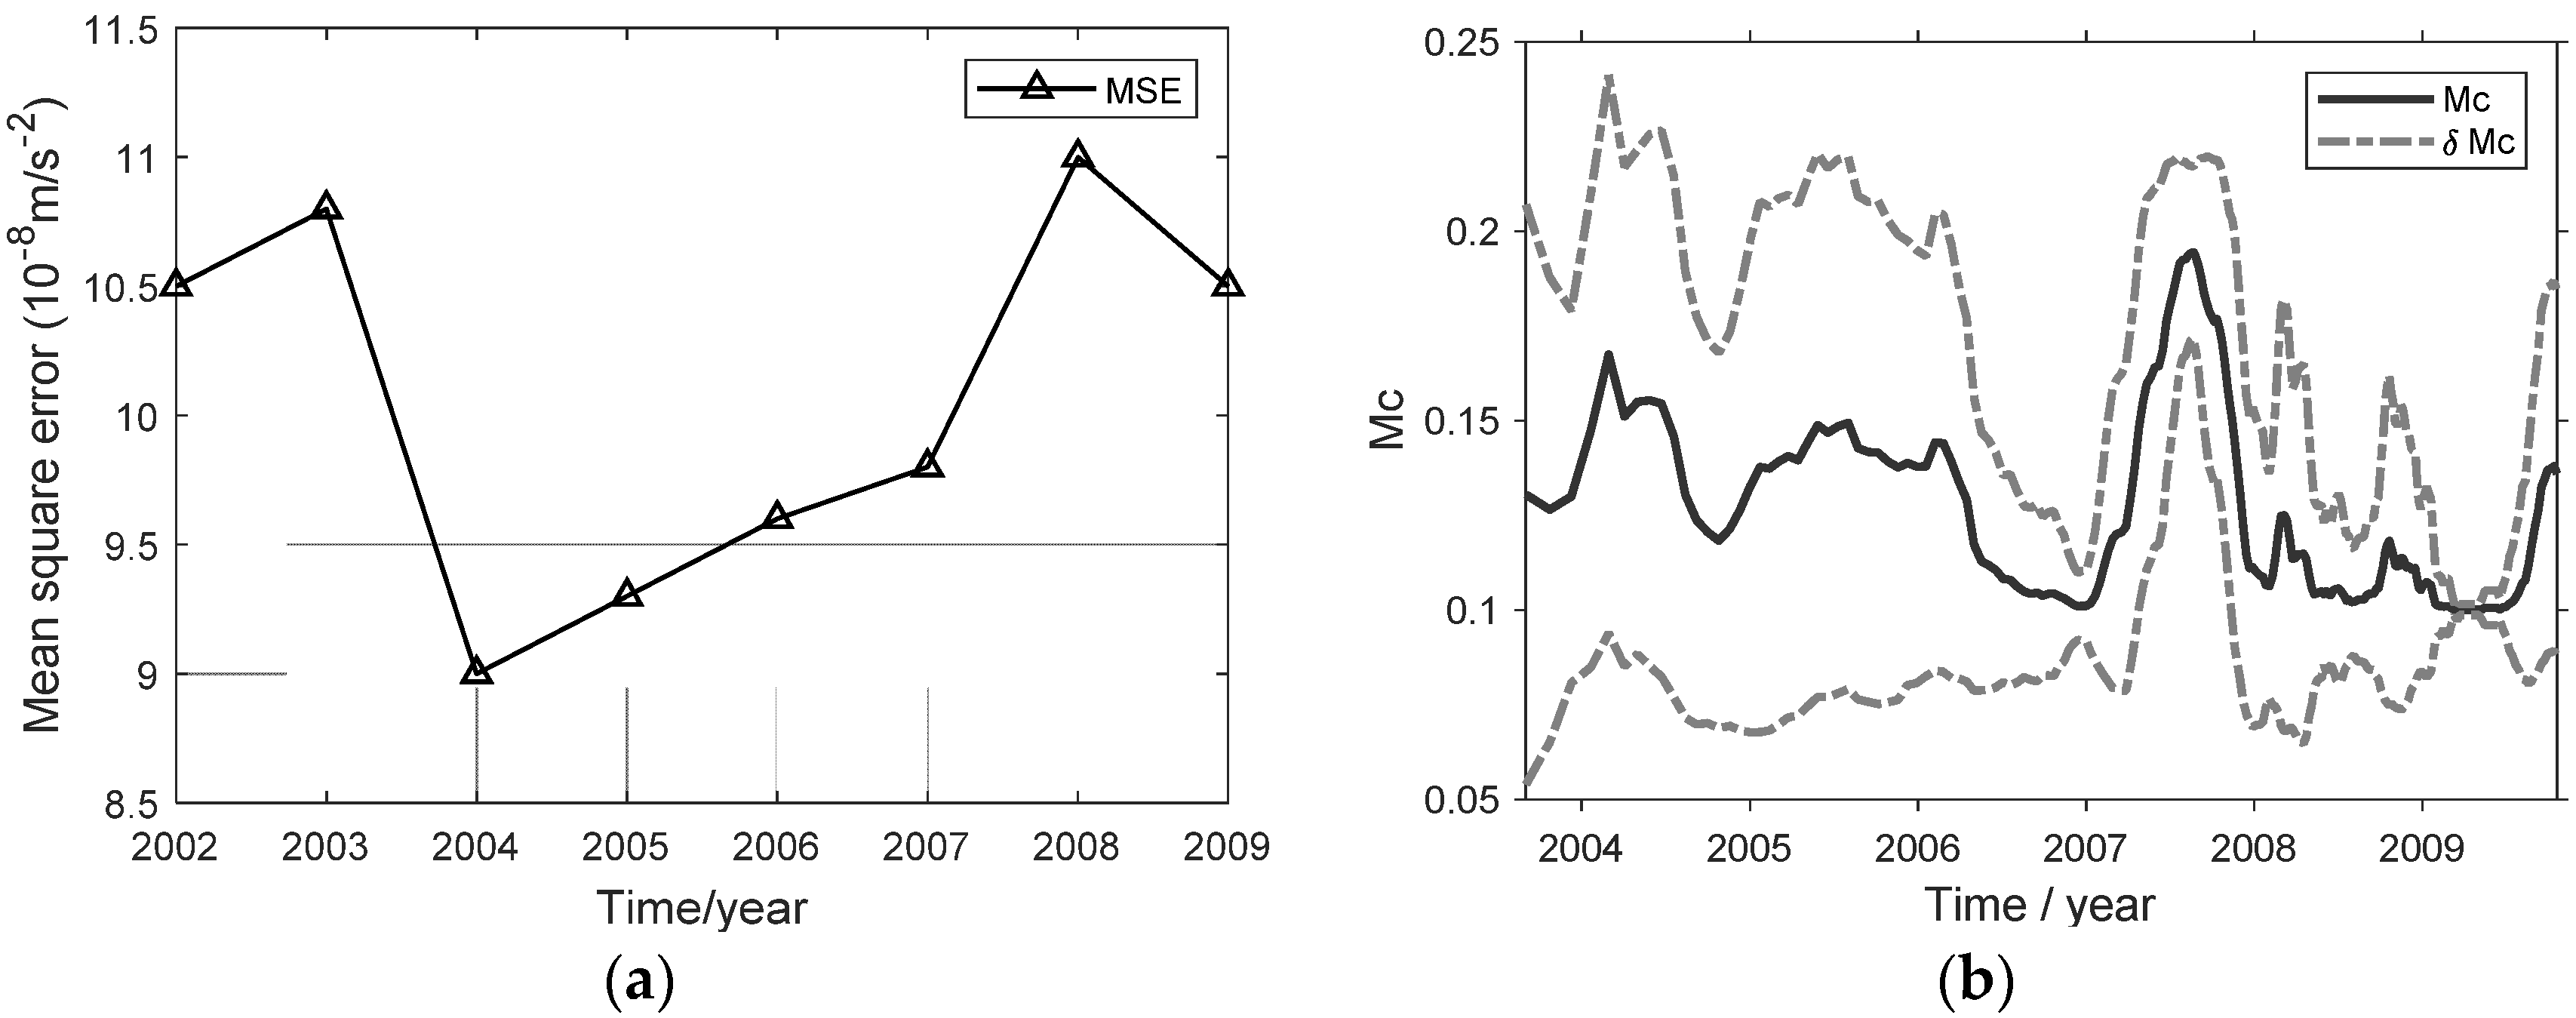
3.2. Gridding of Gravity Data
3.3. Earthquake Monitoring Catalog
3.4. Cross-Correlation Method Based on Reshuffling Tests
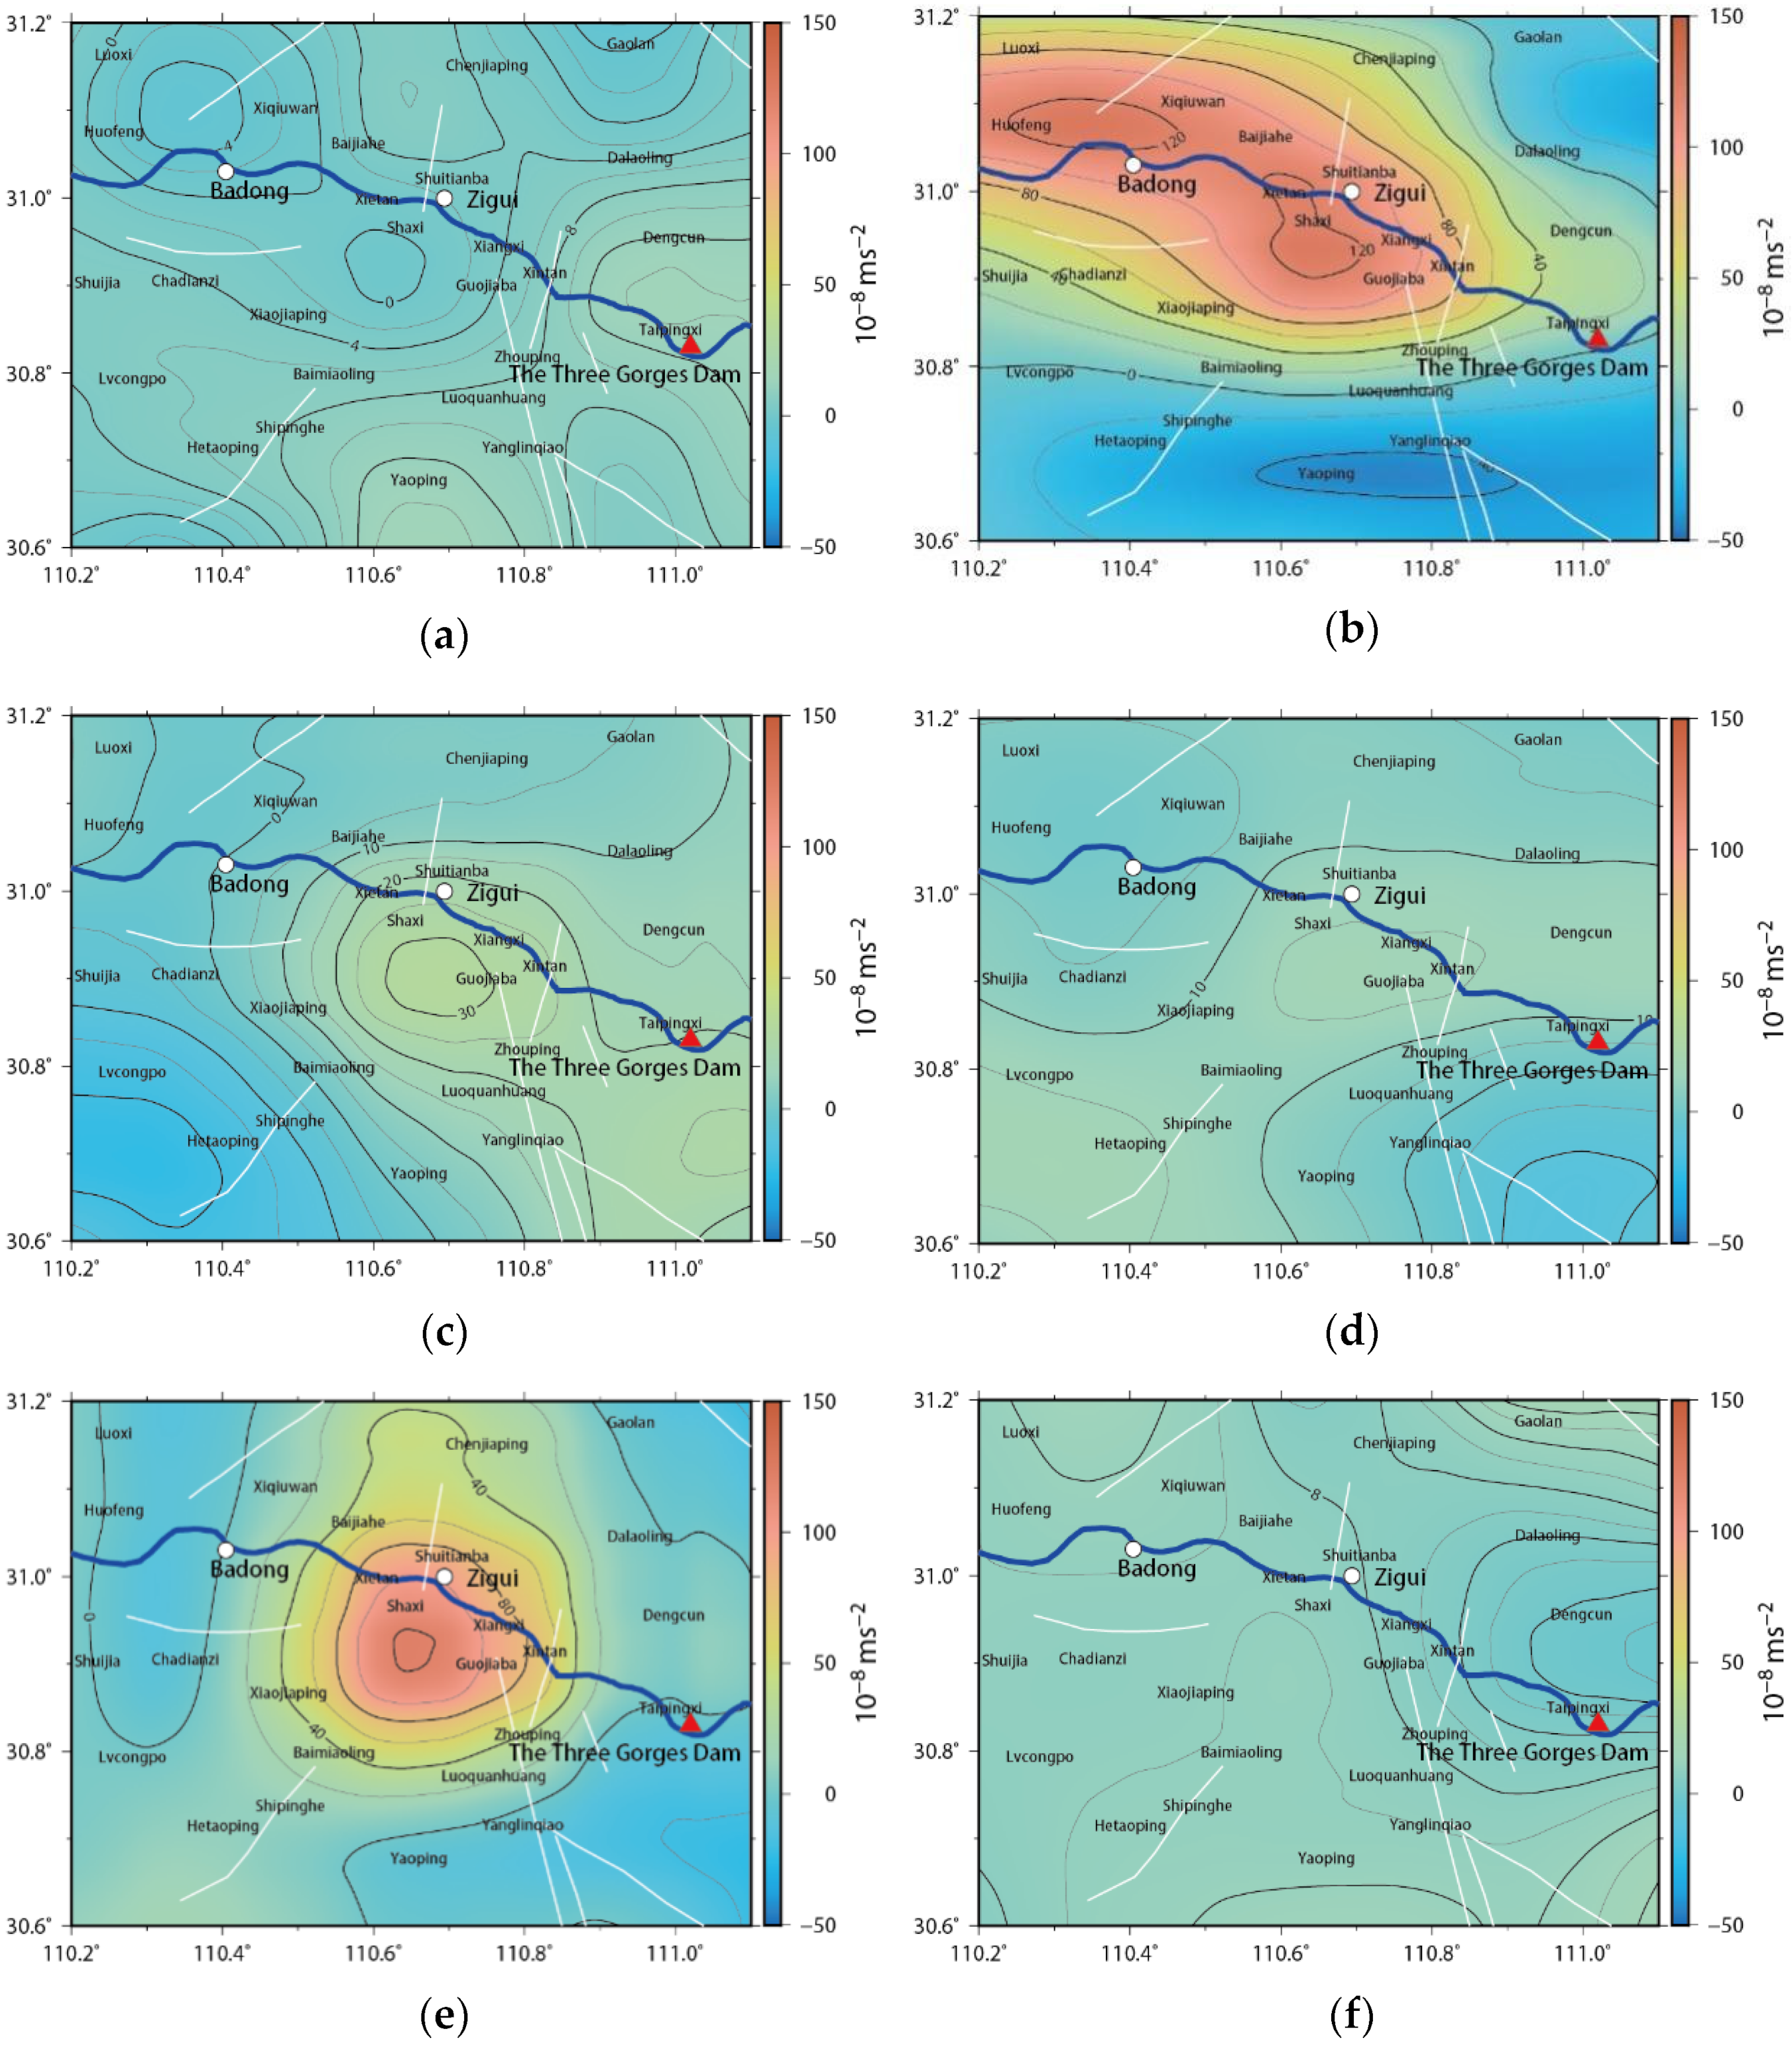
4. Gravity Field Changes and Seismicity during the Process of Water Impounding
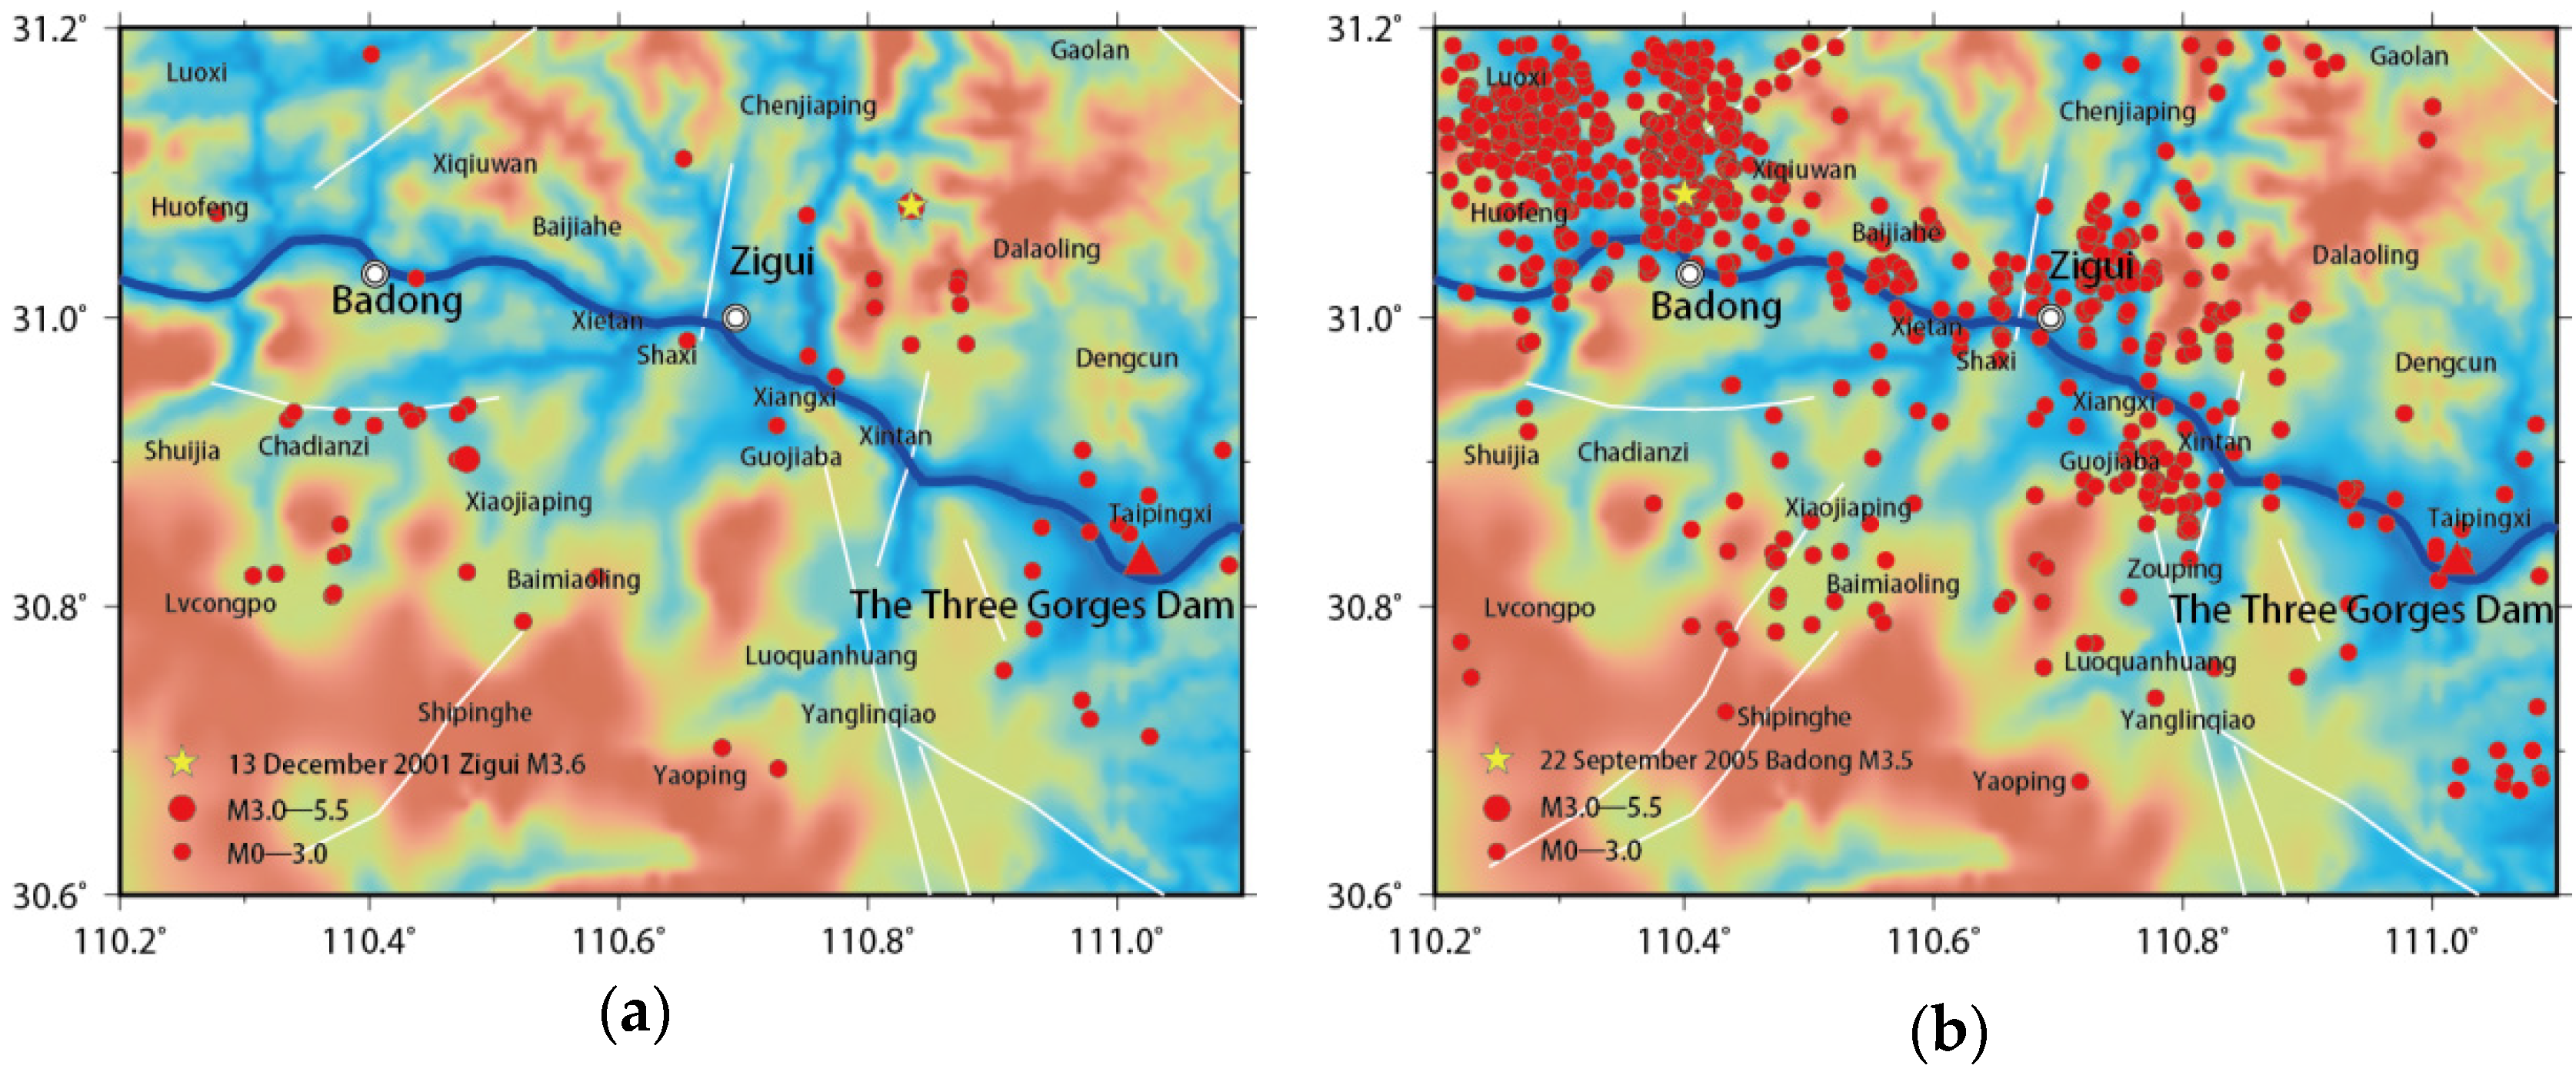
4.1. Before the Water Impoundment
4.2. The 135 m Stage
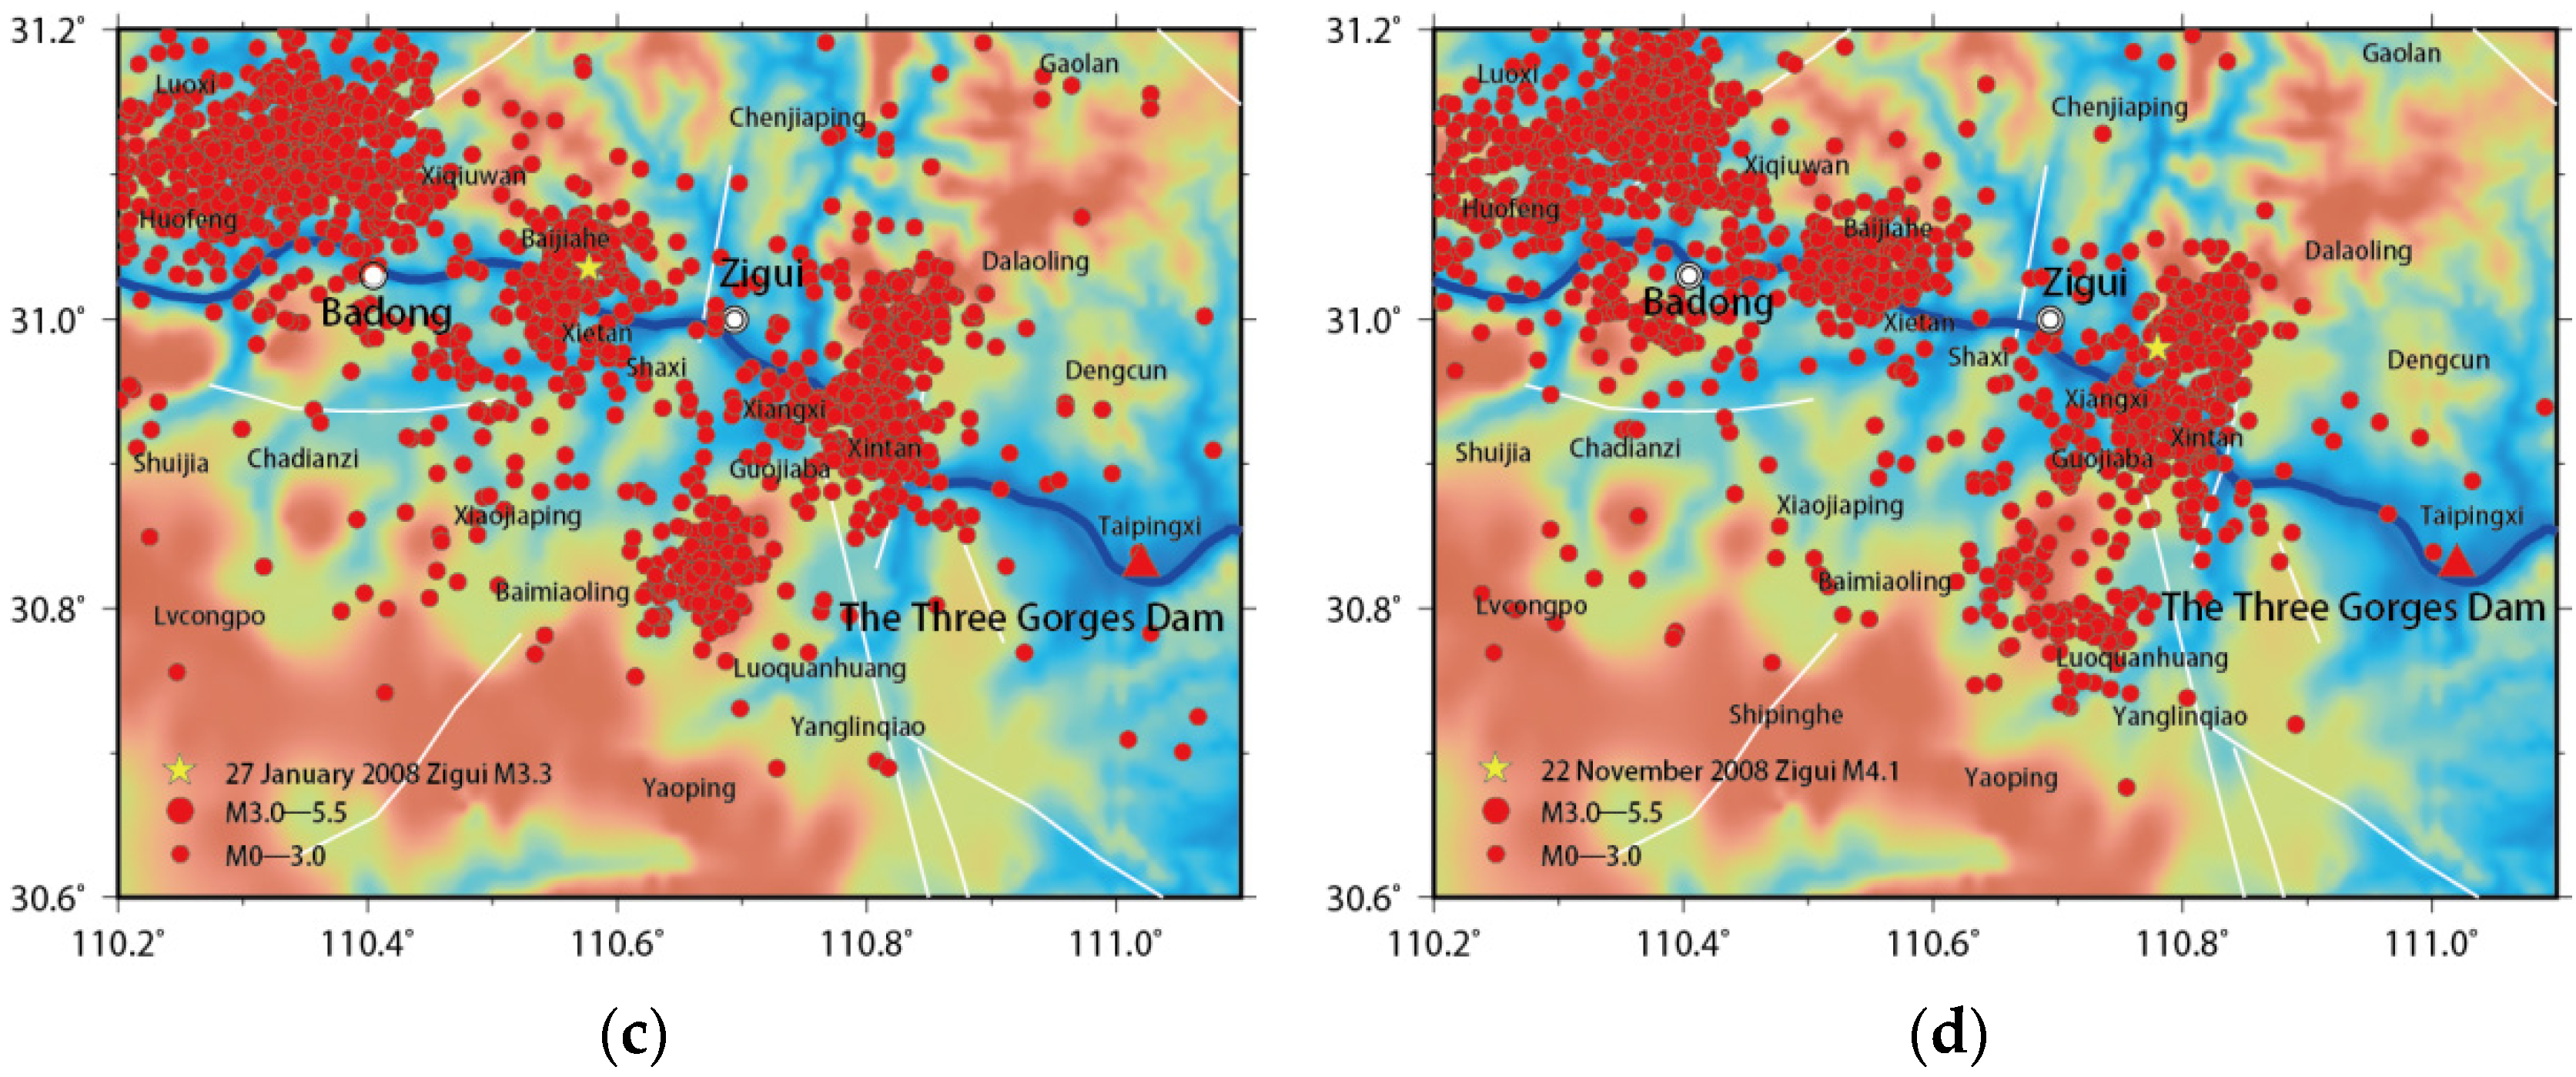
4.3. The 156 m Stage
4.4. The 175 m Experimental Stage
5. Time Series Correlation Test of Seismic Activity and Reservoir Water Level Based on Reshuffling Tests
6. Causing Mechanism of Seismicity during the Impoundment
6.1. Influence of Direct Reservoir Water Load
6.2. The Effect of Reservoir Water Infiltration
7. Conclusions
- (1)
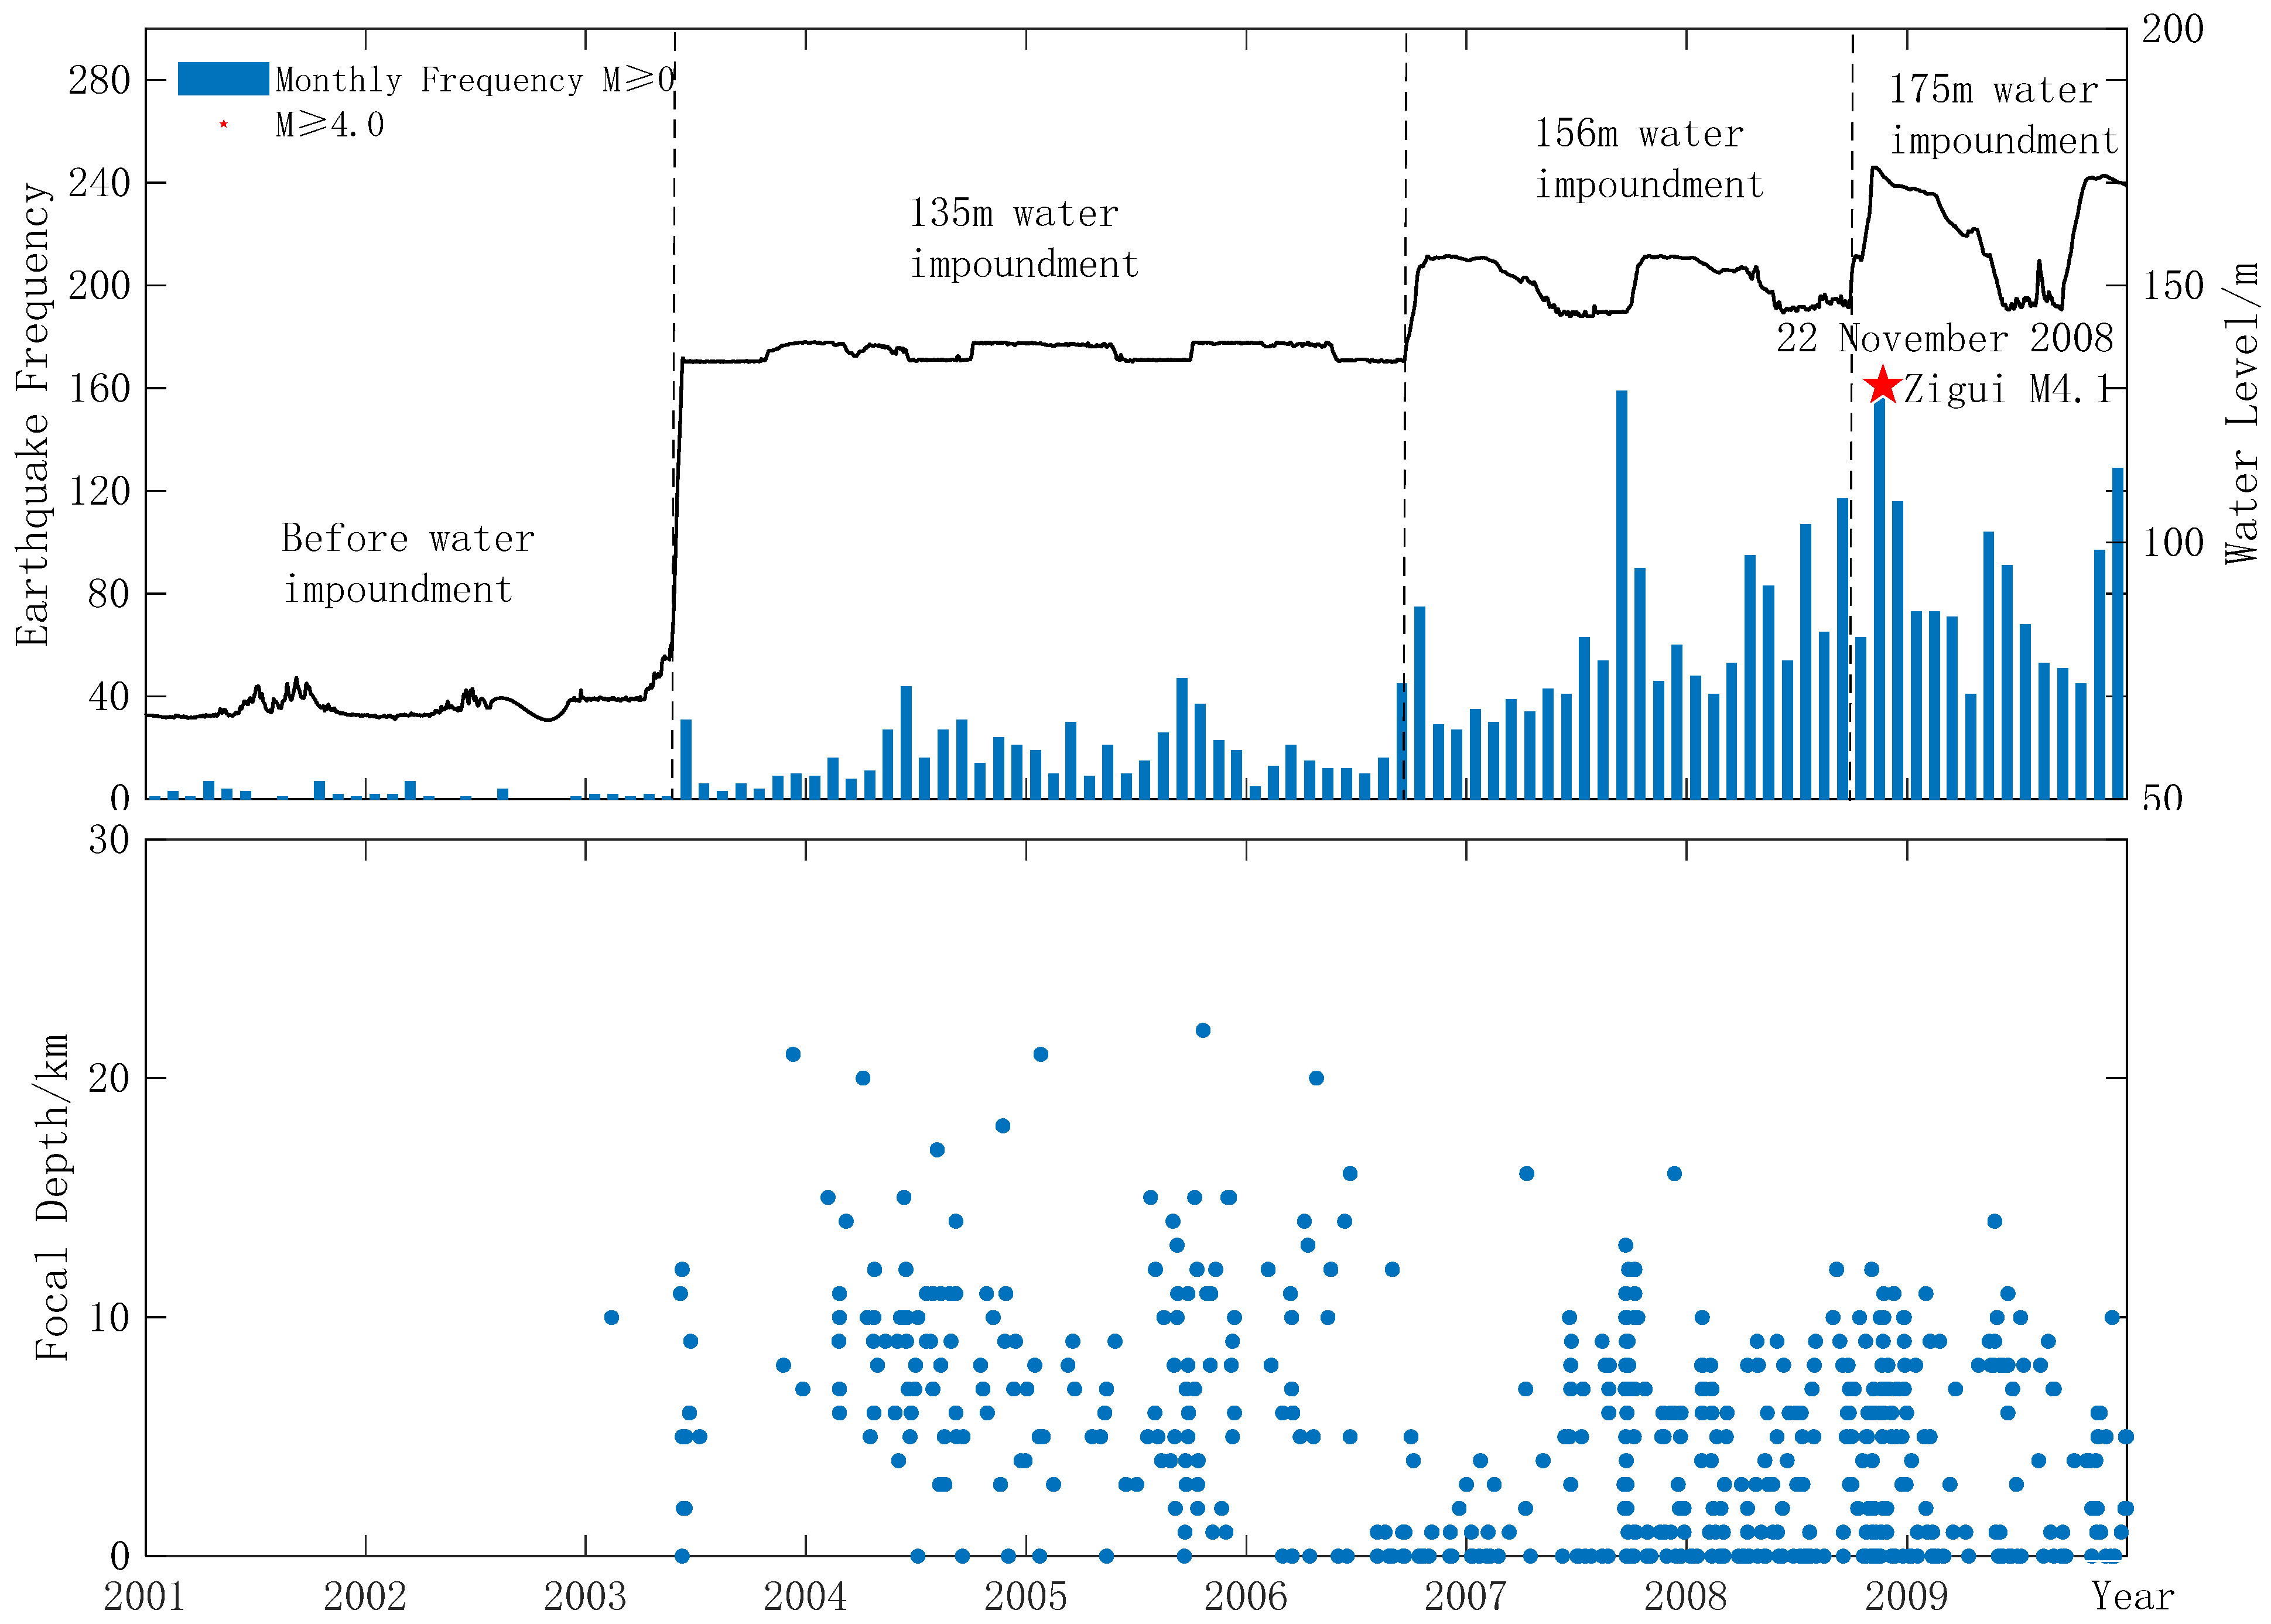
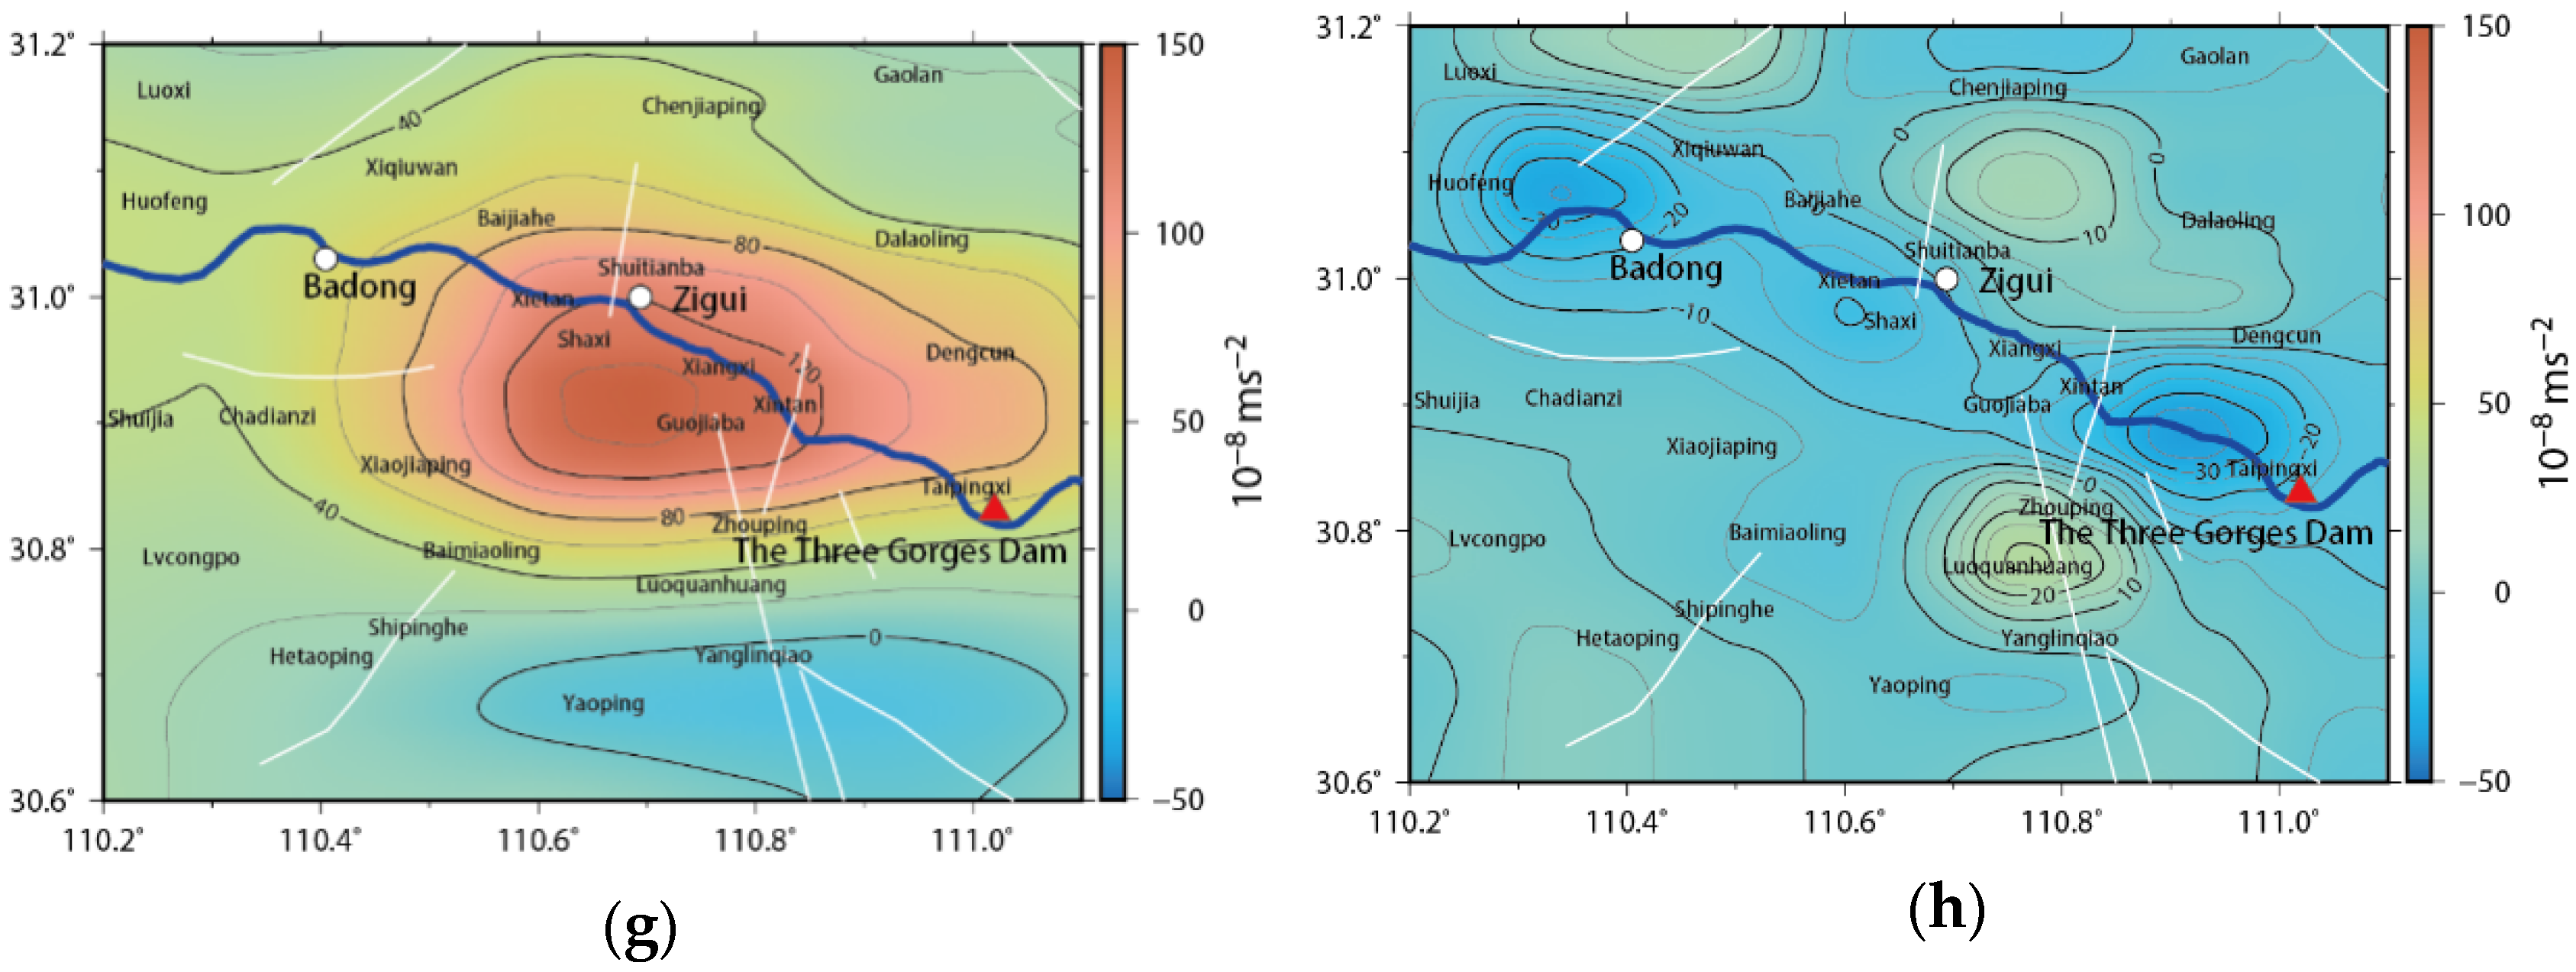
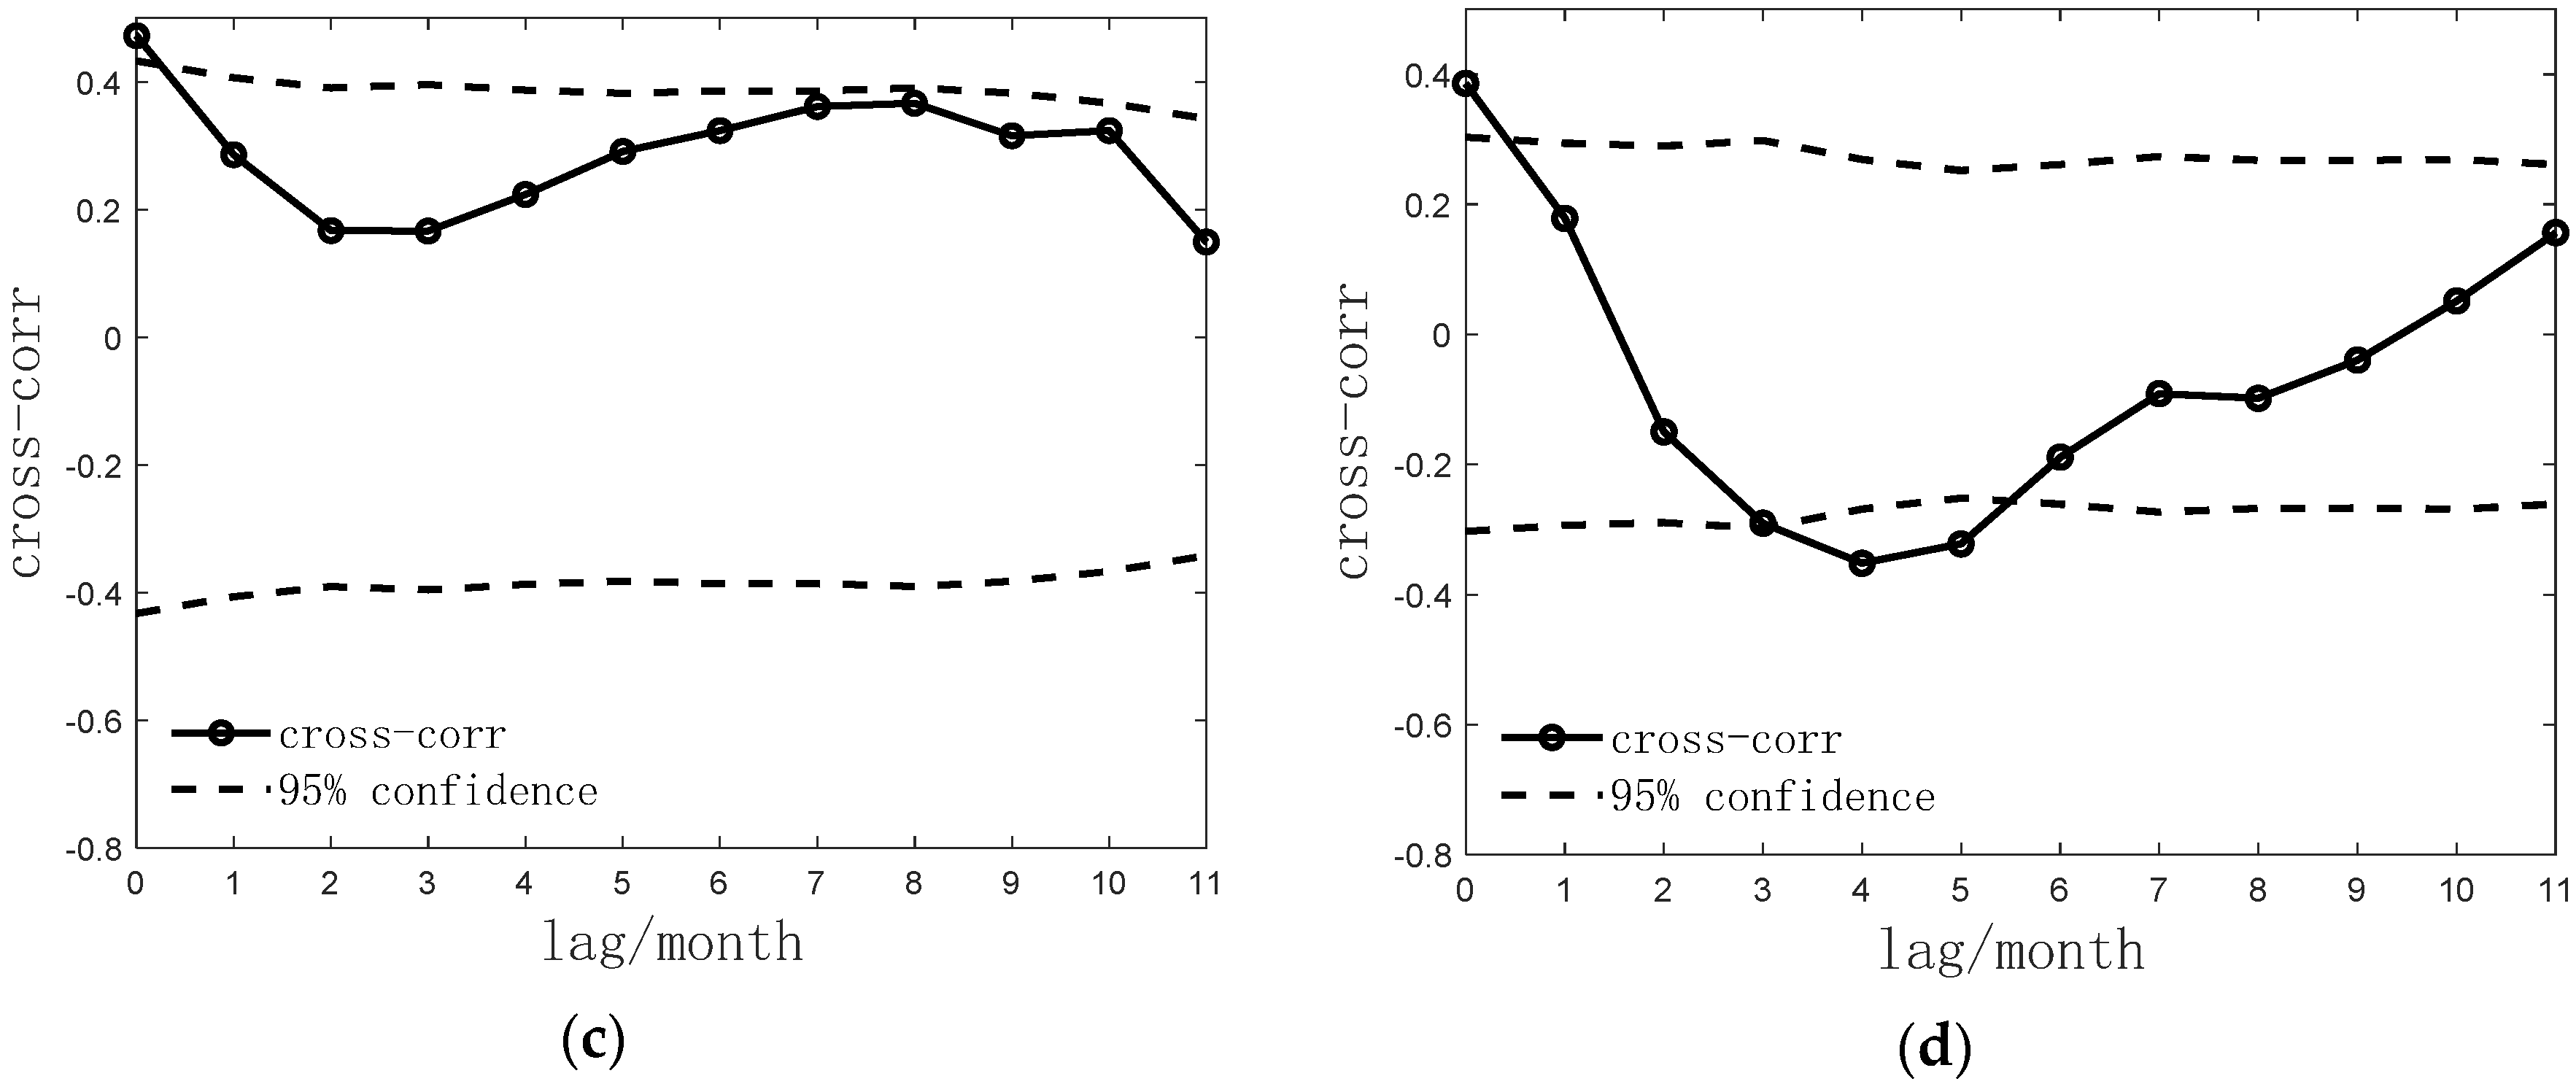
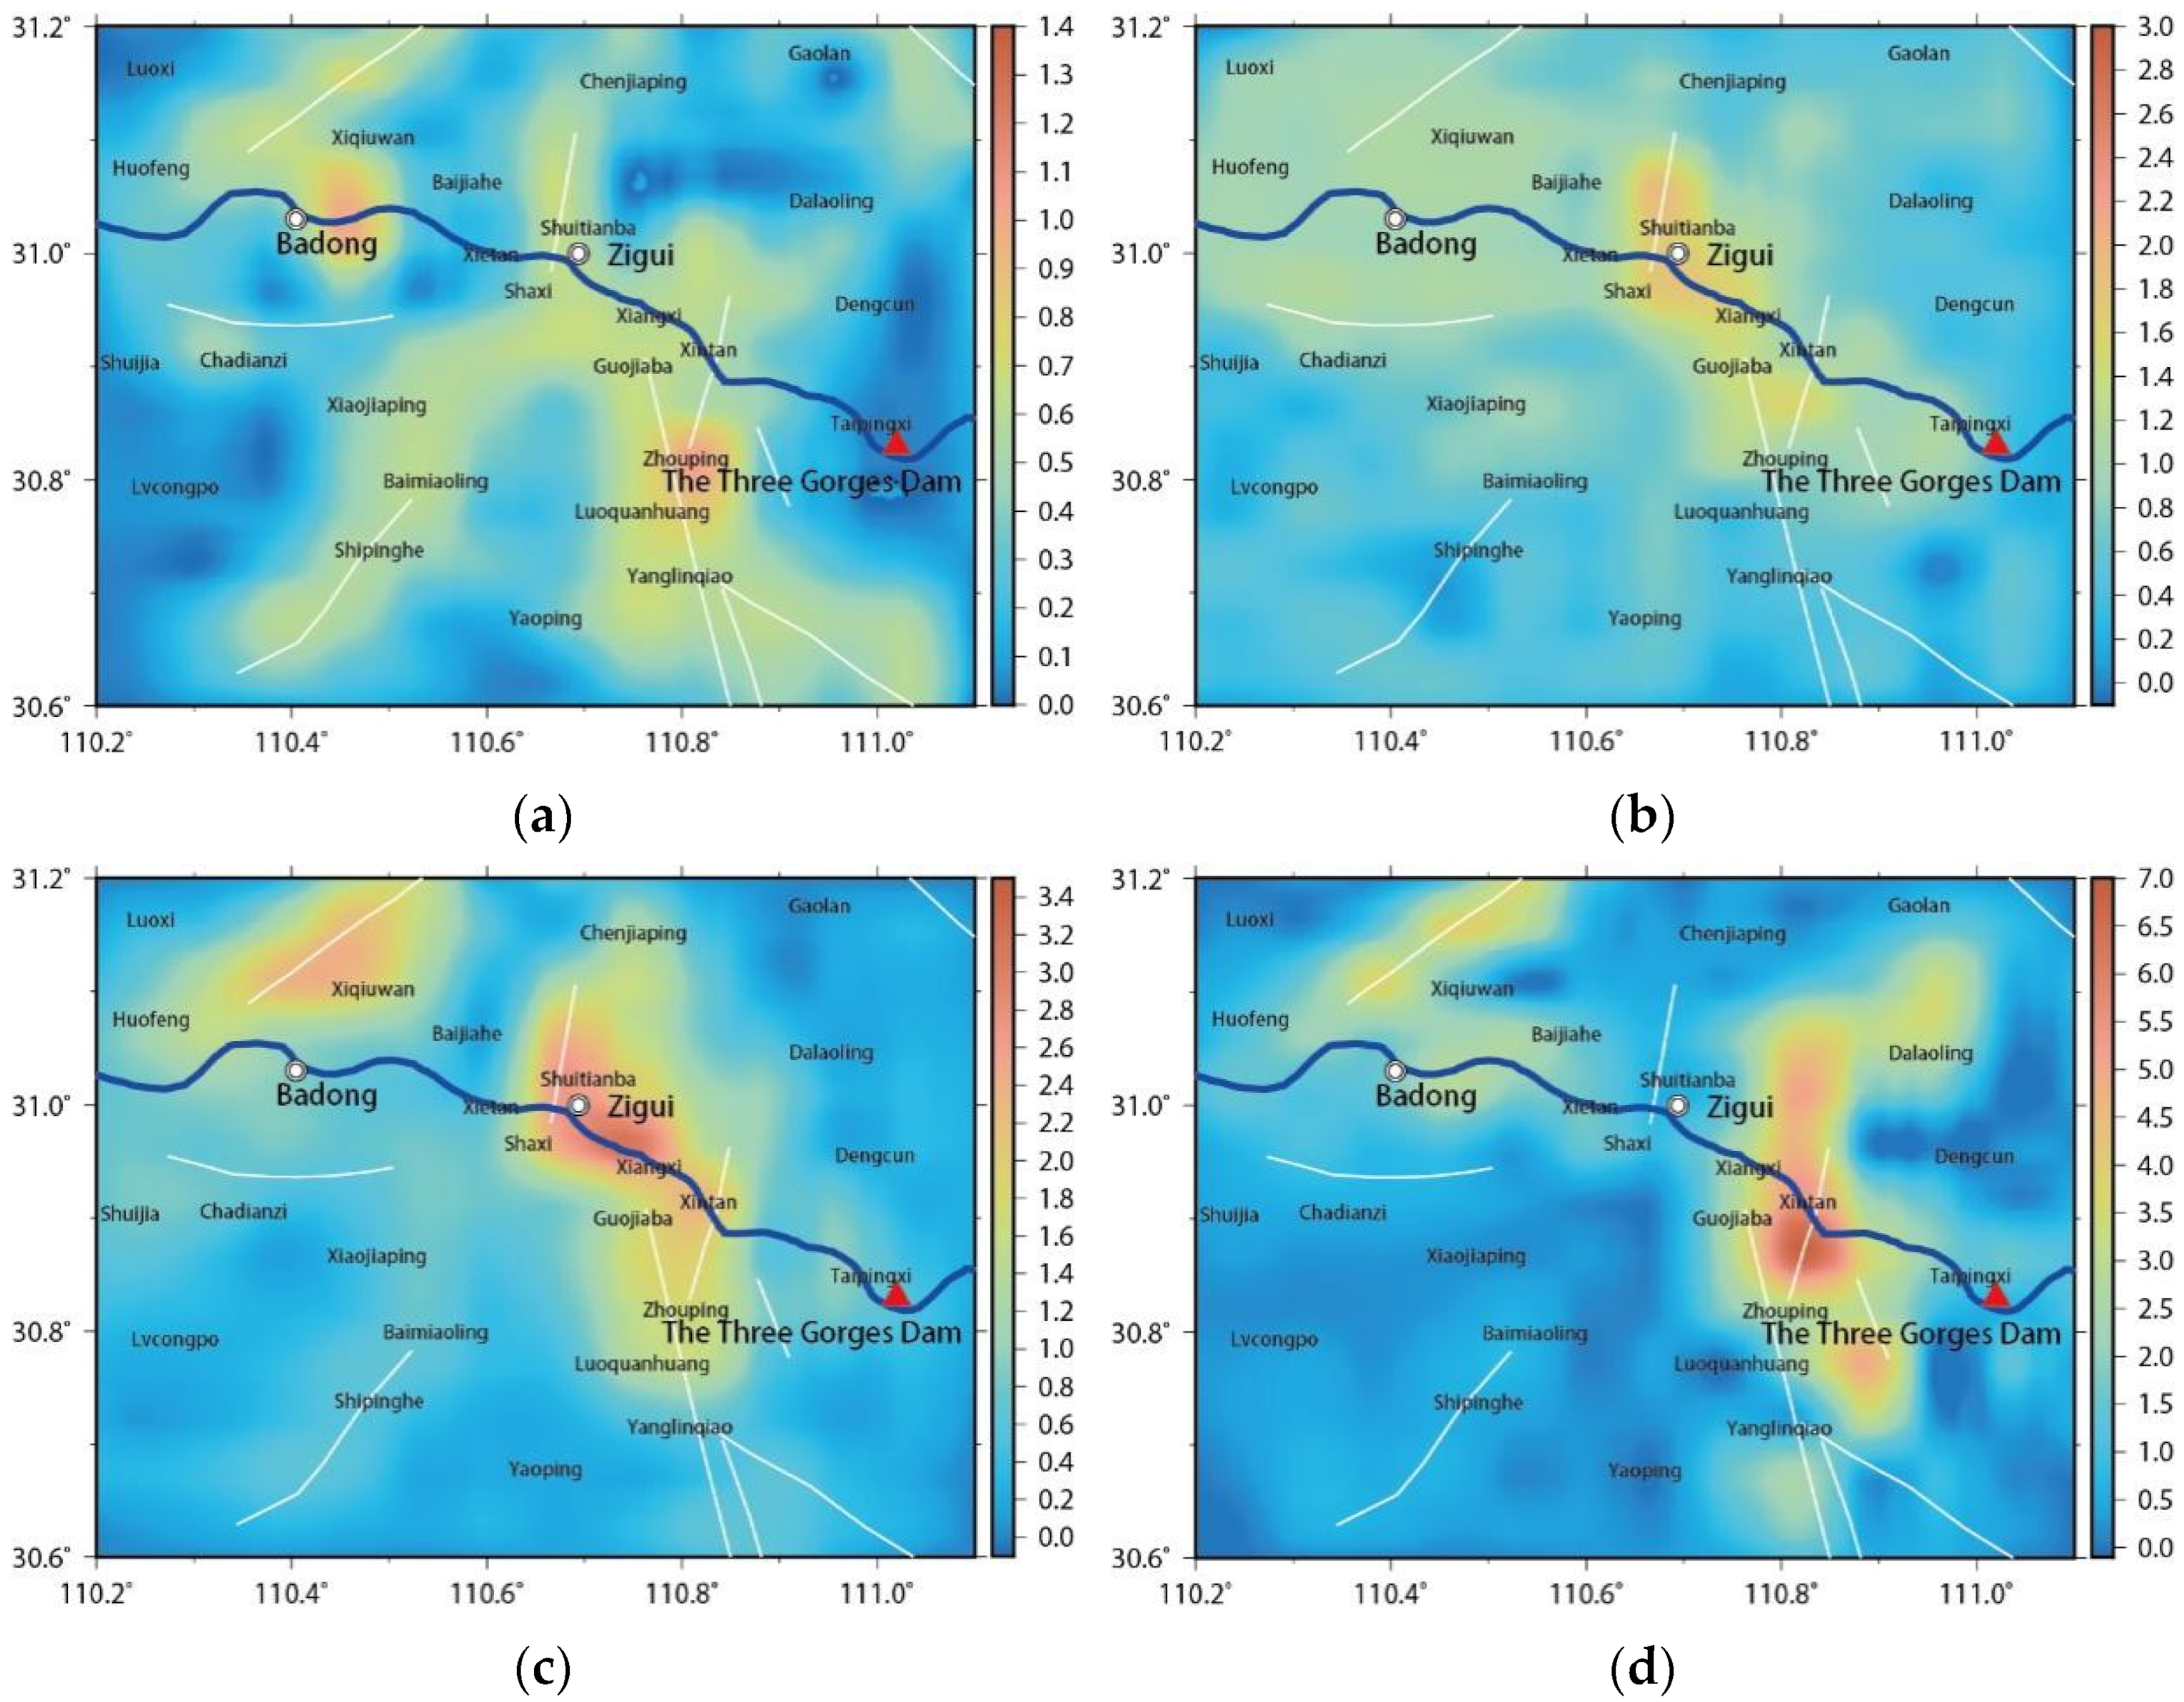
- The rising reservoir water level has had a crucial impact on the gravity field and seismic activity in the reservoir’s head area. The cumulative changes in the gravity field from October 2001 to November 2008 show that water impounding has led to a huge banded positive anomaly of gravity that reaches along the river near Xiangxi. The seismicity activity dominated by micro-earthquakes rose rapidly after the 135 m water level, and the monthly average earthquake frequency increased from 2.00 before the impoundment to 92.60 after the 175 m stage. The massive amount of water load caused the study area to have a positive anomaly of banded gravity along the river, which is centered on Badong county and Xiangxi Estuary of Zigui county. It also formed a good spatial envelope due to the sudden increase in seismic activity during the corresponding periods, which means that the variation of gravity can reveal the influence range of direct reservoir water load.
- (2)
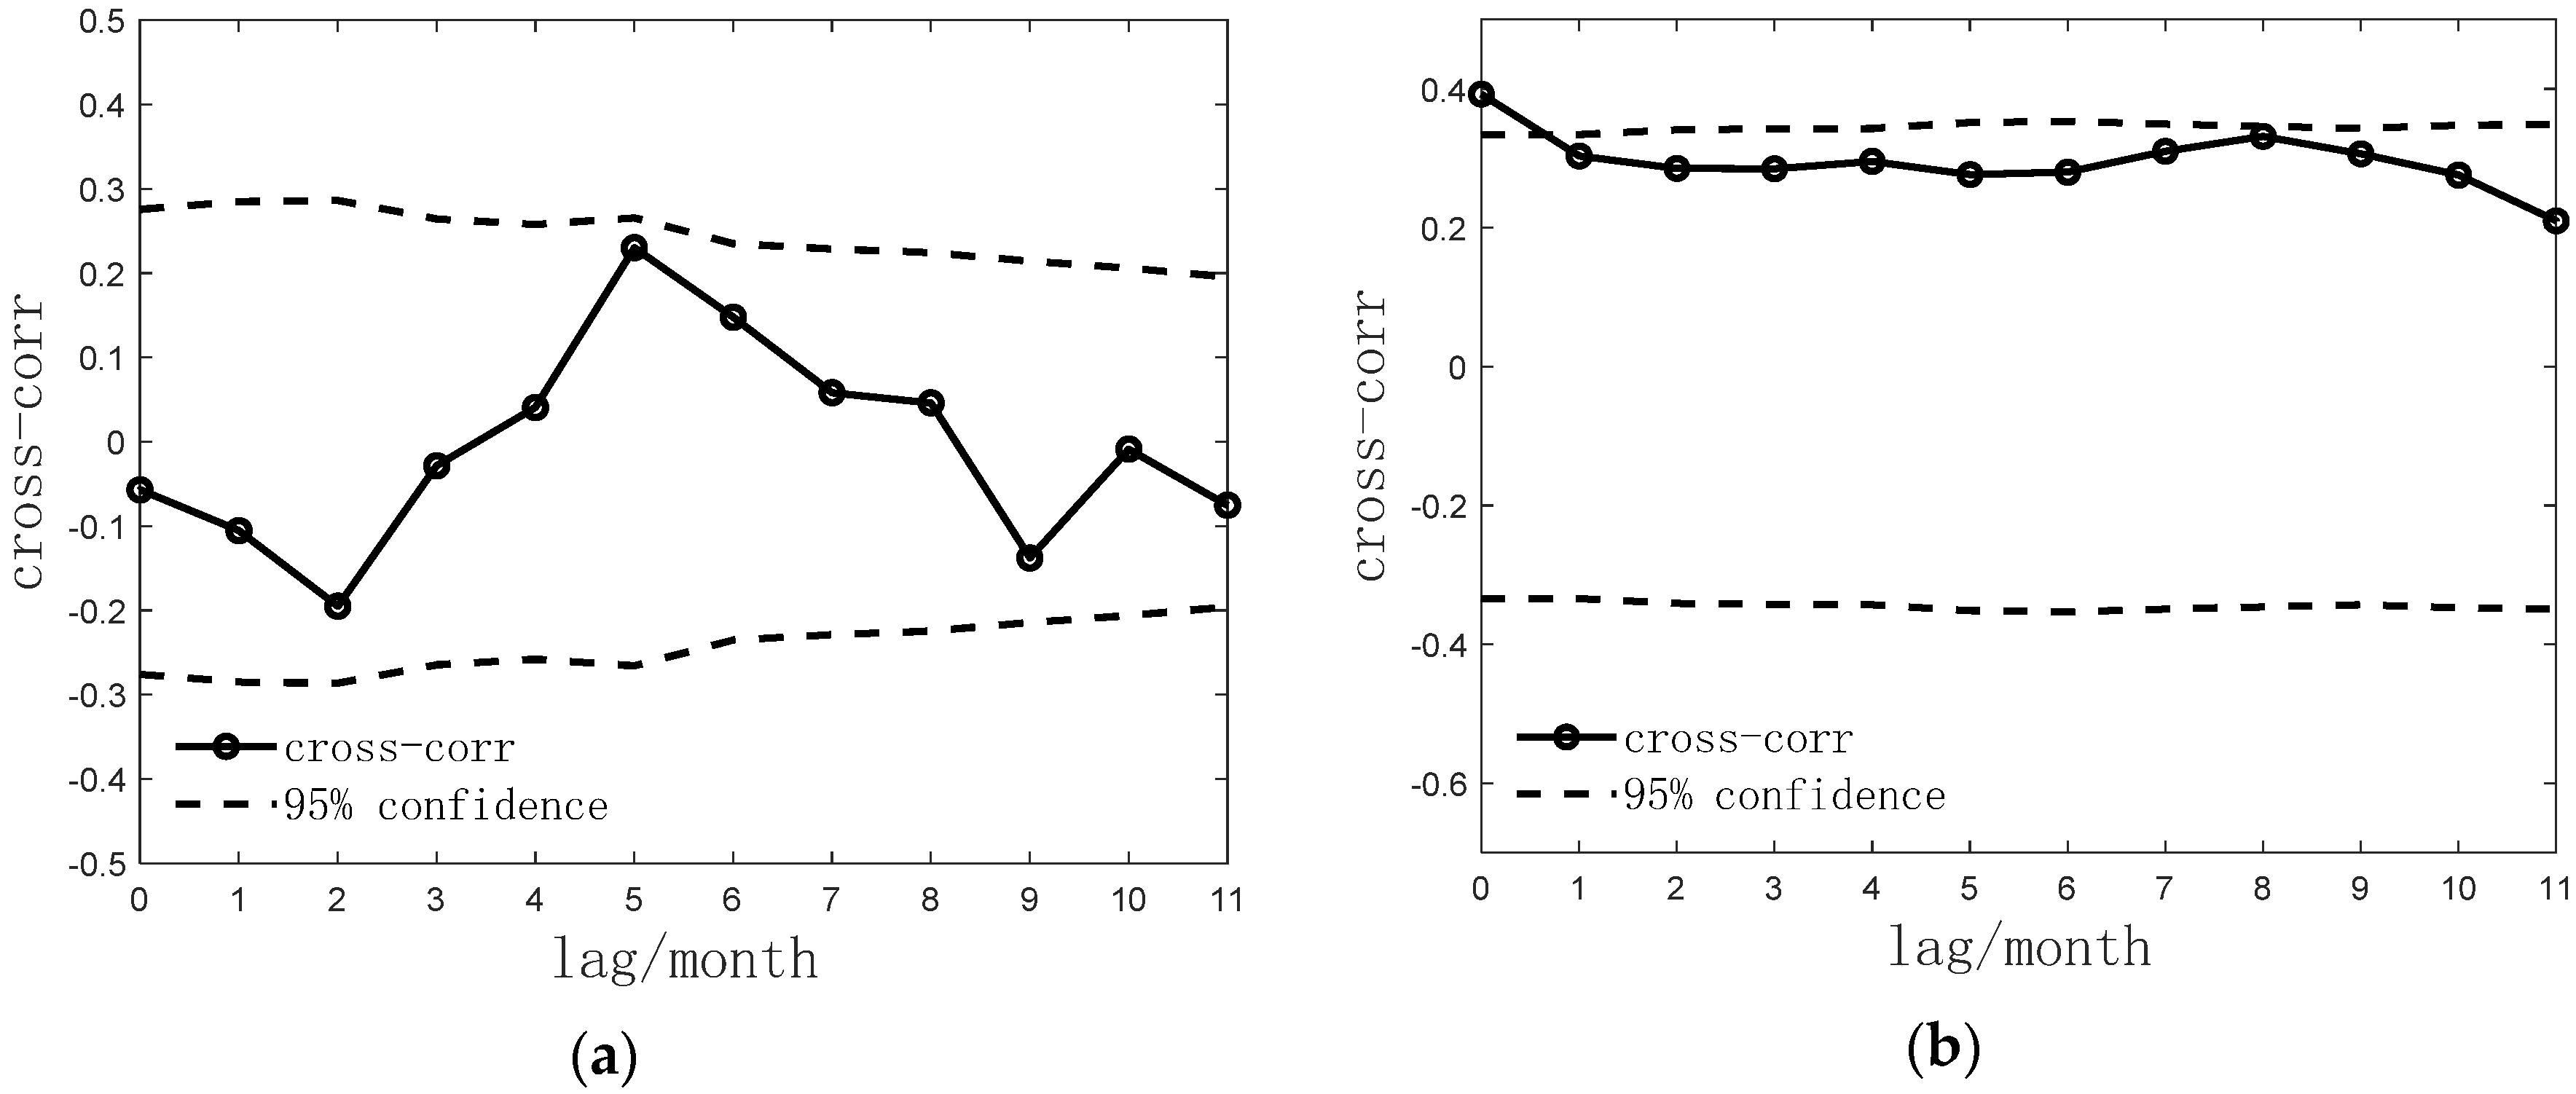
- From the beginning of the impoundment to the experimental impoundment stage of 175 m, the time series correlation test result between the monthly frequency of earthquakes and the water level of the reservoir also changed from uncorrelated before the water storage to correlated when the time lag was 0 months at a 95% confidence threshold. Further gravity observations and numerical simulation results showed that the seismic activity obviously has a direct relationship with the load pressure produced by the rapid rise of the reservoir water level, which causes the instability of the mines, karst caves, shallow rock strata, and faults within 10 km along the river and near the reservoir bank, and consequently induces earthquakes.
- (3)
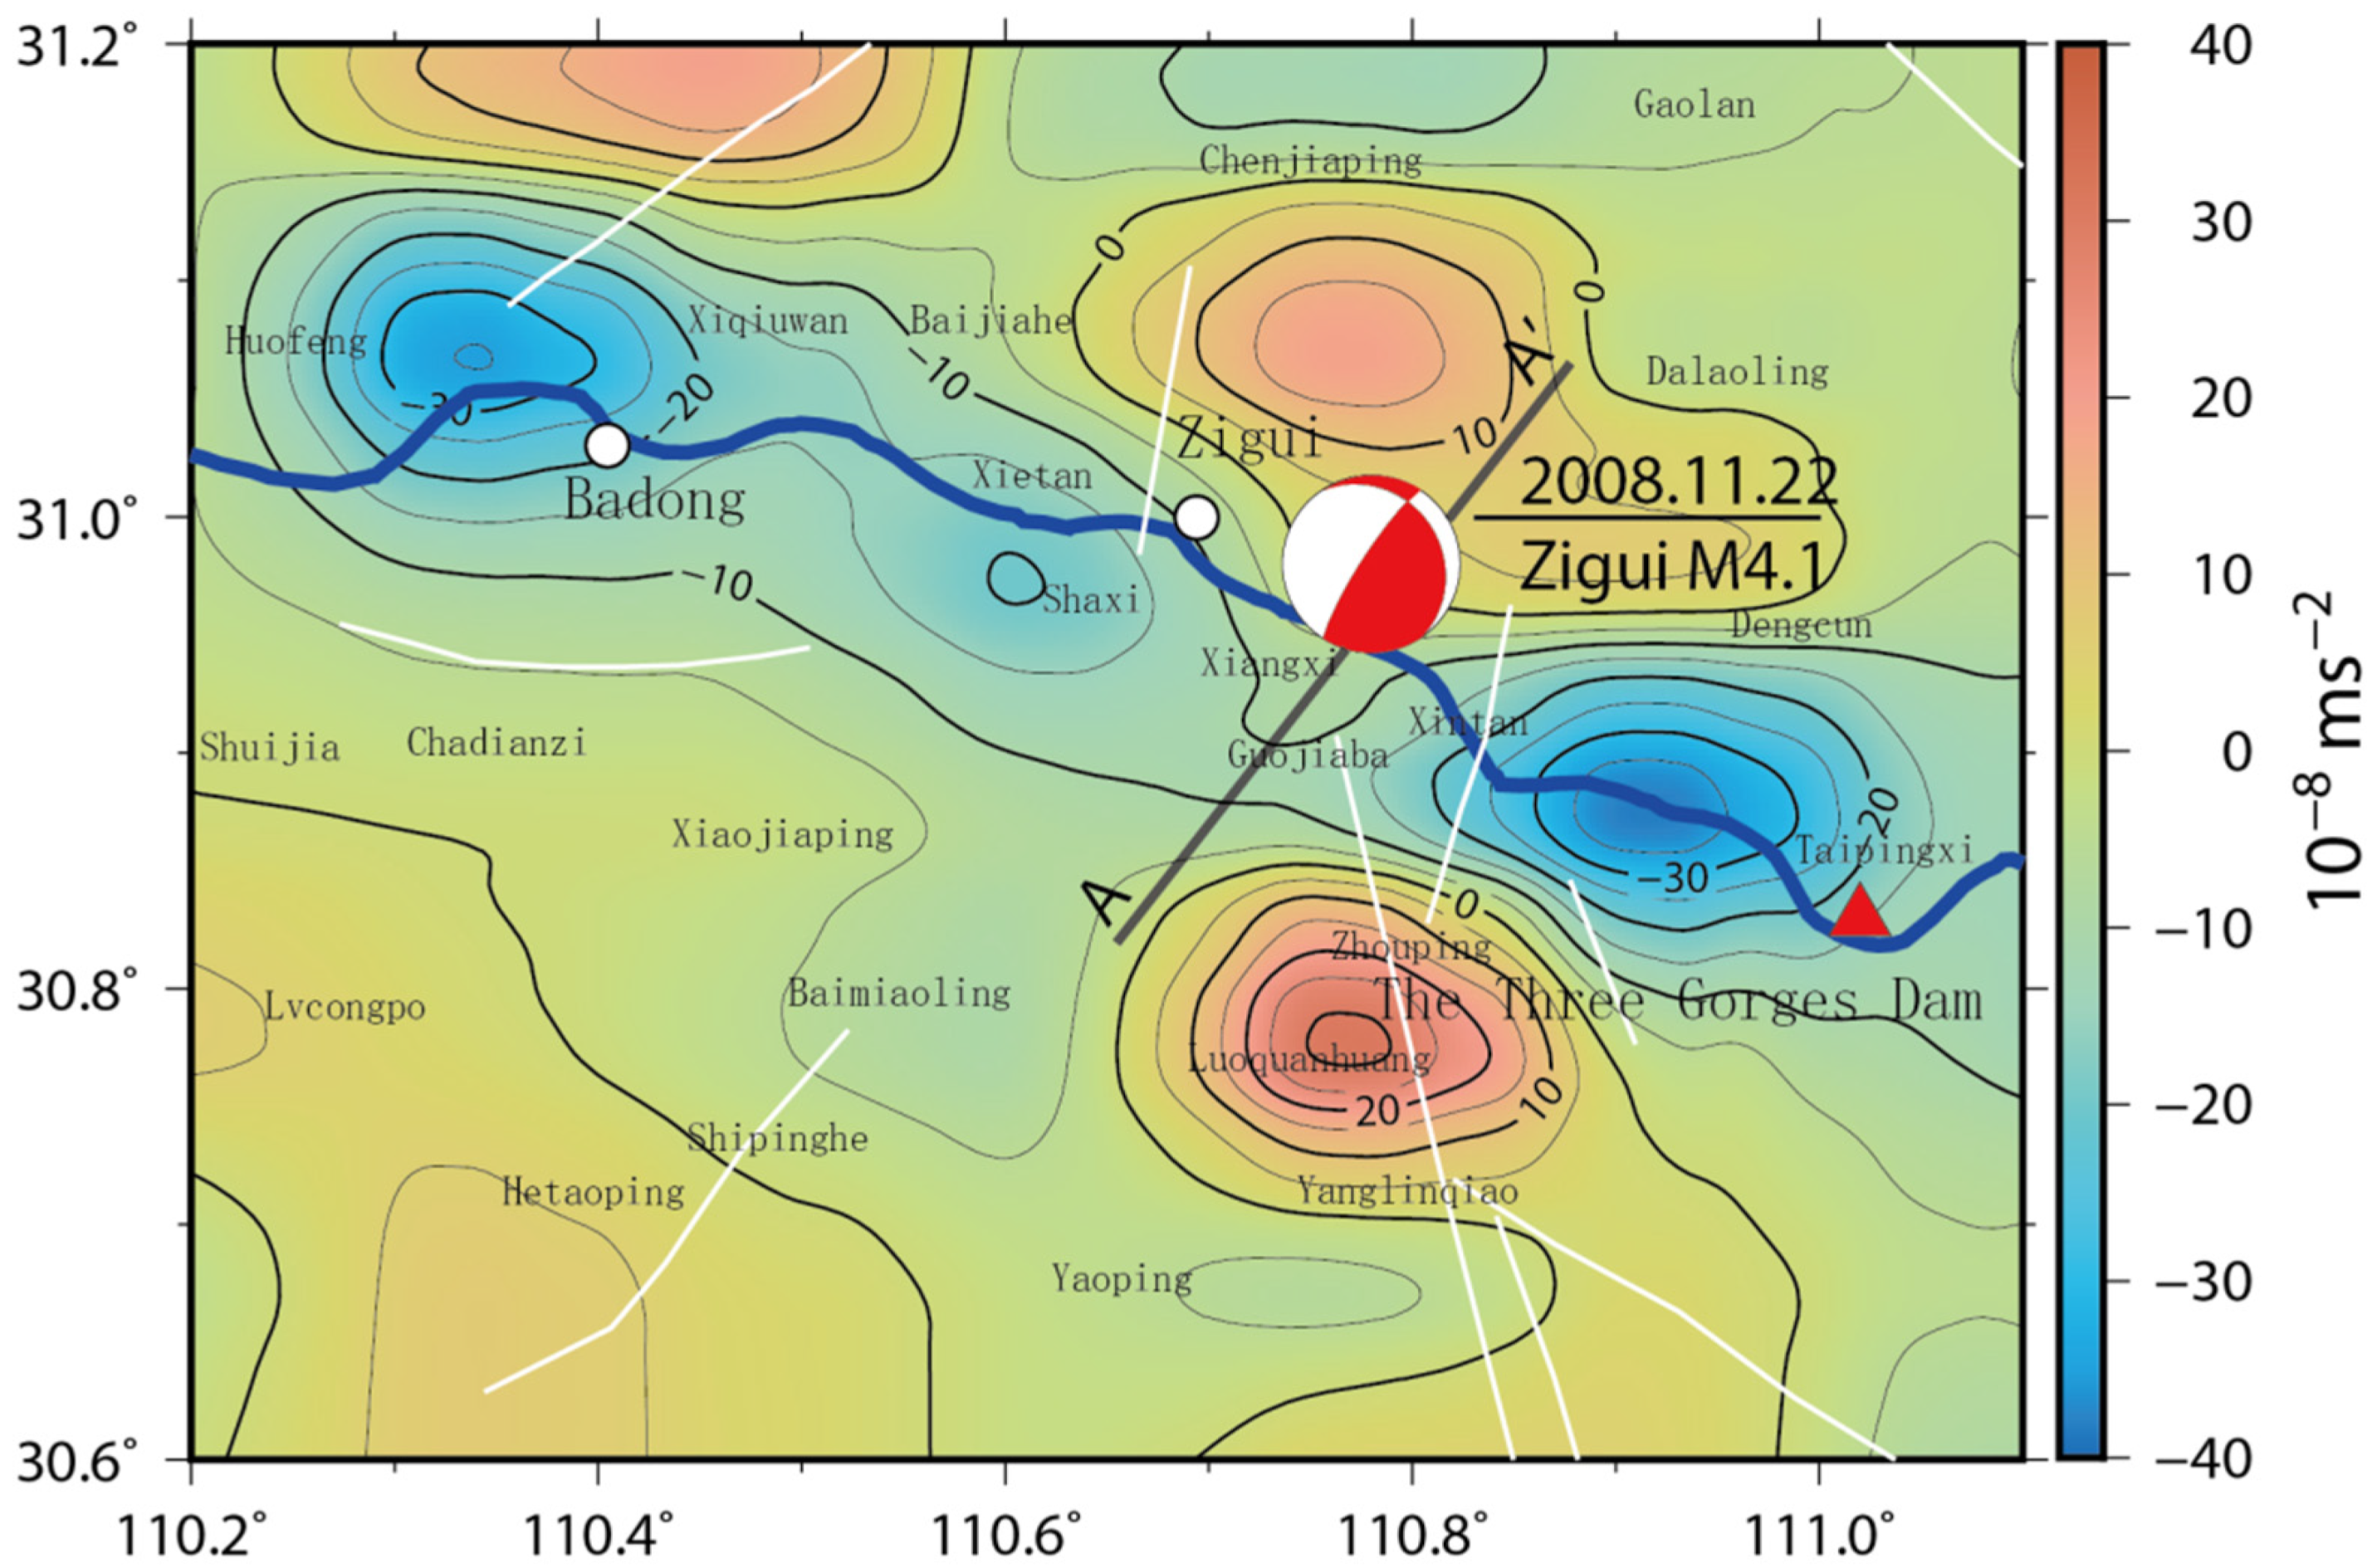
- As the TGR entered the 175 m high-level operation stage, the cross-correlation test confirmed that the seismic activity and the reservoir water level showed negative correlation characteristics under the time lag of 4 to 5 months, suggesting that the seismic activity has a lagging response to the reservoir water level change. Gravity and numerical simulation results showed the continued infiltration of the reservoir water, followed by the softening of the faults and other actions, triggering the Xiangxi M4.1 earthquake at the center of the four quadrants of gravity anomalies near Xiangxi on 22 November 2008. The Xiangxi segment of the reservoir and its periphery, a triangular geological region where the Xiannvshan faults, the Jiuwanxi fault, and the Yangtze River meet, might be at risk of having reservoir-induced tectonic earthquakes.
Author Contributions
Funding
Institutional Review Board Statement
Acknowledgments
Conflicts of Interest
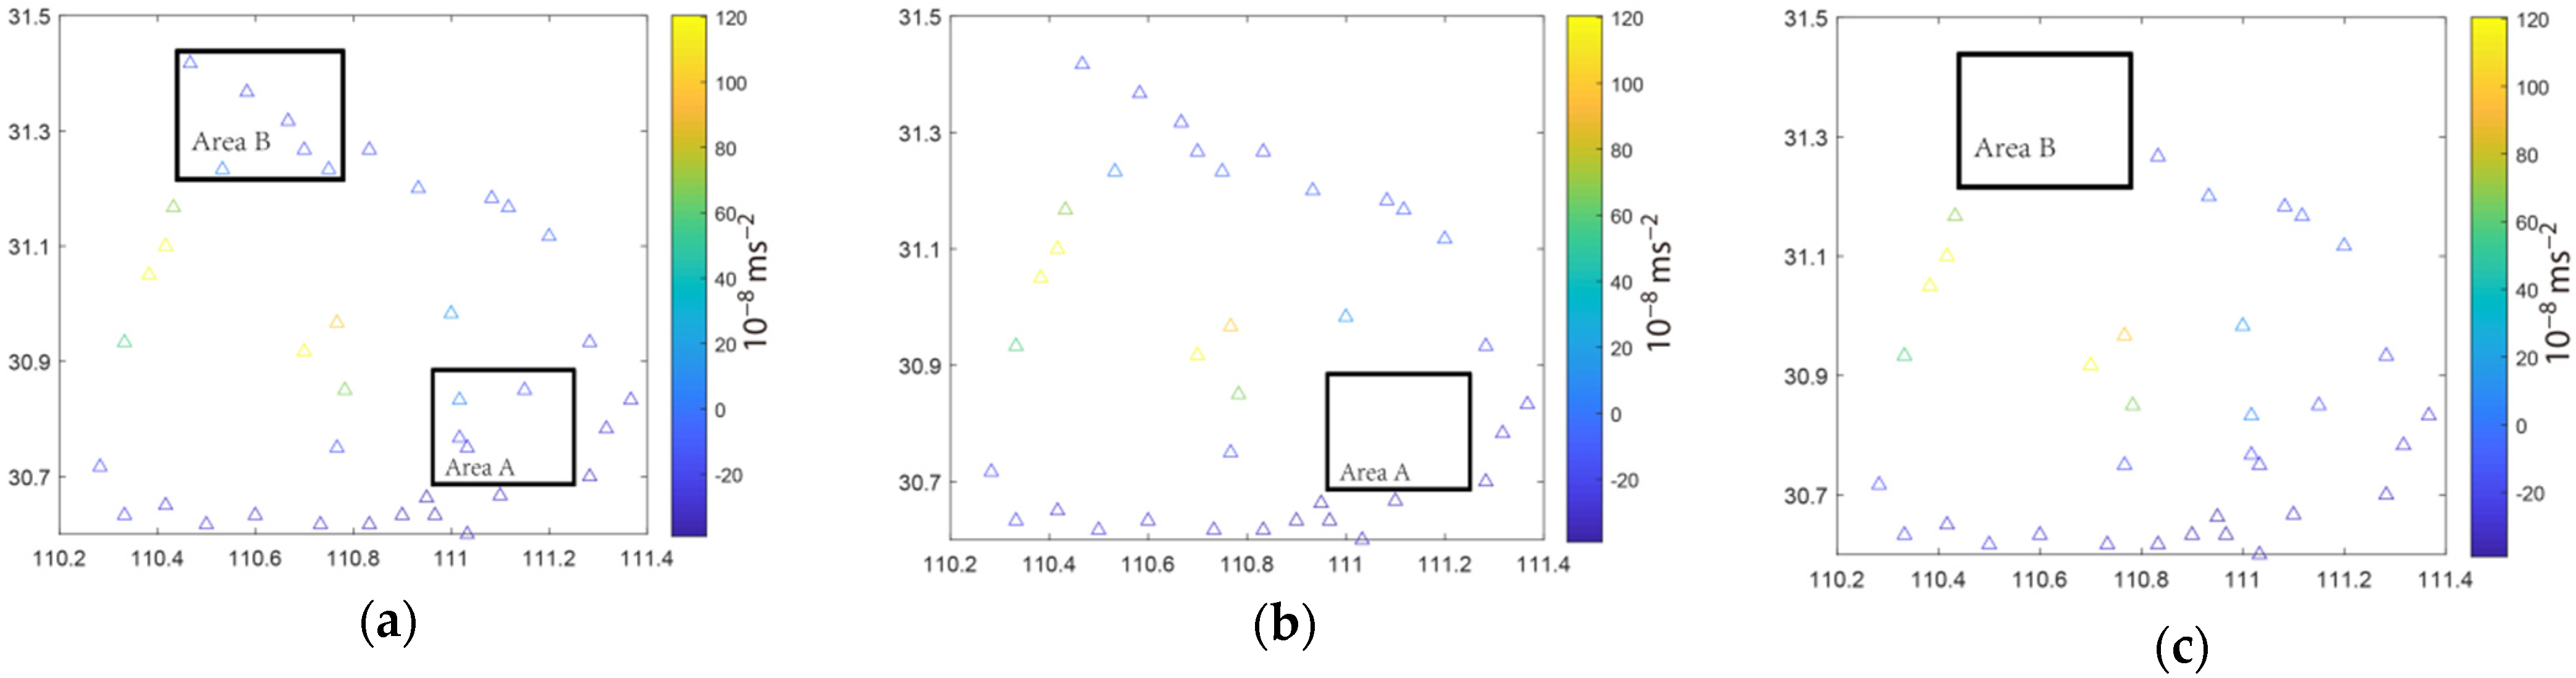
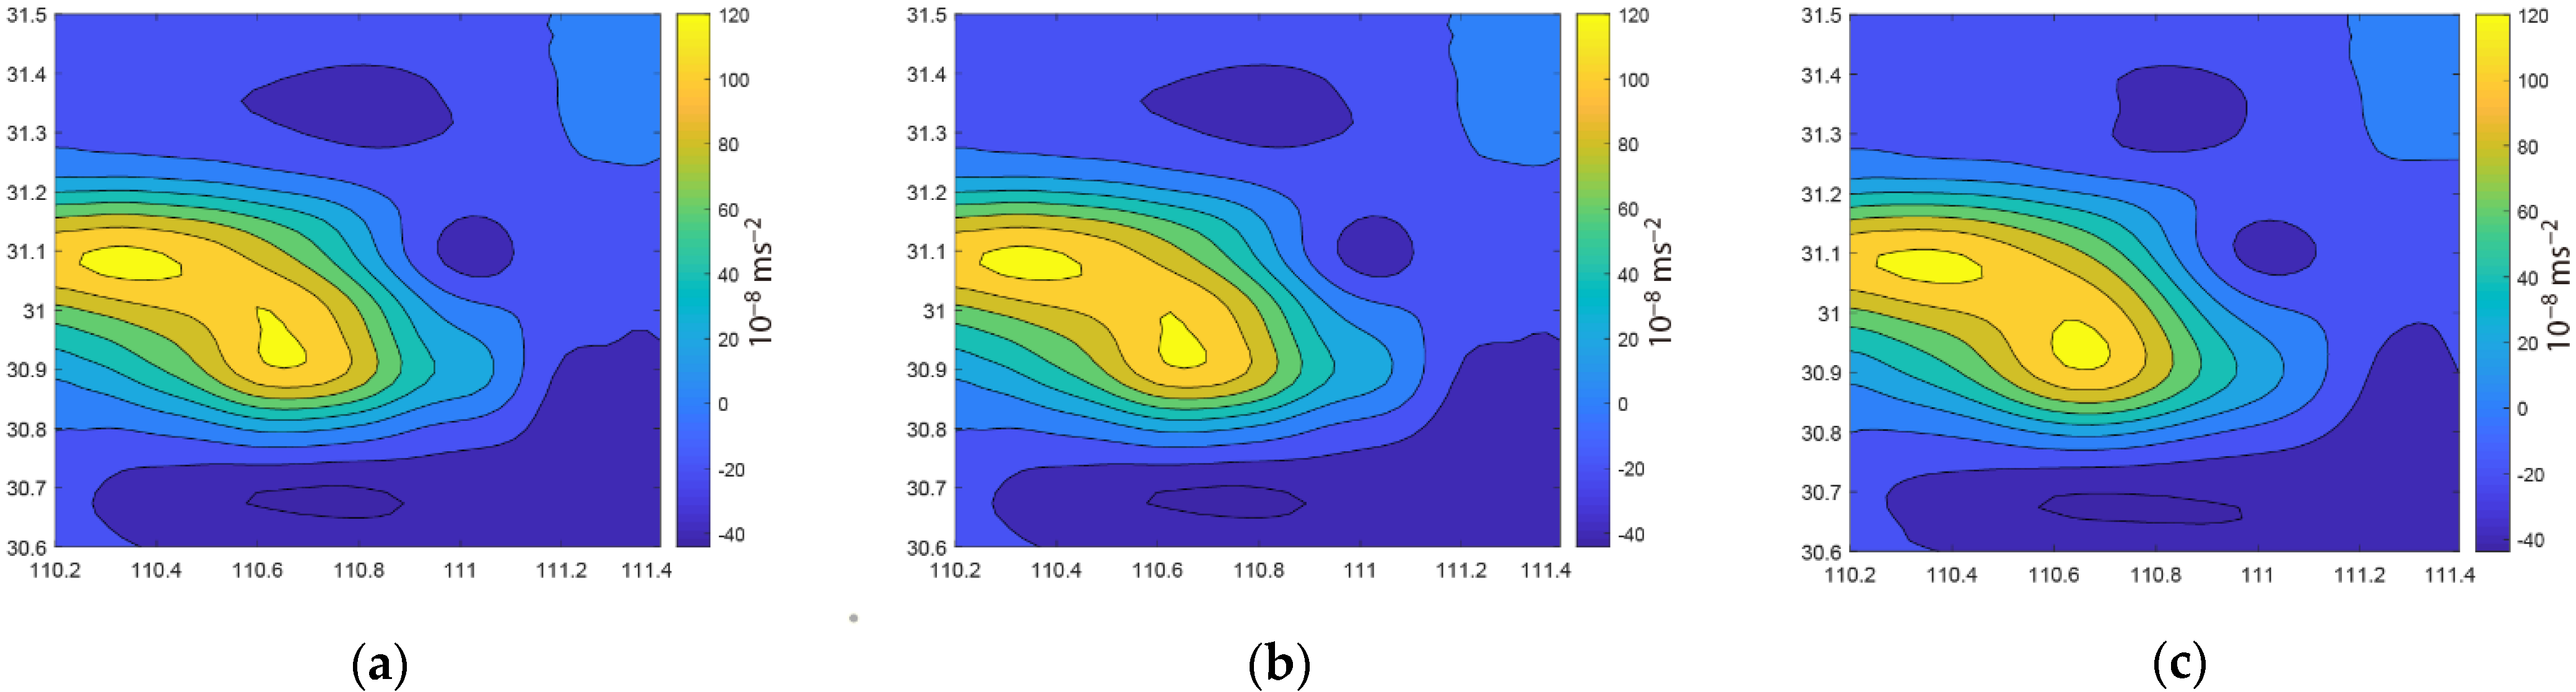
Appendix A. An Example of Gridding the Gravity Observation Data
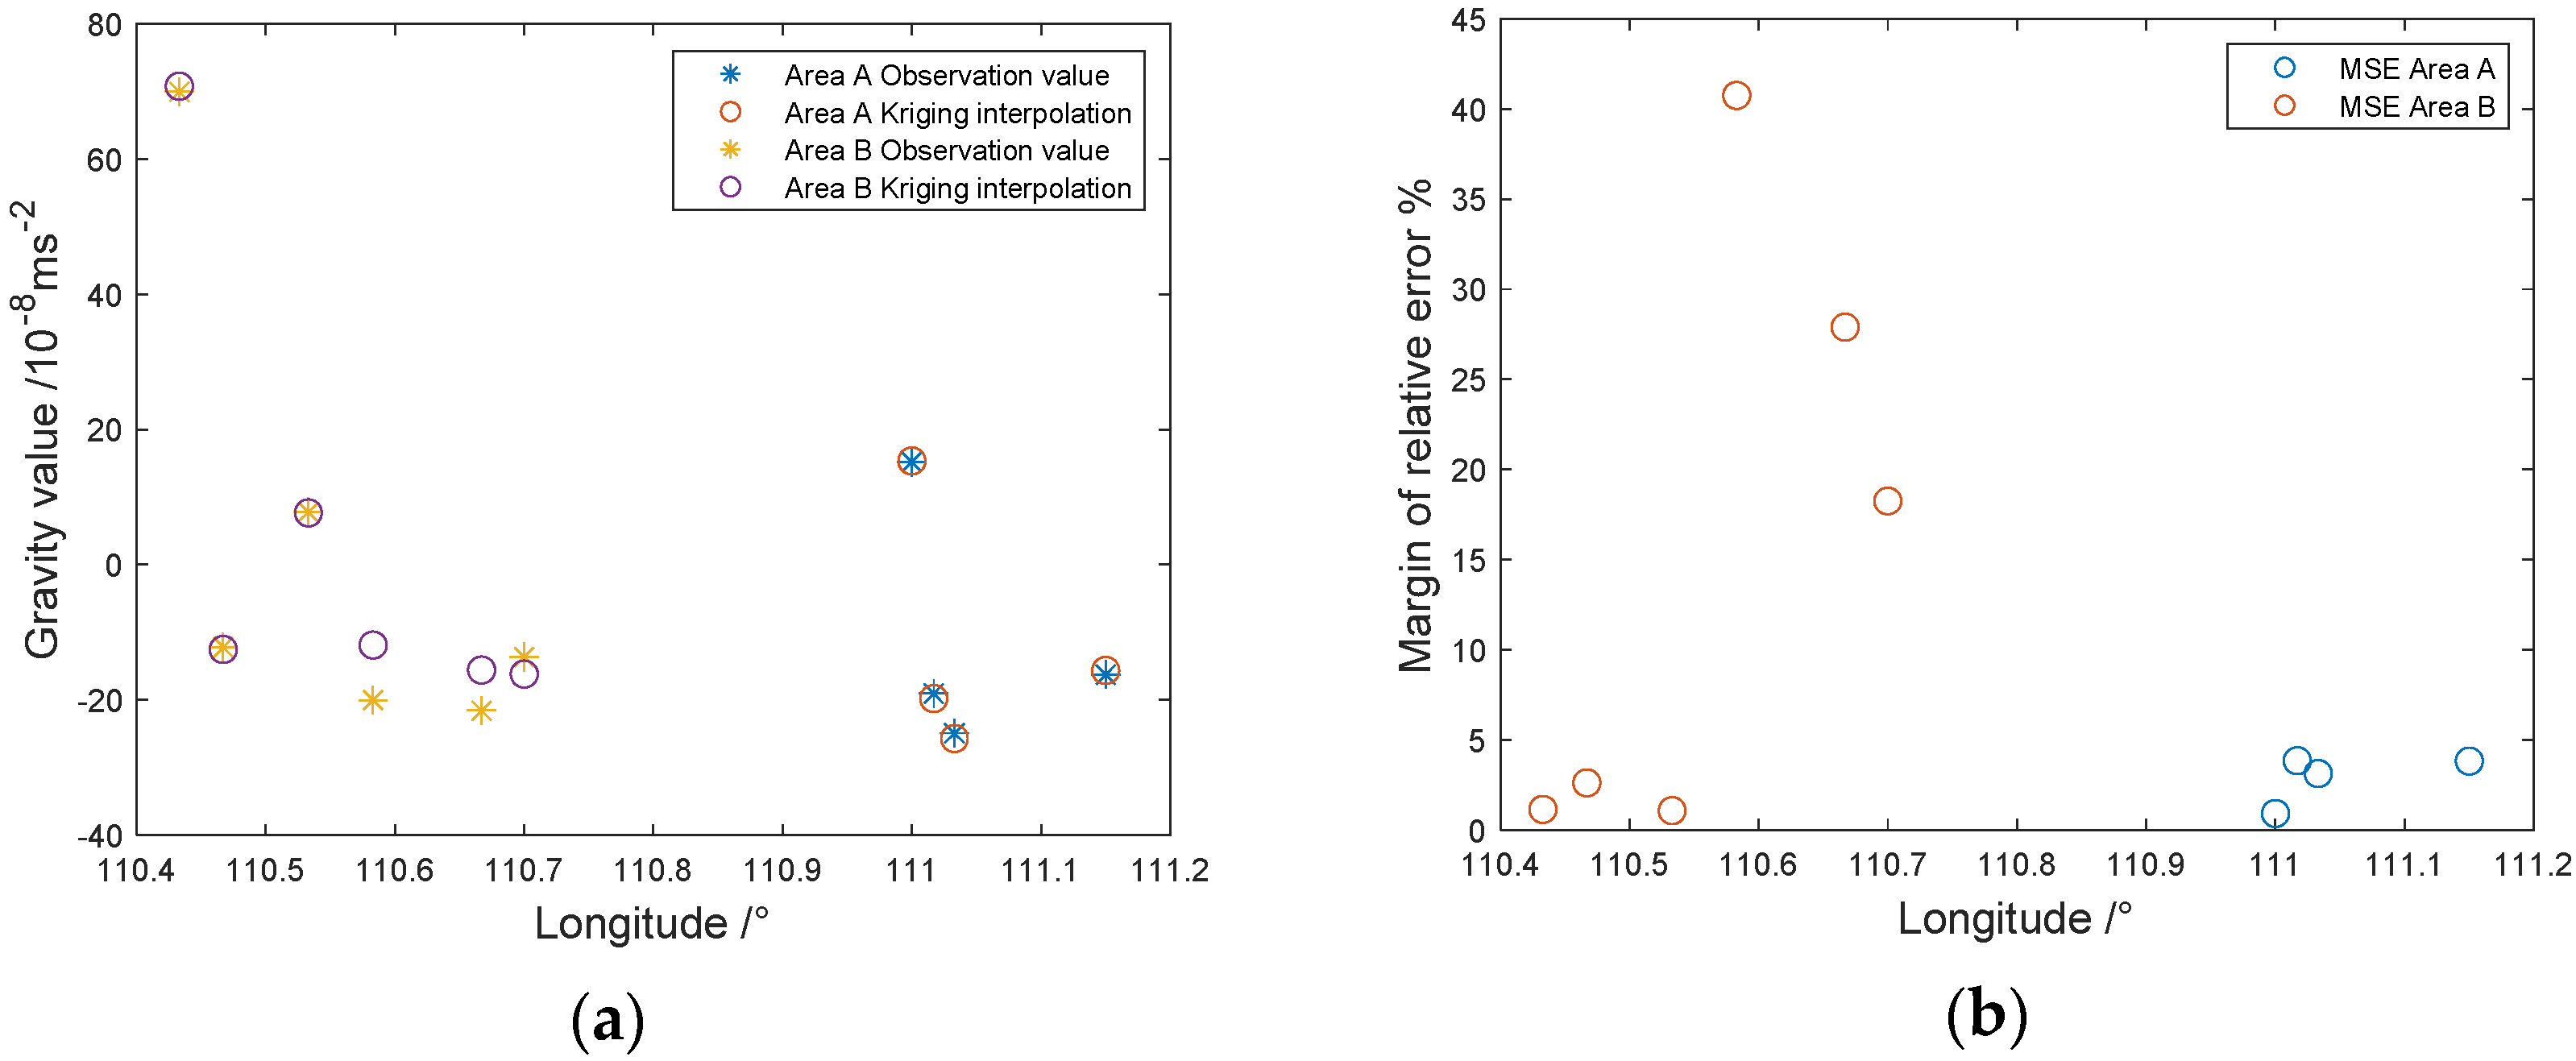
Appendix A.1. An Overview of Kriging Interpolation
Appendix A.2. Gridding of Gravity Observation Data before and after 135 m Water Impounding Stage


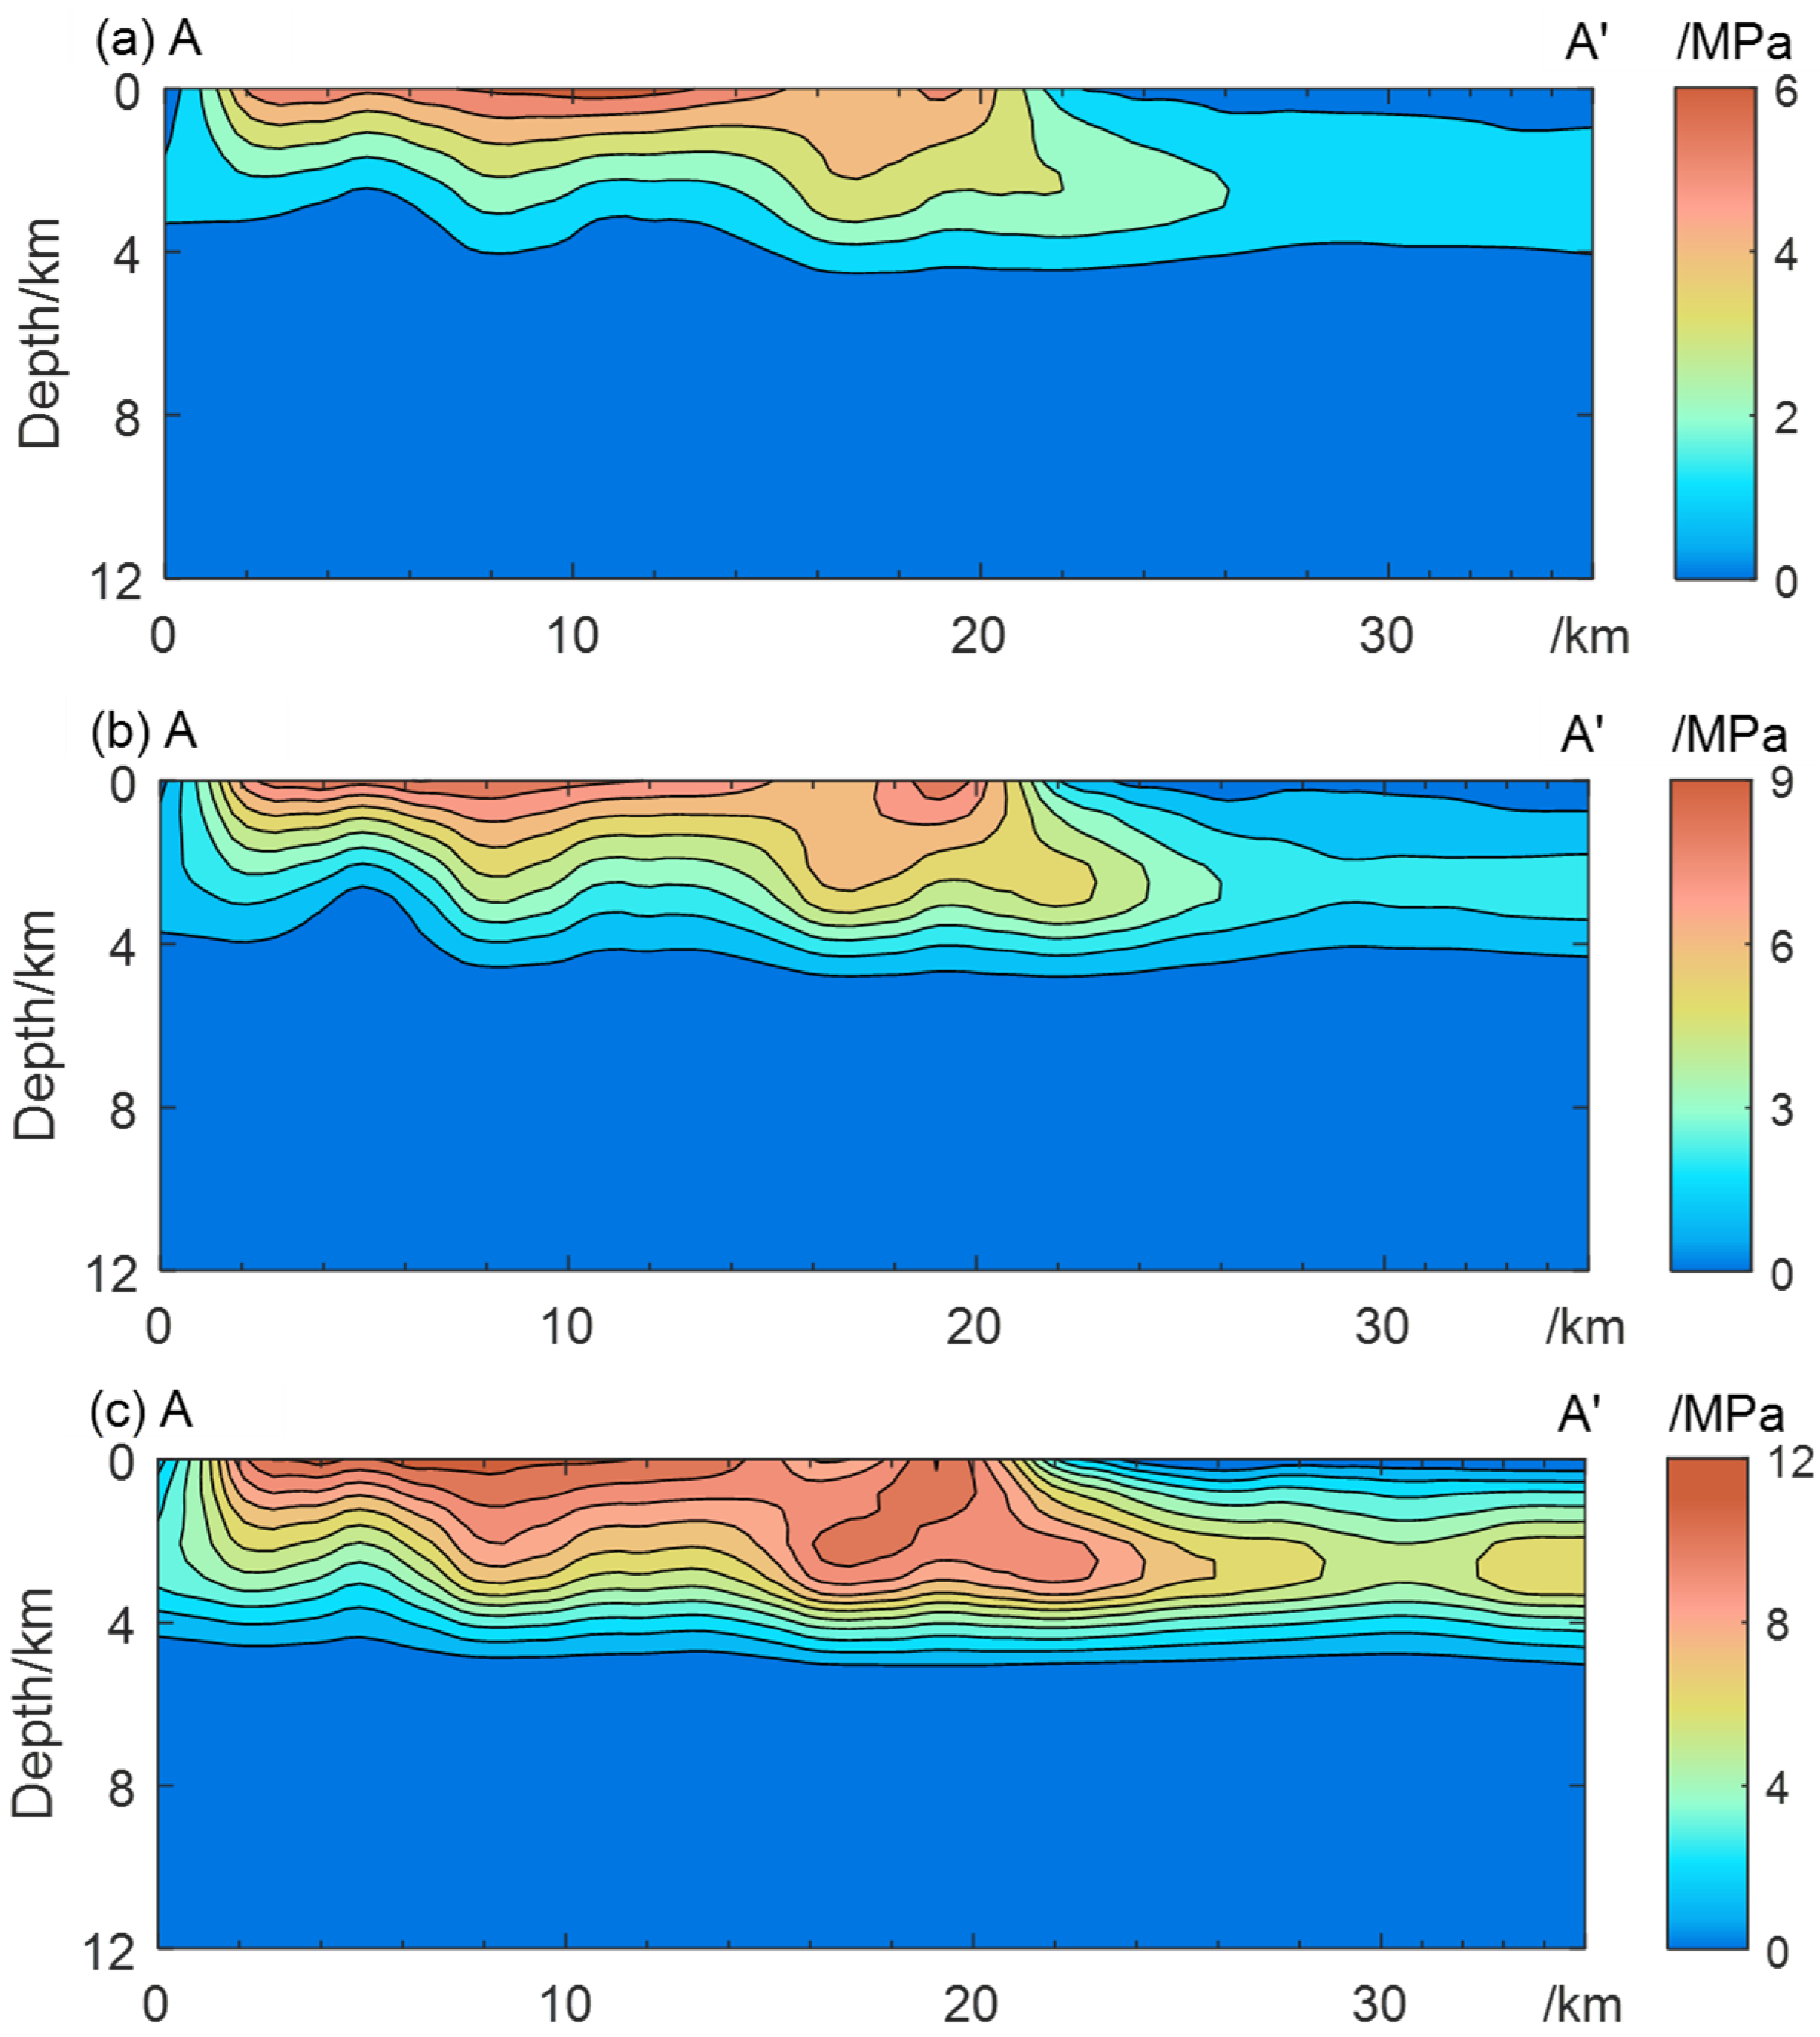
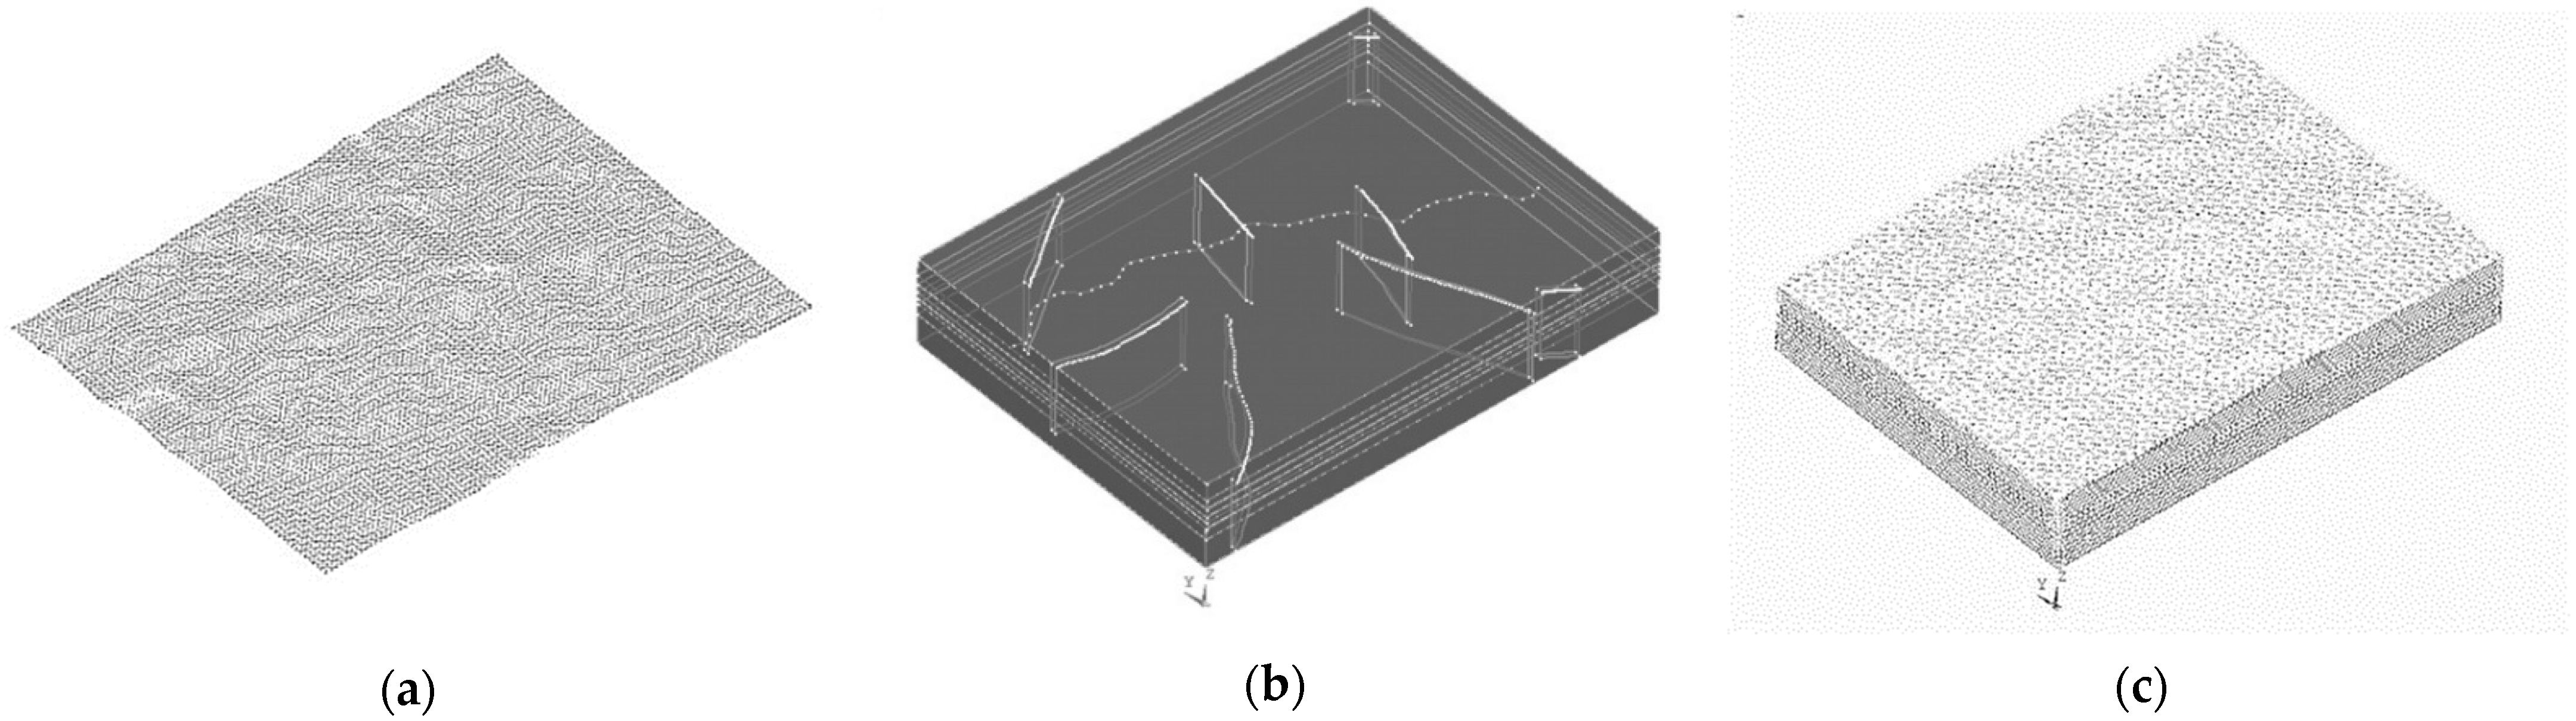
Appendix B. Three-Dimensional Finite-Difference Model Based on Fluid–Solid Coupling Theory
Appendix B.1. Model Building


| Number | Lithology | Thickness | |||||||
| 1 | Gravel, hard clay | 1500 | 32.00 | 110.00 | 1600 | ||||
| 2 | Sandstone, mudstone | 1500 | 26.80 | 7.00 | 27.80 | 27.20 | 223.00 | 2630 | |
| 3 | Siltstone, shale | 1000 | 15.60 | 10.80 | 32.10 | 34.70 | 197.00 | 2570 | |
| 4 | Limestone | 1000 | 22.60 | 11.10 | 32.00 | 42.00 | 134.00 | 2680 | |
| 5 | shale bookstone | 2000 | 8.80 | 4.30 | 27.80 | 14.40 | 202.00 | 2660 | |
| 6 | Limestone | 5000 | 43.90 | 30.20 | 32.10 | 51.00 | 10.34 | 2690 |
Appendix B.2. Calculation Steps and Boundary Condition Settings
Appendix B.3. Post-Processing
References
- Carder, D.S.; Isaacks, W.H.; Greenwood, W.P. Influence of reservoir loading on local earthquake activity. Geol. Soc. Am. Bull. 1947, 58, 1264. [Google Scholar]
- Gupta, H.K. A review of recent studies of triggered earthquakes by artificial water reservoirs with special emphasis on earthquakes in Koyna, India. Earth-Sci. Rev. 2002, 58, 279–310. [Google Scholar] [CrossRef]
- Drakatos, G.; Papanastassiou, D.; Papadopoulos, G.; Skafida, H.; Stavrakakis, G. Relationship between the 13 May 1995 Kozani-Grevena (NW Greece) earthquake and the Polyphyto artificial lake. Eng. Geol. 1998, 51, 65–74. [Google Scholar] [CrossRef]
- Jimenez, A.; Tiampo, K.F.; Posadas, A.M.; Luzon, F.; Donner, R. Analysis of complex networks associated to seismic clusters near the Itoiz reservoir dam. Eur. Phys. J.-Spec. Top. 2009, 174, 181–195. [Google Scholar] [CrossRef]
- Al-Saigh, N.H. The Mechanism of Induced Seismicity at Mosul Reservoir Based on the First Motion Analysis. J. Geol. Soc. India 2010, 76, 399–402. [Google Scholar] [CrossRef]
- Cheng, H.; Zhang, H.; Shi, Y. High-resolution numerical analysis of the triggering mechanism of M(l)5.7 Aswan reservoir earthquake through fully coupled poroelastic finite element modeling. Pure Appl. Geophys. 2016, 173, 1593–1605. [Google Scholar] [CrossRef]
- Grasso, J.R.; Karimov, A.; Amorese, D.; Sue, C.; Voisin, C. Patterns of reservoir-triggered seismicity in a low-seismicity region of France. Bull. Seismol. Soc. Am. 2018, 108, 2967–2982. [Google Scholar] [CrossRef]
- Xuan, N.B.; Trong, D.C.; Long, Q.N.; Bach, X.M.; Le, H.T.; Hien, P.L.; Goyal, R.; Than, A.T.; Hung, N.P. Assessment on maximum magnitude of natural and triggered earthquake when water is impounded in the mining pit: A case study in Nui Nho quarry, Vietnam based on gravity and magnetic data. Russ. J. Earth Sci. 2020, 20, 1. [Google Scholar]
- Zhang, H.; Cheng, H.; Pang, Y.; Shi, Y.; Yuen, D.A. Influence of the impoundment of the Three Gorges Reservoir on the micro-seismicity and the 2013 M5.1 Badong earthquake (Yangtze, China). Phys. Earth Planet. Inter. 2016, 261, 98–106. [Google Scholar] [CrossRef] [Green Version]
- Yao, Y.S.; Wang, Q.L.; Liao, W.L.; Zhang, L.F.; Chen, J.H.; Li, J.G.; Yuan, L.; Zhao, Y.-N. Influences of the Three Gorges Project on seismic activities in the reservoir area. Sci. Bull. 2017, 62, 1089–1098. [Google Scholar] [CrossRef] [Green Version]
- Jiang, H.K.; Song, J.; Wu, Q.; Li, J.; Qu, J.H. Quantitative investigation of fluid triggering on seismicity in the Three Gorge Reservoir area based on ETAS model. Chin. J. Geophys.-Chin. Ed. 2012, 55, 2341–2352. [Google Scholar]
- Jiang, F. Role of Gravimetry in Monitoring the Crustal Deformation of Three Gorges Reservoir Area. Geomat. Inf. Sci. Wuhan Univ. 2003, 28, 679–682. [Google Scholar]
- Xing, C.; Gong, K.; Du, R. Crustal deformation monitoring network for three gorges project on yangtze river. J. Geod. Geodyn. 2003, 23, 114–118. [Google Scholar]
- Tu, P.; Cen, Z.; Chen, H. Monitoring landslides deformation in three gorges reservoir area by using the repeat-pass spaceborne InSAR. Remote Sens. Technol. Appl. 2010, 25, 886–890. [Google Scholar]
- Zhang, S.; Chen, Z.; Wang, Q.; Liu, J.; Zhang, P. The anomaly feature extraction of mobile gravity in the sichuan-yunnan region using wavelet transform methodthe case study of the ludian m_s6.5 and jinggu m_s6.6 earthquakes in 2014. J. Geod. Geodyn. 2020, 40, 87–93. [Google Scholar]
- Zhu, Y.; Liu, F.; Zhang, G.; Xu, Y. Development and prospect of mobile gravity monitoring and earthquake forecasting in recent ten years in China. Geod. Geodyn. 2019, 10, 485–491. [Google Scholar] [CrossRef]
- Sun, S.; Xiang, A.; Zhu, P.; Shen, C. Gravity change and its mechanism after the first water impoundment in three gorges project. Acta Seismol. Sin. 2006, 28, 485–492. [Google Scholar] [CrossRef]
- Yang, Y.; Gao, Y.; Wang, W.; Kang, S.; Yang, G. Analysis of the influence of water impoundment and drainage in the Three Gorges Reservoir on the ground gravity change. Sci. Surv. Mapp. 2018, 43, 66–70. [Google Scholar]
- Yang, G.; Shen, C.; Wang, X.; Sun, S.; Liu, D.; Li, H. Numerical simulation of gravity effect of water-impoundment in three gorges reservoir. J. Geod. Geodyn. 2005, 25, 19–23. [Google Scholar]
- Li, X.; Yao, Y.; Zeng, Z.; Liu, L. Analysis of the formation system of the present tectonic stress field in the head area of the three gorges reservoir. J. Geomech. 2006, 12, 174–181. [Google Scholar]
- Liu, J.Z.; Wang, T.Q.; Chen, Z.H.; Zhang, P.; Zhu, C.D.; Zhang, S.X. Analyzing gravity anomaly variations before the 2016 Ms 6.4 earthquake in Menyuan, Qinghai with an interpolation/cutting potential field separation technique. Appl. Geophys. 2018, 15, 137–146. [Google Scholar] [CrossRef]
- Wiemer, S.; Wyss, M. Minimum magnitude of completeness in earthquake catalogs: Examples from Alaska, the western United States, and Japan. Bull. Seismol. Soc. Am. 2000, 90, 859–869. [Google Scholar] [CrossRef]
- Telesca, L. Analysis of the cross-correlation between seismicity and water level in the koyna area of india. Bull. Seismol. Soc. Am. 2010, 100, 2317–2321. [Google Scholar] [CrossRef]
- Schultz, R.; Telesca, L. The cross-correlation and reshuffling tests in discerning induced seismicity. Pure Appl. Geophys. 2018, 175, 3395–3401. [Google Scholar] [CrossRef]
- Little, M.A.; McSharry, P.E.; Moroz, I.M.; Roberts, S.J. Testing the assumptions of linear prediction analysis in normal vowels. J. Acoust. Soc. Am. 2006, 119, 549–558. [Google Scholar] [CrossRef] [Green Version]
- Zhang, L.; Yao, Y.; Shen, X.; Wei, G.; Chen, J. Study on type and focal mechanism of the earthquakes in three gorges reservoir. J. Geod. Geodyn. 2014, 34, 77–82. [Google Scholar]
- Telesca, L.; ElBary, R.E.F.; Mohamed, A.E.-E.A.; ElGabry, M. Analysis of the cross-correlation between seismicity and water level in the Aswan area (Egypt) from 1982 to 2010. Nat. Hazards Earth Syst. Sci. 2012, 12, 2203–2207. [Google Scholar] [CrossRef] [Green Version]
- Dvorkin, J.; Nur, A. Dynamic poroelasticity—A unified model with the squirt and the biot mechanisms. Geophysics 1993, 58, 524–533. [Google Scholar] [CrossRef]
- Xie, X.D. Study on Mechanism of Reservoir-Induced Seismicity Based on Theory of Fluid-Solid Coupling in the Danjiangkou Reservoir Area. Ph.D. Thesis, Wuhan University, Wuhan, China, April 2010. [Google Scholar]
- Yu, J.; Wang, Q.; Zhao, Y. Stress field of the three gorges based on fluid-solid coupling simulation. J. Geod. Geodyn. 2020, 40, 928–930, 941. [Google Scholar]
- Hundelshaussen, R.; Costa, J.F.C.L.; Marques, D.M.; Bassani, M.A.A. Localised kriging parameter optimisation based on absolute error minimisation. Appl. Earth Sci.-Trans. Inst. Min. Metall. 2018, 127, 153–162. [Google Scholar] [CrossRef]
- Ryu, J.S.; Kim, M.S.; Cha, K.J.; Lee, T.H.; Choi, D.H. Kriging interpolation methods in geostatistics and DACE model. KSME Int. J. 2002, 16, 619–632. [Google Scholar] [CrossRef]


| Method | Area A | Area B |
|---|---|---|
| Kriging | 5.34% | 17.12% |
| RBF | 5.73% | 17.86% |
| TLI | 6.69% | 18.88% |
| Impounding Stages | Beginning and End Dates | Average Monthly Earthquake Frequency | ||||||
|---|---|---|---|---|---|---|---|---|
| 0.0–0.9 | 1.0–1.9 | 2.0–2.9 | 3.0–3.9 | 4.0–4.9 | 5.0–5.9 | All | ||
| Before the impoundment | 1 January 2001–24 May 2003 | 0.97 | 0.90 | 0.07 | 0.07 | 0.00 | 0.00 | 2.00 |
| 135 m | 25 May 2003–19 September 2006 | 16.43 | 2.20 | 0.25 | 0.03 | 0.00 | 0.00 | 18.90 |
| 156 m | 20 September 2006–27 September 2008 | 65.08 | 8.58 | 0.63 | 0.00 | 0.00 | 0.00 | 74.29 |
| 175 m | 28 September 2008–31 December 2009 | 82.67 | 8.73 | 1.13 | 0.00 | 0.07 | 0.00 | 92.60 |
Publisher’s Note: MDPI stays neutral with regard to jurisdictional claims in published maps and institutional affiliations. |
© 2022 by the authors. Licensee MDPI, Basel, Switzerland. This article is an open access article distributed under the terms and conditions of the Creative Commons Attribution (CC BY) license (https://creativecommons.org/licenses/by/4.0/).
Share and Cite
Meng, Q.; Yao, Y.; Liao, W.; Zhang, L.; Dang, X. The Impact of Rising Reservoir Water Level on the Gravity Field and Seismic Activity in the Reservoir Area: Evidence from the Impoundment of the Three Gorges Reservoir (China). Appl. Sci. 2022, 12, 4085. https://0-doi-org.brum.beds.ac.uk/10.3390/app12084085
Meng Q, Yao Y, Liao W, Zhang L, Dang X. The Impact of Rising Reservoir Water Level on the Gravity Field and Seismic Activity in the Reservoir Area: Evidence from the Impoundment of the Three Gorges Reservoir (China). Applied Sciences. 2022; 12(8):4085. https://0-doi-org.brum.beds.ac.uk/10.3390/app12084085
Chicago/Turabian StyleMeng, Qingxiao, Yunsheng Yao, Wulin Liao, Lifen Zhang, and Xuehui Dang. 2022. "The Impact of Rising Reservoir Water Level on the Gravity Field and Seismic Activity in the Reservoir Area: Evidence from the Impoundment of the Three Gorges Reservoir (China)" Applied Sciences 12, no. 8: 4085. https://0-doi-org.brum.beds.ac.uk/10.3390/app12084085