
Precision Nutrient Management Using Artificial Intelligence Based on Digital Data Collection Framework

Abstract
:1. Introduction
2. Related Works
3. Materials and Methods
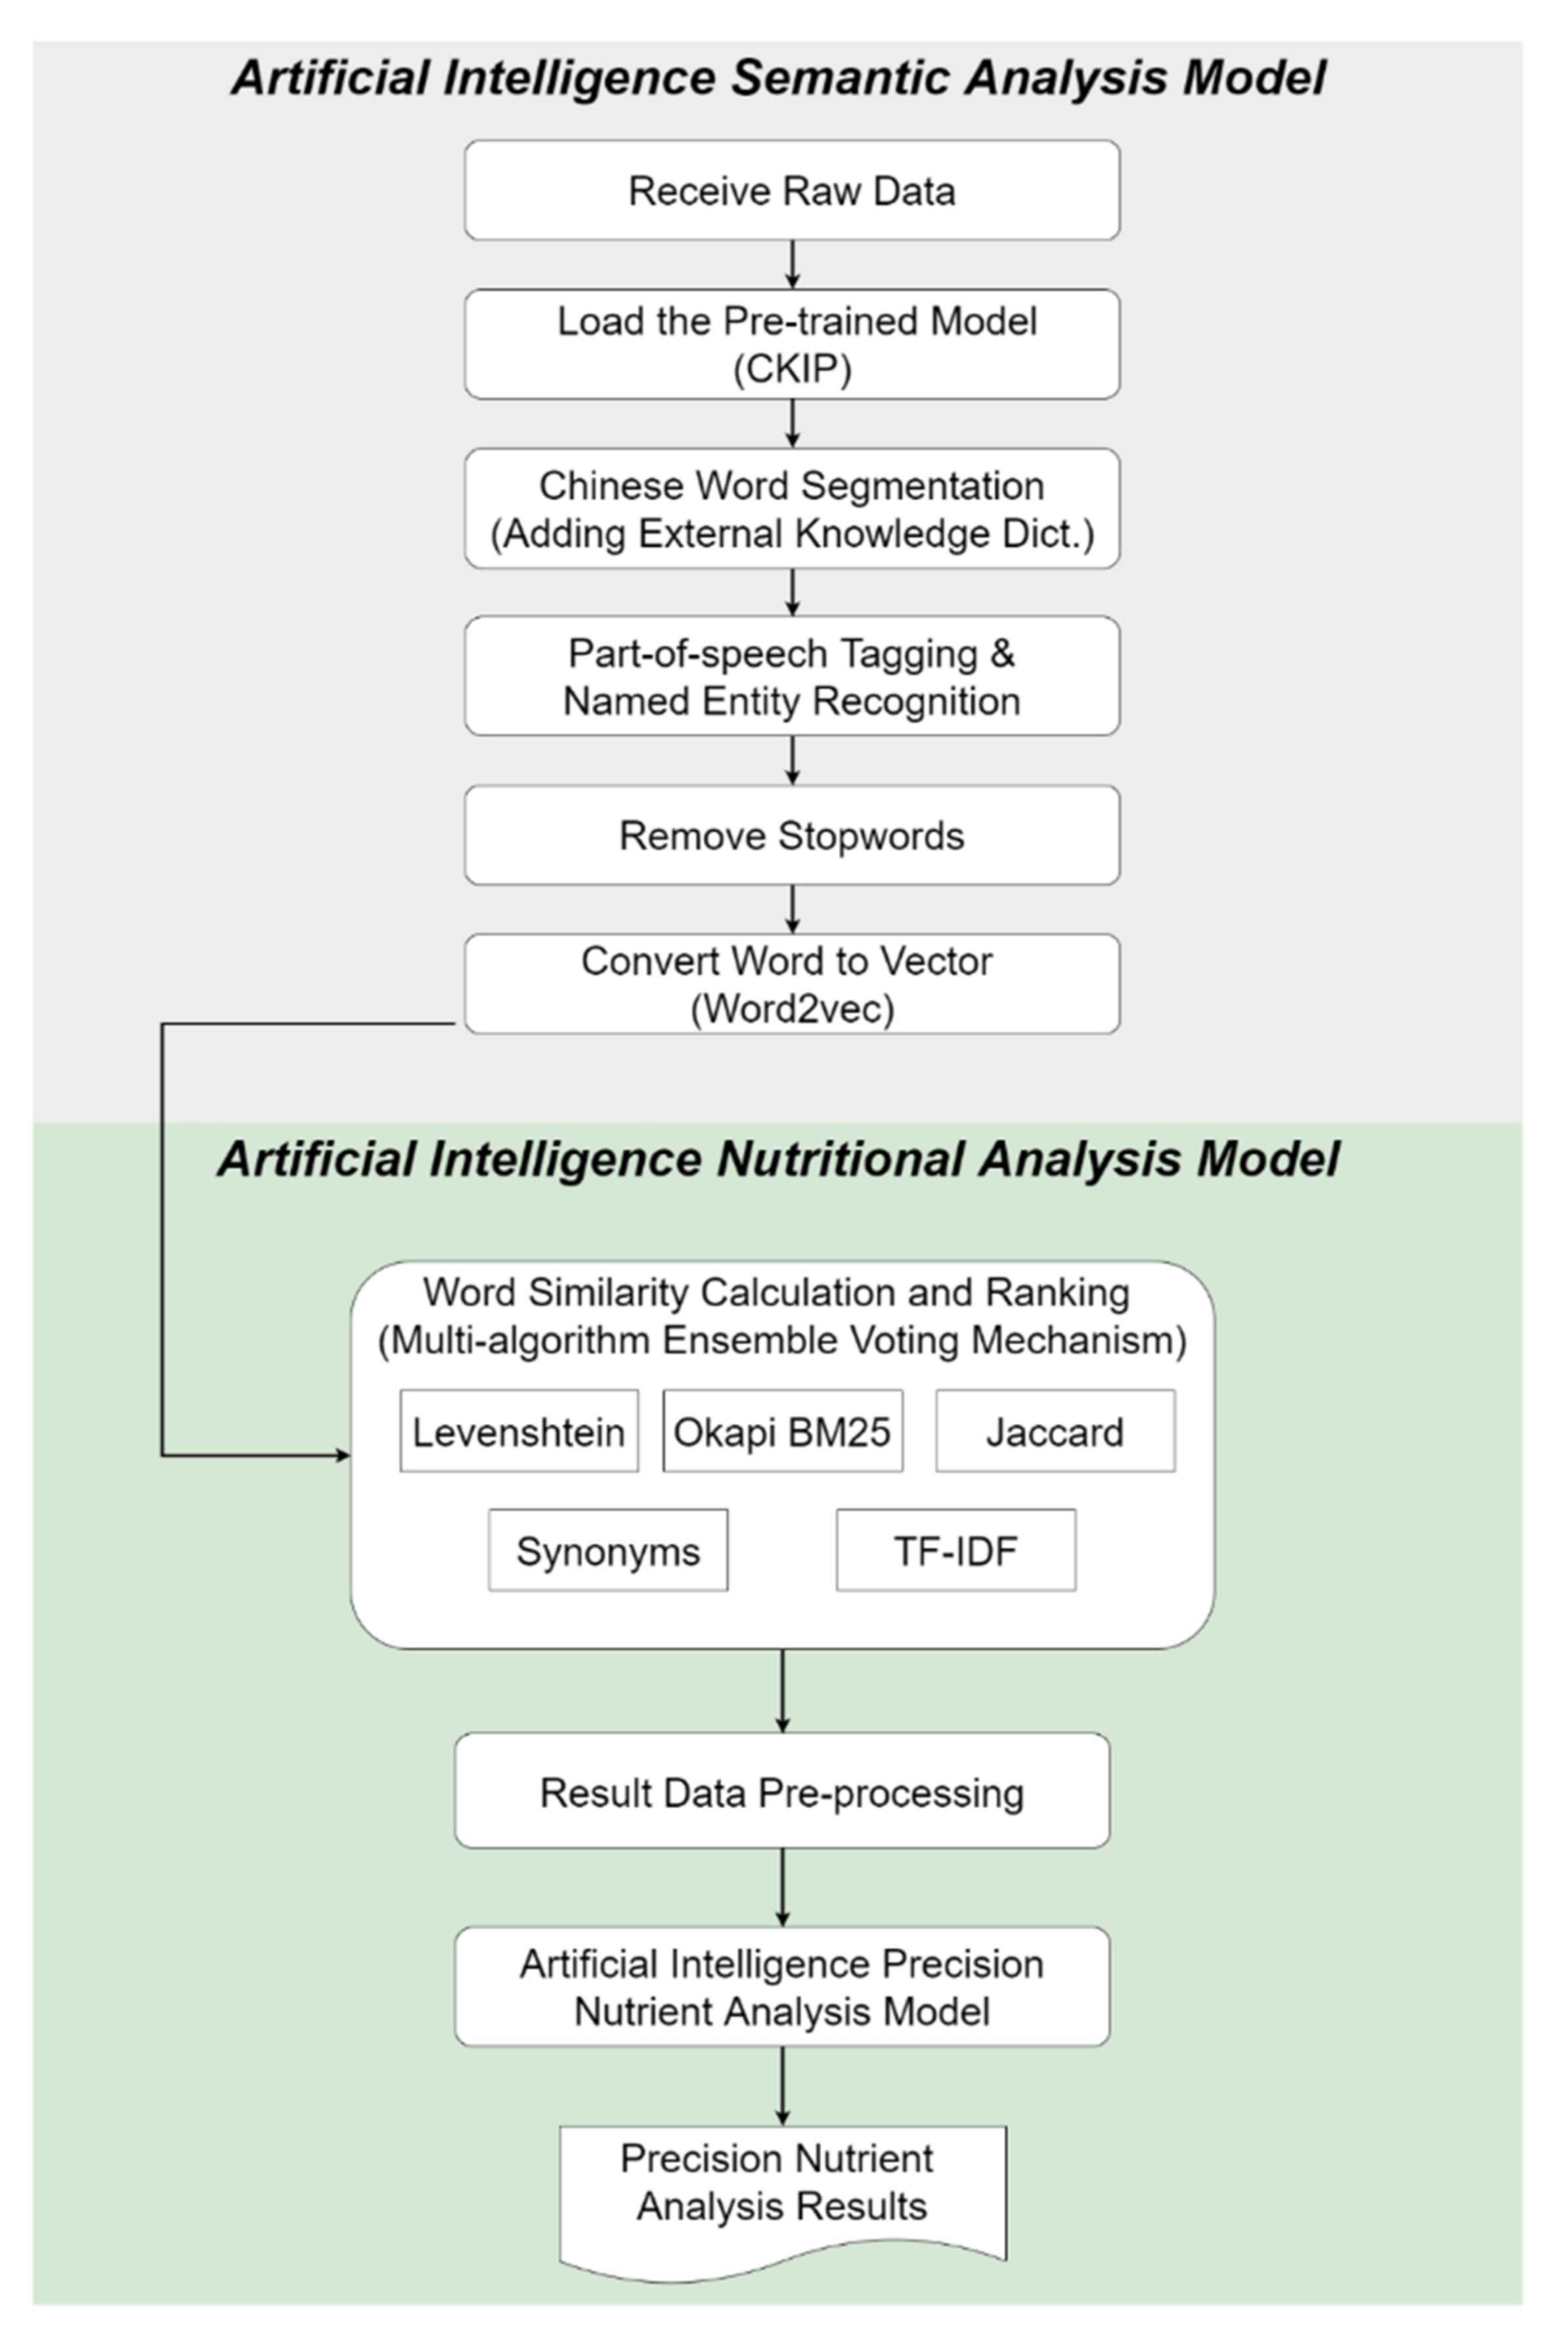
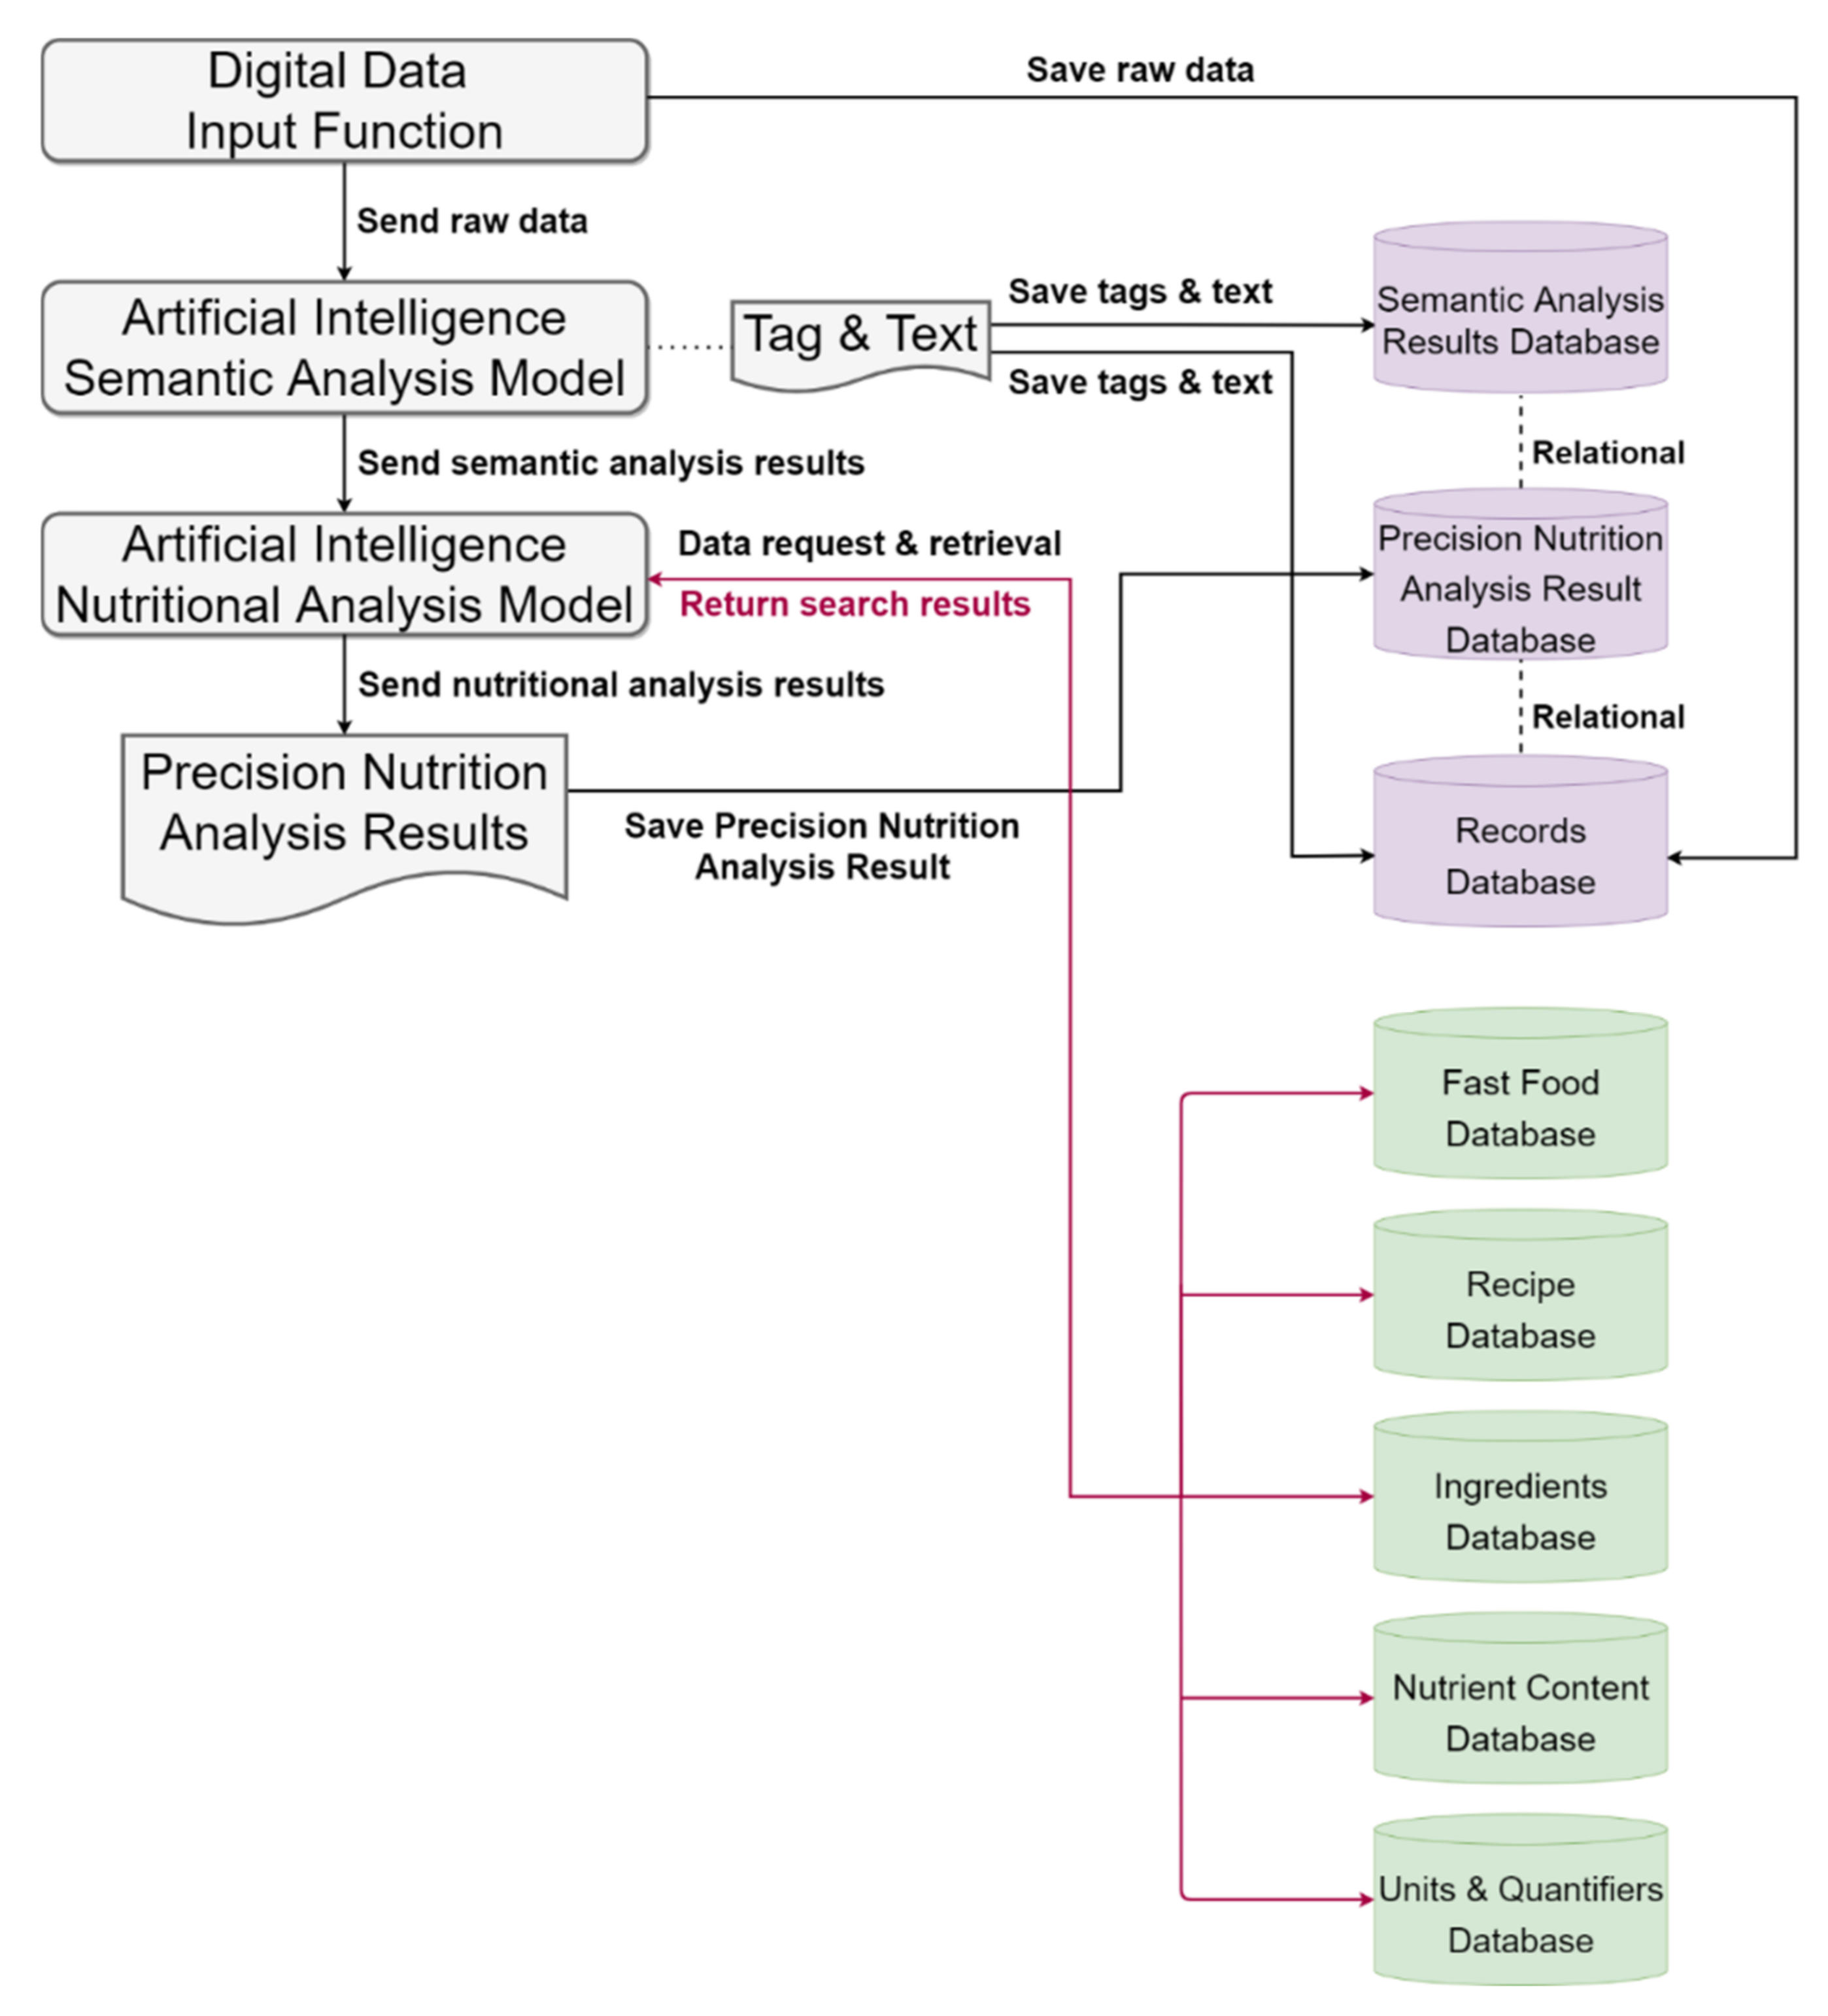
3.1. Artificial Intelligence Semantic Analysis Model
3.2. Artificial Intelligence Nutritional Analysis Model
3.2.1. Step 1. Artificial Intelligence Analysis
- (1)
- Okapi Best Matching (Okapi BM25)
- f(qi,D): Frequency of the term qi in Document D0
- |D|: Length of Document D (in words).
- K1: The terminology described above is saturated with parameters.
- b: The length normalization parameters, as described above.
- avgdl: Average document length in document collection.
- IDF: Frequency of inverse text files.
- n(qi): Number of documents containing qi.
- n: Total number of text files in the collection.
- (2)
- Term Frequency–Inverse Document Frequency (TF–IDF)
- Molecular formula: ni,j denotes the number of occurrences of the word in document dj.
- Denominator: The sum of all occurrences of the word in document dj.
- Molecular formula: total number of documents.
- Denominator: the number of documents containing the term.
- The result of the calculation is obtained by quoting the logarithm of the number of documents with a base of 10.
- (3)
- Levenshtein
- (4)
- Jaccard
- (5)
- Synonyms
3.2.2. Step 2. Common Voting Mechanism
3.2.3. Step 3. Nutritional Ingredient Analysis
4. Results
4.1. Operation Example
- Input the dietary record to the model.Dietary Record: “Today I had a plate of cabbage with pork fat and a bowl of bamboo shoots and pork ribs soup.”
- The names of the dishes and the portion sizes were analyzed by the Semantic Analysis Model. Nd is defined as time; Nf is defined as a quantity, and Na is defined as a common noun.Segmentation of record:[{“label”: ”Today”, ”Pos”: ”Nd”}, {“label”: ”plate”, ”Pos”: ”Nf”}, {“label”: ”cabbage”, ”Pos”: ”Na”}, {“label”: ”pork fat”, ”Pos”: ”Na”}, {“label”: ”bowl”,”Pos”: ”Nf”}, {“label”: ” bamboo shoots”, ”Pos”: ”Na”}, {“label”: ” pork ribs”, ”Pos”: ”Na”}, {“label”: ” soup”, ”Pos”: ”Na”}]In this study, the plate of the dish represents 200 g, and the soup bowl represents 200 g.
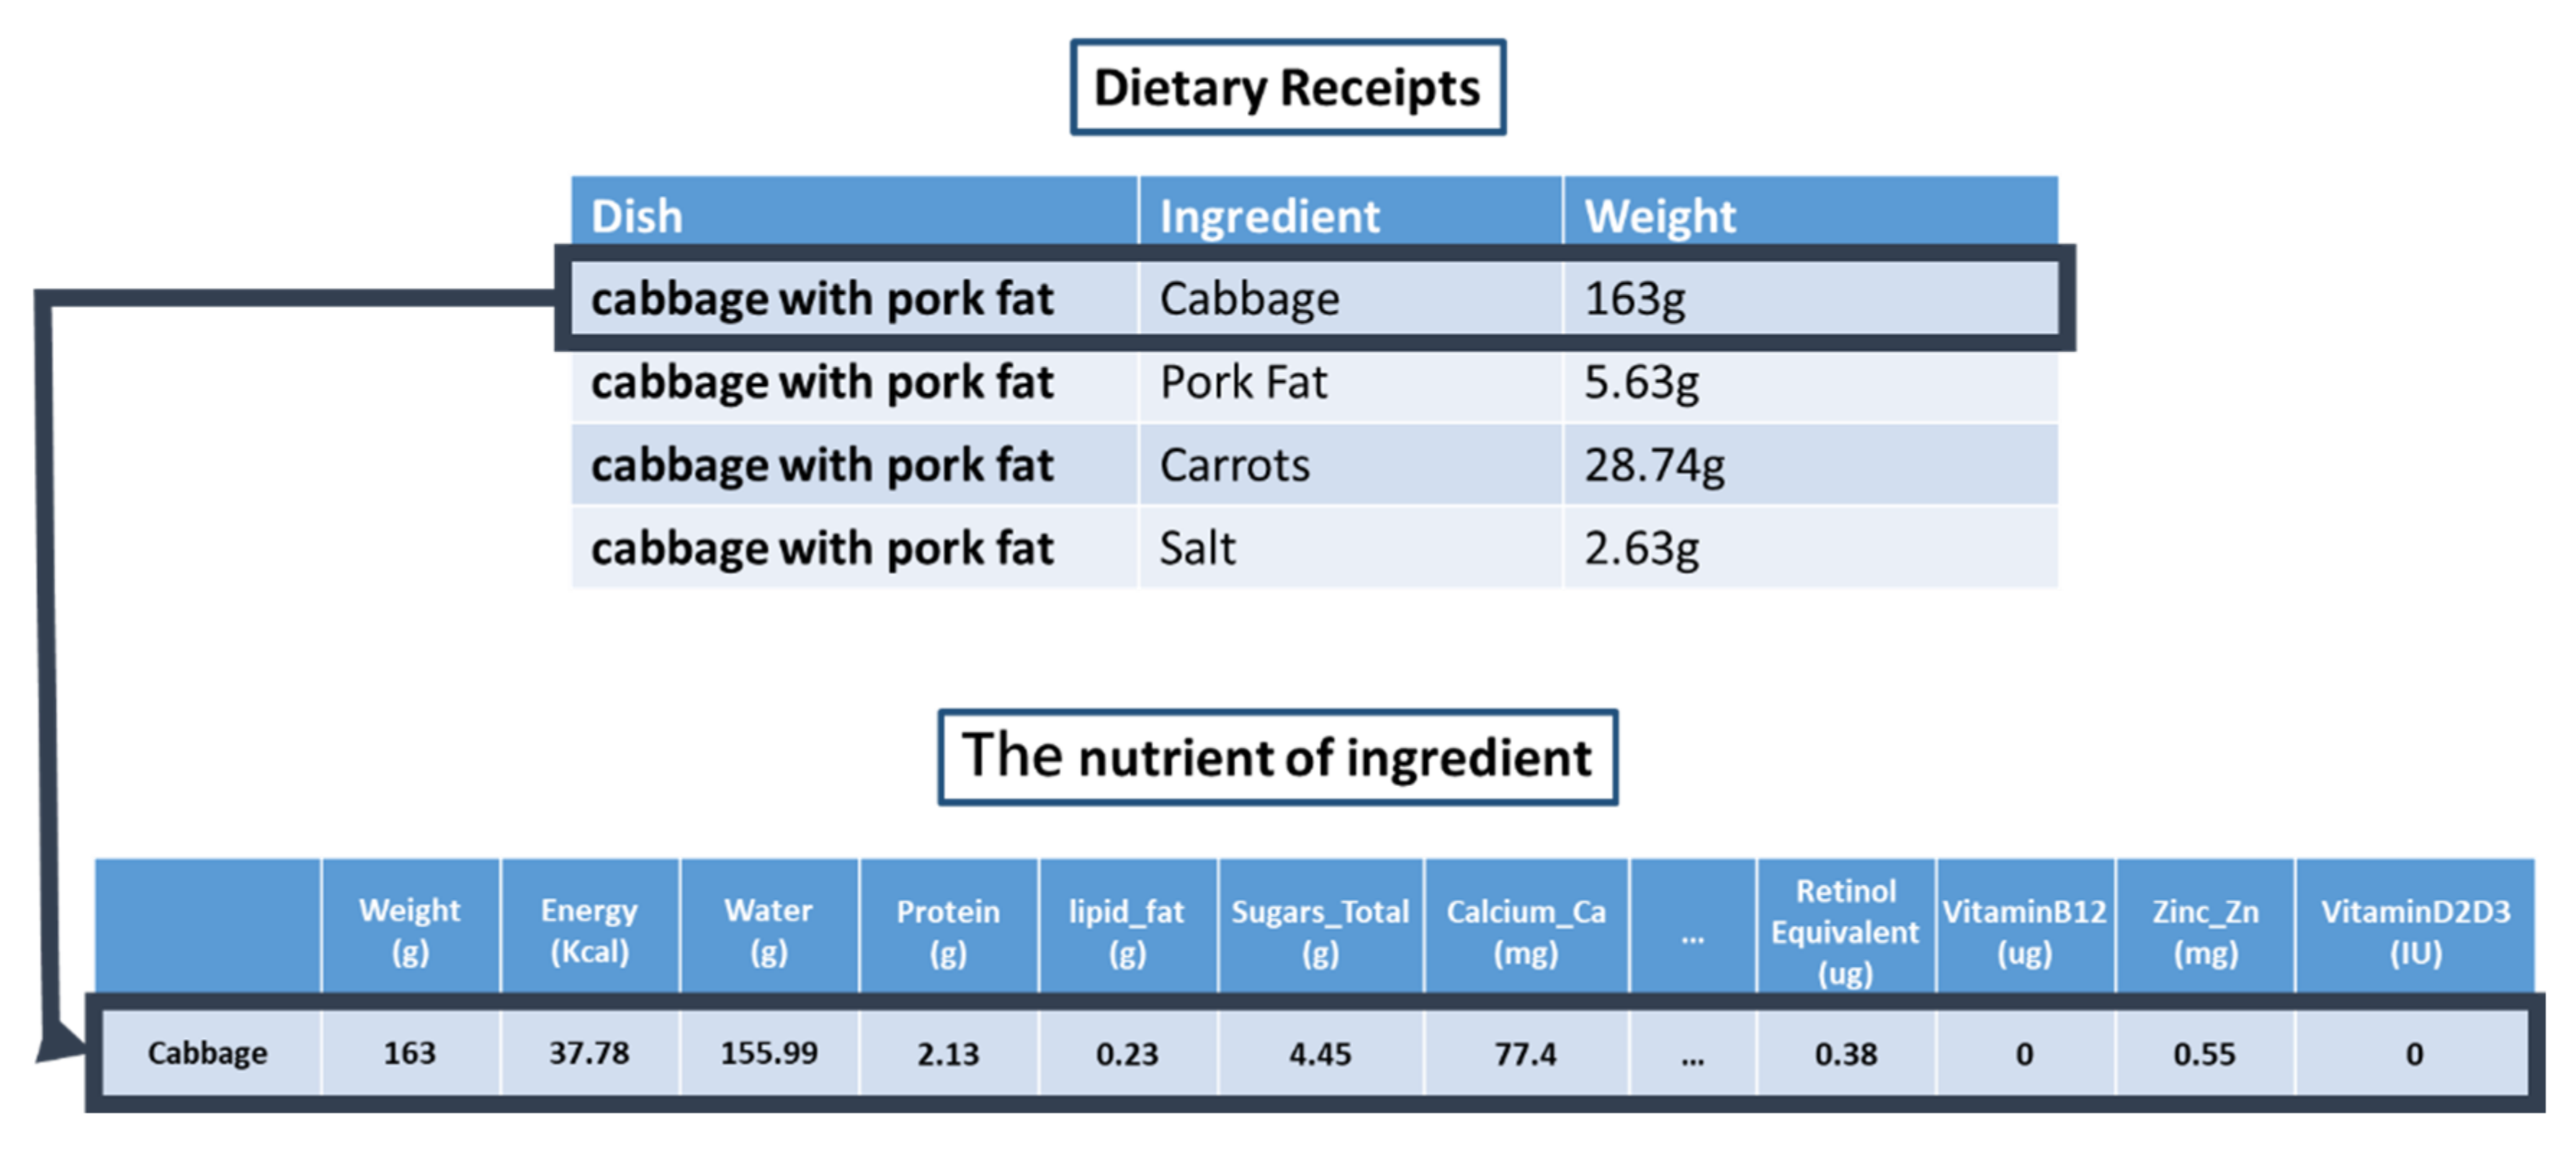
- Nutrition intake calculation by the Precision Nutrient Analysis Model.
- (1)
- In Step 1: Each dish was separated into its ingredients according to the recipes.200 g of cabbage with pork fat: Cabbage: 163 g, Pork Fat: 5.63 g, Carrots: 28.74 g, and Salt: 2.63 g.200 g of bamboo shoots and pork ribs soup: Water: 50.13 g, White pepper: 0.63 g, Bamboo shoot: 73.43 g, Pork chops: 75.19 g, and Salt: 0.63 g.
- (2)
- In Step 2: 24 nutrients were calculated for each ingredient, and the precision nutrient analysis results were calculated based on the sum of all nutrients.
4.2. Model Accuracy Verification
4.2.1. Data Resource
- 24 h dietary recall nutrient intake sum analysis file (sum_nutrients_24hH—total 2602 data entries. This file includes the data of the total nutrient intake in a single 24 h dietary recall survey.
- 24 h dietary recall food weight and nutrient ingredient file (food_wt_and_nutrients)—totaling 113,824 data entries. This file includes the data of the sum of nutrients for each individual dish, food, health product, etc.
4.2.2. Validation Process
- (1)
- Inputting data from the “102–105 National Survey of Changes in Nutritional Health Status” into a digitized data semantic analysis model;
- (2)
- Model analysis of dishes, portion sizes, and the ingredients in the dishes;
- (3)
- Analysis of nutrient intake using the AI Precision Nutrient Analysis Model;
- (4)
- Analyze the results against the “24-h dietary recall nutrient intake sum analysis file” and the “24-h dietary recall food weight and nutrient ingredient file”;
- (5)
- Compare the accuracy of the model.
4.3. Analysis Result
5. Discussion
6. Conclusions
Author Contributions
Funding
Institutional Review Board Statement
Informed Consent Statement
Data Availability Statement
Conflicts of Interest
References
- Cade, J.E. Measuring diet in the 21st century: Use of new technologies. Proc. Nutr. Soc. 2017, 76, 276–282. [Google Scholar] [CrossRef] [PubMed]
- Cade, J.E.; Consortium, O.B.O.T.D.; Warthon-Medina, M.; Albar, S.; Alwan, N.A.; Ness, A.; Roe, M.; Wark, P.A.; Greathead, K.; Burley, V.J.; et al. DIET@NET: Best Practice Guidelines for dietary assessment in health research. BMC Med. 2017, 15, 1–15. [Google Scholar] [CrossRef] [PubMed] [Green Version]
- Freedman, L.S.; Schatzkin, A.; Midthune, D.; Kipnis, V. Dealing with Dietary Measurement Error in Nutritional Cohort Studies. JNCI 2011, 103, 1086–1092. [Google Scholar] [CrossRef] [PubMed] [Green Version]
- Freedman, L.S.; Potischman, N.; Kipnis, V.; Midthune, U.; Schatzkin, A.; Thompson, F.; Troiano, R.P.; Prentice, R.; Patterson, R.; Carroll, R.; et al. A comparison of two dietary instruments for evaluating the fat–breast cancer relationship. Int. J. Epidemiol. 2006, 35, 1011–1021. [Google Scholar] [CrossRef] [Green Version]
- Carter, M.C.; Burley, V.; Nykjaer, C.; Cade, J. Adherence to a Smartphone Application for Weight Loss Compared to Website and Paper Diary: Pilot Randomized Controlled Trial. J. Med. Internet Res. 2013, 15, e32. [Google Scholar] [CrossRef]
- Timon, C.M.; Blain, R.J.; McNulty, B.; Kehoe, L.; Evans, K.; Walton, J.; Flynn, A.; Gibney, E.R. The Development, Validation, and User Evaluation of Foodbook24: A Web-Based Dietary Assessment Tool Developed for the Irish Adult Population. J. Med. Internet Res. 2017, 19, e158. [Google Scholar] [CrossRef] [Green Version]
- Boushey, C.J.; Harray, A.J.; Kerr, D.A.; Schap, T.; Paterson, S.; Aflague, T.; Ruiz, M.B.; Ahmad, Z.; Delp, E.J.; Harnack, L.; et al. How Willing Are Adolescents to Record Their Dietary Intake? The Mobile Food Record. JMIR MHealth UHealth 2015, 3, e47. [Google Scholar] [CrossRef]
- Thompson, F.E.; Dixit-Joshi, S.; Potischman, N.; Dodd, K.W.; Kirkpatrick, S.I.; Kushi, L.H.; Alexander, G.L.; Coleman, L.A.; Zimmerman, T.P.; Sundaram, M.E.; et al. Comparison of Interviewer-Administered and Automated Self-Administered 24-Hour Dietary Recalls in 3 Diverse Integrated Health Systems. Am. J. Epidemiol. 2015, 181, 970–978. [Google Scholar] [CrossRef] [Green Version]
- Thompson, F.E.; Byers, T. Dietary assessment resource manual. J. Nutr. 1994, 124, s2245–s2317. [Google Scholar] [CrossRef]
- Subar, A.F.; Kirkpatrick, S.I.; Mittl, B.; Zimmerman, T.P.; Thompson, F.E.; Bingley, C.; Willis, G.; Islam, N.G.; Baranowski, T.; McNutt, S.; et al. The automated self-administered 24-hour dietary recall (ASA24): A resource for researchers, clinicians, and educators from the national cancer institute. J. Acad. Nutr. Diet. 2012, 112, 1134–1137. [Google Scholar] [CrossRef] [Green Version]
- Campbell, V.A.; Dodds, M.L. Collecting Dietary Information from Groups of Older People. Limitations of the 24-Hr. Recall. J. Am. Diet. Assoc. 1967, 51, 29–33. [Google Scholar] [CrossRef] [PubMed]
- Heady, J.A. Diets of Bank Clerks Development of a Method of Classifying the Diets of Individuals for Use in Epidemiological Studies. J. R. Stat. Soc. Ser. A 1961, 124, 336. [Google Scholar] [CrossRef]
- Dwyer, J.T.; Gardner, J.; Halvorsen, K.; Krall, E.A.; Cohen, A.; Valadian, I. MEMORY OF FOOD INTAKE IN THE DISTANT PAST. Am. J. Epidemiol. 1989, 130, 1033–1046. [Google Scholar] [CrossRef] [PubMed]
- Iv, C.; Edgar; Godwin, S.L.; Vecchio, F.A. Cognitive strategies for reporting portion sizes using dietary recall procedures. J. Am. Diet. Assoc. 2000, 100, 891–897. [Google Scholar]
- Guthrie, H.A. Selection and quantification of typical food portions by young adults. J. Am. Diet. Assoc. 1984, 84, 1440–1444. [Google Scholar] [CrossRef]
- Bolland, J.E.; Yuhas, J.A.; Bolland, T.W. Estimation of food portion sizes: Effectiveness of training. J. Am. Diet. Assoc. 1988, 88, 817–821. [Google Scholar] [CrossRef]
- Howat, P.M.; Mohan, R.; Champagne, C.; Monlezun, C.; Wozniak, P.; Bray, G. Validity and reliability of reported dietary intake data. J. Am. Diet. Assoc. 1994, 94, 169–173. [Google Scholar] [CrossRef]
- Gibson, R.S. Principles of Nutritional Assessment; Oxford University Press: Oxford, UK, 2005. [Google Scholar]
- Kirkpatrick, S.I.; Dodd, K.W.; Tooze, J.; Bailey, R.L.; Freedman, L.; Midthune, D. Measurement Error Webinar Series. Risk Factor Monitoring and Methods, National Cancer Institute, National Institutes of Health. 2012; Bethesda: Bethesda, MD, USA, 2012. [Google Scholar]
- Gatford, S.E.R.; Walker, S.; Jones, S. Micheline Hancock-Beaulieu & Mike. In Proceedings of the Third Text REtrieval Conference (TREC 1994), Gaithersburg, MD, USA, 2–4 November 1994; Available online: https://trec.nist.gov/pubs/trec3/t3_proceedings.html (accessed on 1 January 2021).
- Jones, K.S.; Walker, S.; Robertson, S. A probabilistic model of information retrieval: Development and comparative experiments: Part 2. Inf. Process. Manag. 2000, 36, 809–840. [Google Scholar] [CrossRef]
- Jones, K.S.; Walker, S.; Robertson, S. A probabilistic model of information retrieval: Development and comparative experiments: Part 1. Inf. Process. Manag. 2000, 36, 779–808. [Google Scholar] [CrossRef]
- Jones, K.S. Index term weighting. Inf. Storage Retr. 1973, 9, 619–633. [Google Scholar] [CrossRef]
- Levenshtein, V.I. Binary Codes Capable of Correcting Deletions, Insertions and Reversals. Sov. Phys. Dokl. 1966, 10, 707. [Google Scholar]
- Michael, L.; Winter, D. Distance between Sets. Nature 1971, 234, 34–35. [Google Scholar]
- Chatopera. Synonyms. Available online: https://github.com/chatopera/Synonyms#references (accessed on 20 January 2021).
- Tucker, K.L.; Chen, H.; Hannan, M.T.; Cupples, L.A.; Wilson, P.W.F.; Felson, D.; Kiel, D. Bone mineral density and dietary patterns in older adults: The Framingham Osteoporosis Study. Am. J. Clin. Nutr. 2002, 76, 245–252. [Google Scholar] [CrossRef] [PubMed] [Green Version]
- Wirfält, A.E.; Jeffery, R.W. Using Cluster Analysis to Examine Dietary Patterns: Nutrient Intakes, Gender, and Weight Status Differ Across Food Pattern Clusters. J. Am. Diet. Assoc. 1997, 97, 272–279. [Google Scholar] [CrossRef]
- Haveman-Nies, A.; Tucker, K.; de Groot, L.; Wilson, P.; van Staveren, W. Evaluation of dietary quality in relationship to nutritional and lifestyle factors in elderly people of the US Framingham Heart Study and the European SENECA study. Eur. J. Clin. Nutr. 2001, 55, 870–880. [Google Scholar] [CrossRef] [Green Version]
- Walter, W. Nutritional Epidemiology; Oxford University Press: Oxford, UK, 2012; Volume 40. [Google Scholar]
- Freedman, L.S.; Midthune, D.; Arab, L.; Prentice, R.L.; Subar, A.F.; Willett, W.; Neuhouser, M.L.; Tinker, L.F.; Kipnis, V. Combining a Food Frequency Questionnaire With 24-Hour Recalls to Increase the Precision of Estimation of Usual Dietary Intakes—Evidence from the Validation Studies Pooling Project. Am. J. Epidemiol. 2018, 187, 2227–2232. [Google Scholar] [CrossRef] [Green Version]
- Nicastro, H.L.; Bailey, R.; Dodd, K.W. Using 2 Assessment Methods May Better Describe Dietary Supplement Intakes in the United States. J. Nutr. 2015, 145, 1630–1634. [Google Scholar] [CrossRef] [Green Version]


| Error Range | Energy (kcal) | Water (g) | Protein (g) | Lipid Fat (g) | Sugars Total (g) | Calcium Ca (mg) | Phosphorus P (mg) | Iron Fe (mg) | ||||||||
|---|---|---|---|---|---|---|---|---|---|---|---|---|---|---|---|---|
| <1% | 2187 | 84.1% | 2503 | 96.2% | 2284 | 87.8% | 1902 | 73.1% | 352 | 13.5% | 1168 | 44.9% | 2087 | 80.2% | 1401 | 53.8% |
| ≥1% and <2% | 297 | 11.4% | 68 | 2.6% | 228 | 8.8% | 319 | 12.3% | 436 | 16.8% | 601 | 23.1% | 306 | 11.8% | 734 | 28.2% |
| ≥2% and <3% | 45 | 1.7% | 24 | 0.9% | 43 | 1.7% | 136 | 5.2% | 270 | 10.4% | 298 | 11.5% | 82 | 3.2% | 199 | 7.6% |
| ≥3% and <4% | 22 | 0.8% | 5 | 0.2% | 12 | 0.5% | 84 | 3.2% | 186 | 7.1% | 194 | 7.5% | 44 | 1.7% | 116 | 4.5% |
| ≥4% and <5% | 9 | 0.3% | 1 | 0.0% | 10 | 0.4% | 42 | 1.6% | 142 | 5.5% | 109 | 4.2% | 21 | 0.8% | 39 | 1.5% |
| ≥5% and <6% | 8 | 0.3% | 1 | 0.0% | 8 | 0.3% | 29 | 1.1% | 91 | 3.5% | 68 | 2.6% | 15 | 0.6% | 41 | 1.6% |
| 6–10% | 27 | 1.0% | 0 | 0.0% | 12 | 0.5% | 56 | 2.2% | 316 | 12.1% | 122 | 4.7% | 32 | 1.2% | 51 | 2.0% |
| 11–15% | 6 | 0.2% | 0 | 0.0% | 2 | 0.1% | 13 | 0.5% | 172 | 6.6% | 22 | 0.8% | 8 | 0.3% | 7 | 0.3% |
| 16–20% | 1 | 0.0% | 0 | 0.0% | 2 | 0.1% | 6 | 0.2% | 136 | 5.2% | 11 | 0.4% | 3 | 0.1% | 7 | 0.3% |
| 21–30% | 0 | 0.0% | 0 | 0.0% | 0 | 0.0% | 8 | 0.3% | 170 | 6.5% | 2 | 0.1% | 2 | 0.1% | 7 | 0.3% |
| 31–40% | 0 | 0.0% | 0 | 0.0% | 1 | 0.0% | 6 | 0.2% | 91 | 3.5% | 5 | 0.2% | 2 | 0.1% | 0 | 0.0% |
| 41–60% | 0 | 0.0% | 0 | 0.0% | 0 | 0.0% | 1 | 0.0% | 121 | 4.7% | 0 | 0.0% | 0 | 0.0% | 0 | 0.0% |
| 61–80% | 0 | 0.0% | 0 | 0.0% | 0 | 0.0% | 0 | 0.0% | 49 | 1.9% | 2 | 0.1% | 0 | 0.0% | 0 | 0.0% |
| 81–100% | 0 | 0.0% | 0 | 0.0% | 0 | 0.0% | 0 | 0.0% | 32 | 1.2% | 0 | 0.0% | 0 | 0.0% | 0 | 0.0% |
| >100% | 0 | 0.0% | 0 | 0.0% | 0 | 0.0% | 0 | 0.0% | 0 | 0.0% | 0 | 0.0% | 0 | 0.0% | 0 | 0.0% |
| Error Range | VitaminB1 (mg) | VitaminB2 (mg) | Nicotinic (mg) | Vitamin C (mg) | Saturated Fat (g) | Cholesterol (mg) | Vitamin E Alpha TE (mg) | Sodium Na (mg) | ||||||||
|---|---|---|---|---|---|---|---|---|---|---|---|---|---|---|---|---|
| <1% | 1990 | 76.5% | 1601 | 61.5% | 1811 | 69.6% | 1652 | 63.5% | 1440 | 55.3% | 1375 | 52.8% | 921 | 35.4% | 1836 | 70.6% |
| ≥1% and <2% | 345 | 13.3% | 644 | 24.8% | 416 | 16.0% | 234 | 9.0% | 480 | 18.4% | 586 | 22.5% | 398 | 15.3% | 296 | 11.4% |
| ≥2% and <3% | 100 | 3.8% | 135 | 5.2% | 146 | 5.6% | 139 | 5.3% | 193 | 7.4% | 542 | 20.8% | 307 | 11.8% | 106 | 4.1% |
| ≥3% and <4% | 59 | 2.3% | 81 | 3.1% | 76 | 2.9% | 81 | 3.1% | 112 | 4.3% | 20 | 0.8% | 240 | 9.2% | 87 | 3.3% |
| ≥4% and <5% | 35 | 1.3% | 38 | 1.5% | 45 | 1.7% | 60 | 2.3% | 76 | 2.9% | 12 | 0.5% | 176 | 6.8% | 60 | 2.3% |
| ≥5% and <6% | 17 | 0.7% | 17 | 0.7% | 23 | 0.9% | 37 | 1.4% | 69 | 2.7% | 8 | 0.3% | 128 | 4.9% | 55 | 2.1% |
| 6–10% | 40 | 1.5% | 46 | 1.8% | 57 | 2.2% | 104 | 4.0% | 137 | 5.3% | 21 | 0.8% | 288 | 11.1% | 93 | 3.6% |
| 11–15% | 7 | 0.3% | 23 | 0.9% | 20 | 0.8% | 50 | 1.9% | 49 | 1.9% | 12 | 0.5% | 82 | 3.2% | 37 | 1.4% |
| 16–20% | 4 | 0.2% | 6 | 0.2% | 5 | 0.2% | 35 | 1.3% | 11 | 0.4% | 9 | 0.3% | 31 | 1.2% | 12 | 0.5% |
| 21–30% | 4 | 0.2% | 9 | 0.3% | 1 | 0.0% | 52 | 2.0% | 21 | 0.8% | 3 | 0.1% | 18 | 0.7% | 8 | 0.3% |
| 31–40% | 1 | 0.0% | 2 | 0.1% | 0 | 0.0% | 27 | 1.0% | 11 | 0.4% | 1 | 0.0% | 9 | 0.3% | 8 | 0.3% |
| 41–60% | 0 | 0.0% | 0 | 0.0% | 1 | 0.0% | 40 | 1.5% | 2 | 0.1% | 1 | 0.0% | 4 | 0.2% | 1 | 0.0% |
| 61–80% | 0 | 0.0% | 0 | 0.0% | 1 | 0.0% | 27 | 1.0% | 1 | 0.0% | 1 | 0.0% | 0 | 0.0% | 1 | 0.0% |
| 81–100% | 0 | 0.0% | 0 | 0.0% | 0 | 0.0% | 11 | 0.4% | 0 | 0.0% | 5 | 0.2% | 0 | 0.0% | 2 | 0.1% |
| >100% | 0 | 0.0% | 0 | 0.0% | 0 | 0.0% | 53 | 2.0% | 0 | 0.0% | 6 | 0.2% | 0 | 0.0% | 0 | 0.0% |
| Error Range | VitaminB6 (mg) | Magnesium (mg) | Dietary Fiber (g) | Potassium K (mg) | Retinol Equivalent (ug) | VitaminB12 (ug) | Zinc Zn (mg) | VitaminD2D3 (IU) | ||||||||
|---|---|---|---|---|---|---|---|---|---|---|---|---|---|---|---|---|
| <1% | 1511 | 58.1% | 1793 | 68.9% | 1518 | 58.3% | 1773 | 68.1% | 1234 | 47.4% | 1388 | 53.3% | 1579 | 60.7% | 723 | 68.9% |
| ≥1% and <2% | 518 | 19.9% | 529 | 20.3% | 327 | 12.6% | 487 | 18.7% | 475 | 18.3% | 350 | 13.5% | 626 | 24.1% | 209 | 20.3% |
| ≥2% and <3% | 180 | 6.9% | 153 | 5.9% | 196 | 7.5% | 155 | 6.0% | 241 | 9.3% | 255 | 9.8% | 206 | 7.9% | 162 | 5.9% |
| ≥3% and <4% | 123 | 4.7% | 34 | 1.3% | 95 | 3.7% | 76 | 2.9% | 148 | 5.7% | 165 | 6.3% | 75 | 2.9% | 143 | 1.3% |
| ≥4% and <5% | 60 | 2.3% | 22 | 0.8% | 61 | 2.3% | 43 | 1.7% | 98 | 3.8% | 95 | 3.7% | 27 | 1.0% | 120 | 0.8% |
| ≥5% and <6% | 48 | 1.8% | 18 | 0.7% | 53 | 2.0% | 20 | 0.8% | 61 | 2.3% | 68 | 2.6% | 18 | 0.7% | 86 | 0.7% |
| 6–10% | 95 | 3.7% | 22 | 0.8% | 187 | 7.2% | 35 | 1.3% | 140 | 5.4% | 181 | 7.0% | 35 | 1.3% | 339 | 0.8% |
| 11–15% | 28 | 1.1% | 14 | 0.5% | 60 | 2.3% | 8 | 0.3% | 98 | 3.8% | 53 | 2.0% | 18 | 0.7% | 250 | 0.5% |
| 16–20% | 11 | 0.4% | 5 | 0.2% | 36 | 1.4% | 5 | 0.2% | 39 | 1.5% | 12 | 0.5% | 8 | 0.3% | 75 | 0.2% |
| 21–30% | 16 | 0.6% | 3 | 0.1% | 46 | 1.8% | 0 | 0.0% | 48 | 1.8% | 13 | 0.5% | 0 | 0.0% | 81 | 0.1% |
| 31–40% | 8 | 0.3% | 4 | 0.2% | 10 | 0.4% | 0 | 0.0% | 9 | 0.3% | 5 | 0.2% | 1 | 0.0% | 54 | 0.2% |
| 41–60% | 3 | 0.1% | 5 | 0.2% | 9 | 0.3% | 0 | 0.0% | 5 | 0.2% | 4 | 0.2% | 1 | 0.0% | 58 | 0.2% |
| 61–80% | 0 | 0.0% | 0 | 0.0% | 3 | 0.1% | 0 | 0.0% | 4 | 0.2% | 2 | 0.1% | 4 | 0.2% | 40 | 0.0% |
| 81–100% | 1 | 0.0% | 0 | 0.0% | 1 | 0.0% | 0 | 0.0% | 0 | 0.0% | 5 | 0.2% | 0 | 0.0% | 31 | 0.0% |
| >100% | 0 | 0.0% | 0 | 0.0% | 0 | 0.0% | 0 | 0.0% | 2 | 0.1% | 6 | 0.2% | 4 | 0.2% | 231 | 0.0% |
| Error Range | Energy (kcal) | Water (g) | Protein (g) | Lipid Fat (g) | Sugars Total (g) | Calcium Ca (mg) | Phosphorus P (mg) | Iron Fe (mg) | ||||||||
|---|---|---|---|---|---|---|---|---|---|---|---|---|---|---|---|---|
| <1% | 97,435 | 85.6% | 99,390 | 87.3% | 97,211 | 85.4% | 102,695 | 90.2% | 95,184 | 83.6% | 97,059 | 85.3% | 100,940 | 88.7% | 99,540 | 87.5% |
| ≥1% and <2% | 6263 | 5.5% | 2592 | 2.3% | 4949 | 4.3% | 1878 | 1.6% | 3485 | 3.1% | 661 | 0.6% | 666 | 0.6% | 514 | 0.5% |
| ≥2% and <3% | 1177 | 1.0% | 1357 | 1.2% | 570 | 0.5% | 139 | 0.1% | 75 | 0.1% | 685 | 0.6% | 306 | 0.3% | 130 | 0.1% |
| ≥3% and <4% | 595 | 0.5% | 250 | 0.2% | 1114 | 1.0% | 67 | 0.1% | 265 | 0.2% | 146 | 0.1% | 101 | 0.1% | 88 | 0.1% |
| ≥4% and <5% | 153 | 0.1% | 67 | 0.1% | 514 | 0.5% | 338 | 0.3% | 370 | 0.3% | 915 | 0.8% | 663 | 0.6% | 1880 | 1.7% |
| ≥5% and <6% | 472 | 0.4% | 774 | 0.7% | 114 | 0.1% | 77 | 0.1% | 311 | 0.3% | 84 | 0.1% | 502 | 0.4% | 625 | 0.5% |
| 6–10% | 2231 | 2.0% | 1028 | 0.9% | 991 | 0.9% | 1096 | 1.0% | 1756 | 1.5% | 2583 | 2.3% | 4554 | 4.0% | 3749 | 3.3% |
| 11–15% | 575 | 0.5% | 2868 | 2.5% | 3500 | 3.1% | 850 | 0.7% | 258 | 0.2% | 878 | 0.8% | 399 | 0.4% | 791 | 0.7% |
| 16–20% | 790 | 0.7% | 606 | 0.5% | 122 | 0.1% | 518 | 0.5% | 285 | 0.3% | 4737 | 4.2% | 184 | 0.2% | 333 | 0.3% |
| 21–30% | 2952 | 2.6% | 1205 | 1.1% | 323 | 0.3% | 552 | 0.5% | 493 | 0.4% | 2020 | 1.8% | 666 | 0.6% | 547 | 0.5% |
| 31–40% | 383 | 0.3% | 1691 | 1.5% | 1596 | 1.4% | 2303 | 2.0% | 598 | 0.5% | 268 | 0.2% | 343 | 0.3% | 2657 | 2.3% |
| 41–60% | 80 | 0.1% | 1281 | 1.1% | 96 | 0.1% | 637 | 0.6% | 2803 | 2.5% | 760 | 0.7% | 504 | 0.4% | 1566 | 1.4% |
| 61–80% | 189 | 0.2% | 182 | 0.2% | 231 | 0.2% | 167 | 0.1% | 449 | 0.4% | 432 | 0.4% | 460 | 0.4% | 309 | 0.3% |
| 81–100% | 330 | 0.3% | 362 | 0.3% | 2142 | 1.9% | 1979 | 1.7% | 3087 | 2.7% | 2191 | 1.9% | 2051 | 1.8% | 378 | 0.3% |
| >100% | 199 | 0.2% | 171 | 0.2% | 351 | 0.3% | 528 | 0.5% | 4405 | 3.9% | 405 | 0.4% | 1485 | 1.3% | 717 | 0.6% |
| Error Range | VitaminB1 (mg) | VitaminB2 (mg) | Nicotinic (mg) | Vitamin C (mg) | Saturated Fat (g) | Cholesterol (mg) | Vitamin E Alpha TE (mg) | Sodium Na (mg) | ||||||||
|---|---|---|---|---|---|---|---|---|---|---|---|---|---|---|---|---|
| <1% | 103,564 | 91.0% | 103,347 | 90.8% | 103,396 | 90.8% | 102,357 | 89.9% | 99,471 | 87.4% | 110,481 | 97.1% | 100,867 | 88.6% | 99,264 | 87.2% |
| ≥1% and <2% | 1899 | 1.7% | 1869 | 1.6% | 360 | 0.3% | 1721 | 1.5% | 782 | 0.7% | 27 | 0.0% | 150 | 0.1% | 3296 | 2.9% |
| ≥2% and <3% | 301 | 0.3% | 55 | 0.0% | 1075 | 0.9% | 237 | 0.2% | 280 | 0.2% | 1717 | 1.5% | 2102 | 1.8% | 227 | 0.2% |
| ≥3% and <4% | 376 | 0.3% | 388 | 0.3% | 197 | 0.2% | 69 | 0.1% | 1228 | 1.1% | 5 | 0.0% | 284 | 0.2% | 171 | 0.2% |
| ≥4% and <5% | 82 | 0.1% | 284 | 0.2% | 40 | 0.0% | 98 | 0.1% | 172 | 0.2% | 0.0% | 31 | 0.0% | 138 | 0.1% | |
| ≥5% and <6% | 98 | 0.1% | 257 | 0.2% | 175 | 0.2% | 62 | 0.1% | 151 | 0.1% | 10 | 0.0% | 119 | 0.1% | 240 | 0.2% |
| 6–10% | 2417 | 2.1% | 3394 | 3.0% | 2291 | 2.0% | 3267 | 2.9% | 1875 | 1.6% | 18 | 0.0% | 2710 | 2.4% | 4153 | 3.6% |
| 11–15% | 1331 | 1.2% | 578 | 0.5% | 609 | 0.5% | 308 | 0.3% | 782 | 0.7% | 17 | 0.0% | 129 | 0.1% | 503 | 0.4% |
| 16–20% | 216 | 0.2% | 691 | 0.6% | 877 | 0.8% | 337 | 0.3% | 1750 | 1.5% | 28 | 0.0% | 175 | 0.2% | 396 | 0.3% |
| 21–30% | 825 | 0.7% | 187 | 0.2% | 2583 | 2.3% | 621 | 0.5% | 259 | 0.2% | 29 | 0.0% | 2448 | 2.2% | 975 | 0.9% |
| 31–40% | 445 | 0.4% | 400 | 0.4% | 392 | 0.3% | 499 | 0.4% | 2312 | 2.0% | 40 | 0.0% | 203 | 0.2% | 1087 | 1.0% |
| 41–60% | 143 | 0.1% | 422 | 0.4% | 139 | 0.1% | 242 | 0.2% | 484 | 0.4% | 25 | 0.0% | 1142 | 1.0% | 639 | 0.6% |
| 61–80% | 186 | 0.2% | 95 | 0.1% | 77 | 0.1% | 392 | 0.3% | 411 | 0.4% | 27 | 0.0% | 335 | 0.3% | 231 | 0.2% |
| 81–100% | 1657 | 1.5% | 1478 | 1.3% | 1395 | 1.2% | 2022 | 1.8% | 2819 | 2.5% | 1201 | 1.1% | 2182 | 1.9% | 2305 | 2.0% |
| >100% | 284 | 0.2% | 379 | 0.3% | 218 | 0.2% | 1592 | 1.4% | 1048 | 0.9% | 199 | 0.2% | 947 | 0.8% | 199 | 0.2% |
| Error Range | VitaminB6 (mg) | Magnesium (mg) | Dietary Fiber (g) | Potassium K (mg) | Retinol Equivalent (ug) | VitaminB12 (ug) | Zinc Zn (mg) | VitaminD2D3 (IU) | ||||||||
|---|---|---|---|---|---|---|---|---|---|---|---|---|---|---|---|---|
| <1% | 99,965 | 87.8% | 93,126 | 81.8% | 105,576 | 92.8% | 102,151 | 89.7% | 101,920 | 89.5% | 109,024 | 95.8% | 97,681 | 85.8% | 110,264 | 96.9% |
| ≥1% and <2% | 294 | 0.3% | 2576 | 2.3% | 1991 | 1.7% | 452 | 0.4% | 121 | 0.1% | 9 | 0.0% | 151 | 0.1% | 346 | 0.3% |
| ≥2% and <3% | 2042 | 1.8% | 2091 | 1.8% | 295 | 0.3% | 734 | 0.6% | 91 | 0.1% | 1 | 0.0% | 964 | 0.8% | 3 | 0.0% |
| ≥3% and <4% | 295 | 0.3% | 160 | 0.1% | 458 | 0.4% | 162 | 0.1% | 59 | 0.1% | 4 | 0.0% | 1998 | 1.8% | 3 | 0.0% |
| ≥4% and <5% | 27 | 0.0% | 190 | 0.2% | 128 | 0.1% | 56 | 0.0% | 5 | 0.0% | 2 | 0.0% | 424 | 0.4% | 120 | 0.1% |
| ≥5% and <6% | 46 | 0.0% | 702 | 0.6% | 308 | 0.3% | 1118 | 1.0% | 24 | 0.0% | 12 | 0.0% | 95 | 0.1% | 86 | 0.1% |
| 6–10% | 2877 | 2.5% | 2045 | 1.8% | 1154 | 1.0% | 1391 | 1.2% | 3627 | 3.2% | 38 | 0.0% | 2568 | 2.3% | 14 | 0.0% |
| 11–15% | 1679 | 1.5% | 1406 | 1.2% | 296 | 0.3% | 131 | 0.1% | 118 | 0.1% | 1700 | 1.5% | 1084 | 1.0% | 1707 | 1.5% |
| 16–20% | 576 | 0.5% | 282 | 0.2% | 258 | 0.2% | 396 | 0.3% | 175 | 0.2% | 31 | 0.0% | 2991 | 2.6% | 10 | 0.0% |
| 21–30% | 1016 | 0.9% | 625 | 0.5% | 512 | 0.4% | 475 | 0.4% | 174 | 0.2% | 34 | 0.0% | 1764 | 1.5% | 29 | 0.0% |
| 31–40% | 205 | 0.2% | 300 | 0.3% | 63 | 0.1% | 239 | 0.2% | 1046 | 0.9% | 11 | 0.0% | 324 | 0.3% | 5 | 0.0% |
| 41–60% | 781 | 0.7% | 597 | 0.5% | 446 | 0.4% | 1962 | 1.7% | 407 | 0.4% | 171 | 0.2% | 643 | 0.6% | 12 | 0.0% |
| 61–80% | 574 | 0.5% | 1594 | 1.4% | 204 | 0.2% | 136 | 0.1% | 141 | 0.1% | 27 | 0.0% | 100 | 0.1% | 11 | 0.0% |
| 81–100% | 1896 | 1.7% | 7775 | 6.8% | 1878 | 1.6% | 3980 | 3.5% | 5097 | 4.5% | 2215 | 1.9% | 2532 | 2.2% | 1368 | 1.2% |
| >100% | 1551 | 1.4% | 355 | 0.3% | 257 | 0.2% | 441 | 0.4% | 819 | 0.7% | 545 | 0.5% | 505 | 0.4% | 52 | 0.0% |
Publisher’s Note: MDPI stays neutral with regard to jurisdictional claims in published maps and institutional affiliations. |
© 2022 by the authors. Licensee MDPI, Basel, Switzerland. This article is an open access article distributed under the terms and conditions of the Creative Commons Attribution (CC BY) license (https://creativecommons.org/licenses/by/4.0/).
Share and Cite
Lee, H.-A.; Huang, T.-T.; Yen, L.-H.; Wu, P.-H.; Chen, K.-W.; Kung, H.-H.; Liu, C.-Y.; Hsu, C.-Y. Precision Nutrient Management Using Artificial Intelligence Based on Digital Data Collection Framework. Appl. Sci. 2022, 12, 4167. https://0-doi-org.brum.beds.ac.uk/10.3390/app12094167
Lee H-A, Huang T-T, Yen L-H, Wu P-H, Chen K-W, Kung H-H, Liu C-Y, Hsu C-Y. Precision Nutrient Management Using Artificial Intelligence Based on Digital Data Collection Framework. Applied Sciences. 2022; 12(9):4167. https://0-doi-org.brum.beds.ac.uk/10.3390/app12094167
Chicago/Turabian StyleLee, Hsiu-An, Tzu-Ting Huang, Lo-Hsien Yen, Pin-Hua Wu, Kuan-Wen Chen, Hsin-Hua Kung, Chen-Yi Liu, and Chien-Yeh Hsu. 2022. "Precision Nutrient Management Using Artificial Intelligence Based on Digital Data Collection Framework" Applied Sciences 12, no. 9: 4167. https://0-doi-org.brum.beds.ac.uk/10.3390/app12094167