
Detection of Sleep Apnea from Electrocardiogram and Pulse Oximetry Signals Using Random Forest


1
School of Life and Environmental Sciences, Guilin University of Electronic Technology, Guilin 541004, China
2
School of Electronic Engineering and Automation, Guilin University of Electronic Technology, Guilin 541004, China
*
Author to whom correspondence should be addressed.
Appl. Sci. 2022, 12(9), 4218; https://0-doi-org.brum.beds.ac.uk/10.3390/app12094218
Submission received: 7 March 2022
/
Revised: 19 April 2022
/
Accepted: 20 April 2022
/
Published: 22 April 2022
(This article belongs to the Topic Artificial Intelligence in Healthcare)
Abstract
:Sleep apnea (SA) is a common sleep disorder which could impair the human physiological system. Therefore, early diagnosis of SA is of great interest. The traditional method of diagnosing SA is an overnight polysomnography (PSG) evaluation. When PSG has limited availability, automatic SA screening with a fewer number of signals should be considered. The primary purpose of this study is to develop and evaluate a SA detection model based on electrocardiogram (ECG) and blood oxygen saturation (SpO2). We adopted a multimodal approach to fuse ECG and SpO2 signals at the feature level. Then, feature selection was conducted using the recursive feature elimination with cross-validation (RFECV) algorithm and random forest (RF) classifier used to discriminate between apnea and normal events. Experiments were conducted on the Apnea-ECG database. The introduced algorithm obtained an accuracy of 97.5%, a sensitivity of 95.9%, a specificity of 98.4% and an AUC of 0.992 in per-segment classification, and outperformed previous works. The results showed that ECG and SpO2 are complementary in detecting SA, and that the combination of ECG and SpO2 enhances the ability to diagnose SA. Therefore, the proposed method has the potential to be an alternative to conventional detection methods.
1. Introduction
Sleep apnea (SA) is a common sleep disorder, also commonly known as obstructive sleep apnea (OSA) [1]. OSA occurs due to the abnormal function of the upper respiratory tract. When the hard palate muscles at the back of the throat that support the soft palate relax, the soft palate blocks the passage of air into the respiratory system. The clinical manifestation of SA is a cessation of nasal airflow or a decrease in airflow intensity by more than 30% compared to the base level, but the corresponding breathing movements are maintained [2]. At the same time, oxygen saturation decreases by more than 4% for more than 10 s. The prevalence of OSA in adults ranges from 9% to 38% and increases with age [3]. Low quality sleep accompanied by apnea usually leads directly to poor concentration, memory loss, slow response, and depression [4]. In addition, OSA is a potential threat to many physiological systems of the human body, especially the cardiovascular system. It can induce hypertension, heart failure, coronary artery disease, diabetes, and other diseases, which seriously threaten the health of patients [5]. If patients are identified and then treated at an early stage of OSA, the health risks can be reduced. Therefore, timely diagnosis of patients with OSA is essential.
Clinically, polysomnography (PSG) is the reference standard for the diagnosis of SA. PSG is effective in monitoring sleep conditions by collecting various physiological signals such as electrocardiogram (ECG), electroencephalogram (EEG), electromyogram (EMG), blood oxygen saturation (SpO2), airflow signals, respiratory effort, etc. [6]. However, wearing too many sensors during physiological signal collection can cause discomfort to the patient. In addition, the diagnosis of OSA requires sleep specialists to spend a lot of time manually analyzing PSG data [7]. Therefore, automatic detection of SA using fewer signals is necessary.
Researchers have typically developed SA detection algorithms using ECG signals. ECG is a non-invasive technique for recording the electrical activity of heart and the physiological activity of heart is regulated under the autonomic nervous system (ANS). Studies have shown that hypoxia caused by SA can lead to the dysregulation of the ANS. Clinically, heart rate variability (HRV) is an important indicator of the outcome of ANS regulation [8]. Therefore, it is feasible to screen for apnea by monitoring ECG during sleep [9]. Yet, ECG signals are easily influenced by cardiovascular disease status. This makes the diagnosis of SA more challenging. Apart from ECG signals, SpO2 signals are also widely used to detect SA as the lack of airflow due to SA events can lead to a decrease in SpO2. Repetitive oxygen desaturation is highly specific for apnea. However, the sensitivity of oximetry is usually low, as not all apnea events lead to discernible desaturations [7]. Thus, SpO2 alone or ECG alone can be used as a potential diagnostic means of SA, but not as a reliable means.
With technological advances in sensors and low-power embedded systems, the collection of physiological signals has become easier and more economical [10]. Therefore, we consider using multiple signals to develop a more reliable detection algorithm of SA, rather than being limited to a single signal.
This study explores the efficiency and reliability of a multimodal approach to the automated detection of SA events using a combined channel of ECG and SpO2. To this end, we extracted features from ECG signal and SpO2 signal separately, and then fused the features of the two different modalities. Feature selection was performed using the recursive feature elimination with cross-validation (RFECV) algorithm. Then, the selected features were fed to the RF classifier to identify sleep apnea events.
Our study provides three main contributions to research. First, we verify the complementarity of ECG and SpO2 signals to automatically detect SA. When the two signals are combined, the diagnostic ability is increased. Second, the RFECV algorithm is employed to select the most important features. The proposed SA detection technique uses a smaller number of features and is computationally inexpensive compared to most of the existing methods. Third, we enrich the method in the field of the automated detection of SA by applying a multimodal approach to fuse ECG and SpO2 signals at the feature level. So far, most of the extant literature primarily used SpO2 alone or ECG alone, but did not consider the combination of ECG and SpO2.
The rest of this paper is organized as follows. The related works of SA detection are explored in Section 2. The explanation of the dataset, preprocessing steps, and the introduced SA detection technique is presented in Section 3. The Results and Discussions are presented in Section 4 and Section 5, respectively. Finally, Section 6 concludes the paper.
2. Related Works
Over past studies, various physiological signals (e.g., ECG, EEG, SpO2, snoring or airflow) have been used to develop SA detection algorithms [11], the most widely used of which are ECG signal and SpO2 signal.
For ECG signal-based methods, the shallow characteristic signals of the ECG are usually analyzed in the time domain, frequency domain or nonlinear domain. The time intervals between successive heartbeats are sequentially combined to form the RR interval signal [12]. HRV analysis refers to the analysis of changes in the RR interval signal. Nakayama et al. [9] proposed a method for detecting sleep apnea based on HRV analysis. Their method was successfully applied to clinical PSG data and the performance was comparable to portable monitoring devices in sleep laboratories. ECG-derived respiratory (EDR) signals reflecting respiratory activity can be used as complementary information to HRV [13]. Khandoker et al. [14] analyzed the EDR signal and RR interval with wavelet transform and used SVM classifier to identify OSA patients. In their work, more than 90% of subjects in the test set were correctly classified. Further, Bsoul et al. [15] extracted a complete feature set containing 111 features from RR and EDR time series using time-frequency analysis methods. Sharma et al. [16] developed a SA detection model using Hermite basis functions. Sharma mainly considered the morphological changes occurring in the QRS wave complex of the ECG.
The occurrence of apnea is usually accompanied by a decrease in oxygen saturation, hence the SpO2 signal has been used in several studies. Some of these studies employed statistical methods to quantify the variation in oxygen saturation over time. For example, Ulysses et al. [17] used time spent below a certain level saturation (TSA), the saturation variability index and other indicators to evaluate AHI, and compared the diagnostic performance of SA under different metrics. The oxygen desaturation index (ODI) is defined as the number of oxyhemoglobin desaturation below a certain threshold [18]. Ling et al. [19] found that the use of ODI improved the accuracy of moderate and severe OSA detection. However, the ODI index is more suitable for prolonged SpO2 signals. In addition, some studies have explored nonlinear parameters. Alvarez et al. [20] used central tendency measure (CTM) and Lempel–Ziv (LZ) complexity to identify OSA and showed that the sensitivity obtained using CTM and LZ complexity, respectively, was 90.1% and 86.5%. Hornero et al. [21] performed a time series analysis of the SpO2 signal by approximate entropy and obtained a sensitivity of 82.09% and a specificity of 86.96% on training set.
To conclude our brief review of SA detection algorithms, we have found that screening for SA using either ECG or SpO2 signals is effective, but the majority of the previous studies focused only on a single data modality. However, several machine learning tasks in other fields (e.g., medical image analysis, sentiment recognition, etc.) have demonstrated that fusing information from multiple data modalities can enhance the robustness of a model [22]. Therefore, our proposed multimodal approach for the detection of SA is more advanced.
3. Materials and Methods
3.1. Proposed Framework
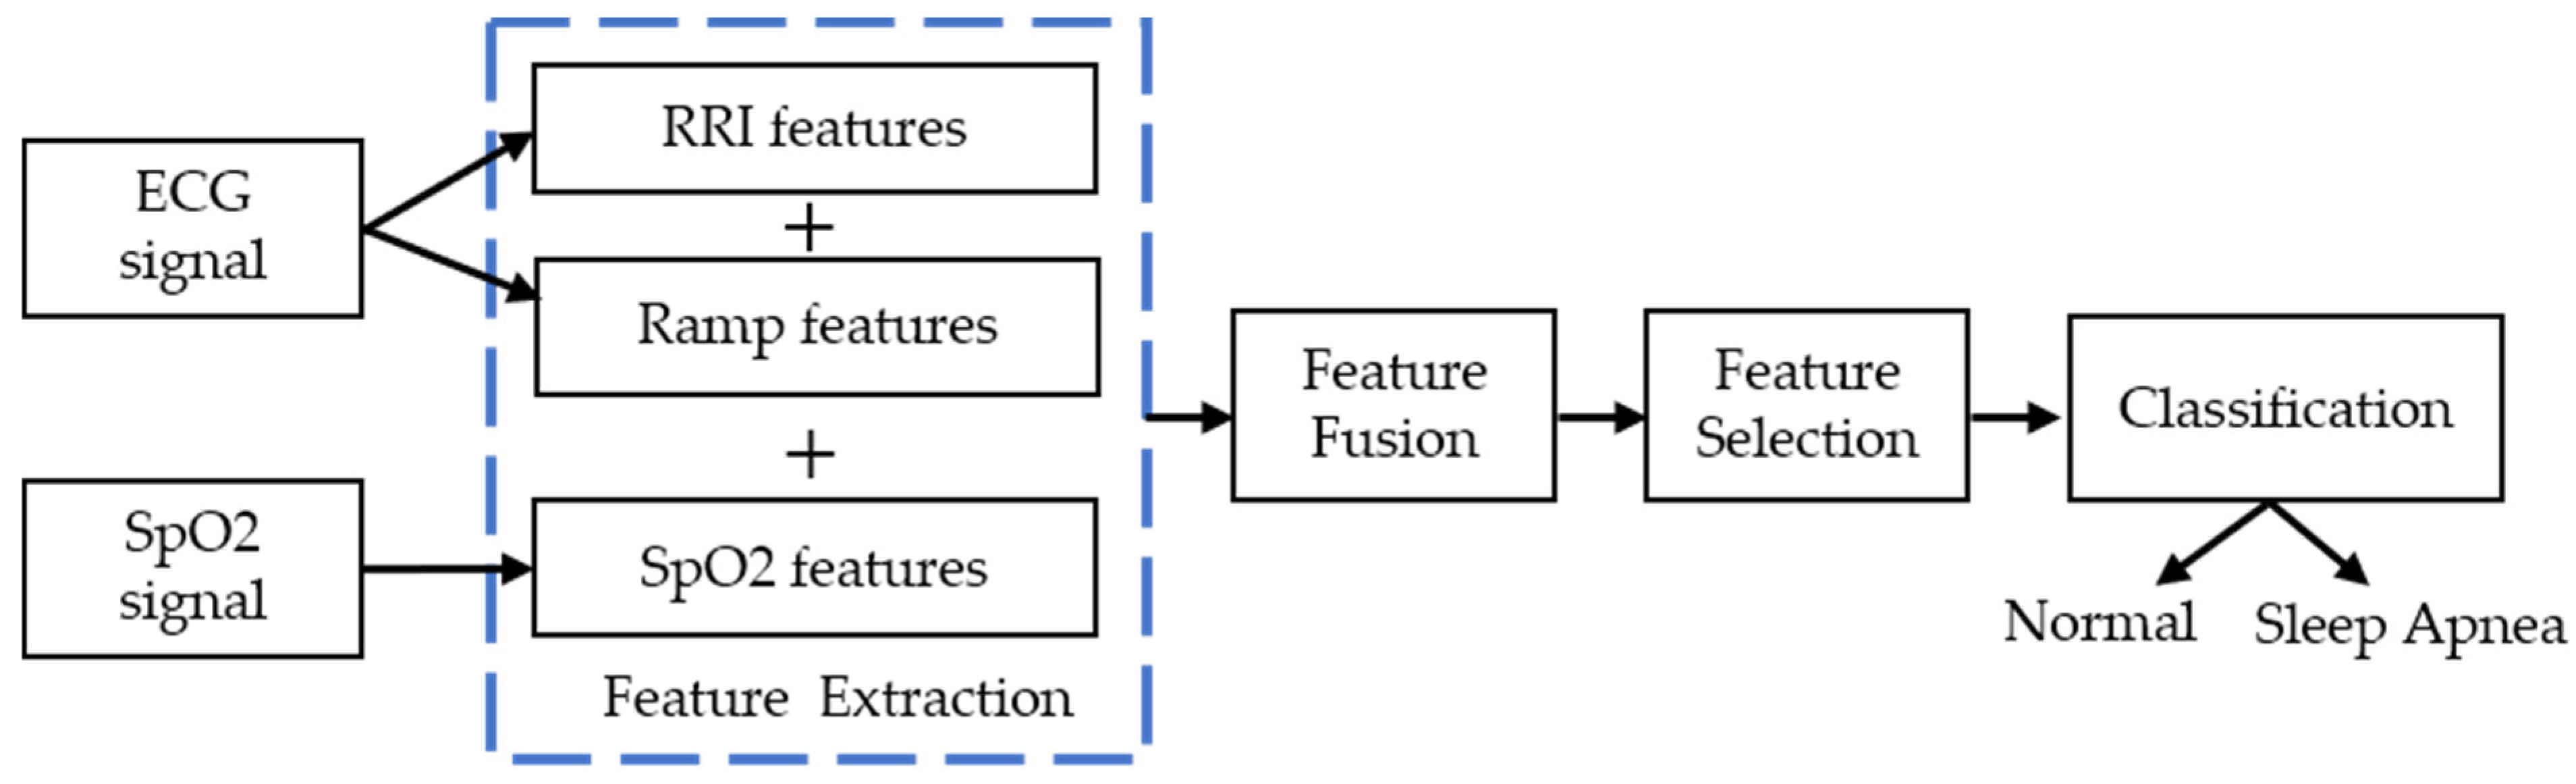
This section is composed of six subsections. First, the Apnea-ECG dataset and the preprocessing step are described. In this step, the number of signals used, sampling frequency, denoising method, data segmentation, and the derivation of the RR interval and R-wave amplitude (RAMP) signals from the ECG segments are explained. Afterward, linear and nonlinear analysis methods are applied to extract features and fuse three different feature sets using an early fusion strategy. Then, the optimal features are selected from the fused feature vector. Finally, these features are used as input to the four different types of classifiers for discriminating normal and apnea events. The flow diagram of the proposed technique is illustrated in Figure 1.
3.2. Dataset
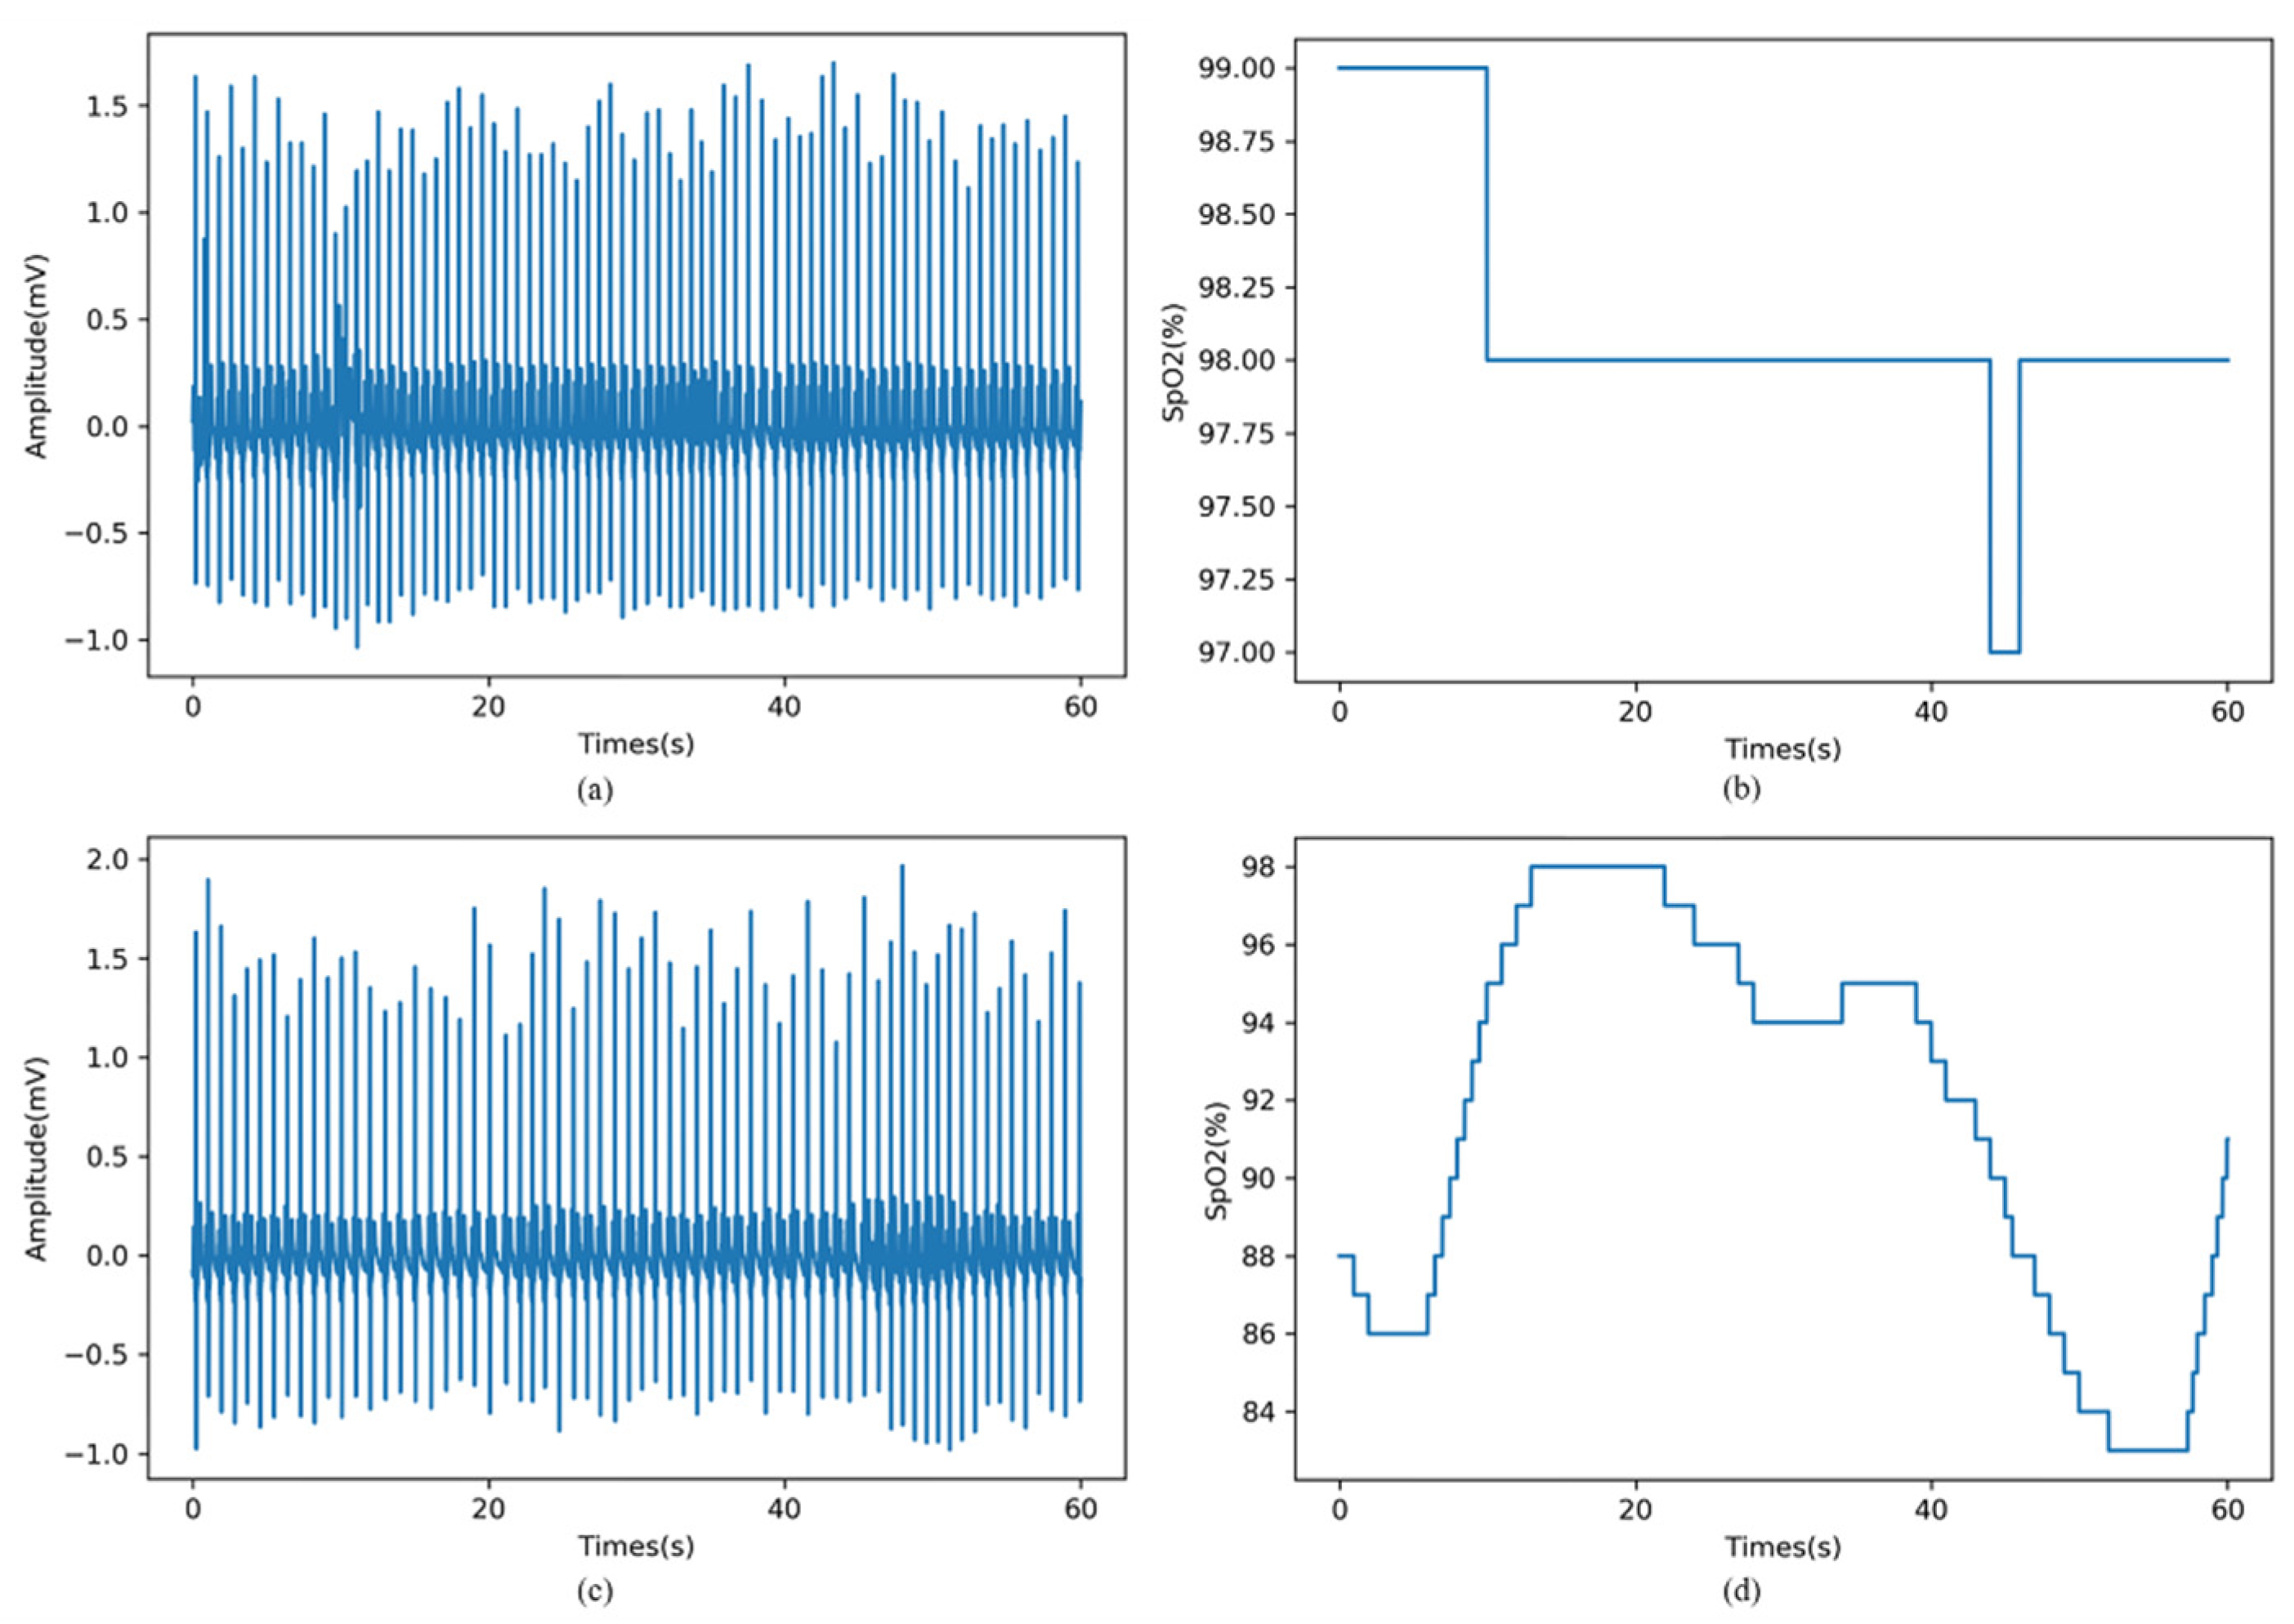
In this study, the Apnea-ECG database provided by Dr. Tomas Penzel of Phillips University is used in our proposed method. The data set consists of 70 records, which are divided into a learning set of 35 records and a test set of 35 records. These records ranged from 7 to 10 h, and contained the ECG signals. Eight of the records (a01~a04, b01, c01~c03) contained four additional signals (Resp C and Resp A, the chest and abdominal respiratory effort signals; Resp N, nasal airflow; SpO2). All signals were digitized at 100 Hz with 16-bit resolution. Each record was labelled minute by minute by the sleep specialist as normal (N) or apnea (A) [23]. An example of 1-min apnea and normal segments are demonstrated in Figure 2.
In order to satisfy the data conditions of this study, eight records (a01~b04, b01, c01~c03) containing ECG and SpO2 signals were selected from the above data set as experimental data.
3.3. Preprocessing
For the noise in the ECG signal such as baseline drift and power frequency interference, we have used FIR bandpass filter with passband of 3~50 Hz to denoise the original ECG signal [2]. Then, the entire ECG signal was segmented into 1-min segments by referring to the annotations in the database. Based on the per-minute ECG segment, we used the Hamilton algorithm to locate the R peaks, and corrected the position of the R peaks to the maximum value, so as to ensure the accuracy of the R peaks detection. The RR interval signal was obtained by the interval between successive R peaks, and the RR interval outliers were removed with reference to the method of [24]. The RAMP signal was obtained by the amplitude of R wave. In particular, one of the simplest approaches to obtain an EDR (ECG-derived respiration) signal is by interpolating the RAMP signal [14], so the RAMP signal is also called the EDR signal.
SpO2 and ECG recordings were collected simultaneously. Similarly, the entire SpO2 signal was split into 1-min segments, and segments that violated its physiological significance (SpO2 values less than 50%) were removed [25]. Then, the RR interval signal, RAMP signal and SpO2 signal were used for subsequent feature extraction.
3.4. Feature Extraction and Fusion
In this study, linear (time domain and frequency domain) analysis and nonlinear analysis methods were used to extract features. We obtained three sets of features from ECG and SpO2 signals, which were RR intervals features, R-wave amplitudes features, and SpO2 features. The details of these features and fusion strategy are described below.
3.4.1. RR Intervals Features
Linear analysis of HRV is widely used in clinical studies due to its theoretical maturity. We calculated RRmean, RMSSD, SDNN, NN50, pNN50, HR from the time domain, while the VLF 1, LF 1, HF 1, LF/HF 1, LFnorm 1, HFnorm 1 were extracted from the frequency domain. The detailed descriptions of these 12 features are shown in Table 1. In the process of frequency domain analysis, by following [26], we applied cubic spline interpolation to resample the RR interval signal to 4 Hz. Then, the power spectral density (PSD) was estimated using the FFT-Welch (s, n = 256) method.
3.4.2. R-Wave Amplitudes Features
It has been shown that the PSD of the RAMP signal has similar characteristics to the RR intervals and can serve as complementary information to HRV [15]. Therefore, we also extracted the above six frequency domain features (VLF 2, LF 2, HF 2, LF/HF 2, LFnorm 2, HFnorm 2) based on the RAMP signal using the frequency domain analysis method of HRV. The detailed descriptions of these six features are shown in Table 1.
3.4.3. SpO2 Features
Six features were calculated from the SpO2 signal. These features are listed in Table 2. Based on statistical methods, Smin, Smean, and Svar were calculated from SpO2 segments. Three commonly used nonlinear features (ApEn, CTM, and LZC) were also added to the SpO2 feature set.
Specifically, ApEn and LZC are suitable for small sample data and can reflect the complexity and chaos degree of the signal [27]. The optimal parameters for calculating ApEn were a tolerance of 0.25 and an embedding dimension of 2, while LZC is a non-parametric measurement. In addition, CTM calculates the ratio of the number of points falling into the center in the origin region with radius R to the total number of points through the second-order difference graph [20].
After feature extraction, in order to eliminate the distribution differences between various types of features and speed up the convergence of the model, we normalized the features with the following equation:
where 𝑥 is the unnormalized feature, represents the mean of the feature, is the standard deviation of the feature, and is the normalized feature.
3.4.4. Feature Fusion
In the field of machine learning, multimodal fusion is a technique that integrates information from multiple modalities, including early, later, and hybrid fusion. Among them, early fusion, also known as feature-based multimodal fusion, refers to the connection of features from different modalities before model training [28].
In this study, the ECG and SpO2 signals collected by different sensors can be considered as two modalities. In order to combine the information from different modalities, we fused the above three feature sets using an early fusion strategy with the following steps: let In be the feature vector of RR intervals, let Rn be the feature vector of RAMP, and let Sn be the feature vector of SpO2; then, the concatenation of these three representations In, Rn, and Sn produced a feature vector of which the dimension is 24.
3.5. Feature Selection
In machine learning tasks, it is important to eliminate irrelevant or redundant features to improve the accuracy and reduce the complexity of the model. Therefore, we chose the RFECV algorithm to search for the optimal feature subset [29], where the estimator parameter was set as RF classifier. The procedure of the RFECV method is illustrated in Figure 3. Firstly, a RF classifier on the feature set to be filtered is trained. Then, the importance of each feature is calculated and the classification accuracy of that feature set is obtained using a cross-validation method. Lastly, the unimportant or irrelevant features are removed from the current feature set and the RF classifier is retrained using the updated feature set. This is an iterative process until the feature set is empty.
At the end, the p-value of the selected feature set was calculated using the Kruskal–Wallis one-way ANOVA (KW-ANOVA) test. KW-ANOVA is a non-parametric test for estimating the difference between two or more types of correlated data without assuming any particular data distribution [30].
3.6. Classfier
The appropriate classifier can lead to better diagnostic performance. Therefore, four different types of classifiers were pre-selected for experimentation in order to select the most suitable classifier for this study. Random forest (RF) belongs to ensemble learning, k-nearest neighbor (KNN) is representative of lazy learning, logistic regression (LR) is a regression model that enables classification, and the support vector machine (SVM) is a functional model. A brief description of these four classifiers is presented below.
3.6.1. Random Forest
RF is an ensemble learning model consisting of a set of decision tree classifiers [31], and the specific implementation process is to use a randomized with put-back approach (Bootstrap method) to extract the training set from the original sample set ; then to use the sampled training set to train the decision tree . When a new sample is input to the random forest, all decision trees classify the new sample separately, and finally determine by voting the classification results:
where is the final result of the classification, is the classification model, is a single decision tree classifier, is the result of a single decision tree classification, and I(°) is the characteristic function.
RF has the advantages of high prediction accuracy, fast training speed, strong resistance to noise and outliers, and generates training sets by random sampling to reduce overfitting and improve generalization ability.
3.6.2. K-Nearest Neighbor
KNN is a popular supervised learning algorithm. KNN is implemented by finding the k closest training samples in the training set based on a certain distance measure, and then predicting based on the information of these k samples (where k is a positive integer). Usually, a voting method is used in classification tasks, where the most frequent category marker among these k samples is selected as the prediction result.
3.6.3. Support Vector Machine
SVM is a classification algorithm. In binary classification tasks, SVM creates a separation hyperplane between two classes () of samples where is support vectors, is training data, and with . If is the new feature vector, the result given by SVM is:
where is the threshold, are the Lagrangian coefficients which are calculated solving the dual Lagrangian form minimize:
where is the regularization parameter, that determines the trade-off between the maximum margin and the minimum classification error, and K(°) is the kernel function.
3.6.4. Logistic Regression
LR allows estimation of the posterior probability of the occurrence of a certain event. In real cases, the dependent variable consists of positive class and negative class, while the predictors are input features. Therefore, LR allows us to estimate the posterior probability of the output, regardless of making any a priori assumption about the statistical nature of the data. The expression of LR is as follows [32]:
where is the posterior probability of the output, is the compensation parameter, is the correlation coefficient, and k is the number of input features. LR estimates and by the maximum likelihood optimization method.
3.7. Performance Evaluation
In this study, accuracy, sensitivity, and specificity as defined in Equations (6)–(8) were used to evaluate the proposed model [33]. Here, accuracy describes the total number of SA segments and normal segments that were correctly identified among all of the samples, sensitivity reflects the number of correctly identified SA among all SA segments, and specificity reflects the number of correctly identified normal among all normal segments. In addition, the area under the receiver operating characteristic curve (AUC) is also the evaluation index of this model:
where TP, TN, FP, and FN are the number of true positives, true negatives, false positives, and false negatives.
4. Results
After the preprocessing step, the published set consisted of 3903 1-min samples, of which 2308 were normal samples and 1595 were sleep apnea samples. Three sets of features extracted from each sample were fused and fed into a classifier for sleep apnea detection after feature selection. During the experiment, the dataset was divided into a training set (80%) and a test set (20%) by a stratified sampling method. On the training set, five-fold cross validation was used to select optimal features, optimize classifier parameters, and model training. Accuracy, sensitivity, specificity, and AUC were used on the test set to evaluate the model performance.
The experimental environment is based on the Windows 10 operating system, the software used to develop the algorithm is python 3.6, and the hardware configuration is Xeon E5-2640v4 CPU, Nvidia GeForce RTX2080Ti GPU, and 32GB RAM.
4.1. Feature Selection and KW-ANOVA Test
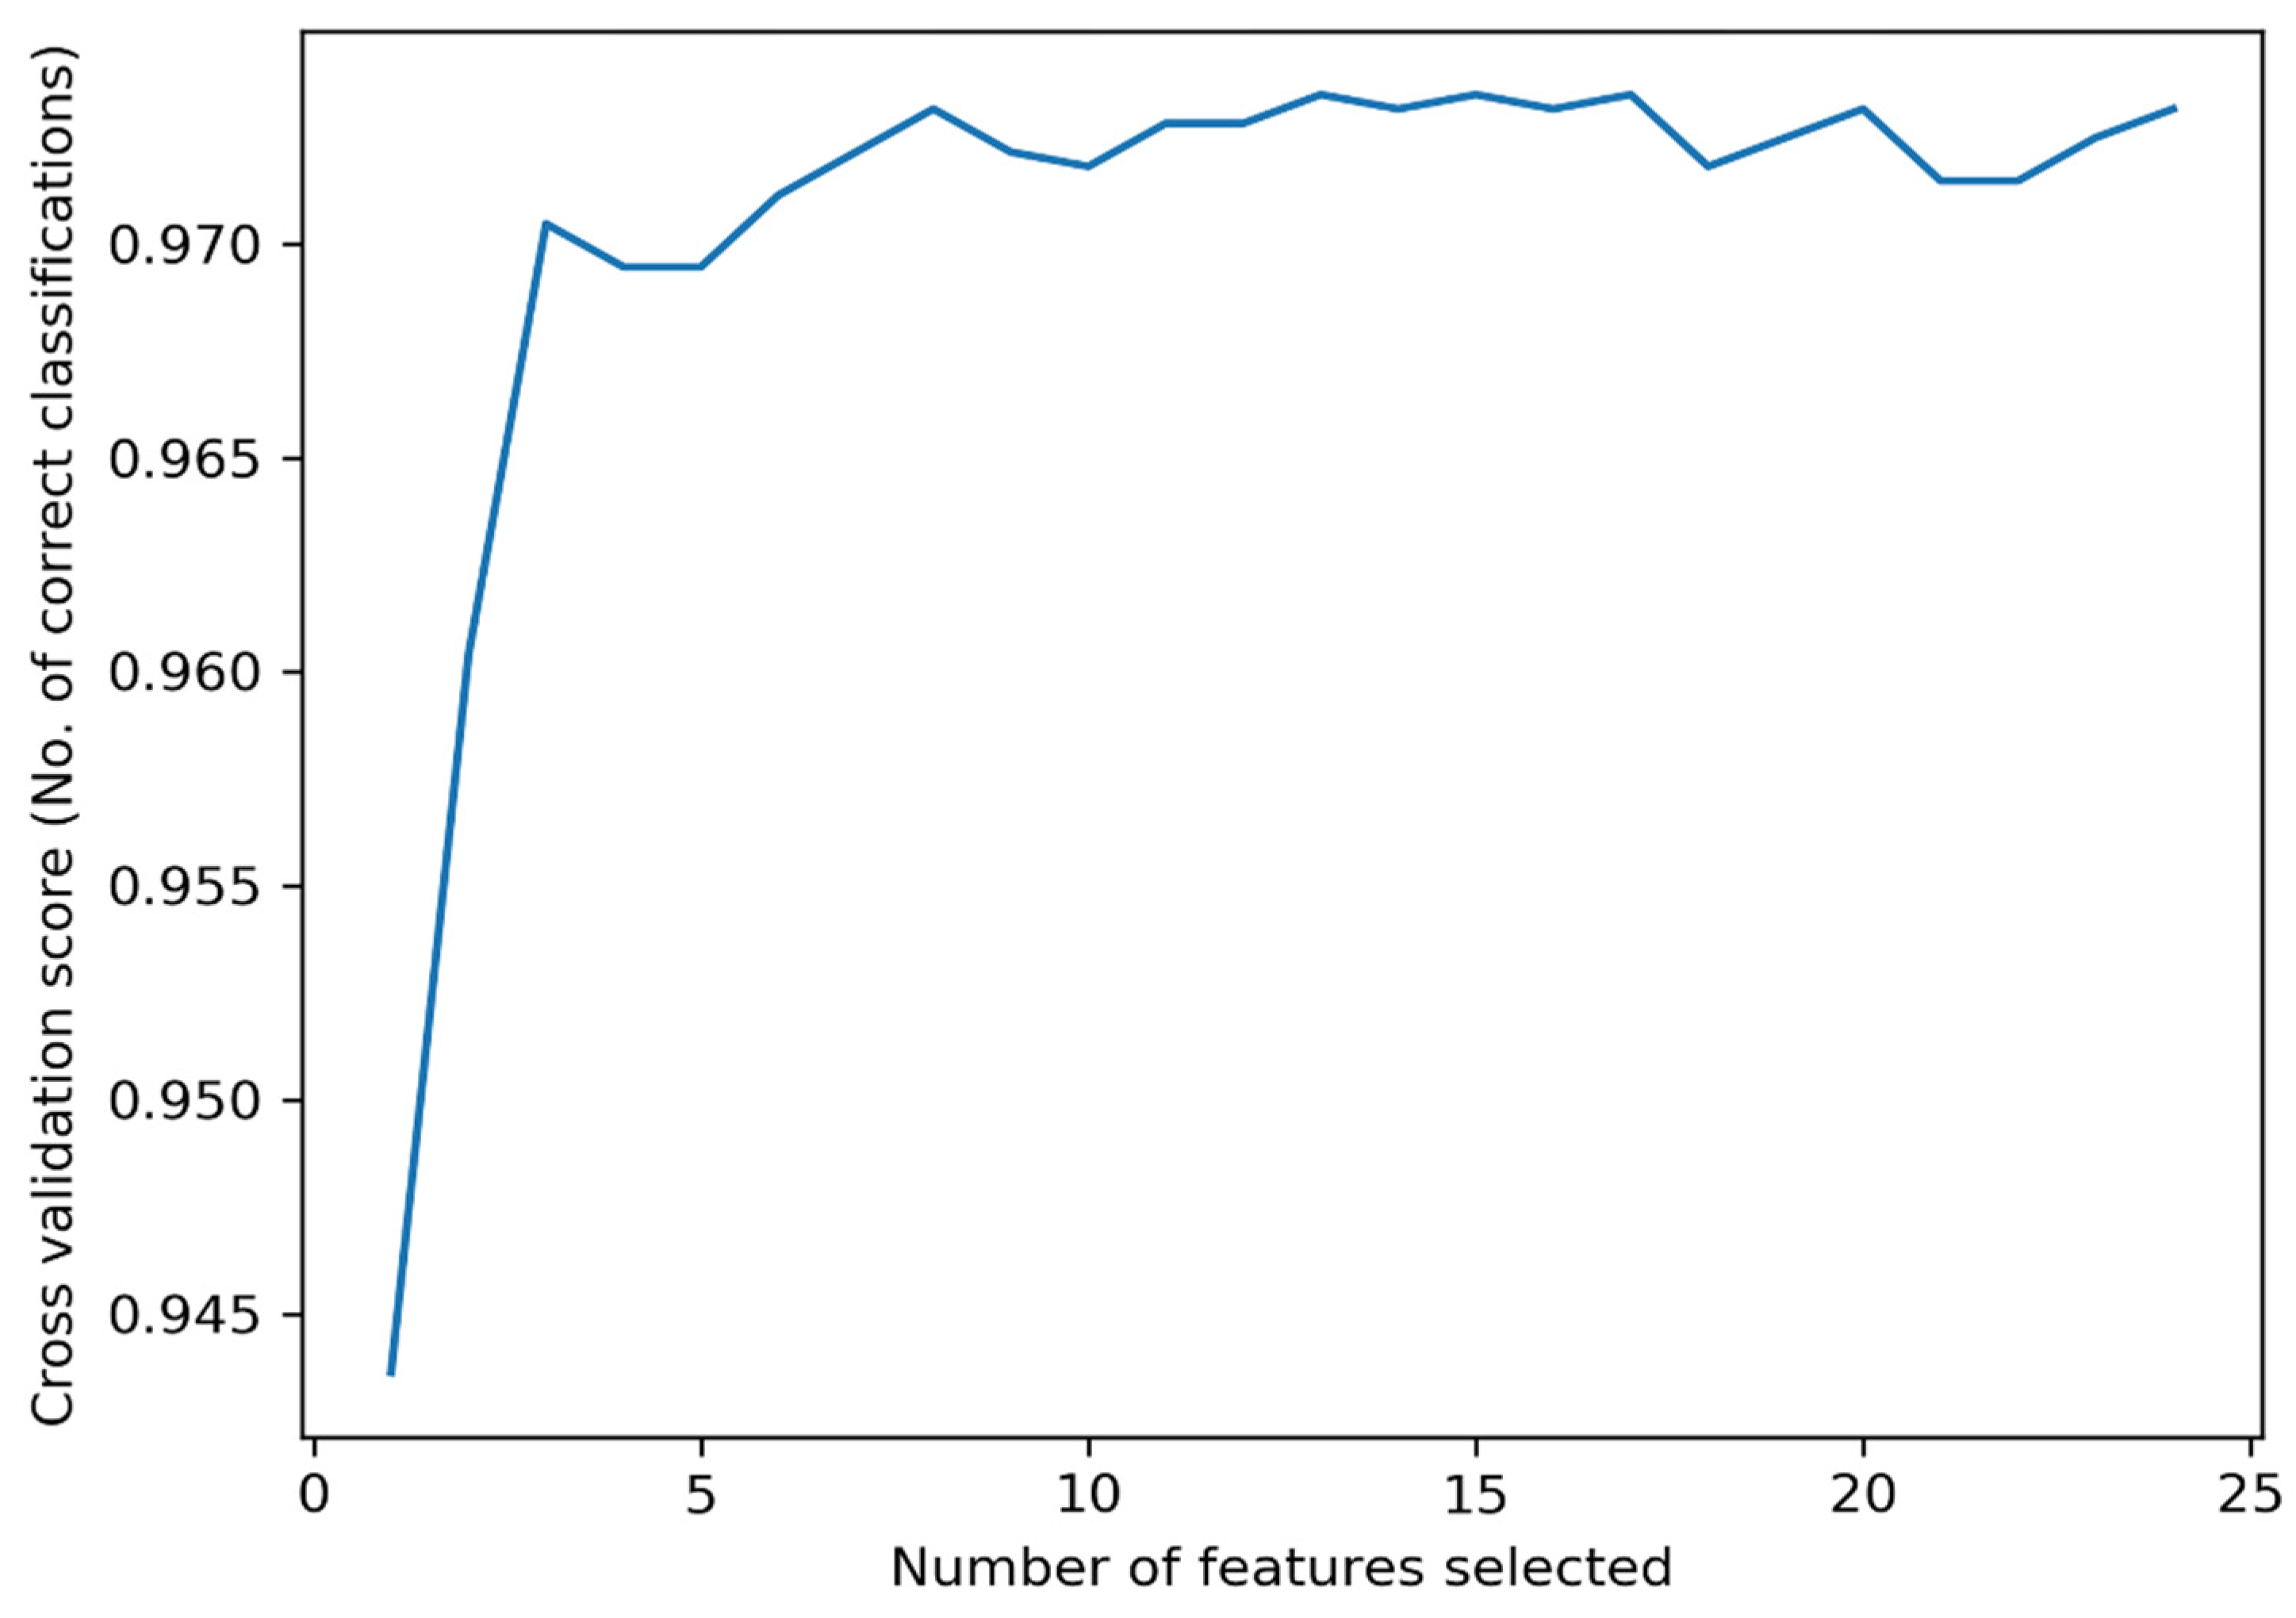
As mentioned before, the optimal subset of features was selected using the RFECV algorithm and the features were statistically analyzed by the KW-ANOVA test. The optimal subset of features reduces the complexity of the model while maintaining the classification accuracy. The relationship between the number of selected features and the classification accuracy is illustrated in Figure 4. In Figure 4, the cross-validation score fluctuates as the number of features decreases, which is caused by the change in the data distribution during the five-fold cross validation process. From Figure 4, the highest accuracy is obtained by selecting 13 features. The selected features are as follows: RMSSD, pNN50, HR, VLF 1, HF 1, LFnorm 1, and HFnorm 1 in the ECG feature set; Smin, Smean, Svar, ApEn, LZC, and CTM in the SpO2 feature set. The number corresponding to each feature is presented in Table 3.
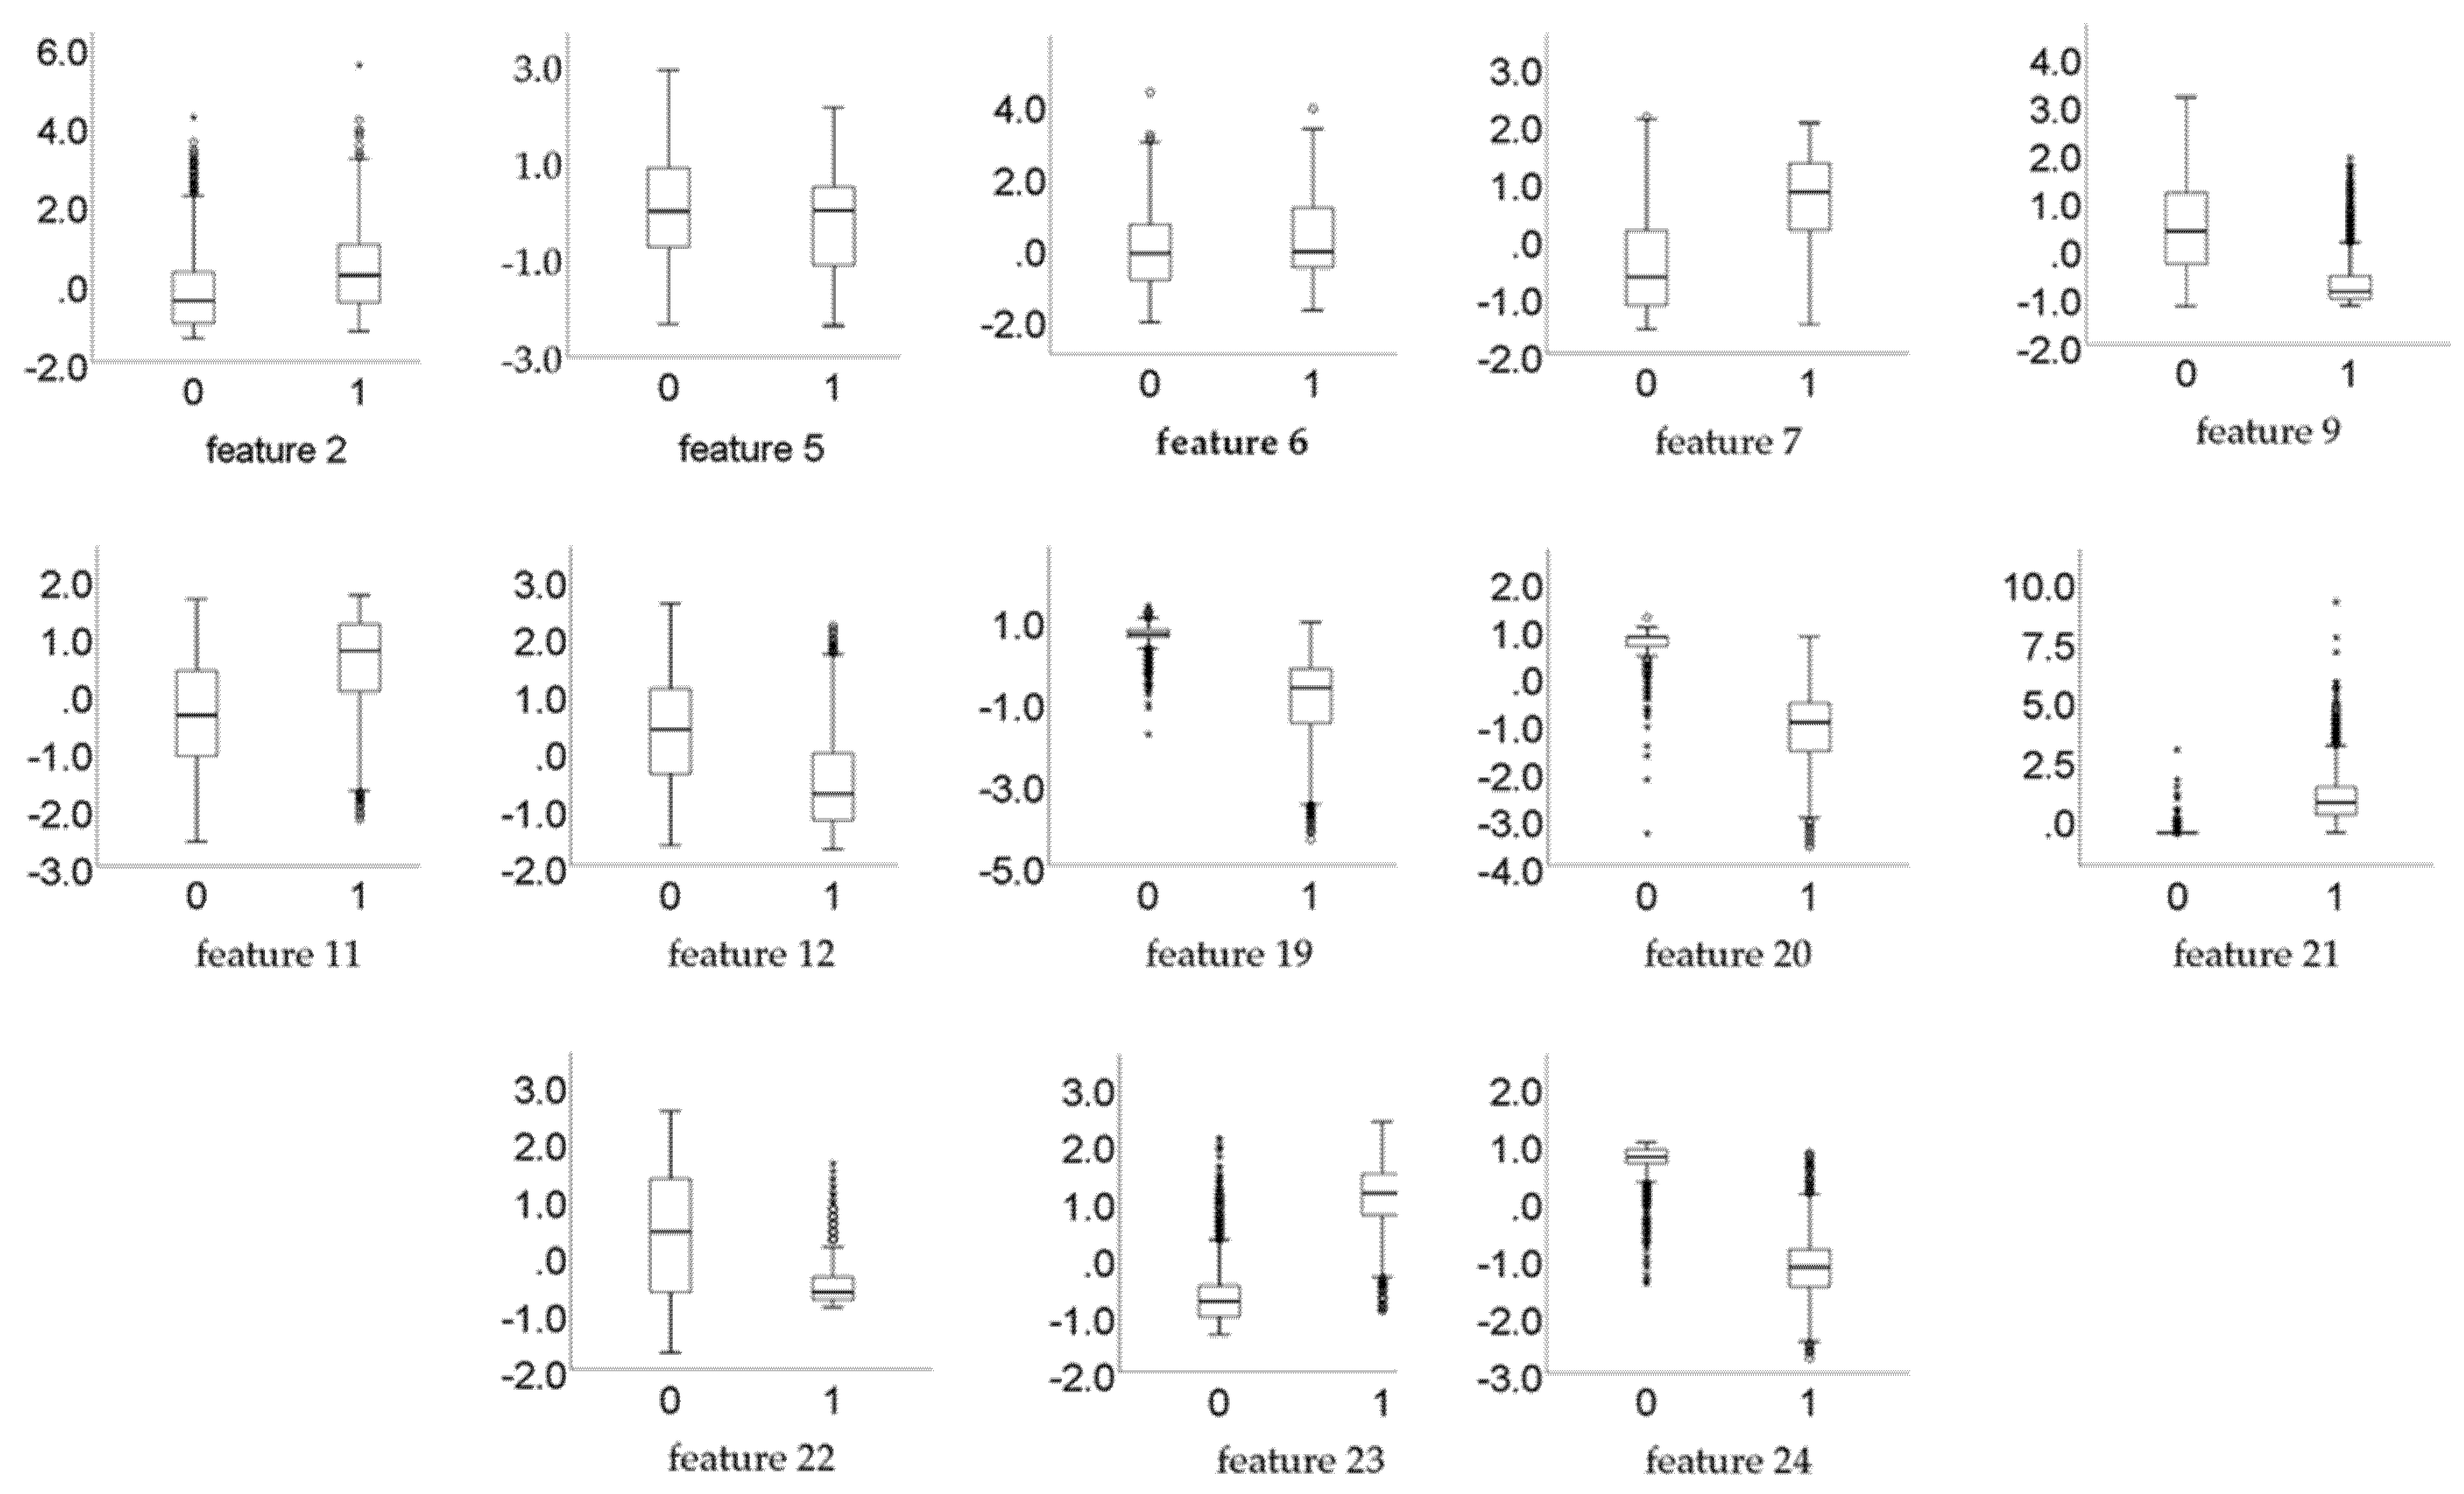
The results of the KW-ANOVA test shows that for all the 13 selected features, p << 0.01, which means that the selected features are statistically significantly different in discriminating between normal and SA classes. Furthermore, Figure 5 exhibits the box plots of the selected features, to verify that these features have significant differences.
4.2. Using Conbined ECG and SpO2 Feature Set
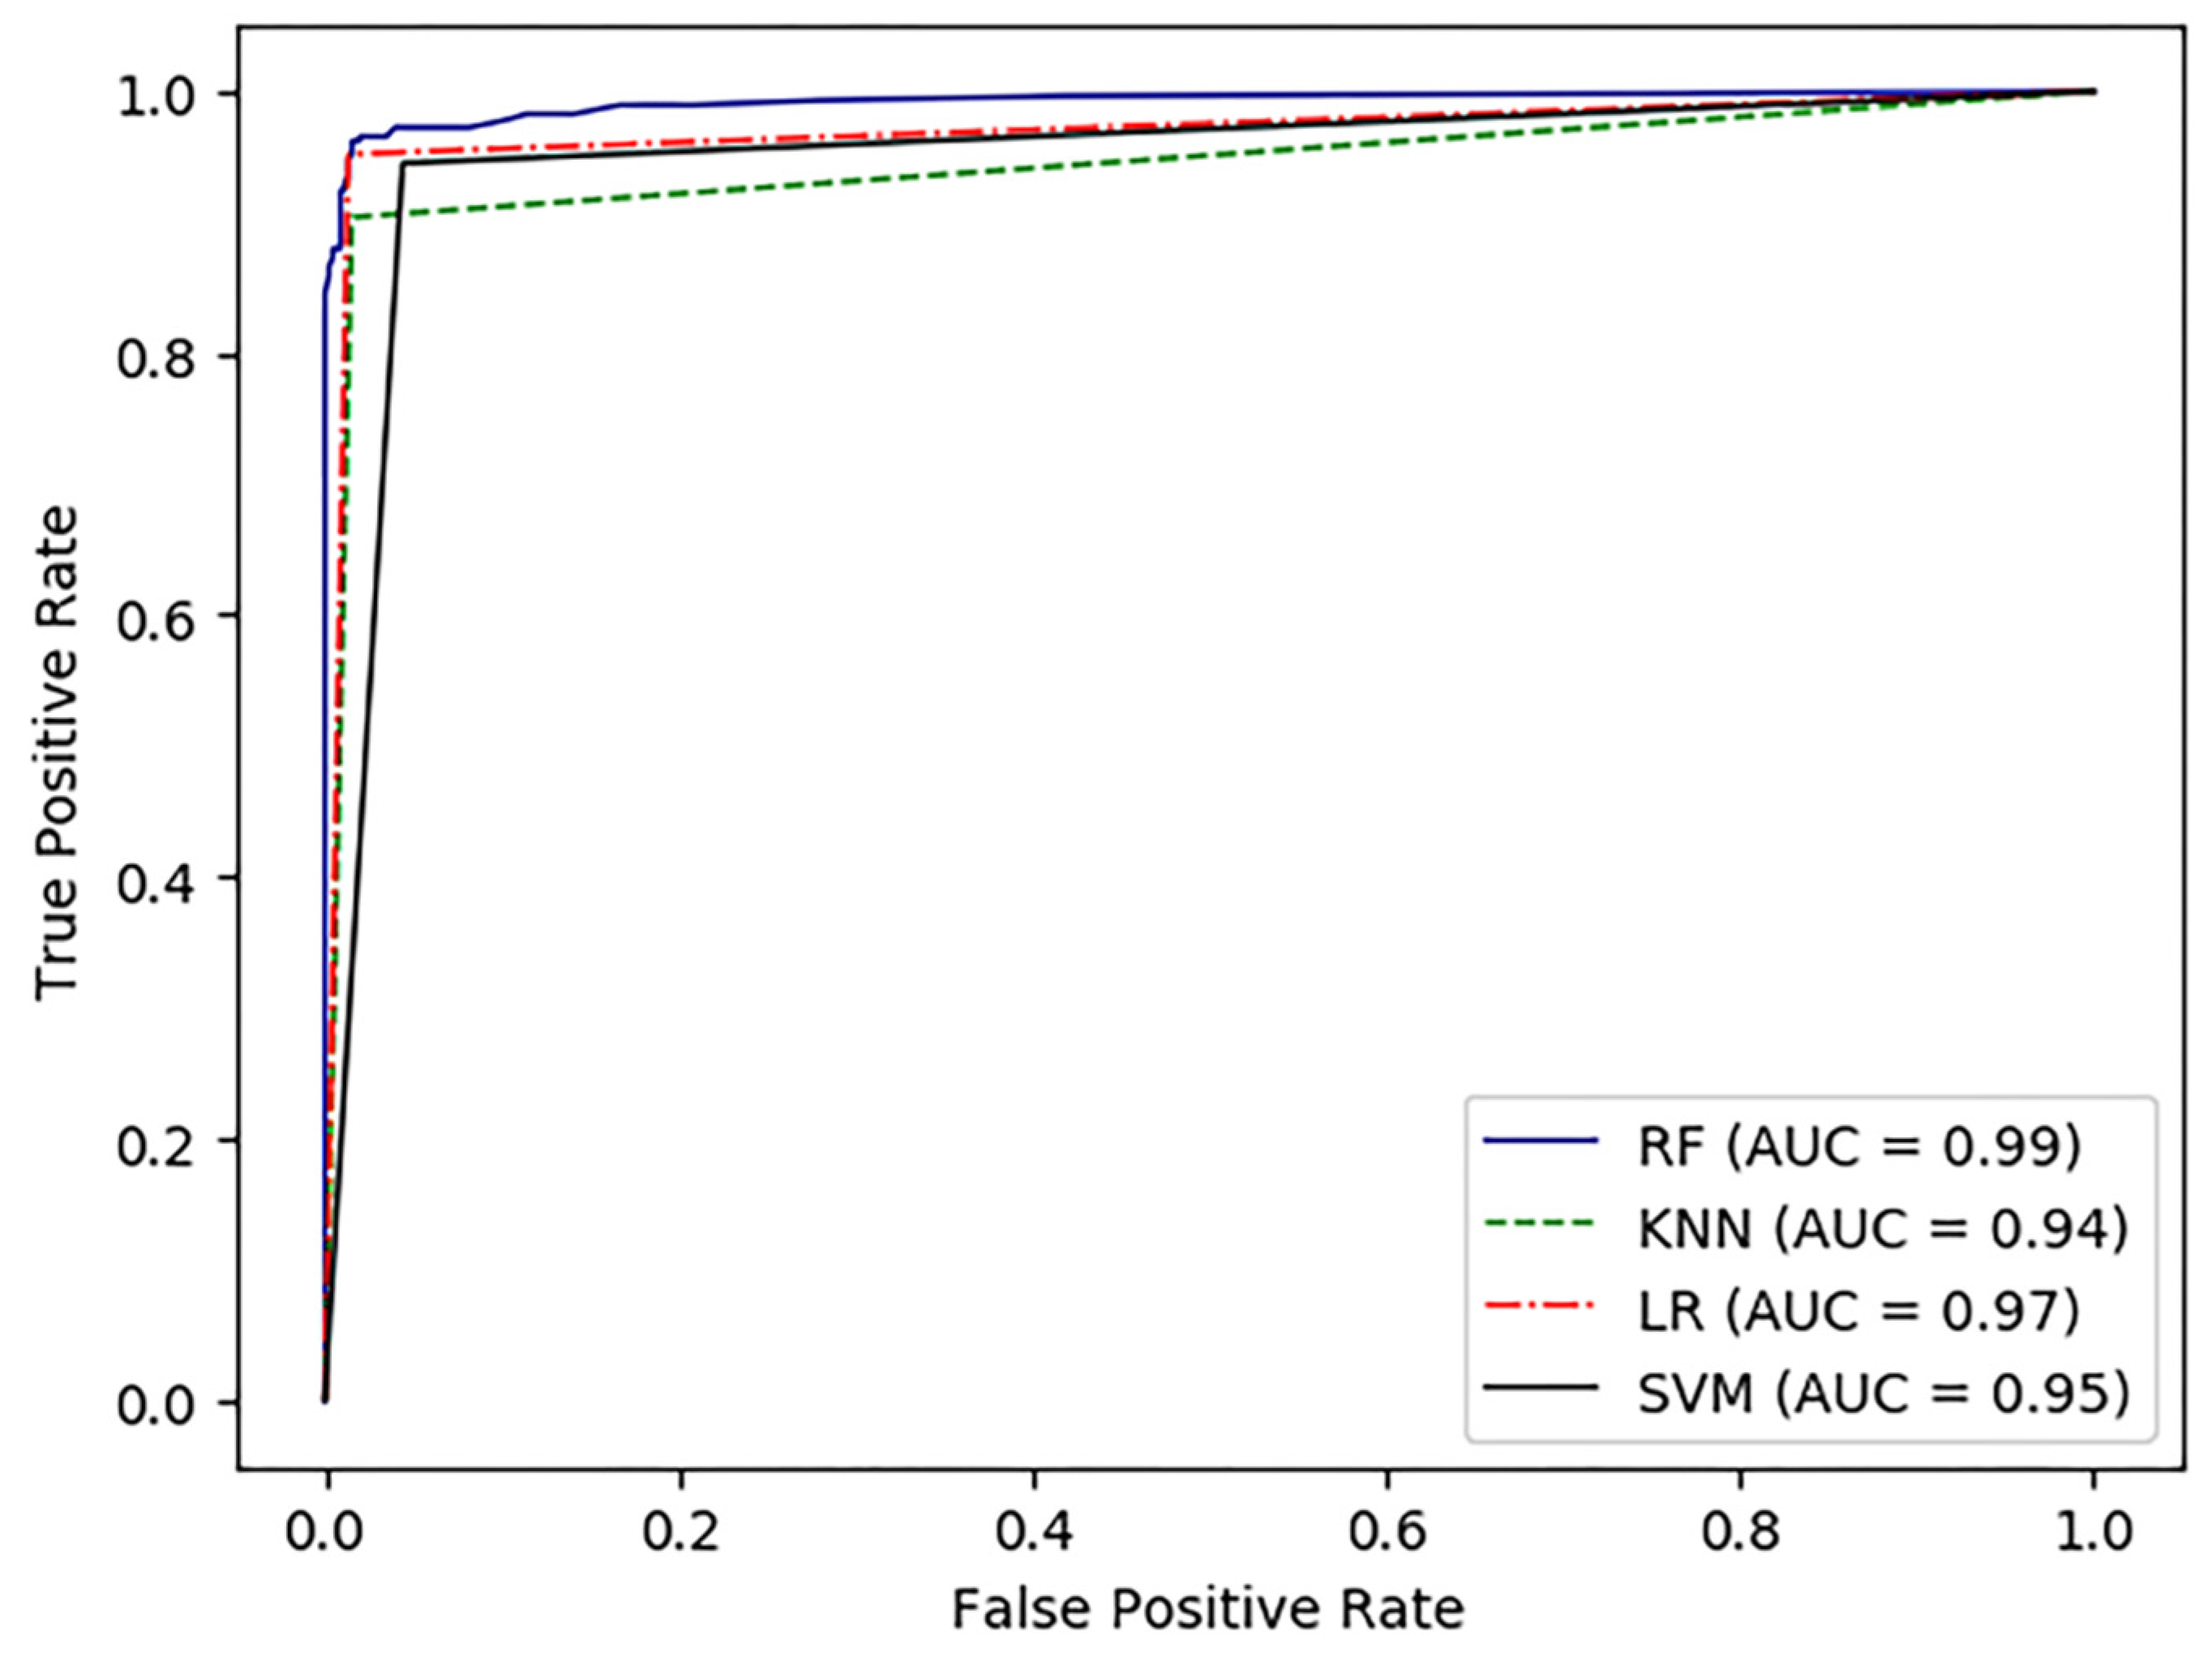
The classification results of per-minute segment are shown in Table 4. According to Table 4, the proposed method provided an accuracy of 97.5%, sensitivity of 95.9%, specificity of 98.4%, and AUC of 99.2% using RF classifier. In addition, we used some other classical classifiers (including SVM, KNN, and LR) to compare with the RF classifier. Although these classifiers also achieved satisfactory results, the RF classifier still had the highest accuracy of 97.5%. Furthermore, sensitivity, specificity, and AUC using the RF classifier were also higher than the other classifiers. The ROC curves of the four classifiers are plotted in Figure 6. Thus, in this study, the RF classifier is more suitable for SA detection than the other machine learning algorithms mentioned above.
4.3. Using either ECG or SpO2 Feature Set
To compare the SA detection performance of different signals, the ECG features and SpO2 features from the optimal feature set were used for SA detection, respectively. From Table 4, it was clear that the RF classifier outperforms the other classifiers. Therefore, the experiments in this section were conducted using the RF classifier alone. Table 5 shows the accuracy, sensitivity, specificity, and AUC using either the ECG feature set or the SpO2 feature set.
5. Discussion
5.1. Comparison among Different Signals
Reviewing the results of SA detection using either ECG signals or SpO2 signals alone in Section 4.3, we found that the SpO2 feature set had better accuracy, sensitivity, and specificity compared to the ECG feature set. In addition, some previous review works on SA detection also pointed out that SpO2 signals usually performed better than ECG signals [34]. This phenomenon can be attributed to the ability of the signal to characterize on sleep apnea syndrome. Because, when apnea occurs, a decrease in inhaled air flow can directly cause fluctuations in SpO2, and such fluctuations are significant. For the ECG signal, in addition to respiratory events, some cardiovascular diseases such as arrhythmias and heart block may also cause changes in HRV [34]. Therefore, it is challenging to detect apnea using the ECG signal.
Although excellent results were obtained using SpO2 signals alone, there are still some drawbacks. For example, chronic obstructive pulmonary disease or alveolar hypoventilation can also cause a decrease in oxygen saturation [35]. This means that some non-apnea-induced oxygen desaturations masquerade as apnea-induced oxygen desaturation, which can eventually lead to a decrease in the sensitivity of the model. However, upon comparing Table 4 and Table 5, it can be seen that the accuracy and sensitivity were improved by approximately 1% and 2%, respectively, when using the combined signals compared to using the SpO2 signal alone. This suggests that the two channel signals provide richer SA representation information to the classifier when classifying SA events. Further, from the results of feature selection, the RFECV algorithm selected six features from the ECG feature set and seven features from the SpO2 feature set, respectively. Thus, these features are non-redundant, indicating the complementarity between the two signals.
Another advantage of using a combination of ECG and SpO2 is better applicability. To the best of our knowledge, SA automatic detection algorithms developed based on single-lead ECG signals are not suitable for cardiac patients, which limits the applicability of the algorithms to some extent. However, the proposed algorithm achieved feature-level fusion. The advantage of using multimodal fusion techniques is that multimodal systems can still operate when one of the modalities is missing [28]. In other words, the proposed algorithm still has the ability to diagnose SA when one of the signals does not work.
5.2. Comparison with Other Related Works
We compared the performance of our method with other studies. Table 6 summarizes the results of our work and related work on per-segment SA detection. As shown in Table 6, some studies such as [12,31,36] used ECG signals, where [36] used an autoregressive model and a spectral autocorrelation function to extract features from ECG segments with an accuracy of up to 93.9%. In addition, among the studies using SpO2 [25,37], the best performance was reported by [25]. According to Table 6, our proposed approach provided higher per-segment classification accuracy than other studies. Moreover, [38] also used a combination of ECG and SpO2 signals and extracted 39 features. However, this study achieved 97.5% accuracy using only 12 features, which reduces the complexity of the model while improving the accuracy.
6. Conclusions
In this study, an automated SA detection method was developed to accurately identify sleep apnea events using ECG and SpO2 signals. The best results in terms of accuracy, sensitivity, specificity, and AUC were obtained using the RF classifier after fusing the features of ECG and SpO2. The model takes full advantage of the complementary information of the two signals and outperforms the model developed based on a single signal in terms of diagnostic performance. In addition, experimental results on the Apnea-ECG database showed that the performance of our method has been further improved compared to previous studies. Although the evaluation results of the model met our expectations, there are still some limitations. The database provided by Dr. Tomas Penzel does not annotate hypoventilation events. Therefore, in future work, we will combine multiple datasets to distinguish apnea from hypoventilation events and further validate the proposed algorithm.
Author Contributions
Conceptualization and methodology, J.Z. and A.Z.; software, A.Z. and J.H.; validation and formal analysis, Q.G. and Y.Z.; writing—original draft preparation, A.Z.; writing—review and editing, J.Z. and Z.C.; funding acquisition, J.Z. and Z.C. All authors have read and agreed to the published version of the manuscript.
Funding
This research was funded by the Guangxi Natural Science Foundation of China (grant number 2022GXNSFAA035507); the Guangxi Science and Technology Major Special Project (grant number 2019AA12005); the National Key R&D Program of China (grant number 2016YFC1305703); the 2019 Guangxi One Thousand Young and Middle-Aged College and University Backbone Teachers Cultivation Program; the Foundation of Guangxi Key Laboratory of Automatic Detection Technology and Instruments (grant number YQ20112); and the National Natural Science Foundation of China (grant number 61627807).
Institutional Review Board Statement
Not applicable.
Informed Consent Statement
Not applicable.
Data Availability Statement
https://physionet.org/content/apnea-ecg/1.0.0/ (accessed on 11 January 2021).
Conflicts of Interest
The authors declare no conflict of interest.
References
- Chriskos, P.; Frantzidis, C.A.; Nday, C.M.; Gkivogkli, P.T.; Bamidis, P.D.; Kourtidou-Papadeli, C. A review on current trends in automatic sleep staging through bio-signal recordings and future challenges. Sleep Med. Rev. 2021, 55, 101377. [Google Scholar] [CrossRef] [PubMed]
- Wang, T.; Lu, C.; Shen, G. Detection of Sleep Apnea from Single-Lead ECG Signal Using a Time Window Artificial Neural Network. BioMed Res. Int. 2019, 2019, 9768072. [Google Scholar] [CrossRef] [PubMed]
- Ainge-Allen, H.W.; Yee, B.J.; Ip, M.S.M. Contemporary Concise Review 2020: Sleep. Respirology 2021, 26, 700–706. [Google Scholar] [CrossRef] [PubMed]
- Senaratna, C.V.; Perret, J.L.; Lodge, C.J.; Lowe, A.J.; Campbell, B.E.; Matheson, M.C.; Hamilton, G.S.; Dharmage, S.C. Prevalence of obstructive sleep apnea in the general population: A systematic review. Sleep Med. Rev. 2017, 34, 70–81. [Google Scholar] [CrossRef] [PubMed]
- Tietjens, J.R.; Claman, D.; Kezirian, E.J.; De Marco, T.; Mirzayan, A.; Sadroonri, B.; Goldberg, A.N.; Long, C.; Gerstenfeld, E.P.; Yeghiazarians, Y. Obstructive Sleep Apnea in Cardiovascular Disease: A Review of the Literature and Proposed Multidisciplinary Clinical Management Strategy. J. Am. Heart Assoc. 2019, 8, e010440. [Google Scholar] [CrossRef] [PubMed] [Green Version]
- Faust, O.; Razaghi, H.; Barika, R.; Ciaccio, E.J.; Acharya, U.R. A review of automated sleep stage scoring based on physiological signals for the new millennia. Comput. Methods Programs Biomed. 2019, 176, 81–91. [Google Scholar] [CrossRef]
- Mendonca, F.; Mostafa, S.S.; Ravelo-Garcia, A.G.; Morgado-Dias, F.; Penzel, T. A Review of Obstructive Sleep Apnea Detection Approaches. IEEE J. Biomed. Health Inform. 2019, 23, 825–837. [Google Scholar] [CrossRef]
- Berkaya, S.K.; Uysal, A.K.; Gunal, E.S.; Ergin, S.; Gunal, S.; Gulmezoglu, M.B. A survey on ECG analysis. Biomed. Signal Processing Control 2018, 43, 216–235. [Google Scholar] [CrossRef]
- Nakayama, C.; Fujiwara, K.; Sumi, Y.; Matsuo, M.; Kano, M.; Kadotani, H. Obstructive sleep apnea screening by heart rate variability-based apnea/normal respiration discriminant model. Physiol. Meas. 2019, 40, 125001. [Google Scholar] [CrossRef]
- Ramachandran, A.; Karuppiah, A. A Survey on Recent Advances in Machine Learning Based Sleep Apnea Detection Systems. Healthcare 2021, 9, 914. [Google Scholar] [CrossRef]
- Roebuck, A.; Monasterio, V.; Gederi, E.; Osipov, M.; Behar, J.; Malhotra, A.; Penzel, T.; Clifford, G.D. A review of signals used in sleep analysis. Physiol. Meas. 2014, 35, R1-57. [Google Scholar] [CrossRef] [PubMed] [Green Version]
- Sheta, A.; Turabieh, H.; Thaher, T.; Too, J.; Mafarja, M.; Hossain, M.S.; Surani, S.R. Diagnosis of Obstructive Sleep Apnea from ECG Signals Using Machine Learning and Deep Learning Classifiers. Appl. Sci. 2021, 11, 6622. [Google Scholar] [CrossRef]
- Adami, A.; Boostani, R.; Marzbanrad, F.; Charlton, P.H. A New Framework to Estimate Breathing Rate From Electrocardiogram, Photoplethysmogram, and Blood Pressure Signals. IEEE Access 2021, 9, 45832–45844. [Google Scholar] [CrossRef]
- Khandoker, A.H.; Palaniswami, M.; Karmakar, C.K. Support vector machines for automated recognition of obstructive sleep apnea syndrome from ECG recordings. IEEE Trans. Inf. Technol. Biomed. 2009, 13, 37–48. [Google Scholar] [CrossRef]
- Bsoul, M.; Minn, H.; Tamil, L. Apnea MedAssist: Real-time Sleep Apnea Monitor Using Single-Lead ECG. IEEE Trans. Inf. Technol. Biomed. 2011, 15, 416–427. [Google Scholar] [CrossRef] [Green Version]
- Sharma, H.; Sharma, K.K. An algorithm for sleep apnea detection from single-lead ECG using Hermite basis functions. Comput. Biol. Med. 2016, 77, 116–124. [Google Scholar] [CrossRef]
- Magalang, U.J.; Dmochowski, J.; Veeramachaneni, S.; Draw, A.; Mador, M.J.; El-Solh, A.; Grant, B.J. Prediction of the apnea-hypopnea index from overnight pulse oximetry. Chest 2003, 124, 1694–1701. [Google Scholar] [CrossRef] [Green Version]
- Rashid, N.H.; Zaghi, S.; Scapuccin, M.; Camacho, M.; Certal, V.; Capasso, R. The Value of Oxygen Desaturation Index for Diagnosing Obstructive Sleep Apnea: A Systematic Review. Laryngoscope 2021, 131, 440–447. [Google Scholar] [CrossRef]
- Ling, I.T.; James, A.L.; Hillman, D.R. Interrelationships between body mass, oxygen desaturation, and apnea-hypopnea indices in a sleep clinic population. Sleep 2012, 35, 89–96. [Google Scholar] [CrossRef] [Green Version]
- Alvarez, D.; Hornero, R.; Abasolo, D.; del Campo, F.; Zamarron, C. Nonlinear characteristics of blood oxygen saturation from nocturnal oximetry for obstructive sleep apnoea detection. Physiol. Meas. 2006, 27, 399–412. [Google Scholar] [CrossRef] [Green Version]
- Hornero, R.; Alvarez, D.; Abasolo, D.; del Campo, F.; Zamarron, C. Utility of approximate entropy from overnight pulse oximetry data in the diagnosis of the obstructive sleep apnea syndrome. IEEE Trans. Biomed. Eng. 2007, 54, 107–113. [Google Scholar] [CrossRef] [Green Version]
- Xiao, K.; Qian, Z.; Qin, B. A Survey of Data Representation for Multi-Modality Event Detection and Evolution. Appl. Sci. 2022, 12, 2204. [Google Scholar] [CrossRef]
- Obtaining CinC Challenge 2000 Scores. 2021. Available online: https://archive.physionet.org/physiobank/database/apnea-ecg/ (accessed on 11 January 2021).
- Chen, L.; Zhang, X.; Song, C. An Automatic Screening Approach for Obstructive Sleep Apnea Diagnosis Based on Single-Lead Electrocardiogram. IEEE Trans. Autom. Sci. Eng. 2015, 12, 106–115. [Google Scholar] [CrossRef]
- Mostafa, S.S.; Morgado-Dias, F.; Ravelo-García, A.G. Comparison of SFS and mRMR for oximetry feature selection in obstructive sleep apnea detection. Neural Comput. Appl. 2018, 32, 15711–15731. [Google Scholar] [CrossRef]
- Cokelaer, T.; Hasch, J. ‘Spectrum’: Spectral Analysis in Python. J. Open Source Softw. 2017, 2, 348. [Google Scholar] [CrossRef]
- Gutiérrez-Tobal, G.; Hornero, R.; Alvarez, D.; Marcos, J.V.; Campo, F.D. Linear and nonlinear analysis of airflow recordings to help in sleep apnoea-hypopnoea syndrome diagnosis. Physiol. Meas. 2012, 33, 1261–1275. [Google Scholar] [CrossRef] [PubMed]
- Baltrusaitis, T.; Ahuja, C.; Morency, L.P. Multimodal Machine Learning: A Survey and Taxonomy. IEEE Trans. Pattern Anal. Mach. Intell. 2019, 41, 423–443. [Google Scholar] [CrossRef] [Green Version]
- Jeon, H.; Oh, S. Hybrid-Recursive Feature Elimination for Efficient Feature Selection. Appl. Sci. 2020, 10, 3211. [Google Scholar] [CrossRef]
- Kruskal, W.H.; Wallis, W.A. Use of Ranks in One-Criterion Variance Analysis. Curr. Contents/Soc. Behav. Sci. 1987, 20, 583–621. [Google Scholar]
- Rajesh, K.; Dhuli, R.; Kumar, T.S. Obstructive sleep apnea detection using discrete wavelet transform-based statistical features. Comput. Biol. Med. 2021, 130, 104199. [Google Scholar] [CrossRef]
- Barroso-García, V.; Gutiérrez-Tobal, G.C.; Kheirandish-Gozal, L.; Álvarez, D.; Vaquerizo-Villar, F.; Crespo, A.; Del Campo, F.; Gozal, D.; Hornero, R. Irregularity and Variability Analysis of Airflow Recordings to Facilitate the Diagnosis of Paediatric Sleep Apnoea-Hypopnoea Syndrome. Entropy 2017, 19, 447. [Google Scholar] [CrossRef] [Green Version]
- Zarei, A.; Asl, B.M. Automatic Detection of Obstructive Sleep Apnea Using Wavelet Transform and Entropy-Based Features From Single-Lead ECG Signal. IEEE J. Biomed. Health Inform. 2019, 23, 1011–1021. [Google Scholar] [CrossRef]
- Li, Z.; Li, Y.; Zhao, G.; Zhang, X.; Xu, W.; Han, D. A model for obstructive sleep apnea detection using a multi-layer feed-forward neural network based on electrocardiogram, pulse oxygen saturation, and body mass index. Sleep Breath. 2021, 25, 2065–2072. [Google Scholar] [CrossRef] [PubMed]
- Adir, Y.; Humbert, M.; Chaouat, A. Sleep-related breathing disorders and pulmonary hypertension. Eur. Respir. J. 2021, 57, 2002258–2002308. [Google Scholar] [CrossRef] [PubMed]
- Zarei, A.; Mohammadzadeh Asl, B. Performance evaluation of the spectral autocorrelation function and autoregressive models for automated sleep apnea detection using single-lead ECG signal. Comput. Methods Programs Biomed. 2020, 195, 105626. [Google Scholar] [CrossRef] [PubMed]
- Ma, B.; Wu, Z.L.; Li, S.Y.; Benton, R.; Li, D.Q.; Huang, Y.L.; Kasukurthi, M.V.; Lin, J.W.; Borchert, G.M.; Tan, S.B.; et al. A SVM-Based Algorithm to Diagnose Sleep Apnea. In Proceedings of the IEEE International Conference on Bioinformatics and Biomedicine (BIBM), San Diego, CA, USA, 18–21 November 2019; pp. 1556–1560. [Google Scholar]
- Xie, B.; Minn, H. Real-time sleep apnea detection by classifier combination. IEEE Trans. Inf. Technol. Biomed. 2012, 16, 469–477. [Google Scholar] [CrossRef] [Green Version]
Figure 1.
Block diagram of the automated sleep apnea detection algorithm.

Figure 2.
An example of 1-min apnea and normal segments [23]. (a,b) are normal ECG and SpO2 segments; (c,d) are apneic ECG and SpO2 segments.
Figure 2.
An example of 1-min apnea and normal segments [23]. (a,b) are normal ECG and SpO2 segments; (c,d) are apneic ECG and SpO2 segments.

Figure 3.
The main procedure of the RFECV method.

Figure 4.
Feature selection results using the RFECV algorithm on the training set. The best results occur when the number of features is 13.
Figure 4.
Feature selection results using the RFECV algorithm on the training set. The best results occur when the number of features is 13.

Figure 5.
Box plots for the selected features corresponding to 0 and 1 classes, where 0 represents normal and 1 represents apnea.
Figure 5.
Box plots for the selected features corresponding to 0 and 1 classes, where 0 represents normal and 1 represents apnea.

Figure 6.
Receiver operating characteristic (ROC) curve analysis for RF, KNN, LR, and SVM classifier.
Figure 6.
Receiver operating characteristic (ROC) curve analysis for RF, KNN, LR, and SVM classifier.


Table 1.
RR intervals features and R-wave Amplitudes feature.
| Derived from | Feature | Description | |
|---|---|---|---|
| RR | RAMP | ||
| RRmean | Mean of RR intervals | ||
| RMSSD | Root mean square of differences between adjacent RR intervals | ||
| SDNN | Standard deviation of RR intervals | ||
| NN50 | Number of adjacent RR intervals exceeding 50 milliseconds | ||
| pNN50 | Ratio of NN50 to the number of RR intervals | ||
| HR | Mean of heart rates | ||
| VLF1, VLF2 | Very low frequency (0~0.04 Hz) component of the corresponding signal | ||
| LF1, LF2 | Low frequency (0.04~0.15 Hz) component of the corresponding signal | ||
| HF1, HF2 | High frequency (0.15~0.4 Hz) component of the corresponding signal | ||
| LF/HF1, LF/HF2 | Ratio of LF to HF | ||
| LFnorm1, LFnorm2 | Normalized low frequency components | ||
| HFnorm1, HFnorm2 | Normalized high frequency components | ||
1, 2 represent the frequency domain features of the RR interval and RAMP, respectively.
Table 2.
SpO2 features and their descriptions.
| Feature | Description |
|---|---|
| Smin | Minimum value of 1-min SpO2 segments |
| Smean | Mean value of 1-min SpO2 segments |
| Svar | Variance of 1-min SpO2 segments |
| ApEn | Approximate entropy with Tolerence of 0.25 and Enbedding Dimension of 2 |
| LZC | Lempel–Ziv complexity |
| CTM | Central tendency measure with radius 0.25 |
Table 3.
Feature number corresponding to the feature name.
| Feature Number | Feature Name |
|---|---|
| 2 | RMSSD |
| 5 | pNN50 |
| 6 | HR |
| 7 | VLF 1 |
| 9 | HF 1 |
| 11 | LFnorm 1 |
| 12 | HFnorm 1 |
| 19 | Smin |
| 20 | Smean |
| 21 | Svar |
| 22 | ApEn |
| 23 | LZC |
| 24 | CTM |
1 Represent the frequency domain features of the RR interval.
Table 4.
Per-segment classification results of different classifiers on the Apnea-ECG database.
| Classifier | Accuracy (%) | Sensitivity (%) | Specificity (%) | AUC |
|---|---|---|---|---|
| SVM | 96.1% | 93.4% | 97.8% | 0.956 |
| LR | 97.4% | 95.5% | 98.2% | 0.971 |
| KNN | 93.8% | 89.3% | 96.7% | 0.940 |
| RF | 97.5% | 95.9% | 98.4% | 0.992 |
Table 5.
Per-segment classification results based on RF classifier using either ECG or SpO2 feature set.
Table 5.
Per-segment classification results based on RF classifier using either ECG or SpO2 feature set.
| Signal | Accuracy (%) | Sensitivity (%) | Specificity (%) | AUC |
|---|---|---|---|---|
| ECG | 88.6% | 84.5% | 91.2% | 0.957 |
| SpO2 | 96.6% | 93.8% | 98.4% | 0.988 |
Table 6.
Comparison of the proposed method with other previous studies.
| Reference | Signal | Accuracy (%) | Sensitivity (%) | Specificity (%) | AUC |
|---|---|---|---|---|---|
| Zarei et al. [36] | ECG | 93.90% | 92.26% | 94.92% | 0.99 |
| Sheta et al. [12] | ECG | 90.75% | 91.91% | / | 0.97 |
| Rajesh et al. [31] | ECG | 89.70% | 85.07% | 92.42% | 0.96 |
| Mostafa et al. [25] | SpO2 | 97.38% | 84.57% | 97.28% | / |
| Ma et al. [37] | SpO2 | 90.20% | 87.6% | 94.1% | / |
| Xie et al. [38] | ECG + SpO2 | 84.40% | 85.89% | 86.81% | / |
| This Study | ECG + SpO2 | 97.5% | 95.9% | 98.4% | 0.99 |
Publisher’s Note: MDPI stays neutral with regard to jurisdictional claims in published maps and institutional affiliations. |
© 2022 by the authors. Licensee MDPI, Basel, Switzerland. This article is an open access article distributed under the terms and conditions of the Creative Commons Attribution (CC BY) license (https://creativecommons.org/licenses/by/4.0/).
Share and Cite
MDPI and ACS Style
Zhu, J.; Zhou, A.; Gong, Q.; Zhou, Y.; Huang, J.; Chen, Z. Detection of Sleep Apnea from Electrocardiogram and Pulse Oximetry Signals Using Random Forest. Appl. Sci. 2022, 12, 4218. https://0-doi-org.brum.beds.ac.uk/10.3390/app12094218
AMA Style
Zhu J, Zhou A, Gong Q, Zhou Y, Huang J, Chen Z. Detection of Sleep Apnea from Electrocardiogram and Pulse Oximetry Signals Using Random Forest. Applied Sciences. 2022; 12(9):4218. https://0-doi-org.brum.beds.ac.uk/10.3390/app12094218
Chicago/Turabian StyleZhu, Jianming, Aojie Zhou, Qiong Gong, Yu Zhou, Junxiang Huang, and Zhencheng Chen. 2022. "Detection of Sleep Apnea from Electrocardiogram and Pulse Oximetry Signals Using Random Forest" Applied Sciences 12, no. 9: 4218. https://0-doi-org.brum.beds.ac.uk/10.3390/app12094218
Note that from the first issue of 2016, this journal uses article numbers instead of page numbers. See further details here.