Article

Application of a Cost-Effective Visible/Near Infrared Optical Prototype for the Measurement of Qualitative Parameters of Chardonnay Grapes

Department of Agricultural and Environmental Sciences (DiSAA), Università degli Studi di Milano, 20133 Milan, Italy
*
Author to whom correspondence should be addressed.
Submission received: 28 March 2022 / Revised: 6 May 2022 / Accepted: 10 May 2022 / Published: 11 May 2022

Abstract

:

Featured Application

The work shows the results of the application of a vis/NIR prototype used to measure qualitative parameters of Chardonnay grapes by building predictive regression models.

Abstract

In this paper, a cost-effective visible/near infrared optical prototype was tested for grape maturity monitoring. The device was used to quantify the qualitative parameters of Chardonnay grapes, based on the combination of spectroscopic data and the creation of predictive models. The optical acquisitions were performed directly in the field through the use of 12 wavelengths in the vis/NIR range, i.e., 450, 500, 550, 570, 600, 610, 650, 680, 730, 760, 810 and 860 nanometers. The prediction of the qualitative parameters was carried out through a multivariate model, partial least square (PLS) regression technique and built knowing the real values of the parameters, i.e., total soluble solids (TSS), titratable acidity (TA) and pH measured through the reference laboratory analyses. Sampling included two harvest years. The most efficient model was the one for TSS evaluation that gave a R2 = 0.87 (independent test set validation). The results demonstrated that the optical device is able to provide useful information about the ripening parameters of Chardonnay grapes directly in the field in order to predict its correct maturation stage and, therefore, support operators in rapid and objective decision making. Overall, the use of the prototype promotes a sustainable approach and viticulture 4.0.

1. Introduction

Food products, particularly those with a high added value, are frequently subjected to stringent quality standards, which are critical for attesting to certain specific characteristics, such as geographical origin, manufacturing method, and/or producer know-how. Analytical platforms must be updated and improved on a regular basis as fraudulent methods become more sophisticated, as well as the complexity and diversity of food composition [1].
In this context, non-destructive techniques, such as spectroscopic and imaging techniques, are inserted effectively, responding to the problems of the food control field. Since these are analytical techniques that offer numerous advantages, including the non-destruction of samples, the rapidity to obtain results and the possibility of checks during the production processes, they have been studied and exploited for a long time in the agro-food sector [2]. The most commonly widespread non-destructive techniques in the food industry are indeed vis/NIR spectroscopy, NIR spectroscopy (NIRs) and image and multi/hyperspectral analysis [3].
Vis/NIR spectroscopy has been used successfully in the non-destructive evaluation of fruit and vegetable quality over the past few decades [4] and, in particular, in the grape and wine industry, e.g., to determine the optimum harvest time or to evaluate the quality parameters in works by Kemps et al. [5], Guidetti et al. [6], González-Caballero et al. [7], Giovenzana et al. [8], dos Santos Costa et al. [9], Power et al. [10] and Vallone et al. [11], just to name a few.
The possibility of monitoring the ripening stage of the grapes directly in the field has now become of fundamental importance both to guarantee a raw material of the highest quality and to support winemakers in their choices.
Another crucial aspect is covered by sustainability. The chemical analyses normally carried out in the laboratory to evaluate the qualitative parameters of grapes require chemical reagents and also a lot of time and specialized personnel; the optical analyses in this case represent a sustainable alternative [12]. Nowadays, commercially available spectrophotometers are mostly expensive benchtop instruments that do not offer the possibility of being used outside the laboratories. The existing portable instruments offer the possibility of being used directly in the field, but also have a high cost and often a configuration that is only useful to acquire spectra and not to obtain immediate results, in terms of parameter prediction. For these reasons, the research is concentrating on maintaining the high performance of this type of optical analysis, while using simplified, portable and easy to use tools [13].
Some papers have been published on the use of portable spectrometers on vegetal matrices. Nagpala et al. [14] used a portable vis/NIR device based on the creation of an index, which was based on two wavelength peaks (index of absorbance difference, IAD) to follow the ripening evolution of cherries; Ribera-Fonseca et al. [15] used the same device on grape berries, demonstrating that the use of IAD may be useful for monitoring technological ripeness and anthocyanin concentration. Yang et al. [16] used a portable vis/NIR device implemented with an optical fiber to predict the sugar content (TSS) of kiwi fruits and Fan et al. [17] used a portable vis/NIR device on apples to predict the content in TSS.
Despite attempts at simplification, these non-destructive and rapid techniques are, however, characterized by an intrinsic complexity of the data collected, which requires multivariate statistical analysis techniques for interpretation. To measure fruit maturity at harvest and during the post-harvest period, various non-destructive techniques and chemometric algorithms have been developed [18].
Chemometrics is a discipline of statistics that deals with multivariate data historically derived from analytical chemistry. The chemometric techniques used to obtain information from these data are identified as pattern recognition techniques and can be divided between unsupervised methods (principal component analysis and cluster analysis) and supervised methods that allow the creation of predictive models, using various techniques including the regression technique. Exploratory data analysis, such as PCA, is a fundamental step in the analysis of this type of data. It provides an overall view of the system under study, allowing the detection of possible similarities/dissimilarities among samples, the identification of clusters or systematic trends, the discovery of those variables that are relevant to describe the system and that can be discarded in principle, and the detection of possible outlying, anomalous, or at the very least suspicious samples [19]. The proper management of outliers is necessary to develop models that are effective [20]. Regression models can be used to predict and quantify selected maturity indices of products. Chemometric techniques are, therefore, fundamental for extracting useful information from optical data and for creating simplified models. In this case, a PLS (partial least square) regression model was used, which represents a particular type of multivariate analysis that is capable of modeling the relationship between two matrices, i.e., the relationship between the predictors, X, and the variables we want to predict, Y [21].
The experimentation tested a cost-effective and portable prototype to estimate the qualitative parameters of Chardonnay grapes directly in the field in order to support operators in rapid and objective decision making. The aim of this work is to obtain immediate results on grape ripeness to identify the optimal harvesting time.
The optical prototype is equipped with vis/NIR bands and predictive models to promote a sustainable approach and viticulture 4.0.

2. Materials and Methods

2.1. Sampling Activities

The experimental campaign took place in the viticulture area of the province of Mantua at “Azienda Agricola Ricchi” (Monzanbano, Lombardy, Italy; 45°23′22.848′′ N 10°41′36.427′′ E) during the ripening period at the end of July and the end of August 2020 and 2021. Sampling was performed on Chardonnay grapes (Vitis vinifera L.) in different plots distributed in the vineyard. Chardonnay is a white grape strong variety with moderate grape production; its berry clusters are tiny, cylindrical, and winged, and can range in size from well-filled to compact [11].
All the samples were collected from 8 plots and in each plot, 3 plants were selected and marked in order to take the samples as representative as possible of the entire vineyard. In 2020, a total of 80 samples were collected and analyzed in 4 different sampling dates (8 samples for time 0, 24 samples for each of the other 3 sampling dates). In 2021, a total of 96 samples (24 samples for each sampling date) were collected with the same procedure.

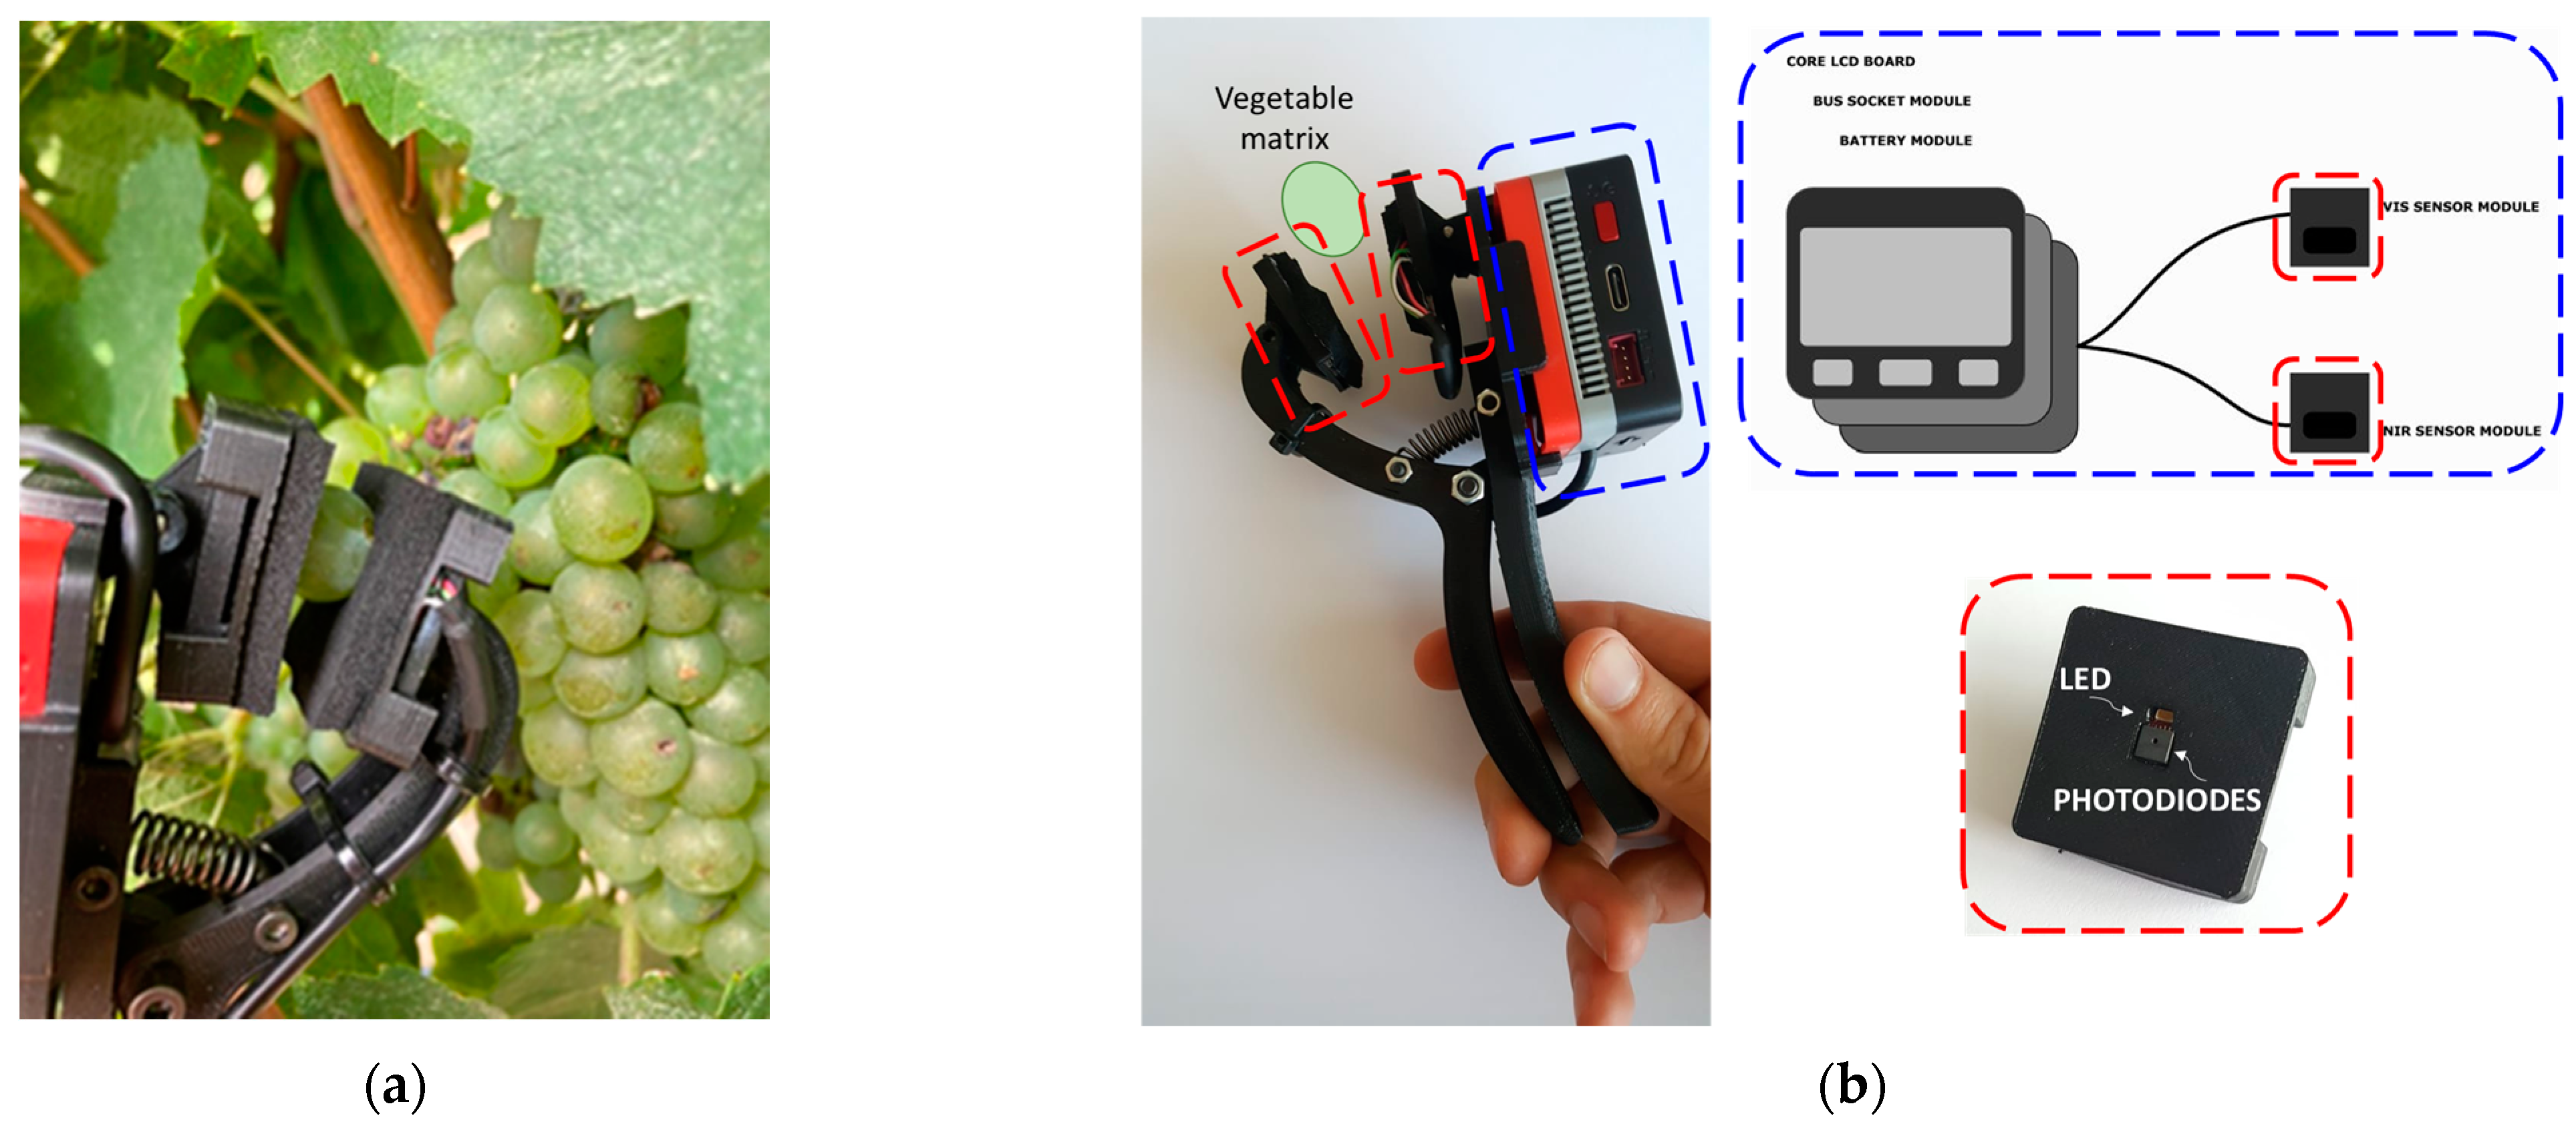
2.2. Optical Acquisition and Prototype Features

The acquisitions were performed directly in the field (immediately after manually collecting the samples), without any sample preparation. For each sample, 5 single berries were analyzed to obtain a total dataset of 400 optical analyses in 2020, corresponding to 40 acquisitions for time 0 and 120 acquisitions for the other samplings. In 2021, 480 optical analyses (corresponding to 120 acquisitions per sampling date) were collected and made up the dataset.
A first version of the prototype was described in 2021 [22] as a pre-prototype; the device was used for optical acquisitions during 2020 sampling. The new version of the device used for 2021 sampling consists of 2 optical sensors with 6 wavelengths each, for a total of 12 wavelengths, as described in Table 1.
The prototype incorporates the two sensors just mentioned (AMS, models AS7262 visible and AS7263 NIR, Premstaetten, Austria, Europe) for spectral acquisitions in visible (vis) and in short wave near-infrared (SW-NIR) regions. The sensors have a 16-bit radiometric resolution and 12 independent on-device optical filters, from 450 to 860 nanometers. The full-width half-maximum of the vis sensor is 40 nm, while the full-width half-maximum of the SW-NIR sensor is 20 nm. The use of these commercial optical cores allows the costs of the prototype to be kept extremely low.
The wavelengths used in the device are the same as in the pre-prototypal version [22], precisely because each wavelength corresponds to a particular absorption peak of particular interest in this type of analysis. As reported by Giovenzana et al. [8], 630 and 690 nanometers are near the characteristic peak of chlorophyll, 730 nanometers is near the third overtone of the -OH bond, and lastly, 810 and 860 nanometers are near the combination band of the -OH groups of sugars.
Unlike the first version of the device, the two sensors are now integrated into a clamp that enables the operator to fully embrace the berry grape (Figure 1a,b) and capture all the readouts at once, without the need to repeat the analysis with the first sensor and then with the second sensor. Moreover, the instrument was configured to perform an average of 10 scans for each acquisition, trying to reduce as much as possible the experimental noise associated with the light that often creates issues with optical analyses.

2.3. Chemical Analyses

The wet-chem analyses were carried out on the same samples on which the optical data were collected and were used as reference parameters. In particular, three characteristic parameters generally used for estimating grape’s technological maturity were measured. Total soluble solids (TSS) were measured using a digital refractometer (PAL-1 ATAGO, Tokyo, Japan, accuracy refractive index ±0.2 Brix), which provides the result in Brix, measuring the refractive index of the juice obtained from mashing the sample according to the total content of soluble solids. Titratable acidity (TA) was measured for the juice with an automatic titrator (TitroMatic KF 1S, Crison Instruments, Milan, Italy) and the result was expressed in grams of tartaric acid per liter (gtartaric acid dm−3). The pH was measured for the juice using a portable pH meter PCE-PHD 1 (PCE Inst. GmbH, Meschede, Germany).

2.4. Data Processing

The results of the chemical reference parameters (TSS, TA and pH) and the optical data obtained by the device were analyzed in Matlab® environment, version 2021a (MathWorks, Inc., Natick, MA, USA) using the PLSToolbox package (Eigenvector Research, Inc., Manson, WA, USA).
The first part of data processing involved the creation of matrices showing the optical data and the execution of a first principal components analysis (PCA). This first unsupervised exploratory analysis allowed the identification, and then the removal, of some outliers using the ‘Hotelling T2 computation’ function. The data matrix used was averaged and then reduced to obtain a new matrix (similarly representative of the sampling campaign) made up of 24 samples for each sampling date (except only for the time 0 of 2020, which consists of 8 samples as mentioned above), switching from a matrix with 880 rows to a matrix with 176 rows. After performing the exploratory PCA analysis and removing outliers, reference parameters (TSS, pH and TA) were used for the calculation of three different predictive models. The partial least square (PLS) regression technique was used to create the models, with only autoscaling as pretreatment.. Cross-validation was used with the leave more out technique, venetian blinds with 5 cancellation groups. Concerning test-set validation, the dataset was randomly divided into a training set, corresponding to the calibration set, and into a test set. A total of 60% of the samples were used for the training set and 40% for the test set. To evaluate model accuracy, root mean square error (RMSE) and coefficient of determination (R2) were used; the better the model performs, the lower the error is, and the higher the R2 (as maximum equal to 1) is.
In addition, the ratio between the standard deviation of the response variable and RMSE (RPD) was calculated. An RPD between 1.5 and 2 means that the model can discriminate low from high values of the response variable; a value between 2 and 2.5 indicates that coarse quantitative predictions are possible, and a value between 2.5 and 3 or above corresponds to good and excellent prediction accuracy, respectively [23].
Finally, a significance test (Student′s t-test) was performed between the reference and predicted data along the ripening evolution monitoring for each year considered.

3. Results

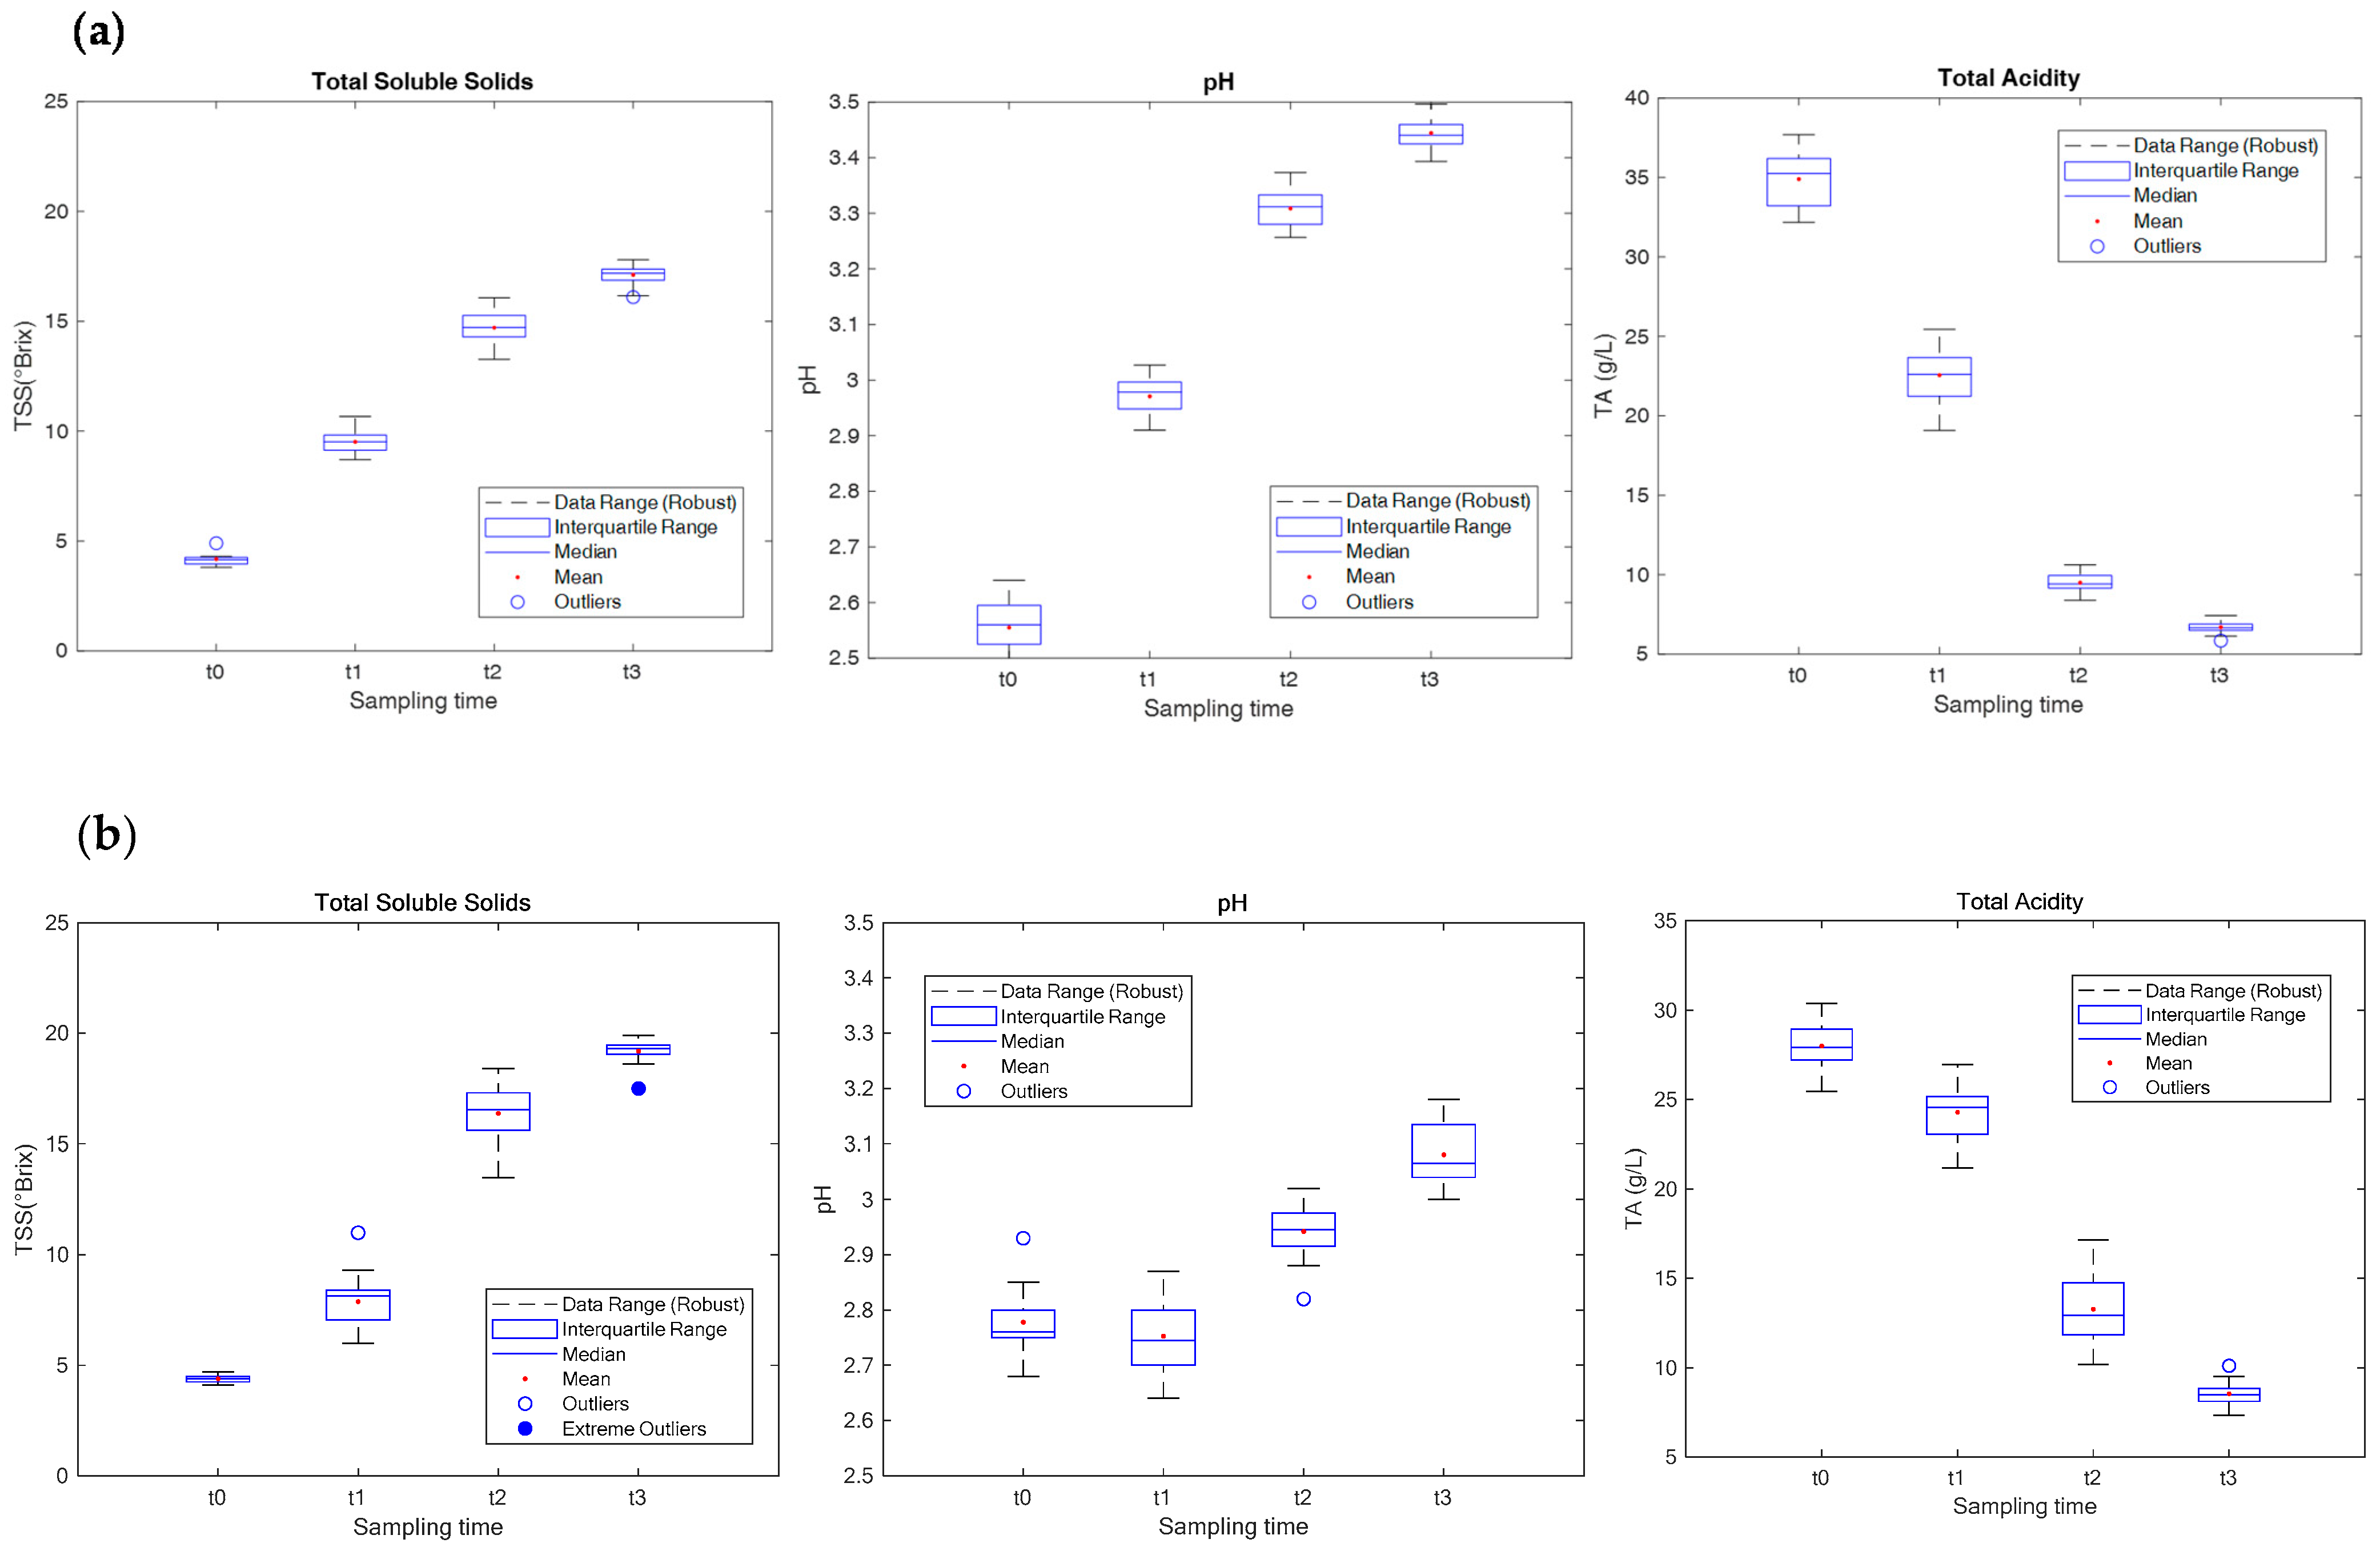
3.1. Reference Parameters (TSS, pH, TA)

In Figure 2, the descriptive statistics of the parameters of technological maturation measured in the laboratory are reported. The data are divided into the four sampling dates and the mean, the median, the interquartile range and the data range are represented in the figure. The graphs also show the outliers and extreme outliers. The outliers highlighted are the values that are more than 1.5 times the interquartile range away from the top or bottom of the box. The characteristic trends of grape ripening are clearly visible from left to right; the total soluble solids and the pH increase, while the titratable acidity tends to decrease as the maturation progresses [24].
The trend of the qualitative parameters clearly shows the same trend in the year 2020 and in the year 2021. The 2020 data (Figure 2a) are characterized by higher variability between the dates than the 2021 sampling (Figure 2b), while the 2021 data highlight higher variability within the dates, with respect to the 2020 sampling.

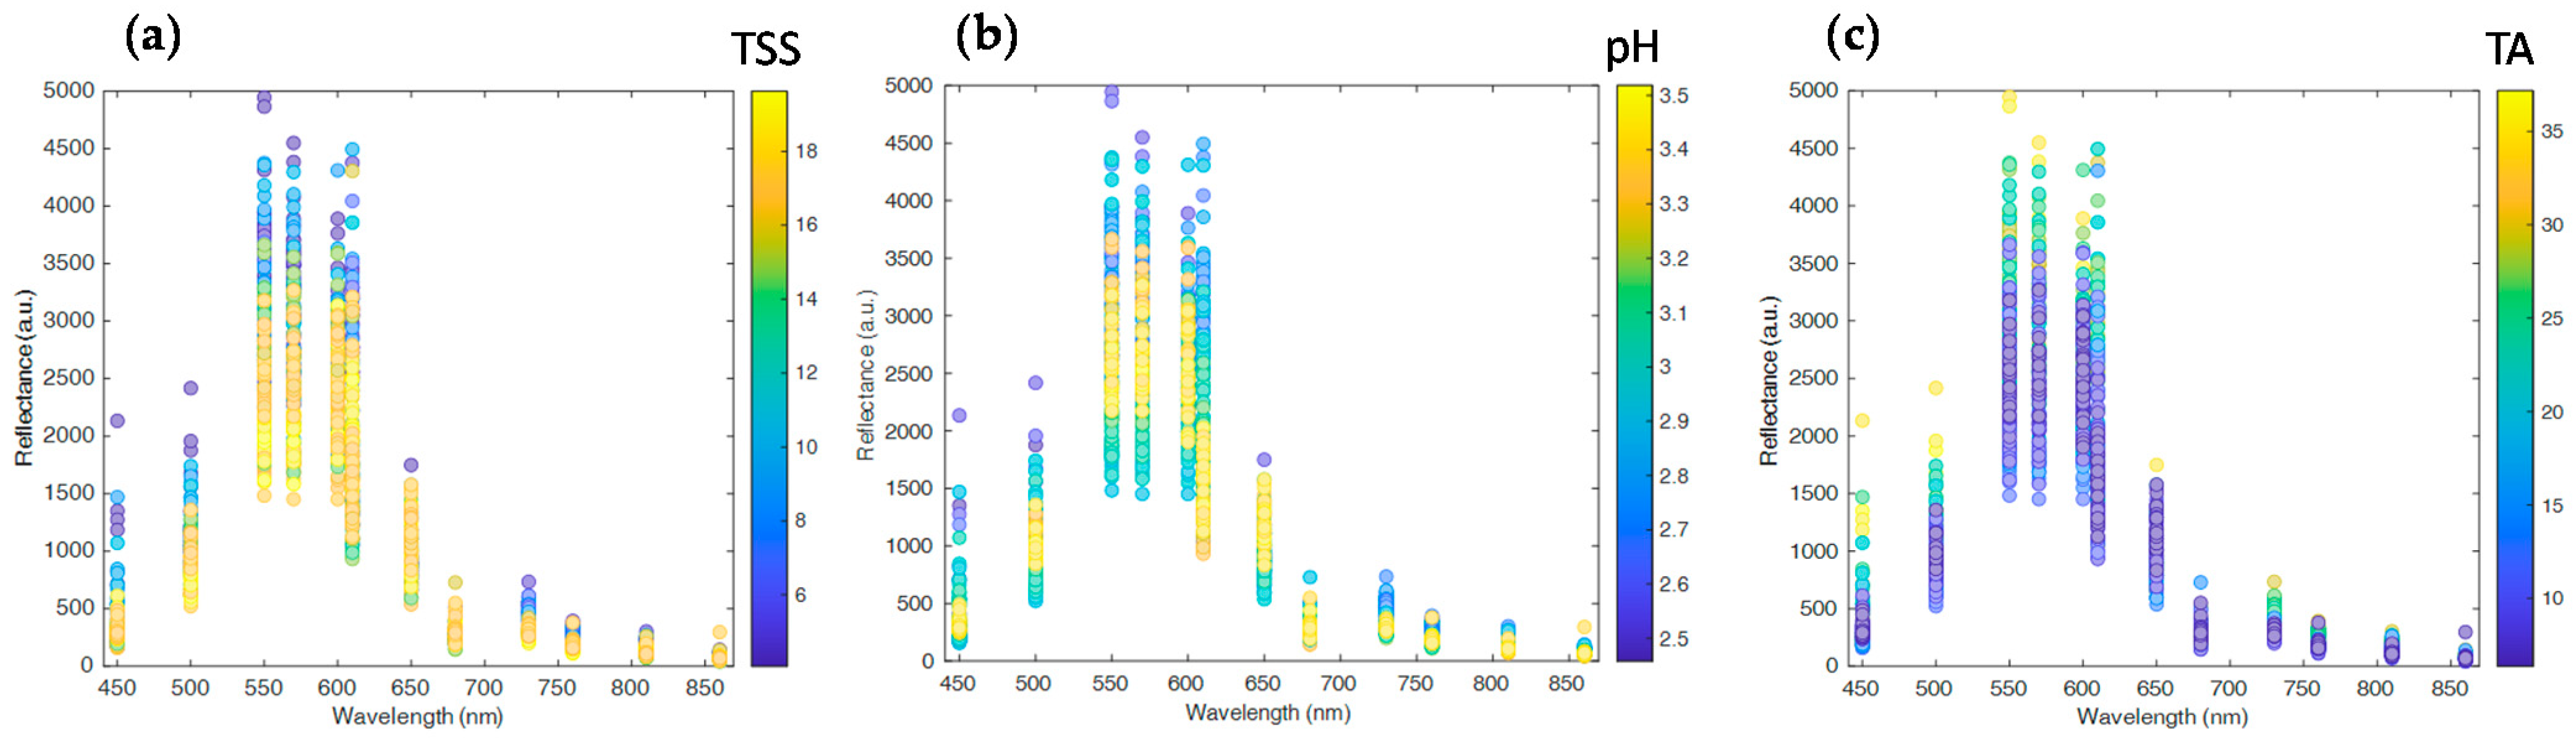
3.2. Optical Readouts

Figure 3 shows the total readouts of both sampling years, colored according to the qualitative parameters. Data from the two different sources, i.e., the pre-prototype [22] and the new version of the device and the two different years, were merged to observe the sample reflectance in the whole optical range covered by the sensors. Even if the device is not able to provide continuous spectra, the increasing and decreasing trends of the measured parameters are visible by observing the readouts in their entirety.
The readouts represented in Figure 3a are colored based on total soluble solids, the readouts in Figure 3b are colored based on pH, while the readouts in Figure 3c are colored based on titratable acidity. The progressive ripening trend determines the color variations in the samples, which are strictly related to the ripening evolution. Variations in green color occur; initially, it is very bright then it tends to turn gradually towards light green, almost yellow. The decreasing trend of the optical outputs is due to high reflectance values corresponding to the less ripe (and therefore greener) grapes; as the ripening progresses, the reflectance values of the samples tend to decrease [25]. Evidently, these effects are more noticeable in the visible region readouts (460–650 nm).

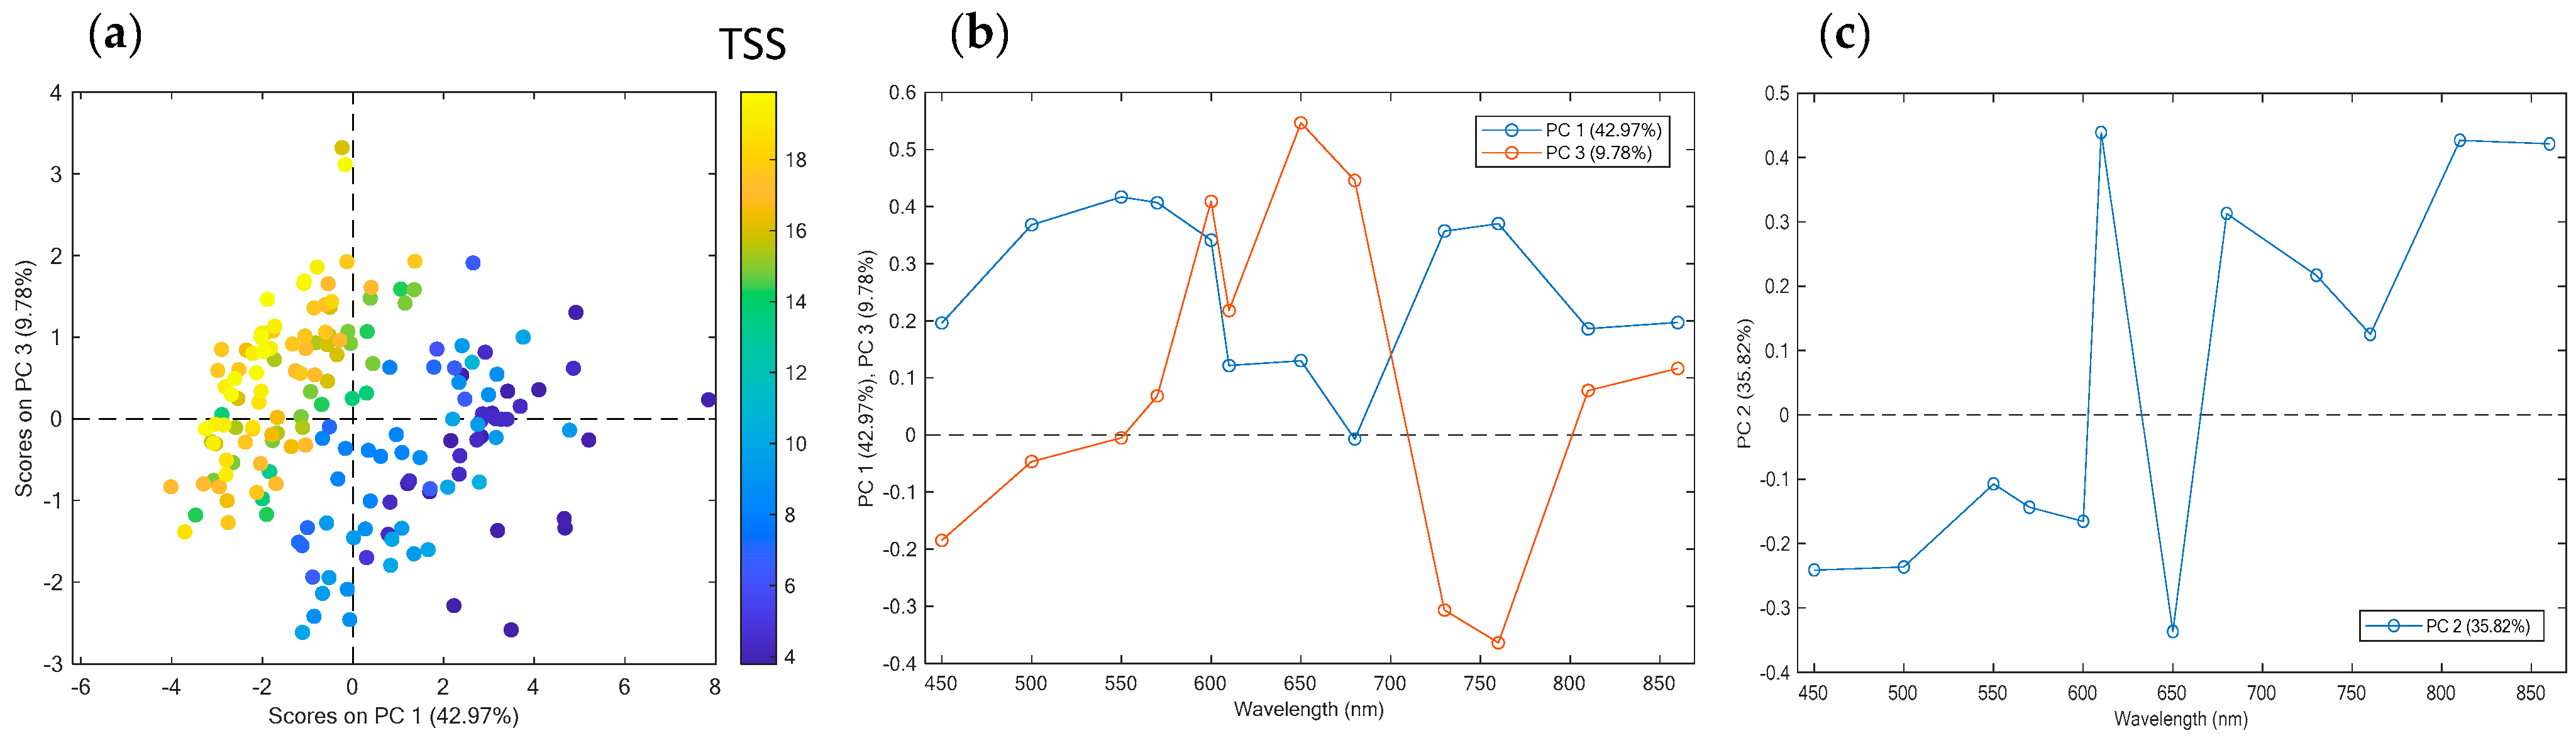
3.3. Principal Component Analysis

As already discussed in Section 2.4, principal component analysis constitutes a fundamental part of chemometric data processing. Figure 4a shows on the x axis the first principal component (PC1), which explains 42.97% of the variance and on the y axis, the third principal component (PC3), which explains 9.78% of the variance. In the orthogonal space defined by the two components (which account for about 53% of the original variance), a horizontal trend is evident along the PC1, which could be attributable to the maturation of the samples and the variations that occur in berries over the course of time, mainly evolution of skin pigmentation. The ripening trend is underlined by the labelling of the samples according to the content of soluble solids (TSS); from right to left, we observe the same trend also recognizable in the total readouts of the device.
Therefore, the interpretation of scores plot suggests that the main source of variability is the progress of maturation. To fully understand the results of the PCA, it is also necessary to observe the loadings plots, as reported in Figure 4b,c. The second principal component (PC2) seems to be attributable to the use of two different sensors. PC2 is positive for the wavelengths of the first sensor (450, 500, 550, 570, 600 and 650 nm) and negative for the wavelengths of the second sensor (610, 680, 730, 760, 810, and 860 nm). This principal component could explain the information related to the acquisition methodology of sensors operating in two different ranges of the electromagnetic spectrum, i.e., visible and NIR, respectively.

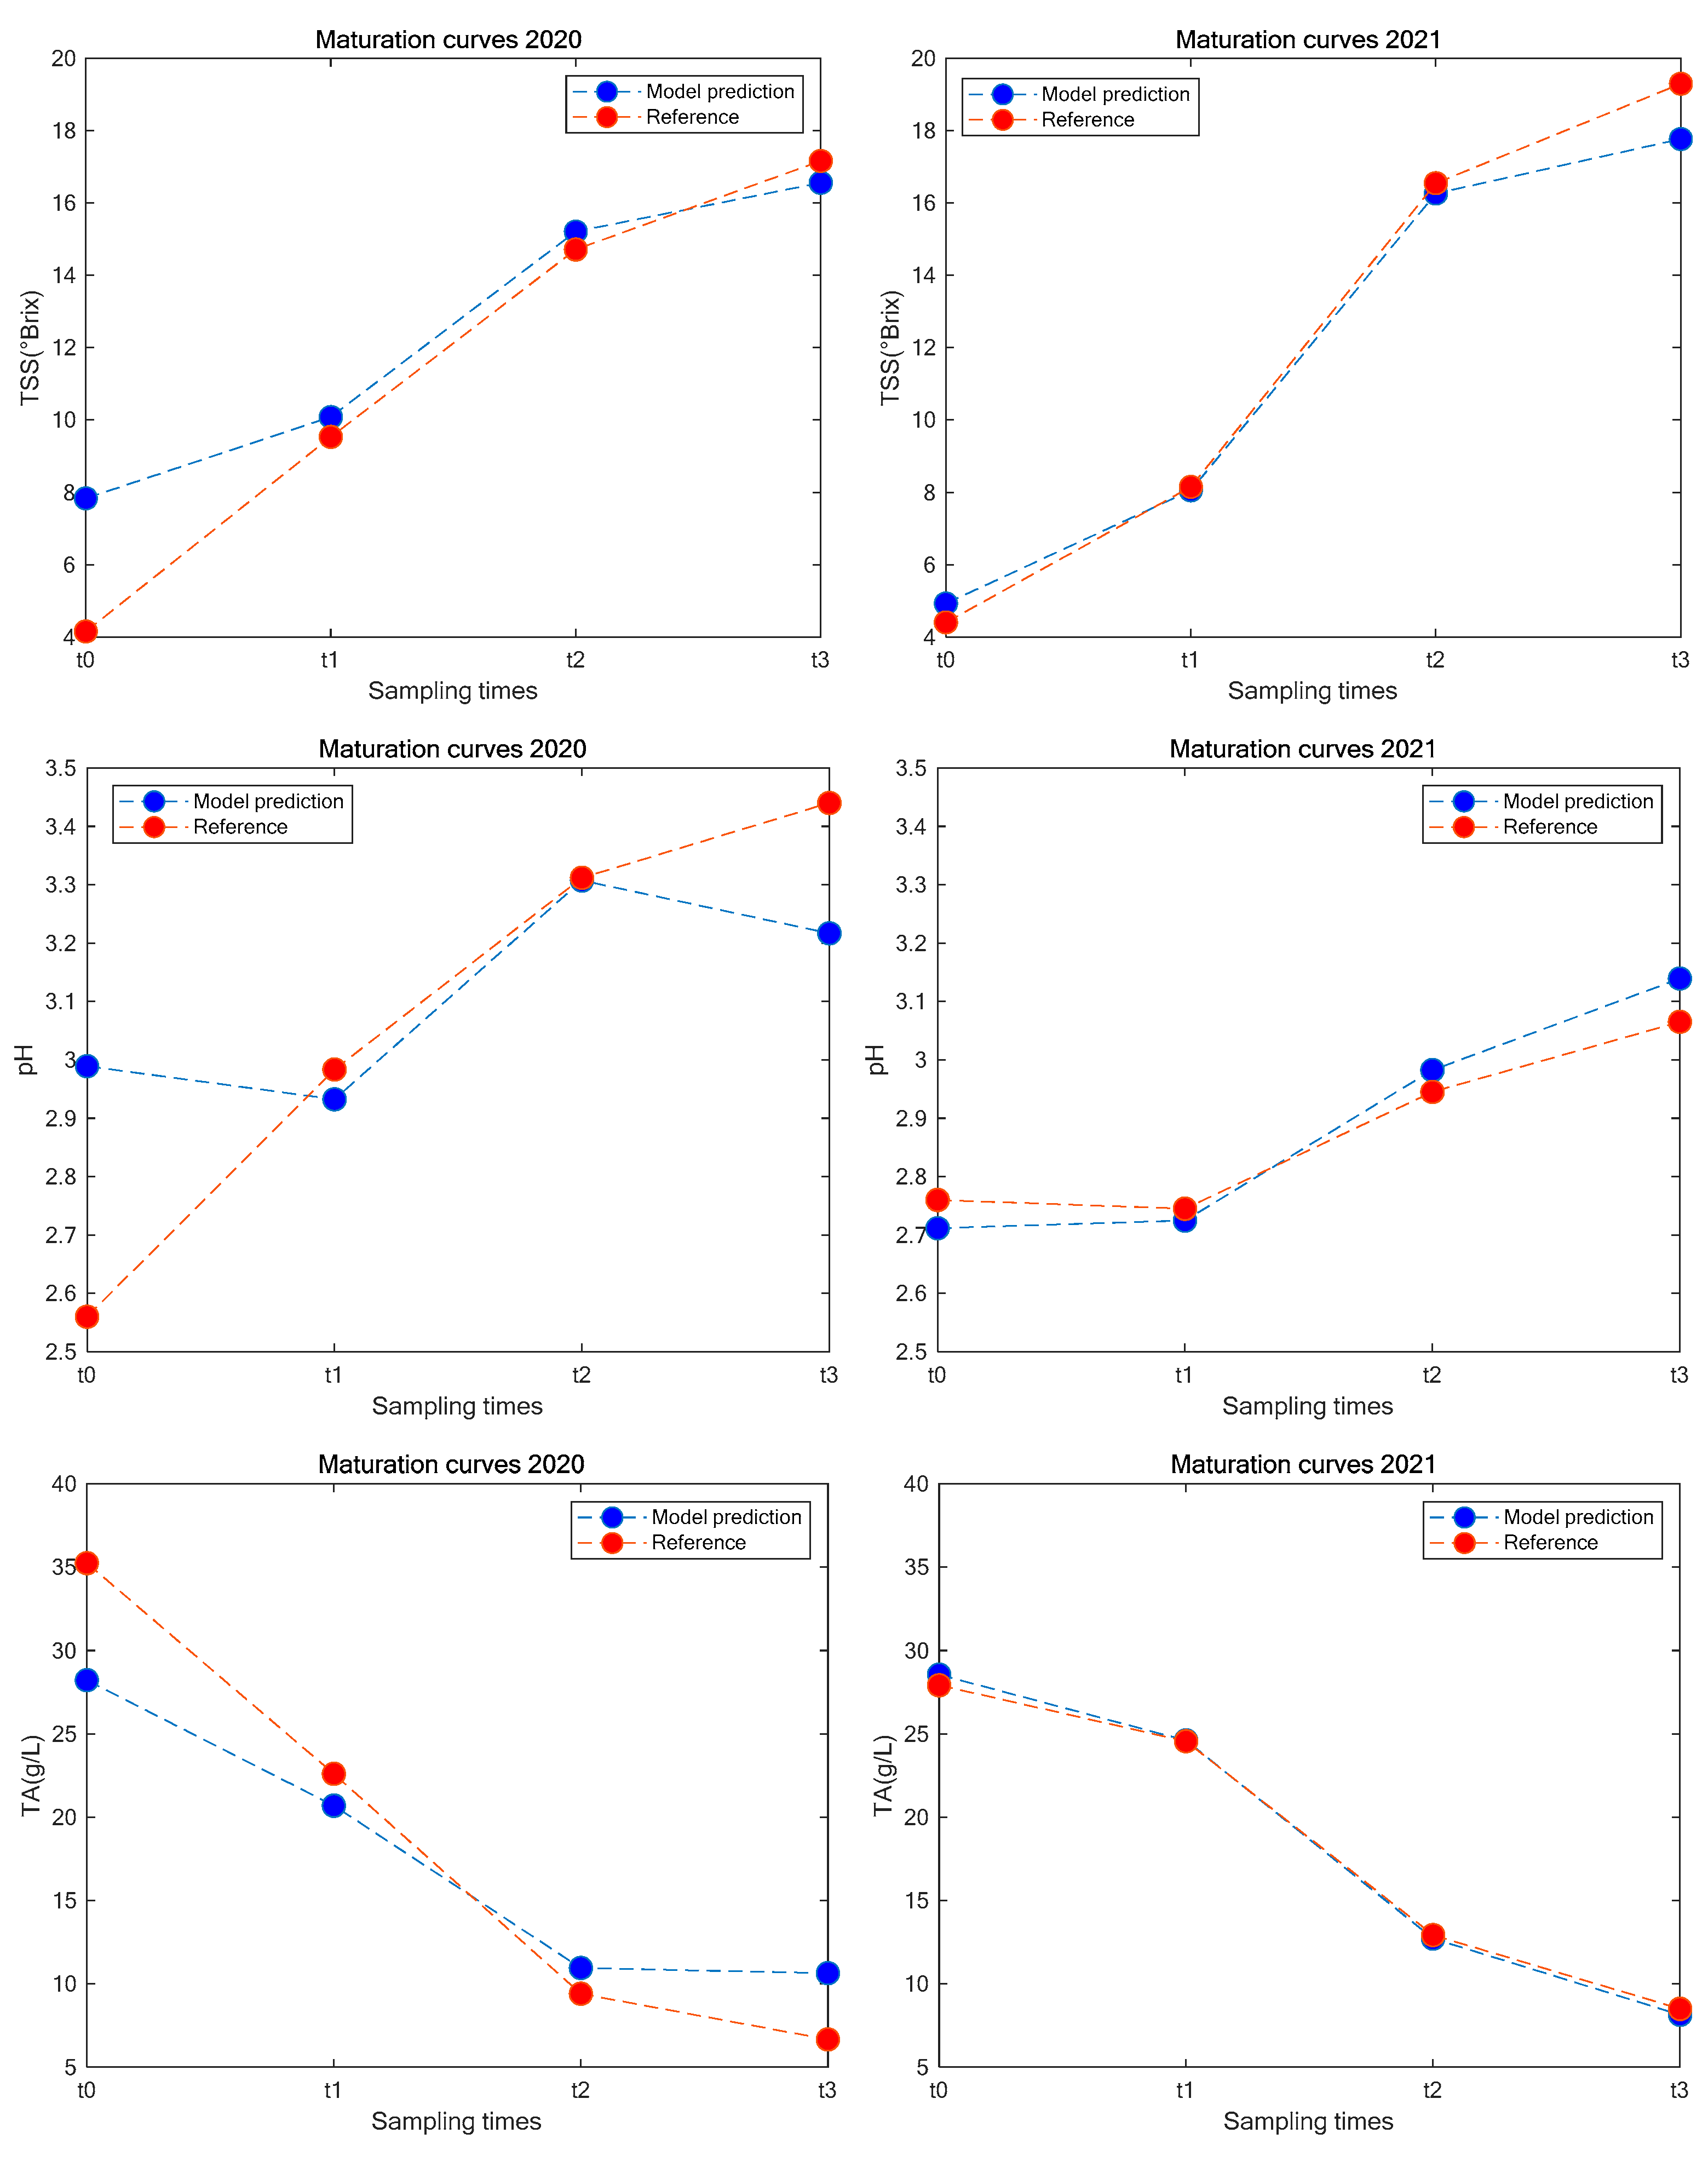
3.4. Predictive Models

The partial least square (PLS) regression method was used to build predictive models using 2020 and 2021 datasets together to try to better verify the predictive capability. The only pre-treatment that was performed on the data was autoscaling; by dividing the variables into their respective standard deviations, it is possible to give each variable the same importance by imposing equal weights in the analysis [26,27].
The prediction capability of the PLS models was verified by calculating the parameters to evaluate it, both in cross-validation and in prediction. Table 2 shows the figure of merit of the three predictive models built by considering two latent variables (LVs).
The most efficient model is the model for TSS prediction (R2 in cross-validation = 0.88 and in prediction = 0.87) and secondary, the model for TA prediction (R2 in cross-validation = 0.83 and in prediction = 0.80). The least performing model is the one built for the prediction of the pH with a R2 in cross-validation of 0.56 and in prediction of 0.62. Maturation curves, which represent the measured and predicted (through the use of PLS models) values for each qualitative parameter, were created. For the creation of the curves, the average values for each sampling date were calculated to be compared with the average values obtained using the device.
The maturation curves that represent the 2020 data show more evident differences between the reference values measured by wet-chem analyses (in red color) and the values predicted by the model (in blue color). The performance improvement of the models for the prediction of the three qualitative parameters is to be attributed to the innovative structure of the prototype, which, as already mentioned, has been modified with respect to the original device in pre-prototype form that did not have the two sensors integrated in a single instrument. The integration of the two sensors in a single hardware allowed for better performance in terms of efficiency of light transfer, both from the LED to the agri-food product and from the grapes to the photodiode, i.e., a better signal to noise ratio [28].
Table 3 shows the Student’s t-test results performed on the values used to build the maturation curves reported in Figure 5.
The test carried out a comparison between the values of the qualitative parameters measured in the laboratory (reference parameters) and the values predicted by the device, i.e., the values obtained from the PLS predictive models. The values were compared for each qualitative parameter and for both sampling years, and for each sampling time. The results demonstrated that the integrated version of the prototype (2021) provides more accurate quality parameters estimation than the pre-prototype version used in 2020 sampling. This phenomenon is highlighted by the non-significative differences (n.s.) in the 2021 comparisons, e.g., for TA and pH, no sampling time shows differences between the reference and predicted values.

4. Discussion

The sampling turned out to be representative; an improvement to obtain an even greater variability could be to carry out sampling at constant days apart to collect data with a more constant variability, in particular in the central week of August. With regard to the models’ predictive capabilities, further experiments are needed to test the device performance in real operative conditions, both on Chardonnay and on other cultivars. The low variability between dates and the high variability within dates in 2021 sampling, compared to 2020 data, could have led to a worst result in the application of predictive PLS models in the estimation of the three parameters (Figure 5) for the year 2021. Instead, the new and more efficient version of the prototype allowed for better performance in the application of the PLS model for 2021 sampling, as also confirmed by the Student’s t-test results reported in Table 3. The creation of predictive models will certainly help the development of simpler vis/NIR prototypes that can be applied directly in the field, making non-expert personnel able to estimate the quality of agri-food products in an objective, instant and more sustainable way.
This work has focused on the applicability of the optical and cost-effective prototype in the wine sector, to define the grape quality by better identifying the exact moment of ripening and obtaining high quality wine. The tested prototype could be easily applied to other small fruits, such as olives and blueberries (after an appropriate modelling phase), for qualitative characterization. Moreover, it could be used at different points of the supply chain, both in pre-harvest to define the best harvest period directly in the field, but also in post-harvest for fruit selection to create different quality classes, optimizing the production process and reducing waste. Moreover, optical devices have been recognized as a green technology capable of estimating quality parameters, producing a low environmental damage compared to traditional wet-chem analyses [12]. Applying smart devices, such as the prototype developed and tested in this work, would help the sector to obtain a sustainable supply chain from an environmental point of view and in line with the industry 4.0 approach [29].
In order to summarize the strengths, weaknesses, opportunities, and threats related to the application of the experimental outputs and concepts of this work in the agri-food sector, a SWOT table was created (Table 4).

5. Patents

Patent application PCT n. PCT/IB2022/051110 (8 February 2022) for Portable Device for Analysing Vegetable Matrices on the Field and Related System and Method.

Author Contributions

Conceptualization, A.P., A.T., V.G., A.C., R.G. and R.B.; methodology, A.P., A.T., V.G., A.C., C.P., L.B., R.G. and R.B.; software, A.P. and A.T.; validation, A.T. and R.B.; formal analysis, A.P., A.T., V.G., A.C. and C.P.; investigation, A.P., C.P. and L.B.; resources, A.P., A.C. and L.B.; data curation, A.P., A.T. and V.G.; writing—original draft preparation, A.P. and V.G.; writing—review and editing, A.T. and R.B.; visualization, A.T. and R.G.; supervision, V.G. and R.B.; project administration, L.B. and R.G.; funding acquisition, R.G. All authors have read and agreed to the published version of the manuscript.

Funding

This research was funded by Regione Lombardia 2018, ADAM project, grant number 4403.

Institutional Review Board Statement

Not applicable.

Informed Consent Statement

Not applicable.

Data Availability Statement

Not applicable.

Acknowledgments

The authors wish to thank Officina delle Soluzioni s.n.c., Magliano Alfieri, Cuneo, Italy, for the technical support and Claudio Gandolfi for the supervision of the research projects.

Conflicts of Interest

The authors declare no conflict of interest.

References

  1. De Araújo Gomes, A.; Azcarate, S.M.; Diniz, P.H.G.D.; de Sousa Fernandes, D.D.; Veras, G. Variable selection in the chemometric treatment of food data: A tutorial review. Food Chem. 2022, 370, 131072. [Google Scholar] [CrossRef] [PubMed]
  2. Giovenzana, V.; Tugnolo, A.; Casson, A.; Guidetti, R.; Beghi, R. Application of visible-near infrared spectroscopy to evaluate the quality of button mushrooms. J. Near Infrared Spectrosc. 2019, 27, 38–45. [Google Scholar] [CrossRef]
  3. Beghi, R.; Giovenzana, V.; Brancadoro, L.; Guidetti, R. Rapid evaluation of grape phytosanitary status directly at the check point station entering the winery by using visible/near infrared spectroscopy. J. Food Eng. 2017, 204, 46–54. [Google Scholar] [CrossRef]
  4. Nicolaï, B.M.; Defraeye, T.; De Ketelaere, B.; Herremans, E.; Hertog, M.L.; Saeys, W.; Torricelli, A.; Vandendriessche, T.; Verboven, P. Nondestructive measurement of fruit and vegetable quality. Annu. Rev. Food Sci. Technol. 2014, 5, 285–312. [Google Scholar] [CrossRef] [PubMed] [Green Version]
  5. Kemps, B.; Leon, L.; Best, S.; De Baerdemaeker, J.; De Ketelaere, B. Assessment of the quality parameters in grapes using VIS/NIR spectroscopy. Biosyst. Eng. 2010, 105, 507–513. [Google Scholar] [CrossRef]
  6. Guidetti, R.; Beghi, R.; Bodria, L. Evaluation of grape quality parameters by a simple Vis/NIR system. Trans. ASABE 2010, 53, 477–484. [Google Scholar] [CrossRef]
  7. González-Caballero, V.; Sánchez, M.T.; Fernández-Novales, J.; López, M.I.; Pérez-Marín, D. On-vine monitoring of grape ripening using near-infrared spectroscopy. Food Anal. Methods 2012, 5, 1377–1385. [Google Scholar] [CrossRef]
  8. Giovenzana, V.; Civelli, R.; Beghi, R.; Oberti, R.; Guidetti, R. Testing of a simplified LED based vis/NIR system for rapid ripeness evaluation of white grape (Vitis vinifera L.) for Franciacorta wine. Talanta 2015, 144, 584–591. [Google Scholar] [CrossRef]
  9. Dos Santos Costa, D.; Mesa, N.F.O.; Freire, M.S.; Ramos, R.P.; Mederos, B.J.T. Development of predictive models for quality and maturation stage attributes of wine grapes using vis-nir reflectance spectroscopy. Postharvest Biol. Technol. 2019, 150, 166–178. [Google Scholar] [CrossRef]
  10. Power, A.; Truong, V.K.; Chapman, J.; Cozzolino, D. From the Laboratory to The Vineyard—Evolution of The Measurement of Grape Composition using NIR Spectroscopy towards High-Throughput Analysis. High-Throughput 2019, 8, 21. [Google Scholar] [CrossRef] [Green Version]
  11. Vallone, M.; Alleri, M.; Bono, F.; Catania, P. Quality evaluation of grapes for mechanical harvest using vis NIR spectroscopy. Int. J. Agric. Eng. 2019, 21, 140–149. [Google Scholar]
  12. Casson, A.; Beghi, R.; Giovenzana, V.; Fiorindo, I.; Tugnolo, A.; Guidetti, R. Environmental advantages of visible and near infrared spectroscopy for the prediction of intact olive ripeness. Biosyst. Eng. 2020, 189, 1–10. [Google Scholar] [CrossRef]
  13. Tugnolo, A.; Giovenzana, V.; Beghi, R.; Grassi, S.; Alamprese, C.; Casson, A.; Casiraghi, E.; Guidetti, R. A diagnostic visible/near infrared tool for a fully automated olive ripeness evaluation in a view of a simplified optical system. Comput. Electron. Agric. 2021, 180, 105887. [Google Scholar] [CrossRef]
  14. Nagpala, E.G.L.; Noferini, M.; Farneti, B.; Piccinini, L.; Costa, G. Cherry-Meter: An innovative non-destructive (vis/NIR) device for cherry fruit ripening and quality assessment. Acta Hortic. 2017, 1161, 491–496. [Google Scholar] [CrossRef]
  15. Ribera-Fonseca, A.; Noferini, M.; Jorquera-Fontena, E.; Rombolà, A.D. Assessment of technological maturity parameters and anthocyanins in berries of cv. Sangiovese (Vitis vinifera L.) by a portable vis/NIR device. Sci. Hortic. 2016, 209, 229–235. [Google Scholar] [CrossRef]
  16. Yang, B.; Guo, W.; Li, W.; Li, Q.; Liu, D.; Zhu, X. Portable, visual, and nondestructive detector integrating Vis/NIR spectrometer for sugar content of kiwifruits. J. Food Process Eng. 2019, 42, e12982. [Google Scholar] [CrossRef]
  17. Fan, S.; Wang, Q.; Tian, X.; Yang, G.; Xia, Y.; Li, J.; Huang, W. Non-destructive evaluation of soluble solids content of apples using a developed portable Vis/NIR device. Biosyst. Eng. 2020, 193, 138–148. [Google Scholar] [CrossRef]
  18. Shah, S.S.A.; Zeb, A.; Qureshi, W.S.; Arslan, M.; Malik, A.U.; Alasmary, W.; Alanazi, E. Towards fruit maturity estimation using NIR spectroscopy. Infrared Phys. Technol. 2020, 111, 103479. [Google Scholar] [CrossRef]
  19. Biancolillo, A.; Marini, F. Chemometric methods for spectroscopy-based pharmaceutical analysis. Front. Chem. 2018, 6, 576. [Google Scholar] [CrossRef]
  20. Courand, A.; Metz, M.; Héran, D.; Feilhes, C.; Prezman, F.; Serrano, E.; Bendoula, R.; Ryckewaert, M. Evaluation of a robust regression method (RoBoost-PLSR) to predict biochemical variables for agronomic applications: Case study of grape berry maturity monitoring. Chemom. Intell. Lab. Syst. 2022, 221, 104485. [Google Scholar] [CrossRef]
  21. Wold, S.; Sjöström, M.; Eriksson, L. PLS-regression: A basic tool of chemometrics. Chemom. Intell. Lab. Syst. 2001, 58, 109–130. [Google Scholar] [CrossRef]
  22. Pampuri, A.; Tugnolo, A.; Giovenzana, V.; Casson, A.; Guidetti, R.; Beghi, R. Design of cost-effective LED based prototypes for the evaluation of grape (Vitis vinifera L.) ripeness. Comput. Electron. Agric. 2021, 189, 106381. [Google Scholar] [CrossRef]
  23. Nicolai, B.M.; Beullens, K.; Bobelyn, E.; Peirs, A.; Saeys, W.; Theron, K.I.; Lammertyn, J. Nondestructive measurement of fruit and vegetable quality by means of NIR spectroscopy: A review. Postharvest Biol. Technol. 2007, 46, 99–118. [Google Scholar] [CrossRef]
  24. Costa, C.; Graça, A.; Fontes, N.; Teixeira, M.; Gerós, H.; Santos, J.A. The interplay between atmospheric conditions and grape berry quality parameters in Portugal. Appl. Sci. 2020, 10, 4943. [Google Scholar] [CrossRef]
  25. Rustioni, L.; Fracassetti, D.; Prinsi, B.; Geuna, F.; Ancelotti, A.; Fauda, V.; Tirelli, A.; Espen, L.; Failla, O. Oxidations in white grape (Vitis vinifera L.) skins: Comparison between ripening process and photooxidative sunburn symptoms. Plant Physiol. Biochem. 2020, 150, 270–278. [Google Scholar] [CrossRef] [PubMed]
  26. Marini, F.; de Beer, D.; Walters, N.A.; de Villiers, A.; Joubert, E.; Walczak, B. Multivariate analysis of variance of designed chromatographic data. A case study involving fermentation of rooibos tea. J. Chromatogr. A 2017, 1489, 115–125. [Google Scholar] [CrossRef]
  27. Tugnolo, A.; Beghi, R.; Giovenzana, V.; Guidetti, R. Characterization of green, roasted beans, and ground coffee using near infrared spectroscopy: A comparison of two devices. J. Near Infrared Spectrosc. 2019, 27, 93–104. [Google Scholar] [CrossRef]
  28. Civelli, R.; Giovenzana, V.; Beghi, R.; Naldi, E.; Guidetti, R.; Oberti, R. A simplified, light emitting diode (LED) based, modular system to be used for the rapid evaluation of fruit and vegetable quality: Development and validation on dye solutions. Sensors 2015, 15, 22705–22723. [Google Scholar] [CrossRef] [Green Version]
  29. Hassoun, A.; Aït-Kaddour, A.; Abu-Mahfouz, A.M.; Rathod, N.B.; Bader, F.; Barba, F.; Biancolillo, A.; Cropotova, J.; Galanakisk, C.M.; Jambrak, A.R.; et al. The fourth industrial revolution in the food industry—Part I: Industry 4.0 technologies. Crit. Rev. Food Sci. Nutr. 2022, 62, 1–17. [Google Scholar] [CrossRef]
Figure 1. (a) Prototype clamp wrapping the sample; (b) prototype layout.
Applsci 12 04853 g001
Figure 2. Box plots reporting descriptive statistics of reference parameters (TSS, pH, TA) in 2020 (a) and 2021 (b).
Applsci 12 04853 g002
Figure 3. Total readouts of four sampling dates of both sampling years, labelled according to the reference parameters: TSS (a), pH (b) and TA (c).
Applsci 12 04853 g003
Figure 4. (a) Scores plot of PC1 and PC3, labelled according to TSS content and relative loadings plot; (b,c) loadings plot of PC2.
Applsci 12 04853 g004
Figure 5. Maturation curves of the two harvest years (2020 and 2021) of the three qualitative parameters: in blue, the average values predicted by the models and in red, the average values measured by wet-chem analyses.
Applsci 12 04853 g005
Table 1. Device wavelengths.
Wavelengths (nm)
Sensor 1450500550570600650
Sensor 2610680730760810860
Table 2. Figure of merit of the partial least square (PLS) models calculated with two latent variables, using optical data pretreated with autoscaling.
ParameterLVsTreatmentSD *R2CVRMSECVR2PredRMSEPRPD
TSS2autoscaling5.350.881.840.871.902.81
pH2autoscaling0.260.560.180.620.141.85
TA2autoscaling8.850.833.590.803.942.25
* SD = standard deviation of reference parameters; R2CV = coefficient of determination in cross-validation; RMSECV = root mean square error of cross-validation; R2Pred = coefficient of determination in prediction; RMSEP = root mean square error in prediction.
Table 3. Student′s t-test performed between refence and predicted data for each sampling time (t0-t3) and for each year considered (2020 and 2021).
TimeTSSTApH
202020212020202120202021
t0******n.s.***n.s.
t1n.s.n.s.*n.s.n.s.n.s.
t2n.s.n.s.*n.s.n.s.n.s.
t3*********n.s.***n.s.
n.s. = difference not significative at p < 0.05; * = difference significative at p < 0.05; ** = difference significative at p < 0.01; *** = difference significative at p < 0.001.
Table 4. Strengths, weaknesses, opportunities, and threats related to the application of the experimental outputs and concepts of this work in the agri-food sector.
InternalStrengthsWeaknesses
Selection of vis/NIR bands easily available on the market
Real-time monitoring quality parameters of agri-food products in an objective way, directly in field or in post-harvest conditions
Cost-effective smart device
Remote control devices
Need to control environmental conditions during optical acquisitions
High variability of agri-food quality parameters
Research efforts to optimize quality parameters estimation using smart devices
ExternalOpportunitiesThreats
Optimization of agri-food chains
Better management of agri-food products
Waste reduction
Lower environmental impact of agri-food chains
Suitable also for SME
Strong link with traditional methods by operators
Reduced orientation towards innovation by operators, still managed by old generation
Publisher’s Note: MDPI stays neutral with regard to jurisdictional claims in published maps and institutional affiliations.

