
Fusing Local and Global Information for One-Step Multi-View Subspace Clustering


1
Department of Electrical Engineering, School of Automation, Guangdong University of Technology, Guangzhou 510006, China
2
Brunel Interdisciplinary Power Systems Research Centre, Department of Electronic and Electrical Engineering, Brunel University London, London UB8 3PH, UK
*
Authors to whom correspondence should be addressed.
Appl. Sci. 2022, 12(10), 5094; https://0-doi-org.brum.beds.ac.uk/10.3390/app12105094
Submission received: 21 March 2022
/
Revised: 4 May 2022
/
Accepted: 17 May 2022
/
Published: 18 May 2022
(This article belongs to the Special Issue Electrification of Smart Cities)
Abstract
:Multi-view subspace clustering has drawn significant attention in the pattern recognition and machine learning research community. However, most of the existing multi-view subspace clustering methods are still limited in two aspects. (1) The subspace representation yielded by the self-expression reconstruction model ignores the local structure information of the data. (2) The construction of subspace representation and clustering are used as two individual procedures, which ignores their interactions. To address these problems, we propose a novel multi-view subspace clustering method fusing local and global information for one-step multi-view clustering. Our contribution lies in three aspects. First, we merge the graph learning into the self-expression model to explore the local structure information for constructing the specific subspace representations of different views. Second, we consider the multi-view information fusion by integrating these specific subspace representations into one common subspace representation. Third, we combine the subspace representation learning, multi-view information fusion, and clustering into a joint optimization model to realize the one-step clustering. We also develop an effective optimization algorithm to solve the proposed method. Comprehensive experimental results on nine popular multi-view data sets confirm the effectiveness and superiority of the proposed method by comparing it with many state-of-the-art multi-view clustering methods.
1. Introduction
Clustering is a fundamental unsupervised learning problem that is widely used in the tasks of machine learning [1], computer vision [2], and data mining [3]. It attempts to help to understand the structure of unlabeled data by dividing the entire unlabeled samples into clusters, where the samples in the same cluster are not similar to samples in the other clusters [4,5,6].
With the continuous development of information technology, different features of the object can be easily acquired by different feature extractors, data sources or sensors. For example, an image can be depicted by the color, texture, and edge features. A news report is usually composed of text descriptions and pictures. In the field of autonomous driving, an obstacle can be captured by different types of sensors. These different features can be viewed as multi-view data. Since each view commonly contains view-specific information about the object, using only one view for clustering may yield poor results [7]. Therefore, it is reasonable and appropriate to fuse different views for clustering. It is known that multiple views come from the same object. Hence, multi-view data contain not only the consistency but also the diversity across views. How to reasonably utilize the consistency and diversity to find the underlying clustering structure of multi-view data has become an important research topic .
To deal with the multi-view data, a natural idea is to concatenate these different feature vectors into a new vector and then adopt some existing single-view clustering methods to group the multi-view data. Although this idea is intuitive and simple to deal with multi-view data, it ignores the consistency and complementary information across these views. To address this problem, lots of multi-view clustering methods have been developed to obtain the good clustering performance. For background reading, the reader can refer to the surveys on multi-view clustering [8,9,10]. In this paper, we mainly focus on the multi-view subspace clustering, which has received extensive attention due to its advanced clustering performance and good mathematical interpretability.
Multi-view subspace clustering attempts to construct an ideal subspace representation to describe the multiple linear subspace structure, and the clustering results are then obtained by utilizing the spectral clustering for this obtained subspace representation. The mechanism for computing the subspace representation is based on the self-expressive reconstruction model, where each sample is reconstructed by entire samples. Hence, subspace representation yielded by the self-expressive reconstruction model can exploit the global information but may ignore the local information of multi-view data. Nevertheless, exploring the local structure has been confirmed to improve the learning performance [11]. Moreover, most multi-view subspace clustering methods divide the learning subspace representation and clustering into two individual procedures, which ignores their communications.
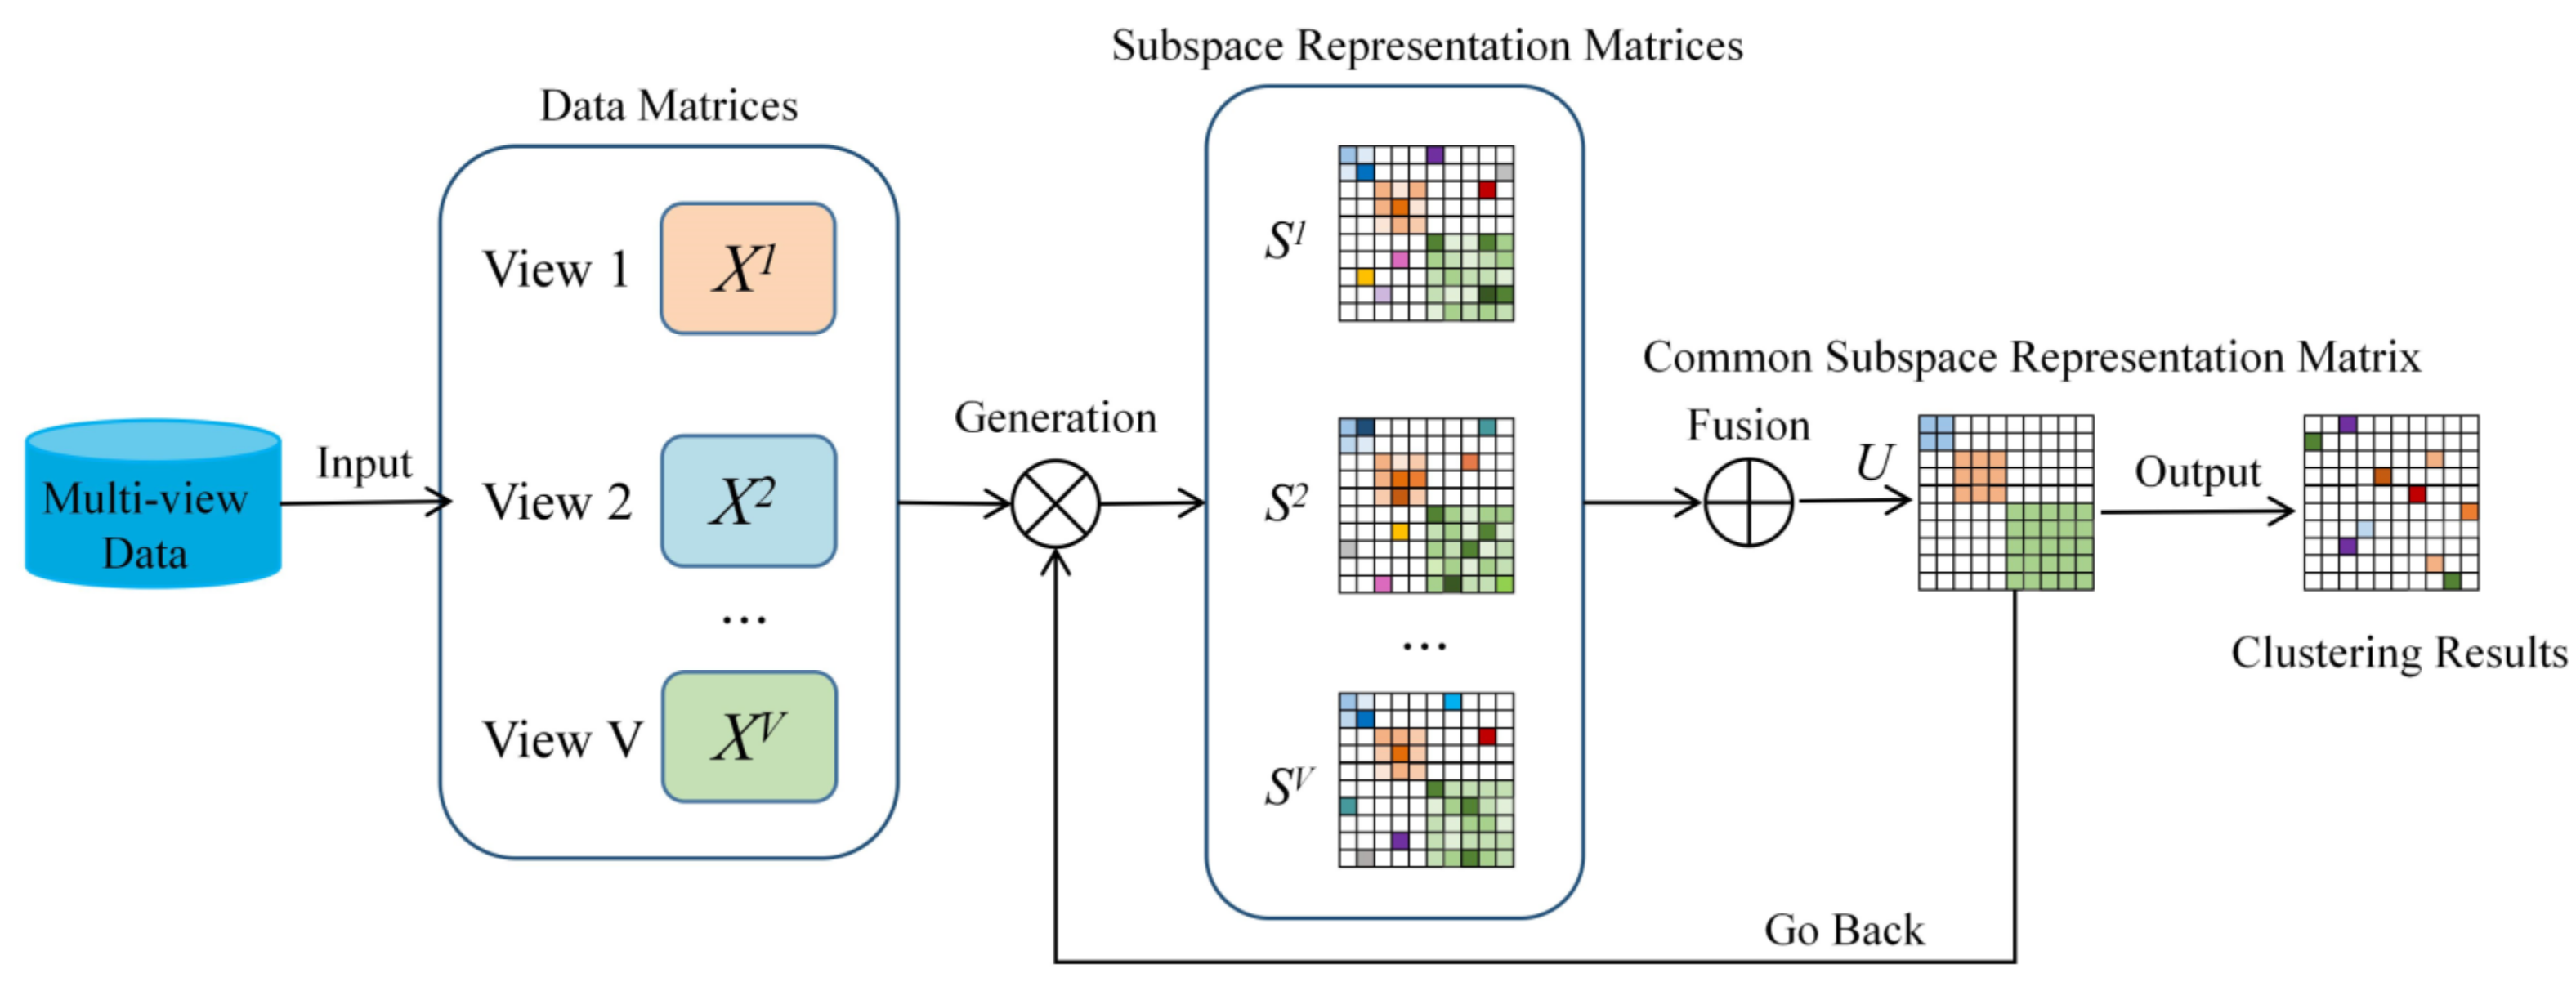
To address the above-mentioned issues, in this paper, we propose a novel subspace clustering method fusing local and global information for one-step multi-view subspace clustering (LGOMSC). The proposed method combines the procedures of constructing subspace representation, multi-view information fusion, and clustering into a unified optimization framework. In this framework, as shown in Figure 1, to exploit the local and global information of multi-view data, we integrate graph learning into the self-expressive reconstruction model by adaptively exploring the local structure information for the construction of subspace representation. To capture latent consistency information across views, the proposed method adopts a multi-view information fusion to learn the common subspace representation from these specific subspace representations of different views. Meanwhile, in graph learning, a rank constraint is applied to the Laplacian matrix yielded by the common subspace representation to directly produce the clustering result. Therefore, the proposed method is a one-step multi-view subspace clustering method. The main contributions of the work are summarized as follows:
- A novel one-step multi-view subspace clustering method is proposed, which fuses the subspace representation (exploring local and global information), multi-view information fusion (constructing a common subspace representation by fusing different view-specific subspace representations), and clustering (imposing rank constraint on the Laplacian matrix from the common subspace representation) as a unified optimization framework to realize the end-to-end clustering.
- We develop an effective optimization algorithm to solve the proposed method. Comprehensive experiments on nine popular multi-view data sets confirm the effectiveness and superiority of the proposed method by comparing it with some state-of-the-art multi-view clustering methods.

The rest of this paper is organized as follows. In Section 2, we review the related works. In Section 3, we introduce the formulation of the proposed LGOMSC method. In Section 4, we provide the optimization algorithm to solve the proposed LGOMSC method, including the analysis of the convergence and computation complexity. In Section 5, we conduct the experiments on nine popular multi-view data sets and analyze the experimental results. Finally, we provide the conclusion in Section 6.
2. Related Work
Multi-view clustering is a very powerful data analysis tools for unsupervised learning of data with heterogeneous features. In the past two decades, many multi-view clustering methods have been proposed to achieve robust clustering performance. In the following, we will briefly introduce several multi-view clustering methods from different perspectives.
Subspace-based methods have recently become the mainstay of multi-view clustering research, aiming to discover potential subspace structures across different views. For example, Gao et al. [12] propose a multi-view subspace clustering method that utilizes a common cluster structure to exploit the consistency information across multiple views. Cao et al. [13] propose a diversity-induced multi-view subspace clustering method that adopts the Hilbert–Schmidt independence criterion as the diversity term to explore the complementary information of multi-view data. Luo et al. [14] propose a multi-view subspace clustering method that simultaneously considers the consistency and specificity for learning the subspace representation. Wang et al. [15] propose a multi-view subspace clustering method that considers the complementarity of multi-view data by adopting a position-aware exclusivity term. Guo et al. [16] propose a rank consistency induced multi-view subspace clustering model that learns a consistent subspace structure. Brbić and Kopriva [17] propose a multi-view subspace clustering method that adopts an agreement term to ensure the consistency among these subspace representations. To capture the high-order correlations underlying multi-view data, the tensor technique is adopted to exploit the complementary information among different views. For example, Zhang et al. [18] propose a low-rank tensor constrained multi-view subspace clustering model that adopts a low-rank tensor constraint for the obtained subspace representations. Xie et al. [19] utilize the subspace representations of multiple views as a tensor data and then utilize the tensor-singular value decomposition on the rotated tensor to guarantee the consensus among different views. Zhang et al. [20] propose a tensorized multi-view subspace representation learning that adopts a low-rank constraint model for the subspace representation tensor. Yin et al. [21] propose a multi-view subspace clustering model by organizing the multi-view data as tensorial data, and the tensorial data can be represented by a t-linear combination with sparse and low-rank penalty. Recently, researchers considered partition-level multi-view information fusion and proposed a partition-based clustering model to construct joint optimization of multi-view subspace clustering. For example, Kang et al. [22] propose a unified multi-view subspace clustering model that implements the graph construction, the generation of basic partitions, and the fusion of consensus clustering in an interactive way. Lv et al. [23] propose a partition fusion-based multi-view subspace clustering method that utilizes the different partitions to find a shared partition. Zhang et al. [24] develop a consensus one-step multi-view subspace clustering method that fuses the subspace representation learning, partition learning, and clustering into a whole to iteratively optimize. Kang et al. [25] propose to integrate multi-view information in the partition space and obtain clustering results by assigning each partition with a respective rotation matrix. Furthermore, each view is assigned a weight to consider the differences in the clustering capacity of the views. The anchor-based model is proposed to fit for the large-scale multi-view data. Kang et al. [26] propose a large-scale multi-view subspace clustering method by integrating the anchor graphs from different views for spectral clustering. Wang et al. [27] propose a fast parameter-free multi-view subspace clustering by adaptively learning the anchors and graph structure. Sun et al. [28] propose to combine anchor learning and graph construction into a unified optimization framework, allowing the learned anchors to represent the actual latent data distribution more accurately, leading to a more discriminative clustering structure.
Matrix factorization-based methods refer to obtaining consistent latent representations through matrix factorization. Specifically, a given data matrix can be represented by the product of two or more low-dimensional matrices. Liu et al. [29] extended the traditional single-view non-negative matrix factorization algorithm to multi-view application scenarios and proposed a multi-view clustering algorithm based on non-negative matrix factorization. Guo et al. [30] propose to exploit group sparsity inducing norm in a matrix factorization framework to learn shared sparse subspace representations. Recently, Wang et al. [31] proposed a diversity non-negative matrix factorization multi-view clustering method by introducing a new diversity term to increase the diversity among multi-view representations and linearize the running time. Nie et al. [32] propose a new joint clustering method named Fast Multi-view Matrix Tri-Factorization to reduce the information loss in the matrix factorization process, while reducing the computational complexity and improving the operational efficiency. Liu et al. [33] propose a novel multi-view matrix factorization-based clustering method, which proposes to consider the higher-order relationships among features using an optimal graph regularization strategy and introduces the Hilbert–Schmidt independence criterion (HSIC) to fully explore the complementary information in different views. In addition, researchers have extended matrix factorization from the perspective of intact space learning [34]. For example, Zhang et al. [35] propose a latent multi-view subspace clustering that utilizes the latent representation for subspace clustering. Li et al. [36] propose a flexible multi-view representation learning that utilizes the kernel dependence measure to obtain a latent representation from different views for subspace clustering. Xie et al. [37] propose a multi-view subspace clustering method that fuses graph learning, latent representation, and clustering into a unified optimization framework.
Graph-based methods provides an effective way to solve the nonlinearly separated problems. For example, Tang et al. [38] propose a fusion process using linked matrix factorization to fuse the graph matrices corresponding to all views with multiple sources of information. Nie et al. [39] propose a multi-view graph clustering method based on the idea of manifold learning that can perform local structure learning and multi-view clustering at the same time and can also adaptively learn the weights corresponding to each view. Meanwhile, Nie et al. [40] propose an automatic weighting method to fuse a series of view-specific low-quality graphs into a high-quality unified graph, while extending the Laplacian rank approach to multi-view learning. Similarly, Zhan et al. [41] further design a notable clustering method based on twostep multiple graph fusion strategy. Recently, Zhan et al. [42] proposed a method to learn a consensus graph matrix by all views by minimizing disagreement between different views and constraining the rank of the Laplacian matrix. Wang et al. [43] propose another graph-based multi-view clustering method that automatically fuses multiple graph matrices to generate a unified graph matrix. The learned unified graph matrix can help the graph matrices of all views and gives the clustering indicator matrix. Recently, Zhao et al. [44] proposed to minimize the divergence between graphs using tensor Schatten p-norm regularization and integrate the tensor Schatten p-norm regularization and the manifold learning regularization into a unified framework to learn a shared common graph.
Although most of existing multi-view subspace clustering methods have achieved good clustering performance, they still have some limitations. First, the subspace representation generated by the self-expression reconstruction model usually ignores the local structure of the data set. Second, most multi-view subspace clustering methods usually divide the subspace representation learning process and the subsequent clustering task into two separate processes, ignoring the interactions between them. To address these issues, in this paper we propose an LGOMSC method that considers adding graph learning to explore local information adaptively for obtaining subspace representations. Moreover, LGOMSC performs multi-view information fusion directly on the subspace representation and introduces rank constraints on the Laplacian matrix of the common subspace representation matrix, which helps to naturally partition the data points into the desired number of clusters. Our approach integrates similarity learning, multi-view information fusion and clustering as a unified framework to achieve multi-view clustering in an end-to-end manner.
Duan et al. [45] propose a multi-view subspace clustering (MVSCLG) that also utilizes the local and global information to achieve the end-to-end clustering. The main differences between MVSCLG and LGOMSC include: (1) to explore the consistency between different views, MVSCLG adopts the spectral matrix fusion, but LGOMSC adopts the graph matrix fusion; (2) to achieve end-to-end clustering, MVSCLG adopts a rotation matrix to map the common spectral matrix to the final cluster label matrix, but LGOMSC adopts a rank constraint on the common Laplacian matrix to directly achieve clustering. Moreover, compared with MVSCLG, LGOMSC has some advantages. Firstly, MVSCLG involves many singular value decomposition procedures and contains many variables, which leads to longer running times and more memory usage than LGOMSC. Secondly, LGOMSC contains fewer hyperparameters than MVSCLG, which is more suitable for practical applications.
3. Proposed Method
3.1. Notations
For convenience, we list important mathematic notations that are used throughout the paper in Table 1. Matrices are represented in bold uppercase, while vectors are represented in bold lowercase.
3.2. Formulation
In this section, we provide the detailed modeling process of the proposed LGOMSC method. For a multi-view data set with V views, let be the data matrices of the V views and be the v-th view data, where is the dimensionality of the v-th view, and n is the number of data points. Since each view contains view-specific information about the object, we respectively compute the view-specific subspace representation of each view to capture the diversity across views. The objective function of the self-expression model for the multi-view data can be formulated as:
where is the subspace representation matrix of the v-th view, is the j-th element of , denotes a column vector with all entries of one, denotes a vector of the diagonal elements of a matrix.
Since Model (1) adopts the entire data set to linearly reconstruct each data sample, the subspace representation matrix captures the global information of the v-th view data. However, this subspace representation obtained by Model (1) ignores the local structure to construct the subspace representations. In other words, two closed data samples should have similar subspace representations. Hence, to exploit the local information of multi-view data, we integrate the graph learning into Model (1) to compute the subspace representation. Hence, the objection function can be formulated as:
Since multi-view data come from the same object, they should have latent consistency. To characterize this consistency, we adopt a multi-view information fusion term to obtain a common subspace representation matrix from the subspace representation matrices . This term can be represented as:
Through minimizing Model (3), this common subspace representation matrix can make these the subspace representation matrices to have latent consistency. Hence, we add this multi-view information fusion term into Model (2) as:
After obtaining the common subspace structure, we can get the affinity matrix and perform spectral clustering on such a subspace affinity matrix. However, the constructions of subspace representation and clustering are divided into two individual procedures, which ignore their interactions. To address this problem, we consider introducing a rank constraint [46] on the Laplacian matrix , where the degree matrix D is defined as a diagonal matrix whose i-th diagonal element is . If the common subspace representation matrix is non-negative, then the Laplacian matrix has the following theorem.
Theorem 1.
The number of connected components in the graph withis equal to the multiplicity of zero eigenvalue of the Laplacian matrix [47].
According to Theorem 1, we consider making the number of zero eigenvalues of the Laplacian matrix to be equal to the number of clustering clusters, i.e., . By adding the rank constraint into Model (4), the common subspace representation matrix will have the ideal property. Therefore, we can directly obtain the cluster result from without discretization.
However, it is difficult to directly solve the rank constraint . It is known that is equivalent to , where denotes the i-th smallest eigenvalues of . Since is positive semi-definite, . According to Ky Fan’s Theorem [48], . Therefore, to hold , the objective function of the proposed LGOMSC is formulated as:
where is a parameter, is the embedding matrix, and denotes the identity matrix.
In Model (5), when is large enough, the obtained common subspace representation makes zero. Hence, is satisfied. To effectively accelerate the optimization procedure, we determine the value of in a heuristic way. Moreover, in Model (5), we integrate subspace representation learning, multi-view information fusion, and clustering into a unified framework. The aim is to exploit the internal relationships of the three procedures to obtain a good clustering performance.
4. Optimization
There are several variables and constraints in the proposed method. To effectively solve these variables from LGOMSC, we developed an alternate optimization algorithm.
4.1. Update
When and are fixed, the objective function about becomes:
In this paper, we adopt a two-step approximation strategy [25] to optimize .
Firstly, we ignore the constraints in Model (6) to solve as:
Through making the derivative of Model (7) of as zero, we have:
where is the ij-th element of and denotes the identity matrix.
Secondly, through adding the constraints of , the solution of can be obtained by:
Model (9) is a constrained quadratic optimization problem, which can be effectively solved by the iterative algorithm in the work [49].
4.2. Update
When and are fixed, the objective function about is represented as:
where is a column vector, is the j-th element of .
Noting that , we denote be a vector with the j-th element . Through simple mathematical derivation, problem (10) can be rewritten as follows:
We define , we can obtain:
Model (12) is effectively optimized by an iterative algorithm referring to the work [50].
4.3. Update
When and are fixed, the objective function about is represented as:
The optimal solution yielded by Model (13) is formed by the eigenvectors of corresponding to the smallest eigenvalues. Finally, the procedure for optimizing Model (5) is described in Algorithm 1.
4.4. Convergence Analysis
In this paper, we adopt an alternate updating algorithm (Algorithm 1) to solve the objective function in Model (5). Since is changed during the iteration to accelerate the procedure in the experiment, the objective function of Model (5) is varied during each iteration. Hence, it is difficult to guarantee convergence theoretically. However, in the experiments, the results show that Algorithm 1 for optimizing Model (5) has good convergence.
4.5. Computational Complexity Analysis
According to the optimization process described in Algorithm 1, the computational complexity of LGOMSC consists of updating , , and . First, the update of takes O(n3 + Vn2). Second, the update of needs O(n2). Third, the update of costs O(n3) for compute eigenvectors of the Laplacian matrix. Overall, the complexity of Algorithm 1 is , where T is the total number of iterations.
| Algorithm 1: Optimization Algorithm for Model (5) |
| Input: given view data with , the number of clusters , parameters and . Output: with exact connected components. Initialize by the optimization problem [51]: Initialize and based on . Repeat Update by model (9). Update by model (12). Update by model (13). Until and |
5. Experiments
In this section, we use nine popular multi-view data sets to assess the clustering performance of LGOMSC.
5.1. Data Set Descriptions
In the experiments, the nine public multi-view benchmark data sets were 3Sources, 100leaves, BBC, Caltech101, COIL-20, NottingHill, Webkb, Cornell, and Wikipedia Articles. All the data sets are summarized in Table 2.
5.2. Experimental Setting
In this paper, LGOMSC is compared with twelve relevant methods including
- FeatConcate: Concatenate the features of different views into a vector and utilize k-means to acquire the clustering result. It is regarded as the baseline method.
- LMSC: Latent multi-view subspace clustering [35].
- FMR: Flexible multi-view representation learning for subspace clustering [36].
- MLRSSC: Multi-view low-rank sparse subspace clustering [17].
- RMKMC: Robust multi-view k-means clustering [53].
- mPAC: Multiple partitions aligned clustering [25].
- LMVSC: Large-scale multi-view subspace clustering in linear time [26].
- PMSC: Partition level multi-view subspace clustering [22].
- COMVSC: Consensus one-step multi-view subspace clustering [24].
- GMC: Graph-based multi-view clustering [43].
- MVSCLG: Multi-view subspace clustering with local and global information [45].
We conduct these comparison methods from corresponding open-source codes and follow their papers to set the optimal parameters. LGOMSC contains two parameters and . For , it is first set with a proper value in a heuristic way, then in each iteration, is divided by two if the number of zero eigenvalues of is greater than c and multiplied by two if it is smaller than c. For , we adopt the grid search method to empirically choose it in the range of . In this paper, we use L2 norm for data normalization, i.e., .
5.3. Experiment Results and Analysis
In the experiments, four popular metrics including accuracy (ACC), normalized mutual information (NMI), F-score and adjusted Rand index (ARI) are utilized to assess the clustering result. These evaluation metrics reflect different natures of the clustering results, thus providing a comprehensive analysis from multiple perspectives. For all four of the evaluation metrics, higher values indicate better results. The comparison results are shown in Table 3,Table 4,Table 5 and Table 6. The best result is highlighted in red font, and the second best result is reported in blue font.
Experiment Analysis. Through observing the clustering results from Table 3,Table 4,Table 5 and Table 6, one can see that our proposed method can obtain the best results on all multi-view data sets except Caltech101. For the Caltech101 data set, LGOMSC is lower than FeatConcate and RMKMC in terms of NMI. However, in terms of ACC, our proposed method exceeds the second best results on the data sets including 3sources, 100leaves, BBC, Caltech101, COIL-20, NottingHill, Webkb, Cornell, and Wikipedia by 6.51%, 7.93%, 2.19%, 2.31%, 4.51%, 8.07%, 2.76%, 8.72% and 1.59%, respectively. For NMI, our proposed method is 8.93% lower than the best method, RMKMC, on the Caltech101 data set. For F-score, our proposed method exceeds the second best method by 1.41%, 14.45%, 4.39%, 3.89%, 6.55%, 11.23%, 3.75%, 7.75% and 0.63% for the corresponding data sets, respectively. In terms of ARI, our proposed method exceeds the second best method by 0.84%, 14.59%, 5.31%, 7.37%, 6.97%, 14.33%, 12.11%, 2.54% and 0.16% for the corresponding data set, respectively. The above results demonstrate the effectiveness and superiority of the proposed method. Hence, our LGOMSC method is a valuable multi-view subspace clustering method.
From the results in these tables, one can see that the baseline method (i.e., FeatConcate) sometimes exhibits comparable performance to the multi-view subspace method and even exceeds some multi-view clustering methods. However, in most cases, this baseline method still has a big gap in comparison with multi-view clustering methods. It confirms that multi-view clustering methods that consider the consistency or complementary information can obtain a good multi-view clustering performance. However, in some data sets, e.g., 3sources and 100leaves, the multi-view k-means method RMKMC, produces even worse results than FeatConcate. This phenomenon has been observed by some previous researchers [18,54].
Multi-view subspace clustering based on intact space learning methods like LMSC and FMR performs clustering on the latent representation space. However, there is a large gap between these methods and our approach, probably because they separate the representation learning and clustering processes, leading to suboptimal clustering results.
Compared with similar multi-view information fusion methods like GMC and LMVSC, our approach achieves a more impressive performance. This is mainly because we fuse graph learning into the self-expression model to jointly explore local and global structural information in the data. More information is used to serve the clustering task and therefore better performance is obtained.
Compared with the partition-based models to construct multi-view subspace clustering for joint optimization methods like COMVSC, mPAC, and PMSC, our approach achieves more impressive performance. This is mainly because we make the clustering structure of the multi-view data revealed while generating the common subspace representation under the rank constraint of Laplacian matrix. Thus, the end-to-end clustering approach facilitates a better clustering performance.
Compared with the MVSCLG method, the overall results from the nine data sets show that our method achieves the best results on all evaluation criteria, except for the Caltech101, Cornell and Wikipedia data sets. It states that using rank constraint can obtain an ideal graph matrix fitting for direct clustering. Our method also has superiorities in terms of running time and memory usage, which will be discussed in the next subsection. Thus, our method is more effective than MVSCLG.
Compared with these state-of-the-art clustering methods, the proposed method can achieve a more impressive clustering performance. The main reason is that it considers the local and global information from the original multi-view data to learn the subspace representation. Moreover, the proposed LGOMSC is an end-to-end model, which fuses the construction of subspace representation, multi-view information fusion, and clustering into a seamless whole. The purpose for this is to dig into their potential correlations.
Statistical Analysis. To demonstrate the statistical properties of our proposed method, we conducted the Friedman test and Nemenyi post-hoc test.
The Friedman test assumes that all the k compared methods hold the same performance on H data sets. Specifically, this model performance evaluation consists of the following two main steps. In the first step, first, sort all methods on each data set from high to low according to the clustering performance index and assign corresponding ordinal values (e.g., 1, 2, …), and then calculate each method on all data sets average rank. In particular, the ordinal values are averaged if the performance of the two methods is the same. Finally, and are calculated, and their mathematical expressions are as follows:
where , represents the average rank of the i-th method over all data sets. Besides, obeys the F-distribution with the degree of freedom k−1 and (k−1)(H−1). The correctness of the hypothesis is eliminated by comparing the with its corresponding threshold (the thresholds of the Friedman test can be calculated by in R programming language). If the hypothesis is rejected, this indicates a significant difference in the performance of the compared methods. A further Nemenyi post-hoc test is then required to further distinguish between the methods.
In the second step, the Nemenyi post-hoc test calculates the critical distance by Equation (15) to reflect the difference between the average ordinal results of various methods.
where can be calculate by in R programming language.
In our case, the number of compared methods, k, equals 13 and H equals 9. We sort the ACC, NMI, F-score, and ARI of the compared methods from high to low and obtain the average ranking of each method in terms of all data sets.
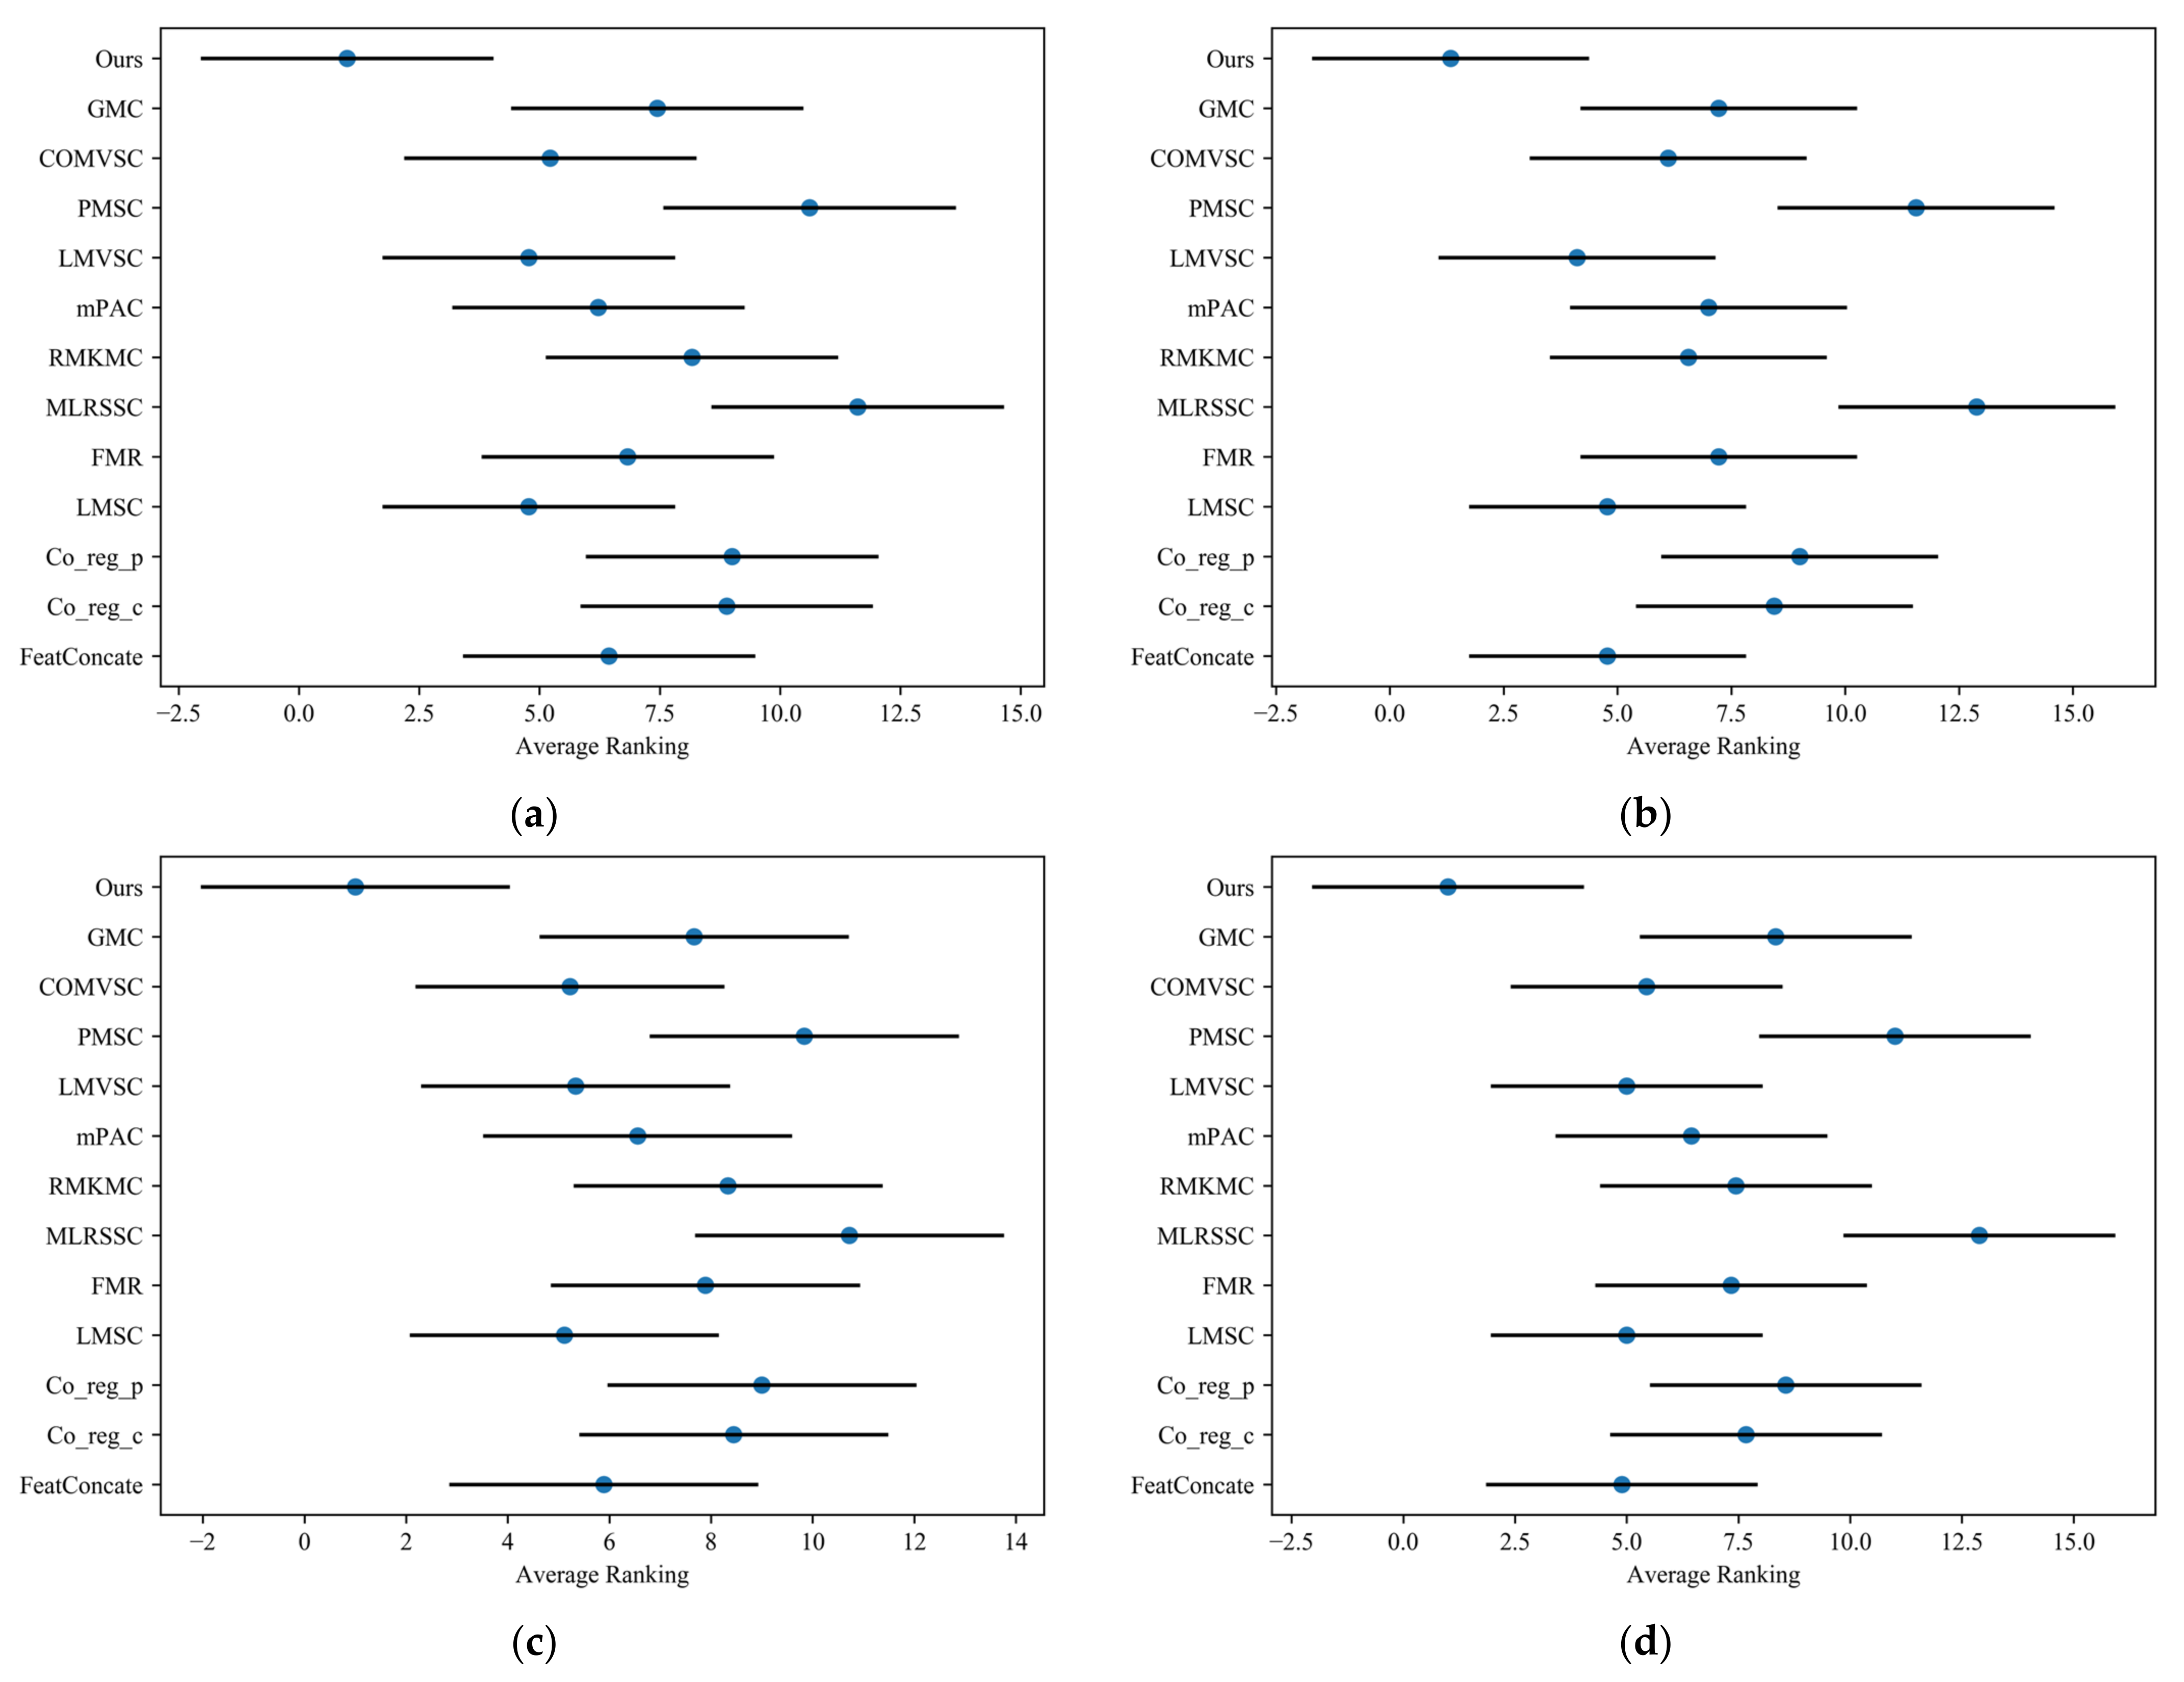
When = 0.05, the threshold for the Friedman test was 1.8544. According to Equation (14), the values can be calculated for different clustering evaluation metrics (ACC, NMI, F-score, and ARI), which are 8.4348, 13.0826, 5.9892 and 11.3655, respectively. These values are all greater than the threshold of the Friedman test, which rejects the hypothesis that all the methods being compared hold the same performance. Then, we perform the Nemenyi post-hoc test to further distinguish multiple methods. After obtaining the critical distance, CD = 6.2982, according to Equation (15), we can draw the Friedman test chart as Figure 2. For each method, the blue dot marks its average rank. The horizontal lines with the dot at the center indicate the critical distance, CD. If the lines do not have overlapping areas this indicates a significant difference in the comparison methods.
From the figure, we can see that there are significant differences between the method in this paper and Co_reg_c, Co_reg_p, MLRSSC, and PMSC, and that the other methods do not differ from one another significantly. Compared with other methods, our method has the best average ranking regardless of the clustering evaluation index. In summary, our proposed method holds statistical advantages.
5.4. Running Time Analysis
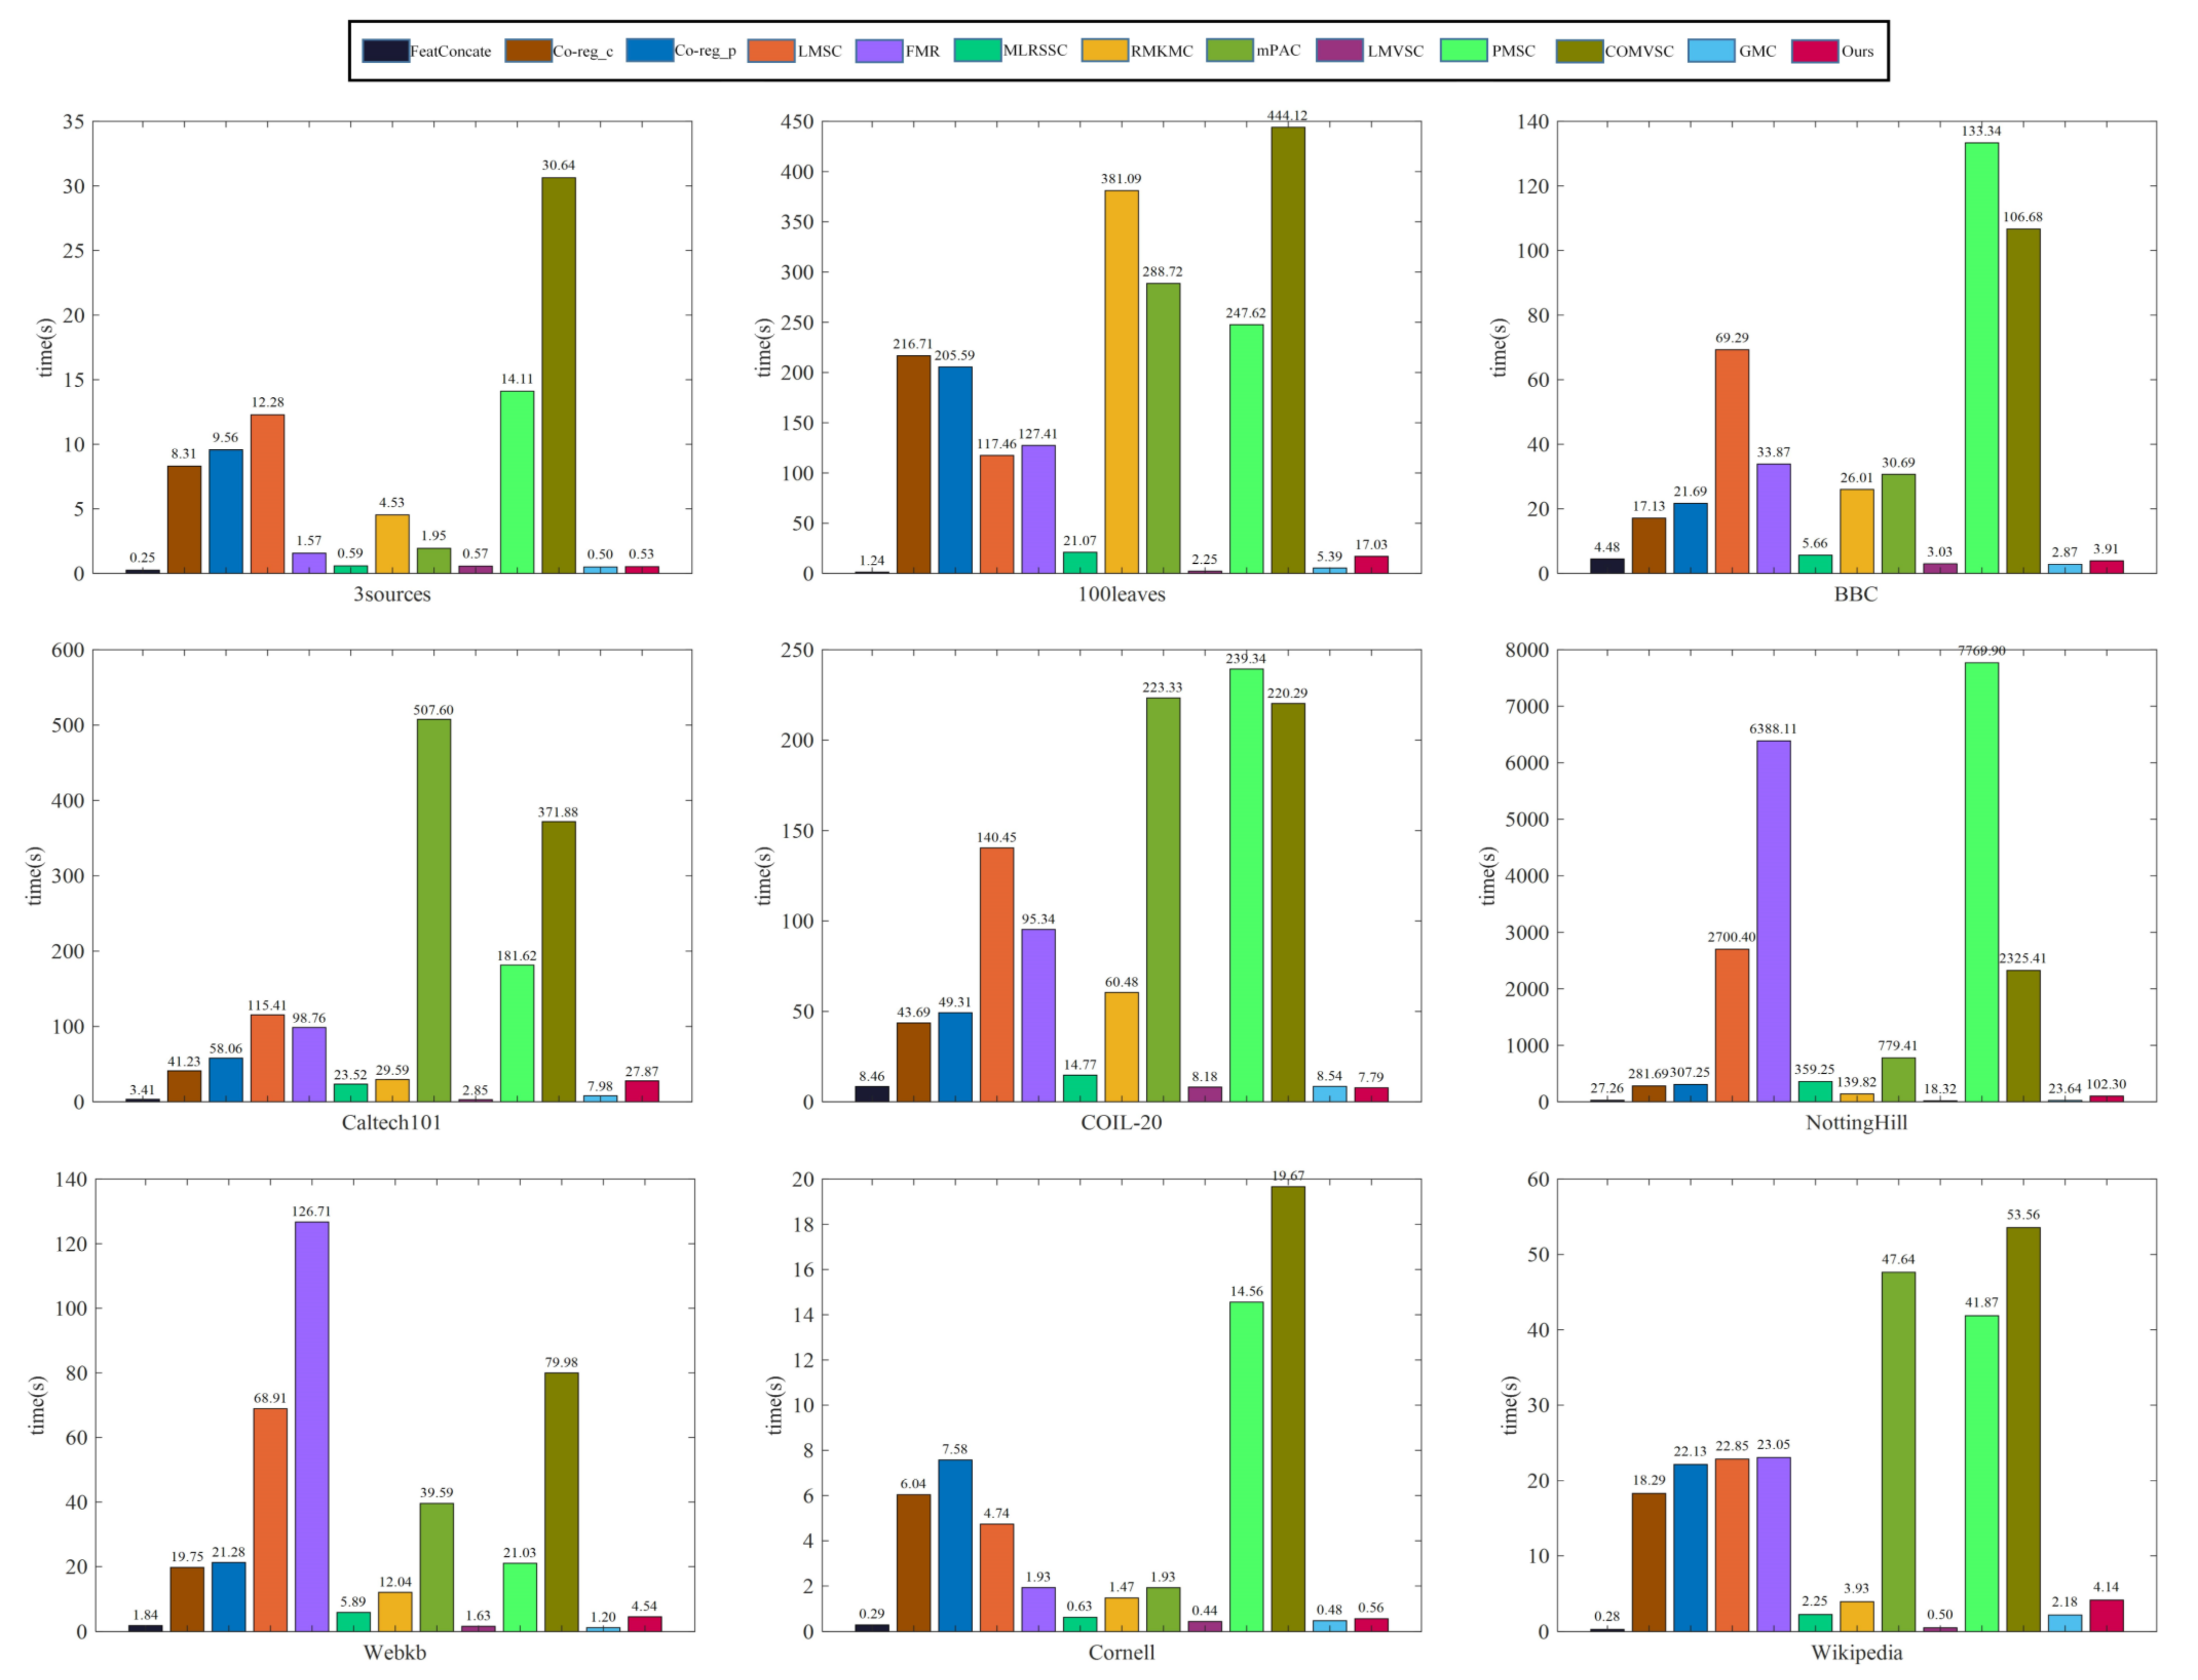
We used MATLAB 2018b to run each clustering method independently and recorded the running time of each clustering method under one hyperparameter combination on each data set in Figure 3. From these results, one can see that FeatConcate is the fastest among most of multi-view data sets. To explore the consistency or complementary information of the multi-view data, these multi-view clustering methods generally need a relatively long running time to produce the final clustering. Our LGOMSC method is faster than Co_reg_c, Co_reg_p, LMSC, FMR, MLRSSC, RMKMC, mPAC, PMSC, and COMVSC on most data sets. On the Caltech101 data set, our LGOMSC method is 4.35 s slower than MLRSSC, and on the Wikipedia data set, our LGOMSC method is 1.89 s slower than MLRSSC and 0.21 s slower than RMKMC. On these data sets, LMVSC and GMC are the fastest, and they are more suitable for solving large-scale clustering problems. They are more concerned with efficiency rather than effectiveness. Therefore, the clustering performance is relatively poor. Although our proposed method is slower than the methods designed specifically for large-scale scenarios, our method is still comparable to LMVSC and GMC for the NottingHill data set. In Table 7, MVSCLG costs more running times than our method. In the NottingHill data set, LGOMSC costs 4744.49 s under one hyperparameter combination. However, since MVSCLG contains three hyperparameters, we need to conduct the grid search strategy to select the optimal one from 420 hyperparameter combinations, which may need 553.52 h. Hence, we ignore it.
5.5. Memory Usage Analysis
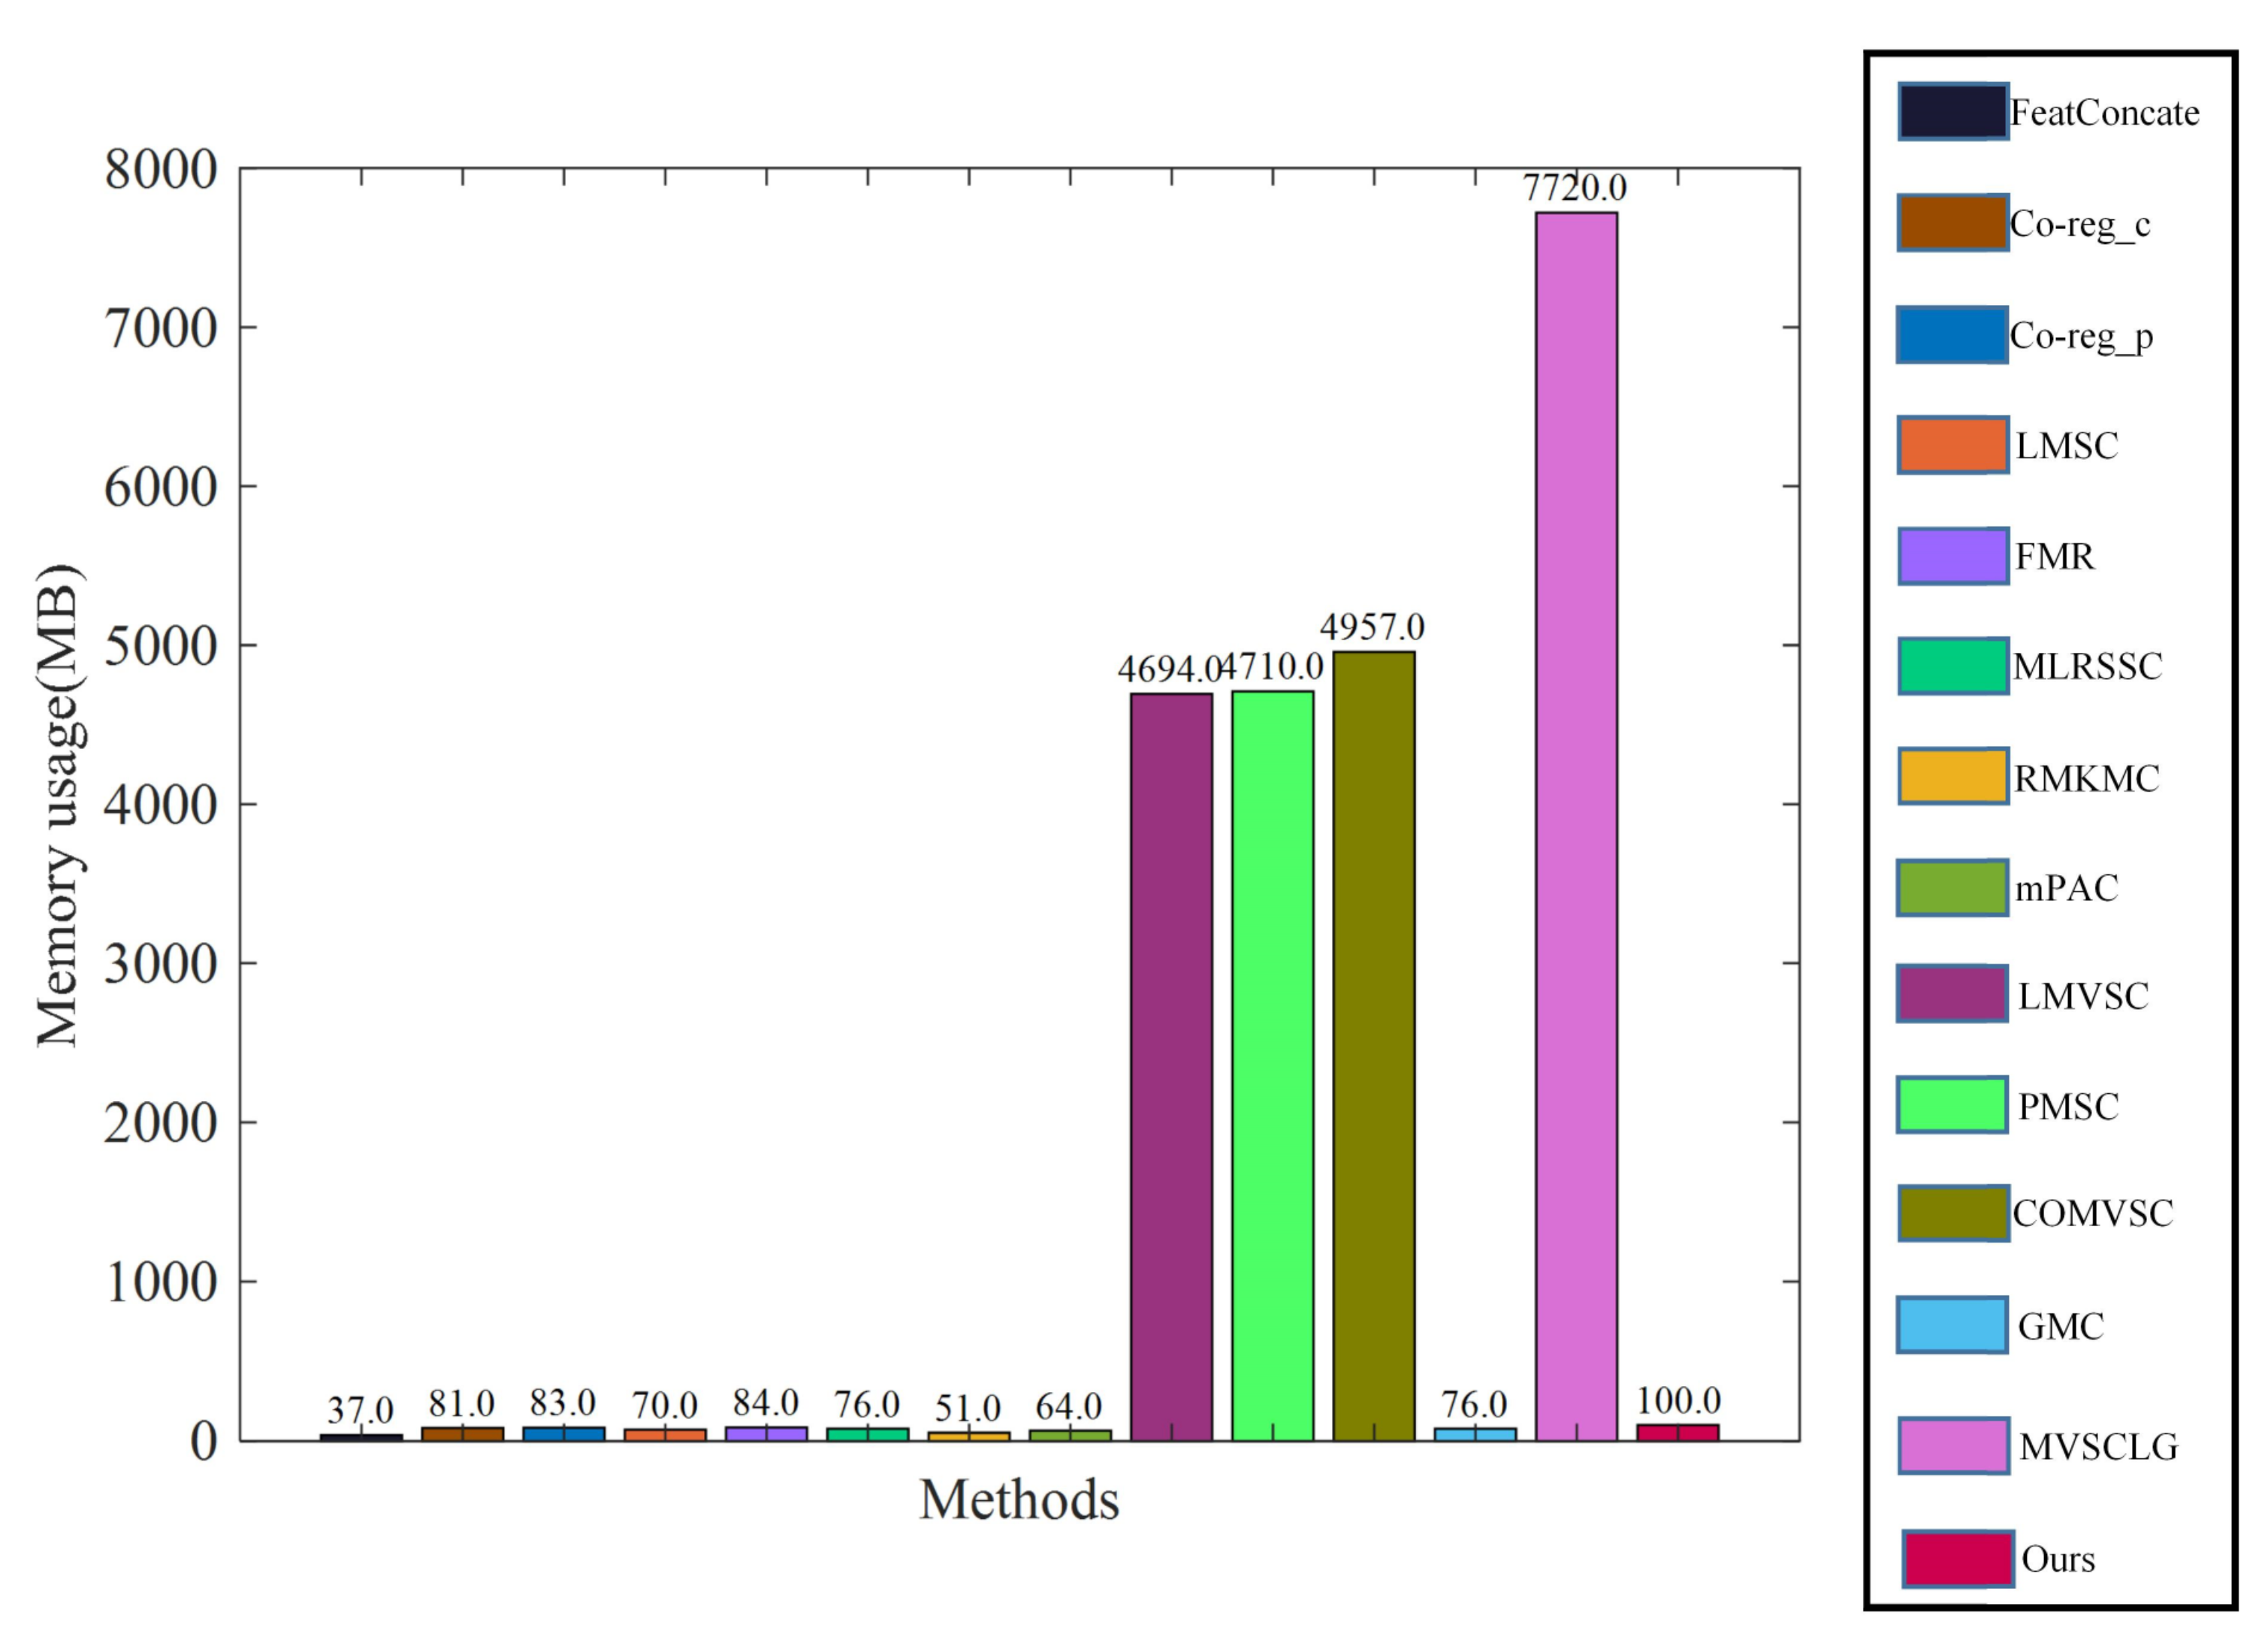
We use MATLAB 2018b to run each clustering method independently and recorded the memory usage of each clustering method. Specifically, we recorded the current matlab memory usage once before we ran the program. After the program has finished, we recorded the current matlab memory usage again. Subtracting the first reading from the second reading gives us the memory usage of the method. For example, on the 3sources data set, as can be seen in Figure 4, the memory usage of our method is small compared with the LMVSC, PMSC, COMVSC and MVSCLG methods. The memory usage of our method is slightly larger than the other remaining methods, but there is no significant difference between our method and the other remaining methods in terms of memory usage by an order of magnitude. Therefore, our method has an appropriate space complexity.
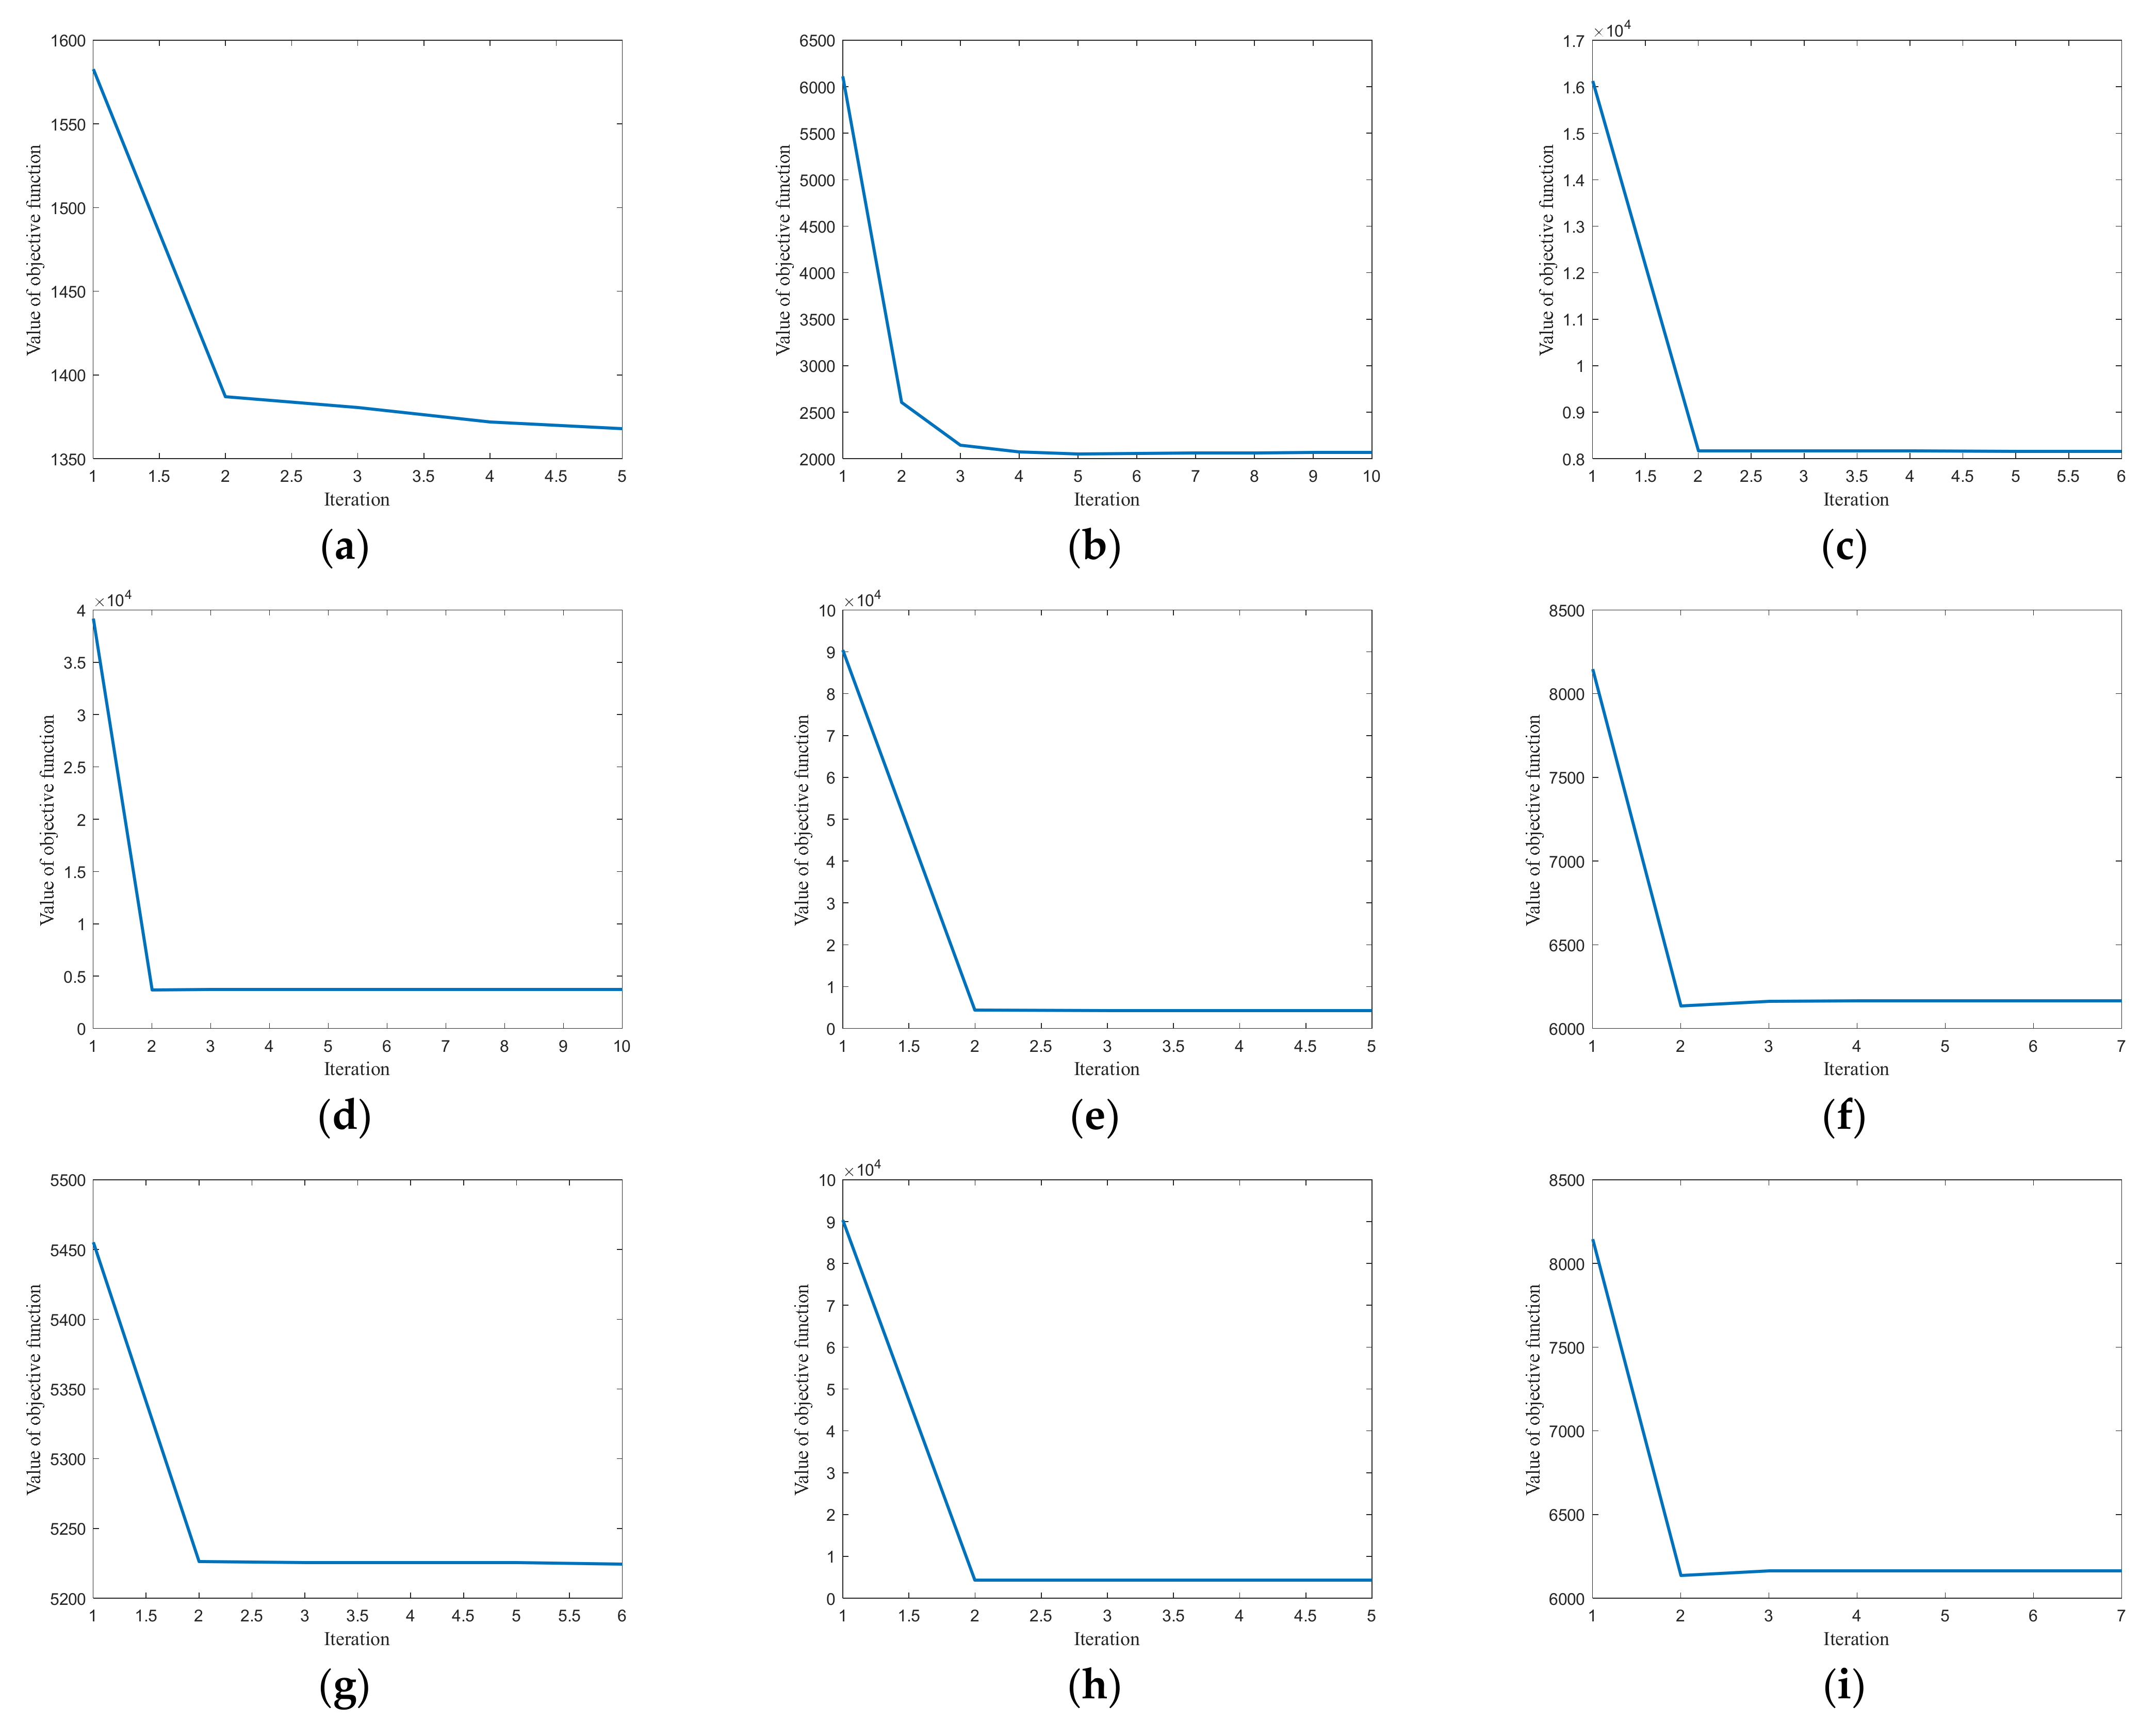
5.6. Convergence Study
The objective function of LGOMSC has multiple variables and constraints. We have developed an effective iterative optimization algorithm to solve the proposed method. We conduct the convergence experiment in Figure 5, which provides the convergence curves of LGOMSC on nine multi-view data sets. The x-axis displays the number of iterations, and the y-axis displays the corresponding objective function value. From these results, one can see that the proposed method is well convergent and converges quickly. Within 10 iterations, the objective function value can converge to a stable value.
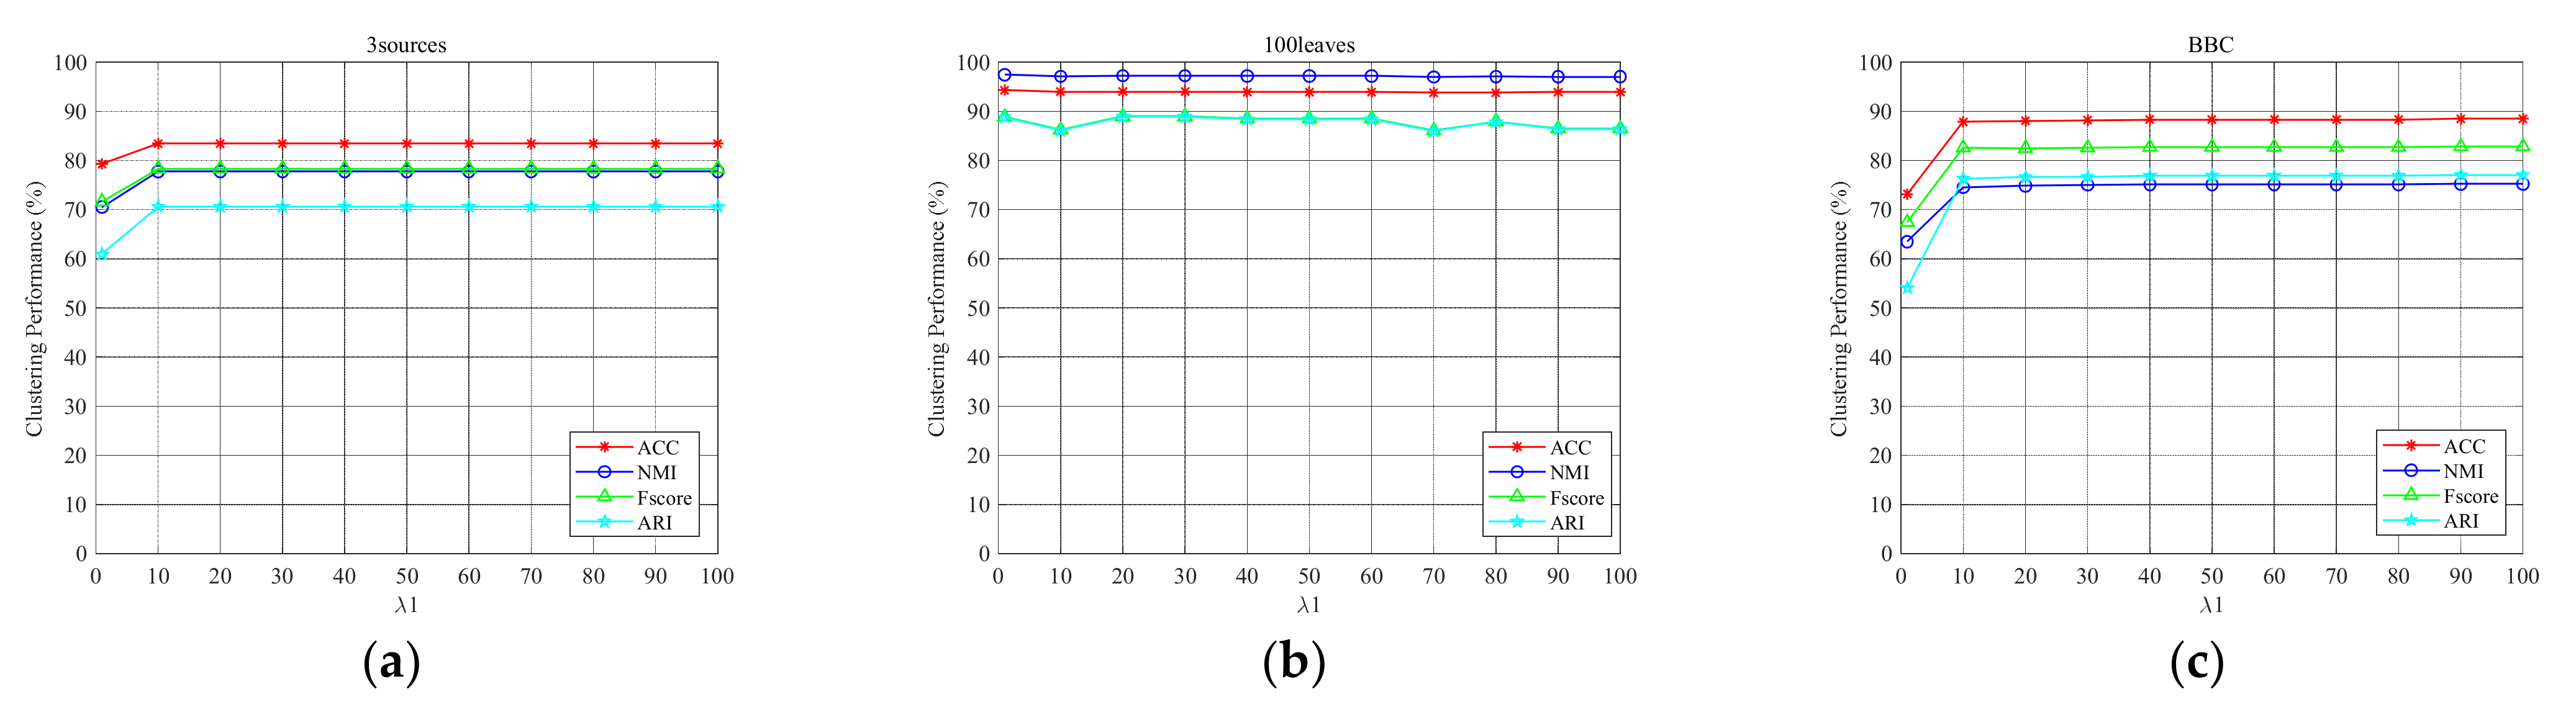
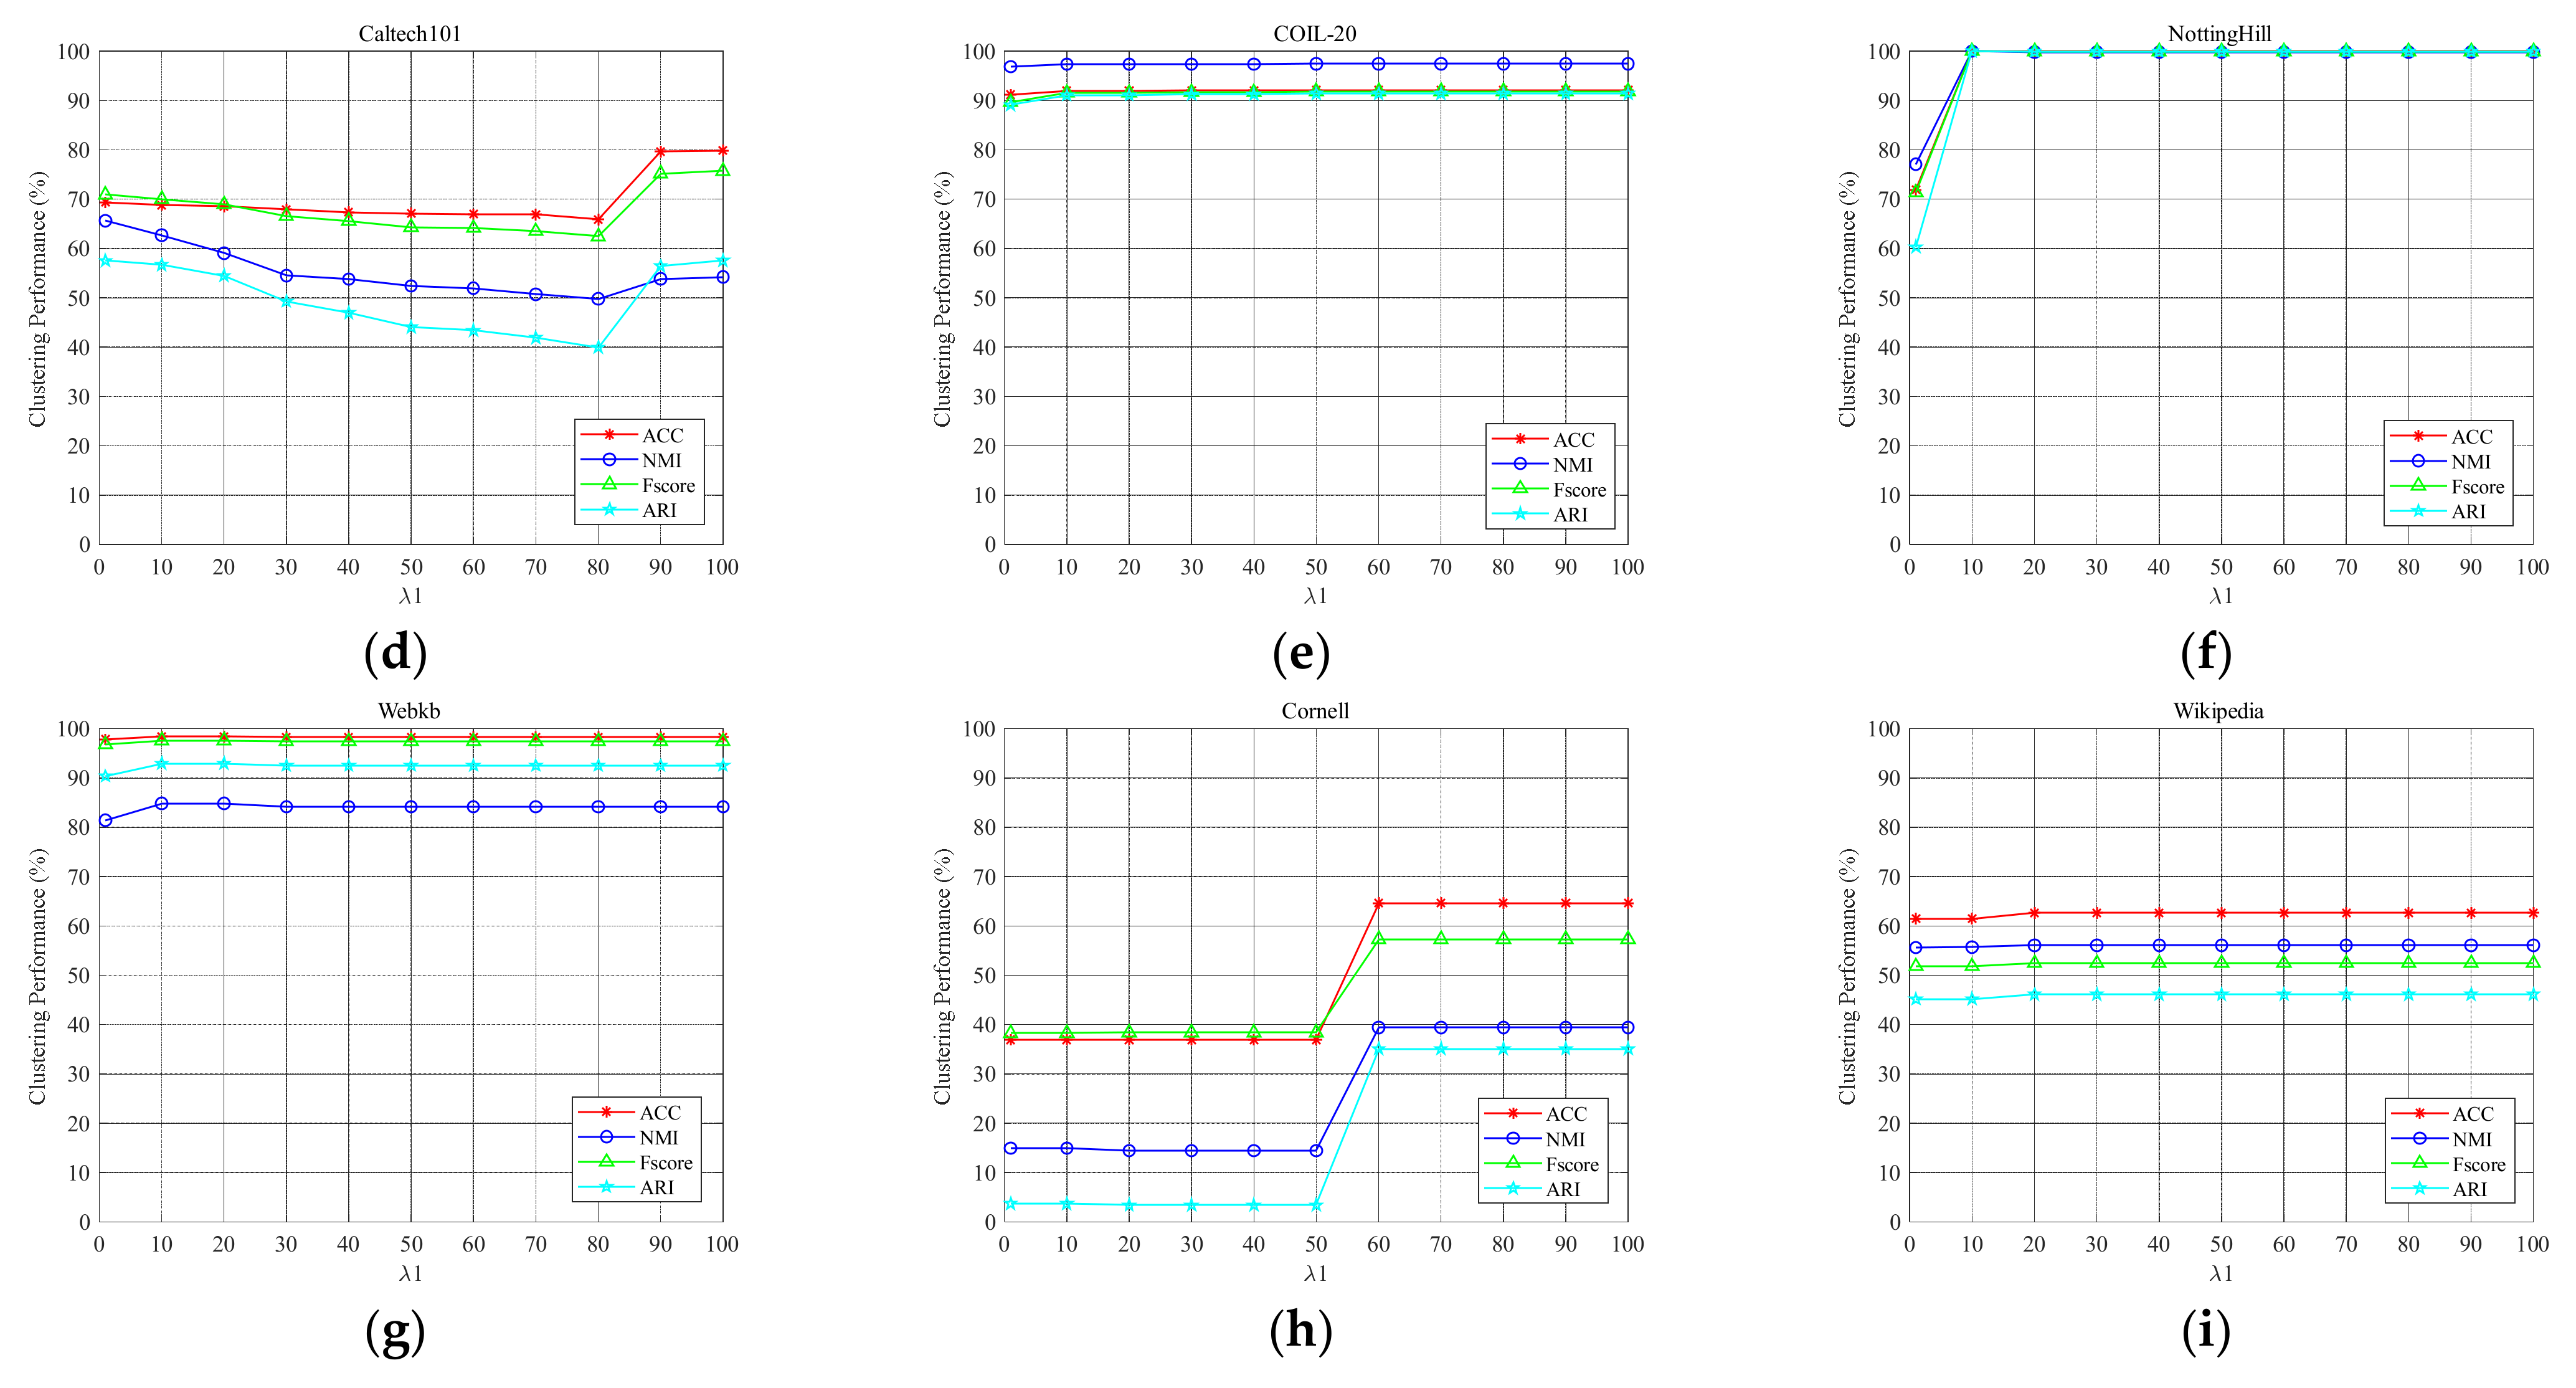
5.7. Parameter Tuning
We conducted an experiment to analyze the hyperparameter in this paper. In the experiment, we tuned from a candidate set of . As shown in Figure 6, we give the parameter tuning of LGOMSC on nine multi-view data sets and show the clustering performance under different values. One can see that the proposed method keeps a relatively robust clustering performance under a large range of . This helps us to easily select a proper parameter.
6. Conclusions
In this paper, we propose a novel one-step multi-view subspace clustering method, which integrates the self-expression model and graph learning to simultaneously exploit the local and global information of subspace representations from multi-view data. Moreover, to further exploit the hidden relationships between different steps to achieve an end-to-end clustering, our method integrates the subspace representation learning, multi-view information fusion, and clustering tasks into a joint framework. Experimental results on nine popular multi-view data sets confirm the effectiveness of our method by comparing with many baseline methods.
In the future, we have two directions to improve our method. First, since our method is a linear model, we will consider expanding our model to non-linear cases to deal with complex multi-view data. Second, for better fitting for large-scale multi-view subspace clustering, we will adopt anchor-based ideas to improve our method.
Author Contributions
Conceptualization, Y.D. and H.Y.; methodology, H.Y. and C.S.L.; software, Y.D.; experiment, validation and analysis, Y.D. and H.Y.; investigation, Y.D. and H.Y.; resources, H.Y.; data curation, Y.D.; writing—original draft preparation, Y.D. and H.Y.; writing—review and editing, Y.D., H.Y., C.S.L. and L.L.L. All authors have read and agreed to the published version of the manuscript.
Funding
This research was funded by National Natural Science Foundation of China under Grant 61903091; Guangdong Basic and Applied Basic Research Foundation (No. 2020A1515010801).
Institutional Review Board Statement
Not applicable.
Informed Consent Statement
Not applicable.
Data Availability Statement
The original contributions presented in the study are included in the article, further inquiries can be directed to the corresponding author.
Conflicts of Interest
The authors declare no conflict of interest.
References
- Goldberg, D.; Holland, J. Genetic algorithms and machine learning. Mach. Learn. 1988, 3, 95–99. [Google Scholar] [CrossRef]
- Liu, S.; Liang, X.; Liu, L.; Shen, X.; Yang, J.; Xu, C.; Lin, L.; Cao, X.; Yan, S. Matching-cnn meets knn: Quasi-parametric human parsing. In Proceedings of the IEEE Conference on Computer Vision and Pattern Recognition (CVPR), Boston, MA, USA, 7–12 June 2015; pp. 1419–1427. [Google Scholar]
- Witten, I.; Frank, E. Data Mining: Practical Machine Learning Tools and Techniques; Morgan Kaufmann: San Mateo, CA, USA, 2005; pp. 35–40. [Google Scholar]
- Berkhin, P. A survey of clustering data mining techniques. In Grouping Multidimensional Data; Kogan, J., Nicholas, C., Teboulle, M., Eds.; Springer: Berlin/Heidelberg, Germany, 2006; pp. 25–71. [Google Scholar]
- Astolfi, D.; Pandit, R. Multivariate wind turbine power curve model based on data clustering and polynomial LASSO regression. Appl. Sci. 2021, 12, 72. [Google Scholar] [CrossRef]
- Dinh, D.; Fujinami, T.; Huynh, V. Estimating the optimal number of clusters in categorical data clustering by silhouette coef-ficient. In Proceedings of the Twentieth International Symposium on Knowledge and Systems Sciences (ISKSS), Da Nang, China, 29 November–1 December 2019; pp. 1–17. [Google Scholar]
- Liu, G.; Lin, Z.; Yan, S.; Sun, J.; Yu, Y.; Ma, Y. Robust recovery of subspace structures by low-rank representation. IEEE Trans. Pattern Anal. Mach. Intell. 2013, 35, 171–184. [Google Scholar] [CrossRef] [PubMed] [Green Version]
- Chao, G.; Sun, S.; Bi, J. A survey on multiview clustering. IEEE Trans. Artif. Intell. 2021, 2, 146–168. [Google Scholar] [CrossRef]
- Yang, Y.; Wang, H. Multi-view clustering: A survey. Big Data Min. Anal. 2018, 1, 83–107. [Google Scholar]
- Fu, L.; Lin, P.; Vasilakos, A.; Wang, S. An overview of recent multi-view clustering. Neurocomputing 2020, 402, 148–161. [Google Scholar] [CrossRef]
- Yan, S.; Xu, D.; Zhang, B.; Zhang, H.; Yang, Q.; Lin, S. Graph embedding and extensions: A general framework for dimensionality reduction. IEEE Trans. Pattern Anal. Mach. Intell. 2006, 29, 40–51. [Google Scholar] [CrossRef] [Green Version]
- Gao, H.; Nie, F.; Li, X.; Huang, H. Multi-view subspace clustering. In Proceedings of the 2015 IEEE International Conference on Computer Vision (ICCV), Santiago, Chile, 7–13 December 2015; pp. 4238–4246. [Google Scholar]
- Cao, X.; Zhang, C.; Fu, H.; Liu, S.; Zhang, H. Diversity-induced multi-view subspace clustering. In Proceedings of the IEEE Conference on Computer Vision and Pattern Recognition (CVPR), Boston, MA, USA, 7–12 June 2015; pp. 586–594. [Google Scholar]
- Luo, S.; Zhang, C.; Zhang, W.; Cao, X. Consistent and specific multi-view subspace clustering. In Proceedings of the Thirty-Second AAAI Conference on Artificial Intelligence (AAAI-18), New Orleans, LA, USA, 2–7 February 2018; pp. 3730–3737. [Google Scholar]
- Wang, X.; Guo, X.; Lei, Z.; Zhang, C.; Li, S. Exclusivity-consistency regularized multi-view subspace clustering. In Proceedings of the IEEE Conference on Computer Vision and Pattern Recognition (CVPR), Long Beach, CA, USA, 15–20 June 2019; pp. 923–931. [Google Scholar]
- Guo, J.; Sun, Y.; Gao, J.; Hu, Y.; Yin, B. Rank Consistency induced multiview subspace clustering via low-rank matrix factorization. IEEE Trans. Neural Netw. Learn. Syst. 2021, 1–14. [Google Scholar] [CrossRef]
- Brbić, M.; Kopriva, I. Multi-view low-rank sparse subspace clustering. Pattern Recognit. 2018, 73, 247–258. [Google Scholar] [CrossRef] [Green Version]
- Zhang, C.; Fu, H.; Liu, S.; Liu, G.; Cao, X. Low-rank tensor constrained multiview subspace clustering. In Proceedings of the 2015 IEEE International Conference on Computer Vision (ICCV), Santiago, Chile, 7–13 December 2015; pp. 1582–1590. [Google Scholar]
- Xie, Y.; Tao, D.; Zhang, W.; Liu, Y.; Zhang, L.; Qu, Y. On unifying multi-view self-representations for clustering by tensor multi-rank minimization. Int. J. Comput. Vis. 2018, 126, 1157–1179. [Google Scholar] [CrossRef] [Green Version]
- Zhang, C.; Fu, H.; Wang, J.; Li, W.; Cao, X.; Hu, Q. Tensorized multi-view subspace representation learning. Int. J. Comput. Vis. 2020, 128, 2344–2361. [Google Scholar] [CrossRef] [Green Version]
- Yin, M.; Gao, J.; Xie, S.; Guo, Y. Multiview subspace clustering via tensorial t-product representation. IEEE Trans. Neural Netw. Learn. Syst. 2018, 30, 851–864. [Google Scholar] [CrossRef]
- Kang, Z.; Zhao, X.; Peng, C.; Zhu, H.; Zhou, J.; Peng, X.; Chen, W.; Xu, Z. Partition level multiview subspace clustering. Neural Netw. 2020, 122, 279–288. [Google Scholar] [CrossRef]
- Lv, J.; Kang, Z.; Wang, B.; Ji, L.; Xu, Z. Multi-view subspace clustering via partition fusion. Inf. Sci. 2021, 560, 410–423. [Google Scholar] [CrossRef]
- Zhang, P.; Liu, X.; Xiong, J.; Zhou, S.; Zhao, W.; Zhu, E.; Cai, Z. Consensus one-step multi-view subspace clustering. IEEE Trans. Knowl. Data Eng. 2020, 1–14. [Google Scholar] [CrossRef]
- Kang, Z.; Guo, Z.; Huang, S.; Wang, S.; Chen, W.; Su, Y.; Xu, Z. Multiple partitions aligned clustering. In Proceedings of the Twenty-Eighth International Joint Conference on Artificial Intelligence (IJCAI), Macao, China, 10–16 August 2019; pp. 2701–2707. [Google Scholar]
- Kang, Z.; Zhou, W.; Zhao, Z.; Shao, J.; Han, M.; Xu, Z. Large-scale multi-view subspace clustering in linear time. In Proceedings of the Thirty-Fourth AAAI Conference on Artificial Intelligence (AAAI-20), New York, NY, USA, 7–12 February 2020; pp. 4412–4419. [Google Scholar]
- Wang, S.; Liu, X.; Zhu, X.; Zhang, P.; Zhang, Y.; Gao, F.; Zhu, E. Fast parameter-free multi-view subspace clustering with consensus anchor guidance. IEEE Trans. Image Process. 2022, 31, 556–568. [Google Scholar] [CrossRef]
- Sun, M.; Zhang, P.; Wang, S.; Zhou, S.; Tu, W.; Liu, X.; Zhu, E.; Wang, C. Scalable multi-view subspace clustering with unified anchors. In Proceedings of the 29th ACM International Conference on Multimedia, Chengdu, China, 20–24 October 2021; pp. 3528–3536. [Google Scholar]
- Liu, J.; Wang, C.; Gao, J.; Han, J. Multi-view clustering via joint nonnegative matrix factorization. In Proceedings of the 2013 SIAM International Conference on Data Mining (SDM), Austin, TX, USA, 2–4 May 2013; pp. 252–260. [Google Scholar]
- Guo, Y. Convex subspace representation learning from multi-view data. In Proceedings of the Twenty-Seventh AAAI Conference on Artificial Intelligence Bellevue, Washington, DC, USA, 14–18 July 2013; pp. 387–393. [Google Scholar]
- Wang, J.; Tian, F.; Yu, H.; Liu, C.; Zhan, K.; Wang, X. Diverse non-negative matrix factorization for multiview data representation. IEEE Trans. Cybern. 2018, 48, 2620–2632. [Google Scholar]
- Nie, F.; Shi, S.; Li, X. Auto-weighted multi-view co-clustering via fast matrix factorization. Pattern Recognit. 2020, 102, 107207. [Google Scholar] [CrossRef]
- Liu, X.; Song, P.; Sheng, C.; Zhang, W. Robust multi-view non-negative matrix factorization for clustering. Digit. Signal Process. 2022, 123, 103447. [Google Scholar] [CrossRef]
- Xu, C.; Tao, D.; Xu, C. Multi-view intact space learning. IEEE Trans. Pattern Anal. Mach. Intell. 2015, 37, 2531–2544. [Google Scholar] [CrossRef] [Green Version]
- Zhang, C.; Hu, Q.; Fu, H.; Zhu, P.; Cao, X. Latent multi-view subspace clustering. In Proceedings of the IEEE Conference on Computer Vision and Pattern Recognition (CVPR), Honolulu, HI, USA, 21–26 July 2017; pp. 4279–4287. [Google Scholar]
- Li, R.; Zhang, C.; Hu, Q.; Zhu, P.; Wang, Z. Flexible multi-view representation learning for subspace clustering. In Proceedings of the Twenty-Eighth International Joint Conference on Artificial Intelligence (IJCAI), Macao, China, 10–16 August 2019; pp. 2916–2922. [Google Scholar]
- Xie, D.; Zhang, X.; Gao, Q.; Han, J.; Xiao, S.; Gao, X. Multiview clustering by joint latent representation and similarity learning. IEEE Trans. Cybern. 2019, 50, 4848–4854. [Google Scholar]
- Tang, W.; Lu, Z.; Dhillon, I.S. Clustering with multiple graphs. In Proceedings of the 2009 Ninth IEEE International Conference on Data Mining, Miami, FL, USA, 6–9 December 2009; pp. 1016–1021. [Google Scholar]
- Nie, F.; Cai, G.; Li, X. Multi-view clustering and semi-supervised classification with adaptive neighbours. In Proceedings of the Thirty-First AAAI Conference (AAAI-17), San Francisco, CA, USA, 4–9 February 2017; pp. 2408–2414. [Google Scholar]
- Nie, F.; Li, J.; Li, X. Self-weighted multiview clustering with multiple graphs. In Proceedings of the Twenty-Sixth International Joint Conference on Artificial Intelligence, Melbourne, Australia, 19–25 August 2017; pp. 2564–2570. [Google Scholar]
- Zhan, K.; Zhang, C.; Guan, J.; Wang, J. Graph learning for multiview clustering. IEEE Trans. Cybern. 2017, 48, 2887–2895. [Google Scholar] [CrossRef]
- Zhan, K.; Nie, F.; Wang, J.; Yang, Y. Multiview consensus graph clustering. IEEE Trans. Image Process. 2018, 28, 1261–1270. [Google Scholar] [CrossRef]
- Wang, H.; Yang, Y.; Liu, B. GMC: Graph-based multi-view clustering. IEEE Trans. Knowl. Data Eng. 2019, 32, 1116–1129. [Google Scholar] [CrossRef]
- Zhao, Y.; Yun, Y.; Zhang, X.; Li, Q.; Gao, Q. Multi-view spectral clustering with adaptive graph learning and tensor schatten p-norm. Neurocomputing 2022, 468, 257–264. [Google Scholar] [CrossRef]
- Duan, Y.; Yuan, H.; Lai, L.; He, B. Multi-view subspace clustering with local and global information. In Proceedings of the International Conference on Wavelet Analysis and Pattern Recognition (ICWAPR), Adelaide, Australia, 3–5 December 2021; pp. 1–6. [Google Scholar]
- Nie, F.; Wang, X.; Jordan, M.; Huang, H. The constrained Laplacian rank algorithm for graph-based clustering. In Proceedings of the Thirtieth AAAI Conference on Artificial Intelligence (AAAI-16), Phoenix, AZ, USA, 12–17 February 2016; pp. 1969–1976. [Google Scholar]
- Mohar, B.; Alavi, Y.; Chartrand, G.; Oellermann, O. The Laplacian spectrum of graphs. Graph Theory Comb. Appl. 1991, 2, 871–898. [Google Scholar]
- Fan, K. On a theorem of Weyl concerning eigenvalues of linear transformations I. Proc. Natl. Acad. Sci. USA 1949, 35, 652–655. [Google Scholar] [CrossRef] [Green Version]
- Huang, J.; Nie, F.; Huang, H. A new simplex sparse learning model to measure data similarity for clustering. In Proceedings of the the Twenty-fourth International Joint Conference on Artificial Intelligence, Buenos Aires, Argentina, 25–31 July, 2015; pp. 3569–3575. [Google Scholar]
- Wang, H.; Yang, Y.; Liu, B.; Fujita, H. A study of graph-based system for multi-view clustering. Knowl.-Based Syst. 2019, 163, 1009–1019. [Google Scholar] [CrossRef]
- Nie, F.; Wang, X.; Huang, H. Clustering and projected clustering with adaptive neighbors. In Proceedings of the 20th ACM SIGKDD International Conference on Knowledge Discovery and Data Mining, New York, NY, USA, 24–27 August 2014; pp. 977–986. [Google Scholar]
- Kumar, A.; Rai, P.; Daumé, H. Co-regularized multi-view spectral clustering. In Proceedings of the 25th Annual Conference on Neural Information Processing Systems, Granada, Spain, 12–15 December 2011; pp. 1413–1421. [Google Scholar]
- Cai, X.; Nie, F.; Huang, H. Multi-view k-means clustering on big data. In Proceedings of the Twenty-Third International Joint Conference on Artificial Intelligence, Beijing, China, 3–9 August 2013; pp. 724–730. [Google Scholar]
- Yang, Y.; Song, J.; Huang, Z.; Ma, Z.; Sebe, N.; Hauptmann, A.G. Multi-feature fusion via hierarchical regression for multimedia analysis. IEEE Trans. Multimed. 2013, 15, 572–581. [Google Scholar] [CrossRef]
Figure 2.
Friedman test charts. (a) Friedman test on ACC, (b) Friedman test on NMI, (c) Friedman test on F-score, (d) Friedman test on ARI.
Figure 2.
Friedman test charts. (a) Friedman test on ACC, (b) Friedman test on NMI, (c) Friedman test on F-score, (d) Friedman test on ARI.

Figure 3.
Running time of different methods on nine multi-view data sets.

Figure 4.
The memory usage representation of compared methods on 3sources.

Figure 5.
Convergence performance on nine multi-view data sets. (a) 3sources, (b) 100leaves, (c) BBC, (d) Caltech101, (e) COIL-20, (f) NottingHill, (g) Webkb, (h) Cornell, (i) Wikipedia.
Figure 5.
Convergence performance on nine multi-view data sets. (a) 3sources, (b) 100leaves, (c) BBC, (d) Caltech101, (e) COIL-20, (f) NottingHill, (g) Webkb, (h) Cornell, (i) Wikipedia.

Figure 6.
The parameter sensitivity of on nine multi-view data sets. (a) 3sources, (b) 100leaves, (c) BBC, (d) Caltech101, (e) COIL-20, (f) NottingHill, (g) Webkb, (h) Cornell, (i) Wikipedia.
Figure 6.
The parameter sensitivity of on nine multi-view data sets. (a) 3sources, (b) 100leaves, (c) BBC, (d) Caltech101, (e) COIL-20, (f) NottingHill, (g) Webkb, (h) Cornell, (i) Wikipedia.


Table 1.
Notations and abbreviations.
| Notation | Definition |
|---|---|
| Identity matrix | |
| All-ones column vector | |
| n | Number of data sample |
| c | Number of clusters |
| V | Number of views |
| Feature dimension of the v-th view | |
| Feature matrix of the v-th view | |
| , respectively | |
| The transpose of a matrix | |
| Subspace representation matrix of the v-th view | |
| Common subspace representation matrix | |
| The Frobenius norm | |
| Trace operator of a matrix | |
| Vector of the diagonal elements of a matrix | |
| The rank of a matrix |
Table 2.
Summary of nine multi-view benchmark data sets (dv denotes the dimensionality of the v-th view).
Table 2.
Summary of nine multi-view benchmark data sets (dv denotes the dimensionality of the v-th view).
| Data Set | Point | Class | View | d1 | d2 | d3 | d4 | d5 | d6 |
|---|---|---|---|---|---|---|---|---|---|
| 3sources | 169 | 6 | 3 | 3560 | 3631 | 3068 | |||
| 100leaves | 1600 | 100 | 3 | 64 | 64 | 64 | |||
| BBC | 685 | 5 | 4 | 4659 | 4633 | 4665 | 4684 | ||
| Caltech101 | 1474 | 7 | 6 | 48 | 40 | 254 | 1984 | 512 | 928 |
| COIL-20 | 1440 | 20 | 3 | 1024 | 3304 | 6750 | |||
| NottingHill | 4660 | 5 | 3 | 6750 | 3304 | 2000 | |||
| Webkb | 1051 | 2 | 2 | 1840 | 3000 | ||||
| Cornell | 195 | 5 | 2 | 195 | 1703 | ||||
| Wikipedia | 693 | 10 | 2 | 128 | 10 |
Table 3.
The clustering performance comparison in terms of ACC on nine multi-view data sets.
| ACC (%) | 3sources | 100leaves | BBC | Caltech101 | COIL-20 | NottingHill | Webkb | Cornell | Wikipedia |
|---|---|---|---|---|---|---|---|---|---|
| FeatConcate | 65.09 | 71.00 | 61.46 | 54.27 | 67.50 | 91.93 | 94.77 | 43.08 | 57.72 |
| Co-reg_c | 69.17 | 78.53 | 34.74 | 42.00 | 70.36 | 74.77 | 80.42 | 38.41 | 38.59 |
| Co-reg_p | 66.18 | 75.60 | 35.99 | 42.14 | 72.42 | 72.14 | 83.24 | 36.26 | 20.70 |
| LMSC | 71.60 | 77.00 | 86.28 | 53.80 | 75.35 | 83.78 | 95.34 | 43.59 | 56.85 |
| FMR | 70.41 | 69.25 | 85.11 | 47.69 | 72.01 | 82.85 | 93.24 | 43.08 | 56.85 |
| MLRSSC | 34.88 | 1.44 | 33.14 | 54.21 | 5.07 | 30.11 | 78.02 | 43.08 | 15.22 |
| RMKMC | 54.44 | 1.00 | 60.44 | 54.14 | 61.60 | 75.43 | 94.01 | 43.59 | 61.04 |
| mPAC | 76.92 | 47.06 | 58.10 | 59.36 | 73.40 | 90.28 | 78.12 | 45.64 | 56.71 |
| LMVSC | 63.31 | 71.06 | 84.38 | 56.72 | 74.17 | 89.25 | 95.62 | 55.90 | 59.16 |
| PMSC | 63.85 | 22.46 | 34.45 | 44.45 | 49.09 | 70.21 | 78.02 | 45.44 | 19.70 |
| COMVSC | 65.09 | 70.88 | 69.49 | 77.54 | 77.64 | 81.70 | 82.87 | 55.38 | 60.46 |
| GMC | 65.09 | 86.38 | 69.05 | 65.74 | 87.57 | 31.24 | 77.64 | 38.97 | 31.89 |
| Ours | 83.43 | 94.31 | 88.47 | 79.85 | 92.08 | 100.00 | 98.38 | 64.62 | 62.63 |
Table 4.
The clustering performance comparison in terms of NMI on nine multi-view data sets.
| NMIn (%) | 3sources | 100leaves | BBC | Caltech101 | COIL-20 | NottingHill | Webkb | Cornell | Wikipedia |
|---|---|---|---|---|---|---|---|---|---|
| FeatConcate | 56.53 | 87.64 | 60.63 | 56.18 | 79.15 | 86.66 | 66.18 | 19.02 | 54.04 |
| Co-reg_c | 55.03 | 92.04 | 13.38 | 43.68 | 81.69 | 69.79 | 8.79 | 12.60 | 26.22 |
| Co-reg_p | 50.85 | 90.04 | 6.59 | 43.59 | 82.17 | 67.73 | 18.91 | 11.57 | 7.54 |
| LMSC | 69.18 | 89.22 | 65.70 | 51.85 | 84.54 | 78.57 | 70.36 | 18.89 | 52.60 |
| FMR | 57.34 | 85.44 | 66.04 | 46.77 | 78.53 | 66.38 | 59.59 | 21.44 | 51.81 |
| MLRSSC | 5.75 | 13.33 | 1.03 | 2.11 | 2.66 | 0.23 | 0.08 | 4.86 | 2.31 |
| RMKMC | 40.23 | 0.00 | 54.38 | 63.16 | 79.06 | 75.28 | 63.81 | 27.99 | 55.09 |
| mPAC | 64.13 | 73.96 | 47.41 | 50.56 | 85.86 | 83.14 | 16.79 | 15.48 | 47.53 |
| LMVSC | 59.35 | 87.49 | 69.45 | 55.70 | 82.24 | 82.33 | 69.41 | 27.84 | 52.81 |
| PMSC | 48.75 | 64.02 | 4.19 | 21.38 | 70.31 | 65.73 | 7.95 | 10.42 | 6.47 |
| COMVSC | 50.69 | 87.19 | 57.67 | 52.70 | 87.50 | 75.16 | 23.73 | 24.51 | 53.58 |
| GMC | 53.73 | 95.37 | 55.62 | 53.77 | 96.31 | 9.23 | 0.17 | 15.90 | 29.98 |
| Ours | 77.74 | 97.43 | 75.20 | 54.23 | 97.44 | 100.00 | 84.84 | 39.40 | 56.06 |
Table 5.
The clustering performance comparison in terms of F-score on nine multi-view data sets.
| F-score (%) | 3sources | 100leaves | BBC | Caltech101 | COIL-20 | NottingHill | Webkb | Cornell | Wikipedia |
|---|---|---|---|---|---|---|---|---|---|
| FeatConcate | 66.61 | 63.54 | 60.32 | 56.91 | 61.05 | 88.77 | 92.78 | 33.27 | 50.34 |
| Co-reg_c | 69.04 | 74.46 | 37.00 | 42.83 | 68.20 | 72.38 | 79.66 | 32.06 | 26.96 |
| Co-reg_p | 66.01 | 69.67 | 37.74 | 42.34 | 69.67 | 69.08 | 81.71 | 31.12 | 13.00 |
| LMSC | 65.58 | 68.72 | 76.81 | 53.58 | 71.33 | 83.04 | 93.02 | 42.59 | 48.96 |
| FMR | 63.89 | 59.07 | 76.55 | 47.24 | 66.58 | 72.19 | 90.08 | 34.50 | 48.22 |
| MLRSSC | 37.49 | 1.97 | 37.88 | 55.93 | 9.42 | 36.03 | 79.27 | 42.88 | 19.57 |
| RMKMC | 47.89 | 1.86 | 57.46 | 55.64 | 58.84 | 72.58 | 91.87 | 35.94 | 51.85 |
| mPAC | 76.93 | 36.61 | 59.10 | 61.19 | 68.73 | 88.17 | 79.18 | 43.34 | 45.81 |
| LMVSC | 55.85 | 61.67 | 78.44 | 51.90 | 69.29 | 85.36 | 93.83 | 49.57 | 50.13 |
| PMSC | 57.05 | 18.77 | 38.48 | 43.46 | 49.56 | 66.84 | 79.27 | 43.55 | 19.67 |
| COMVSC | 56.74 | 62.95 | 62.72 | 71.83 | 71.79 | 80.11 | 81.47 | 46.18 | 51.02 |
| GMC | 52.88 | 66.27 | 63.05 | 61.54 | 85.31 | 36.94 | 78.67 | 37.06 | 23.00 |
| Ours | 78.34 | 88.91 | 82.83 | 75.72 | 91.86 | 100.00 | 97.58 | 57.32 | 52.48 |
Table 6.
The clustering performance comparison in terms of ARI on nine multi-view data sets.
| ARI (%) | 3sources | 100leaves | BBC | Caltech101 | COIL-20 | NottingHill | Webkb | Cornell | Wikipedia |
|---|---|---|---|---|---|---|---|---|---|
| FeatConcate | 56.90 | 63.17 | 49.20 | 41.94 | 58.89 | 85.67 | 76.99 | 12.33 | 44.28 |
| Co-reg_c | 58.38 | 74.20 | 6.05 | 27.03 | 66.46 | 64.70 | 16.20 | 6.57 | 18.39 |
| Co-reg_p | 54.81 | 69.36 | 1.52 | 26.46 | 68.03 | 60.71 | 27.19 | 2.47 | 2.80 |
| LMSC | 56.72 | 68.41 | 69.70 | 37.80 | 69.74 | 78.20 | 80.79 | 10.18 | 42.89 |
| FMR | 53.70 | 58.66 | 69.13 | 31.86 | 64.83 | 64.68 | 72.84 | 12.01 | 42.12 |
| MLRSSC | 0.33 | 0.12 | −0.04 | 0.93 | 0.03 | 0.04 | −0.14 | 1.33 | −0.09 |
| RMKMC | 34.27 | 0.00 | 45.61 | 41.21 | 56.45 | 64.69 | 73.61 | 15.73 | 45.97 |
| mPAC | 69.79 | 35.87 | 40.27 | 45.19 | 67.08 | 84.79 | 28.17 | 8.97 | 38.86 |
| LMVSC | 43.16 | 61.36 | 71.75 | 34.48 | 67.67 | 81.15 | 80.81 | 32.54 | 44.24 |
| PMSC | 36.70 | 17.47 | 1.17 | 17.58 | 46.33 | 57.26 | 0.18 | 10.44 | 1.96 |
| COMVSC | 36.94 | 62.55 | 47.36 | 50.17 | 70.28 | 74.50 | 25.52 | 17.68 | 44.69 |
| GMC | 32.87 | 65.86 | 47.46 | 39.64 | 84.45 | 2.21 | 1.02 | 3.47 | 6.07 |
| Ours | 70.63 | 88.79 | 77.06 | 57.54 | 91.42 | 100.00 | 92.92 | 35.08 | 46.13 |
Table 7.
Comparing LGOMSC with MVSCLG on nine multi-view data sets.
| Methods | 3sources | 100leaves | BBC | Caltech101 | COIL-20 | NottingHill | Webkb | Cornell | Wikipedia | |
|---|---|---|---|---|---|---|---|---|---|---|
| MVSCLG | ACC | 78.70 | 73.38 | 80.88 | 82.56 | 78.61 | - | 91.82 | 70.77 | 63.49 |
| NMI | 65.13 | 88.54 | 58.14 | 58.06 | 90.28 | - | 56.49 | 49.88 | 59.09 | |
| F-score | 76.13 | 66.10 | 69.95 | 79.07 | 72.94 | - | 88.04 | 65.40 | 56.16 | |
| ARI | 68.10 | 65.74 | 61.18 | 61.76 | 71.34 | - | 67.89 | 51.35 | 49.69 | |
| Time (s) | 59.77 | 947.71 | 209.86 | 764.76 | 443.21 | 4744.49 | 163.05 | 40.27 | 107.10 | |
| Ours | ACC | 83.43 | 94.31 | 88.47 | 79.85 | 92.08 | 100.00 | 98.38 | 64.62 | 62.63 |
| NMI | 77.74 | 97.43 | 75.20 | 54.23 | 97.44 | 100.00 | 84.84 | 39.40 | 56.06 | |
| F-score | 78.34 | 88.91 | 82.83 | 75.72 | 91.86 | 100.00 | 97.58 | 57.32 | 52.48 | |
| ARI | 70.63 | 88.79 | 77.06 | 57.54 | 91.42 | 100.00 | 92.92 | 35.08 | 46.13 | |
| Time (s) | 0.53 | 17.03 | 3.91 | 27.87 | 7.79 | 102.3 | 4.54 | 0.56 | 4.15 |
“-” indicates that MVSCLG requires more than 553.52 h on the NottingHill data set.
Publisher’s Note: MDPI stays neutral with regard to jurisdictional claims in published maps and institutional affiliations. |
© 2022 by the authors. Licensee MDPI, Basel, Switzerland. This article is an open access article distributed under the terms and conditions of the Creative Commons Attribution (CC BY) license (https://creativecommons.org/licenses/by/4.0/).
Share and Cite
MDPI and ACS Style
Duan, Y.; Yuan, H.; Lai, C.S.; Lai, L.L. Fusing Local and Global Information for One-Step Multi-View Subspace Clustering. Appl. Sci. 2022, 12, 5094. https://0-doi-org.brum.beds.ac.uk/10.3390/app12105094
AMA Style
Duan Y, Yuan H, Lai CS, Lai LL. Fusing Local and Global Information for One-Step Multi-View Subspace Clustering. Applied Sciences. 2022; 12(10):5094. https://0-doi-org.brum.beds.ac.uk/10.3390/app12105094
Chicago/Turabian StyleDuan, Yiqiang, Haoliang Yuan, Chun Sing Lai, and Loi Lei Lai. 2022. "Fusing Local and Global Information for One-Step Multi-View Subspace Clustering" Applied Sciences 12, no. 10: 5094. https://0-doi-org.brum.beds.ac.uk/10.3390/app12105094
Note that from the first issue of 2016, this journal uses article numbers instead of page numbers. See further details here.