
Response Surface Methodological Approach for Optimizing Theobroma cacao L. Oil Extraction

 , ,
, ,
Abstract
:1. Introduction
2. Materials and Methods
2.1. Materials
2.2. Extraction and Variables
2.3. RSM and CCD
2.4. Extraction and Determination of Total Phenolic Content
2.5. Determination of CSO Acid Value
2.6. Determination of Peroxide Value of CSO
2.7. Determination of Fatty Acid Content
2.8. Determination of Nitric Oxide Free Radical Scavenging Activity
2.9. Statistical Analysis
3. Results and Discussion
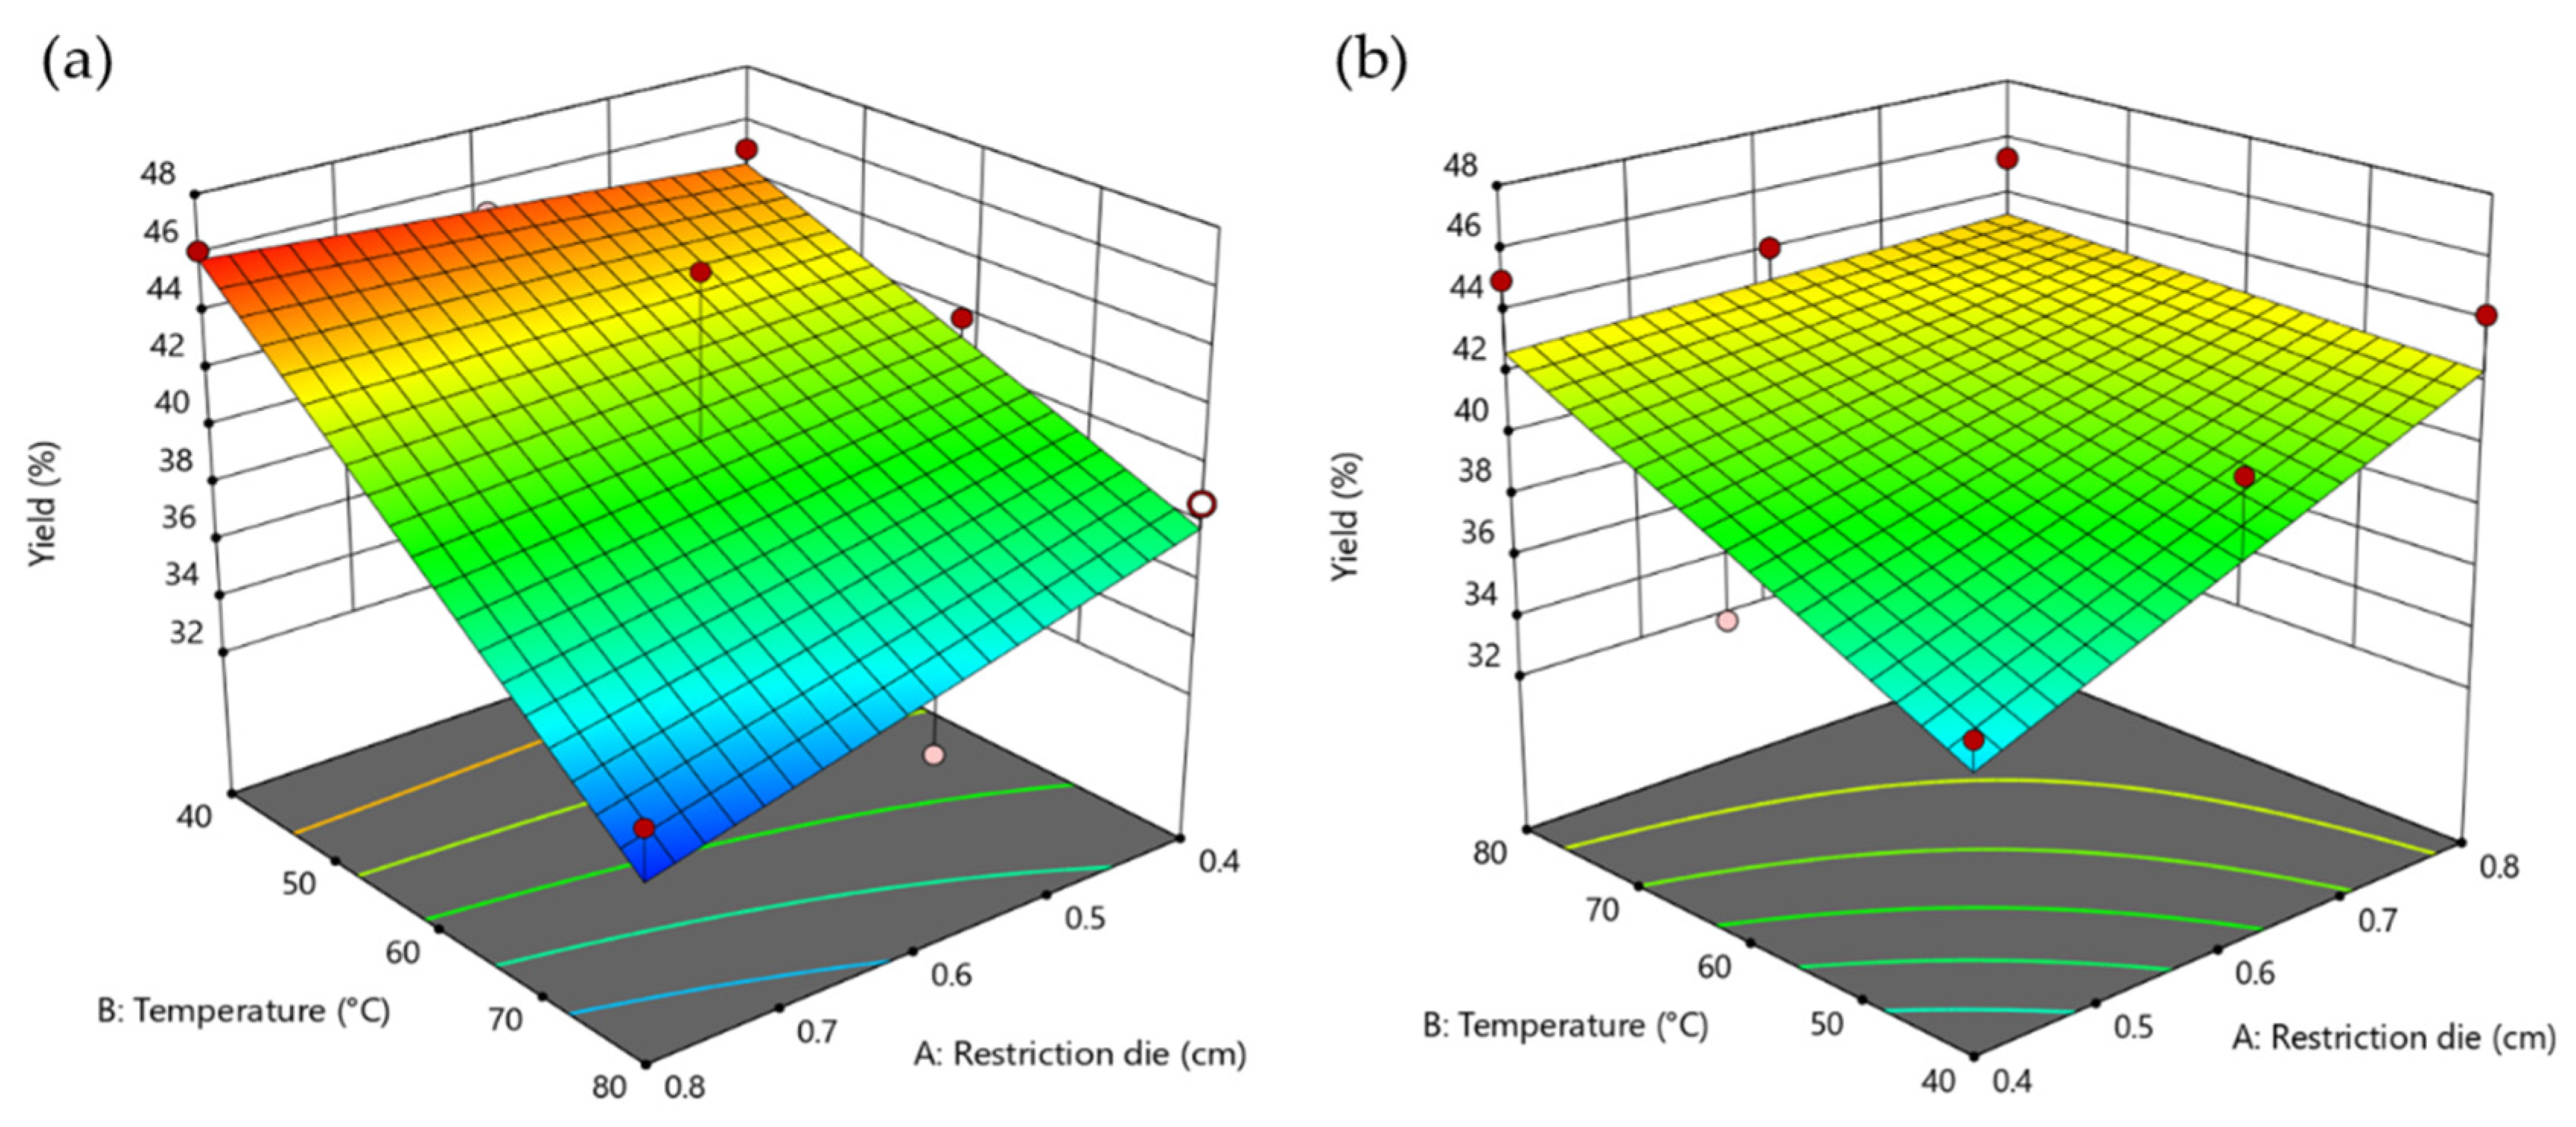
3.1. CSO Yield
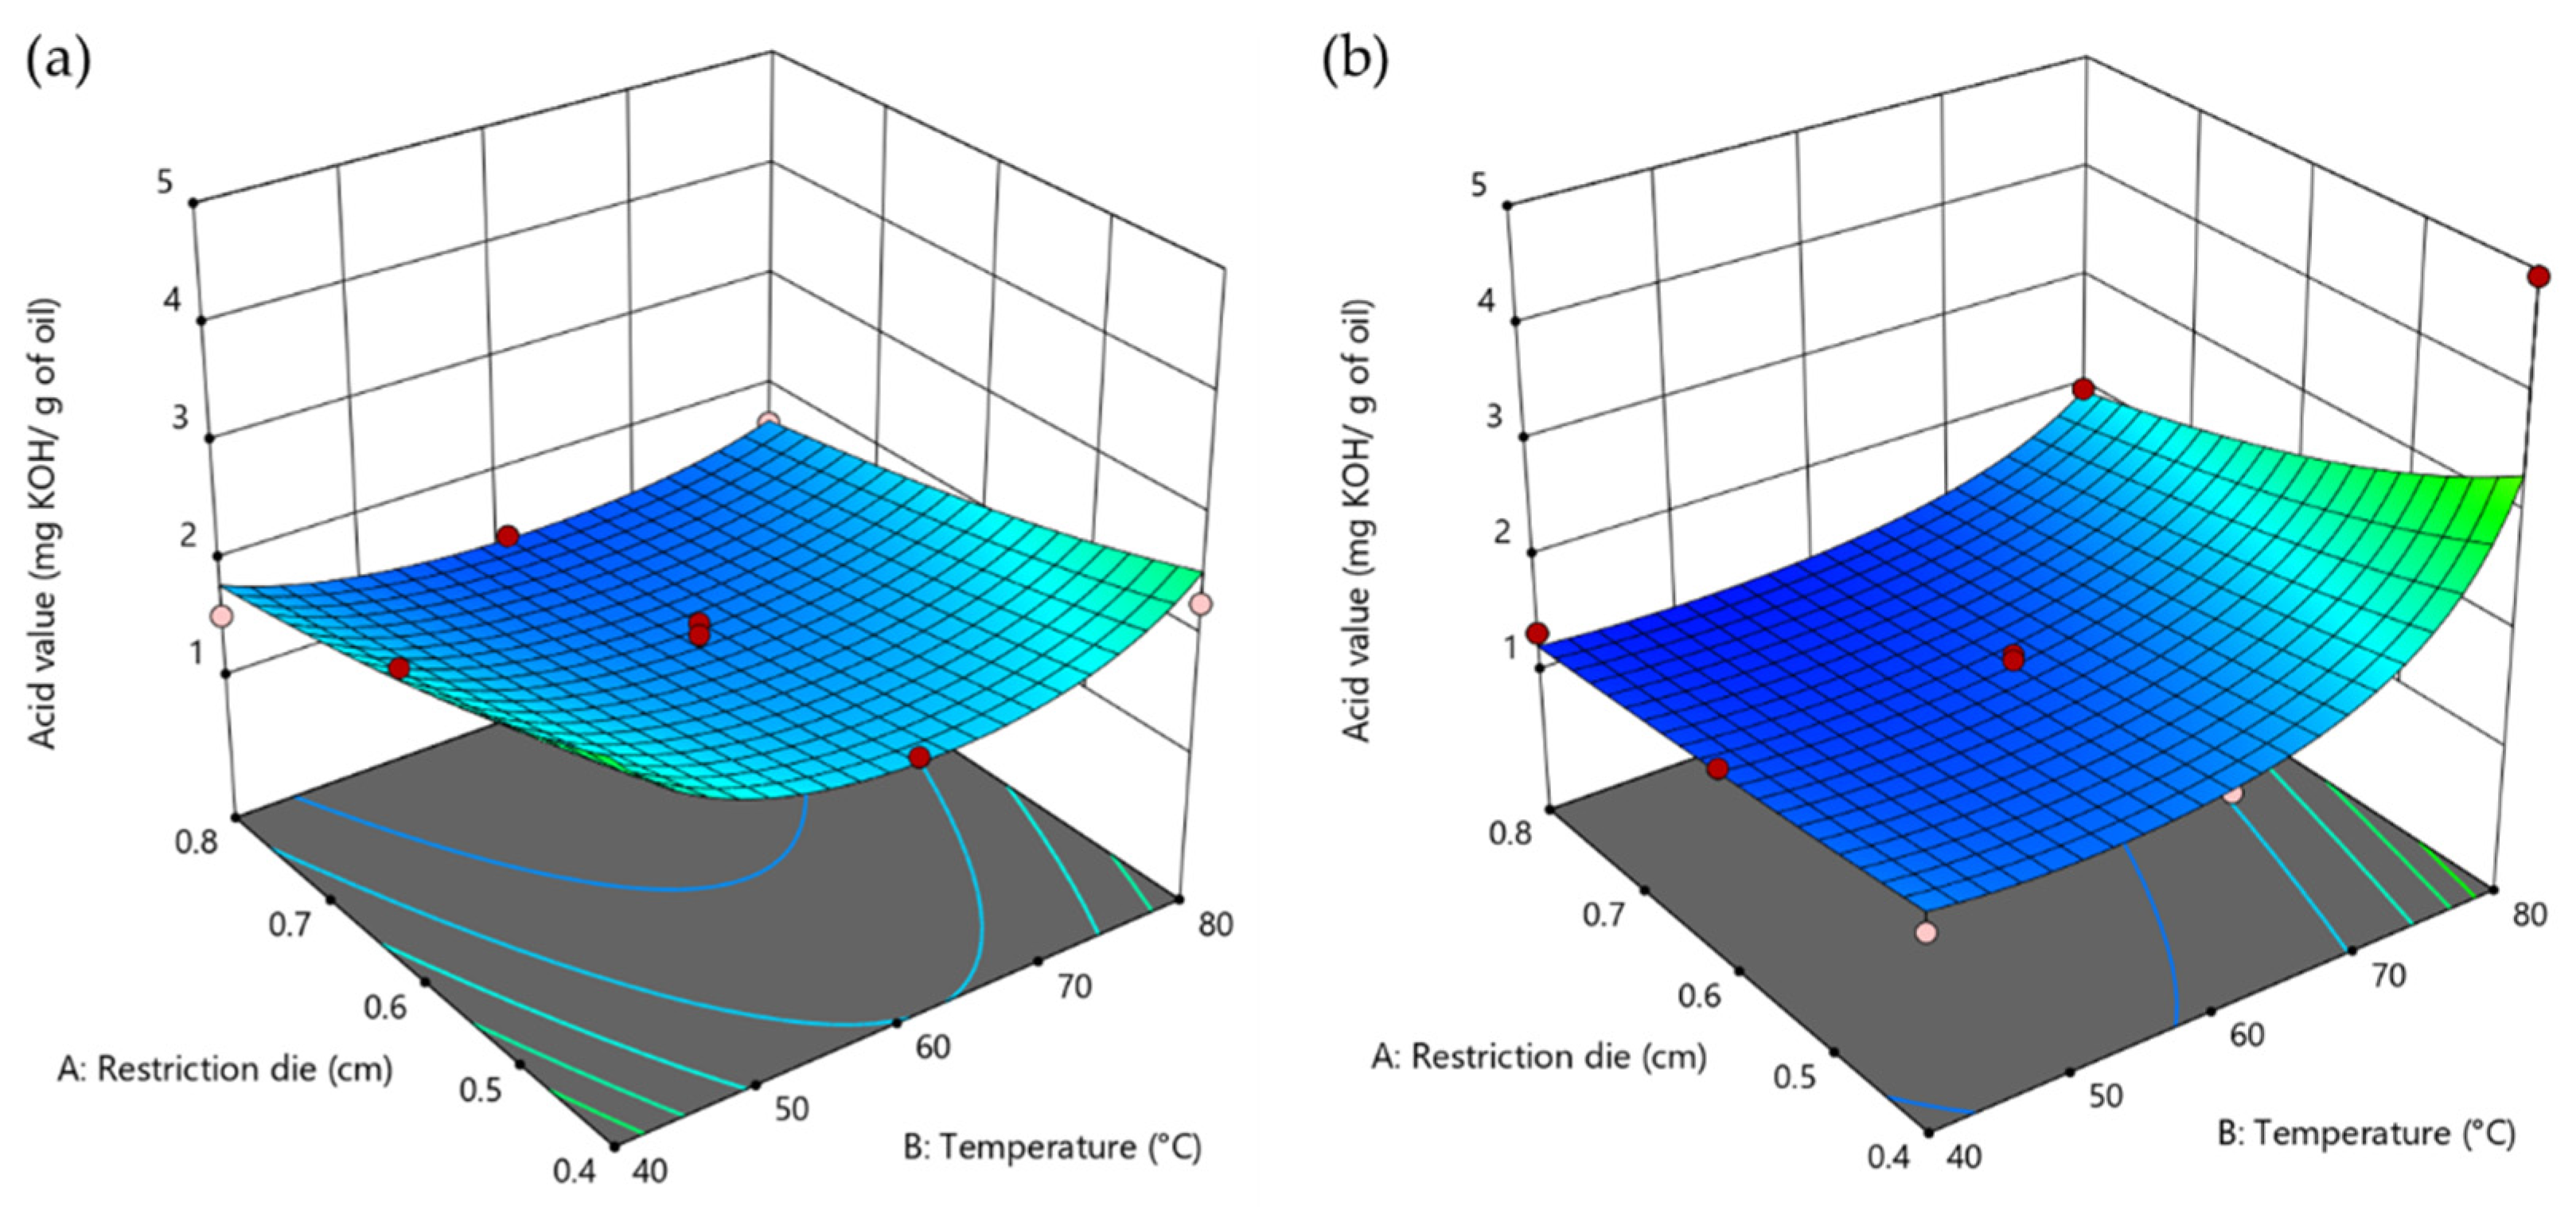
3.2. Acid Values of CSO
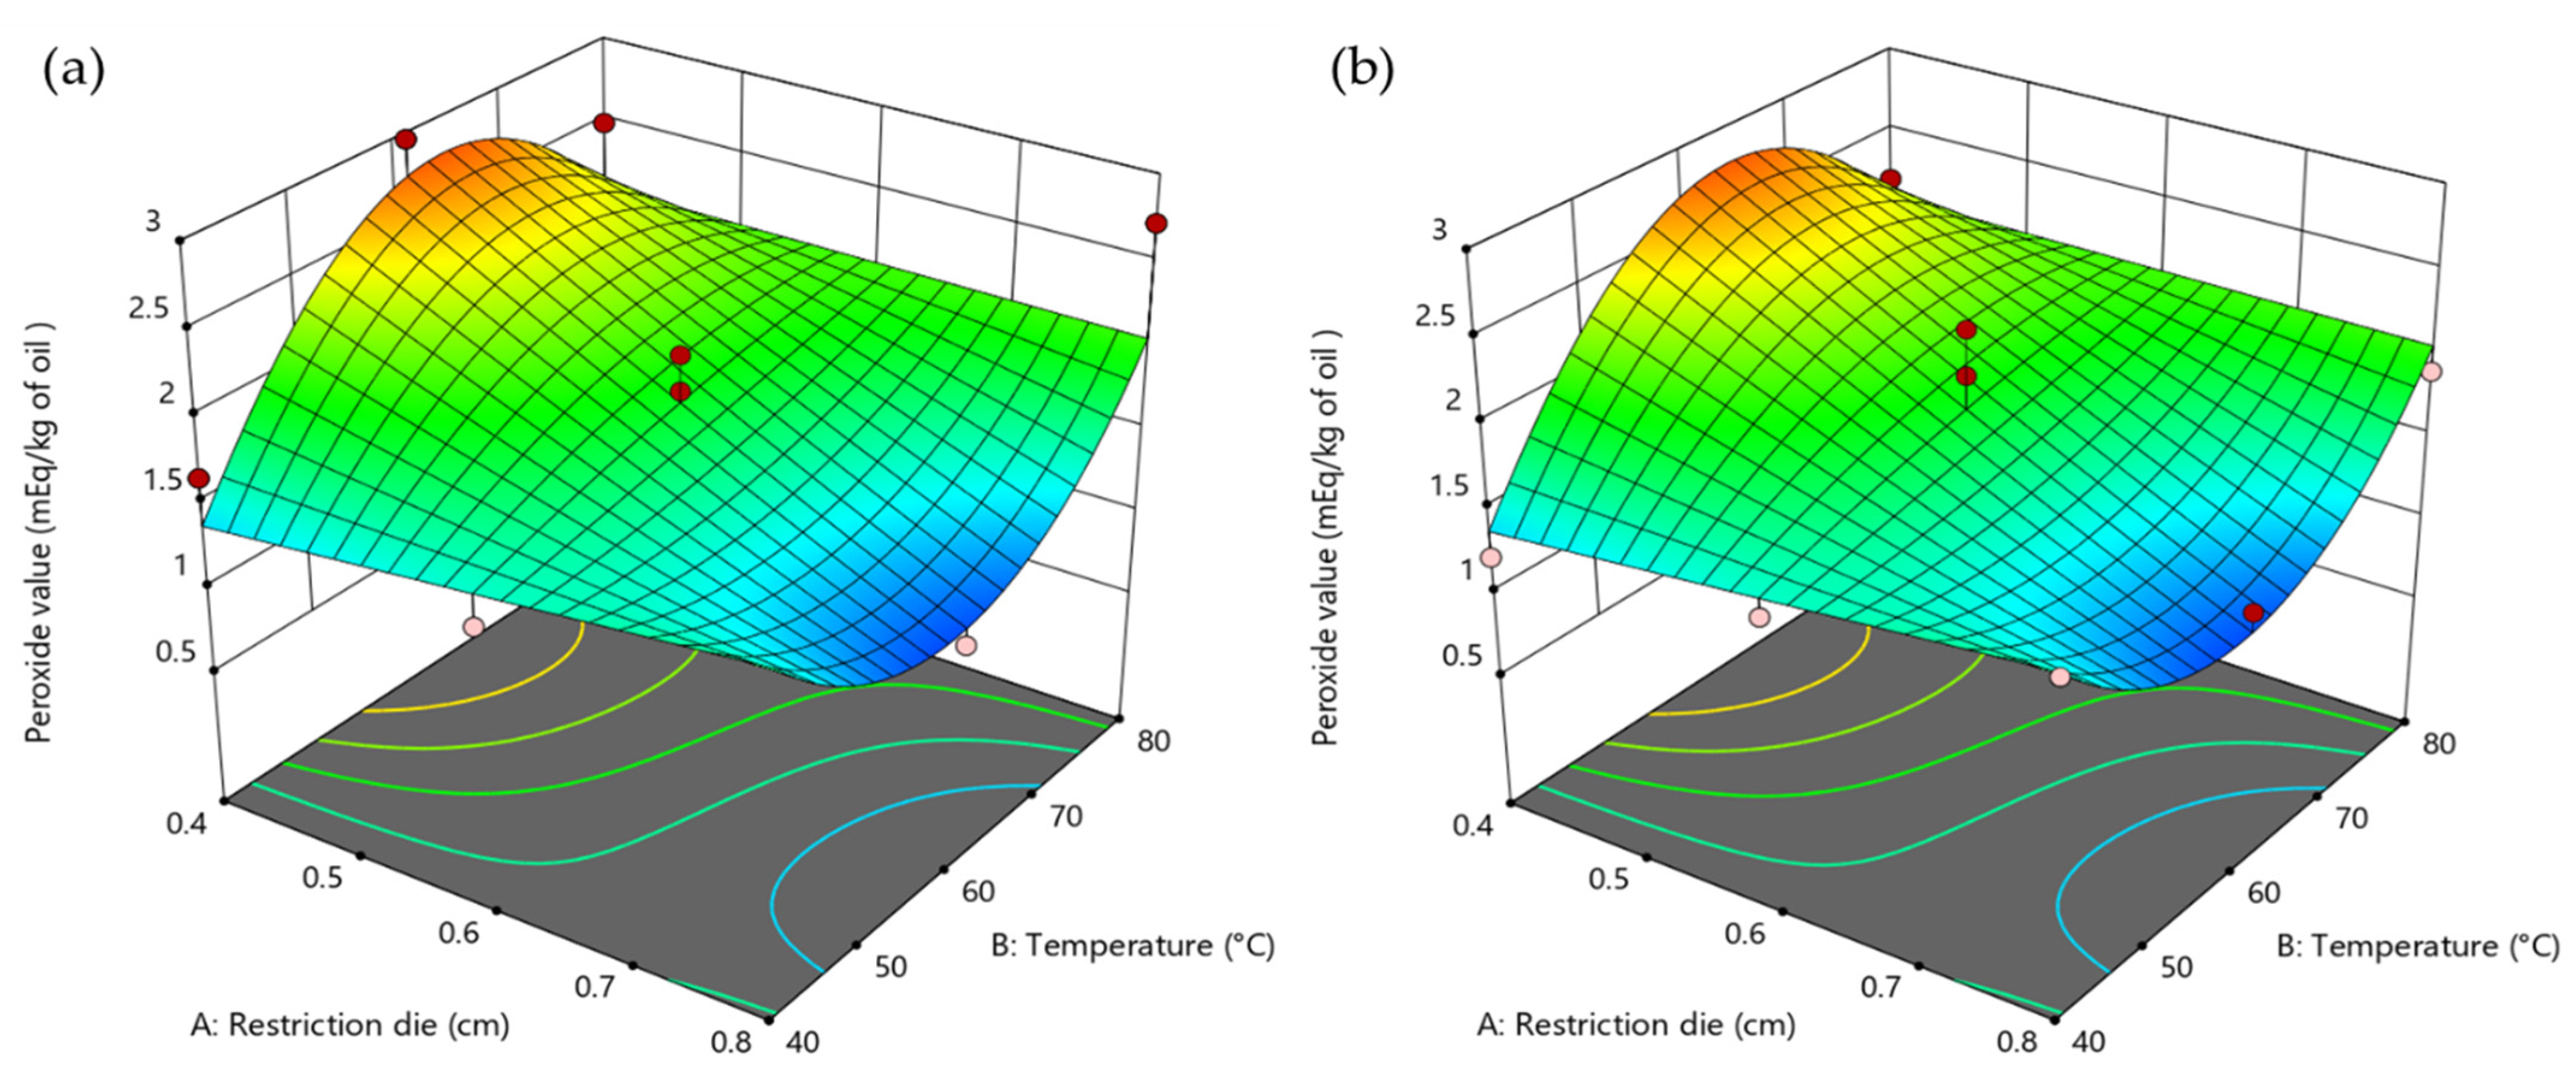
3.3. Peroxide Value of CSO
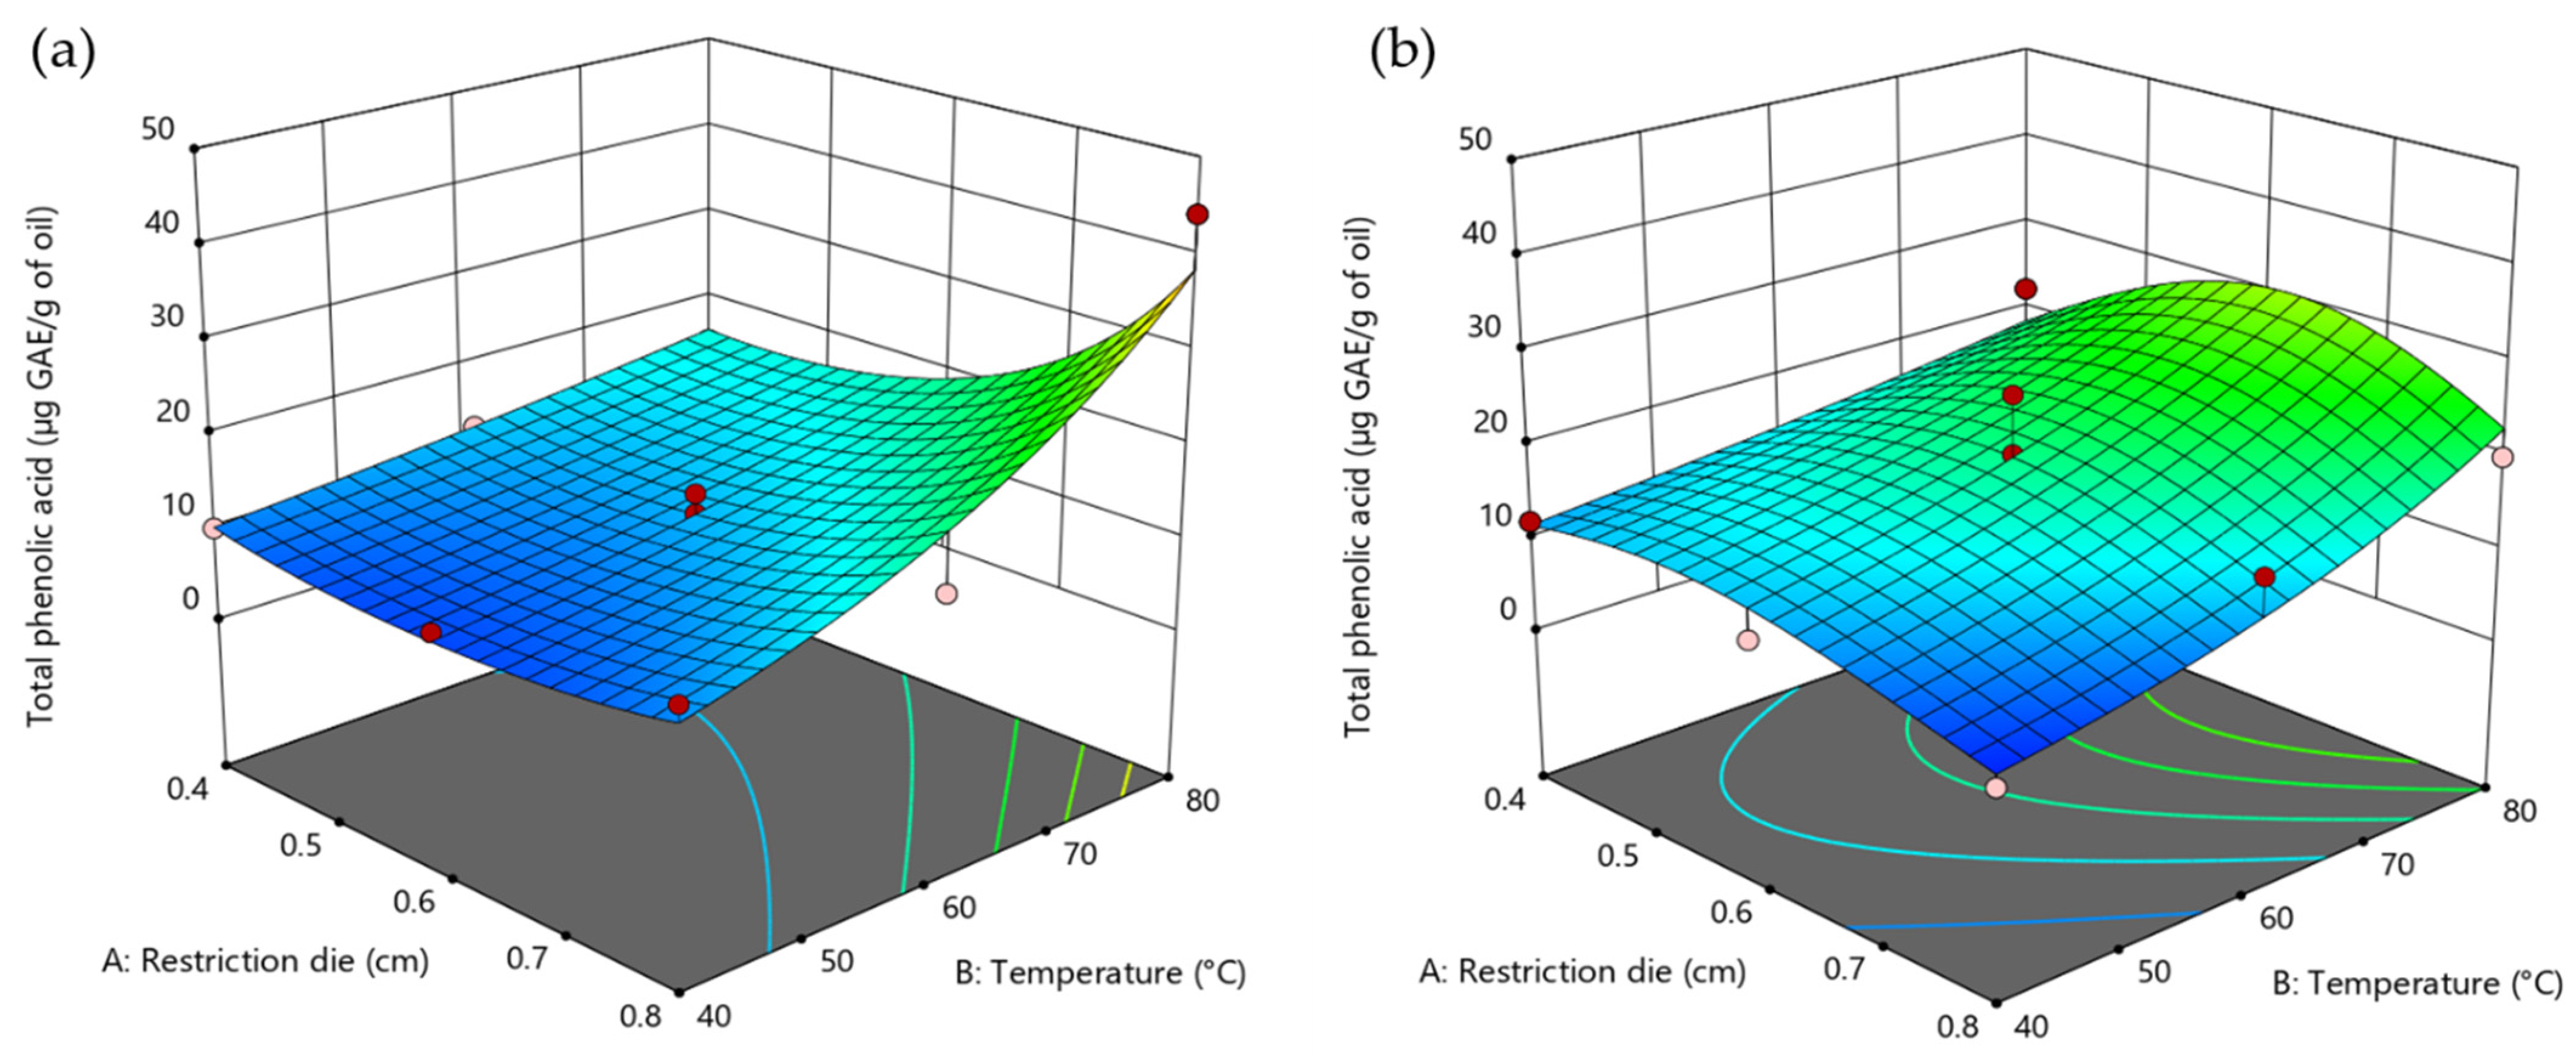
3.4. TPC of CSO
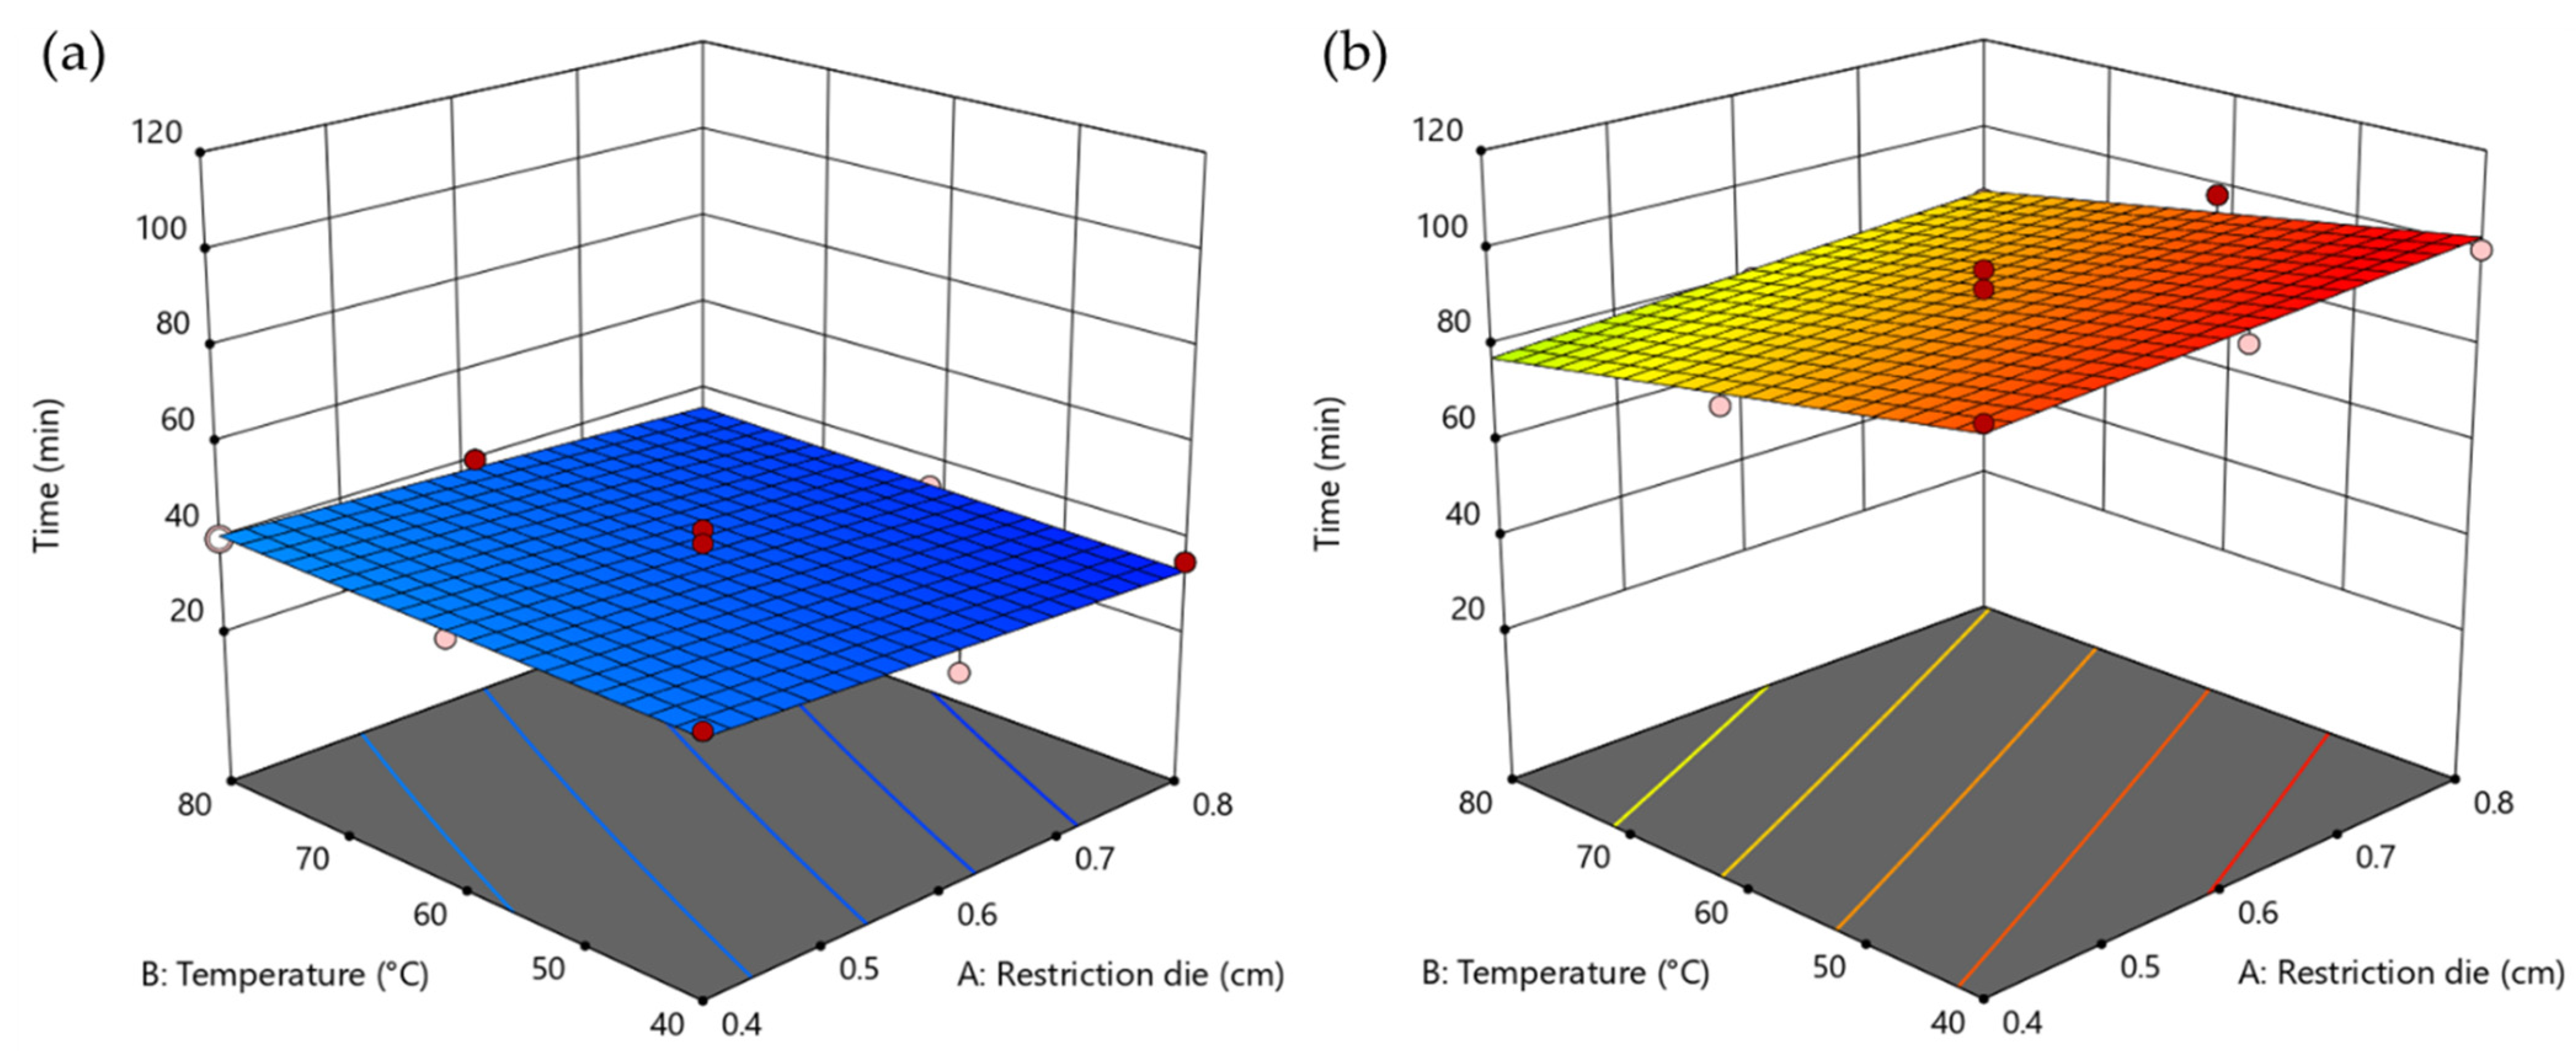
3.5. Pressing Time
3.6. Fatty Acid Composition
3.7. Nitric Oxide (NO) Free Radical Scavenging Activity
3.8. Data Optimization
4. Conclusions
Author Contributions
Funding
Institutional Review Board Statement
Informed Consent Statement
Data Availability Statement
Acknowledgments
Conflicts of Interest
References
- Sonwa, D.J.; Weise, S.F.; Schroth, G.; Janssens, M.J.J.; Shapiro, H.Y. Structure of cocoa farming systems in West and Central Africa: A review. Agrofor. Syst. 2019, 93, 2009–2025. [Google Scholar] [CrossRef]
- Lee, K.W.; Kim, Y.J.; Lee, H.J.; Lee, C.Y. Cocoa has more phenolic phytochemicals and a higher antioxidant capacity than teas and red wine. J. Agric. Food Chem. 2003, 51, 7292–7295. [Google Scholar] [CrossRef]
- Jahurul, M.H.A.; Zaidul, I.S.M.; Norulaini, N.A.N.; Sahena, F.; Jinap, S.; Azmir, J.; Sharif, K.M.; Mohd Omar, A.K. Cocoa butter fats and possibilities of substitution in food products concerning cocoa varieties, alternative sources, extraction methods, composition, and characteristics. J. Food Eng. 2013, 117, 467–476. [Google Scholar] [CrossRef]
- Kris-Etherton, P.M.; Keen, C.L. Evidence that the antioxidant flavonoids in tea and cocoa are beneficial for cardiovascular health. Curr. Opin. Lipidol. 2002, 13, 41–49. [Google Scholar] [CrossRef]
- Keen, C.L.; Holt, R.R.; Oteiza, P.I.; Fraga, C.G.; Schmitz, H.H. Cocoa antioxidants and cardiovascular health. Am. J. Clin. Nutr. 2005, 81, 298S–303S. [Google Scholar] [CrossRef] [Green Version]
- Afoakwa, E.O.; Quao, J.; Takrama, J.; Budu, A.S.; Saalia, F.K. Chemical composition and physical quality characteristics of Ghanaian cocoa beans as affected by pulp pre-conditioning and fermentation. J. Food Sci. Technol. 2013, 50, 1097–1105. [Google Scholar] [CrossRef] [Green Version]
- Asep, E.K.; Jinap, S.; Tan, T.J.; Russly, A.R.; Harcharan, S.; Nazimah, S.A.H. The effects of particle size, fermentation and roasting of cocoa nibs on supercritical fluid extraction of cocoa butter. J. Food Eng. 2008, 85, 450–458. [Google Scholar] [CrossRef]
- Heinrich, U.; Neukam, K.; Tronnier, H.; Sies, H.; Stahl, W. Long-term ingestion of high flavanol cocoa provides photoprotection against UV-induced erythema and improves skin condition in women. J. Nutr. 2006, 136, 1565–1569. [Google Scholar] [CrossRef] [Green Version]
- Scapagnini, G.; Davinelli, S.; Di Renzo, L.; De Lorenzo, A.; Olarte, H.H.; Micali, G.; Cicero, A.F.; Gonzalez, S. Cocoa bioactive compounds: Significance and potential for the maintenance of skin health. Nutrients 2014, 6, 3202–3213. [Google Scholar] [CrossRef] [Green Version]
- Septiyanti, M.; Fauziyah, N.; Harmami, S.B.; Agustian, E.; Meliana, Y. Effect of water content on water in oil (W/O) emulsion properties based on cocoa butter for cosmetic raw material. ARPN J. Eng. Appl. Sci. 2021, 16, 2330–2337. [Google Scholar]
- Myers, S.L.; Yang, C.Z.; Bittner, G.D.; Witt, K.L.; Tice, R.R.; Baird, D.D. Estrogenic and anti-estrogenic activity of off-the-shelf hair and skin care products. J. Expo. Sci. Environ. Epidemiol. 2015, 25, 271–277. [Google Scholar] [CrossRef] [Green Version]
- Noordin, M.I.; Chung, L.Y. Thermostability and polymorphism of Theobroma oil and palm kernel oil as suppository bases. J. Therm. Anal. Calor. 2009, 95, 891–894. [Google Scholar] [CrossRef]
- Tulashie, S.K.; Dodoo, D.; Appiah, G.; Kotoka, F.; Adukpoh, K.E. Oil produced from Ghana cocoa bean for potential industrial applications. Ind. Crops Prod. 2022, 177, 114426. [Google Scholar] [CrossRef]
- Asep, E.K.; Jinap, S.; Russly, A.R.; Jahurul, M.H.A.; Ghafoor, K.; Zaidul, I.S.M. The effect of flow rate at different pressures and temperatures on cocoa butter extracted from cocoa nib using supercritical carbon dioxide. J. Food Sci. Technol. 2016, 53, 2287–2297. [Google Scholar] [CrossRef] [Green Version]
- Okiyama, D.C.G.; Soares, I.D.; Toda, T.A.; Oliveira, A.L.; Rodrigues, C.E.C. Effect of the temperature on the kinetics of cocoa bean shell fat extraction using pressurized ethanol and evaluation of the lipid fraction and defatted meal. Ind. Crops Prod. 2019, 130, 96–103. [Google Scholar] [CrossRef]
- Belwal, T.; Cravotto, C.; Ramola, S.; Thakur, M.; Chemat, F.; Cravotto, G. Bioactive compounds from cocoa husk: Extraction, analysis and applications in food production chain. Foods 2022, 11, 798. [Google Scholar] [CrossRef] [PubMed]
- Rahmawati, I.; Fachri, B.A.; Manurung, Y.H.; Reza, M. Application of response surface methodology in optimization condition of anthocyanin extraction process of cocoa peel waste with microwave-assisted extraction method (MAE). In Proceedings of the IOP Conference Series: Earth and Environmental Science; IOP Publishing: East Java, Indonesia, 2020; Volume 743, p. 01209. [Google Scholar]
- Ibrahim, N.H.; Mahmud, M.S.; Nurdin, S. Microwave-assisted extraction of β-sitosterol from cocoa shell waste. In Proceedings of the IOP Conference Series: Materials Science and Engineering; IOP Publishing: Kuala Lumpur, Malaysia, 2020; Volume 991, p. 012106. [Google Scholar]
- Rebollo-Hernanz, M.; Cañas, S.; Taladrid, D.; Segovia, Á.; Bartolomé, B.; Aguilera, Y.; Martín-Cabrejas, M.A. Extraction of phenolic compounds from cocoa shell: Modeling using response surface methodology and artificial neural networks. Sep. Purif. Technol. 2021, 270, 118779. [Google Scholar] [CrossRef]
- Myers, R.H.; Montgomery, D.C. Response Surface Methodology: Product and Process Optimization Using Designed Experiments, 2nd ed.; John Wiley & Sons: New York, NY, USA, 2002. [Google Scholar]
- Tramontin, D.; Cadena-Carrera, S.E.; Assreuy, J.; Nunes, R.; Santin, J.R.; Bolzan, A.; Quadri, M. Response surface methodology (RSM) to evaluate both the extraction of triterpenes and sterols from jackfruit seed with supercritical CO2 and the biological activity of the extracts. J. Food Sci. Technol. 2021, 58, 3303–3313. [Google Scholar] [CrossRef]
- Woraharn, S.; Lailerd, N.; Sivamaruthi, B.S.; Wangcharoen, W.; Peerajan, S.; Sirisattha, S.; Chaiyasut, C. Development of fermented Hericium erinaceus juice with high content of L-glutamine and L-glutamic acid. Int. J. Food Sci. Technol. 2015, 50, 2104–2112. [Google Scholar] [CrossRef]
- Chaiyasut, C.; Pengkumsri, N.; Sirilun, S.; Peerajan, S.; Khongtan, S.; Sivamaruthi, B.S. Assessment of changes in the content of anthocyanins, phenolic acids, and antioxidant property of Saccharomyces cerevisiae mediated fermented black rice bran. AMB Express 2017, 7, 114. [Google Scholar] [CrossRef]
- Bezerra, M.A.; Santelli, R.E.; Oliveira, E.P.; Villar, L.S.; Escaleira, L.A. Response surface methodology (RSM) as a tool for optimization in analytical chemistry. Talanta 2008, 76, 965–977. [Google Scholar] [CrossRef]
- Rajewski, J.; Dobrzynska-Inger, A. Application of response surface methodology (RSM) for the optimization of chromium (III) synergistic extraction by supported liquid membrane. Membranes 2021, 11, 854. [Google Scholar] [CrossRef]
- Hennessey-Ramos, L.; Murillo-Arango, W.; Vasco-Correa, J.; Paz Astudillo, I.C. Enzymatic extraction and characterization of pectin from cocoa pod husks (Theobroma cacao L.) using Celluclast® 1.5 L. Molecules 2021, 26, 1473. [Google Scholar] [CrossRef]
- Fuentes, E.; Báez, M.E.; Bravo, M.; Cid, C.; Labra, F. Determination of total phenolic content in olive oil samples by UV-visible spectrometry and multivariate calibration. Food Anal. Methods 2012, 5, 1311–1319. [Google Scholar] [CrossRef]
- Blainski, A.; Lopes, G.C.; de Mello, J.C.P. Application and analysis of the Folin Ciocalteu method for the determination of the total phenolic content from Limonium Brasiliense L. Molecules 2013, 18, 6852–6865. [Google Scholar] [CrossRef] [Green Version]
- Sirilun, S.; Sivamaruthi, B.S.; Pengkumsri, N.; Saelee, M.; Chaiyasut, K.; Tuntisuwanno, N.; Suttajit, M.; Peerajan, S.; Chaiyasut, C. Impact of different pre-treatment strategies on the quality of fatty acid composition, tocols content and metabolic syndrome-related activities of Perilla frutescens seed oil. J. Appl. Pharm. Sci. 2016, 6, 001–008. [Google Scholar] [CrossRef] [Green Version]
- Pengkumsri, N.; Chaiyasut, C.; Saenjum, C.; Sirilun, S.; Peerajan, S.; Suwannalert, P.; Sirisattha, S.; Sivamaruthi, B.S. Physicochemical and antioxidative properties of black, brown and red rice varieties of northern Thailand. Food Sci. Technol. 2015, 35, 331–338. [Google Scholar] [CrossRef] [Green Version]
- Tulashie, S.K.; Kotoka, F. Kinetics and thermodynamic studies on Moringa oleifera oil extraction for biodiesel production via transesterification. Biofuels 2019, 13, 341–349. [Google Scholar] [CrossRef]
- Meziane, S.; Kadi, H. Kinetics and thermodynamics of oil extraction from olive cake. JAOCS 2008, 85, 391–396. [Google Scholar] [CrossRef]
- Amarante, R.C.A.; Oliveira, P.M.; Schwantes, F.K.; Moron-Villarreyes, J.A. Oil extraction from castor cake using ethanol: Kinetics and thermodynamics. Ind. Eng. Chem. Res. 2014, 53, 6824–6829. [Google Scholar] [CrossRef]
- Kraljić, K.; Stjepanović, T.; Obranović, M.; Pospišil, M.; Balbino, S.; Škevin, D. Influence of conditioning temperature on the quality, nutritional properties and volatile profile of virgin rapeseed oil. Food Technol. Biotechnol. 2018, 56, 562–572. [Google Scholar] [CrossRef]
- Çakaloğlu, B.; Özyurt, V.H.; Ötleş, S. Cold press in oil extraction. A review. Ukrainian Food Journal. 2018, 7, 640–654. [Google Scholar] [CrossRef]
- Oracz, J.; Nebesny, E. Antioxidant properties of cocoa beans (Theobroma cacao L.): Influence of cultivar and roasting conditions. Int. J. Food Prop. 2016, 6, 1242–1258. [Google Scholar] [CrossRef] [Green Version]
- Oliviero, T.; Capuano, E.; Cämmerer, B.; Fogliano, V. Influence of roasting on the antioxidant activity and HMF formation of a cocoa bean model systems. J. Agric. Food Chem. 2009, 57, 147–1452. [Google Scholar] [CrossRef]
- Santoso, H.; Iryantoa; Inggrida, M. Effects of temperature, pressure, preheating time and pressing time on rubber seed oil extraction using hydraulic press. Procedia Chem. 2014, 9, 248–256. [Google Scholar] [CrossRef] [Green Version]
- Martínez, M.L.; Bordón, M.G.; Lallana, R.L.; Ribotta, P.D.; Maestri, D.M. Optimization of sesame oil extraction by cold pressing at low temperature. Food Bioproc. Tech. 2017, 10, 1113–1121. [Google Scholar] [CrossRef]
- Ostrowska-Ligęza, E.; Dolatowska-Żebrowska, K.; Wirkowska-Wojdyła, M.; Bryś, J.; Górska, A. Comparison of thermal characteristics and fatty acids composition in raw and roasted cocoa beans from Peru (Criollo) and Ecuador (Forastero). Appl. Sci. 2021, 11, 2698. [Google Scholar] [CrossRef]
- Torres-Moreno, M.; Torrescasana, E.; Salas-Salvado, J.; Blanch, C. Nutritional composition and fatty acids profile in cocoa beans and chocolates with different geographical origin and processing conditions. Food Chem. 2015, 166, 125–132. [Google Scholar] [CrossRef]
- Żyżelewicz, D.; Budryn, G.; Krysiak, W.; Oracz, J.; Nebesny, E.; Bojczuk, M. Influence of roasting conditions on fatty acid composition and oxidative changes of cocoa butter extracted from cocoa bean of Forastero variety cultivated in Togo. Food Res. Int. 2014, 63, 328–343. [Google Scholar] [CrossRef]
- Shen, M.C.; Zhao, X.; Siegal, G.P.; Desmond, R.; Hardy, R.W. Dietary stearic acid leads to a reduction of visceral adipose tissue in athymic nude mice. PLoS ONE 2014, 9, e104083. [Google Scholar] [CrossRef] [Green Version]
- van Rooijen, M.A.; Mensink, R.P. Palmitic Acid Versus Stearic Acid: Effects of interesterification and intakes on cardiometabolic risk markers-A systematic review. Nutrients 2020, 12, 615. [Google Scholar] [CrossRef] [Green Version]
- Carrillo, C.; Cavia, M.M.; Alonso-Torre, S. Role of oleic acid in immune system; mechanism of action; a review. Nutr. Hosp. 2012, 27, 978–990. [Google Scholar]
- Carrillo, C.; Cavia, M.M.; Alonso-Torre, S.R. Antitumor effect of oleic acid; mechanisms of action: A review. Nutr. Hosp. 2012, 27, 1860–1865. [Google Scholar]


| STD | Restriction Die (cm) | Temperature (°C) | Sieve Size |
|---|---|---|---|
| 1 | 0.4 | 40 | Level 1 (>1.4 mm) |
| 2 | 0.8 | 40 | Level 1 (>1.4 mm) |
| 3 | 0.4 | 80 | Level 1 (>1.4 mm) |
| 4 | 0.8 | 80 | Level 1 (>1.4 mm) |
| 5 | 0.4 | 60 | Level 1 (>1.4 mm) |
| 6 | 0.8 | 60 | Level 1 (>1.4 mm) |
| 7 | 0.6 | 40 | Level 1 (>1.4 mm) |
| 8 | 0.6 | 80 | Level 1 (>1.4 mm) |
| 9 | 0.6 | 60 | Level 1 (>1.4 mm) |
| 10 | 0.6 | 60 | Level 1 (>1.4 mm) |
| 11 | 0.6 | 60 | Level 1 (>1.4 mm) |
| 12 | 0.4 | 40 | Level 2 (<1.4 mm) |
| 13 | 0.8 | 40 | Level 2 (<1.4 mm) |
| 14 | 0.4 | 80 | Level 2 (<1.4 mm) |
| 15 | 0.8 | 80 | Level 2 (<1.4 mm) |
| 16 | 0.4 | 60 | Level 2 (<1.4 mm) |
| 17 | 0.8 | 60 | Level 2 (<1.4 mm) |
| 18 | 0.6 | 40 | Level 2 (<1.4 mm) |
| 19 | 0.6 | 80 | Level 2 (<1.4 mm) |
| 20 | 0.6 | 60 | Level 2 (<1.4 mm) |
| 21 | 0.6 | 60 | Level 2 (<1.4 mm) |
| 22 | 0.6 | 60 | Level 2 (<1.4 mm) |
| STD | Yield (%) | Acid Value (mg KOH/g of Oil) | Peroxide Value (mEq/Kg of Oil) | Total Phenolic Acid (µg GAE/g of Oil) | Time (Min) | |||||
|---|---|---|---|---|---|---|---|---|---|---|
| Observed | Predicted | Observed | Predicted | Observed | Predicted | Observed | Predicted | Observed | Predicted | |
| 1 | 44.98 | 44.44 | 1.34 | 2.68 | 1.66 | 1.37 | 9.99 | 9.78 | 40.00 | 38.65 |
| 2 | 46.10 | 45.82 | 1.52 | 1.75 | 1.86 | 1.70 | 12.32 | 10.29 | 35.00 | 33.02 |
| 3 | 38.76 | 37.88 | 2.28 | 2.42 | 2.48 | 2.08 | 15.02 | 15.76 | 40.00 | 40.68 |
| 4 | 34.65 | 32.85 | 1.65 | 1.64 | 2.72 | 2.05 | 44.16 | 36.63 | 33.00 | 35.65 |
| 5 | 41.83 | 41.16 | 1.91 | 1.81 | 2.96 | 2.74 | 12.75 | 12.41 | 38.00 | 39.67 |
| 6 | 53.68 | 39.34 | 1.39 | 1.34 | 0.99 | 1.07 | 13.45 | 19.42 | 34.00 | 34.33 |
| 7 | 45.02 | 45.13 | 2.30 | 2.11 | 1.35 | 1.53 | 8.85 | 7.58 | 31.00 | 35.83 |
| 8 | 33.41 | 35.37 | 1.84 | 1.95 | 1.71 | 2.06 | 14.58 | 18.15 | 40.00 | 38.17 |
| 9 | 45.99 | 40.25 | 1.79 | 1.54 | 1.95 | 1.88 | 12.16 | 11.73 | 42.00 | 37.00 |
| 10 | 47.93 | 40.25 | 1.33 | 1.54 | 2.16 | 1.88 | 9.90 | 11.73 | 35.00 | 37.00 |
| 11 | 32.40 | 40.25 | 1.69 | 1.54 | 0.93 | 1.88 | 14.31 | 11.73 | 39.00 | 37.00 |
| 12 | 36.35 | 35.38 | 1.39 | 1.53 | 1.22 | 1.37 | 11.87 | 11.16 | 97.00 | 95.16 |
| 13 | 44.21 | 42.42 | 1.32 | 1.19 | 1.68 | 1.70 | 5.18 | 6.30 | 100.00 | 102.60 |
| 14 | 45.01 | 42.69 | 4.95 | 3.05 | 2.19 | 2.08 | 22.31 | 17.98 | 93.00 | 40.68 |
| 15 | 45.29 | 43.32 | 1.96 | 1.89 | 1.90 | 2.05 | 19.91 | 22.41 | 84.00 | 85.83 |
| 16 | 36.86 | 39.03 | 1.55 | 1.54 | 2.58 | 2.74 | 10.73 | 14.16 | 84.00 | 86.48 |
| 17 | 40.22 | 42.87 | 3.93 | 1.19 | 1.21 | 1.07 | 16.28 | 11.88 | 98.00 | 94.21 |
| 18 | 41.50 | 38.90 | 1.39 | 1.34 | 1.43 | 1.53 | 9.16 | 12.19 | 96.00 | 98.88 |
| 19 | 44.08 | 43.00 | 1.93 | 2.32 | 1.41 | 2.06 | 26.88 | 29.19 | 80.00 | 81.81 |
| 20 | 36.48 | 40.95 | 1.46 | 1.34 | 1.75 | 1.88 | 19.69 | 18.86 | 96.00 | 90.34 |
| 21 | 39.62 | 40.95 | 1.07 | 1.34 | 2.08 | 1.88 | 26.04 | 18.86 | 92.00 | 90.34 |
| 22 | 40.84 | 40.95 | 1.41 | 1.34 | 2.35 | 1.88 | 18.93 | 18.86 | 89.00 | 90.34 |
| Responses | Models | Model (p-Value) | Lack of Fit (p-Value) | R2 | Adjusted R2 | Predicted R2 | Adequate Precision |
|---|---|---|---|---|---|---|---|
| Yield (%) | 2FI | 0.0472 | 0.9877 | 0.5782 | 0.3835 | 0.2255 | 6.2858 |
| Acid value | Reduced quadratic | 0.0008 | 0.9395 | 0.7495 | 0.6601 | 0.5050 | 10.3548 |
| Peroxide value | Reduced cubic | 0.0110 | 0.8405 | 0.5756 | 0.4430 | 0.2474 | 7.6494 |
| TPC | Reduced cubic | 0.0003 | 0.2398 | 0.8152 | 0.7228 | 0.5245 | 12.0579 |
| Time | 2FI | <0.0001 | 0.6063 | 0.9902 | 0.9861 | 0.9779 | 35.8860 |
| Term | Estimated Parameters | |||||||||
|---|---|---|---|---|---|---|---|---|---|---|
| Yield of CSO | p-Value | Time | p-Value | Acid Value | p-Value | Peroxide Value | p-Value | TPC | p-Value | |
| Restriction die (A) | 0.5019 | 0.6443 | 0.6008 | 0.5781 | 0.1023 | 0.0055 | −0.7268 | 0.0010 | 0.0295 | 0.3478 |
| Temperature (B) | −1.41 | 0.1832 | −3.68 | 0.0036 | −0.0736 | 0.0248 | 0.2316 | 0.0425 | 0.1896 | <0.0001 |
| Sieve size (C) | 0.3513 | 0.6632 | 26.67 | <0.0001 | 0.0511 | 0.0346 | 0.1031 | 0.0078 | ||
| Restriction die × Temperature (A × B) | −1.60 | 0.2164 | 0.1513 | 0.9119 | −0.0803 | 0.5412 | 0.0861 | 0.0363 | ||
| Restriction die × Sieve size (A × C) | 1.41 | 0.2058 | 3.27 | 0.0079 | −0.0676 | 0.0428 | ||||
| Temperature × Sieve size (B × C) | 3.47 | 0.0044 | −4.85 | 0.0004 | −0.0935 | 0.0065 | ||||
| Restriction die × Restriction die (A2) | −0.0205 | 0.6565 | ||||||||
| Temperature × Temperature (B2) | −0.1631 | 0.0023 | −0.0726 | 0.6474 | ||||||
| Restriction die × Temperature2 (A × B2) | 0.7947 | 0.0026 | ||||||||
| Restriction die2 × Sieve size (A2 × C) | −0.1422 | 0.0070 | ||||||||
| Fatty Acids | Fatty Acid Content (%) | |||
|---|---|---|---|---|
| Sieve Size (>1.4 mm) | Sieve Size (<1.4 mm) | |||
| Low Temp. (STD 2) | High Temp. (STD 6) | Low Temp. (STD 17) | High Temp. (STD 15) | |
| Butyric acid (C4:0) | - | - | - | - |
| Caproic acid (C6:0) | - | - | - | - |
| Caprylic acid (C8:0) | - | - | - | - |
| Capric acid (C10:0) | - | - | - | - |
| Lauric acid (C12:0) | - | - | - | - |
| Myristic acid (C14:0) | 0.05 | 0.05 | 0.05 | 0.06 |
| Pentadecylic acid (C15:0) | 0.02 | 0.01 | 0.01 | 0.02 |
| Palmitic acid (C16:0) | 22.63 | 22.74 | 22.96 | 22.24 |
| Palmitoleic acid (C16:1) | 0.19 | 0.17 | 0.18 | 0.24 |
| Margaric acid (C17:0) | 0.22 | 0.20 | 0.21 | 0.26 |
| Heptadecenoic acid (C17:1) | 0.01 | 0.01 | 0.01 | 0.01 |
| Stearic acid (C18:0) | 39.02 | 40.12 | 39.96 | 37.83 |
| Elaidic acid (C18:1 n-9 trans) | - | - | - | - |
| Oleic acid (C18:1 n-9 cis) | 33.23 | 32.51 | 32.43 | 34.07 |
| Linolelaidic acid (C18:2 n-6 trans) | - | - | - | - |
| Linoleic acid (C18:2 n-6 cis) | 3.08 | 2.84 | 2.89 | 3.54 |
| γ-Linolenic acid (C18:3 n-6) | - | - | - | - |
| α-Linolenic acid (C18:3 n-3) | 0.15 | 0.12 | 0.12 | 0.18 |
| Arachidic acid (C20:0) | 1.24 | 1.08 | 1.06 | 1.37 |
| Eicosenoic acid (C20:1 n-9) | - | - | - | - |
| Eicosadieoic acid (C20:2 n-6) | - | - | - | - |
| Dihomogammalinolenic acid (C20:3 n-6) | - | - | - | - |
| Arachidonic acid (C20:4 n-6) | - | - | - | - |
| cis-11,14,17-Eicosatrienoic acid (C20:3 n-3) | - | - | - | - |
| Behenic acid (C22:0) | 0.11 | 0.09 | 0.09 | 0.13 |
| Erucic acid (C22:1 n-9) | - | - | - | - |
| Eicosapentaenoic acid (C20:5 n-3) | - | - | - | - |
| Tricosanoic acid (C23:0) | - | - | - | - |
| Lignoceric acid (C24:0) | 0.04 | 0.03 | 0.03 | 0.05 |
| Nervonic acid (C24:1) | - | - | - | - |
| Docosahexaenoic acid (C22:6 n-3) | - | - | - | - |
| Docosapentaenoic acid (C22:5) | - | - | - | - |
| Sieve Size (>1.4 mm) | Sieve Size (<1.4 mm) | ||
|---|---|---|---|
| Low Temp. (STD 2) | High Temp. (STD 6) | Low Temp. (STD 17) | High Temp. (STD 15) |
| 45.03 ± 0.13 a | 147.36 ± 28.47 b | 61.98 ± 0.51 a | 128.46 ± 4.33 b |
Publisher’s Note: MDPI stays neutral with regard to jurisdictional claims in published maps and institutional affiliations. |
© 2022 by the authors. Licensee MDPI, Basel, Switzerland. This article is an open access article distributed under the terms and conditions of the Creative Commons Attribution (CC BY) license (https://creativecommons.org/licenses/by/4.0/).
Share and Cite
Saelee, M.; Sivamaruthi, B.S.; Tansrisook, C.; Duangsri, S.; Chaiyasut, K.; Kesika, P.; Peerajan, S.; Chaiyasut, C. Response Surface Methodological Approach for Optimizing Theobroma cacao L. Oil Extraction. Appl. Sci. 2022, 12, 5482. https://0-doi-org.brum.beds.ac.uk/10.3390/app12115482
Saelee M, Sivamaruthi BS, Tansrisook C, Duangsri S, Chaiyasut K, Kesika P, Peerajan S, Chaiyasut C. Response Surface Methodological Approach for Optimizing Theobroma cacao L. Oil Extraction. Applied Sciences. 2022; 12(11):5482. https://0-doi-org.brum.beds.ac.uk/10.3390/app12115482
Chicago/Turabian StyleSaelee, Manee, Bhagavathi Sundaram Sivamaruthi, Chawin Tansrisook, Sasiwimon Duangsri, Khontaros Chaiyasut, Periyanaina Kesika, Sartjin Peerajan, and Chaiyavat Chaiyasut. 2022. "Response Surface Methodological Approach for Optimizing Theobroma cacao L. Oil Extraction" Applied Sciences 12, no. 11: 5482. https://0-doi-org.brum.beds.ac.uk/10.3390/app12115482