Article

Robustness for the Starting Point of Two Iterative Methods for Fitting Debye or Cole–Cole Models to a Dielectric Permittivity Spectrum †

by
Roberto Dima
1,*,
Giovanni Buonanno
2,
Sandra Costanzo
2,3,4,5 and
Raffaele Solimene
1,5,6
1
Department of Engineering, University of Campania, 81031 Aversa, Italy
2
Dipartimento di Ingegneria Informatica, Modellistica, Elettronica e Sistemistica, University of Calabria, 87036 Rende, Italy
3
Institute for Electromagnetic Sensing of the Environment (IREA), National Research Council (CNR), 80124 Naples, Italy
4
National Inter-University Research Center on the Interactions between Electromagnetic Fields and Biosystems (ICEmB), 16145 Genoa, Italy
5
National Inter-University Consortium for Telecommunications (CNIT), 43124 Parma, Italy
6
Department of Electrical Engineering, Indian Institute of Technology Madras, Chennai 600036, India
*
Author to whom correspondence should be addressed.
This paper is an extended version of our paper published in Engineering Proceedings 2021, 11, 45.
Submission received: 21 April 2022 / Revised: 25 May 2022 / Accepted: 31 May 2022 / Published: 3 June 2022

Abstract

:
Curve-fitting means the determination of the set of parameters that best fit the input data set as expressed by a given function that is usually non-linear. The paper addresses the curve fitting of Debye and Cole–Cole models to a dielectric permittivity spectrum. The success of a nonlinear curve fit heavily depends on the choice of the algorithm and how close the starting point is to the solution. For these reasons, two different algorithms, the Levenberg–Marquardt and the Variable Projection algorithms, were used for constrained optimization and compared, with particular reference to robustness with respect to the choice of the starting point of the reconstruction procedure. The dielectric spectrum of blood plasma with different glucose concentrations is taken as reference data and a Monte Carlo analysis was conducted to evaluate accuracy and precision in the two methods provided as the distance of the initial parameters from the true value’s changes. In general, both algorithms with constraints on the parameters provide good results for practical situations, although the Variable Projection Algorithm has a greater computational burden for large data sets.

1. Introduction

Debye and Cole–Cole models have been developed in the context of dielectric relaxation phenomenon to provide a synthetic description of an experimentally measured dielectric permittivity spectrum. They are used in many contexts and with many different materials: in electrochemical impedance spectroscopy [1], particularly in bioimpedance spectroscopy [2], electromagnetic dosimetry [3], and biomedical applications [4,5,6,7,8,9,10]. Fitting Debye and Cole–Cole models to data is, therefore, a topic of great interest in a research context, and a variety of optimization algorithms has been proposed in the literature in this regard [11,12,13,14,15,16].
In the framework of the design of non-invasive glucose monitoring devices, which can considerably improve the quality of life for diabetic people [17], developing accurate and precise fitting methods for blood models, with different glucose concentrations, is essential: it affects the simulation stage required for sensor design [18] and the “synthetic view” (in terms of a few parameters) extracted from sensor response data.
For these reasons many models of the permittivity of blood (or similar materials) have been proposed in the literature, fitting Debye or Cole–Cole models to experimental measurements [6,7,8,9,10,19,20]. The studies differ in the materials used (human blood, animal blood, plasma, and water/glucose solutions), frequency ranges, glucose concentrations, and algorithms used. Unfortunately, little or no importance was given to the choice of fitting algorithm and its implementation. Hence, the decision to produce this work was motivated and we aim to provide valuable insights into the fitting problem, particularly in the context of blood permittivity modeling.
More in detail, starting from the dielectric spectrum, which is assumed known over a certain number of frequencies, we aim at estimating the parameters of a single-pole Debye model and a single-pole Cole–Cole model. As it is well known, this entails solving a nonlinear inverse problem, which here is addressed by two different methods: the classical Levenberg–Marquardt method [21,22] and the Variable Projection algorithm [23]. We evaluate how sensitive the two methods are with respect to the starting points of the parameters and with what accuracy and precision these parameters can be estimated. In order to compare the two methods, we generate synthetic dielectric spectra by employing a single-pole Cole–Cole model, using data from the literature [24] as the true values for its parameters, and we use them as reference.
The present work is an extended version of the conference paper [25]. In the previous work, only one set of intervals was considered for initial value estimations. Here, this is extended and completed by considering wider intervals and including also parameter α , which in [25] was practically fixed at the value 0.1. In addition, we also consider curve fitting applied to the Debye model in order to compare the two permittivity models as well. Finally, the fitting algorithms are equipped with proper constraints that allow the obtainment of algorithms with much better performance in terms of execution time and convergence.
We consider first-order models to perform the comparison as they are a good trade-off between complexity and fitting capability. In [26], the dielectric properties of a blood plasma sample are fitted to single-pole, two-pole, and three-pole Cole–Cole models, and it was found that the single-pole model is sufficient to represent data with lower numbers of parameters and computational time. Furthermore, all blood glucose models we are aware of from the literature use Debye or Cole–Cole single-pole models.

2. Materials and Methods

In this section two well-known models for complex relative permittivity ε r = ε / ε 0 are briefly presented.

2.1. Debye Model

The Debye equation is used to describe the relaxation response of a group of ideal noninteracting dipoles relative to an applied alternating electric field [27]. In most biological tissues, there are different polarization phenomena, and each one is characterized by its own relaxation time τ n . The Debye relaxation equation with N poles describes the complex relative permittivity of the medium as a function of the angular frequency ω of the applied electric field as follows:
ε r ( ω ) = ε + n = 1 N ε s n ε 1 + j ω τ n
where N is the number of the poles and, thus, the order of the Debye model, ε = lim ω ε r ( ω ) is the high-frequency permittivity. For each addend considered individually, ε s n is the static permittivity, and τ n is the relaxation time constant. Also in this case, to take into account the conductivity of the material considered, the conductive term is added, obtaining the following expression:
ε r ( ω ) = ε + n = 1 N ε s n ε 1 + j ω τ n + σ s j ω ε 0
where σ s is the static ionic conductivity.

2.2. Cole–Cole Model

The Cole–Cole model [28] is widely used to describe the complex relative permittivity of biological tissues, ε r ( ω ) = ε ( ω ) / ε 0 , and its equation is described as follows:
ε r ( ω ) = ε + n = 1 N ε s n ε 1 + ( j ω τ n ) 1 α n
in which N is the number of poles and thence the order of the model, ε = lim ω , ε r ( ω ) , is the permittivity at high frequencies, σ s is the static ionic conductivity, and ε s n , τ n , and α n are the static permittivity, the relaxation time constant, and the distribution parameter of the n-th addend of the summation, respectively.
To take into account the conductivity of the material considered, the conductive term is added, obtaining the following expression:
ε r ( ω ) = ε + n = 1 N ε s n ε 1 + ( j ω τ n ) 1 α n + σ s j ω ε 0
where σ s is the static ionic conductivity.
Such a model incorporates the Debye model [27]. Indeed, the main difference between the Debye and Cole–Cole models is that the latter includes exponent 1 α , with 0 α 1 . When the exponent becomes smaller, the relaxation time distribution becomes broader, i.e., the transition between low- and high-frequency values becomes wider, and the peak on imaginary part of the spectrum also becomes wider.
The complexity of both the structure and composition of biological material is such that the dispersion region of each pole may be broadened by multiple contributions to it. The broadening of the dispersion could be empirically accounted for by using the Cole–Cole model [29]. It is for that reason that the Cole–Cole model is expected to provide more accurate dielectric spectrum curve-fitting.
Nevertheless, we also consider the Debye model in our study as it is sometimes preferred for its simplicity [4,5,7,8,9,10] and easy implementation of computational EM methods, such as finite-difference time-domain FDTD (in the Cole–Cole model, the addition of the parameters α causes difficulties when transforming to the time domain because the fractional powers of frequency lead to fractional derivatives [11]).

2.3. Curve Fitting Algorithms

Let x be the vector of model parameters, P its length, and M the number of frequency points where the measures are taken. We define the data vector as follows ( stands for transposition):
y = y ( ω 1 ) , y ( ω m ) , y ( ω M )
in which the mth component of the vector y is the observed value y ( ω m ) . Let the following:
ε r ( x ) = ε r ( ω 1 ; x ) , ε r ( ω m ; x ) , ε r ( ω M ; x )
be the model vector, here given by Equation (4), with  ( ω m ; x ) being its estimation at ω m .
Solving the least squares problem means finding x ^ such that the following is the case:
x ^ = arg min x R P 1 2 ε r ( x ) y 2 2
in which the function to minimize, Ψ = 1 2 ε r ( x ) y 2 2 , is the 2 quadratic norm of the misfit r = ε r ( x ) y , which is a non-linear function such that r : R P C M with P M .
Many studies in the literature have proposed metaheuristic algorithms for curve fitting, such as genetic algorithm, simulated annealing algorithm, particle swarm algorithm, hybrid variants, etc. [11,16,30], because of their ability to deal with very large search spaces. However, they have non-negligible disadvantages: longer execution time, stochastic nature, and poor mathematical background. For these reasons, we preferred to focus on gradient-like algorithms by evaluating their performance in terms of what is considered their weakness: the choice of the starting point.
Thus, we address the non-linear fitting problem with two methods: the Levenberg–Marquardt Algorithm (LMA) and the Variable Projection Algorithm (VPA). The first is a classic algorithm already used in this context [13,14]; the other, to the best of our knowledge, is used for the first time for this problem.

2.3.1. Levenberg–Marquardt Algorithm

The Levenberg–Marquardt Algorithm [21,22] acts more similarly to a gradient-descent method when the parameters are far from their optimal value and acts more similarly to the Gauss–Newton method when the parameters are close to their optimal value [31]. The equation for the step h at the kth iteration is as follows:
J x k J x k + λ k I h = J x k f x k
where J is the Jacobian of f, and λ k is the damping parameter. It controls both the magnitude and direction of h, and it was chosen at each iteration. It can be shown [22] that, at each iteration, Equation (8) solves the minimization problem over a reduced set of admissible solutions, i.e., those that satisfy h R ( λ ) , limiting the correction step within a region near x k . The radius of the trust region R = R ( λ ) is a strictly decreasing function with lim λ R ( λ ) = 0 . When λ k = 0 , step h is identical to that of the Gauss–Newton method and its magnitude assumes the maximum value. As  λ , h tends towards the steepest descent direction, with the magnitude tending towards 0.
Based on the above, we infer the qualitative update rule for λ k + 1 : if Ψ ( x k + h ) < Ψ ( x k ) then the quadratic approximation works well and we can extend the trust region, i.e., it will be λ k + 1 < λ k . Otherwise, the step is unsuccessful, and we reduce the trust region, i.e., it will be λ k + 1 > λ k ; in this way, the next step tends toward the negative gradient method and a lower value of Ψ is more likely to be found.
The MATLAB implementation has been used, specifically the lscurvefit function with the Levenberg–Marquardt option [32].

2.3.2. Variable Projection Algorithm

The Variable Projection Algorithm [23] is a method used to solve separable nonlinear least squares problems. The least squares problem is said to be separable when the model parameters can be separated into two sets of parameters: one that enter linearly into the model, c = [ c 1 , , c k ] , and another set of parameters that enters the model non linearly, a = [ a 1 , , a l ] , such that x = [ c , a ] . For each observation y m of a separable nonlinear least squares problem, the model consists of the following linear combination:
ε r ( ω ) = j = 1 k c j ϕ j ω ( ω ; a )
where ϕ j ( ω ; a ) is a nonlinear function that depends on nonlinear parameters. Functional Ψ is written in terms of residual vector r as follows:
Ψ ( a , c ) = 1 2 y Φ ( a ) c 2
in which the j-th column of the matrix Φ is ϕ j ( ω ; a ) . The linear parameters c could be obtained from the knowledge of a by solving the linear least squares problem:
c = Φ ( a ) y
which stands for the minimum-norm solution of the linear least squares problem for fixed a, where Φ ( a ) is the Moore–Penrose generalized inverse of Φ ( a ) . By replacing this in Equation (10), we obtain the Variable Projection functional:
Ψ VP ( a ) = 1 2 y Φ ( a ) Φ ( a ) y 2
The Variable Projection algorithm consists of two steps: first minimizing Equation (12) with an iterative nonlinear method and then using the optimal value found for a to solve for c in Equation (11) [33]. The principal advantage is that the iterative nonlinear algorithm used to solve the first minimization problem works in a reduced space, and less initial guesses are necessary. A robust implementation in MATLAB, called VARPRO [34], has been adapted and used to deal with complex-value problems, choosing the Levenberg–Marquardt option for the solution of Equation (12).

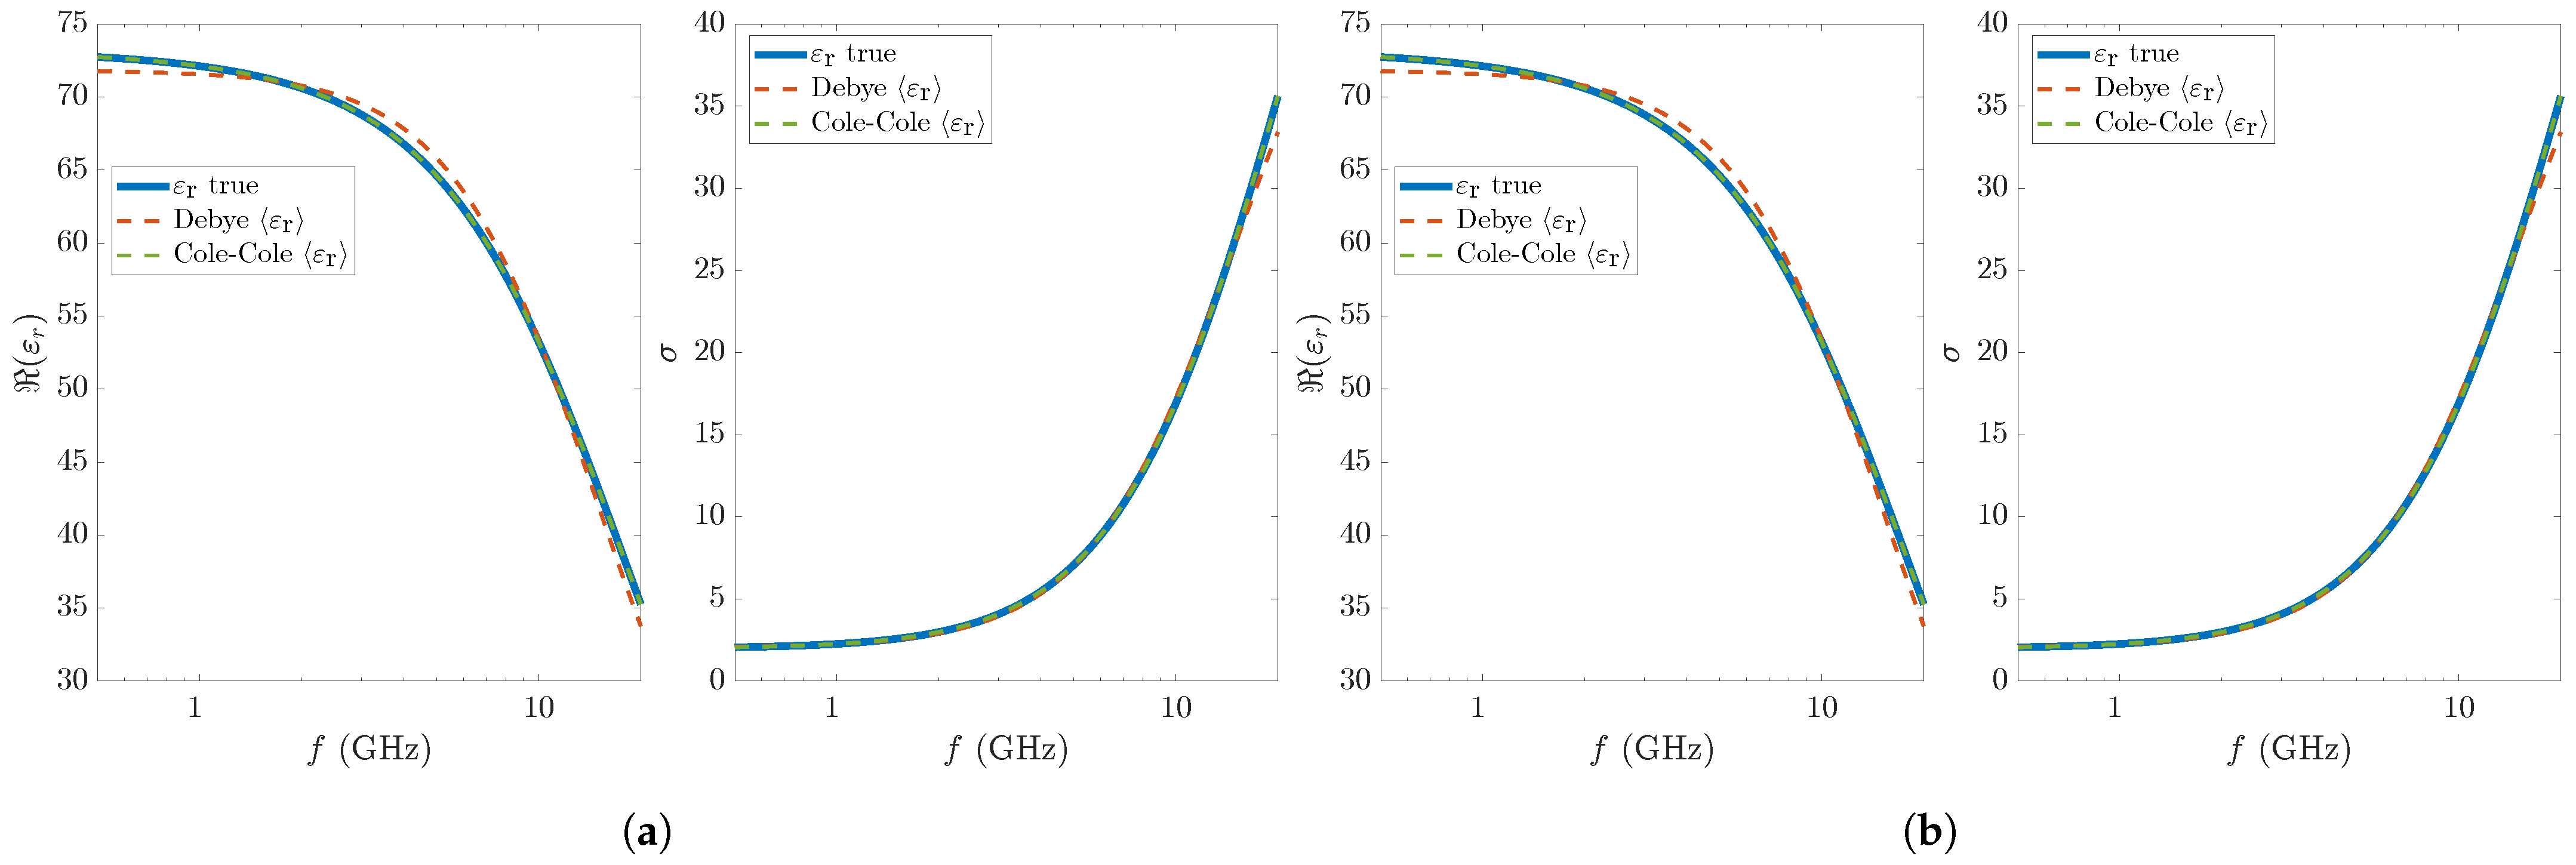
2.4. Numerical Simulations

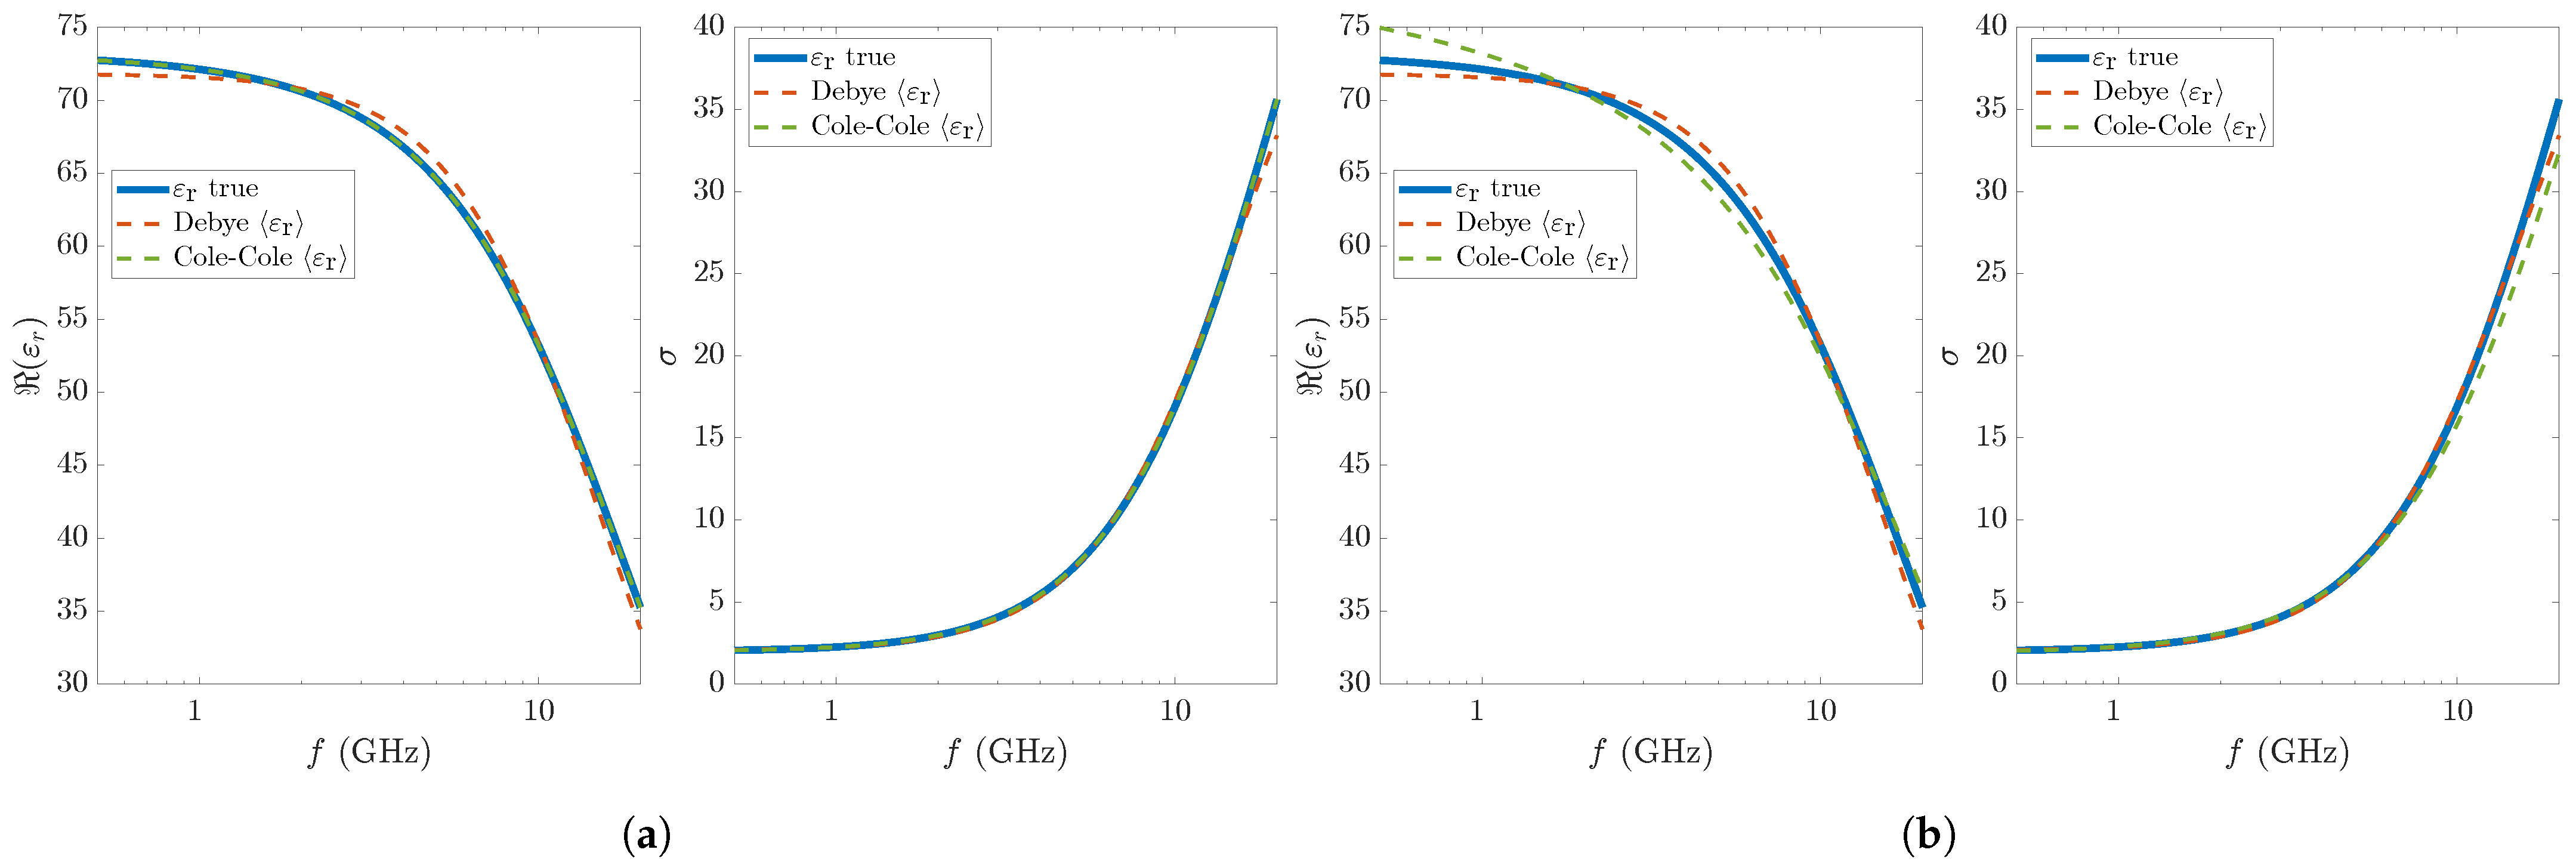
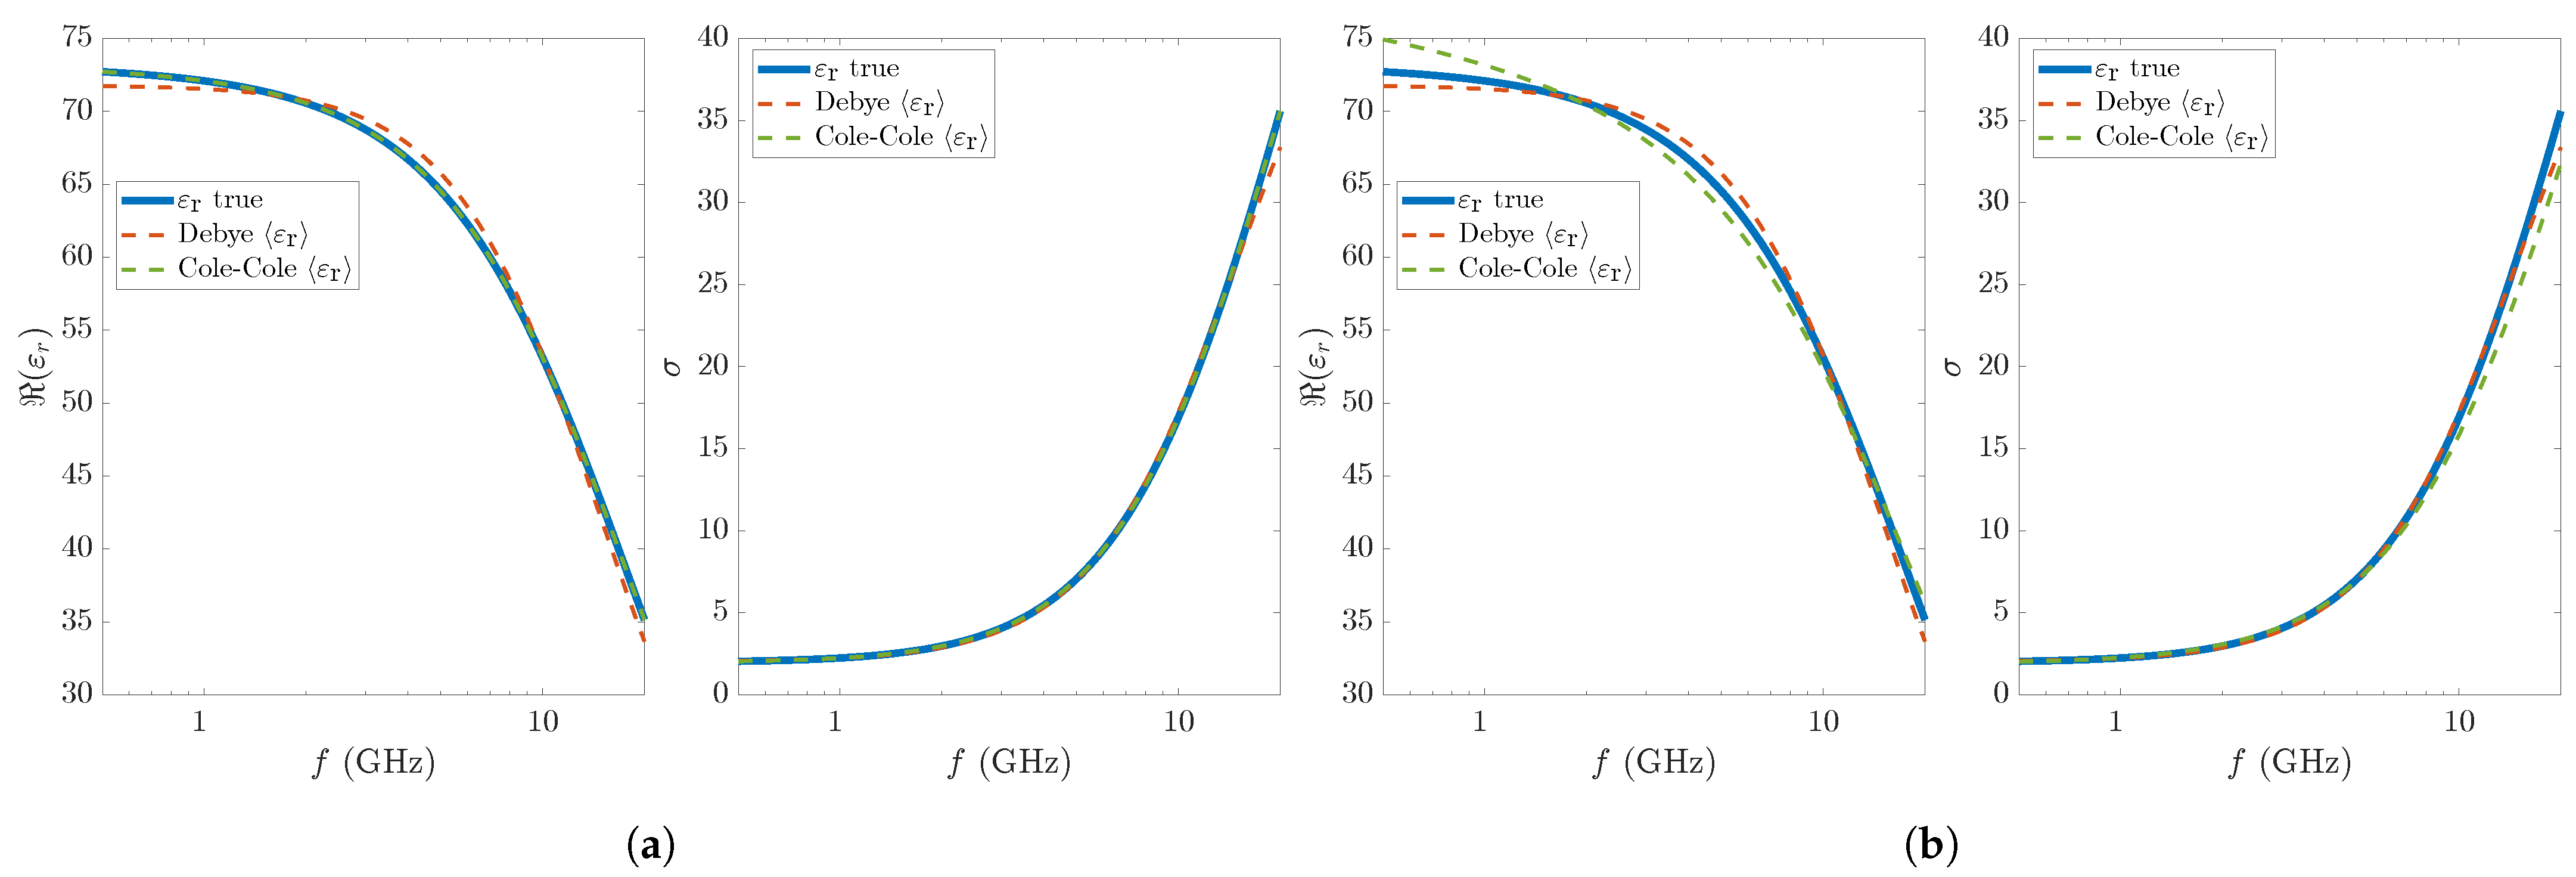
The generation of the synthetic complex relative permittivity of blood plasma relies on quadratic fits relative to glucose-dependent Cole–Cole parameters reported in [24]; in particular, we consider two different concentrations, 100 mg/dL and 250 mg/dL, where the former is a normal value while the latter is typical of severe diabetes, respectively, in accordance with the diagnostic criteria in [35]. The data vector consists of M = 1000 points in the frequency range 500 MHz–20 GHz.
In gradient-like algorithms, the choice of the initial point is a crucial factor for the convergence of the procedure. For the single-pole model case, it is fairly easy to exploit the physical meaning of the parameters to infer an initial estimate. However, since the noise can invalidate the initial estimate, we propose to study the robustness of the two algorithms with respect to the initial point. To this end, a Monte Carlo analysis is performed, iteratively evaluating the deterministic algorithms using a set of N sim = 1000 uniformly distributed random initial points arranged in a 5D hypercube of the parameter space in order to statistically characterize the results. Each side of the hypercube represents an interval containing the range of variation of each parameter for the glucose concentrations considered.
We run simulations on a machine with Intel i9-10850K (10 physical cores), 32GB RAM, and Ubuntu 21.04, and we took advantage of the Parallel Computing Toolbox using the parfor loop for running the N sim simulations.
The intervals for generating the random initial value for each parameter (of the Cole–Cole model) is chosen from the data tabulated in [24]. In particular, the widths of these intervals are the same for each glucose concentration. We define three sets of intervals for the starting points with wider and wider intervals.
The first set, labeled as Set A, consists of the following intervals: [ 1 , 5 ] for ε , [ 1 , 150 ] for ε s , [ 1 × 10 14 , 1 × 10 11 ] for τ , [ 0.1 1 × 10 9 , 0.1 + 1 × 10 9 ] for α , and [ 0 , 5 ] for σ s .
The second set, labeled as Set B, consists of the following intervals: [ 1 , 5 ] for ε , [ 1 , 150 ] for ε s , [ 1 × 10 14 , 1 × 10 11 ] for τ , [ 1 × 10 4 , 0.6 ] for α , and [ 0 , 5 ] for σ s .
The third set, labeled as Set C, consists of the following intervals: [ 0 , 10 ] for ε , [ 0 , 200 ] for ε s , [ 1 × 10 14 , 1 × 10 10 ] for τ , [ 1 × 10 4 , 0.6 ] for α , and [ 0 , 10 ] for σ s .
These intervals are relatively large compared to the values taken from [24] in order to test the two algorithms in sufficiently stressful situations. Obviously, it must be taken into account that VPA requires only the generation of τ and α values for the Cole–Cole model and only of τ values for the Debye model.
The algorithms are improved by introducing constraints on the parameters to be reconstructed. The required bounds are the following: [ 0 , 30 ] for ε , [ 0 , 200 ] for ε s , [ 1 × 10 14 , 1 × 10 10 ] for τ , [ 0 , 1 ] for α , and [ 0 , 10 ] for σ s .
For a quantitative evaluation of the performance of the two algorithms, we then define multiple figures of merit for statistically characterizing the results of the Monte Carlo analysis. For each parameter, mean and standard deviation are calculated over the entire set of reconstructions. Let the following:
x ^ ( i ) = [ ε ^ ( i ) , ε ^ s ( i ) , τ ^ ( i ) , α ^ ( i ) , σ s ^ ( i ) ]
be the vector of parameter estimates returned by the two algorithms at the i-th simulation and let x ^ ( i ) denote one of its five elements. Moreover, let the following:
x ¯ = 1 N sim i = 1 N sim x ^ i
s = 1 N sim 1 i = 1 N sim | x ^ i x ¯ | 2
be the sample mean and standard deviation, respectively, calculated for each parameter.
To evaluate the accuracy of fitted curves, for each simulation, the root mean square relative error is calculated according to the following equation:
RMSRE i = 1 M k = 1 M | ε r ( ω k ) y k y k | 2 × 100 %
Mean and standard deviation of RMSRE over all simulations are finally calculated.

3. Results

We have conducted many numerical simulations by increasingly widening the generation intervals. The qualitative and quantitative results of each of the performed simulations are presented in Figure 1, Figure 2, Figure 3, Figure 4, Figure 5 and Figure 6 and Table 1, Table 2, Table 3, Table 4, Table 5 and Table 6. Each figure shows three curves: the exact curve, the curve obtained from the average of the curves fitted with Cole–Cole model, and the curve obtained from the average of the curves fitted with Debye model. In particular, each figure shows the real part and the equivalent conductivity σ = ω ε 0 m ε r ( ω ) of the permittivities.
In general, one can practically observe the following difference between the Debye and Cole–Cole models: the additional degree of freedom given by the parameter α allows the latter to shape the transition between low-frequency and high-frequency values more accurately then the former. In particular, in this study, the transition is smoother and the Debye model is not able to follow it.
Let us consider simulations with initial points taken from the first set, i.e., set A. Figure 1a,b and Figure 2a,b and Table 1 and Table 2 refer to this case. The true values of the parameters are reported in the row labeled x true (and it is the same for the other tables). Both algorithms converge to the least square solution for both glucose concentrations. Even though the Debye model is here used to fit synthetic data generated from Cole–Cole model, the fitted curve reveals a small RMSRE.
The results of simulations with initial points taken from set B are reported in Figure 3a,b and Figure 4a,b and Table 3 and Table 4. The widening of the generation range for the parameter α up to [ 0 , 0.6 ] does not change the considerations made for set A.
Figure 5a,b and Figure 6a,b and Table 5 and Table 6 refer to simulations with initial points taken from set C. This is the most interesting case because a noticeable difference between the two algorithms emerges. In fact, VPA presents convergence problems in fitting the Cole–Cole model due to ill-conditioning. In particular, we observed that for 3 × 10 11 < τ < 1 × 10 10 , matrix Φ ( a ) in Equation (11) is ill-conditioned, with condition number 10 16 , such that the pseudo-inverse is not able to accurately determine the linear parameters for the considered step, invalidating the convergence of the algorithm. Instead, LMA does not suffer from this problem, and the results are always comparable with previous cases.
In terms of performance, the introduction of parameter constraints has reduced execution times in both algorithms. However, while LMA takes a few seconds for the 1000 simulations, VPA takes a few hundred seconds.

4. Discussion

In this paper, we faced the problem of fitting the dielectric spectrum of a blood sample in order to estimate the parameters of the single-pole Debye model and the single-pole Cole–Cole model. In particular, we compared the performance of two different algorithms, LMA and VPA, in terms of accuracy and precision with respect to the starting points of the parameters.
Compared to the results of the previous study [25], the performance of both algorithms improved significantly by introducing constraints on the parameters to be reconstructed. This prompted us to assess the algorithms in even worse cases, taking initial points further and further away from the solution of the optimization problem. In consideration of the shown results, we can say that, in the tests performed with the updated versions of the algorithms, LMA was more stable than VPA and, as before, was considerably faster. The slowness of VPA is due to the large number of measurement points considered ( n = 1000 ), which makes the computation of SVDs (Singular Value Decomposition) particularly time consuming.
The results are promising and research will continue by evaluating algorithms and their variants in increasingly realistic scenarios, adding noise to synthetic data, and also considering dielectric spectra of other biological tissues.

Author Contributions

Conceptualization, R.S. and S.C.; methodology, R.D. and G.B.; software, R.D.; validation, R.D. and G.B.; formal analysis, R.S., R.D. and G.B.; investigation, R.D. and G.B.; resources, R.S. and S.C.; data curation, R.D.; writing—original draft preparation, R.D.; writing—review and editing, G.B. and R.D.; visualization, R.D. and G.B.; supervision, R.S. and G.B.; project administration, R.S. and S.C.; funding acquisition, R.S. and S.C. All authors have read and agreed to the published version of the manuscript.

Funding

This research was funded by MIUR (Ministero dell’Istruzione dell’Università e della Ricerca), Italy, as part of PRIN 2017 project “Microwave Biosensors: Enhanced Non-Invasive Methodology for Blood Glucose Monitoring” and by MUR (Ministero dell’Università e della Ricerca), Italy, as part of “Programma Operativo Nazionale Ricerca e Innovazione 2014–2020” (PON “Ricerca e Innovazione” 2014–2020) project “Non-invasive Electromagnetic Green Devices and Methods for Advanced Medical Diagnostics”.

Data Availability Statement

The data presented in this study are available upon request from the corresponding author.

Conflicts of Interest

The authors declare no conflict of interest.

References

  1. Elwakil, A.S.; Al-Ali, A.A.; Maundy, B.J. Extending the Double-Dispersion Cole–Cole, Cole–Davidson and Havriliak–Negami Electrochemical Impedance Spectroscopy Models. Eur. Biophys. J. 2021, 50, 915–926. [Google Scholar] [CrossRef]
  2. Naranjo-Hernández, D.; Reina-Tosina, J.; Min, M. Fundamentals, Recent Advances, and Future Challenges in Bioimpedance Devices for Healthcare Applications. J. Sens. 2019, 2019, e9210258. [Google Scholar] [CrossRef] [Green Version]
  3. Sasaki, K.; Wake, K.; Watanabe, S. Development of Best Fit Cole-Cole Parameters for Measurement Data from Biological Tissues and Organs between 1 MHz and 20 GHz. Radio Sci. 2014, 49, 459–472. [Google Scholar] [CrossRef]
  4. Fhager, A.; Gustafsson, M.; Nordebo, S. Image Reconstruction in Microwave Tomography Using a Dielectric Debye Model. IEEE Trans. Biomed. Eng. 2012, 59, 156–166. [Google Scholar] [CrossRef] [Green Version]
  5. Lazebnik, M.; Okoniewski, M.; Booske, J.H.; Hagness, S.C. Highly Accurate Debye Models for Normal and Malignant Breast Tissue Dielectric Properties at Microwave Frequencies. IEEE Microw. Wirel. Compon. Lett. 2007, 17, 822–824. [Google Scholar] [CrossRef]
  6. Yilmaz, T.; Foster, R.; Hao, Y. Broadband Tissue Mimicking Phantoms and a Patch Resonator for Evaluating Noninvasive Monitoring of Blood Glucose Levels. IEEE Trans. Antennas Propag. 2014, 62, 3064–3075. [Google Scholar] [CrossRef]
  7. Turgul, V.; Kale, I. On the Accuracy of Complex Permittivity Model of Glucose/Water Solutions for Non-Invasive Microwave Blood Glucose Sensing. In Proceedings of the 2015 E-Health and Bioengineering Conference (EHB), Iasi, Romania, 19–21 November 2015; pp. 1–4. [Google Scholar] [CrossRef]
  8. Turgul, V.; Kale, I. Characterization of the Complex Permittivity of Glucose/Water Solutions for Noninvasive RF/Microwave Blood Glucose Sensing. In Proceedings of the 2016 IEEE International Instrumentation and Measurement Technology Conference Proceedings, Taipei, Taiwan, 23–26 May 2016; pp. 1–5. [Google Scholar] [CrossRef]
  9. Turgul, V.; Kale, I. Permittivity Extraction of Glucose Solutions through Artificial Neural Networks and Non-Invasive Microwave Glucose Sensing. Sens. Actuators A Phys. 2018, 277, 65–72. [Google Scholar] [CrossRef] [Green Version]
  10. Omer, A.E.; Shaker, G.; Safavi-Naeini, S.; Shubair, R.M. EM Measurements of Glucose-Aqueous Solutions. In Proceedings of the 2019 IEEE International Symposium on Antennas and Propagation and USNC-URSI Radio Science Meeting, Atlanta, GA, USA, 7–12 July 2019; pp. 103–104. [Google Scholar] [CrossRef]
  11. Clegg, J.; Robinson, M.P. A Genetic Algorithm Used to Fit Debye Functions to the Dielectric Properties of Tissues. In Proceedings of the IEEE Congress on Evolutionary Computation, Barcelona, Spain, 18–23 July 2010; pp. 1–8. [Google Scholar] [CrossRef]
  12. Cruciani, S.; Santis, V.D.; Feliziani, M.; Maradei, F. Cole-Cole vs Debye Models for the Assessment of Electromagnetic Fields inside Biological Tissues Produced by Wideband EMF Sources. In Proceedings of the 2012 Asia-Pacific Symposium on Electromagnetic Compatibility, Singapore, 21–24 May 2012; pp. 685–688. [Google Scholar] [CrossRef]
  13. Grosse, C. A Program for the Fitting of Debye, Cole–Cole, Cole–Davidson, and Havriliak–Negami Dispersions to Dielectric Data. J. Colloid Interface Sci. 2014, 419, 102–106. [Google Scholar] [CrossRef]
  14. Grosse, C. A Program for the Fitting of up to Three Havriliak-Negami Dispersions to Dielectric Data. J. Colloid Interface Sci. 2021, 600, 318–323. [Google Scholar] [CrossRef] [PubMed]
  15. Piuma, F.J.D.; Safar, F.G.E.; Passarella, D.N. Robust Fitting of the Cole-Cole Permittivity Equation. In Proceedings of the 2015 XVI Workshop on Information Processing and Control (RPIC), Cordoba, Argentina, 6–9 October 2015; pp. 1–5. [Google Scholar] [CrossRef]
  16. Zhang, L.; Liu, P.; Dan, C.; Shi, X.; Dong, X. A Comparative Study on Algorithms for Optimizing Debye Model of Tissue Dielectric Properties. In Proceedings of the 2013 6th International Conference on Biomedical Engineering and Informatics, Hangzhou, China, 16–18 December 2013; pp. 317–321. [Google Scholar] [CrossRef]
  17. Lin, T. Non-Invasive Glucose Monitoring: A Review of Challenges and Recent Advances. Curr. Trends Biomed. Eng. Biosci. 2017, 6, 555696. [Google Scholar] [CrossRef]
  18. Costanzo, S.; Cioffi, V. Dielectric Models for the Accurate Design of Wearable Diabetes Sensors. In Proceedings of the 2019 23rd International Conference on Applied Electromagnetics and Communications (ICECOM), Dubrovnik, Croatia, 30 September–2 October 2019; pp. 1–3. [Google Scholar] [CrossRef]
  19. Venkataraman, J.; Freer, B. Feasibility of Non-Invasive Blood Glucose Monitoring: In-vitro Measurements and Phantom Models. In Proceedings of the 2011 IEEE International Symposium on Antennas and Propagation (APSURSI), Spokane, WA, USA, 3–8 July 2011; pp. 603–606. [Google Scholar] [CrossRef]
  20. Costanzo, S.; Cioffi, V.; Raffo, A. Complex Permittivity Effect on the Performances of Non-invasive Microwave Blood Glucose Sensing: Enhanced Model and Preliminary Results. In Trends and Advances in Information Systems and Technologies; Rocha, Á., Adeli, H., Reis, L.P., Costanzo, S., Eds.; Advances in Intelligent Systems and Computing; Springer International Publishing: Cham, Switzerland, 2018; pp. 1505–1511. [Google Scholar] [CrossRef]
  21. Levenberg, K. A Method for the Solution of Certain Non-Linear Problems in Least Squares. Q. Appl. Math. 1944, 2, 164–168. [Google Scholar] [CrossRef] [Green Version]
  22. Marquardt, D.W. An Algorithm for Least-Squares Estimation of Nonlinear Parameters. J. Soc. Ind. Appl. Math. 1963, 11, 431–441. [Google Scholar] [CrossRef]
  23. Golub, G.H.; Pereyra, V. The Differentiation of Pseudo-Inverses and Nonlinear Least Squares Problems Whose Variables Separate. SIAM J. Numer. Anal. 1973, 10, 413–432. [Google Scholar] [CrossRef]
  24. Karacolak, T.; Moreland, E.C.; Topsakal, E. Cole–Cole Model for Glucose-Dependent Dielectric Properties of Blood Plasma for Continuous Glucose Monitoring. Microw. Opt. Technol. Lett. 2013, 55, 1160–1164. [Google Scholar] [CrossRef]
  25. Dima, R.; Buonanno, G.; Solimene, R. Comparing Two Fitting Algorithms for Determining the Cole–Cole Parameters in Blood Glucose Problems. Eng. Proc. 2021, 11, 45. [Google Scholar] [CrossRef]
  26. Karacolak, T.; Moreland, E.C.; Topsakal, E. Cole-Cole Model for Glucose-Dependent Dielectric Properties of Blood Plasma for Continuous Glucose Monitoring. In Proceedings of the XXIXth URSI General Assembly, Chicago, IL, USA, 7–16 August 2008. [Google Scholar]
  27. Debye, P. Polar Molecules; The Chemical Catalog Company, Inc.: New York, NY, USA, 1929. [Google Scholar]
  28. Cole, K.S.; Cole, R.H. Dispersion and Absorption in Dielectrics I. Alternating Current Characteristics. J. Chem. Phys. 1941, 9, 341–351. [Google Scholar] [CrossRef] [Green Version]
  29. Gabriel, S.; Lau, R.W.; Gabriel, C. The Dielectric Properties of Biological Tissues: III. Parametric Models for the Dielectric Spectrum of Tissues. Phys. Med. Biol. 1996, 41, 2271–2293. [Google Scholar] [CrossRef] [Green Version]
  30. Salahuddin, S.; Porter, E.; Krewer, F.; O’ Halloran, M. Optimised Analytical Models of the Dielectric Properties of Biological Tissue. Med. Eng. Phys. 2017, 43, 103–111. [Google Scholar] [CrossRef] [PubMed]
  31. Gavin, H.P. The Levenberg-Marquardt Algorithm for Nonlinear Least Squares Curve-Fitting Problems; Duke University: Durham, NC, USA, 2020; p. 19. [Google Scholar]
  32. Matlab. Optimization Toolbox—User’s Guide; MathWorks: Natick, MA, USA, 2021. [Google Scholar]
  33. Golub, G.; Pereyra, V. Separable Nonlinear Least Squares: The Variable Projection Method and Its Applications. Inverse Probl. 2003, 19, R1–R26. [Google Scholar] [CrossRef]
  34. O’Leary, D.P.; Rust, B.W. Variable Projection for Nonlinear Least Squares Problems. Comput. Optim. Appl. 2013, 54, 579–593. [Google Scholar] [CrossRef]
  35. IDF Diabetes Atlas; Technical Report; International Diabetes Federation: Brussels, Belgium, 2019.
Figure 1. Real part of relative permittivity and conductivity of synthetic data (100 mg/dL glucose concentration) and Debye’s and Cole–Cole’s fitted curves. LMA (a) and VPA (b) with Set A of initial points are used.
Applsci 12 05698 g001
Figure 2. Real part of relative permittivity and conductivity of synthetic data (250 mg/dL glucose concentration) and Debye’s and Cole–Cole’s fitted curves. LMA (a) and VPA (b) with Set A of initial points are used.
Applsci 12 05698 g002
Figure 3. Real part of relative permittivity and conductivity of synthetic data (100 mg/dL glucose concentration) and Debye’s and Cole–Cole’s fitted curves. LMA (a) and VPA (b) with Set B of initial points are used.
Applsci 12 05698 g003
Figure 4. Real part of relative permittivity and conductivity of synthetic data (250 mg/dL glucose concentration) and Debye’s and Cole–Cole’s fitted curves. LMA (a) and VPA (b) with Set B of initial points are used.
Applsci 12 05698 g004
Figure 5. Real part of relative permittivity and conductivity of synthetic data (100 mg/dL glucose concentration) and Debye’s and Cole–Cole’s fitted curves. LMA (a) and VPA (b) with Set C of initial points are used.
Applsci 12 05698 g005
Figure 6. Real part of relative permittivity and conductivity of synthetic data (250 mg/dL glucose concentration) and Debye’s and Cole–Cole’s fitted curves. LMA (a) and VPA (b) with Set C of initial points are used.
Applsci 12 05698 g006
Table 1. Statistical diagnostics on fitting results. Set A of the initial points and 100 mg/dL glucose concentrations were considered.
ε ε s τ (s) α σ s (S/m)RMSRE
x true 2.373.3 8.72 × 10 12 0.11.99-
x ¯ Cole–ColeLMA2.373.3 8.72 × 10 12 0.11.99 6.5 × 10 13
VPA2.373.3 8.72 × 10 12 0.11.99 7.83 × 10 12
DebyeLMA12.971.8 1.07 × 10 11 02.031.64
VPA12.971.8 1.07 × 10 11 02.031.64
sCole–ColeLMA 2.68 × 10 11 2.86 × 10 12 4.74 × 10 24 1.89 × 10 13 9.23 × 10 14 3.06 × 10 12
VPA 7.27 × 10 10 7.06 × 10 11 1.31 × 10 22 5.12 × 10 12 2.32 × 10 12 8.57 × 10 11
DebyeLMA0.000135 2.31 × 10 5 4.05 × 10 17 0 3.85 × 10 7 1.67 × 10 5
VPA 4.31 × 10 5 7.35 × 10 6 1.29 × 10 17 0 1.23 × 10 7 5.31 × 10 6
Table 2. Statistical diagnostics on fitting results. Set A of the initial points and 250 mg/dL glucose concentrations were considered.
ε ε s τ (s) α σ s (S/m)RMSRE
x true 2.3173.3 8.76 × 10 12 0.11.97-
x ¯ Cole–ColeLMA2.3173.3 8.76 × 10 12 0.11.97 3 . × 10 24
VPA2.3173.3 8.76 × 10 12 0.11.97 4.12 × 10 22
DebyeLMA12.971.8 1.08 × 10 11 02.011.07
VPA12.971.8 1.08 × 10 11 02.011.07
sCole–ColeLMA 2.45 × 10 11 2.58 × 10 12 4.36 × 10 24 1.73 × 10 13 8.39 × 10 14 3.97 × 10 23
VPA 2.88 × 10 10 2.83 × 10 11 5.2 × 10 23 2.04 × 10 12 9.31 × 10 13 1.26 × 10 20
DebyeLMA0.000136 2.33 × 10 5 4.09 × 10 17 0 3.9 × 10 7 1.56 × 10 9
VPA 4.28 × 10 5 7.34 × 10 6 1.29 × 10 17 0 1.23 × 10 7 8.53 × 10 10
Table 3. Statistical diagnostics on fitting results. Set B of the initial points and 100 mg/dL glucose concentrations were considered.
ε ε s τ (s) α σ s (S/m)RMSRE
x true 2.373.3 8.72 × 10 12 0.11.99-
x ¯ Cole–ColeLMA2.373.3 8.72 × 10 12 0.11.99 8.81 × 10 24
VPA2.373.3 8.72 × 10 12 0.11.99 1.37 × 10 22
DebyeLMA12.971.8 1.07 × 10 11 02.031.07
VPA12.971.8 1.07 × 10 11 02.031.07
sCole–ColeLMA 4.3 × 10 11 4.03 × 10 12 7.65 × 10 24 2.92 × 10 13 1.37 × 10 13 1.51 × 10 22
VPA 1.65 × 10 10 1.63 × 10 11 2.96 × 10 23 1.17 × 10 12 5.34 × 10 13 5.79 × 10 22
DebyeLMA0.000139 2.37 × 10 5 4.16 × 10 17 0 3.96 × 10 7 1.59 × 10 9
VPA 4.29 × 10 5 7.31 × 10 6 1.28 × 10 17 0 1.22 × 10 7 8.64 × 10 10
Table 4. Statistical diagnostics on fitting results. Set B of the initial points and 250 mg/dL glucose concentrations were considered.
ε ε s τ (s) α σ s (S/m)RMSRE
x true 2.3173.3 8.76 × 10 12 0.11.97-
x ¯ Cole–ColeLMA2.3173.3 8.76 × 10 12 0.11.97 1 . 0 × 10 23
VPA2.3173.3 8.76 × 10 12 0.11.97 1.18 × 10 22
DebyeLMA12.971.8 1.08 × 10 11 02.011.07
VPA12.971.8 1.08 × 10 11 02.011.07
sCole–ColeLMA 4.56 × 10 11 4.3 × 10 12 8.13 × 10 24 3.09 × 10 13 1.47 × 10 13 2.46 × 10 22
VPA 1.52 × 10 10 1.51 × 10 11 2.73 × 10 23 1.08 × 10 12 4.94 × 10 13 4.61 × 10 22
DebyeLMA0.000139 2.38 × 10 5 4.18 × 10 17 0 3.98 × 10 7 1.62 × 10 9
VPA 4.41 × 10 5 7.56 × 10 6 1.33 × 10 17 0 1.27 × 10 7 9.18 × 10 10
Table 5. Statistical diagnostics on fitting results. Set C of the initial points and 100 mg/dL glucose concentrations were considered.
ε ε s τ (s) α σ s (S/m)RMSRE
x true 2.373.3 8.72 × 10 12 0.11.99-
x ¯ Cole–ColeLMA2.373.3 8.72 × 10 12 0.11.99 1.21 × 10 24
VPA4.1379.8 1.39 × 10 11 0.1821.914.1
DebyeLMA12.971.8 1.07 × 10 11 02.031.07
VPA12.971.8 1.07 × 10 11 02.031.07
sCole–ColeLMA 1.57 × 10 11 1.57 × 10 12 2.79 × 10 24 1.1 × 10 13 5.24 × 10 14 2.79 × 10 23
VPA4.6414 1.14 × 10 11 0.1690.1828.7
DebyeLMA0.000137 2.34 × 10 5 4.11 × 10 17 0 3.91 × 10 7 1.39 × 10 9
VPA 6.26 × 10 5 1.07 × 10 5 1.87 × 10 17 0 1.78 × 10 7 1.0 × 10 9
Table 6. Statistical diagnostics on fitting results. Set C of the initial points and 250 mg/dL glucose concentrations were considered.
ε ε s τ (s) α σ s (S/m)RMSRE
x true 2.3173.3 8.76 × 10 12 0.11.97-
x ¯ Cole–ColeLMA2.3173.3 8.76 × 10 12 0.11.97 1.6 × 10 24
VPA4.1279.7 1.39 × 10 11 0.1811.8814
DebyeLMA12.971.8 1.08 × 10 11 02.011.07
VPA12.971.8 1.08 × 10 11 02.011.07
sCole–ColeLMA 1.81 × 10 11 1.63 × 10 12 3.27 × 10 24 1.23 × 10 13 5.58 × 10 14 4.03 × 10 23
VPA4.5913.9 1.14 × 10 11 0.1680.1828.6
DebyeLMA0.000136 2.32 × 10 5 4.08 × 10 17 0 3.89 × 10 7 1.36 × 10 9
VPA 6.15 × 10 5 1.05 × 10 5 1.85 × 10 17 0 1.76 × 10 7 9.66 × 10 10
Publisher’s Note: MDPI stays neutral with regard to jurisdictional claims in published maps and institutional affiliations.

