
Performance Evaluation of Enterprise Collaboration Based on an Improved Elman Neural Network and AHP-EW

1
College of Computer Science, Sichuan University, Chengdu 610065, China
2
Big Data Analysis and Fusion Application Technology Engineering Laboratory of Sichuan Province, Chengdu 610065, China
*
Author to whom correspondence should be addressed.
Appl. Sci. 2022, 12(12), 5941; https://0-doi-org.brum.beds.ac.uk/10.3390/app12125941
Submission received: 7 May 2022
/
Revised: 7 June 2022
/
Accepted: 7 June 2022
/
Published: 10 June 2022
(This article belongs to the Topic Multi-Criteria Decision Making)
Abstract
:In order to mitigate the influence of human subjectivity on indicator weights in the performance evaluation of enterprise collaboration, and explore the nonlinear relationship between the enterprise collaboration influencing factors and the evaluation results, this paper propose a combined performance evaluation model based on AHP-EW and an improved Elman neural network. Firstly, based on the characteristics of collaboration among manufacturing enterprises, the evaluation system for the collaborative performance of manufacturing enterprises is constructed from three dimensions. Moreover, this study combines subjective and objective weighting methods to obtain comprehensive weights that take into account both expert experience and objective information. Then, an improved Elman neural network is proposed and trained to predict and evaluate the collaborative performance indicator data, which greatly shortens the evaluation time and improves evaluation accuracy. The experimental results show that the proposed model has a faster convergence speed and higher accuracy, which will provide a valuable reference for decision making and the management of enterprise collaboration.
1. Introduction
With the development of information technology and economic globalization, market competition has become increasingly fierce. Market demands are becoming increasingly diversified and individualized, and the expectations for products of customers are also becoming higher [1]. How to respond quickly to the market has become the key to competition among enterprises. To cope with these new challenges, more and more enterprises are cooperating in their core business links to quickly respond to market demands and enhance their competitiveness [2]. A division of labor based on specialized product parts forms a manufacturing enterprise collaboration network (MECN). The competition among enterprises has been transformed from a competition over the product quality and production cost of a single enterprise toa competition over the overall collaboration performance of the enterprises and their collaborators.
The essence of MECNs is to provide services such as collaborative product design, collaborative manufacturing, supply chain management, customer relationship management and information sharing among enterprises, and ultimately to realize various collaborative activities across enterprise boundaries. In recent years, much meaningful research has been carried out on the construction of MECNs. Zhang [3] investigated the clustering characteristics of an enterprise collaboration network through an integrating analytic hierarchy process and complex network theory. Peng [4] proposed a probability-based gray comprehensive evaluation method to simulate the preference and uncertainties for partner selection problems in MECNs. Hu [5] investigated an empirical MECN from the viewpoint of complex network theory to explore the topology and evolutionary process of MECNs, and to construct an evolutionary model to reproduce the topological properties found in the empirical network. Jia [6] studied the MECN modeling and feature analysis of complex products, and proposed an enterprise partner selection model based on entropy weight and TOPSIS. Durugbo [7] systematically reviewed the research status of collaborative networks and proposed a comprehensive multi-level framework for describing the logic and management of collaborative networks. Andres [8] studied collaborative processes in hierarchical manufacturing networks and proposed potential future research lines to fully support collaborative processes in non-hierarchical manufacturing network environments.
The current research on MECN mainly focuses on its formation process and characteristic analysis. There are relatively few studies on the collaborative relationship between manufacturing enterprises. The collaborative relationship of enterprises will directly affect both parties, and may even affect other related enterprises, resulting in a cascading effect that affects the operation of the entire alliance. Furthermore, the collaborative relationship between all enterprises in the alliance will determine the quality and cost of the product, thereby affecting the competitiveness of the entire alliance. Therefore, it is of great importance to study the evaluation of the collaboration performance between enterprises.
The most common methods are the mathematical programming approach, uncertainty theory, swarm intelligence algorithm, BP neural network, and so on. However, some existing methods also have some shortcomings. Sometimes, subjective influence is too serious when degerming the weight of the index. Moreover, the evaluation data of enterprises in different periods usually show a certain correlation, and the output of BP neural networks is only determined by the current input when dealing with the evaluation problem, which deviates from the reality. To handle these problems, this paper conducts special research on the collaboration performance between enterprises in MECN. Taking the dynamics and uncertainty of the collaboration performance evaluation into consideration, this paper first introduced ab improved Elman neural network and AHP-EW into the collaboration performance evaluation.
The possible contributions of this paper are as follows:
- (1)
- We combine the subjective AHP with the objective EW to determine the comprehensive indicator weights. A combined weight model based on minimum deviation is established to abstract the index weighting problem into a multi-attribute decision-making problem, so as to obtain a comprehensive weight with the smallest total deviation from the subjective and objective weighting results.
- (2)
- We introduce an improved Elman neural network to deal with the nonlinear relationship between index values and evaluation results. The Elman neural network with memory and self-adaptation is used to solve the dynamic and nonlinearity of the enterprise collaboration performance evaluation. On this basis, the additional momentum and adaptive learning methods are used to improve the network’s learning algorithm parameters, shorten the network’s convergence time and improve the network’s accuracy.
2. Related Work
Cai [9] explored the influencing factors of supply chain risk and constructed a supply chain risk evaluation model based on a BP (Back Propagation) neural network. Huang [10] compared the application effects of several common neural network models for enterprise credit risk evaluation based on a data set of Chinese private small and medium-sized enterprises (SMEs). Gao [11] built a combined performance evaluation model based on a BP neural network to evaluate the effectiveness of manufacturing collaborative logistics. Daclin [12] developed two kinds of measures to evaluate the ability of interoperation between cooperating enterprises before and during the partnership. Abudureheman [13] established an enterprise innovation performance evaluation index system and introduced a fuzzy convolutional neural network to evaluate the enterprises’ innovation performance. Li [14] analyzed and evaluated the competitiveness of China’s logistics enterprises, established the evaluation index of the competitiveness of logistics enterprises, and used SPSS (Statistical Product and Service Solutions) software to analyze the dynamic factors. Li [15] proposed an improved analytic hierarchy process–back propagation (AHP-BP) neural network and used it for the evaluation of corporate social responsibility (CSR) performances. Shu [16] combined a multi-level fuzzy evaluation and a BP neural network for the performance evaluation of private enterprises, so that the decision support system has the advantages of a neural network and multi-level dynamic evaluation simultaneously. Pei [17] combined the gray relational analysis method with a BP neural network to evaluate the resilience of enterprise safety production and provide a valuable reference for improving enterprise safety production. Zhang [18] introduced the bat algorithm (BA) to improve the parameter selection process of BP neural networks and applied it to the evaluation of enterprise business conditions, obtaining a higher prediction accuracy. Awasthy [19] present the University–Industry Collaboration Maturity Model (UICMM)—a collaboration maturity model for a range of stakeholders including universities and industry to assess and benchmark their collaborative efforts. Ho [20] developed a maturity model for supply chain collaboration as a diagnostic tool for analyzing current collaboration practices in organizations as well as a roadmap to guide organizations toward an advanced level of supply chain collaboration. Schimpf [21] proposed a generic and practical model to categorize the collaboration maturity already existing in companies, sectors and regions, and also to allow the categorization of the status as well as the envisioned collaboration maturities related to single actions. Mahmood [22] developed a performance evaluation approach for production systems in an SME’s network that is based on identified key performance indicators and their real-time visualization.
In summary, domestic and foreign scholars focus more on the credit, financial risk, operation and logistics performance of enterprises, which has laid a theoretical foundation and guidance for the development of enterprises in many aspects. However, few studies have focused on the issue of collaborative performance evaluations among enterprises. Existing methods often fail to reflect the dynamic characteristics of enterprise collaboration with regard to market development and task changes, and ignore the objective information of the evaluation index itself, which is not conducive to the scientific and accurate evaluation of enterprises’ collaboration performance. By introducing the Elman neural network with memory and combining the subjective and objective weighting method, on the basis of establishing the enterprise collaboration performance evaluation index system, the enterprise collaboration performance combination evaluation model will be constructed, and the model will be verified by the actual sample data.
3. Collaboration Performance Evaluation Based on Combination of AHP and EW
3.1. Construction of the Evaluation Index System for Collaboration Performance
3.1.1. Principles of Evaluation Index System
In order to ensure the objectivity and accuracy of the evaluation, when selecting the evaluation index, it is necessary to consider the rationality of the index system, as well as the characteristics of the collaborative relationship between enterprises. Therefore, the following principles are followed when constructing the enterprise collaboration performance index system:
- The principle of comprehensiveness. There are many factors that affect manufacturing enterprise collaboration. When constructing the evaluation index system, various factors should be selected comprehensively, and the influence of each index should be considered in each subsequent step.
- The principle of operability. Operability means that the evaluation index and its corresponding data can be easily collected. In addition, it is necessary to ensure that the quantification of these indexes is executable.
- The principle of importance. The selected indicators should be representative and able to reflect important aspects of enterprise collaboration, that is, ignore some secondary aspects and grasp the key points.
- The principle of relevance. The evaluation index system should not only include the key influencing factors of enterprise collaboration, but also have a certain logical relationship between the indexes, so that the indexes at all levels form an index system from top to bottom.
3.1.2. Selection of Evaluation Indicators
In order to scientifically evaluate the collaborative performance of the enterprises in MECN, it is necessary to comprehensively consider factors such as behavioral characteristics, business characteristics and the internal and external conditions of manufacturing enterprises. On the basis of analyzing the collaborative characteristics of manufacturing enterprises, this paper constructs an enterprise collaborative performance evaluation index system from the three dimensions of enterprise finance, business and strategy by classifying and dividing related enterprise data. The specific indicators are shown in Table 1.
3.2. Determining the Comprehensive Weight Based on Combination of AHP and EW
Analytic hierarchy process (AHP) is a subjective weighting method which can better reflect the subjective feelings and experience of experts, but its results are greatly influenced by human subjective factors. The entropy weight method is a method based on objective facts, which only considers the fluctuation of data and ignores the engineering experience of experts. Therefore, neither can accurately reflect the importance of collaboration performance indicators.
In this paper, a combined weight model based on minimum deviation is proposed, which abstracts the comprehensive weight determination into a multi-attribute decision-making problem. This will effectively reduce the “polarization” effect of the subjective and objective weighting methods, and achieve dynamic optimality among the two weighting methods. It not only takes into account the subjective experience of decision makers, but also takes into account the objective facts, so that the evaluation results are more realistic. The specific process is as follows:
3.2.1. Determining the Subjective Weight Based on AHP
The indicators in each layer have different degrees of importance to the indicators of the previous layer. A comparison matrix is a numerical representation of the relative importance of the related indicators of this level to a certain factor at the previous level. For example, the comparison matrix of criterion layer regarding target layer is as follows:
where is the number of elements in the criterion layer, represents the relative importance value of to relative to the target layer, and Satty’s 1–9 scale method is used to quantify the important relationships among different elements.
According to the value of the comparison matrix , calculate the product of the elements of each row in the comparison matrix, and calculate the n-th root of .
The vector is normalized.
where is the feature vector. After the indicator weights are obtained, a consistency check is required. The largest eigenvalue of the comparison matrix is calculated, where represents the i-th element of the vector .
Finally, the consistency index test is carried out on the obtained weight coefficients. If , the comparison matrix has a satisfactory consistency, that is, the weights are calculated correctly. The consistency ratio (CR) is calculated as follows:
where is the average random consistency index.
3.2.2. Determining the Objective Weight Based on EW
Supposing there are evaluation objects and evaluation indicators, the collected data forms the following matrix:
After standardization of indexes, the standardized index matrix is obtained. The proportion of the j-th evaluation object in the i-th index is calculated:
Then, the entropy value of the i-th index can be calculated:
where is the entropy value of the i-th index, and is the number of evaluation objects. The entropy weight of the i-th index can be calculated as:
3.2.3. Determining the Comprehensive Weight Based on Minimum Deviation
After using the above two methods to calculate the subjective weight and the objective weight, respectively, the most common method is to perform linear weighting on them, and the obtained comprehensive index weight is:
where represents the subjective weight of the i-th index obtained by AHP, and represents the objective weight of the i-th index obtained by EW. is the preference coefficient of the subjective weight of the i-th index, and is the preference coefficient of the objective weight of the i-th index, but the value of is generally set based on experience, which is highly subjective.
In order to reflect the subjectivity of decision makers in the decision-making process and the objectivity of data fluctuations, this paper adopts the combined weighting method based on the minimum deviation to determine the weight of comprehensive indicators.
The reasonable comprehensive index weight is the weight that can minimize the total deviation of the decision result from the result under the subjective and objective weighting method. Therefore, we construct the following single-objective optimization model:
Since AHP is easily affected by subjective factors, the entropy weight method is introduced to determine an objective weight according to the fluctuation of the data, which reduces the influence of subjective factors and improves the dynamicity of the index weight. This provides the basic conditions for the accurate evaluation of enterprises’ collaboration performance.
3.3. Collaboration Performance Evaluation Based on Fuzzy Evaluation
3.3.1. Determining the Evaluation Factor Set and the Evaluation Set
According to the constructed evaluation index system, there are three first-level indexes; let represent the set of all evaluation factors. Among them, each factor is divided into several sub-factors , that is, contains sub-factors.
The evaluation set represents the set of evaluation result levels, which is defined as:
The evaluation level is divided into: .
3.3.2. Determining the Weight of Evaluation Factors
Taking into account the different level of importance of each factor to enterprise collaboration, the weight of each indicator is therefore different, and the weight vector is set as . According to the influence of various factors in the index set to the enterprises’ collaboration performance, this paper uses the combination of AHP and EW to determine the weight of each evaluation factor. Then we construct the index weight set:
where represents the weight of each factor in the index set to .
3.3.3. Establishment of Fuzzy Comprehensive Evaluation Matrix
Let be the membership degree of the i-th element in the factor set to the j-th element in the evaluation set , then the evaluation result of the i-th single-factor can be expressed as by a fuzzy set. The matrix is composed of three single-factor evaluation sets , and as rows, which is called a fuzzy comprehensive evaluation matrix.
3.3.4. Comprehensive Evaluation
The comprehensive evaluation result can be obtained by the fuzzy relation synthetic operation:
where is the membership degree of the evaluation result belonging to .
In order to obtain the evaluation value in the form of a percentage, the weighted average method is used to deal with fuzzy comprehensive evaluation results:
where .
The enterprise collaboration performance evaluation index system is constructed from the three dimensions of enterprise finance, business and strategy, and the index weight is determined through the integration of AHP and EW. The combination of subjective and objective weighting methods not only considers the subjective experience of experts, but also takes into account the objective information of objective data fluctuations. Then, the fuzzy comprehensive evaluation method is used to solve the evaluation results step by step, and more accurate and satisfactory evaluation results are obtained.
4. Improved Elman Neural Network for Collaboration Performance Evaluation
4.1. Analysis of Evaluation Problems and Elman Neural Network
To establish a reasonable enterprise collaboration performance evaluation model, on the one hand, it is necessary to solve the problem of the weight allocation of the evaluation index, and on the other hand, it is necessary to explore the mapping rules between enterprise collaboration performance evaluation indicators and evaluation results.
Traditional evaluation methods have certain limitations, and they are often difficult to use in complex environments such as those with incomplete information and fuzzy information. Elman neural networks have strong information processing capabilities and self-learning capabilities which can overcome these limitations. In addition, Elman neural networks with extremely strong nonlinear mapping capabilities can be used to efficiently and accurately discover the laws, which provides a new way to solve multi-index comprehensive evaluation. Compared with the BP neural network, the Elman neural network adds a context layer, which makes it highly sensitive to historical state data, and has the ability to process dynamic information. Therefore, the Elman neural network is selected to simulate the expert evaluation process in this paper.
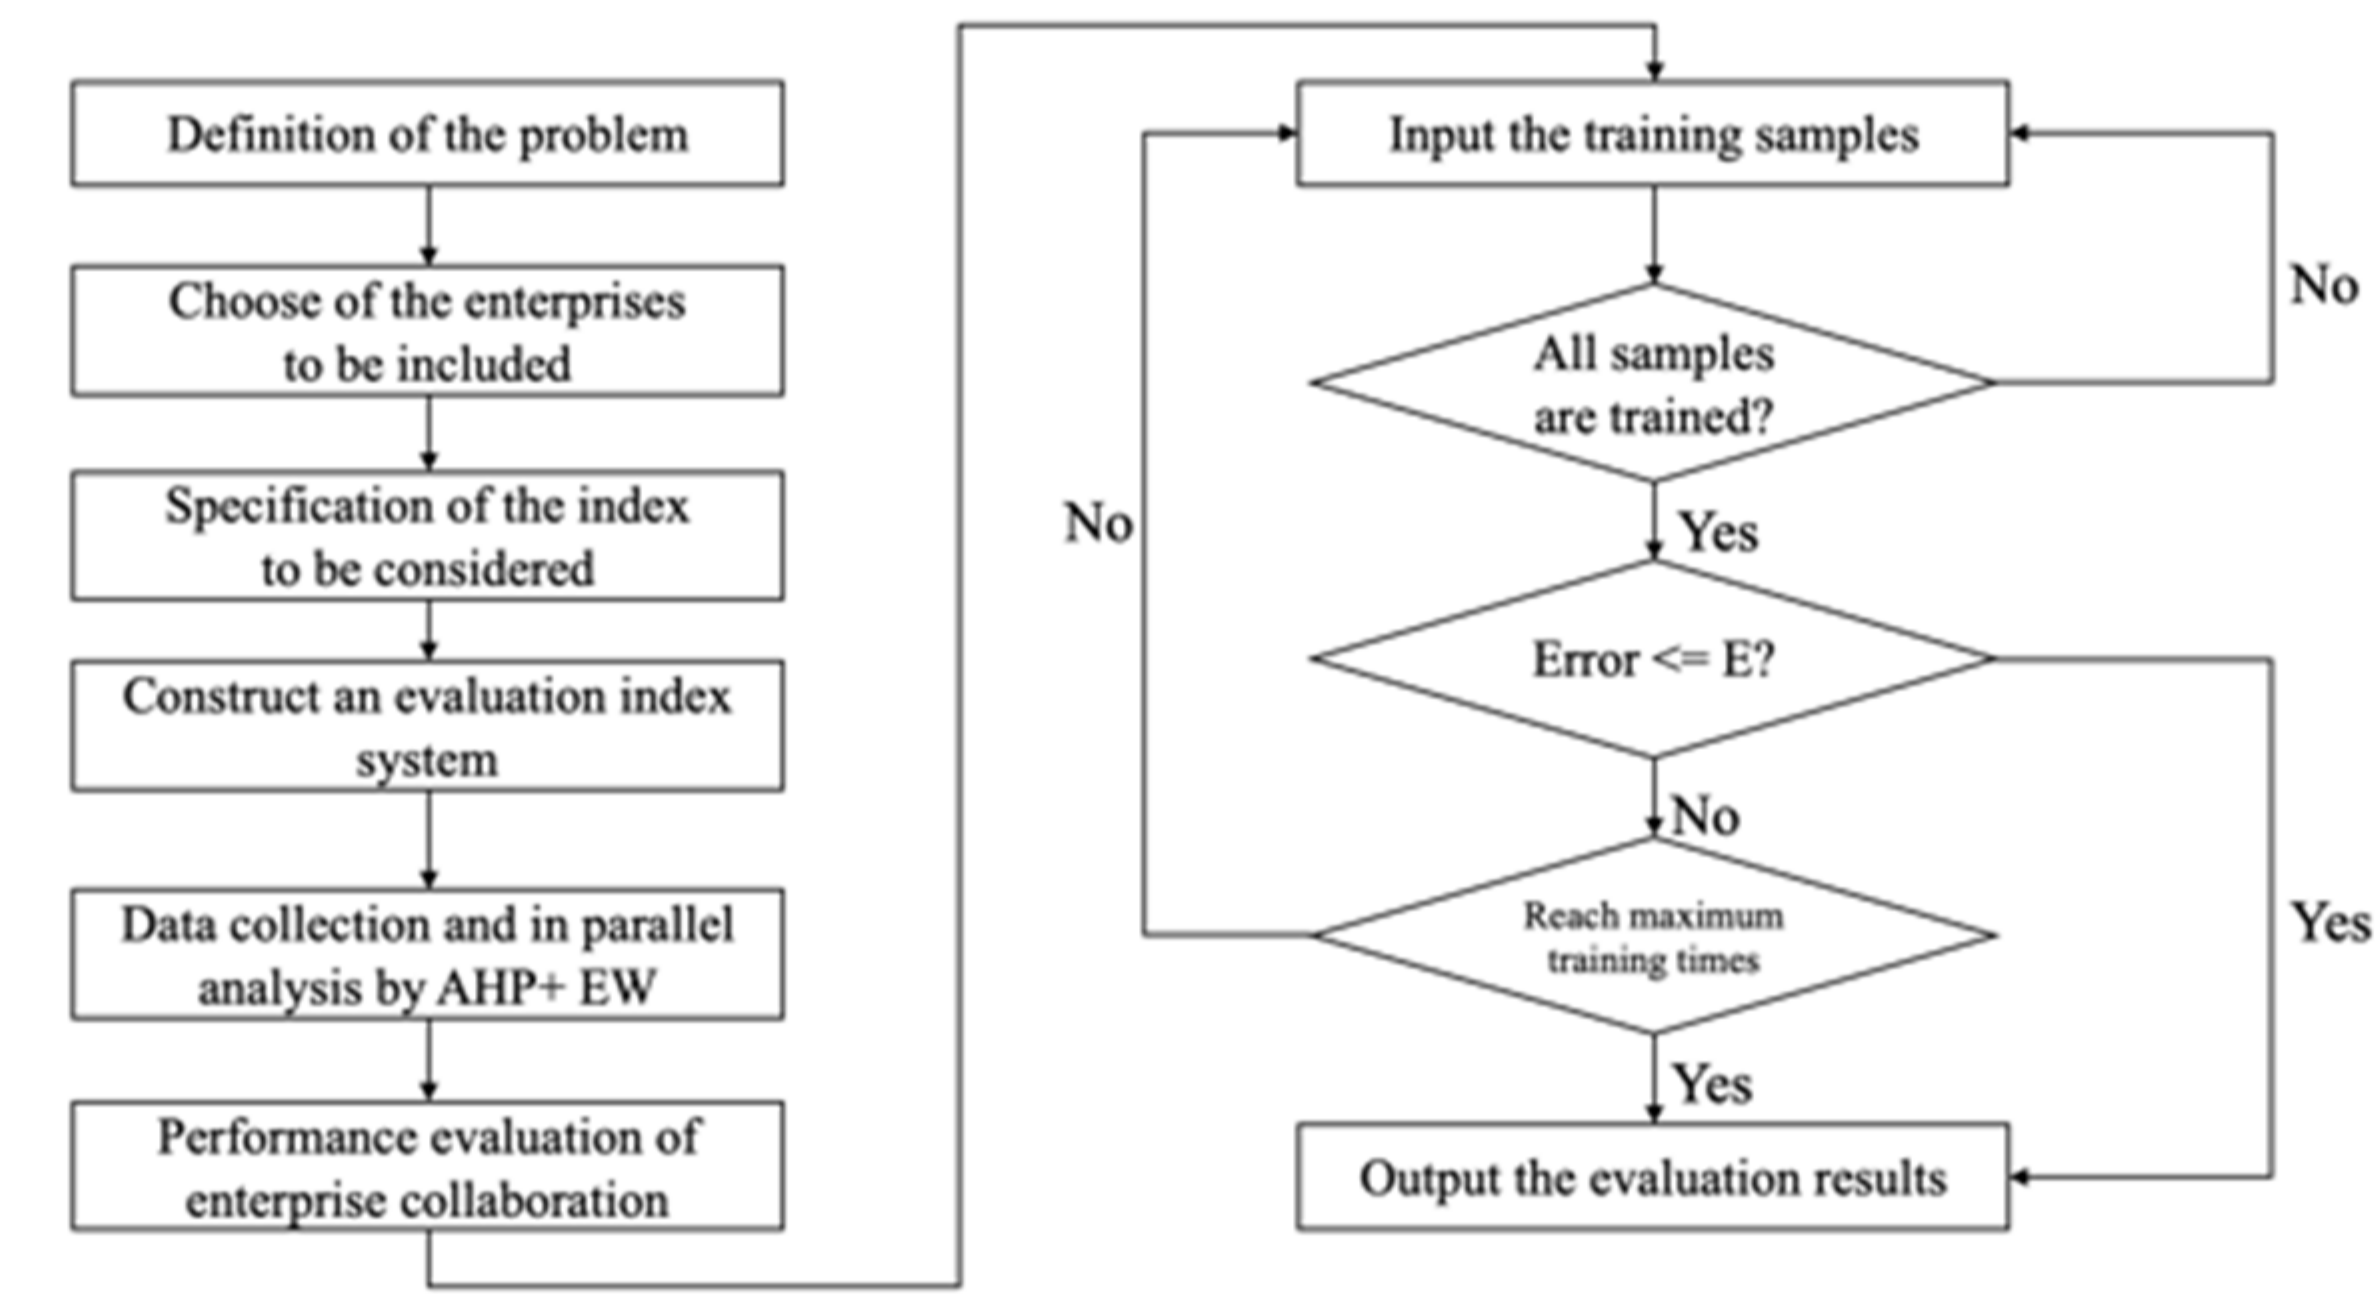
By introducing the Elman neural network with strong memory and nonlinear processing capabilities, it can learn from the historical evaluation data, simulate the intuition and experience of experts, and self-identify and optimize the importance of each influencing factor. In order to enhance the applicability of the Elman for collaborative performance evaluation, the additional momentum method and adaptive learning methods are used to improve the network’s learning algorithm, and they are used for enterprise collaborative performance evaluation. The performance evaluation process of enterprise collaboration in this paper is shown in Figure 1.
4.2. Structure Design of Elman Neural Networks
Different structures of neural networks result in some differences in their ability to solve problems. According to the characteristics of enterprises’ collaboration performance and the proposed evaluation index system, the structure of Elman neural networks is designed. The specific process is as follows:
4.2.1. Determining the Number of Neurons in the Input Layer and the Output Layer
The data corresponding to the enterprise collaborative performance evaluation index system is taken as the input vector of the Elman neural network. Therefore, the number of input neurons is the same as the number of evaluation indicators, which is set to 21. The trained network integrates 21 pieces of evaluation index information into a scalar, so the number of neurons in the output layer is set to 1.
4.2.2. Hidden Layer Setting
Taking into account the amount of data corresponding to the evaluation index, the number of hidden layers and context layers are both set to 1 in this paper. The selection of the number is the key to determining the network’s performance, but there is currently no unified conclusion to determine it. If the number is too large, problems such as a long learning time and poor fault tolerance will occur, and if the number is too small, problems such as poor calculation accuracy will occur. Most of the current research is based on the empirical formula:
where , , are the number of neurons in the hidden layer, input layer and output layer, respectively, and is a constant between 1 and 10.
4.2.3. Determining the Network’s Structure
Based on 21 evaluation indicators and 1 output, combined with the above formula, this paper increases the number of neurons in the hidden layer and the continuation layer from 6 to 15. Through multiple experiments and comparisons, it is found that when the number of neurons in the hidden layer is set to 11, the network’s performance is optimal. In summary, the evaluation model designed in this paper is a 4-layer () Elman neural network model.
4.3. Improved Elman Neural Network Algorithm
However, Elman neural networks also have their own limitations and shortcomings. Aiming at the shortcomings of neural network algorithms in practical engineering applications, scholars have mainly studied and improved from two aspects of network topology and learning algorithms. The adjustment of the neural network topology will greatly increase the computational burden, which is not conducive to the improvement of neural networks’ performance. Therefore, the additional momentum method is used to improve the learning algorithm of the neural network.
4.3.1. Weight Adjustment Based on Additional Momentum
The additional momentum factor algorithm means that in the process of back propagation, a part of the previous weight change is added to the current weight adjustment value through the momentum factor, and it is used as the actual weight adjustment value. The adjustment formula is as follows:
where is the number of training times, is the momentum factor, generally set to 0.95, and is the learning rate.
4.3.2. Adaptive Learning Rate
The adaptive learning rate refers to the automatic adjustment of the learning rate during the training process. The adjustment formula is as follows:
If the correction of the weights reduces the error, the learning rate should be increased so that it learns at the maximum learning rate. Otherwise, over-tuning has occurred, and the value of the learning rate should be reduced immediately.
The specific process of the improved Elman neural network algorithm is as follows:
- Initialize the connection weight matrix of the Elman neural network
- Randomly select 80% of the collected enterprise indicator data as the training set and input it into the network.
- Calculate the output of the hidden layer, the context layer and the output layer.
- Error back propagation.
Elman neural networks use a BP algorithm to revise weights, and the error of the network is:
where is the target output and is the total number of samples.
The adjustment of the connection matrix from the context layer to the hidden layer:
The adjustment of the connection weight matrix from the input layer to the hidden layer:
The adjustment of the connection weight matrix from the hidden layer to the output layer:
- 5.
- The connection weight matrix w1, w2, w3 are corrected.
The correction formula of the network weight is:
Aiming at the dynamics and uncertainty of enterprises’ collaboration performance evaluation, an Elman neural network is introduced and its network structure is designed based on the constructed evaluation index system. Then, through the study of the existing evaluation information, the importance of each evaluation index is identified and optimized, and a more reasonable and scientific evaluation result is obtained. Finally, the network’s learning algorithm is improved by adjusting the relevant parameters to speed up the convergence speed and improve the accuracy of the evaluation results.
5. Experimental Results
5.1. Data Collection
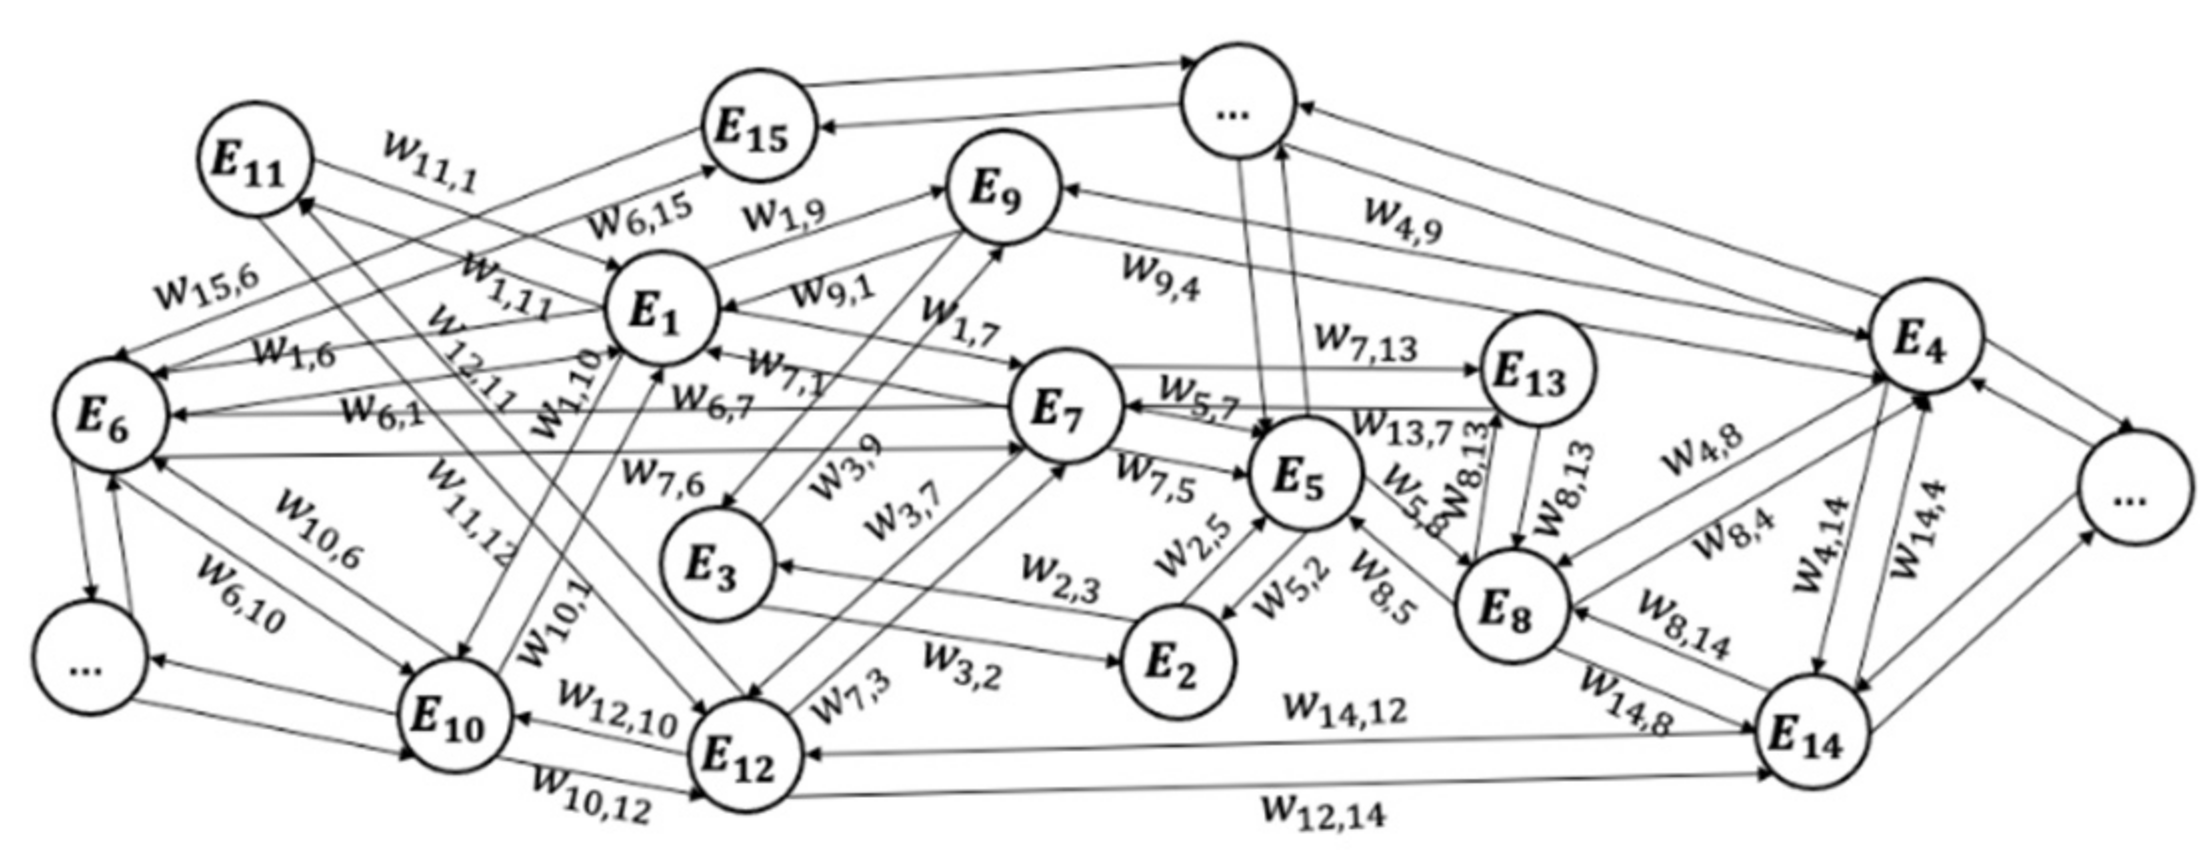
In order to verify the effectiveness of the proposed method, a manufacturing enterprise in Sichuan Province and its collaboration enterprises are selected as sample data, and the survey method is a questionnaire survey. First, design a questionnaire based on the constructed collaborative performance evaluation index system, and distribute it to the enterprise and its partners to collect data. Then, manufacturing enterprise managers, technical experts and authoritative scholars evaluate the collaboration performance between different enterprises, and use the evaluation results as the target value. Finally, 50 pieces of enterprise collaboration performance evaluation data originating from 25 collaborative enterprises were obtained, and each piece of data contained 21 evaluation indicators. Inspired by the experimental settings of [9,10,15], we randomly select 40 pieces of data as training data and the remaining 10 pieces of data as test data. Matlab_R2021b software is used for programming and operation, the 21 items of data of the enterprise are used as input values, and the corresponding evaluation values are used as target output values. The collaborative relationship between enterprises is shown in Figure 2.
The raw data after standardization is shown in Table 2, where represents the indicator data and represents the collaboration performance of enterprise and .
5.2. Determination of the Number of Neurons in the Hidden Layers
The newelm() function in Matlab is used to create the Elman neural network, and its expression is as follows:
Among them, tansig is selected as the activation function because its convergence speed is faster than that of the commonly used sigmoid function, and the number of iterations can be reduced. The training function has a great influence on neural network training. We use the default trainlm as the training function. Compared with the trainbfg and trainingd, although it occupies more memory resources, it has a faster computing speed. The specific parameter settings are shown in the Table 3.
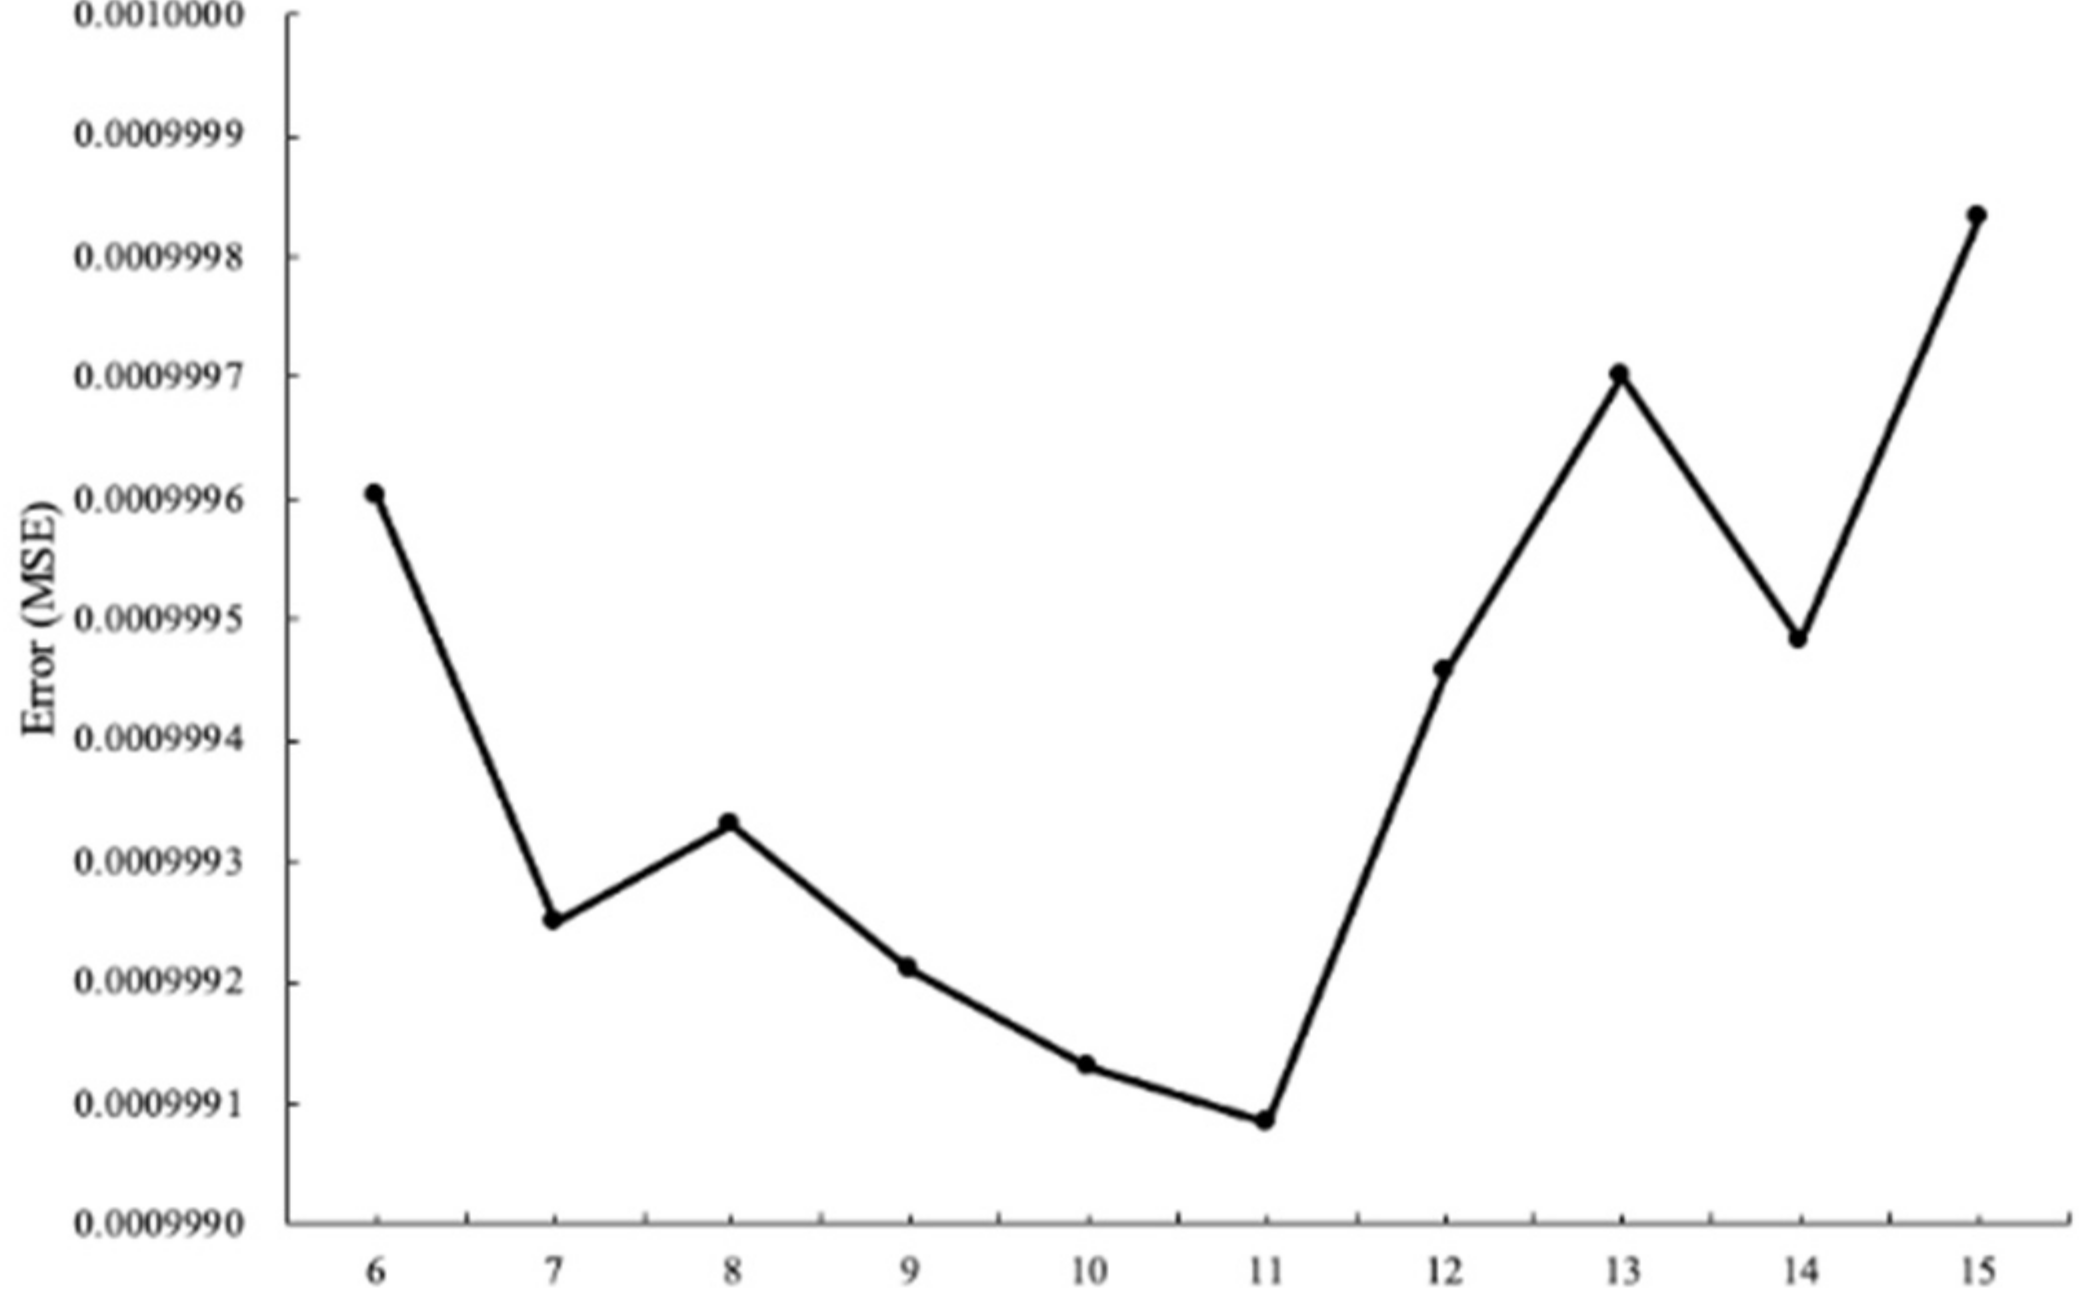
In order to design a neural network model that is more suitable for enterprise collaboration performance evaluation, experiments were carried out to compare networks with different numbers of neurons in the hidden layer. The experimental comparison results are shown in Table 4 and Figure 3.
As can be seen from Table 4 and Figure 3, when the number of neurons in the hidden layer increases from 6 to 11, the error of the model shows a decreasing trend as a whole. Until the number of neurons in the hidden layer increases to 11, the model has the lowest error of 0.0009990843. After that, the error of the model will continue to increase as the number of neurons in the hidden layer increases. Therefore, in the subsequent experiments, the number of neurons in the hidden layer of the Elman neural network is 11.
5.3. Comparative Analysis of Models
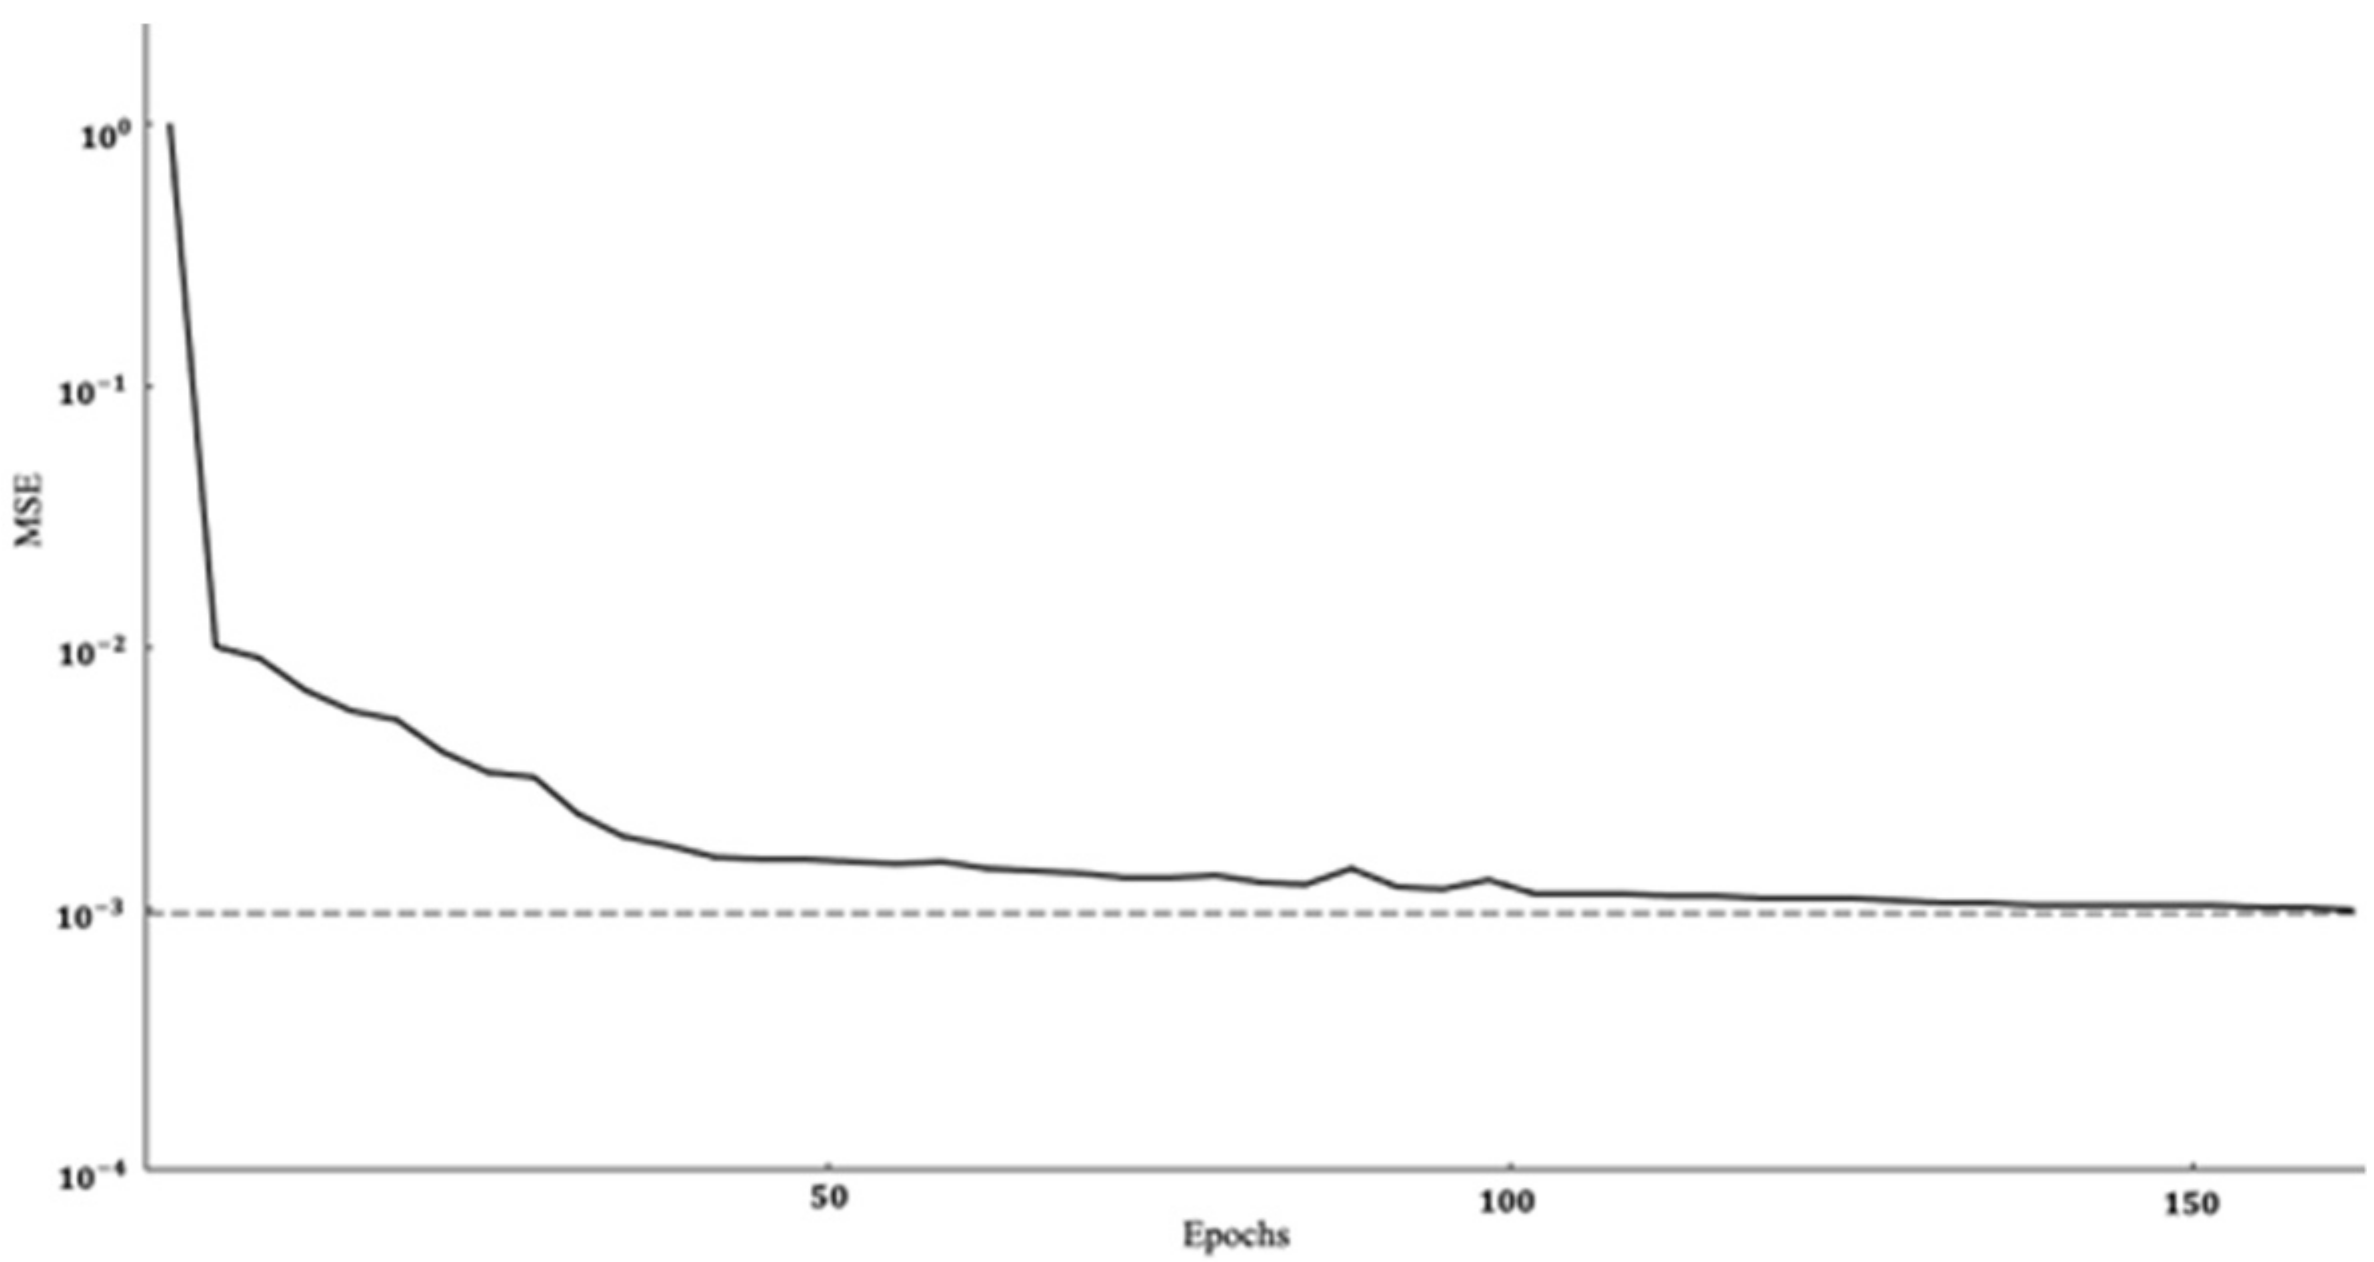
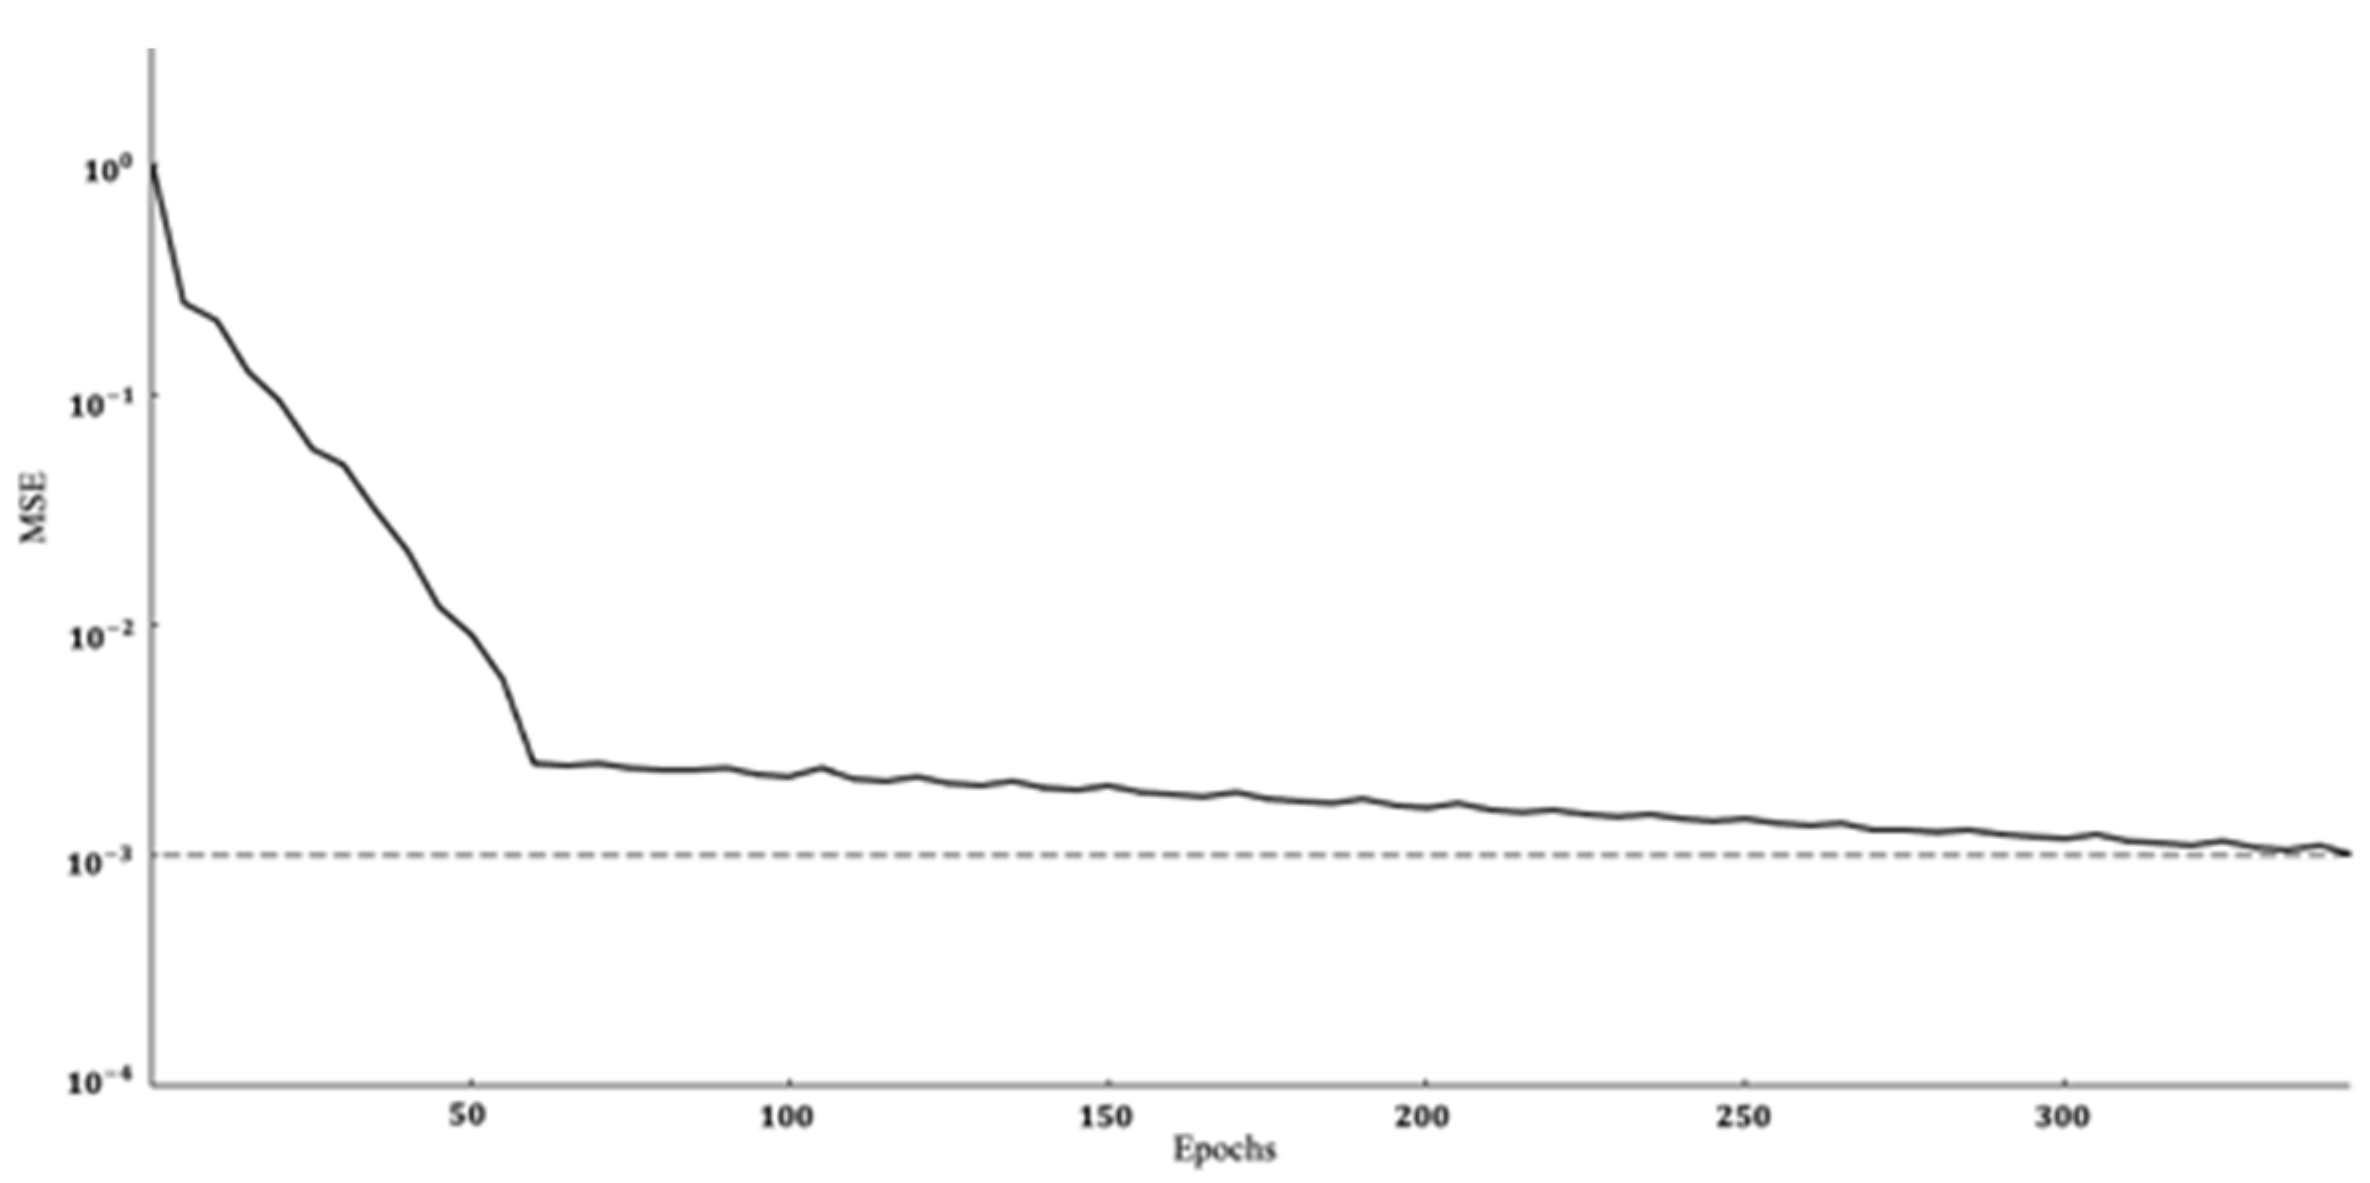
To verify the excellent performance of the improved Elman neural network algorithm proposed in this paper, the convergence speed and accuracy of the proposed model and the original Elman [23] and RBF (Radial Basis Function) neural networks [24] are compared. The convergence of the improved Elman neural network and the original Elman neural network is shown in Figure 4 and Figure 5.
It can be seen from Figure 4 and Figure 5 that the original Elman neural network has iterated more than 360 times, while the improved Elman neural network has only been iterated more than 160 times under the same experimental environment. The proposed model takes significantly less time on enterprise collaboration performance evaluation data, which demonstrates the effectiveness of the improved learning algorithm. The enterprise collaboration performance evaluation data used in the experiment are representative and universal, so the experimental conclusions are also applicable to other enterprise collaboration performance evaluations of this type.
To verify the performance of the proposed model, 5-fold cross-validation and relative error are used to describe the performance of the model. The dataset is randomly divided into five disjoint subsets, one of the subsets is selected as the test set in turn, and the rest are used as the training set. Finally, the results of the five tests are averaged. The results of the cross-validation experiments are shown in Table 5. The formula for calculating the relative error RL is as follows:
where is the number of samples in the test set, is the target output value, and is the actual output value of the model.
From Table 5, it can be seen that the relative error of the proposed model is lower than the other two models in all five experiments.
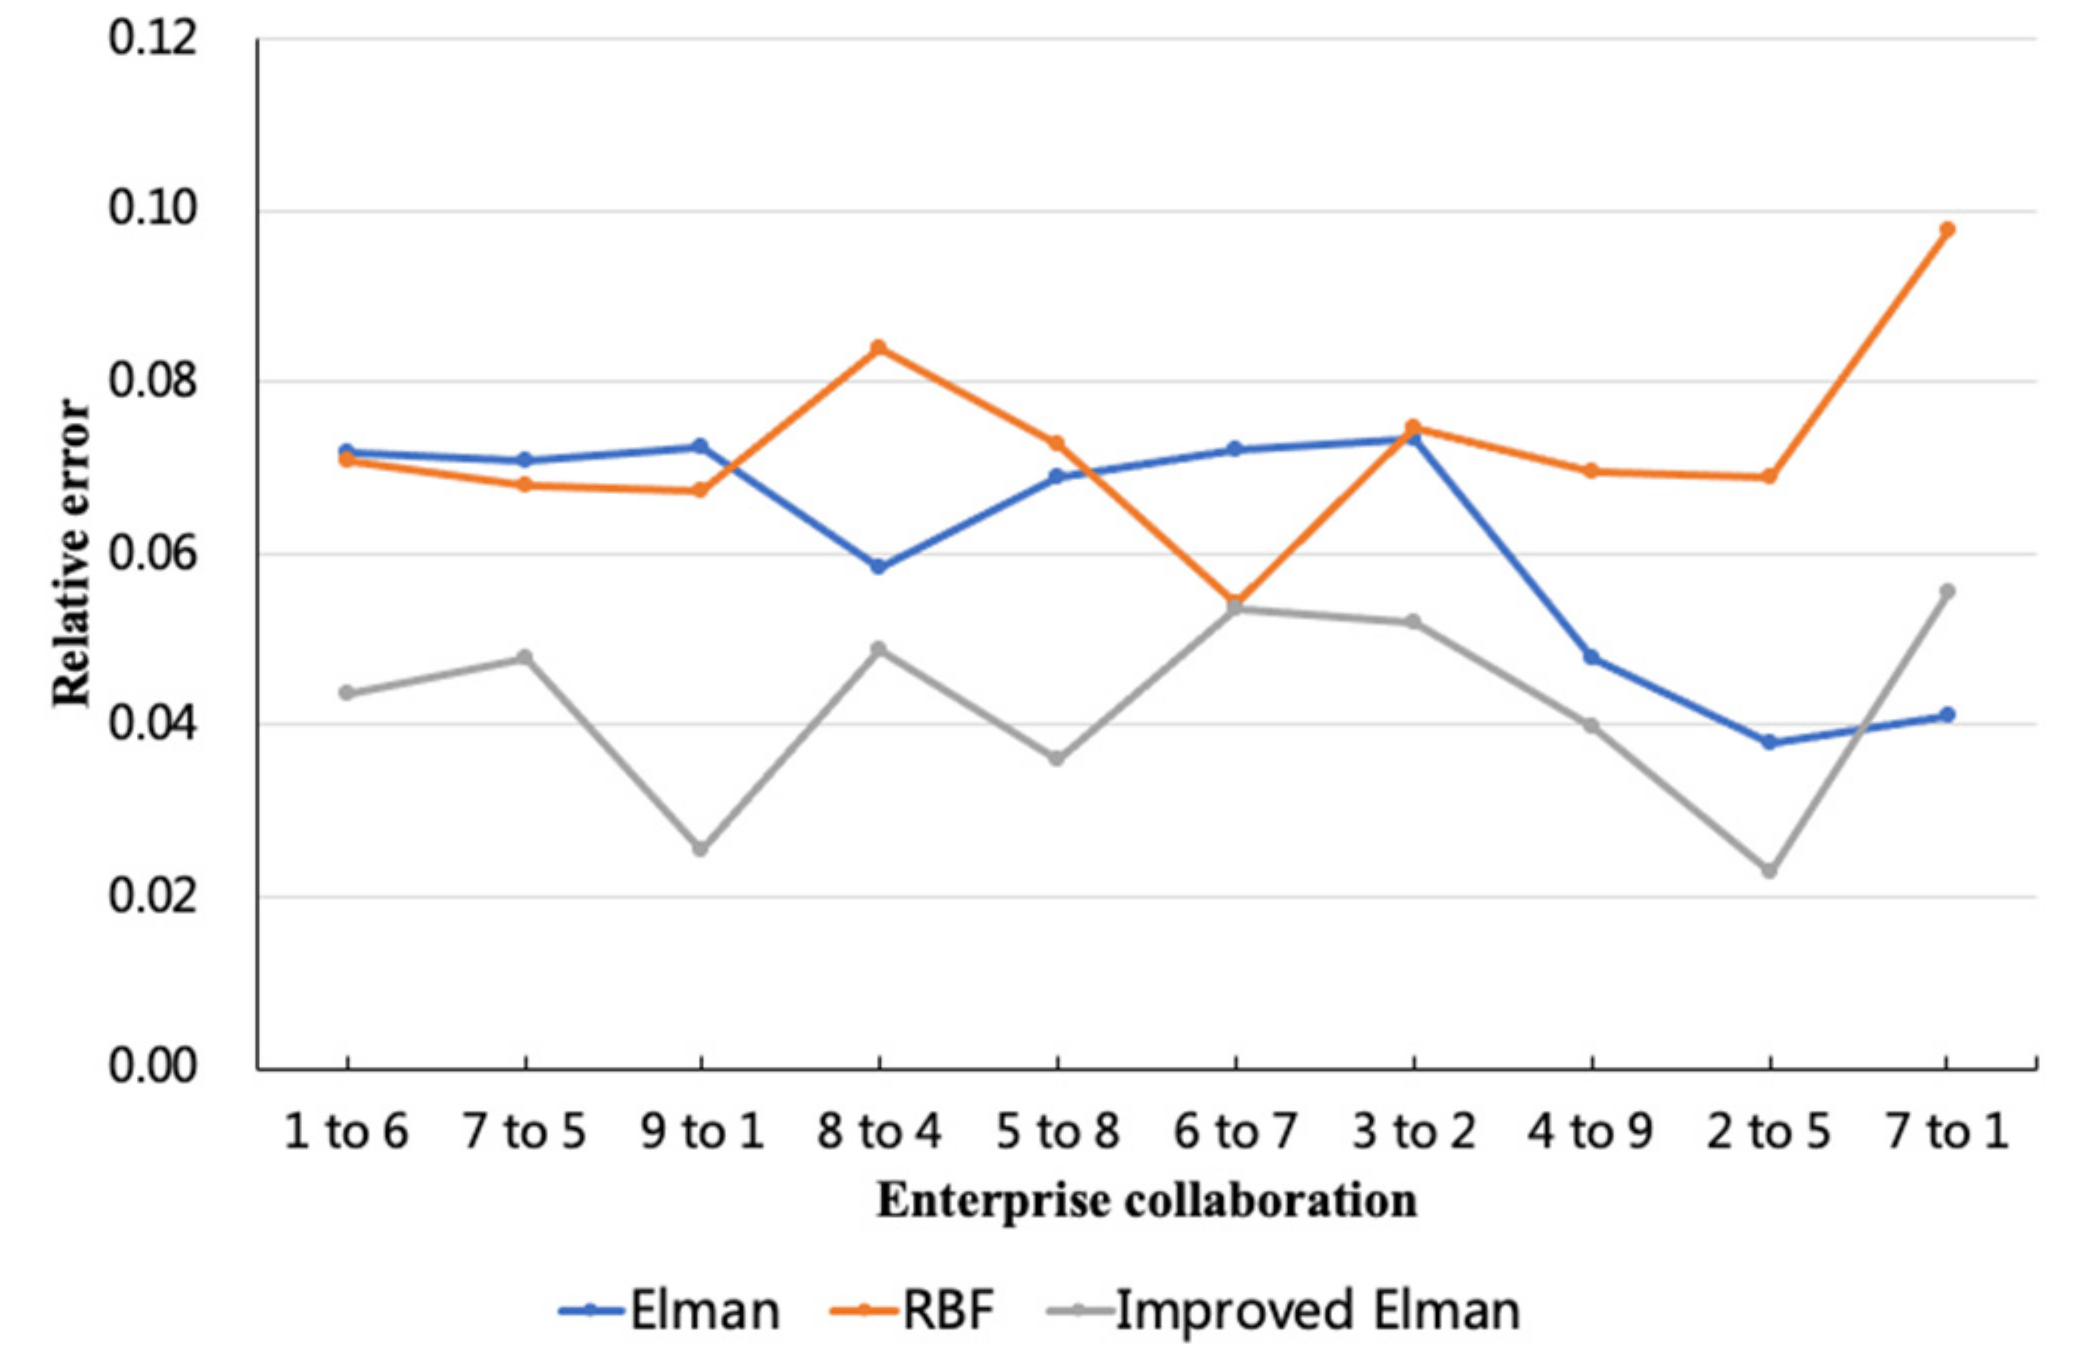
Subsequently, the mean error of the proposed model over five experiments is compared with the original Elman and RBF neural networks. The comparison results are shown in Figure 6 and Table 6.
It can be seen from Figure 6 that the error of the model proposed in this paper is higher than other models for only a few samples, and the error on most of the remaining samples is much lower than that of other models, thus showing a better overall evaluation accuracy.
It can be seen from Table 6 that the relative error of the proposed model is only 4.26%, while the relative errors of RBF and the original Elman neural network are 7.28% and 6.15%, respectively. Compared with the other two methods, the relative error of the proposed model is reduced by an average of 36.14%. The experimental results show that compared with other methods, the improved Elman neural network algorithm in this paper has a faster convergence speed and higher accuracy. Therefore, the method proposed in this paper can provide a more accurate reference for the performance evaluation of inter-firm collaboration in enterprise collaboration alliances.
6. Conclusions
This paper proposes an enterprise collaboration performance evaluation method based on an improved Elman neural network and AHP-EW. The enterprise collaboration performance evaluation index system is established from the three dimensions of enterprise finance, enterprise business and enterprise strategy, and the weights obtained by the AHP and EW methods are synthesized by the minimum deviation method, which takes into account the influence of expert experience and data fluctuations simultaneously. Then, an improved Elman neural network model is proposed, in which the additional momentum and adaptive learning rate methods are used to improve the network’s learning algorithm. The Elman neural network was used to convert human subjective judgments into objective statistical data to improve the rationality, intuition and credibility of the evaluation results. Finally, the proposed model is verified by taking the data of a manufacturing enterprise and its partners as an example. The optimal network structure for enterprise collaboration performance evaluation is determined through repeated experiments. The comparison results with original Elman and RBF neural networks show that the convergence speed of the proposed model is improved by about 50%, and the relative error is reduced by about 30% on average, which can provide a valuable reference for enterprise collaboration and management.
Due to the limitation of external objective conditions, both qualitative and quantitative indicators are used when constructing the evaluation index system for enterprises’ collaboration performance. Although the fuzzy comprehensive evaluation method is used to deal with qualitative indicators, qualitative indicators occupy a large proportion. In this process, qualitative indicators may be affected by the subjective consciousness and quality of the experts. Due to the fact that the number of experts in the expert database is relatively small, the number of experts is limited, and the breadth of prior knowledge accumulation is limited, which needs to be continuously enriched. The number of enterprise data samples should also gradually expand, which is more conducive to model learning and more accurate evaluation accuracy.
Author Contributions
Conceptualization, Y.J.; methodology, J.Z.; validation, X.D.; formal analysis, D.H.; writing-original draft preparation, J.Z.; writing—review and editing, J.Z.; supervision, D.H., B.G. and Y.J. All authors have read and agreed to the published version of the manuscript.
Funding
This work was funded by the National Key R&D Program of China [grant number 2020YFB1707900, 2020YFB1711800].
Institutional Review Board Statement
Not applicable.
Informed Consent Statement
Not applicable.
Data Availability Statement
Not applicable.
Conflicts of Interest
The authors declare no conflict of interest.
References
- Zhang, Z.; Wang, X.; Zhu, X.; Cao, Q.; Tao, F. Cloud manufacturing paradigm with ubiquitous robotic system for product customization. Robot. Comput. Manuf. 2019, 60, 12–22. [Google Scholar] [CrossRef]
- Martino, G.; Fera, M.; Iannone, R.; Miranda, S. Supply chain risk assessment in the fashion retail industry: An analytic network process approach. Int. J. Appl. Eng. Res. 2017, 12, 140–154. [Google Scholar]
- Zhang, F.; Jiang, P.; Zhu, Q.; Cao, W. Modeling and analyzing of an enterprise collaboration network supported by service-oriented manufacturing. Proc. Inst. Mech. Eng. Part B J. Eng. Manuf. 2012, 226, 1579–1593. [Google Scholar] [CrossRef]
- Peng, C.; Meng, Y. Empirical study of manufacturing enterprise collaboration network: Formation and characteristics. Robot. Comput. Manuf. 2016, 42, 49–62. [Google Scholar] [CrossRef]
- Hu, J.W.; Gao, S.; Yan, J.W.; Lou, P.; Yin, Y. Manufacturing enterprise collaboration network: An empirical research and evolutionary model. Chin. Phys. B 2020, 29, 088901. [Google Scholar] [CrossRef]
- Jia, Y.; Li, J. Modeling and Characteristic Analysis of Manufacturing Enterprise Collaboration Network for Complex Product. IOP Conf. Ser. Mater. Sci. Eng. 2020, 790, 012108. [Google Scholar] [CrossRef]
- Durugbo, C. Collaborative networks: A systematic review and multi-level framework. Int. J. Prod. Res. 2015, 54, 3749–3776. [Google Scholar] [CrossRef]
- Andres, B.; Poler, R. Models, guidelines and tools for the integration of collaborative processes in non-hierarchical manufacturing networks: A review. Int. J. Comput. Integr. Manuf. 2016, 29, 166–201. [Google Scholar]
- Cai, X.; Qian, Y.; Bai, Q.; Liu, W. Exploration on the financing risks of enterprise supply chain using Back Propagation neural network. J. Comput. Appl. Math. 2019, 367, 112457. [Google Scholar] [CrossRef]
- Huang, X.; Liu, X.; Ren, Y. Enterprise credit risk evaluation based on neural network algorithm. Cogn. Syst. Res. 2018, 52, 317–324. [Google Scholar] [CrossRef]
- Gao, J. Performance evaluation of manufacturing collaborative logistics based on BP neural network and rough set. Neural Comput. Appl. 2020, 33, 739–754. [Google Scholar] [CrossRef]
- Daclin, N.; Chen, D.; Vallespir, B. Developing enterprise collaboration: A methodology to implement and improve interoperability. Enterp. Inf. Syst. 2014, 10, 467–504. [Google Scholar] [CrossRef]
- Abudureheman, A.; Nilupaer, A.; He, Y. Performance evaluation of enterprises’ innovation capacity based on fuzzy system model and convolutional neural network. J. Intell. Fuzzy Syst. 2020, 39, 1563–1571. [Google Scholar] [CrossRef]
- Li, W.; Wang, Y. Dynamic evaluation of logistics enterprise competitiveness based on machine learning and improved neural network. J. Ambient Intell. Humaniz. Comput. 2021, 12, 1–15. [Google Scholar] [CrossRef]
- Li, W.; Xu, G.; Xing, Q.; Lyu, M. Application of Improved AHP-BP Neural Network in CSR Performance Evaluation Model. Wirel. Pers. Commun. 2019, 111, 2215–2230. [Google Scholar] [CrossRef]
- Shu, Y.; Xu, G.-H. Multi-level Dynamic Fuzzy Evaluation and BP Neural Network Method for Performance Evaluation of Chinese Private Enterprises. Wirel. Pers. Commun. 2018, 102, 2715–2726. [Google Scholar] [CrossRef]
- Pei, J.; Liu, W. Evaluation of Chinese Enterprise Safety Production Resilience Based on a Combined Gray Relevancy and BP Neural Network Model. Sustainability 2019, 11, 4321. [Google Scholar] [CrossRef]
- Zhang, Y.; Hu, Z.; Ji, L.; Sun, N.; Lin, Y. Evaluation model of enterprise operation based on BP neural network optimization algorithm. J. Phys. Conf. Ser. 2020, 1570, 012084. [Google Scholar] [CrossRef]
- Awasthy, R.; Flint, S.; Jones, R.L.; Sankaranarayana, R. UICMM: A Maturity Model for University-Industry Collaboration. In Proceedings of the 2018 IEEE International Conference on Engineering, Technology and Innovation (ICE/ITMC), Stuttgart, Germany, 17–20 June 2018; pp. 1–8. [Google Scholar] [CrossRef]
- Ho, D.; Kumar, A.; Shiwakoti, N. Maturity model for supply chain collaboration: CMMI approach. In Proceedings of the 2016 IEEE International Conference on Industrial Engineering and Engineering Management (IEEM), Bali, Indonesia, 4–7 December 2016; pp. 845–849. [Google Scholar] [CrossRef]
- Schimpf, S.; Christo, N. Towards Strategic Action Planning: Using a Collaboration Maturity Model to Support International Co-Operation in Research and Innovation. In Proceedings of the 2018 IEEE International Conference on Engineering, Technology and Innovation (ICE/ITMC), Stuttgart, Germany, 17–20 June 2018; pp. 1–6. [Google Scholar] [CrossRef]
- Mahmood, K.; Lanz, M.; Toivonen, V.; Otto, T. A Performance Evaluation Concept for Production Systems in an SME Network. Procedia CIRP 2018, 72, 603–608. [Google Scholar] [CrossRef]
- Changjian, L.; Peng, H. Credit Risk Assessment for Rural Credit Cooperatives Based on Improved Neural Network. In Proceedings of the 2017 International Conference on Smart Grid and Electrical Automation (ICSGEA), Changsha, China, 27–28 May 2017; pp. 227–230. [Google Scholar] [CrossRef]
- Huang, L.; Tan, Y.; Guan, X. Evaluation of Cruise Ship Supply Logistics Service Providers with ANP-RBF. J. Adv. Transp. 2021, 2021, 6645946. [Google Scholar] [CrossRef]
Figure 1.
The performance evaluation process of the proposed model.

Figure 2.
The collaborative relationship between enterprises.

Figure 3.
Model performance comparison for different numbers of neurons in the hidden layer.

Figure 4.
Convergence process of improved Elman neural network.

Figure 5.
Convergence process of Elman neural network.

Figure 6.
Relative error comparison of the proposed model with other models.


Table 1.
Enterprise collaboration performance evaluation index system.
| First-Level Indicators | Second-Level Indicators | Third-Level Indicators |
|---|---|---|
| Collaboration performance | Enterprise finance | Input–output ratio (G1) |
| Timely settlement rate (G2) | ||
| Cost saving rate (G3) | ||
| Cash conversion rate (G4) | ||
| Enterprise business | Proportion of joint purchases to total purchases (G5) | |
| Procurement timeliness (G6) | ||
| Inventory turnover (G7) | ||
| Synchronization of production plan (G8) | ||
| Material supply flexibility (G9) | ||
| On-time delivery (G10) | ||
| Project construction flexibility (G11) | ||
| Comprehensive project quality qualification rate(G12) | ||
| The stability of supply and demand (G13) | ||
| Output value of jointly developed products (G14) | ||
| Timeliness of information delivery (G15) | ||
| Degree of information sharing (G16) | ||
| Enterprise strategy | Goal congruence (G17) | |
| Corporate culture compatibility (G18) | ||
| Degree of strategic goal matching (G19) | ||
| Historical cooperation times (G20) | ||
| Degree of corporate trust (G21) |
Table 2.
50 pieces of collaborative data from 25 collaborative enterprises after normalization.
| E1 to E6 | E1 to E9 | E1 to E11 | E2 to E3 | E2 to E5 | E3 to E9 | … | … | E25 to E15 | |
|---|---|---|---|---|---|---|---|---|---|
| G1 | 0.4988 | 0.0100 | 0.4214 | 0.8787 | 0.9532 | 0.5252 | … | … | 1.0000 |
| G2 | 1.0000 | 0.6694 | 0.0100 | 0.7963 | 0.4686 | 0.2982 | … | … | 0.9151 |
| G3 | 0.7722 | 0.8716 | 0.5572 | 1.0000 | 0.5973 | 0.9035 | … | … | 0.9694 |
| G4 | 0.1829 | 0.9707 | 0.8469 | 0.2571 | 0.0100 | 0.8453 | … | … | 0.5112 |
| G5 | 0.9751 | 0.7493 | 0.4631 | 0.7991 | 0.1266 | 0.4948 | … | … | 0.5849 |
| G6 | 0.3793 | 0.6735 | 0.4810 | 0.9054 | 0.7606 | 1.0000 | … | … | 0.6656 |
| G7 | 0.6774 | 0.4573 | 0.7871 | 0.3023 | 0.4479 | 0.2243 | … | … | 0.0100 |
| G8 | 0.5226 | 0.0100 | 1.0000 | 0.4707 | 0.3411 | 0.8328 | … | … | 0.1339 |
| … | … | … | … | … | … | … | … | … | … |
| … | … | … | … | … | … | … | … | … | … |
| G21 | 0.6381 | 0.5744 | 0.3273 | 0.3561 | 0.8465 | 0.3570 | … | … | 0.0100 |
Table 3.
The meaning and setting of experimental parameters.
| Parameters | Meaning | Set Value |
|---|---|---|
| P | The value range of the input matrix | input(:,1:40) |
| T | The value range of the output matrix | output(:,1:40) |
| TFi | The transfer function of the i-th layer | trainsg |
| BTF | The training function | trainlm |
| epochs | Number of iterations over all training samples | 500 |
| goal | Training accuracy | 1 × 10⁻³ |
Table 4.
Comparison of network performance with different numbers of neurons in the hidden layer.
| The Numbers of Neurons in the Hidden Layer | Error (MSE) | Training Times (Epochs) |
|---|---|---|
| 6 | 0.0009996023 | 180 |
| 7 | 0.0009992489 | 179 |
| 8 | 0.0009993312 | 170 |
| 9 | 0.0009992097 | 167 |
| 10 | 0.0009991308 | 160 |
| 11 | 0.0009990843 | 159 |
| 12 | 0.0009994574 | 154 |
| 13 | 0.0009997011 | 152 |
| 14 | 0.0009994827 | 151 |
| 15 | 0.0009998314 | 148 |
Table 5.
Cross-validation experimental results of the proposed model with other models.
| Experiment Number | Elman Neural Network | RBF Neural Network | Improved Elman Neural Network |
| Relative Error | Relative Error | Relative Error | |
| 1 | 6.81% | 7.52% | 4.56% |
| 2 | 6.16% | 7.23% | 4.42% |
| 3 | 6.49% | 7.92% | 4.77% |
| 4 | 6.99% | 7.80% | 4.96% |
| 5 | 6.74% | 7.68% | 4.45% |
| Average | 6.64% | 7.63% | 4.63% |
Table 6.
The output results and error comparison of the proposed model and other models.
| Collaborative Relationship | Expected Output | Elman Neural Network [23] | RBF Neural Network [24] | Improved Elman Neural Network | |||
| Predicted Value | Relative Error | Predicted Value | Relative Error | Predicted Value | Relative Error | ||
| E1 to E6 | 75 | 69.613 | 7.18% | 80.302 | 7.07% | 78.273 | 4.36% |
| E7 to E5 | 69 | 64.118 | 7.08% | 64.317 | 6.79% | 65.701 | 4.78% |
| E9 to E1 | 57 | 61.127 | 7.24% | 53.163 | 6.73% | 58.454 | 2.55% |
| E8 to E4 | 85 | 89.97 | 5.85% | 92.133 | 8.39% | 80.844 | 4.89% |
| E5 to E8 | 65 | 60.523 | 6.89% | 69.732 | 7.28% | 62.663 | 3.60% |
| E6 to E7 | 74 | 68.674 | 7.20% | 69.996 | 5.41% | 77.966 | 5.36% |
| E3 to E2 | 73 | 67.636 | 7.35% | 78.462 | 7.48% | 69.204 | 5.20% |
| E4 to E9 | 78 | 74.262 | 4.79% | 72.575 | 6.96% | 74.887 | 3.99% |
| E2 to E5 | 87 | 90.299 | 3.79% | 81.015 | 6.88% | 88.991 | 2.29% |
| E7 to E1 | 64 | 61.361 | 4.12% | 70.252 | 9.77% | 60.454 | 5.54% |
| Average | 6.15% | 7.28% | 4.26% | ||||
Publisher’s Note: MDPI stays neutral with regard to jurisdictional claims in published maps and institutional affiliations. |
© 2022 by the authors. Licensee MDPI, Basel, Switzerland. This article is an open access article distributed under the terms and conditions of the Creative Commons Attribution (CC BY) license (https://creativecommons.org/licenses/by/4.0/).
Share and Cite
MDPI and ACS Style
Zhang, J.; Ding, X.; Hu, D.; Guo, B.; Jiang, Y. Performance Evaluation of Enterprise Collaboration Based on an Improved Elman Neural Network and AHP-EW. Appl. Sci. 2022, 12, 5941. https://0-doi-org.brum.beds.ac.uk/10.3390/app12125941
AMA Style
Zhang J, Ding X, Hu D, Guo B, Jiang Y. Performance Evaluation of Enterprise Collaboration Based on an Improved Elman Neural Network and AHP-EW. Applied Sciences. 2022; 12(12):5941. https://0-doi-org.brum.beds.ac.uk/10.3390/app12125941
Chicago/Turabian StyleZhang, Jianxiong, Xuefeng Ding, Dasha Hu, Bing Guo, and Yuming Jiang. 2022. "Performance Evaluation of Enterprise Collaboration Based on an Improved Elman Neural Network and AHP-EW" Applied Sciences 12, no. 12: 5941. https://0-doi-org.brum.beds.ac.uk/10.3390/app12125941
Note that from the first issue of 2016, this journal uses article numbers instead of page numbers. See further details here.