
The Vision-Based Data Reader in IoT System for Smart Factory


1
Department of Computer Science & Information Management, Soochow University, Taipei 111, Taiwan
2
Department of Visual Communication Design, Hsuan Chuang University, Hsinchu 300, Taiwan
3
Department of Information Management, Hsuan Chuang University, Hsinchu 300, Taiwan
4
School of Computer Science and Intelligence Education, Lingnan Normal University, Zhanjiang 524048, China
*
Author to whom correspondence should be addressed.
Appl. Sci. 2022, 12(13), 6586; https://0-doi-org.brum.beds.ac.uk/10.3390/app12136586
Submission received: 24 May 2022
/
Revised: 17 June 2022
/
Accepted: 27 June 2022
/
Published: 29 June 2022
(This article belongs to the Special Issue Innovative Applications of Big Data and Cloud Computing)
Abstract
:The proposed research is based on a real plastic injection factory for cutting board production. Most existing approaches for smart manufacturing tried to build the total solution of IoT by moving forward to the standard of industry 4.0. Under the cost considerations, this will not be acceptable to most factories, so we proposed the vision based technology to solve their immediate problem. Real-time machine condition monitoring is important for making great products and measuring line productivity or factory productivity. The study focused on a vision-based data reader (VDR) in edge computing for smart factories. A simple camera embedded in Field Programmable Gate Array (FPGA) was attached to monitor the screen on the control panel of the machines. Each end device was preprogrammed to capture images and process data on its own. The preprocessing step was then performed to have the normalized illumination of the captured image. A saliency map was generated to detect the required region for recognition. Finally, digit recognition was performed and the recognized digits were sent to the IoT system. The most significant contribution of the proposed VDR system used the compact deep learning model for training and testing purposes to fit the requirement of cost consideration and real-time monitoring in edge computing. To build the compact model, different convolution filters were tested to fit the performance requirement. Experimentations on a real plastic cutting board factory showed the improvement in manufacturing products by the proposed system and achieved a high digit recognition accuracy of 97.56%. In addition, the prototype system had low power and low latency advantages.
1. Introduction
In the manufacturing industry, the smart factory is considered to be the solution to the new industrial revolution. Many manufacturing companies are pursuing various advanced and expensive technologies to ensure their competitiveness with others. Machine condition monitoring is a way of making great products and measuring line productivity or factory productivity. Some recent applications of process control monitoring can be achieved with appropriate strategies of data collection and cloud storage. Bacci di Capaci and Scali presented a performance monitoring system in a manufacturing process loop of various industrial plants based on cloud computing in different application areas to match Industry 4.0 paradigms [1]. Their methodology had been tested on real large plant data to show how the system improved the operation plan in the factory.
Over the past ten years, wireless sensor networks have rapidly grown in various applications. Based on the innovations in radio frequency identification, and wireless and cellular networks, the Internet of Things (IoT) was first proposed by Kevin Ashton [2]. IoT has become the term for smart things that can configure and communicate with each other through a global network for many applications. In the IoT world, a lot of smart objects are connected to the internet for their specific application [3]. All these objects have their own identities such that they could be organized, managed, and controlled remotely. Due to the growth in a diverse range of intelligent applications, IoT systems have enriched our daily lives [4], involving aspects of healthcare [5], intelligent cities [6,7], agriculture [8], crowdsensing [9], and crowdsourcing [10], etc. IoT based on robust and suitable total solutions can also help manufacturers solve the problem from a conventional factory to a new smart factory to boost their productivity [11]. A real time optimization algorithm for a large framework based on IoT sensors and an ad-hoc connections system via TCP had been performed by Vaccari, et al. [12]. Furthermore, their work was also implemented on the network components of an Italian chemical industrial factory to manage the production rates of products from different requirements. They also provided the batch and continuous production processes based on the linear optimization and batch operation scheduling [13]. Towards Industry 4.0, Badii, et al. had implemented the monitoring strategies for multiple supply chains on an open source platform. Under the system architecture, the production plant can be integrated with other plants sharing their data and processes, especially with their customers, through a well-defined interface [14].
Due to financial and technical issues, it is difficult for small and medium enterprises to adopt the existing smart manufacturing technologies to face the new challenge of the era, since there are usually several different machines at different times that exist in a factory. It may result in some difficulty for predictive maintenance and condition monitoring by IoT systems. To the best of the author’s knowledge, each control panel of the machine in small and medium-sized plastic injection factories is stand alone with network connection such that we cannot apply the existing communication interface to them directly. In fact, all plastic injection machines in the factory of the study case did not have any communication interface. If someone disassembles the machine and installs the communication interface themselves, it will violate the warranty of the machine. This would not be acceptable to the factory. That is a huge problem to develop IoT technologies on them. Therefore, the conventional monitoring and adjusting process is still done by an experienced operator of the production line for most small and medium-sized factories.
A computer vision-based data reader with edge computing would help the factory to be a smarter one. Computer vision provides object detection and recognition technology for many interesting applications of the IoT. Conventional feature descriptors in computer vision such as Scale Invariant Feature Transform (SIFT) [15], Speeded Up Robust Features (SURF) [16], Binary Robust Independent Elementary Features (BRIEF) [17], etc. are used in object detection for IoT cases to extract features for image classification tasks. However, these methods rely on hand-crafted features from input images using conventional machine learning or pattern recognition algorithms. They also requires a lot of domain knowledge and research experience to extract useful features from the input image to construct feature extractors for such applications. They are then used as input vectors for the classifiers, like Logistic Regression [17], Support Vector Machines [18], etc. to identify the label associated with an entire image (region of interest) in the case of a scene classification (object detection) problem. Therefore, the performance of the classification model is highly dependent on the feature extractor that can effectively and appropriately characterize the semantic features from the concerned images. Recently, the deep learning models combined with computer vision technologies have been able to convert general IoT devices into intelligent IoT devices that can solve a wide variety of realistic problems. For example, a smart speaker based on a face recognition algorithm was trained using a deep neural network. An object detection model was also deployed in the smart speaker; thus, the smart speaker’s camera turns on and calls out the names of detected objects to respond to the user’s command [19]. Most of the past study regarding AI/Computer Vision inspection for smart factories might not be applied to this study directly. They focused on accurate product inspection, including object detection and recognition. Computing resources are not the most important consideration. In general, the more powerful platform the system uses, the better inspection result it obtains. Recently, some studies based on computer vision had been proposed to recognize digits [20,21]. Some deep learning results were only focused on analog meters to perform digit number recognition but not on PLC screens [22], and even a large R-CNN network was used to train the recognition model [23]. It really needs high computing power like GPU to train the object detection and recognition models. These techniques can successfully detect and recognize digits under some special conditions. However, these models are quite expensive and consume high power, such that it makes them almost impossible to run applications on using edge devices for solving various real problems. This background highlights the following two research questions:
- (1)
- How do we build a vision-based data reader in an IoT system by a deep learning network to monitor machine conditions in real time and have a high precision rate?
- (2)
- How do we design a lightweight algorithm and compact model for a vision-based data reader used on edge devices?
The proposed method applied robust image recognition to construct an automatic IoT system to monitor the processing condition and performance of connected machines to improve their productivity and performance. It focused on building a system to perform digit recognition tasks through a deep learning network. A simple camera embedded in Field Programmable Gate Array (FPGA) was attached to monitor the screen on the control panel of machines, and it was pre-programmed to capture images in real-time. The pre-processing step was then performed to have the normalized illumination of the captured image, and a saliency map was generated to reduce the detection time of the required region for recognition. Finally, digit recognition was performed and the recognized digits were transmitted through the IoT system for machine monitoring. The most significant part of the proposed system is the Vision-based Data Reader (VDR) system that uses the designed compact model for training and validation purposes to fit the requirements of cost consideration and real-time monitoring in edge computing. To build the proposed compact model, several different convolution filters are used. Data collected by VDR will transmit to the cloud. Cloud computing is responsible for abnormal event detection and the corresponding decision-making. Experiments on a real plastic cutting board factory showed the improvement in manufacturing products by the proposed system and achieved a high digit recognition accuracy of 97.56%. In addition, the proposed prototype system had low power and low latency advantages.
2. Materials and Methods
2.1. Problem Definition
This research was performed on a real case about production process improvement in a plastic cutting board factory by IoT technologies. The photo of machines in the factory is shown in Figure 1. There are four types of plastic injection molding machines, including horizontal injection molding, vertical injection molding, the robot servo motor is driven, and swing-arm robot. They are responsible for the production of plastic cutting boards of various sizes.
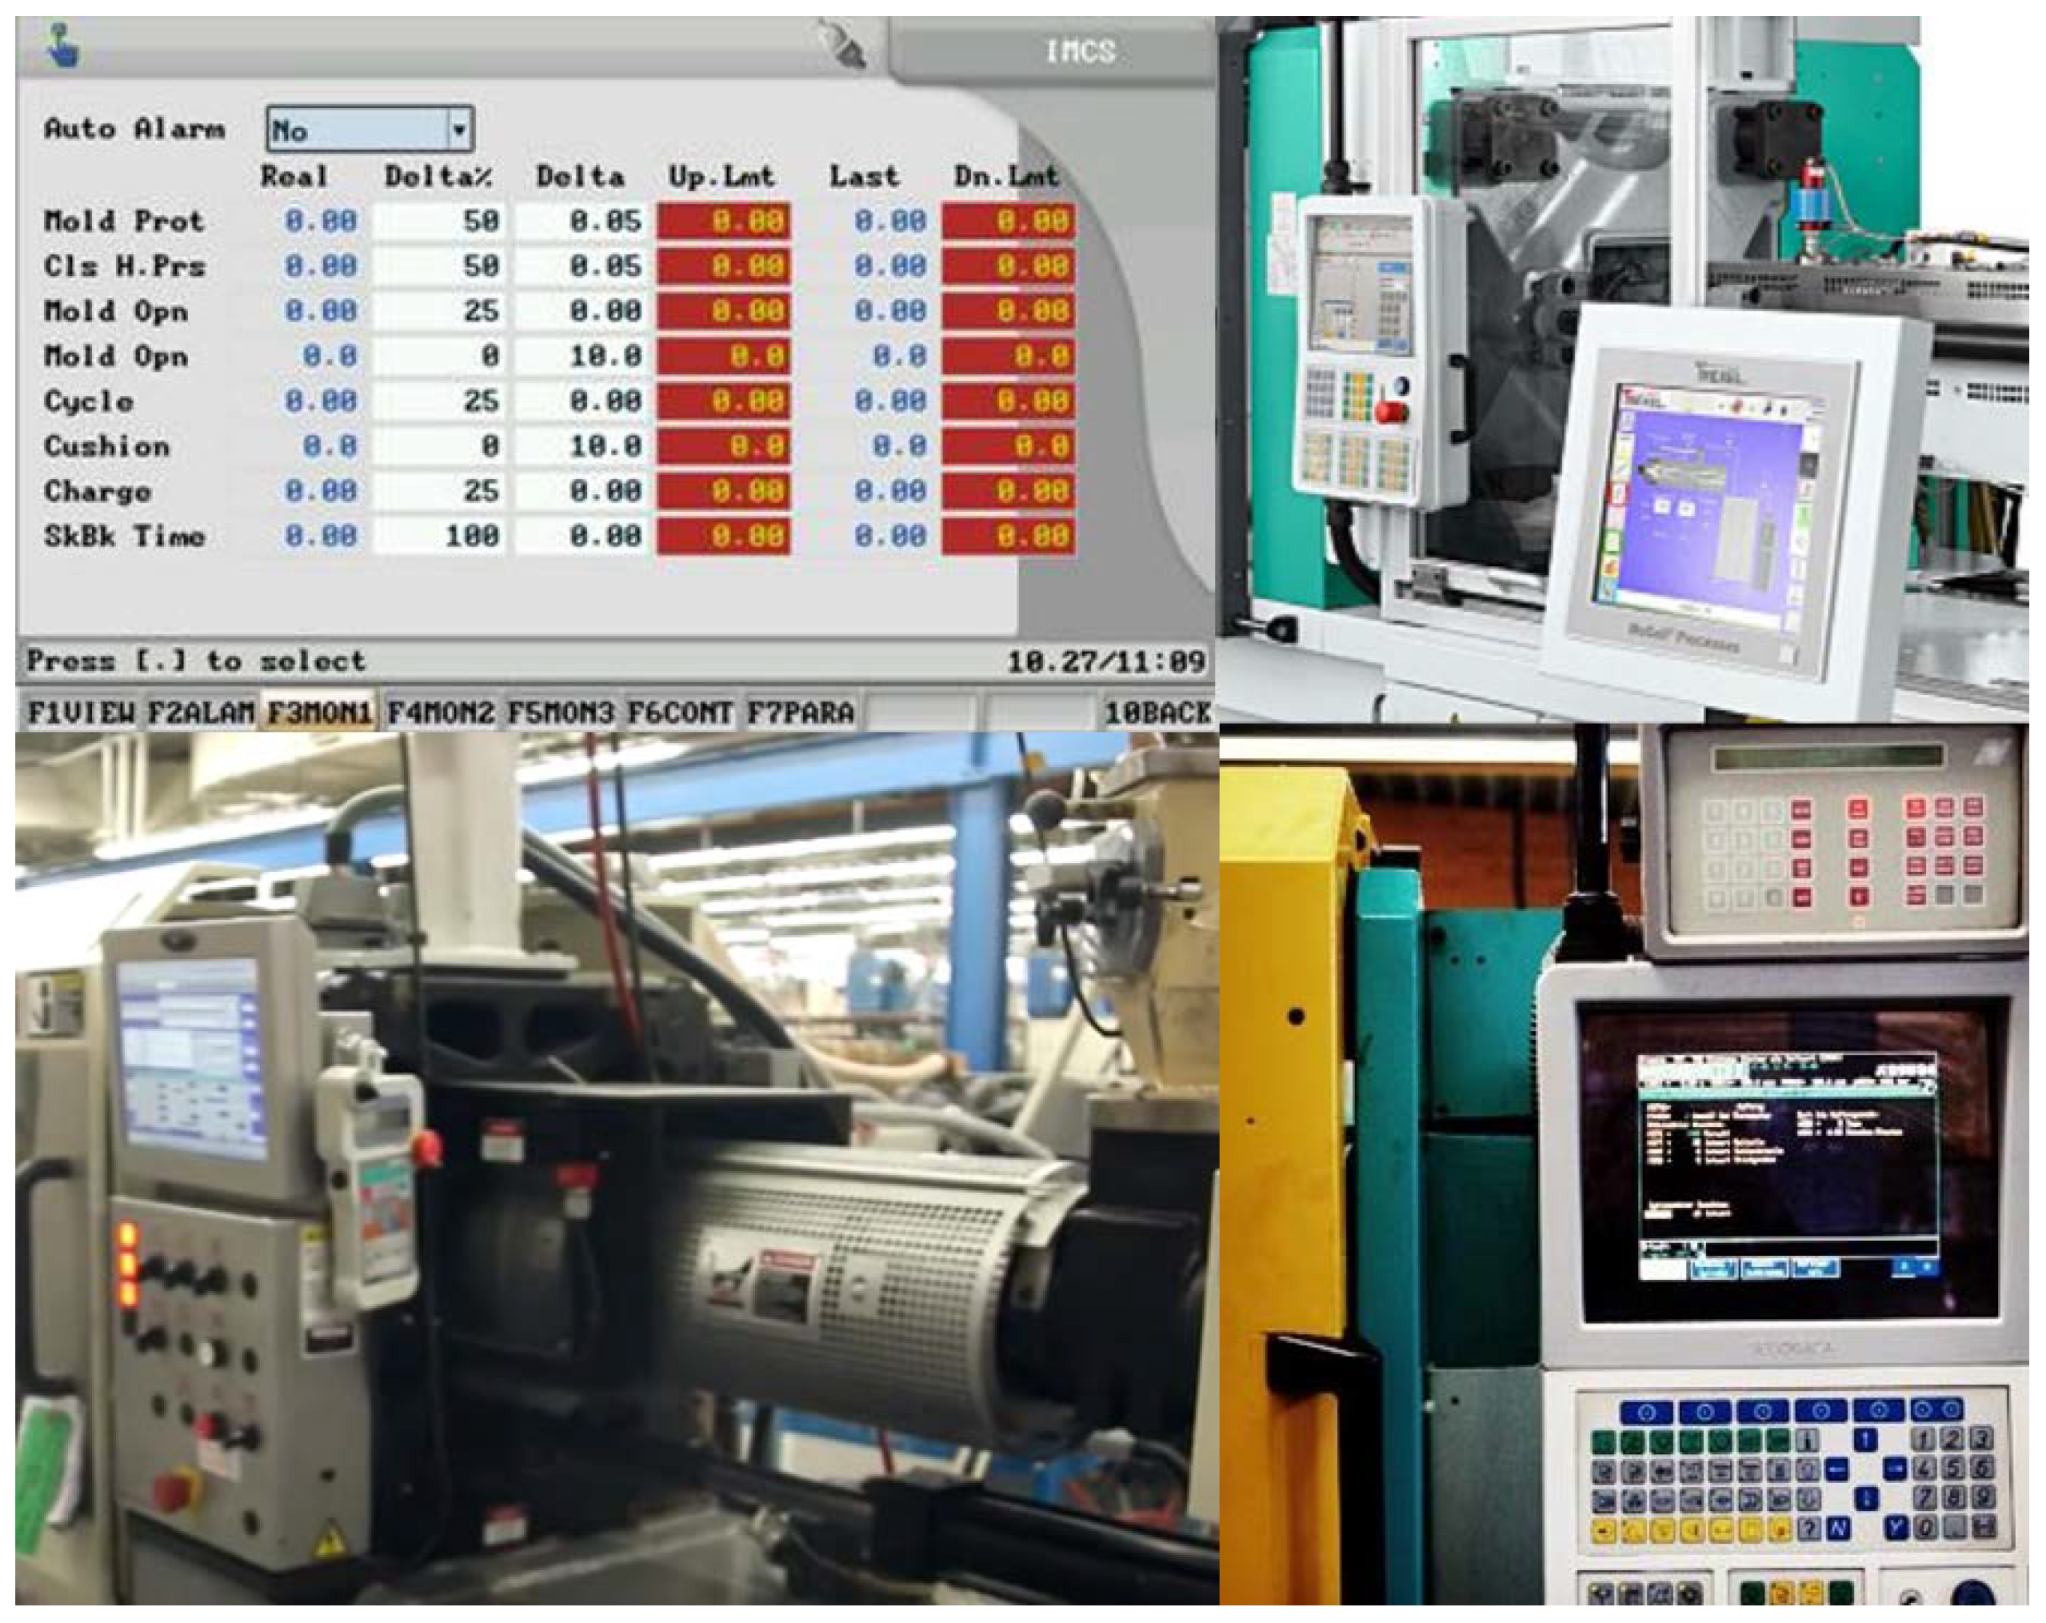
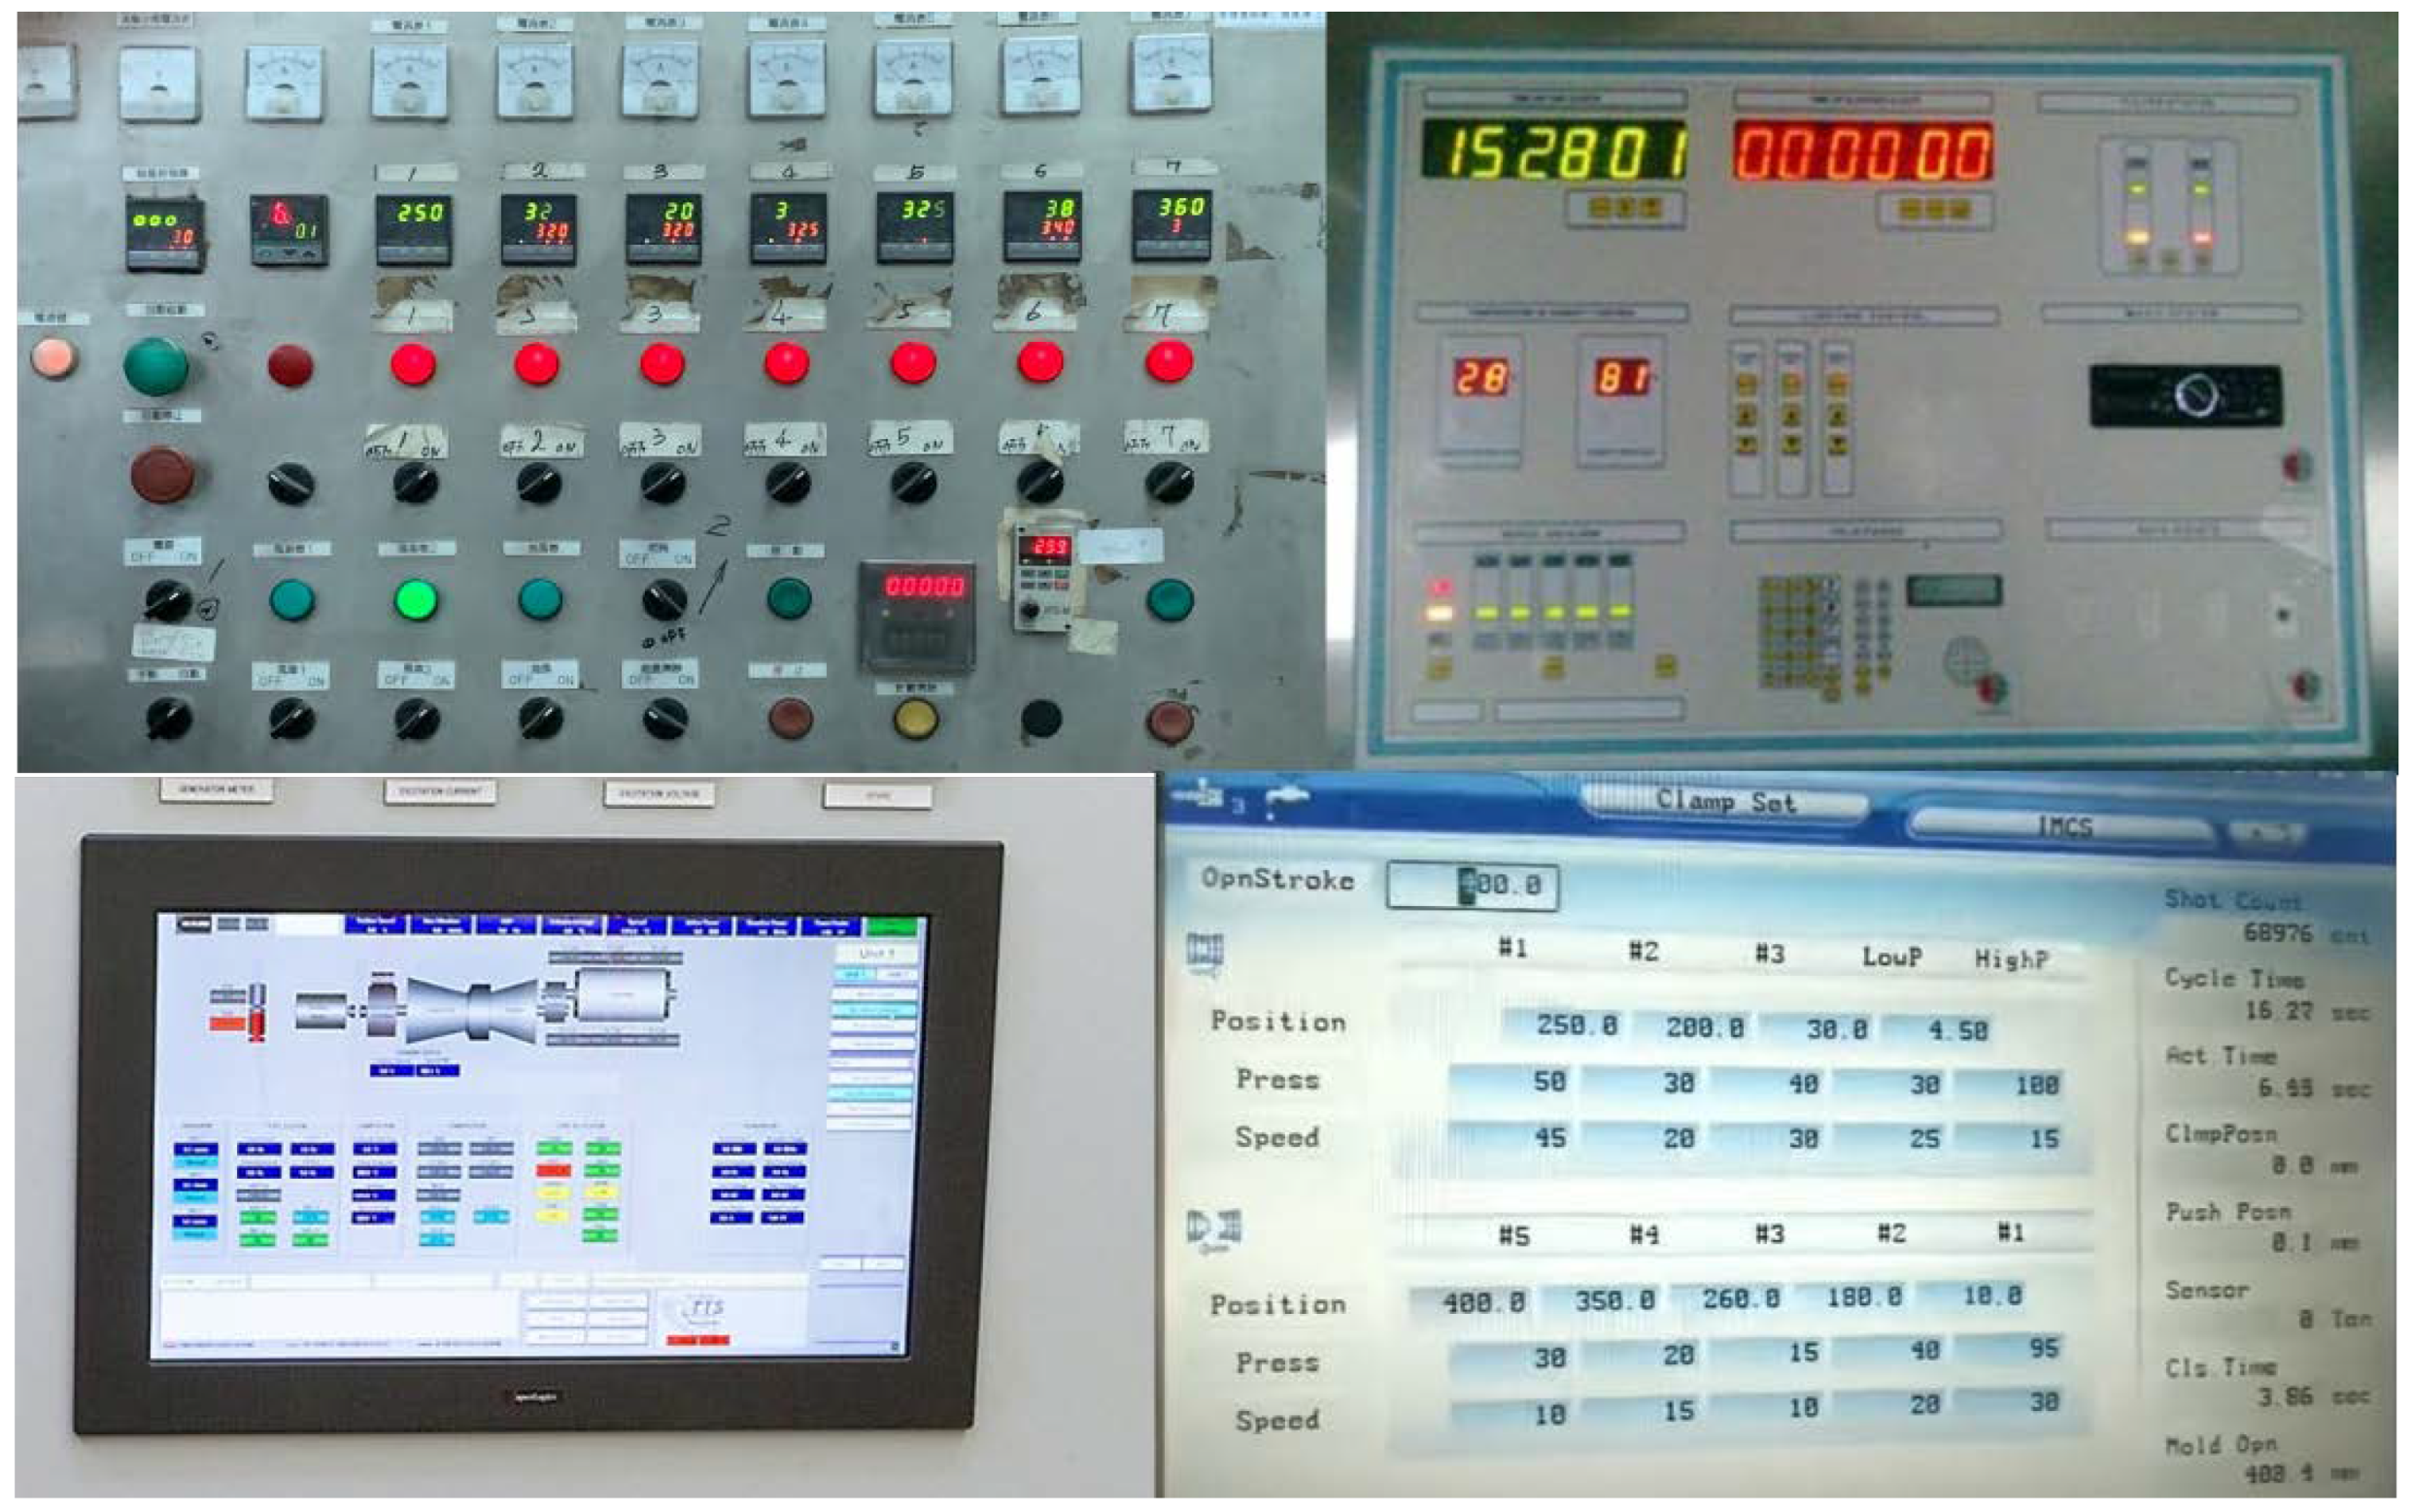
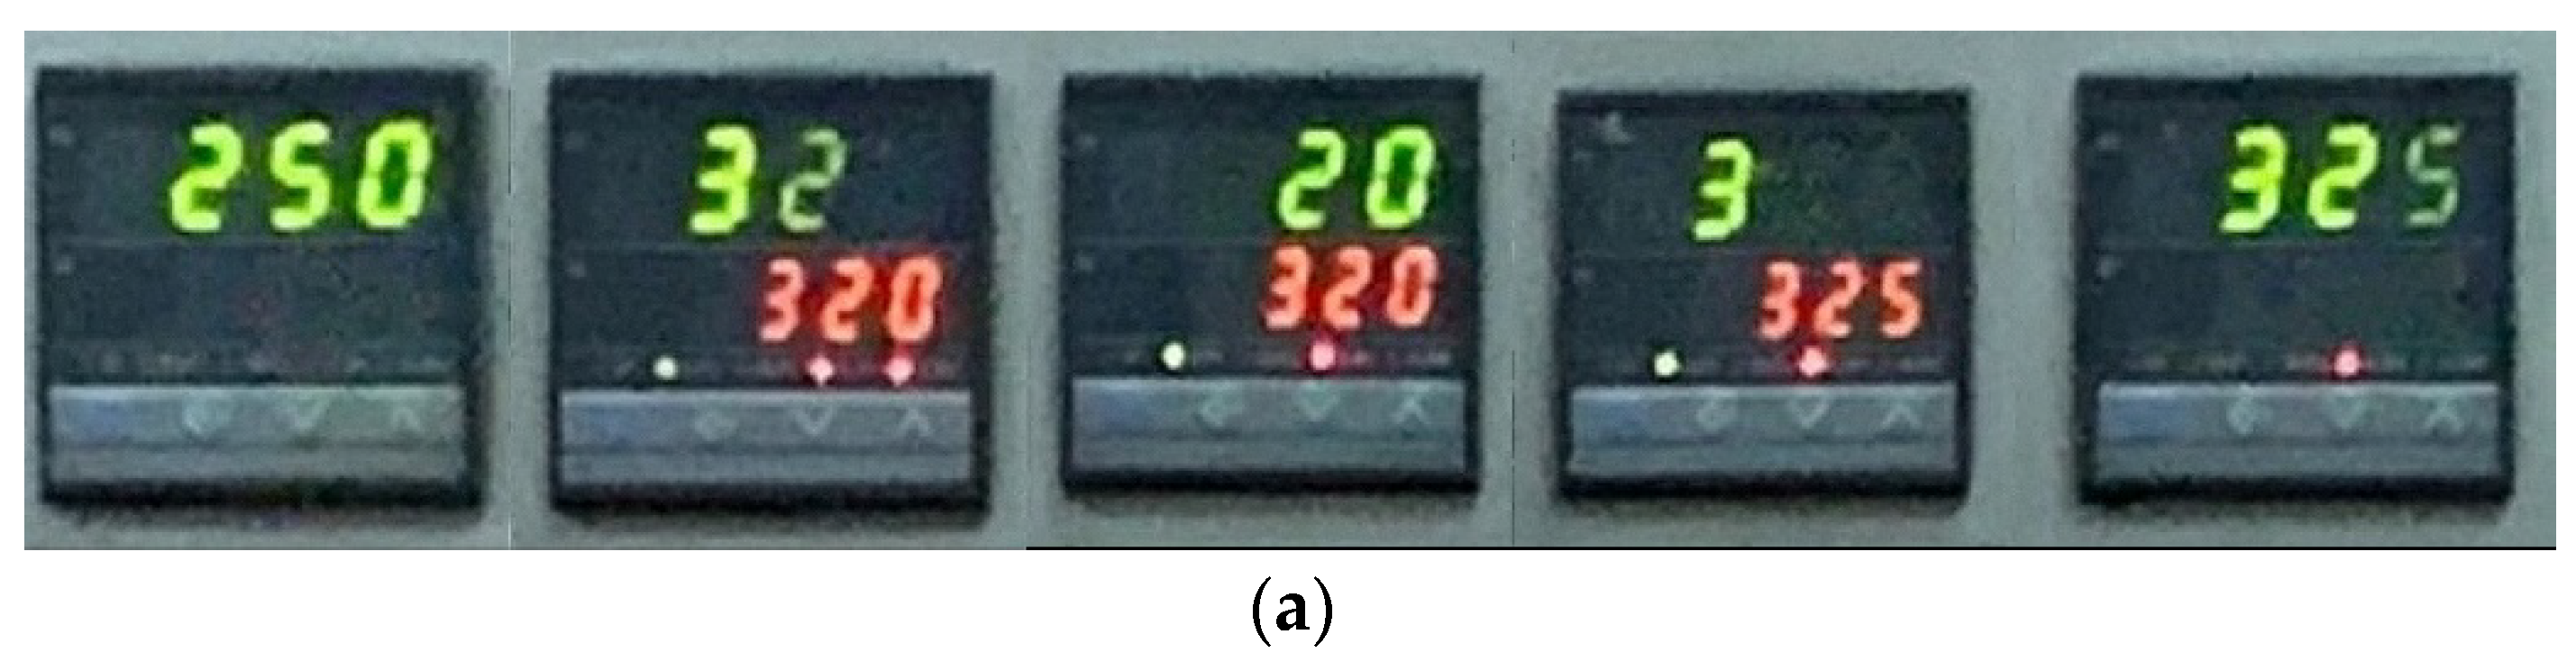
Additionally, each of those machines has at least three versions in the development process of the factory, such that it makes the corresponding Programmable Logic Controller (PLC) panel almost totally different, and the control systems are all stand-alone. Through the study in a small sized plastic injection factory, many control panel or PLC panels of those machines are stand alone and one cannot apply the existing communication interface to them directly. If someone disassembled the machine and installed the communication interface by himself, it would violate the warranty of the machine. This will not be acceptable to the factory. Therefore, it is difficult to monitor those machines using the general IoT technology. It results in great difficulty for the existing IoT deployment to monitor those machines. Under the cost consideration, the proposed lightweight system applied digit recognition to replace direct smart instrumentations that can measure and send the measurement directly to the PLC. Some PLC panels are shown in Figure 2.
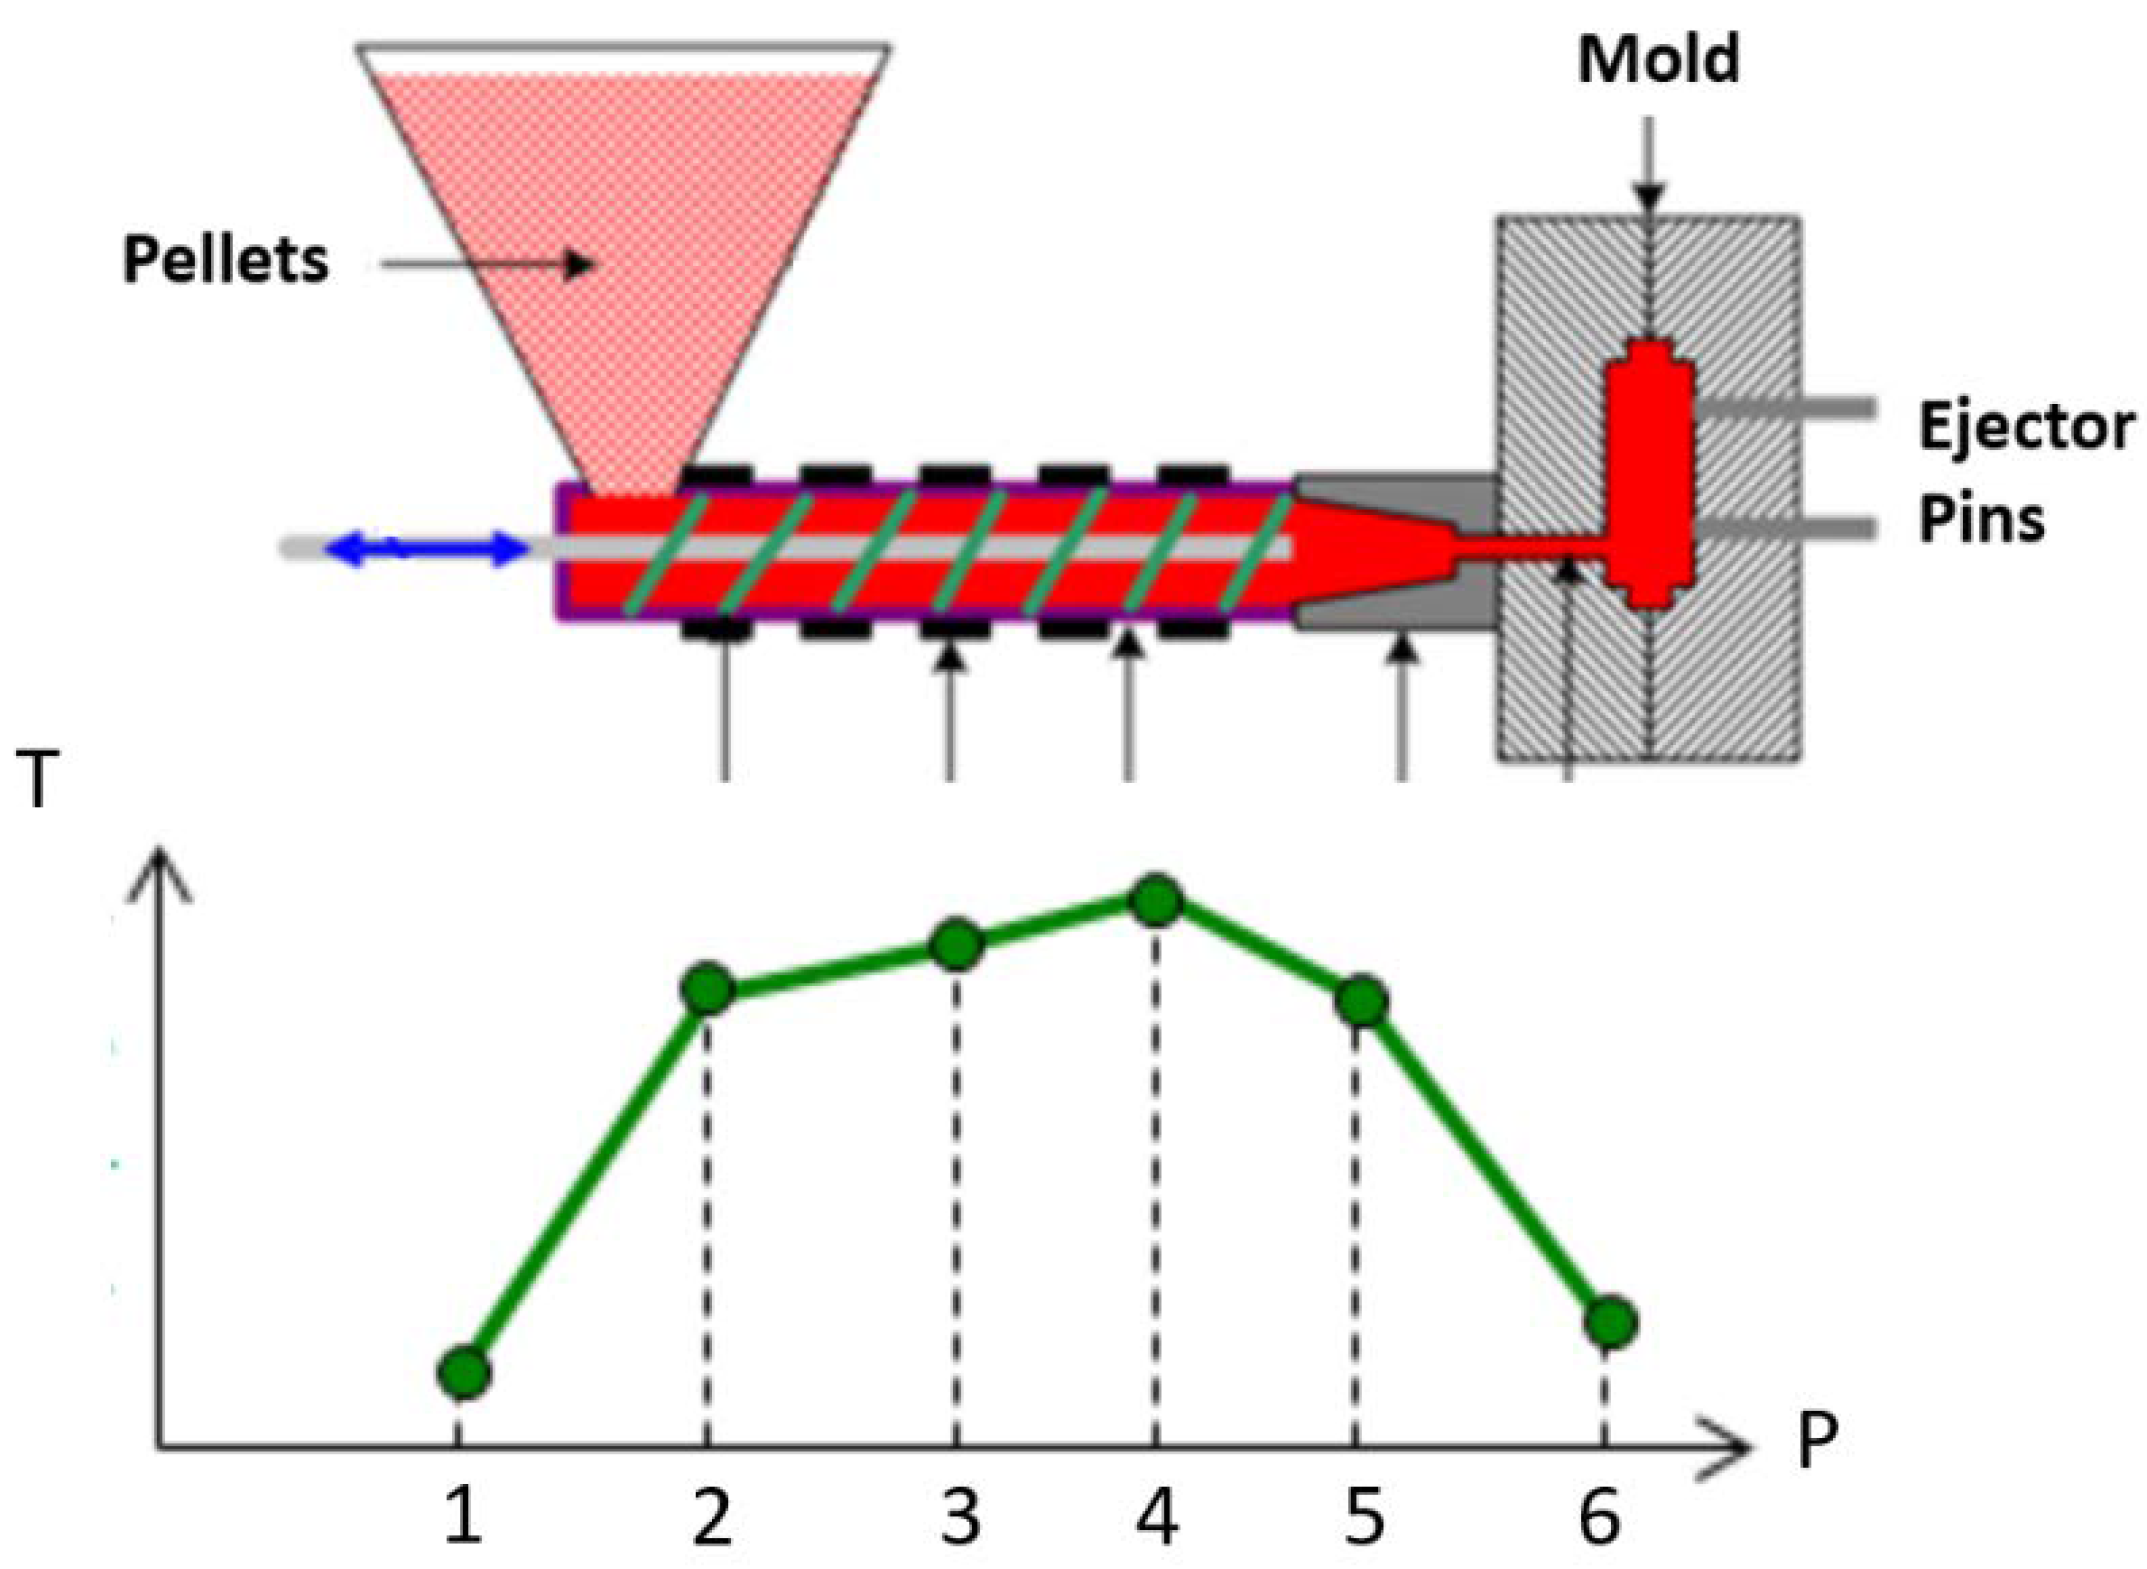
The current major production item of the factory in this study was a plastic cutting board. Figure 3 shows the temperature mapping picture corresponding to the production process. It includes six steps: (1) pellet input, (2) front-end processing, (3) mid-stage processing, (4) back-end processing, (5) nozzle injecting, and (6) molding. The line segments represent the ideal temperature setting at a different step. Melting plastic materials at high temperatures and injecting them into the mold is the basic process for producing a plastic cutting board. Processing time and temperature are important factors for production performance. The flow rate of the plastic material into the machine can be adjusted directly by the PLC parameters setting but temperature control depends on the water-based cooling system which can only be adjusted manually by experienced operators. If the temperature is too high, PLC gives the alarm and stops the working process to prevent faulty products. The operator then increases the cooling water and waits for a suitable temperature to restart the process. The y-axis is just a concept showing the difference of temperature among different steps of the production process. But the exact temperature will be changed for different products such that there is no point label in the y-axis.
The parameter setting on PLC of plastic injection generally depends on five main conditions: temperature, pressure, speed, time, and measurement. Each of them shows the current condition of the machine by numbers on the monitor screen of the control panel. According to digit detection and recognition, the current parameters can be obtained from images of the screen, such that the IoT system can control the entire process of production automatically. For example, if the temperature of the mold is too high, it may produce defective products. At this moment, the system should try to cool down the mold immediately. The IoT system may decrease the temperature by increasing the velocity of cooling water in the system.
2.2. IoT
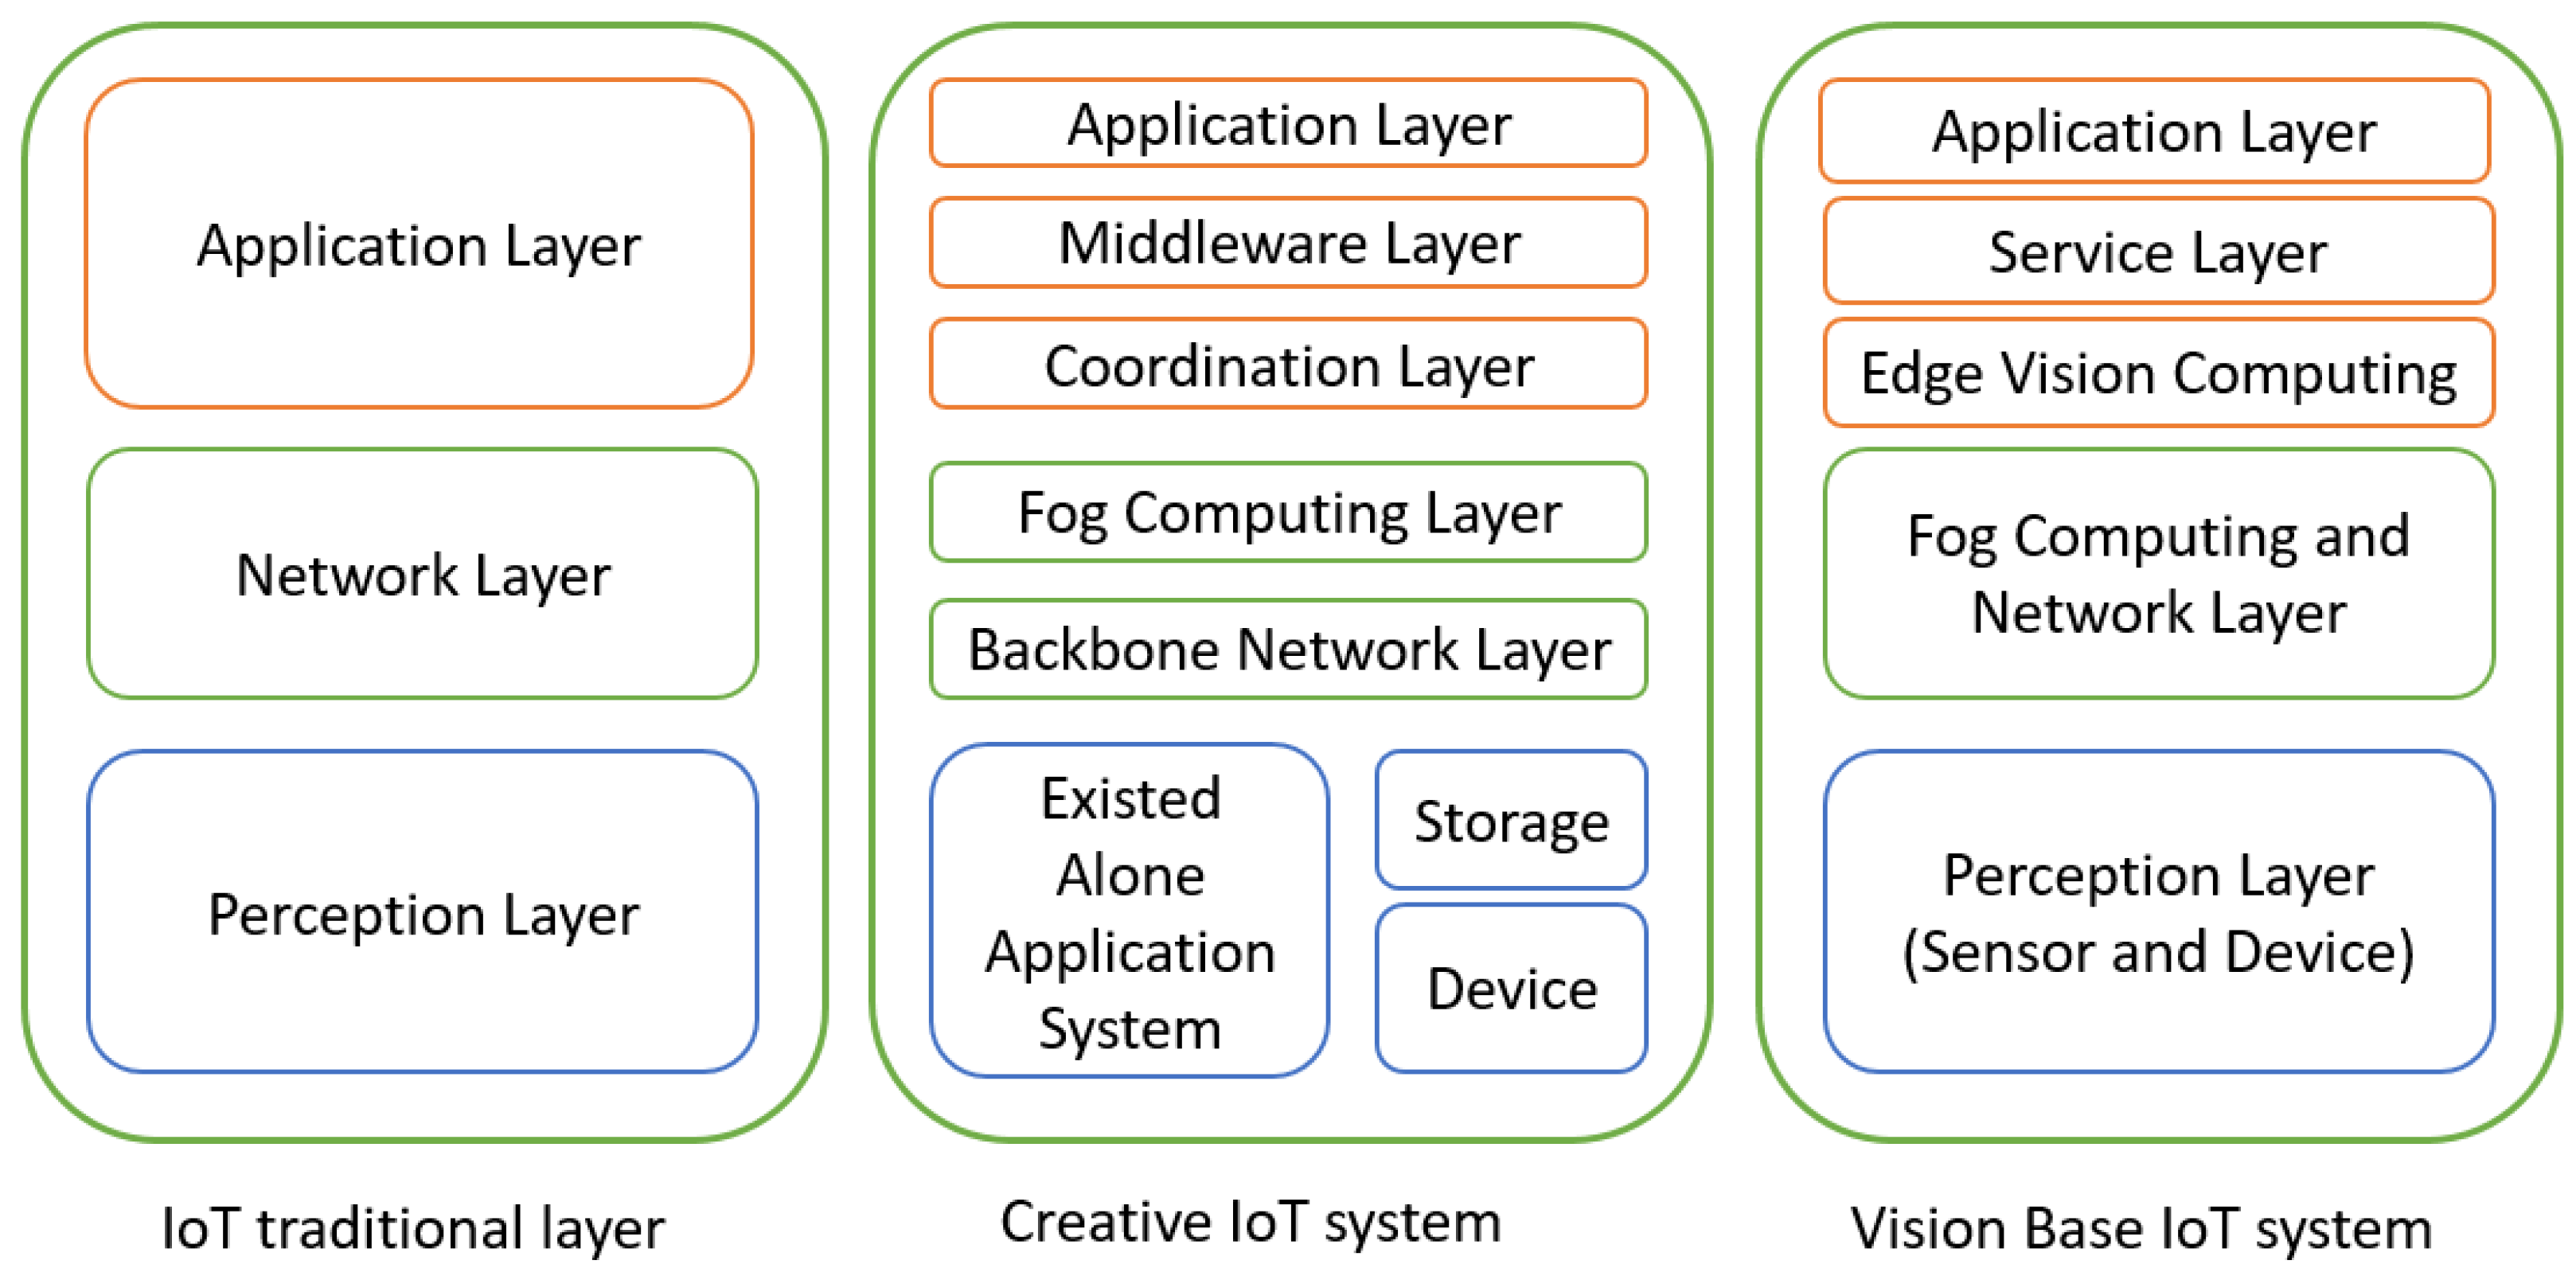
A general IoT system includes a basic three-layer architecture, sensing layer, network layer, and application layer. The sensing layer includes many kinds of different sensing components, such as cameras, for a vision-based approach. For the network and application layers, devices are independent individuals integrated with the management platform. Many devices communicate with each other in the layers and this results in valuable feedback between them, which is useful for further analysis [24]. Figure 4 shows the proposed three-layer architecture. Therefore, IoT applications have enriched our daily lives in healthcare, smart cities, agriculture, etc. The collection and analysis of real data from IoT can help users have some unobserved information in our environment. Since there are a large number of continuous data generated from the IoT devices, this will result in the congestion of the network and the overloading of the server. The system will have problems of delayed communication and poor performance [25].
Based on the IoT structure, many kinds of sensing components were designed in the sensing layer. For example, this study focused on online cameras to monitor machines. This structure is used to receive data from the control panel of the machine. In general, cameras are embedded in Field Programmable Gate Array (FPGA) for further computation and network communication. The communication between devices for different applications rely on the network layer to make the data transmission possible in the IoT based on the existing network architecture, but more flexibly and efficiently. The immediate data is responsible for transmitting information about event detection results from end devices to the server through the network in the IoT architecture. It will reach the goal of real-time analysis and process.
2.3. Deep Learning
Deep learning has indeed made significant progress in many applications including computer vision, speech recognition, and the IoT environment. The development of deep learning has also tremendously influenced the field of smart factories based on computer vision and can be deployed on IoT devices [26]. However, because of the enormous computational complexity of deep learning, deploying such classification models on constrained devices has emerged as a critical bottleneck at the IoT edges [27]. Furthermore, efficient features learned from a deep learning model are usually fit for a particular training dataset. Therefore, if the dataset is not well constructed, the model would not perform well for unknown images. Based on prior studies, the performance for our task based on deep learning exhibited unsatisfactory performance under severe illumination variations. The main reason is that the deep learning feature was trained by the captured images of the monitoring screens of machines in the factory under uneven lighting conditions. For example, the light in the factory is a non-uniform illumination and there may be both underexposed and overexposed areas in the captured image. The traditional deep learning methods designed some constraints to solve it and relied heavily on paired training image data and prior knowledge [28].
Achieving satisfactory performance in computer vision tasks requires high-resolution images such that deep learning-based computer vision processing tasks also depend on image resolution. This resolution of the image is particularly important for IoT applications where we need object detection and classification at a distance. A hybrid approach was proposed to combine deep learning with hand-crafted feature extractors and got good performance. The generated hand-crafted features were used as the input of the training model to reduce the difference between features from humans and the deep learning network. Based on the idea, Zeng et al. proposed the new feature loss to implement a facial-expression recognizing IoT application [29].
2.4. Digit Recognition
Digital digits can be used to represent information or the condition of electricity, water, gas, etc., in factories, houses, and other places. Digital meters or panels with digit numbers are installed to monitor the real-time conditions. Generally, the digit number reading is obtained by operators. The operator watches the panels and writes down the digit number. Unfortunately, reading digits from the panels of meters and storing information by operators are time-consuming tasks and have very high chances of resulting in privacy, integrity, and authentication problems. Automatic reading by IoT supported with computer vision technology can be implemented with a camera attached to capture images of the screen of the control panels and a computation model can be used to detect text in images. It had been addressed with three main steps to accomplish the goal. It included screen detection, digit area segmentation, and digit number recognition [30]. Screen detection is a significant task to crop images of the required region of interest (ROI) from the panel. Ebrahimzadeh and Jampour [31] proposed an appearance feature-based method to perform handwritten digit recognition. The appearance features were generated by the histogram of oriented gradients (HOGs). Karanje et al. proposed a maximally stable extremal region (MSER) approach using blob detection to extract character candidates from a natural scene image with text [32]. Afterward, the HOG feature was also used to perform Chinese word detection in an image by support vector machines (SVMs) [33].
Recently, some studies had used conventional datasets of digit numbers to train the deep learning algorithms for text recognition tasks [20,21]. Some previous research results were only focused on analog meters. YOLO v3 was used to detect the ROI, and a deep learning model based on the VGG network performed the digit number recognition [22]. Another deep learning model based on faster R-CNN is used to extract and recognize digits [23]. Most of the previous results were only focused on analog meters but not on a PLC screen. For R-CNN, it really needs high computing power like GPU to train the object detection model. These techniques can successfully detect and recognize digits under some special cases. However, these models are quite expensive and consume high power, such that it makes them almost impossible to run applications on using edge devices for solving various real problems. For example, dynamic training has to be performed on edge devices for solving various real problems in factories. The proposed approach focused on an FPGA development board by Intel. DE10 Lite was used as the hardware platform of the edge devices for training and testing processes.
3. Results
3.1. System Architecture
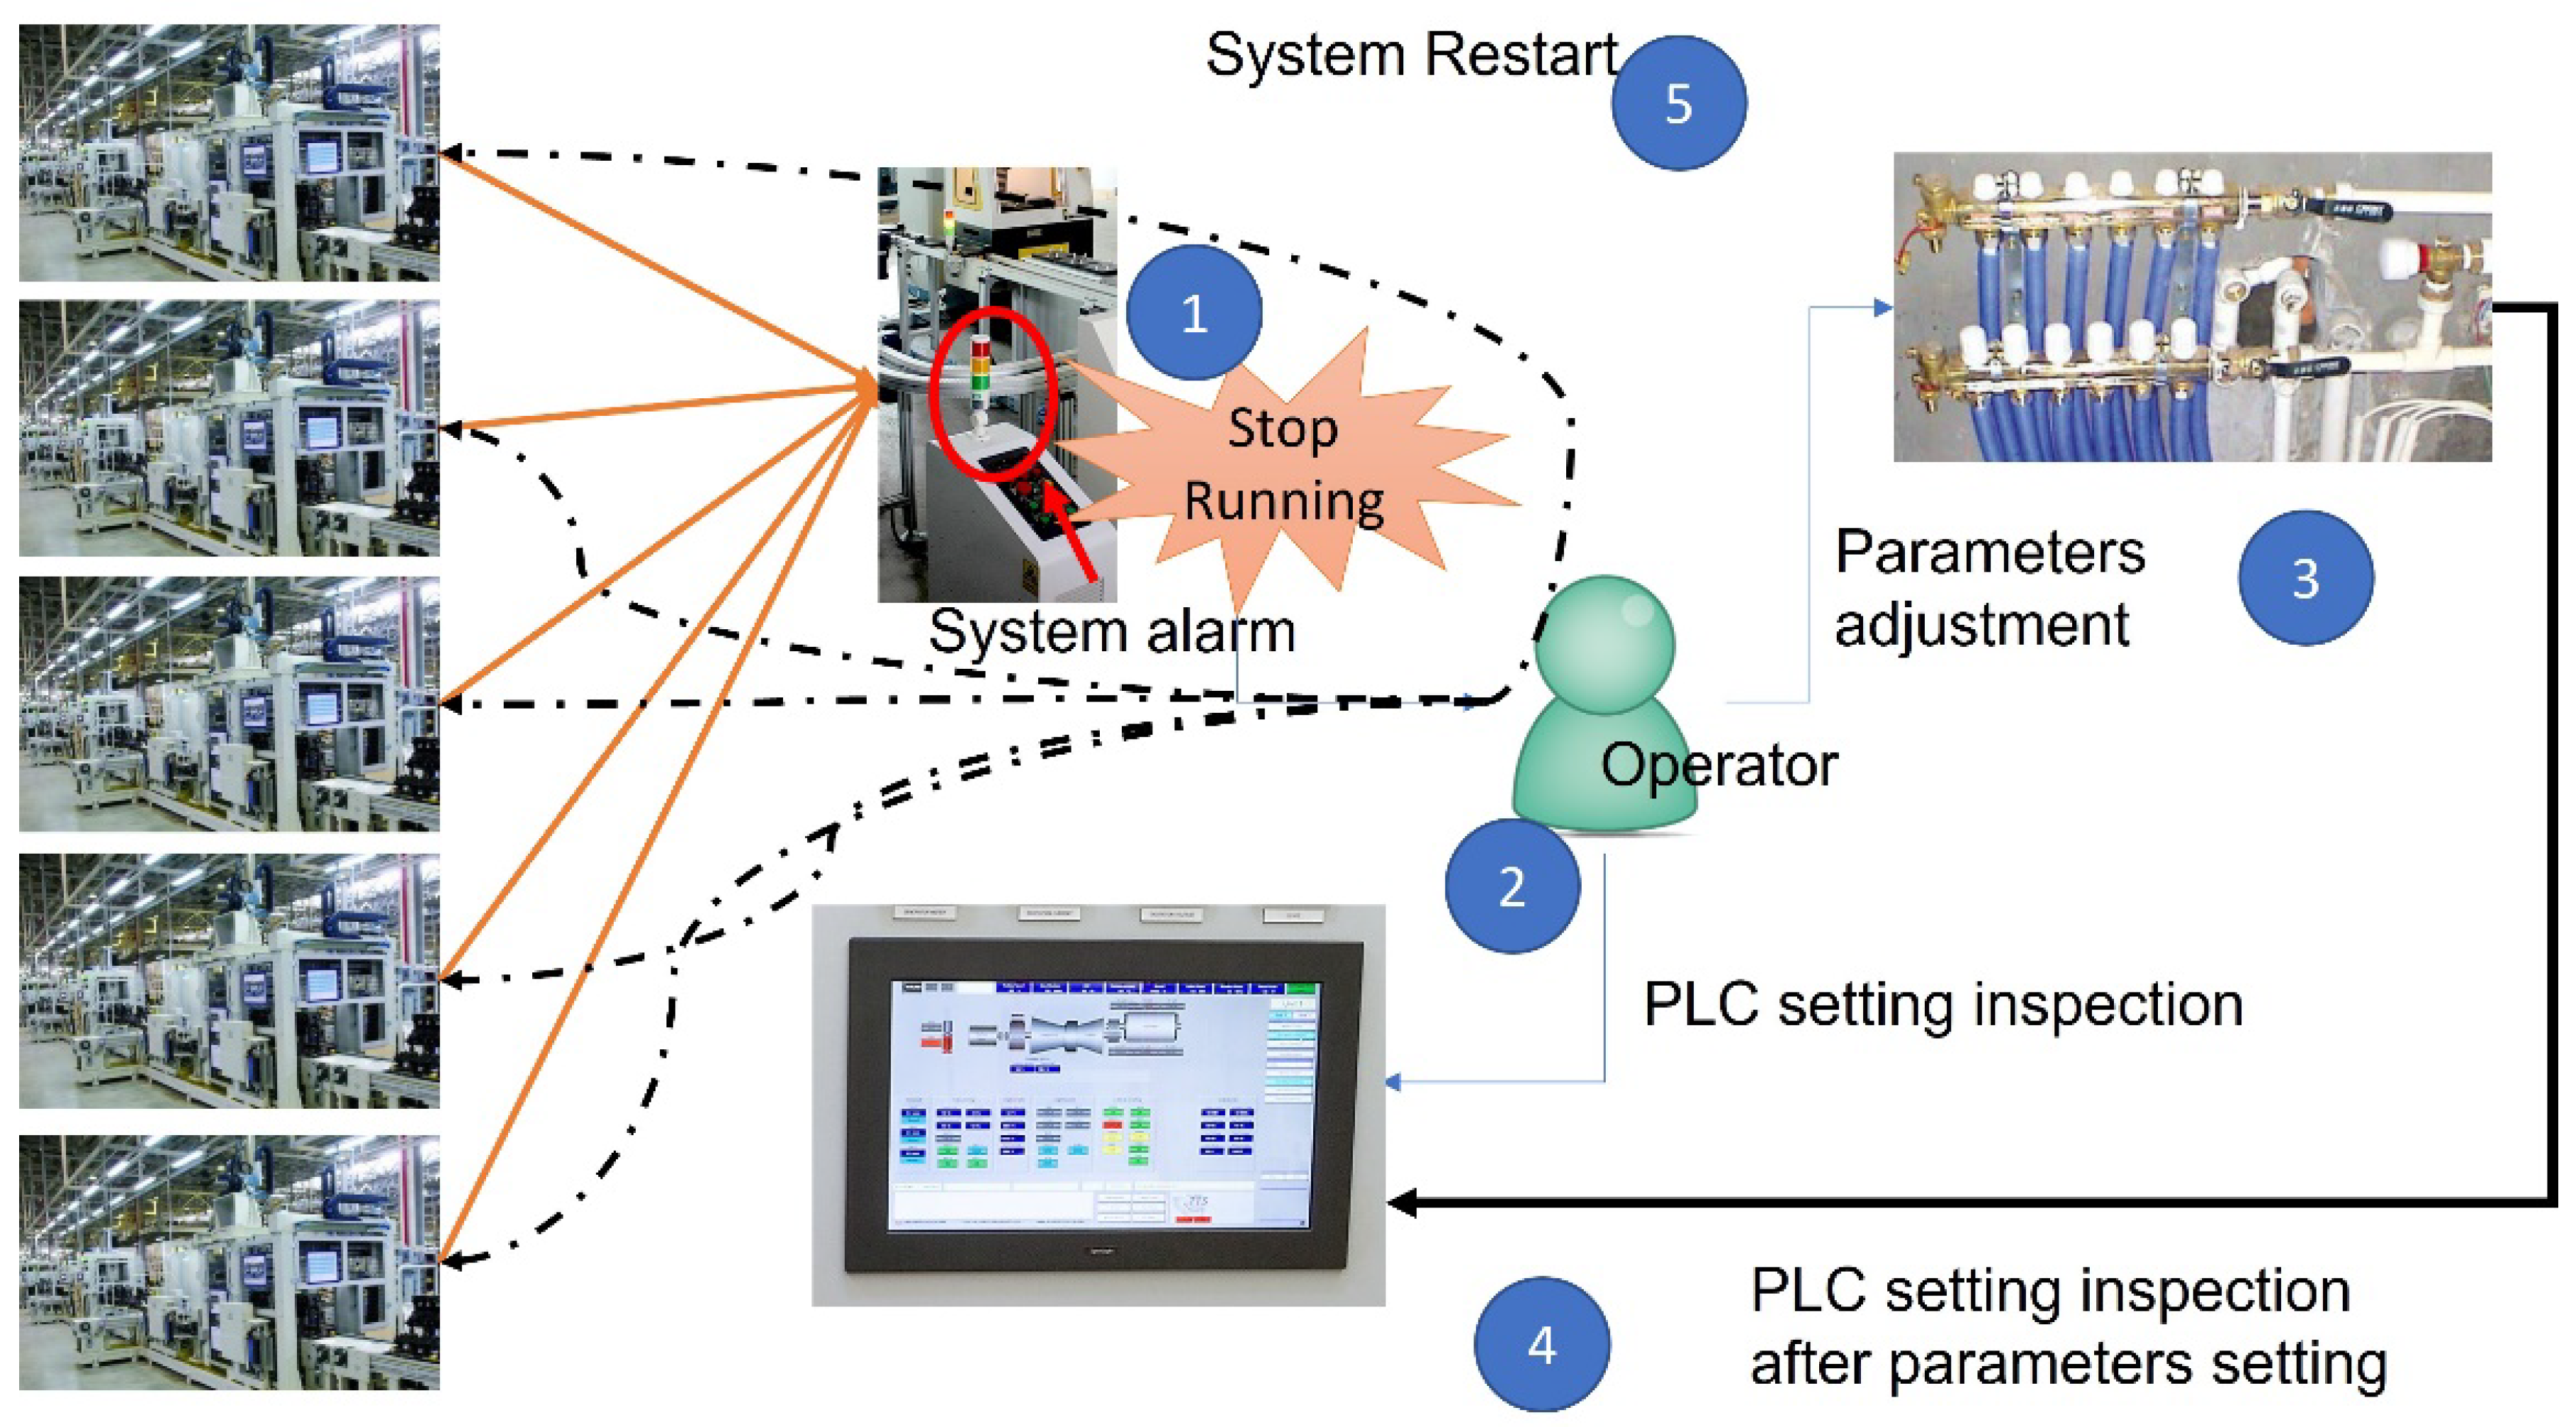
Making great products and measuring line or the entire factory’s productivity depend on machine condition monitoring. The conventional monitoring and adjusting process was done by an experienced operator of a production line for small and medium-sized factories. Figure 5 shows the working process of condition monitoring by operators. In Step 1, if the PLC detects the machine in an abnormal condition, it stops the production process and alerts the operator to help. The operator performs PLC setting inspection to find out the corresponding problems in Step 2. The operator then adjusts the parameters and PLC does the inspection again in Step 3 and Step 4, respectively. At last, the production process is restarted after troubleshooting in Step 5. Actually, there are no caveats from the PLC of the production machine in the study case. In the conventional monitoring and adjusting process, machine downtime will cause delays in manufacturing and waste raw materials in pipes if an abnormal event occurs. Therefore, it needs an automatic system to read the corresponding data from the PLC panel and to make a decision through the IoT architecture to control the production process.
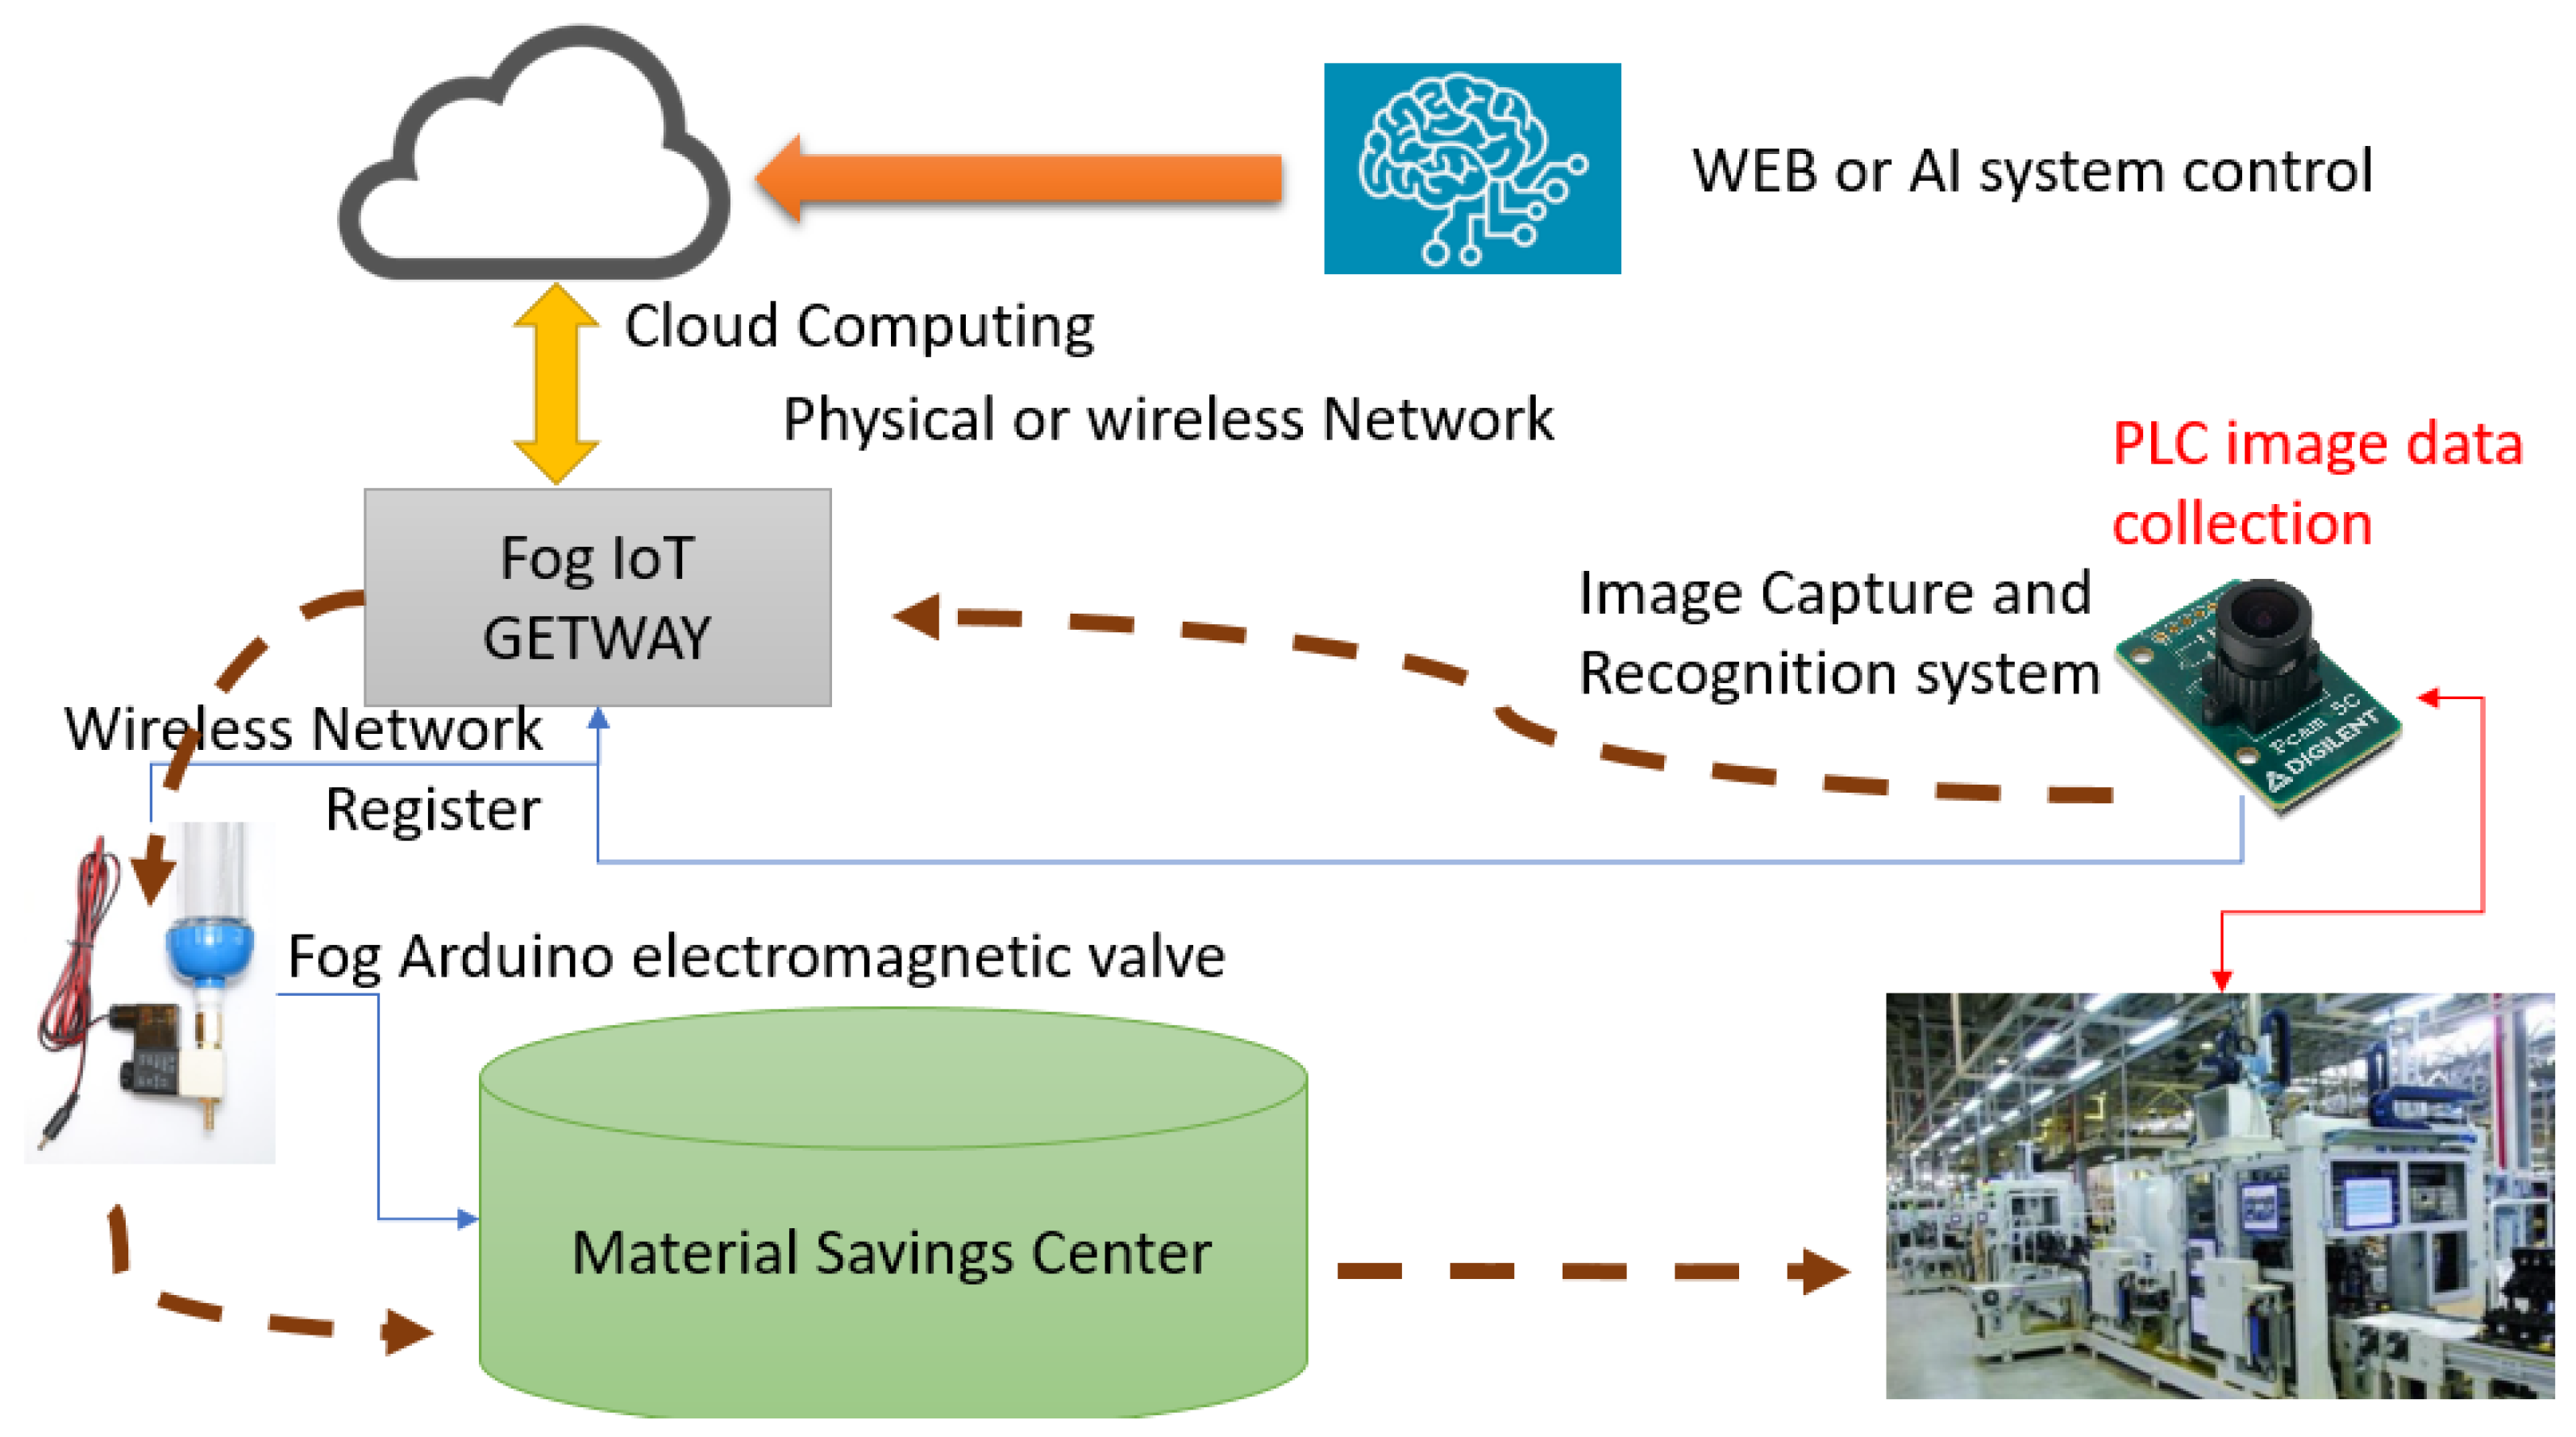
This paper proposed an IoT system architecture to solve the above situation for machine condition monitoring. Figure 6 shows the system architecture about the relations of modules including image detection and a recognition module for a vision-based data reader, a fog Arduino electromagnetic control module for controlling the plastic material input and water-cooling system, and a cloud computing module.
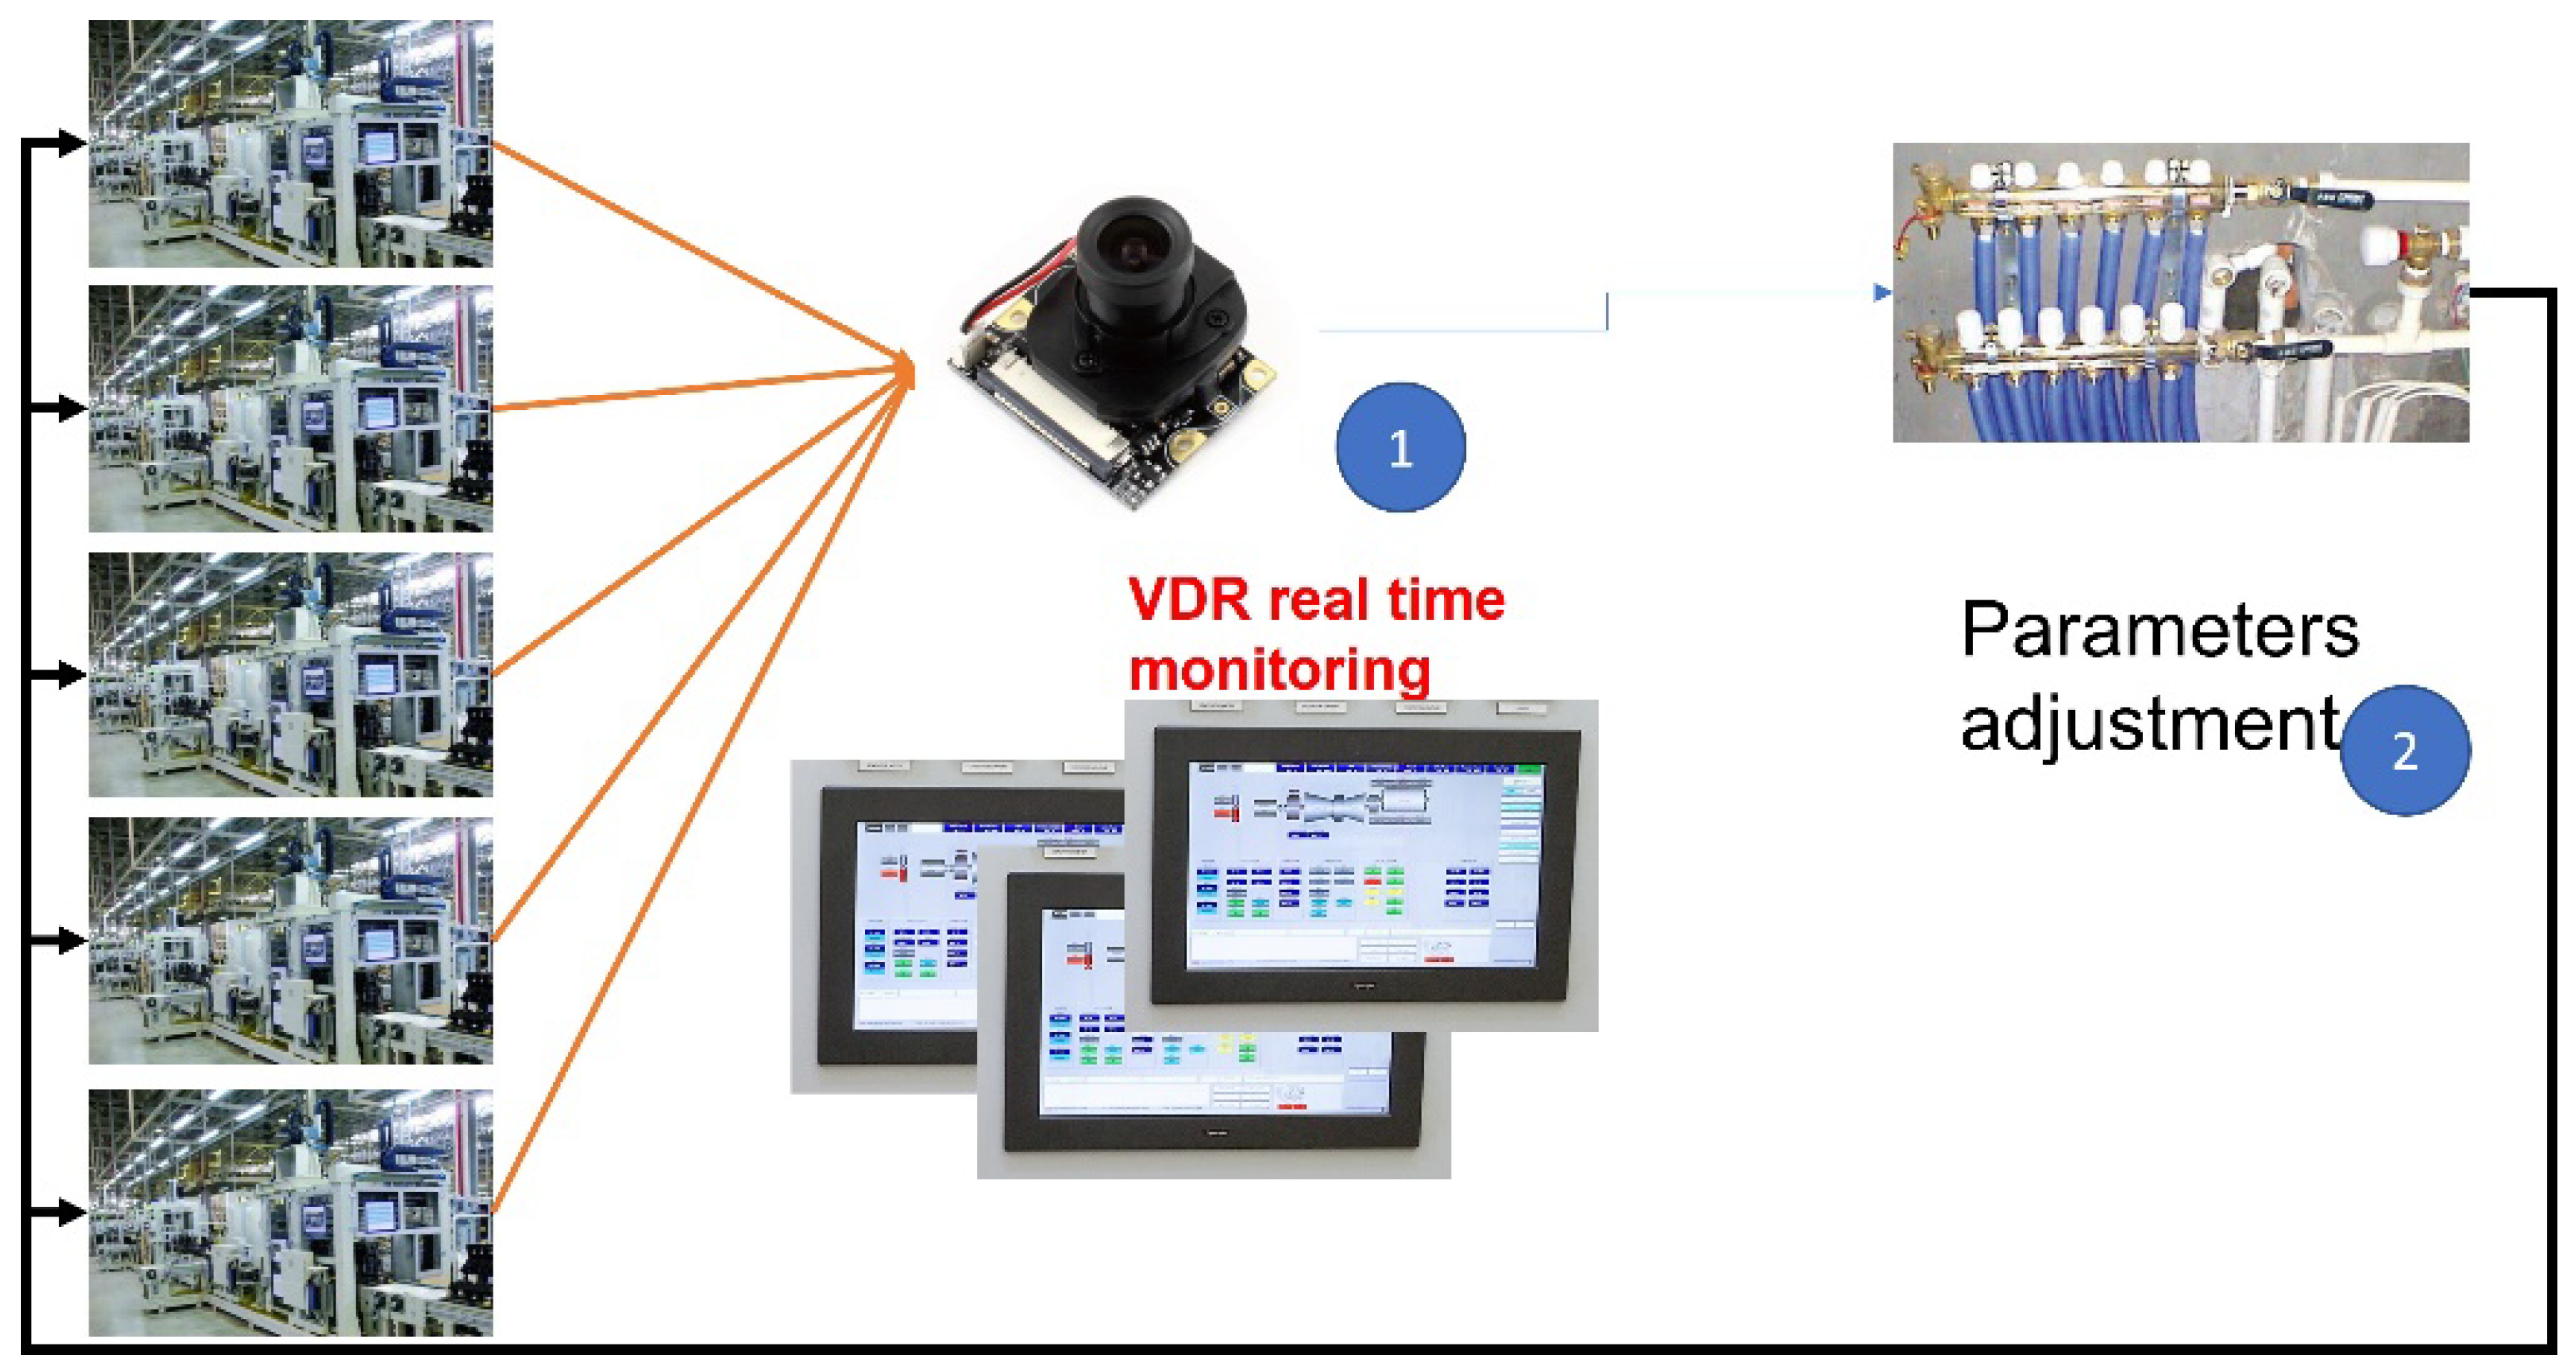
This study focused on performing digit recognition tasks in the end device and transmitting extracted numbers of PLC parameters through an IoT system to further manufacturing management. A simple camera embedded in FPGA was attached to monitor the screen on the control panel of machines at all times, not just when the system alarm is activated. The FPGA end device is pre-programmed to capture an image in real-time. The pre-processing step was then performed to have the normalized illumination of the captured image. A saliency map was generated to detect the required region for recognition. Finally, digit recognition was performed and the recognized digits were sent to the IoT system. The proposed VDR system designed a compact model for the training and recognition process to fit the requirement of cost consideration and real-time monitoring in edge computing. The proposed automatic VDR system for condition monitoring is shown in Figure 7. In Step 1 the real-time VDR monitors the PLC screen constantly to get the production data. If the data is not in the normal range, the system will adjust the corresponding parameters through IoT devices. Based on the results of VDR, machine parameters can be set remotely by a Switchbot. It will be the button pusher instead of the original operator. The diagram of the data flow of the VDR system is shown in Figure 8.
3.2. Illumination Normalization
For the proposed VDR system, image preprocessing on the captured images should avoid over and under enhancement with color and contrast distortions, since the factory is usually not well-lit. Furthermore, the gray value in the image is very sensitive to the variation of lighting conditions. Unfortunately, images may be captured from the same scene under uneven illuminations, especially for the proposed recognition tasks of the VDR system. Even for the human visual system, it is quite difficult to recognize the same object from images that are captured under considerably different illuminations [34]. For the same reason, the proposed VDR system will also be difficult to have good detection and classification results if the training and testing datasets are taken in those situations. For example, images might be taken from different factories.
The illumination normalization process is used to reduce the lighting effect of images that are captured under uneven lighting conditions. We generated a basic model for a standard lighting condition that will be useful to adjust the observed images that are captured under different illuminations to a uniform one. For the proposed VDR system, a histogram-based statistical model M is generated by extracting the features from training images S under standard lighting conditions. At the testing stage, each input image T will be adjusted by the trained statistical model M to be an approximation T′ under standard lighting conditions. Without loss of generality, the intensity histogram of an image is treated as the probability density function. The histogram-based statistical model M is a one-to-one mapping function which is shown in the following Equation (1) [35].
where CS is the empirical Cumulative Distribution Function (CDF) of S and CT is the empirical CDF of input image T. Each pixel in T can be adjusted by using M to normalize the illumination from the original lighting effect. For an input testing image T, the illumination normalization is focused on the ROI RT and the statistical histogram features of the extracted region RT are extracted by the method of [35]. According to model M, the transformed statistical histogram of RT′ will be similar to that for standard lighting conditions. Let RT be the ROI after illumination normalization, then Equation (2) shows how to generate it by Equation (1).
We finally realized the illumination normalization process for each ROI. It was applied to the VDR system before digit detection. It resulted in not only high accuracy for digit region detection but also in low computation time for the training process and recognition task by a deep learning network.
3.3. Saliency Map Extractor
The user interface of the PLC panel has no fixed form for different machines, and there is some uncorrelated information on it which biased the digit region detection and recognition. Figure 9a shows the PLC panel of an old machine with some notes on it. There is also a digit on each note. Figure 9b shows the PLC panel of a new machine with too much information on it. That includes Chinese characters, English characters, and a lot of numbers. It may result in some difficulty in the region detection and recognition process.
From psychology, the saliency of an image means the eye-to-brain connection of a human to quickly focus on the ROI of a scene. Similarly, it can be applied to locate the regions where digits are shown on the PLC screen. Itti et al. [36] proposed a saliency map constructed from the image features by a statistical method to locate the ROI of an image. The computational model for the saliency map took advantage of intensity, color, and orientation features. Afterward, the difference between the center pixel and the surrounding pixels in 3 × 3 neighboring regions was also applied to compute the saliency map [37].
The proposed system was designed in a coarse to fine architecture which not only maintained much information but also increased the speed of the VDR system. The input image was first transformed to a grayscale image for the consideration of low computational end devices. Then, a Gaussian image pyramid based on the transformed grayscale image was constructed. The features in the Gaussian pyramid were generated by a 3 × 3 Gaussian filter applied to the input image. The scaling factor was set by two on each axis. Next, the difference between the center pixel and the surrounding pixels was used to represent the features between coarse and fine scales. Finally, the saliency maps in the Gaussian pyramid were summed up to have the final map.
The proposed digit recognition approach involves the extraction of semantically important regions from input image I ∊ R with the size of W × H, where W (H) represents the width (height) of an image, respectively. The saliency map extraction is described by SI ∊ R represents a saliency map for image I, and S(·) is a saliency map detection function that extracts the saliency map. It is represented as SI = S(I). Since the saliency map can represent the semantically important regions of an image, the saliency map would be a mask to get the region of digit numbers from the PLC panel in the digit detection process.
3.4. Digit Region Segmentation
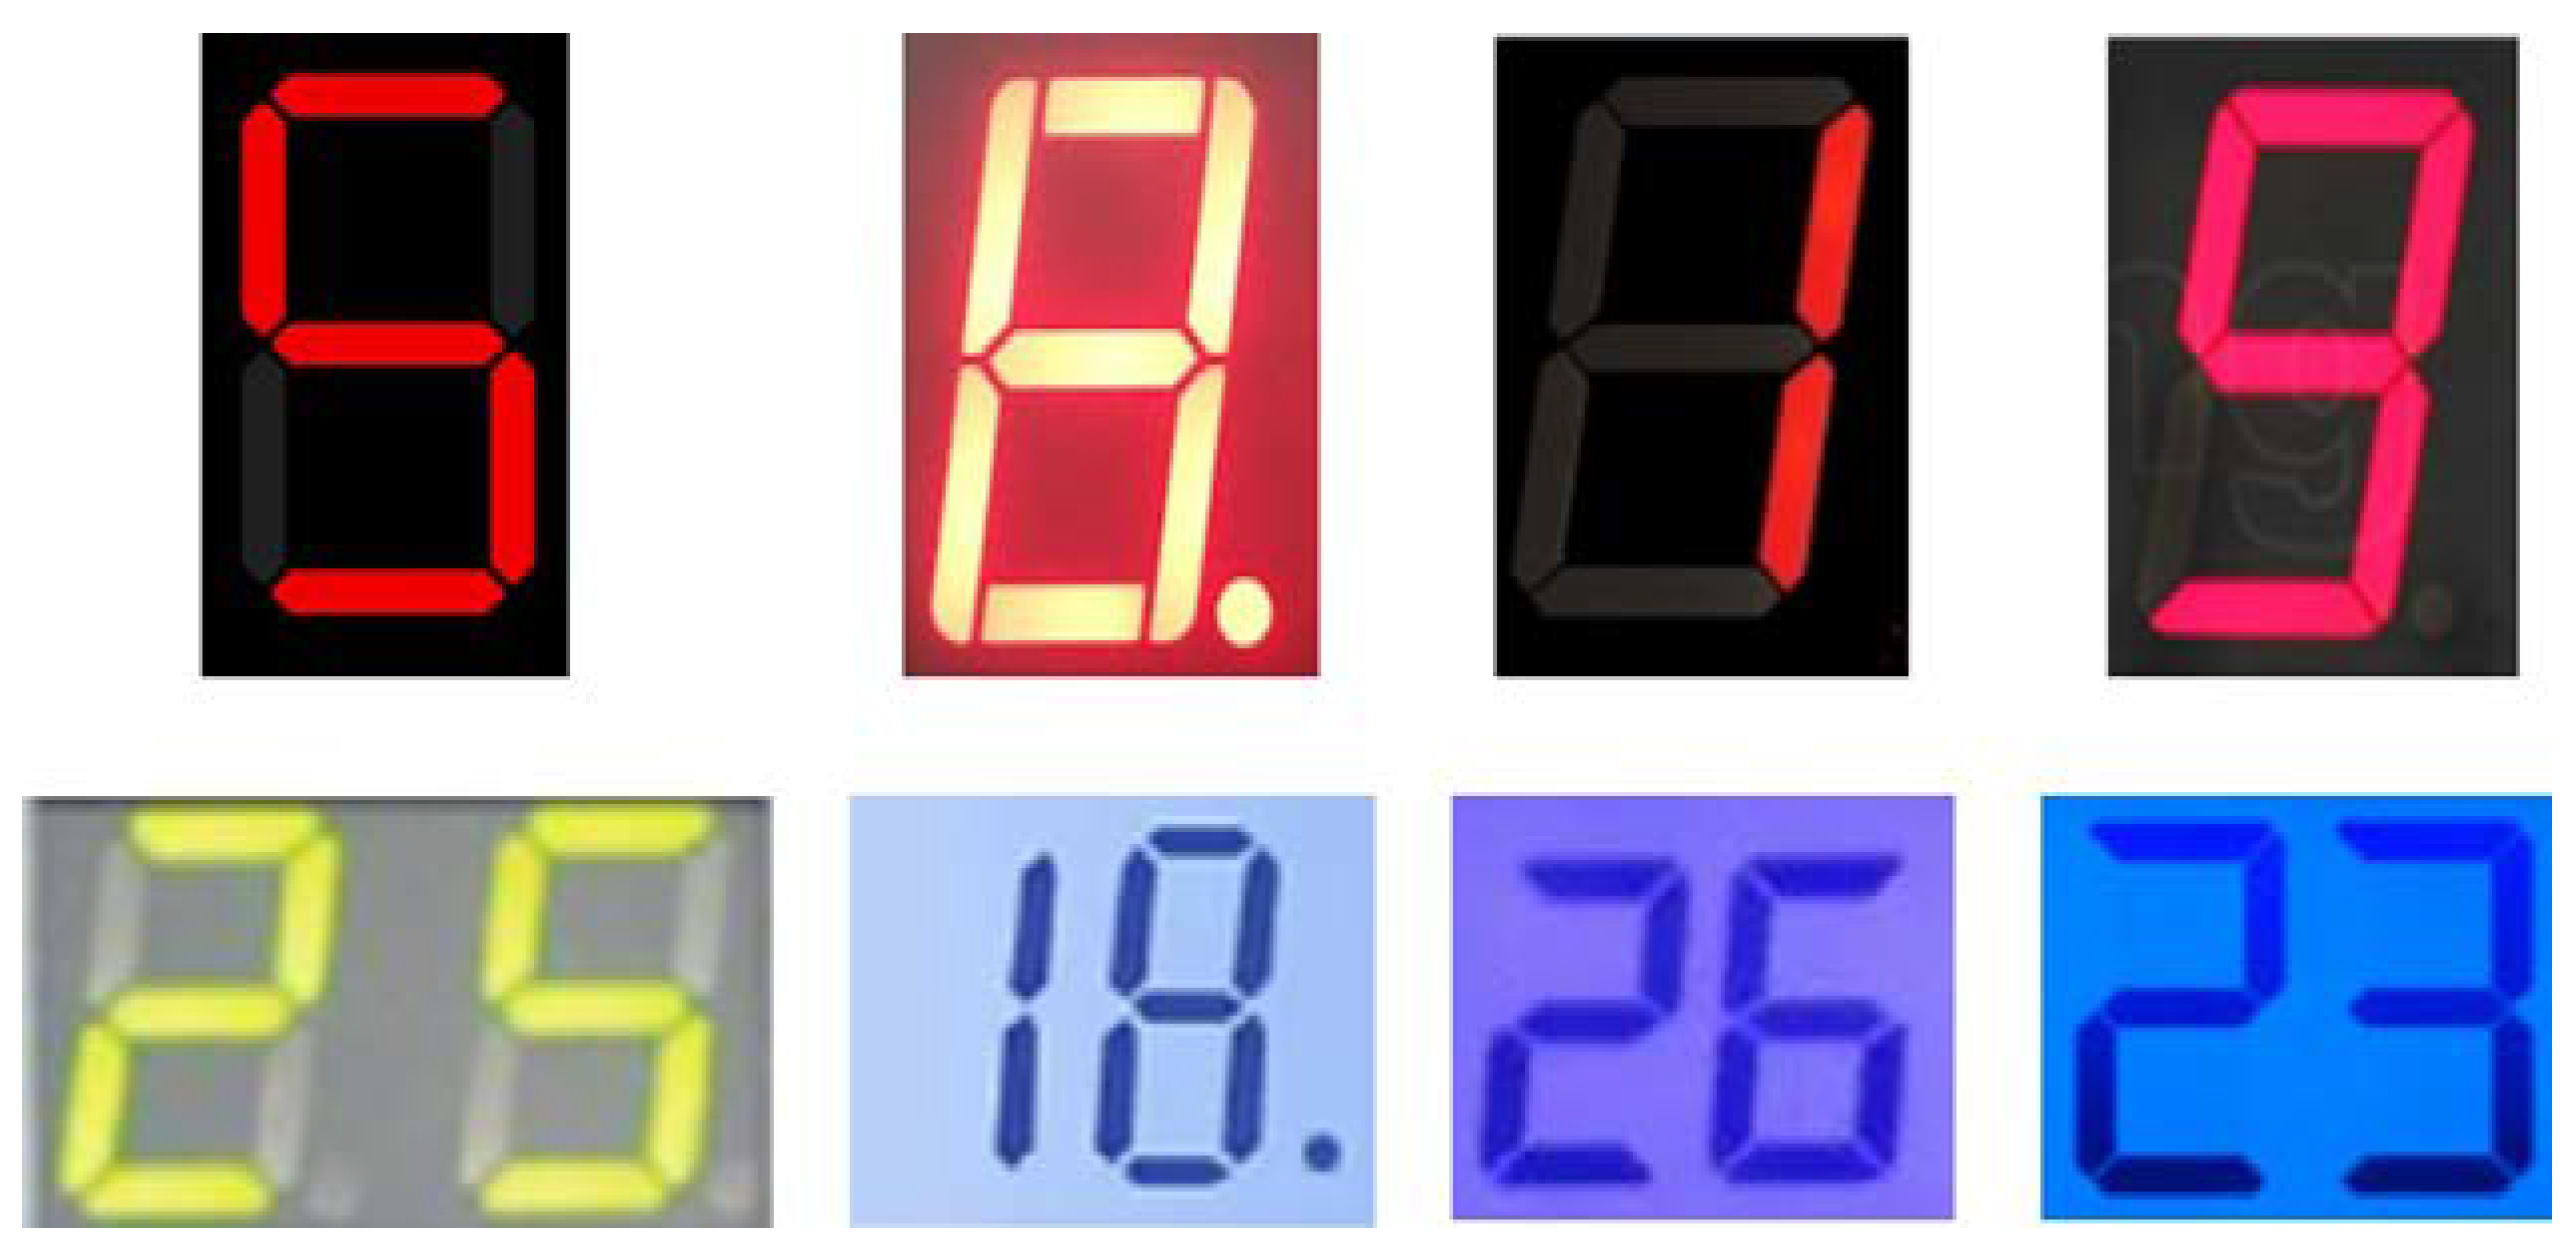
According to the characteristics of the saliency map, the digit detection network (DDN) can quickly extract the information of ROI in fewer steps based on the improved object detection model. The first step is digit area detection. Image features are extracted by using ResNet [38] as the backbone network, which had shown a strong ability to extract the important features in deep learning. The data features of the ROI region are standardized by multilevel ROI pooling, and then location regression is conducted. ResNeSt50 is used as the backbone to extract ROI image features, and the Inception network is used to determine the digit position information. ROI pooling is used to standardize the data features of a single-digit area. Location regression is based on the Non-Maximum Suppression (NMS) proposed by [39]. Eight examples of digit detection results by the proposed system for different font, color, size, length, width, lighting, and background was shown in Figure 10.
3.5. Digit Recognition
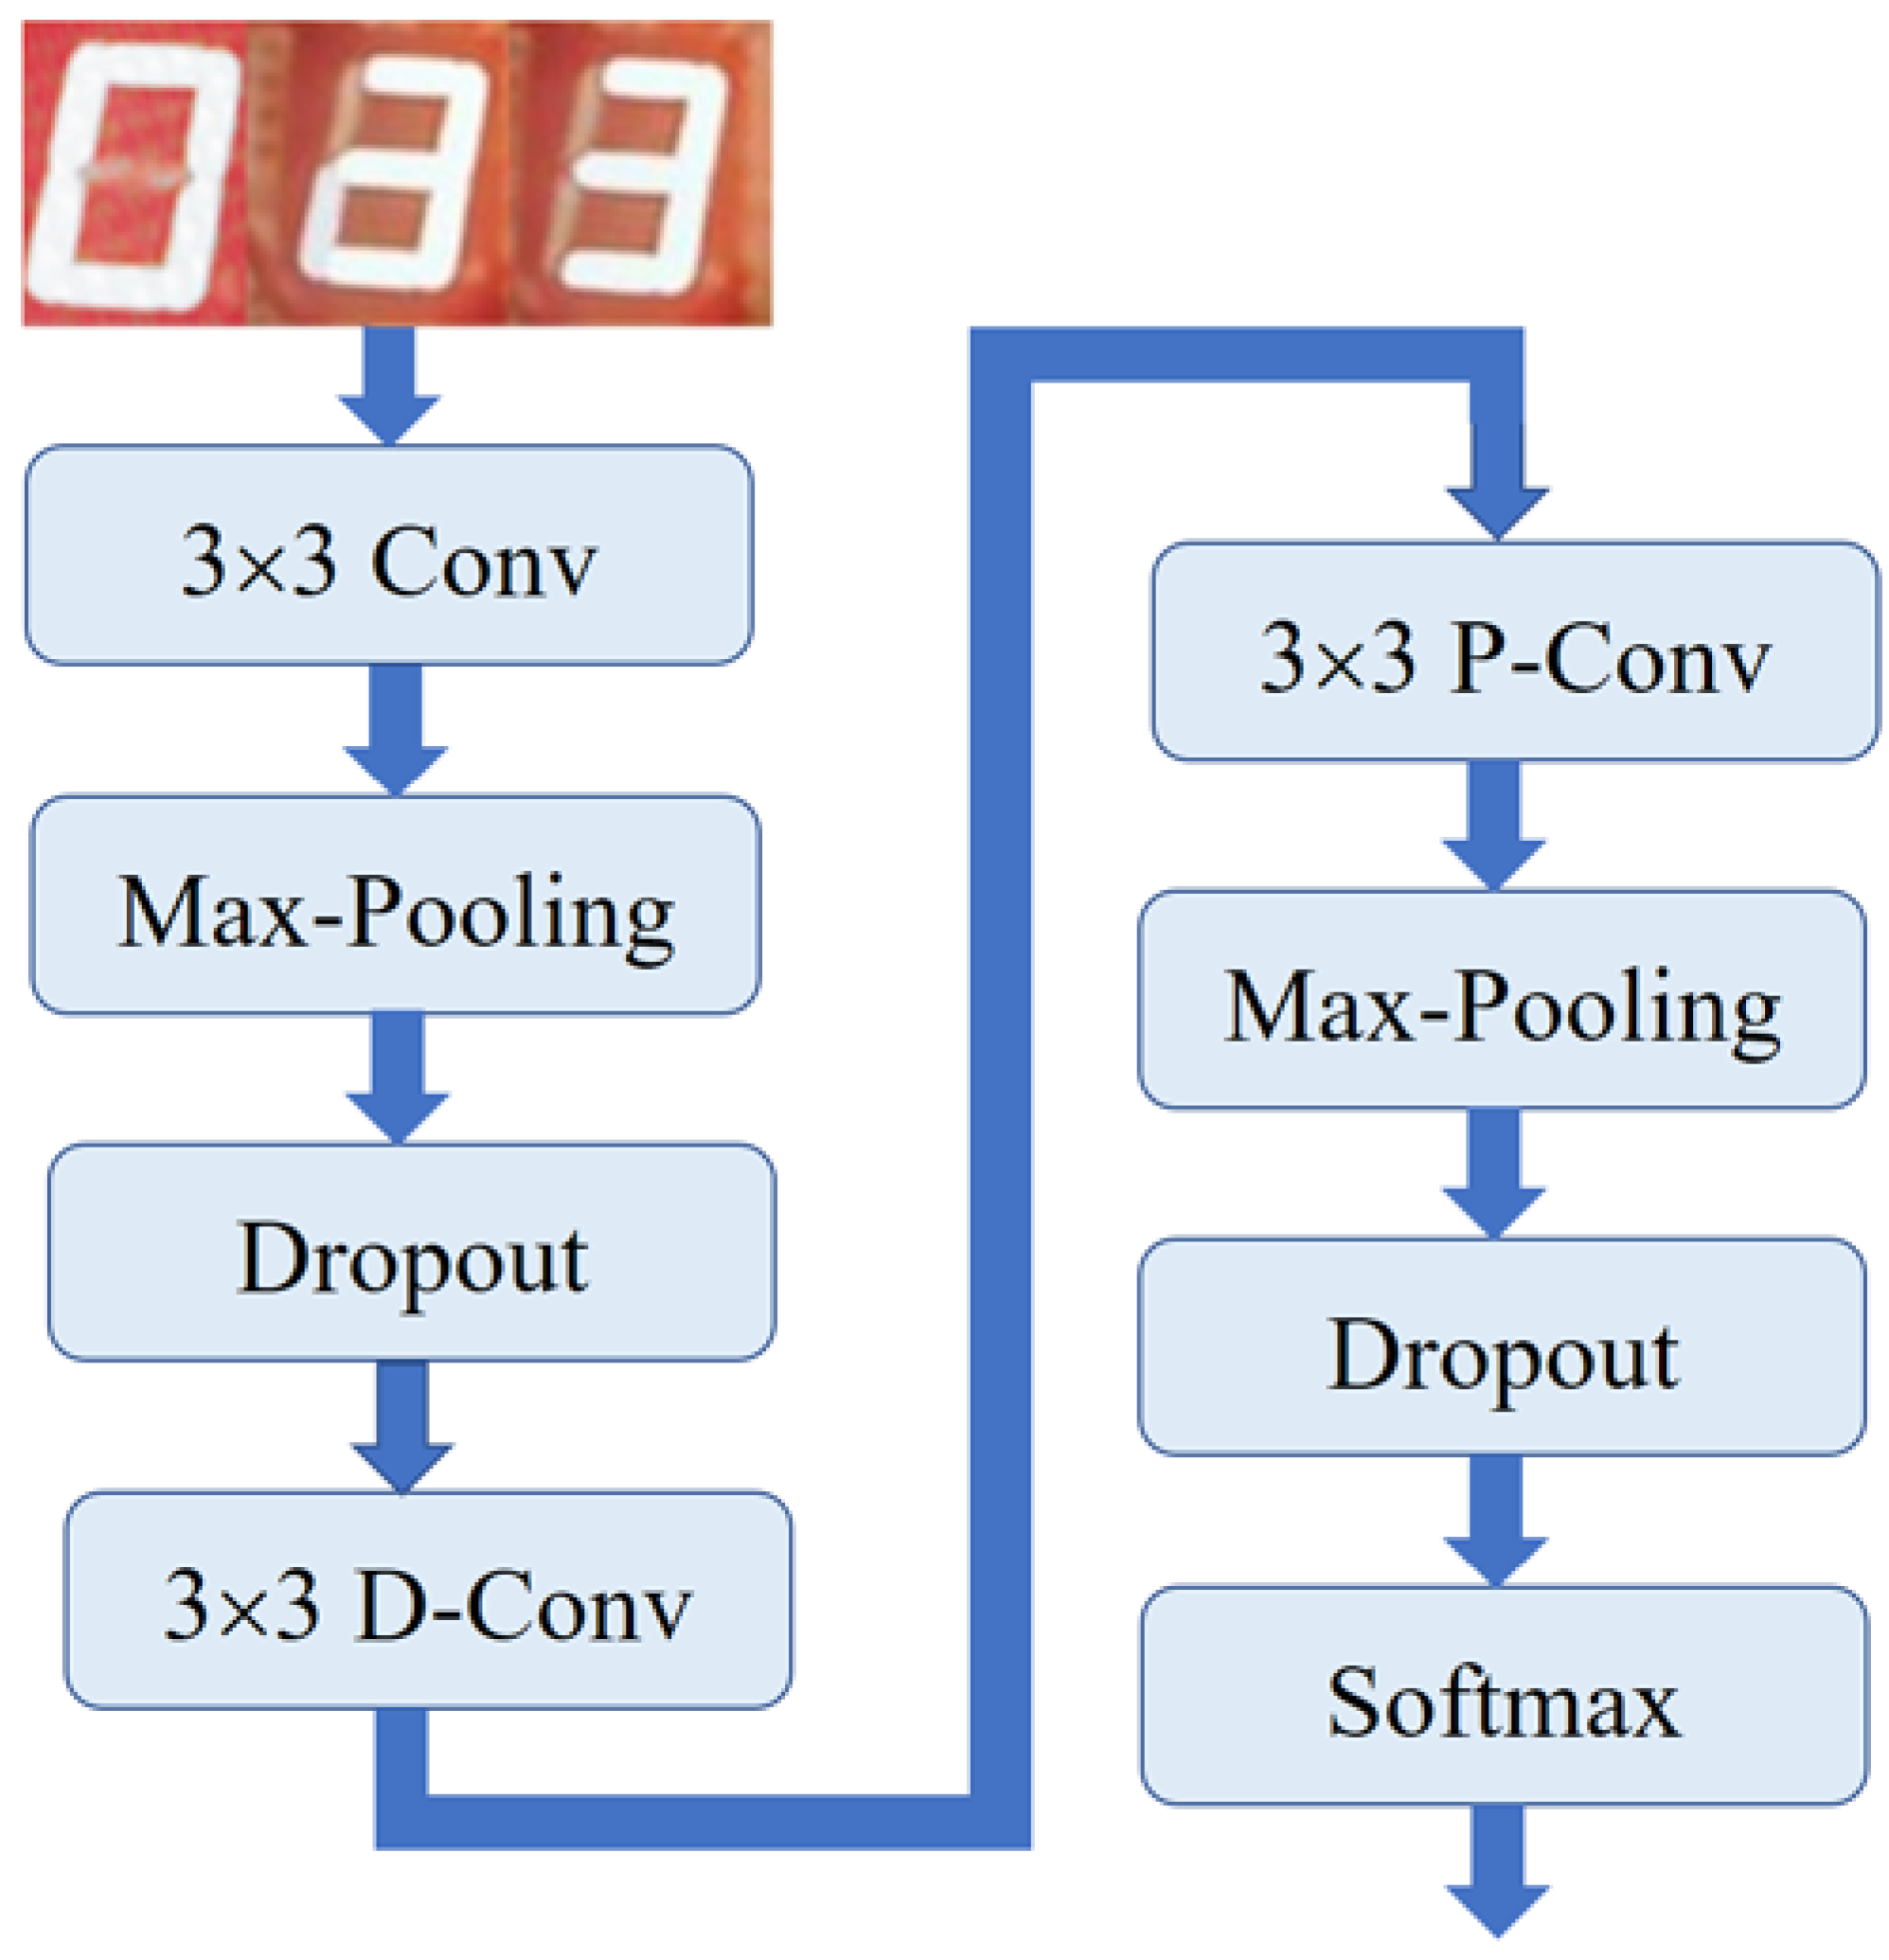
For the recognition of digits in images, a compact DNN architecture with several convolutional filters has been developed. It is easier to implement in end devices like FPGA with low computation power and less storage when compared with the other conventional method since few parameters are used for training. Howard et al. used a separable convolution to build the compact DNN architecture [40]. The separable convolution includes filtering steps based on depth-wise operations and combining steps based on point-wise operations. It divided the image into channels and performed convolutions on each channel. In the combining process, point-wise convolution was performed by a filter of size 1 × 1 on each point. The above process reduced the size and computation time of the deep learning model [41]. The architecture of the proposed deep learning model for the VDR system is shown in Figure 11. The network model proposed in Figure 11 that was designed to be a compact DNN architecture with several convolutional filters has been developed. Therefore, it is easier to implement in edge devices like FPGA with low computation power and less storage when compared with the other conventional method, since few parameters are used for training.
First, the convolution layer is based on a normal convolution (3 × 3 Conv) which contains 28 filters. It is then followed by a max-pooling operation and dropout. For the next layer, the model has used one depth-wise (3 × 3 D-Conv) and one point-wise (3 × 3 P-Conv) convolution layer, which was also followed by MaxPooling and Dropout operations. The step size was set to 1 and the window size was set by 2 × 2. After the convolution layer, there are activation function rectified linear units (ReLU) to solve the vanishing gradient problem and the Batch normalization (BN) layer [42] to make the network faster and more stable. Finally, the output layer of the deep learning model is based on the Softmax layer for a similar measure.
4. Discussion
This section shows the parameter setting and discussion about the experimental results. The experimental environment was built in two plastic injection factories. One had 12 machines with four types of panels and the training images were generated from four machines. There was one for each type of machine. The other had 10 machines also with four types of panels, and the testing images were generated from four of them. In the VDR system, the camera, Pcam 5C, was used as the vision module to be embedded on the FPGA development board, which was attached to monitor the screen on the control panel of the machines. The video streaming format was set as 30 frames per second for computation consideration, although it supports another choice at 60 frames per second. Since the original imaging module is designed around the Omni-vision and provided a 5-megapixel color image by active array dimensions with a size of 2592 × 1944, the performance of the proposed VDR system can be improved further. Since the camera provides a 5-megapixel image, the captured image of the control panel will contain each digit on the panel. In fact, there are many digits on a control panel. For the FPGA development board, an Intel. DE10 Lite with a powerful main chip was used as the hardware platform. Both training and testing processes were performed with the image dataset captured from the aforementioned experimental environment. When generating the image database, there was no restricted limitation about the illumination configurations. The situation was the same as the daily production of the factory. The image dataset contains 54,688 digit images. All of them were normalized to 28 × 28 for the training process.
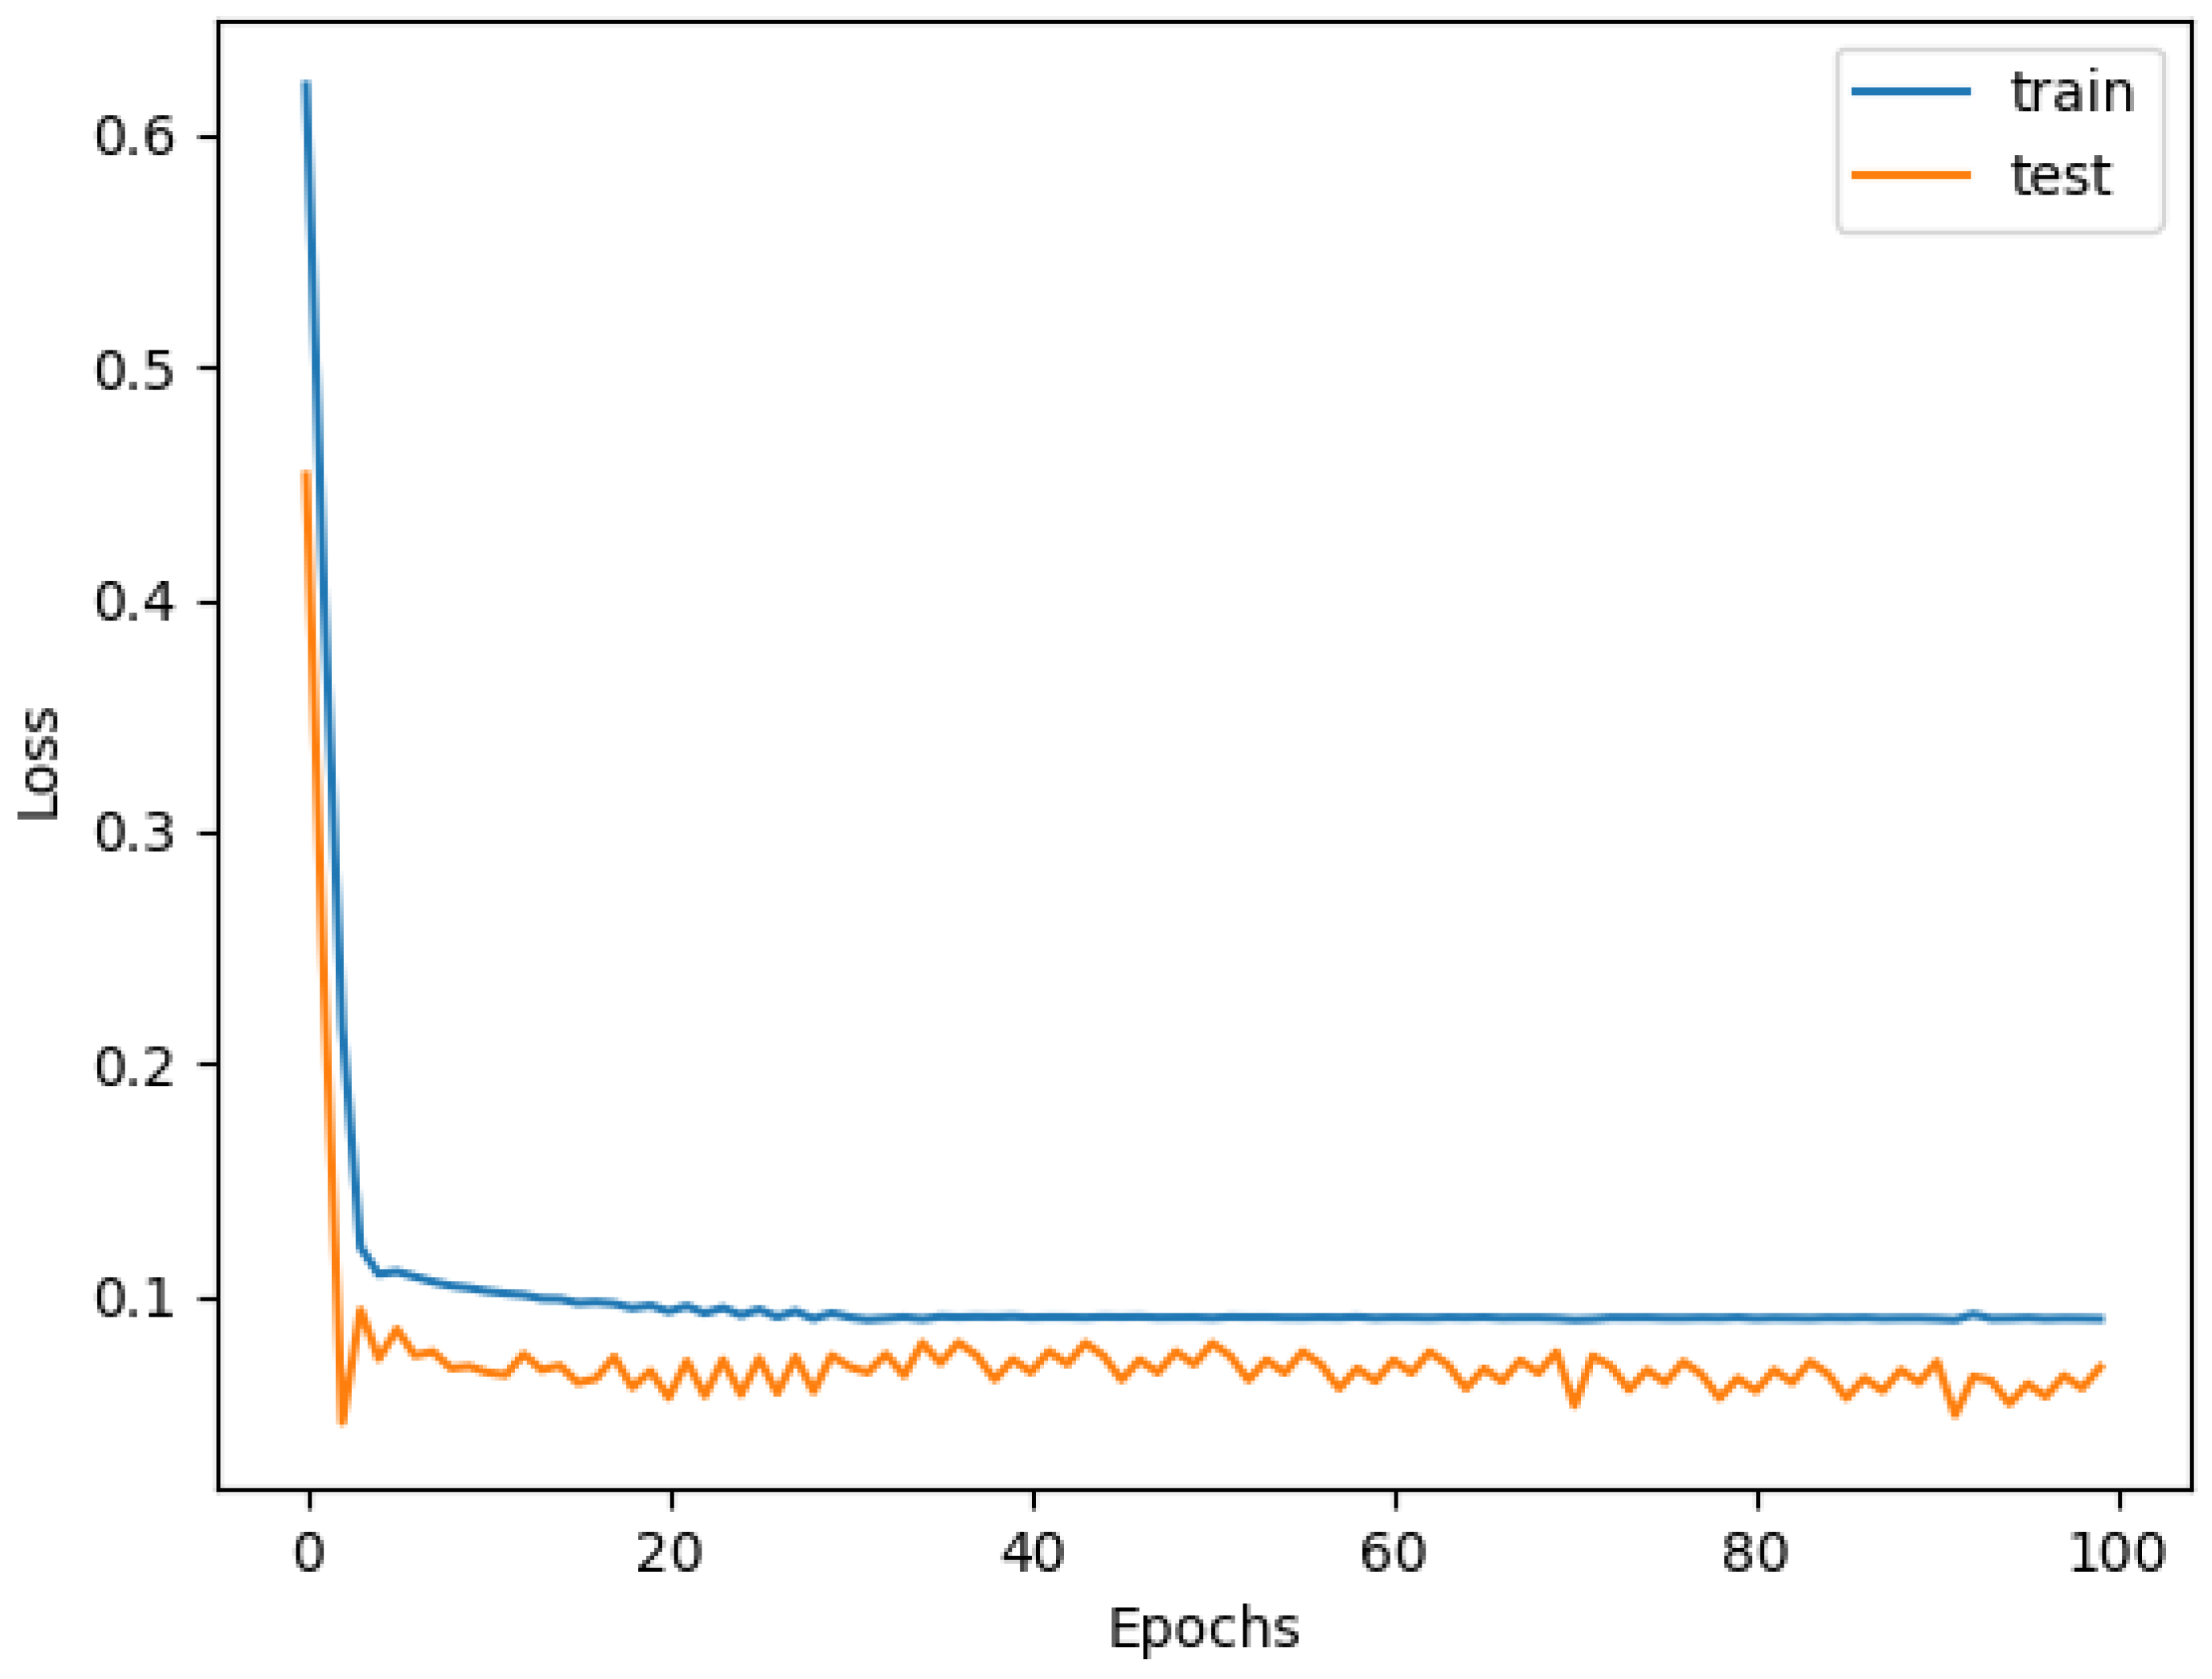
To improve the accuracy and reduce the loss percentage of the deep learning model, the initial learning rate was finally set to be 0.01 based on the prior testing process on several different learning rates for optimal performance. Adam optimization [43] is the frequently used optimizer for deep neural networks and provides good results. The loss function adopted L2 regularization and a square coefficient is used as a penalty term. For the entire training dataset, the proposed model is trained for 100 epochs to see the change in learning rate. The loss curve vs. epochs of the training and testing process is shown in Figure 12. For comparing the performance with the existing methods, a VGG-based CNN method is also implemented for digit recognition [22].
Tests of the proposed method were implemented in a plastic injection factory. It showed the improvement in manufacturing products by the proposed system and achieved a high digit recognition accuracy of 97.56%. Furthermore, the ROI identification was 100%, because the edge of the ROI did not need to approach the boundary of the digit and the calibration of cameras can also improve the precision. In addition, the experiment was performed on low-power end devices with the micro control unit. The proposed network resulted in about 1% lesser accuracy than the existing VGG-based CNN method, but a few parameters were used to fit the hardware performance of FPGA. The comparison of the accuracy of the proposed and existing method is shown in Table 1. For Table 1, the training and testing of the VGG-based CNN method was performed on a GTX 1060 with 6 GB memory and the power rate was 115.0 Watts. However, it needs only 5 Watts for the proposed method to train and test on the Intel. DE10 Lite. Although the network won’t reach 100% accuracy, the need for an operator to check for false positives and false negatives is drastically reduced.
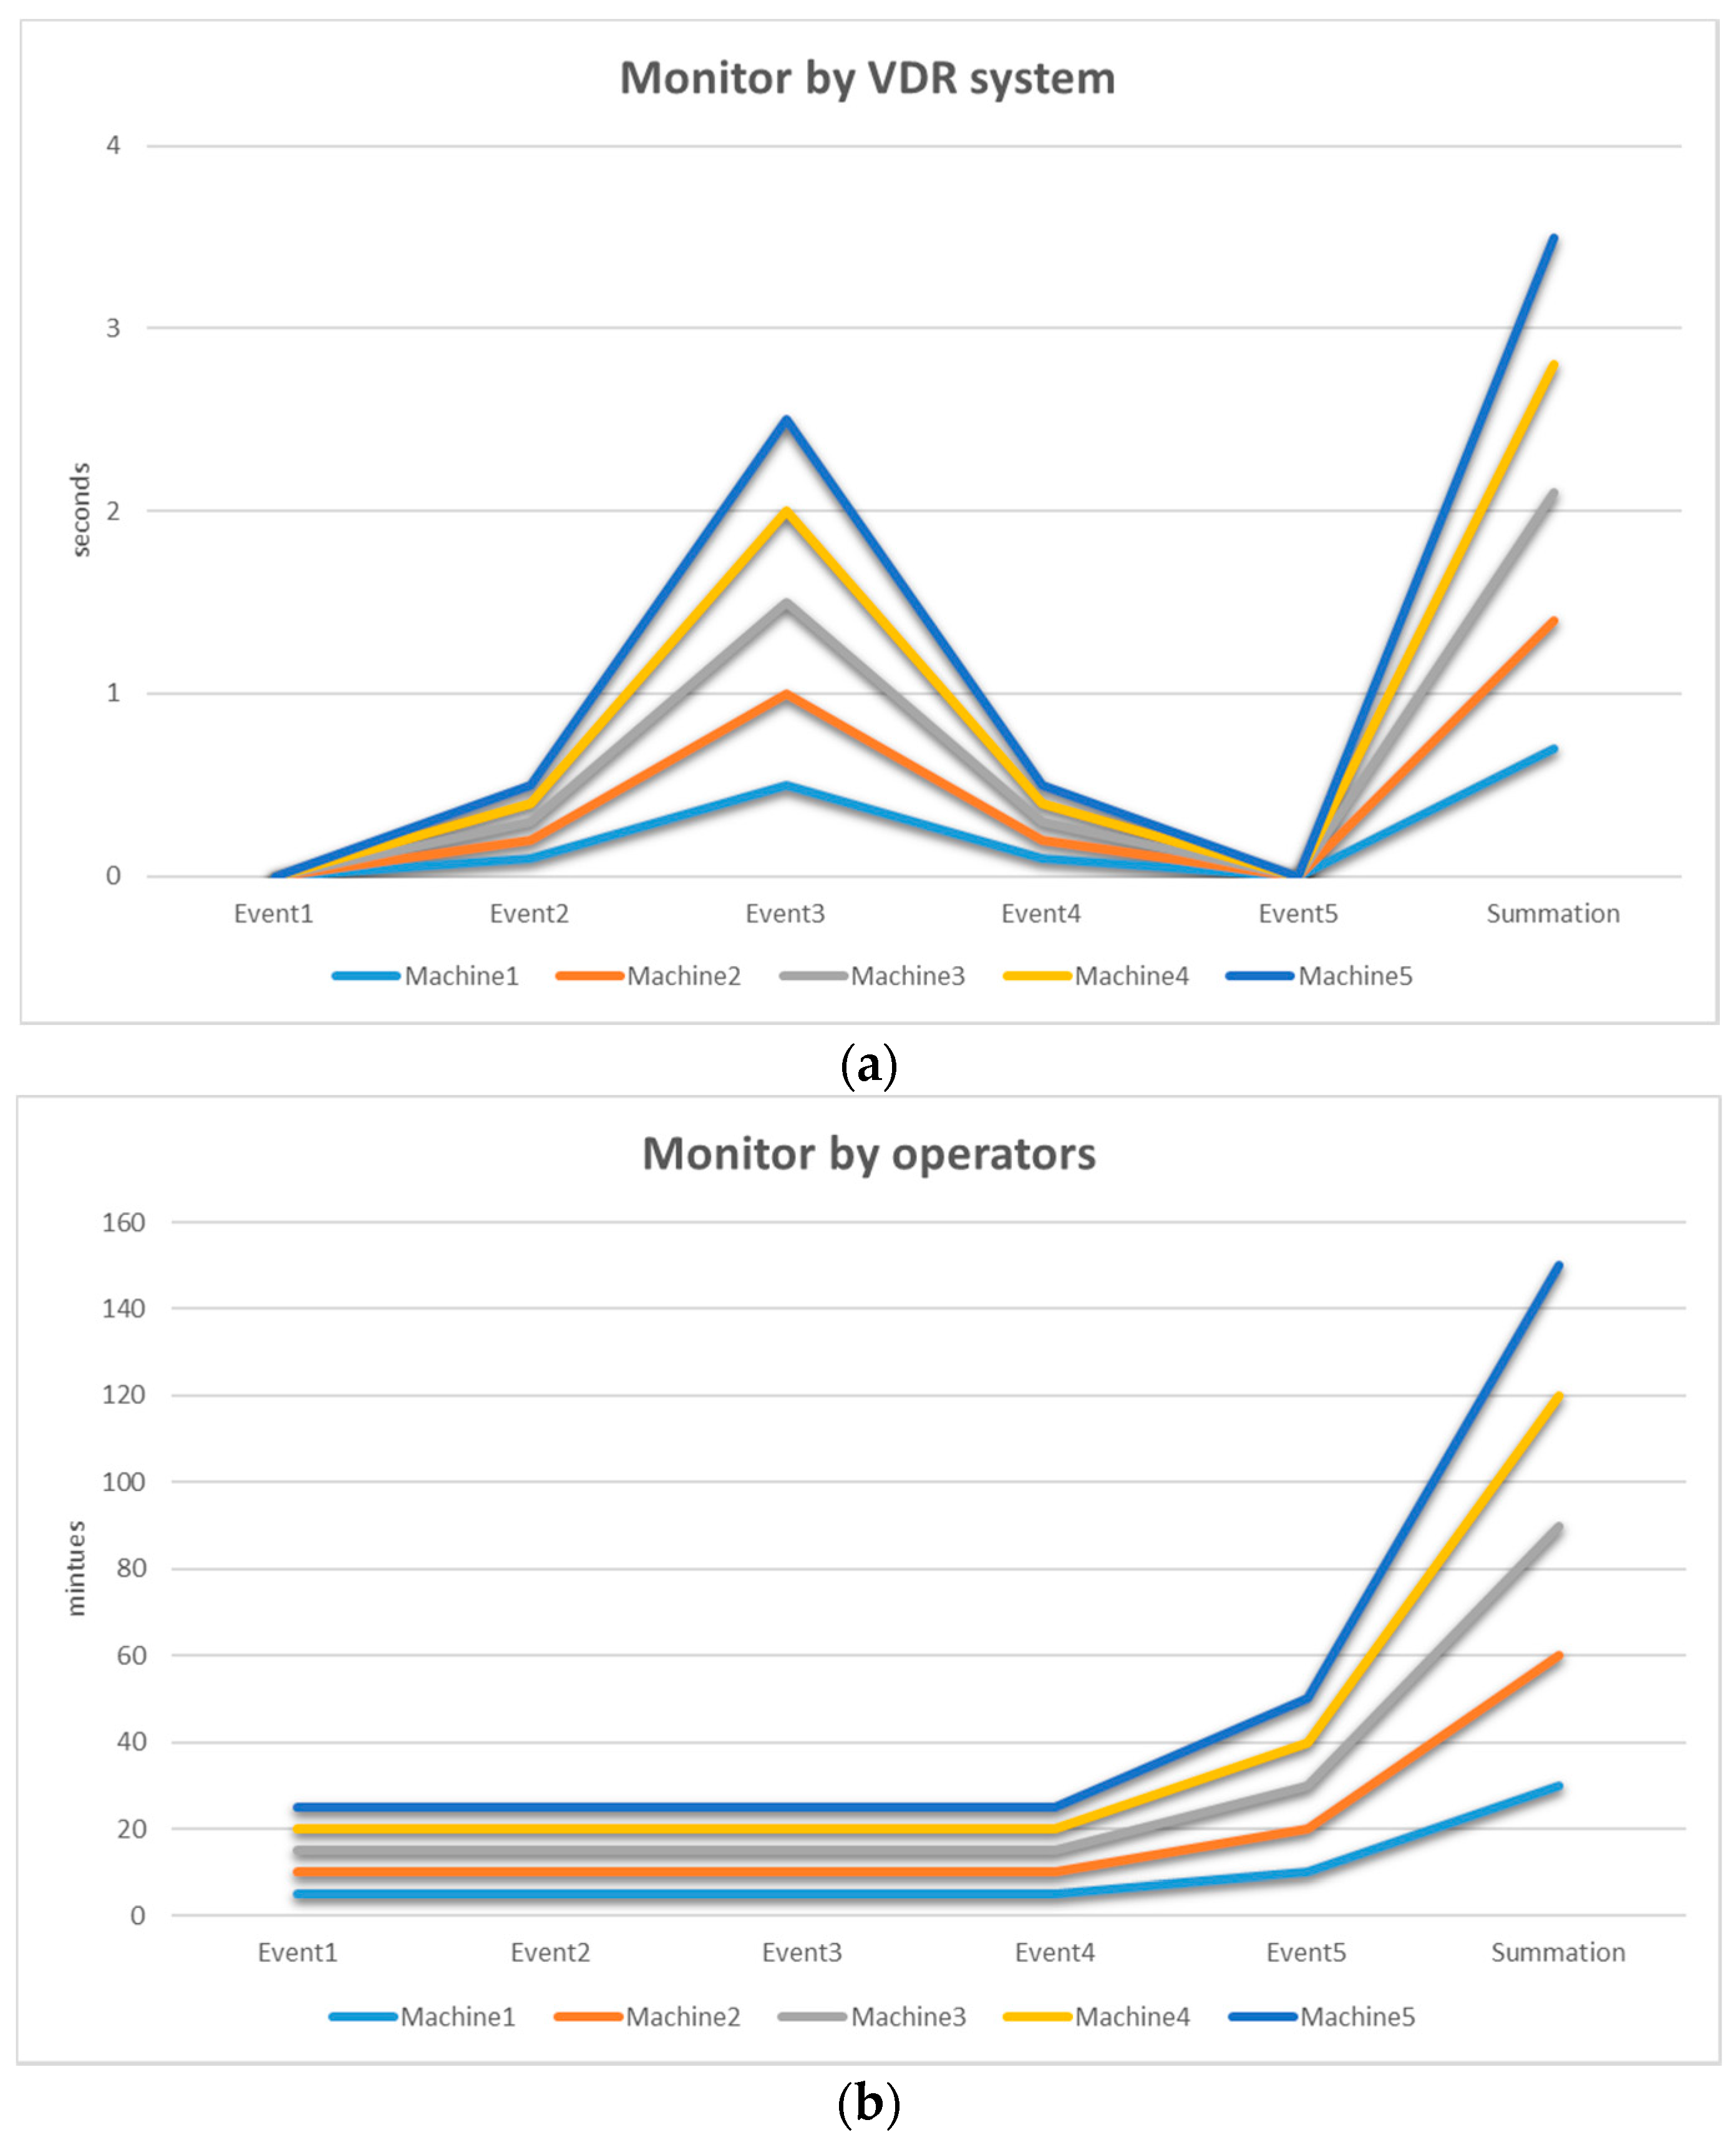
To verify the efficiency of the developed method to the industrial reality, the developed architecture was implemented in a designed testing platform for simulating the online test. Two simulations based on the statistical model were adopted in this study. The simulations were performed on AnyLogic Cloud, which is a web platform for applying simulations operationally. Suppose that the probability that a machine is stopped by an abnormal condition in one day follows a Poisson probability distribution P(λ, λ), where λ is 1. The probability for the waiting time in minutes follows a uniform probability distribution U(10, 30). For the simulation of a VDR system, the data of the machine condition was shown in a panel screen monitored by the VDR system and the corresponding machine parameter adjusting suggestion responded in real-time. The simulation generated five machines in the system and was running for seven days to test the performance. Machines 1 to 5 worked continuously and event 1 to 5 may happen randomly according to Poisson probability distribution. The total waiting time of machine downtime by abnormal event was accumulated. Figure 13a shows the waiting time of machines caused by the VDR system. Since it can manage machines in real-time, the total waiting time is less than 4 s, which is due to a network delay. For the simulation of the conventional system monitoring by operators, the wait time of each machine corresponding to the event was simulated according to uniform probability distribution. The simulation of a conventional working process for condition monitoring by the operator was based on the working flow in Figure 7. These parameters of uniform probability distribution came from the factories in the study cases. In Figure 13b, the total waiting time exceeds 150 min. It was observed that the VDR system drastically reduced the waiting time of machines when compared with the conventional process involving operators.
5. Conclusions
This paper proposed a VDR embedded in FPGA for edge computing to construct an IoT system. It can be used to improve the efficiency of the factory. It focused on performing recognition tasks and transmitting extracted numbers through an IoT system to further manufacturing management. A simple camera embedded in FPGA was attached to monitor the screen on the control panel of the machines. The end device is preprogrammed to capture images in real-time and locally process data on the end device. The preprocessing step was then performed to have the normalized illumination of the captured image. A saliency map was generated to detect the required region for recognition. Finally, digit recognition was performed and the recognized digits were sent to the IoT system. The proposed VDR system uses the compact deep learning model for training and validation purposes to fit the requirement of cost consideration and real-time monitoring in edge computing. Experimental results for a real factory environment show the efficiency of the proposed method. For machine monitoring, digit recognition is just the first step. There are light signals, numbers, pointers, bar graphs, dynamic code tables, flow charts and related texts included on the control panel. The compact deep learning model for training and testing purposes to fit the requirement of cost consideration and real-time monitoring in edge computing might be applied to other machine monitoring applications. In the future, the proposed VDR system can be improved to deal with data collection from the control panel of machines including the knob switch status, pointer meter, status lights, mechanical counters, texts, etc.
Author Contributions
Conceptualization, T.-C.H. and Y.-H.T.; methodology, T.-C.H.; software, T.-C.H. and D.-M.C.; validation, T.-C.H., Y.-H.T. and D.-M.C.; formal analysis, T.-C.H.; investigation, D.-M.C.; resources, Y.-H.T. and T.-C.H.; data curation, D.-M.C.; writing—original draft preparation, T.-C.H.; writing—review and editing, Y.-H.T.; visual-ization, D.-M.C.; supervision, T.-C.H.; project administration, T.-C.H.; funding ac-quisition, Y.-H.T. All authors have read and agreed to the published version of the manuscript.
Funding
This paper was partially supported by the Ministry of Science and Technology of the Republic of China under contract MOST 110-2221-E-364-001.
Conflicts of Interest
The authors declare no conflict of interest.
References
- Di Capaci, R.B.; Scali, C. A Cloud-Based Monitoring System for Performance Assessment of Industrial Plants. Ind. Eng. Chem. Res. 2020, 59, 2341–2352. [Google Scholar] [CrossRef]
- Evtodieva, T.E.; Chernova, D.V.; Ivanova, N.V.; Wirth, J. The internet of things: Possibilities of application in intelligent supply chain management. In Digital Transformation of the Economy: Challenges, Trends and New Opportunities; Springer: Cham, Switzerland, 2020; pp. 395–403. [Google Scholar]
- Abdollahzadeh, S.; Navimipour, N.J. Deployment strategies in the wireless sensor network: A comprehensive review. Comput. Commun. 2016, 91, 1–16. [Google Scholar] [CrossRef]
- Piccialli, F.; Jung, J.E. Understanding customer experience diffusion on social networking services by big data analytics. Mob. Netw. Appl. 2017, 22, 605–612. [Google Scholar] [CrossRef]
- Baker, S.B.; Xiang, W.; Atkinson, I. Internet of things for smart healthcare: Technologies, challenges, and opportunities. IEEE Access 2017, 5, 26521–26544. [Google Scholar] [CrossRef]
- Jara, A.J.; Sun, Y.; Song, H.; Bie, R.; Genooud, D.; Bocchi, Y. Internet of things for cultural heritage of smart cities and smart regions. In Proceedings of the 2015 IEEE 29th International Conference on Advanced Information Networking and Applications Workshops, Gwangiu, Korea, 24–27 March 2015; pp. 668–675. [Google Scholar] [CrossRef]
- Latif, S.; Afzaal, H.; Zafar, N.A. Intelligent traffic monitoring and guidance system for smart city. In Proceedings of the IEEE International Conference on Computing, Mathematics and Engineering Technologies (iCoMET), Sukkur, Pakistan, 3–4 March 2018; pp. 1–6. [Google Scholar]
- Babar, M.; Khan, F.; Iqbal, W.; Yahya, A.; Arif, F.; Tan, Z.; Chuma, J.M. A secured data management scheme for smart societies in industrial internet of things environment. IEEE Access 2018, 6, 43088–43099. [Google Scholar] [CrossRef]
- Pouryazdan, M.; Fiandrino, C.; Kantarci, B.; Soyata, T.; Kliazovich, D.; Bouvry, P. Intelligent gaming for mobile crowd-sensing participants to acquire trustworthy big data in the internet of things. IEEE Access 2017, 5, 22209–22223. [Google Scholar] [CrossRef]
- Lashkari, B.; Rezazadeh, J.; Farahbakhsh, R.; Sandrasegaran, K. Crowdsourcing and sensing for indoor localization in IoT: A review. IEEE Sens. J. 2018, 19, 2408–2434. [Google Scholar] [CrossRef]
- Cao, W.; Zhang, J.; Cai, C.; Chen, Q.; Zhao, Y.; Lou, Y.; Jiang, W.; Gui, G. CNN-based intelligent safety surveillance in green IoT applications. IEEE China Commun. 2021, 8, 108–119. [Google Scholar] [CrossRef]
- Vaccari, M.; Capaci, R.B.; Brunazzi, E.; Tognotti, L.; Pierno, P.; Vagheggi, R.; Pannocchia, G. Optimally Managing Chemical Plant Operations: An Example Oriented by Industry 4.0 Paradigms. Ind. Eng. Chem. Res. 2021, 60, 7853–7867. [Google Scholar] [CrossRef]
- Vaccari, M.; Capaci, R.B.; Brunazzi, E.; Tognotti, L.; Pierno, P.; Vagheggi, R.; Pannocchia, G. Implementation of an Industry 4.0 system to optimally manage chemical plant operation. IFAC-PapersOnLine 2020, 53, 11545–11550. [Google Scholar] [CrossRef]
- Badii, C.; Bellini, P.; Cenni, D.; Mitolo, N.; Nesi, P.; Pantaleo, G.; Soderi, M. Industry 4.0 Synoptics Controlled by IoT Applications in Node-RED. In Proceedings of the 2020 International Conferences on Internet of Things and IEEE Green Computing and Communications and IEEE Cyber, Physical and Social Computing and IEEE Smart Data and IEEE Congress on Cybermatics, Rhodes, Greece, 2–6 November 2020; pp. 54–61. [Google Scholar]
- Karami, E.; Shehata, M.; Smith, A. Image identification using sift algorithm: Performance analysis against different image deformations. arXiv 2017, arXiv:1710.02728. [Google Scholar]
- Bay, H.; Tuytelaars, T.; Van Gool, L. Surf: Speeded up robust features. In Proceedings of the European Conference on Computer Vision, Graz, Austria, 7–13 May 2006; Springer: Berlin/Heidelberg, Germany, 2006; pp. 404–417. [Google Scholar]
- Karami, E.; Prasad, S.; Shehata, M. Image matching using sift, surf, brief and orb: Performance comparison for distorted images. arXiv 2017, arXiv:1710.02726. [Google Scholar]
- Asgary, M.P.; Jahandideh, S.; Abdolmaleki, P.; Kazemnejad, A. Analysis and identification of β-turn types using multinomial logistic regression and artificial neural network. Bioinformatics 2007, 23, 3125–3130. [Google Scholar] [CrossRef] [PubMed] [Green Version]
- Sudharsan, B.; Kumar, S.P.; Dhakshinamurthy, R. Ai vision: Smart speaker design and implementation with object detection custom skill and advanced voice interaction capability. In Proceedings of the IEEE 2019 11th International Conference on Advanced Computing (ICoAC), Chennai, India, 18–20 December 2019; pp. 97–102. [Google Scholar]
- Gallo, I.; Zamberletti, A.; Noce, L. Robust Angle Invariant GAS meter reading. In Proceedings of the International Conference on Digital Image Computing: Techniques and Applications, Adelaide, SA, Australia, 23–25 November 2015. [Google Scholar]
- Cerman, M.; Shalunts, G.; Albertini, D. A Mobile Recognition System for Analog Energy Meter Scanning. In Advances in Visual Computing; Lecture Notes in Computer Science; ISVC Springer: Cham, Switzerland, 2016; Volume 10072, pp. 247–256. [Google Scholar]
- Son, C.; Park, S.; Lee, J.; Paik, J. Deep Learning–based Number Detection and Recognition for Gas Meter Reading. IEIE Trans. Smart Process. Comput. 2019, 8, 367–372. [Google Scholar] [CrossRef]
- Waqar, M.; Waris, M.A.; Rashid, E.; Nida, N.; Nawaz, S.; Yousaf, M.H. Meter Digit Recognition Via Faster RCNN. In Proceedings of the International Conference on Robotics and Automation in Industry (ICRAI), Rawalpindi, Pakistan, 21–22 October 2019; pp. 1–5. [Google Scholar]
- Yadav, P.; Vishwakarma, S. Application of Internet of Things and Big Data towards a Smart City. In Proceedings of the IEEE 3rd International Conference Internet of Things: Smart Innovation and Usages (IoT-SIU), Bhimtal, India, 23–24 February 2018. [Google Scholar] [CrossRef]
- Ishino, M.; Koizumi, Y.; Hasegawa, T. Leveraging proximity services for relay device discovery in user-provided IoT networks. In Proceedings of the IEEE 2nd World Forum on Internet of Things (WF-IoT), Milan, Italy, 14–16 December 2015; pp. 553–558. [Google Scholar]
- Murshed, M.; Murphy, C.; Hou, D.; Khan, N.; Ananthanarayanan, G.; Hussain, F. Machine learning at the network edge: A survey. arXiv 2019, arXiv:1908.00080. [Google Scholar] [CrossRef]
- Shi, W.; Cao, J.; Zhang, Q.; Li, Y.; Xu, L. Edge computing: Vision and challenges. IEEE Internet Things J. 2016, 3, 637–646. [Google Scholar] [CrossRef]
- Khan, R.; Yang, Y.; Liu, Q.; Qaisar, Z.; Divide, H. conquer: Ill-light image enhancement via hybrid deep network. Expert Syst. Appl. 2021, 182, 115034. [Google Scholar] [CrossRef]
- Zeng, G.; Zhou, J.; Jia, X.; Xie, W.; Shen, L. Hand-crafted feature guided deep learning for facial expression recognition. In Proceedings of the 2018 13th IEEE International Conference on Automatic Face & Gesture Recognition (FG 2018), Xi’an, China, 15–19 May 2018; pp. 423–430. [Google Scholar]
- Quintanilha, D.B.P. Automatic consumption reading on electromechanical meters using HoG and SVM. In Proceedings of the 7th Latin American Conference on Networked and Electronic Media (LACNEM), Valparaiso, Chile, 6–7 November 2017; pp. 57–61. [Google Scholar]
- Ebrahimzadeh, R.; Jampour, M. Efficient Handwritten Digit Recognition based on Histogram of Oriented Gradients and SVM. Int. J. Comput. Appl. 2014, 104, 10–13. [Google Scholar] [CrossRef]
- Karanje, U.B.; Dagade, R.; Shiravale, S. Maximally Stable Extremal Region Approach for Accurate Text Detection in Natural Scene Images. Int. J Sci. Develop. Res. 2016, 1, 11. [Google Scholar]
- Yu, B.; Wan, H. Chinese Text Detection and Recognition in Natural Scene Using HOG and SVM. In Proceedings of the 6th International Conference on Information Technology for Manufacturing Systems, Prague, Czech Republic, 10–11 May 2016. [Google Scholar]
- Moses, Y.; Edelman, S.; Ullamn, S. Generalization on Novel Images in Upright and Inverted Faces. Perception 1996, 25, 43–461. [Google Scholar] [CrossRef] [Green Version]
- Phillips, P.J.; Vardi, Y. Efficient Illumination Normalization of Facial Images. Pattern Recognit. Lett. 1996, 17, 921–927. [Google Scholar] [CrossRef]
- Itti, L.; Koch, C.; Niebur, E. A model of saliency-based visual attention for rapid scene analysis. IEEE Pattern Anal. Mach. Intell. 1998, 20, 1254–1259. [Google Scholar] [CrossRef] [Green Version]
- Treisman, A.M.; Gelade, G.A. Feature-integration theory of attention. Cogn. Psychol. 1980, 12, 97–136. [Google Scholar] [CrossRef]
- Zhang, H.; Wu, C.; Zhang, Z.; Zhu, Y.; Zhang, Z.; Lin, H.; Sun, Y.; He, T.; Mueller, J.; Manmatha, R. Resnest: Split-attention networks. arXiv 2020, arXiv:2004.08955. [Google Scholar]
- Salscheider, N.O. FeatureNMS: Non-Maximum Suppression by Learning Feature Embeddings. In Proceedings of the 25th International Conference on Pattern Recognition (ICPR), Milan, Italy, 10–15 January 2020. [Google Scholar]
- Howard, A.G.; Zhu, M.; Chen, B.; Kalenichenko, D.; Wang, W.; Weyand, T.; Andreetto, M.; Adam, H. Mobilenets: Efficient convolutional neural networks for mobile vision applications. Comput. Vis. Pattern Recognit. (CVPR) 2017, 1, 1–9. [Google Scholar]
- Sandler, M.; Howard, A.; Zhu, M.; Zhmoginov, A.; Chen, L. MobileNetV2: Inverted Residuals and Linear Bottle necks. Comput. Vis. Pattern Recognit. (CVPR) 2019, 4, 1–14. [Google Scholar]
- Ioffe, S.; Szegedy, C. Batch normalization: Accelerating deep network training by reducing internal covariate shift. arXiv 2015, arXiv:1502.03167. [Google Scholar]
- Diederik, P.; Kingma, J.; Adam, B. A Method for Stochastic Optimization. In Proceedings of the 3rd International Conference for Learning Representations, San Diego, CA, USA, 7–9 May 2015. [Google Scholar]
Figure 1.
Injection Molding Machine.

Figure 2.
The operation control panel.

Figure 3.
The temperature mapping corresponds to the plastic injection process.

Figure 4.
The proposed vision bases IoT architecture.

Figure 5.
The conventional working process of condition monitoring by the operator.

Figure 6.
The system architecture.

Figure 7.
The proposed condition monitoring by the VDR system.

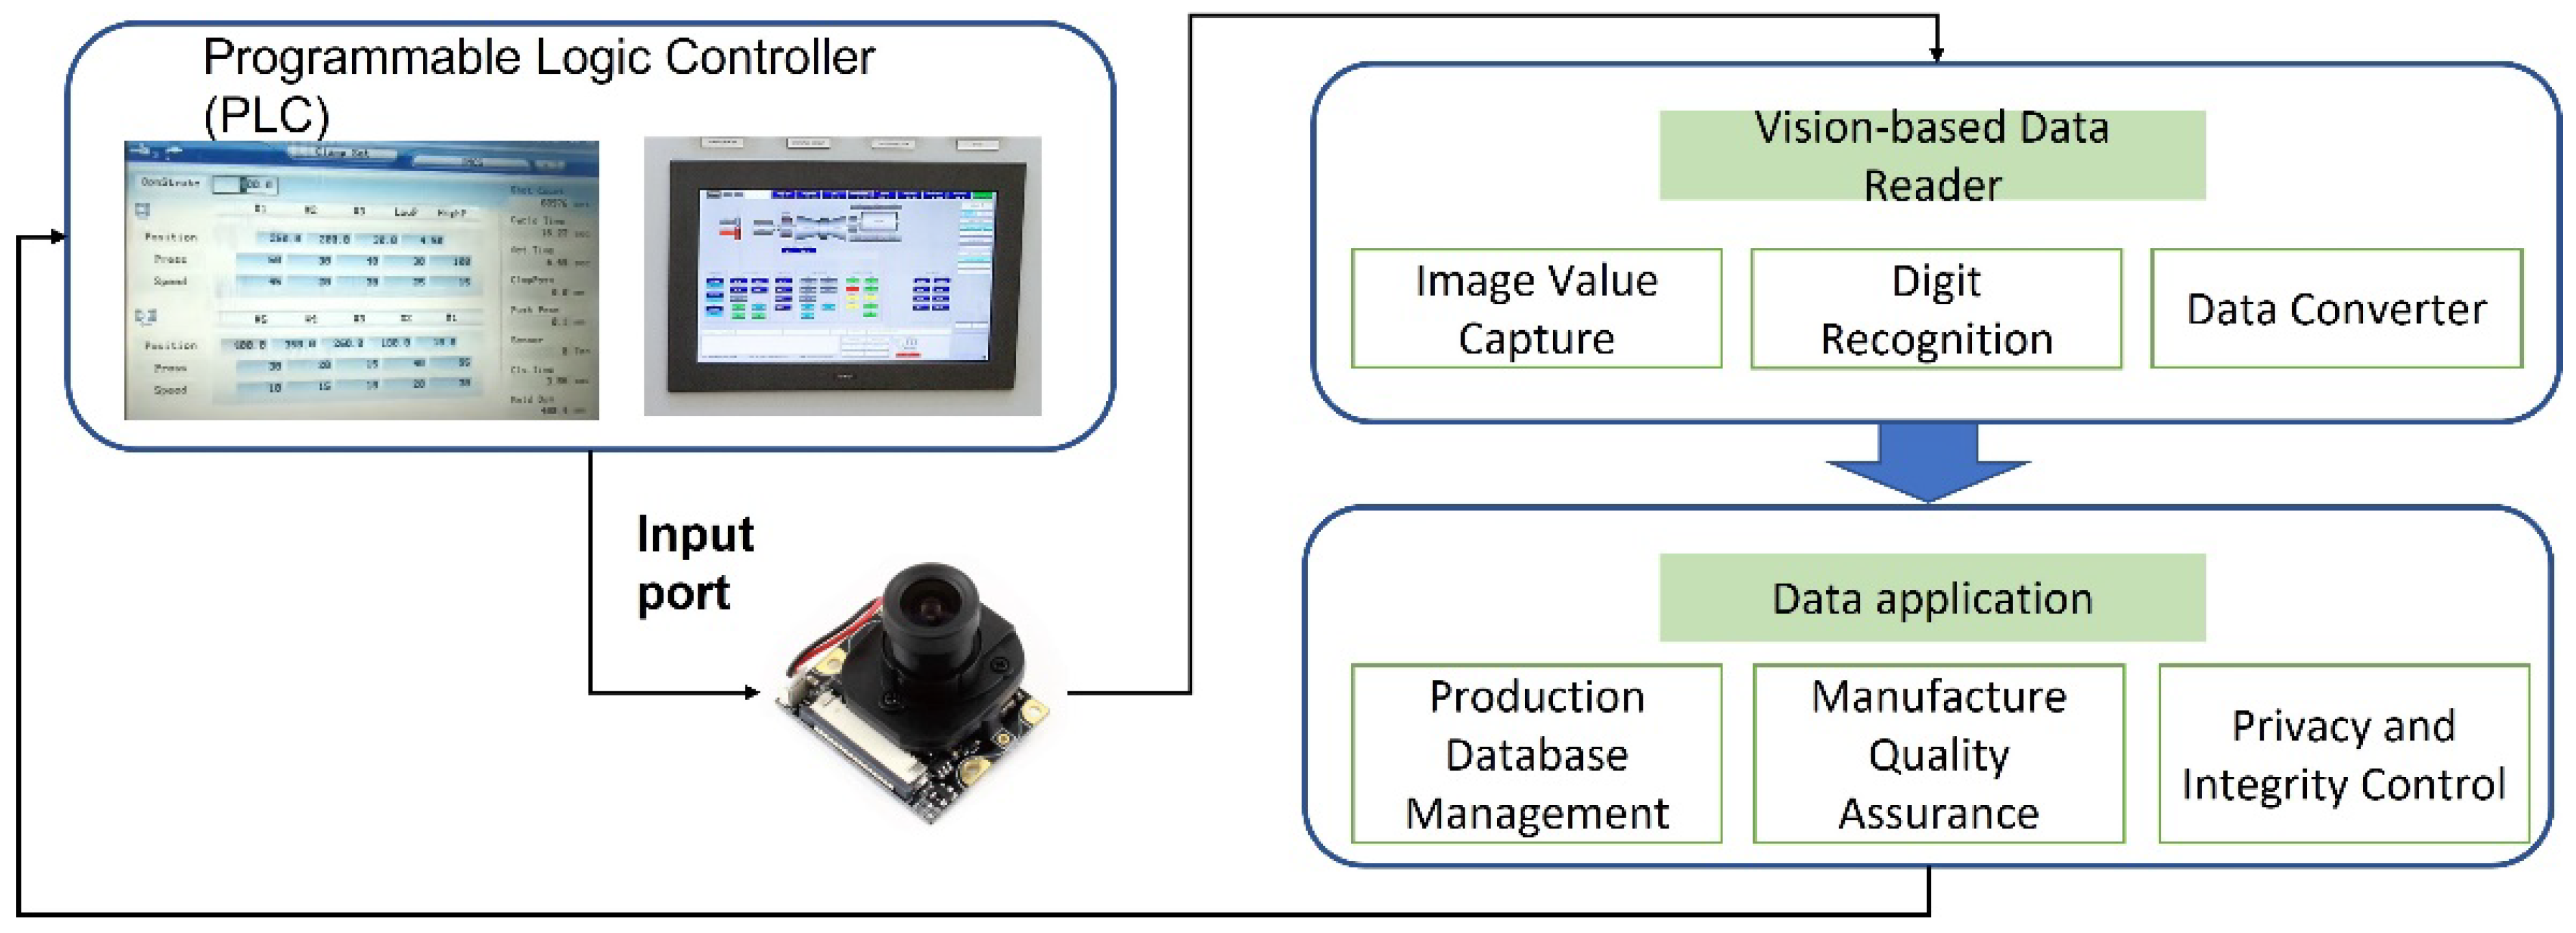
Figure 8.
The vision-based data reader.

Figure 9.
The data on the PLC panel; (a) numerical data; (b) text and graphical data.


Figure 10.
Eight examples of digit detection results.

Figure 11.
The architecture of the proposed deep learning model.

Figure 12.
The loss curve vs. epochs of the training and testing process.

Figure 13.
(a) The waiting time is caused by the VDR system; (b) the waiting time is caused by operators.
Figure 13.
(a) The waiting time is caused by the VDR system; (b) the waiting time is caused by operators.


Table 1.
The comparison of the proposed and VGG-based CNN method.
| Model | Average Accuracy |
|---|---|
| VGG-based CNN the proposed method | 98.02% 97.56% |
Publisher’s Note: MDPI stays neutral with regard to jurisdictional claims in published maps and institutional affiliations. |
© 2022 by the authors. Licensee MDPI, Basel, Switzerland. This article is an open access article distributed under the terms and conditions of the Creative Commons Attribution (CC BY) license (https://creativecommons.org/licenses/by/4.0/).
Share and Cite
MDPI and ACS Style
Hsu, T.-C.; Tsai, Y.-H.; Chang, D.-M. The Vision-Based Data Reader in IoT System for Smart Factory. Appl. Sci. 2022, 12, 6586. https://0-doi-org.brum.beds.ac.uk/10.3390/app12136586
AMA Style
Hsu T-C, Tsai Y-H, Chang D-M. The Vision-Based Data Reader in IoT System for Smart Factory. Applied Sciences. 2022; 12(13):6586. https://0-doi-org.brum.beds.ac.uk/10.3390/app12136586
Chicago/Turabian StyleHsu, Tse-Chuan, Yao-Hong Tsai, and Dong-Meau Chang. 2022. "The Vision-Based Data Reader in IoT System for Smart Factory" Applied Sciences 12, no. 13: 6586. https://0-doi-org.brum.beds.ac.uk/10.3390/app12136586
Note that from the first issue of 2016, this journal uses article numbers instead of page numbers. See further details here.