Article

Evaluation of the Hydrochemical and Water Quality Characteristics of an Aquifer Located in an Urbanized Area

by
Juan G. Loaiza
1,
Yaneth Bustos-Terrones
2,
Victoria Bustos-Terrones
3,
Sergio Alberto Monjardín-Armenta
4,
Alberto Quevedo-Castro
1,
Rogelio Estrada-Vazquez
1 and
Jesús Gabriel Rangel-Peraza
1,*
1
División de Estudios de Posgrado e Investigación, TecNM-Instituto Tecnológico de Culiacán, Juan de Dios Batíz 310. Col. Guadalupe, Culiacan 80220, Mexico
2
División de Estudios de Posgrado e Investigación, CONACYT-TecNM-Instituto Tecnológico de Culiacán, Juan de Dios Batíz 310. Col. Guadalupe, Culiacan 80220, Mexico
3
Academic Department of Engineering in Environmental Technology, Polytechnic University of the State of Morelos, Boulevard Cuauhnáhuac, No. 556. Col. Lomas del Texcal, Jiutepec 62550, Mexico
4
Faculty of Earth and Space Sciences, Autonomous University of Sinaloa, Circuito Interior Oriente, Cd Universitaria, Culiacan 80040, Mexico
*
Author to whom correspondence should be addressed.
Submission received: 18 June 2022 / Revised: 3 July 2022 / Accepted: 5 July 2022 / Published: 7 July 2022
(This article belongs to the Special Issue Water Quality Modelling, Monitoring and Mitigation)

Abstract

:
Groundwater is an important source of fresh water in the world. However, the excessive extraction and increasing pollution represent a major challenge for water sustainability in Mexico. Nowadays, since water quality changes in aquifers are not noticeable, aquifer monitoring and assessment are imperious. In this study, the water quality of the Cuernavaca aquifer was evaluated using a database of 23 parameters in 4 sampling points from 2012 to 2019. The spatial behavior of water quality variables was described by using interpolation. The temporal evaluation of groundwater quality was carried out through time series. Water quality indices (WQI) were obtained in this aquifer and the WQI values suggest that the groundwater could be considered as good quality for potable use and of medium-high quality for irrigation. The chemical characteristics of the groundwater were also evaluated using Gibb, Piper, and Schoeller diagrams. Finally, with a total of 34 samples of each parameter in each sampling site, a multivariate statistical analysis was performed using a Pearson correlation and hierarchical cluster analysis. This analysis showed a correlation between hydrochemical features and groundwater quality parameters, where nitrates presented the highest number of significant correlations with other parameters. These results may be useful for the authorities to adopt planning methods to improve the sustainable development of the aquifer.

1. Introduction

Groundwater is one of the most important natural resources and plays an important role in ecosystems [1]. It is widely used for domestic, industrial, and agricultural activities; hence, its demand is constantly increasing [2,3,4,5]. Population growth, accidental spills, surface leaching, runoff, and the extensive use of fertilizers in irrigated areas are considered the main causes of groundwater alteration [6,7]. Furthermore, agricultural activities modify groundwater conditions with nutrients and pesticides coming from leachate infiltration into the soil. Therefore, the use of fertilizers, pesticides, and herbicides in agriculture are major threats to aquifers [8,9,10]. In addition, the deterioration of an aquifer can be also related to natural causes such as floods, droughts, and salinization [11,12,13]. Once the aquifer is altered, it is complex and expensive to reverse the damage [12,14]. Therefore, groundwater quality must be monitored regularly to prevent aquifer alterations.
Many studies have been proposed for the assessment of aquifer vulnerability. Bannenberg et al. [6] evaluated the hydrological regime and hydrochemical features of the Flamouria aquifer in Edessa, Greece. They found that groundwater quality was not suitable for irrigation use since the high alkalinity and total dissolved solids found in groundwater could generate excessive salinization of the soil. Kumar et al. [8] conducted a hydrochemical study to assess the water quality suitability for drinking and irrigation purposes. As a result, they found a high concentration of some ions, such as As, Fe, and Mn, in an aquifer located in the Central Ganga Basin. Loh et al. [15] evaluated the suitability of an aquifer in Ghana for domestic and irrigation purposes. They used conventional hydrochemical and mass balance models to reveal relationships between water parameters and the main influence on the chemistry of the aquifer under study. As a result, they found that the groundwater in the area is permissible for agricultural irrigation.
Zakaria et al. [16] evaluated the hydrochemistry of groundwater in the Anayari catchment to identify the hydrogeochemical processes that are responsible for the main ions in groundwater. Their results showed good quality for irrigation without prior treatment. Wisitthammasri et al. [17] studied the water quality and hydrochemical characteristics of an aquifer in Thailand using multivariate statistical analysis to identify preliminary ion sources. This multivariate analysis evidenced the ion exchange between Ca2+ and Na+ from the weathering of silicates and calcite. Some commonly used multivariate statistical techniques, such as Pearson correlations and Hierarchical Cluster Analysis (HCA), have been used to illustrate the relationship between many groundwater variables and describe the relationship between them [18]. These studies have been carried out to develop appropriate groundwater management strategies and policies to protect aquifers. According to Elumalai et al. [4], multivariate statistical analyses are important because they provide essential information on groundwater quality and the processes responsible for its alteration.
Another tool for groundwater water quality assessment is the water quality index (WQI). This tool has been widely used by several researchers [8,14,19] since it simplifies the interpretation of water quality behavior. El Osta et al. [19] used this technique to classify the suitability of groundwater. As a result, they found that only a low percentage of the samples were classified as good to excellent to be used, while the rest of the samples were inadequate and required treatment to be used as drinking water. Another effective tool for assessing groundwater quality and its variability is that recommended by Kumar et al. [8] who evaluated the groundwater quality based on the Geographic Information System (GIS) through the Groundwater Quality Index (GQI) in an aquifer in southern India. They mention that this method is reliable for groundwater quality assessment and serves as a useful tool for decision-makers for efficient groundwater quality monitoring and management mainly in agricultural areas which have a great influence on groundwater recharge and quality.
In recent years, population growth and the increase of agricultural areas and indus-trial activities have intensified water demand, threatening the sustainable use of ground-water in the Cuernavaca aquifer. Despite this situation has been locally evidenced, no formal studies have been carried out to demonstrate the effect of these activities on groundwater resources. The novelty of this study lies in describing the hydrological and hydrochemical conditions of this aquifer to identify its vulnerability. The geohydrological features of the Cuernavaca aquifer are described using Gibb, Piper, and Schoeller diagrams. Groundwater quality evaluation is carried out based on time series analysis, water quality distribution maps, and water quality indices. This study performs a multivariate and correlation analysis to identify possible pollution sources and proposes better water management strategies for this aquifer.

2. Materials and Methods
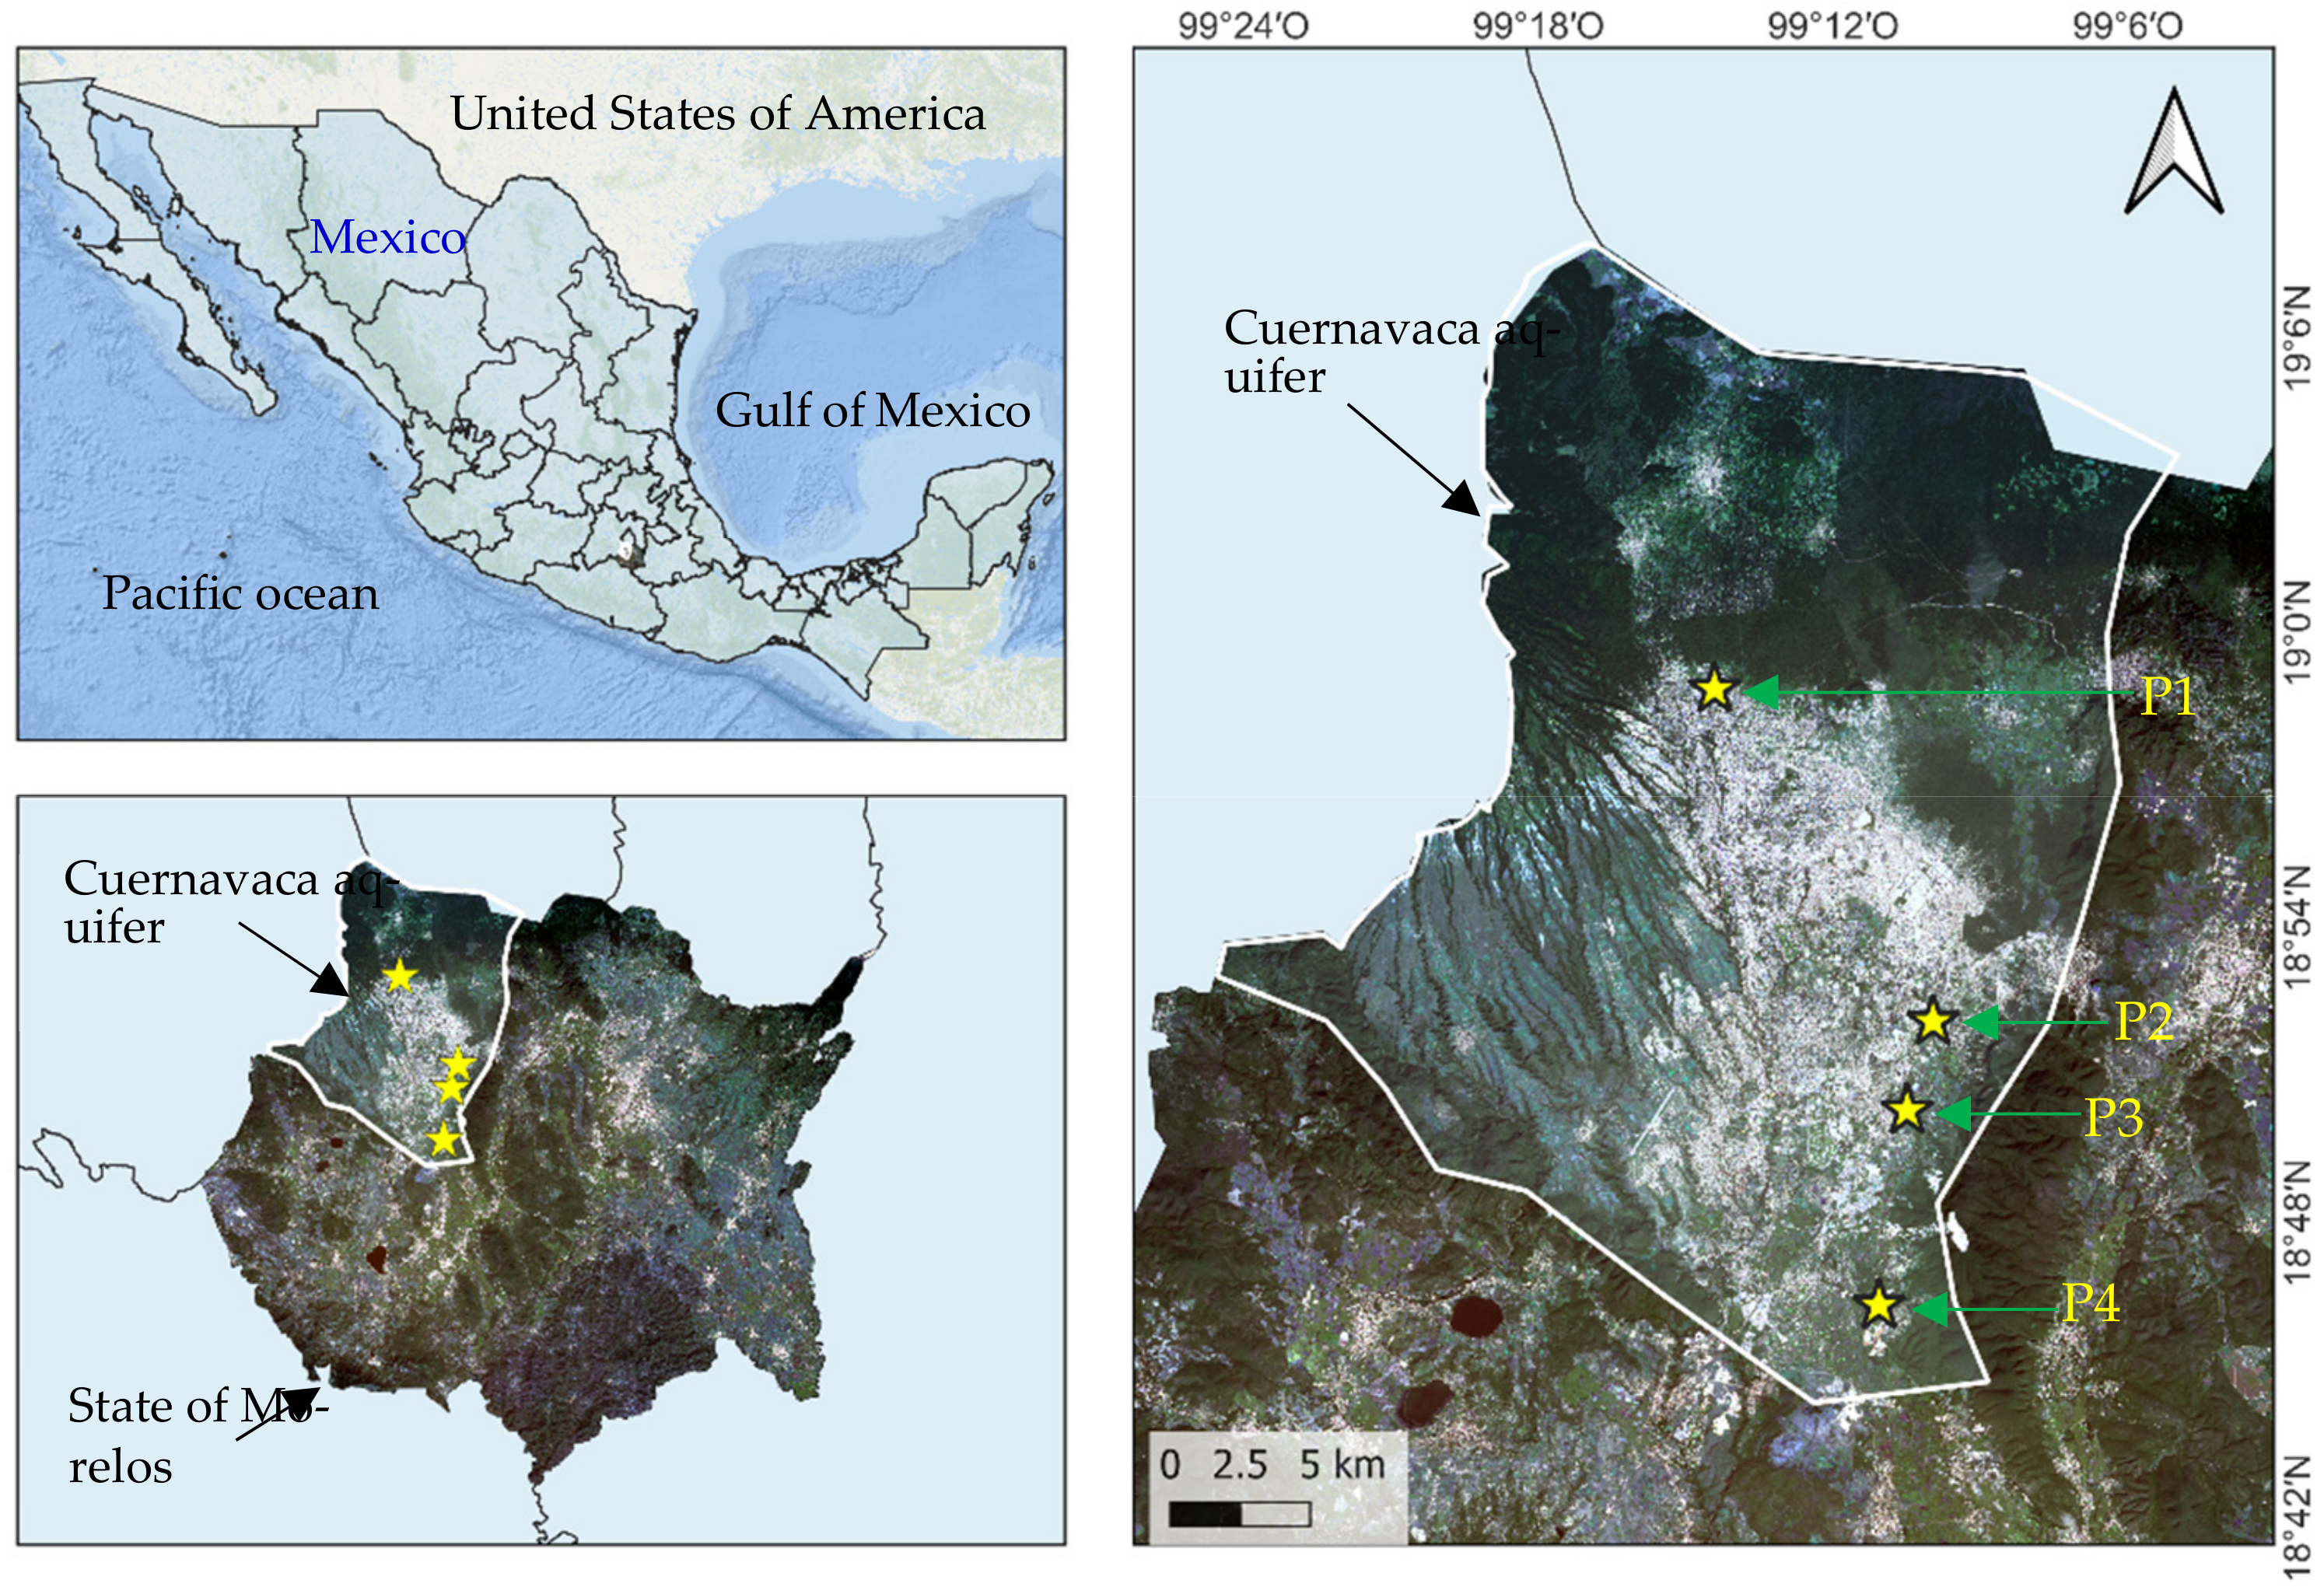
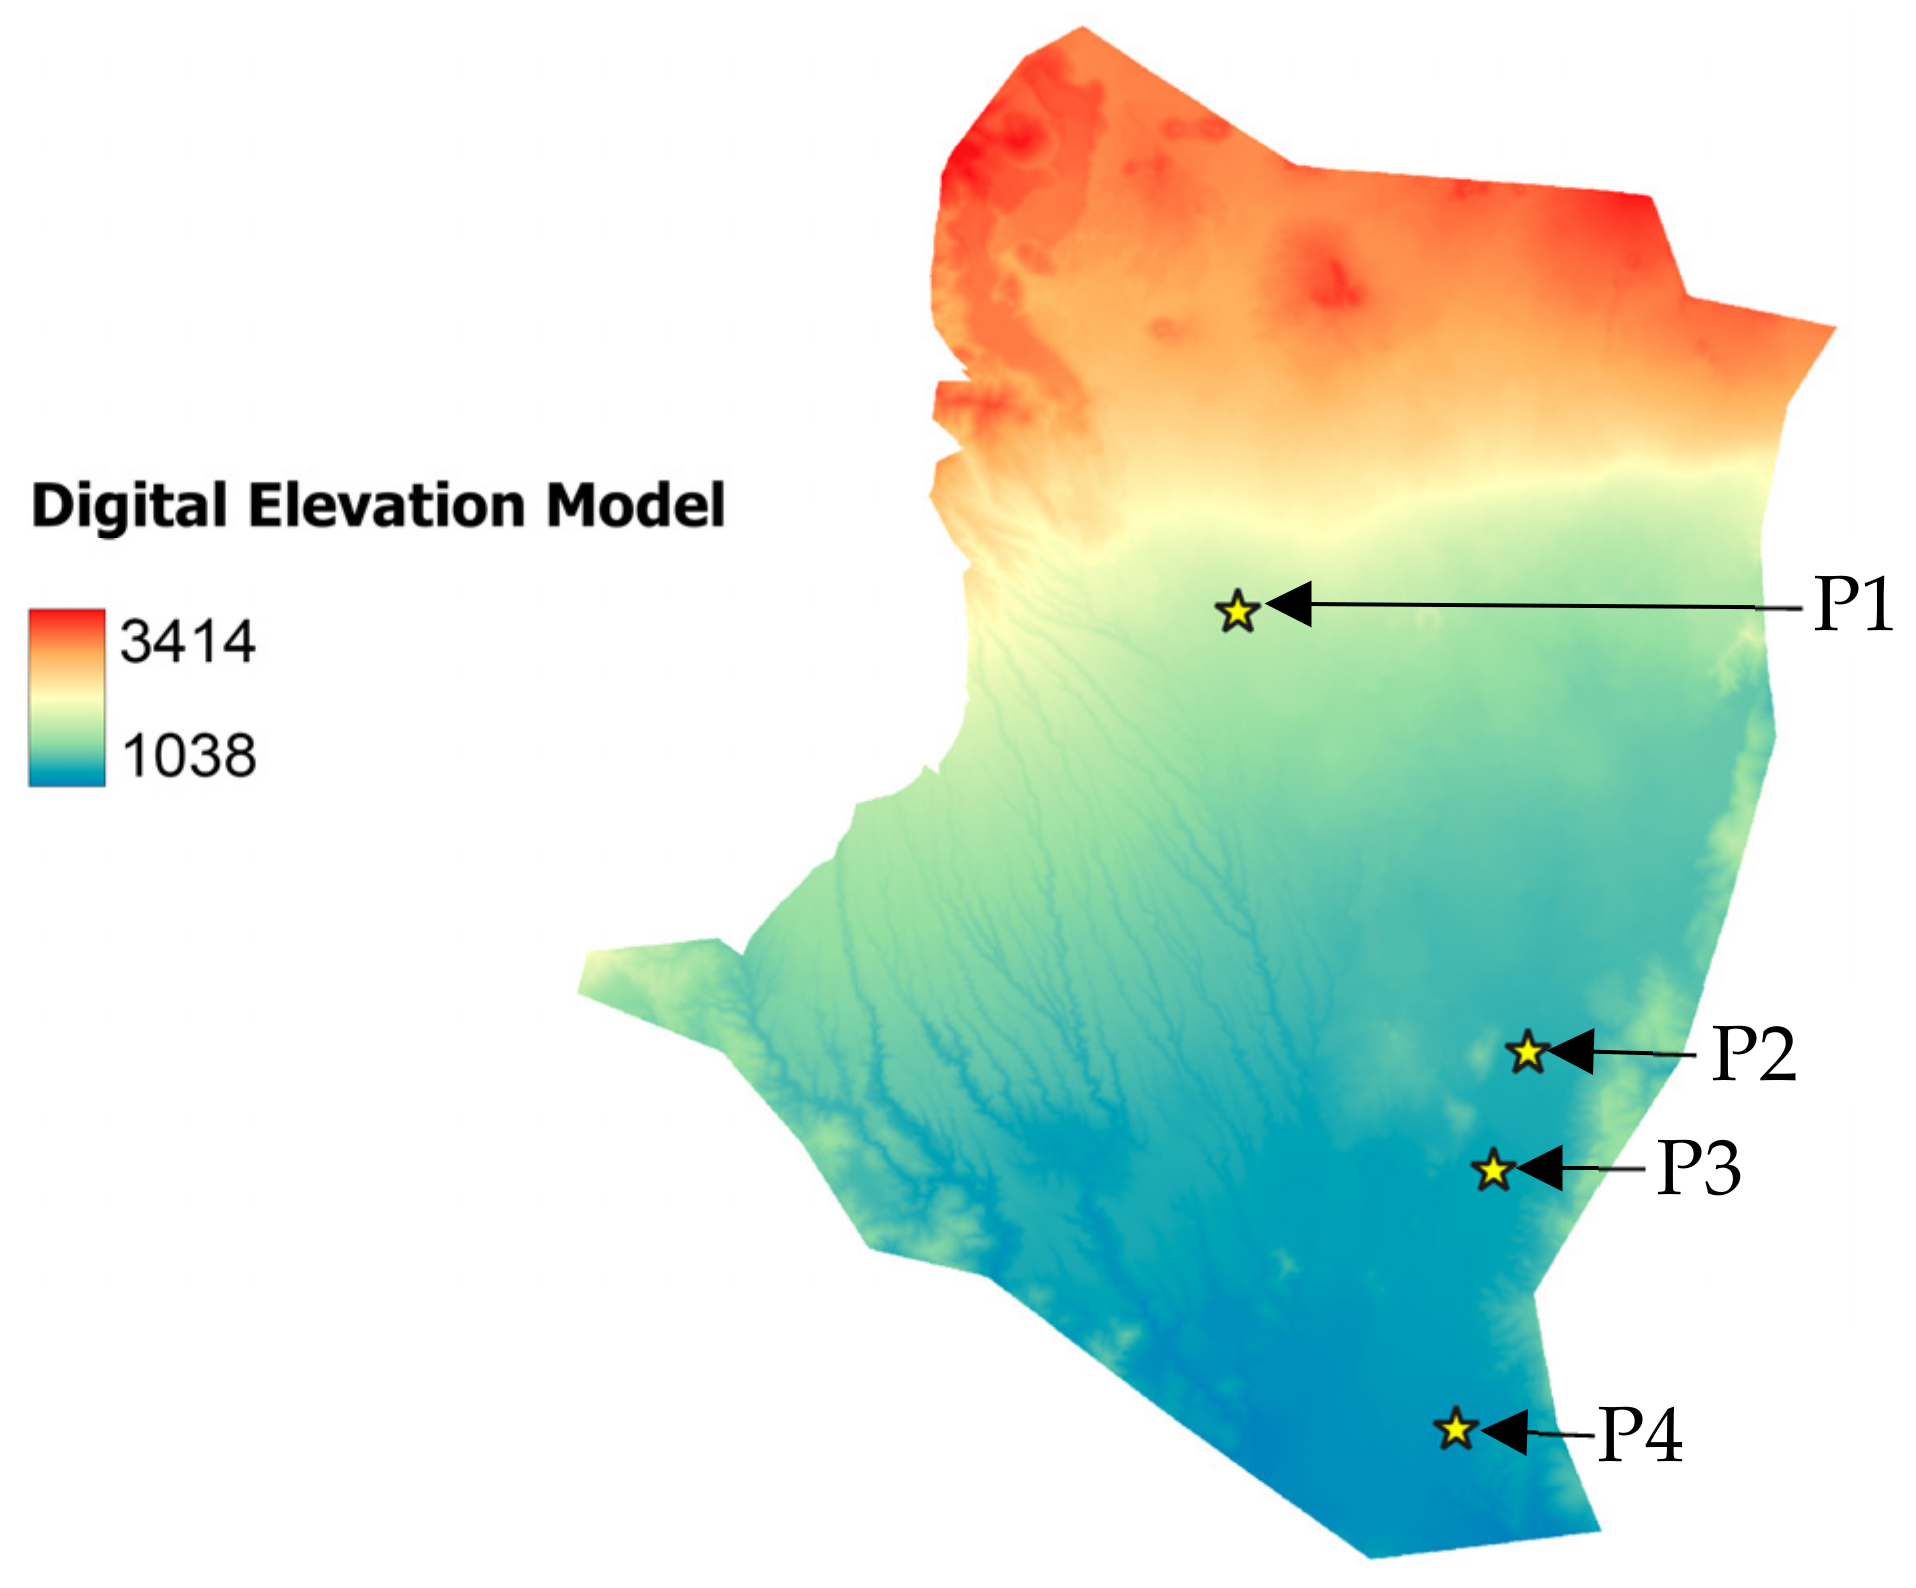
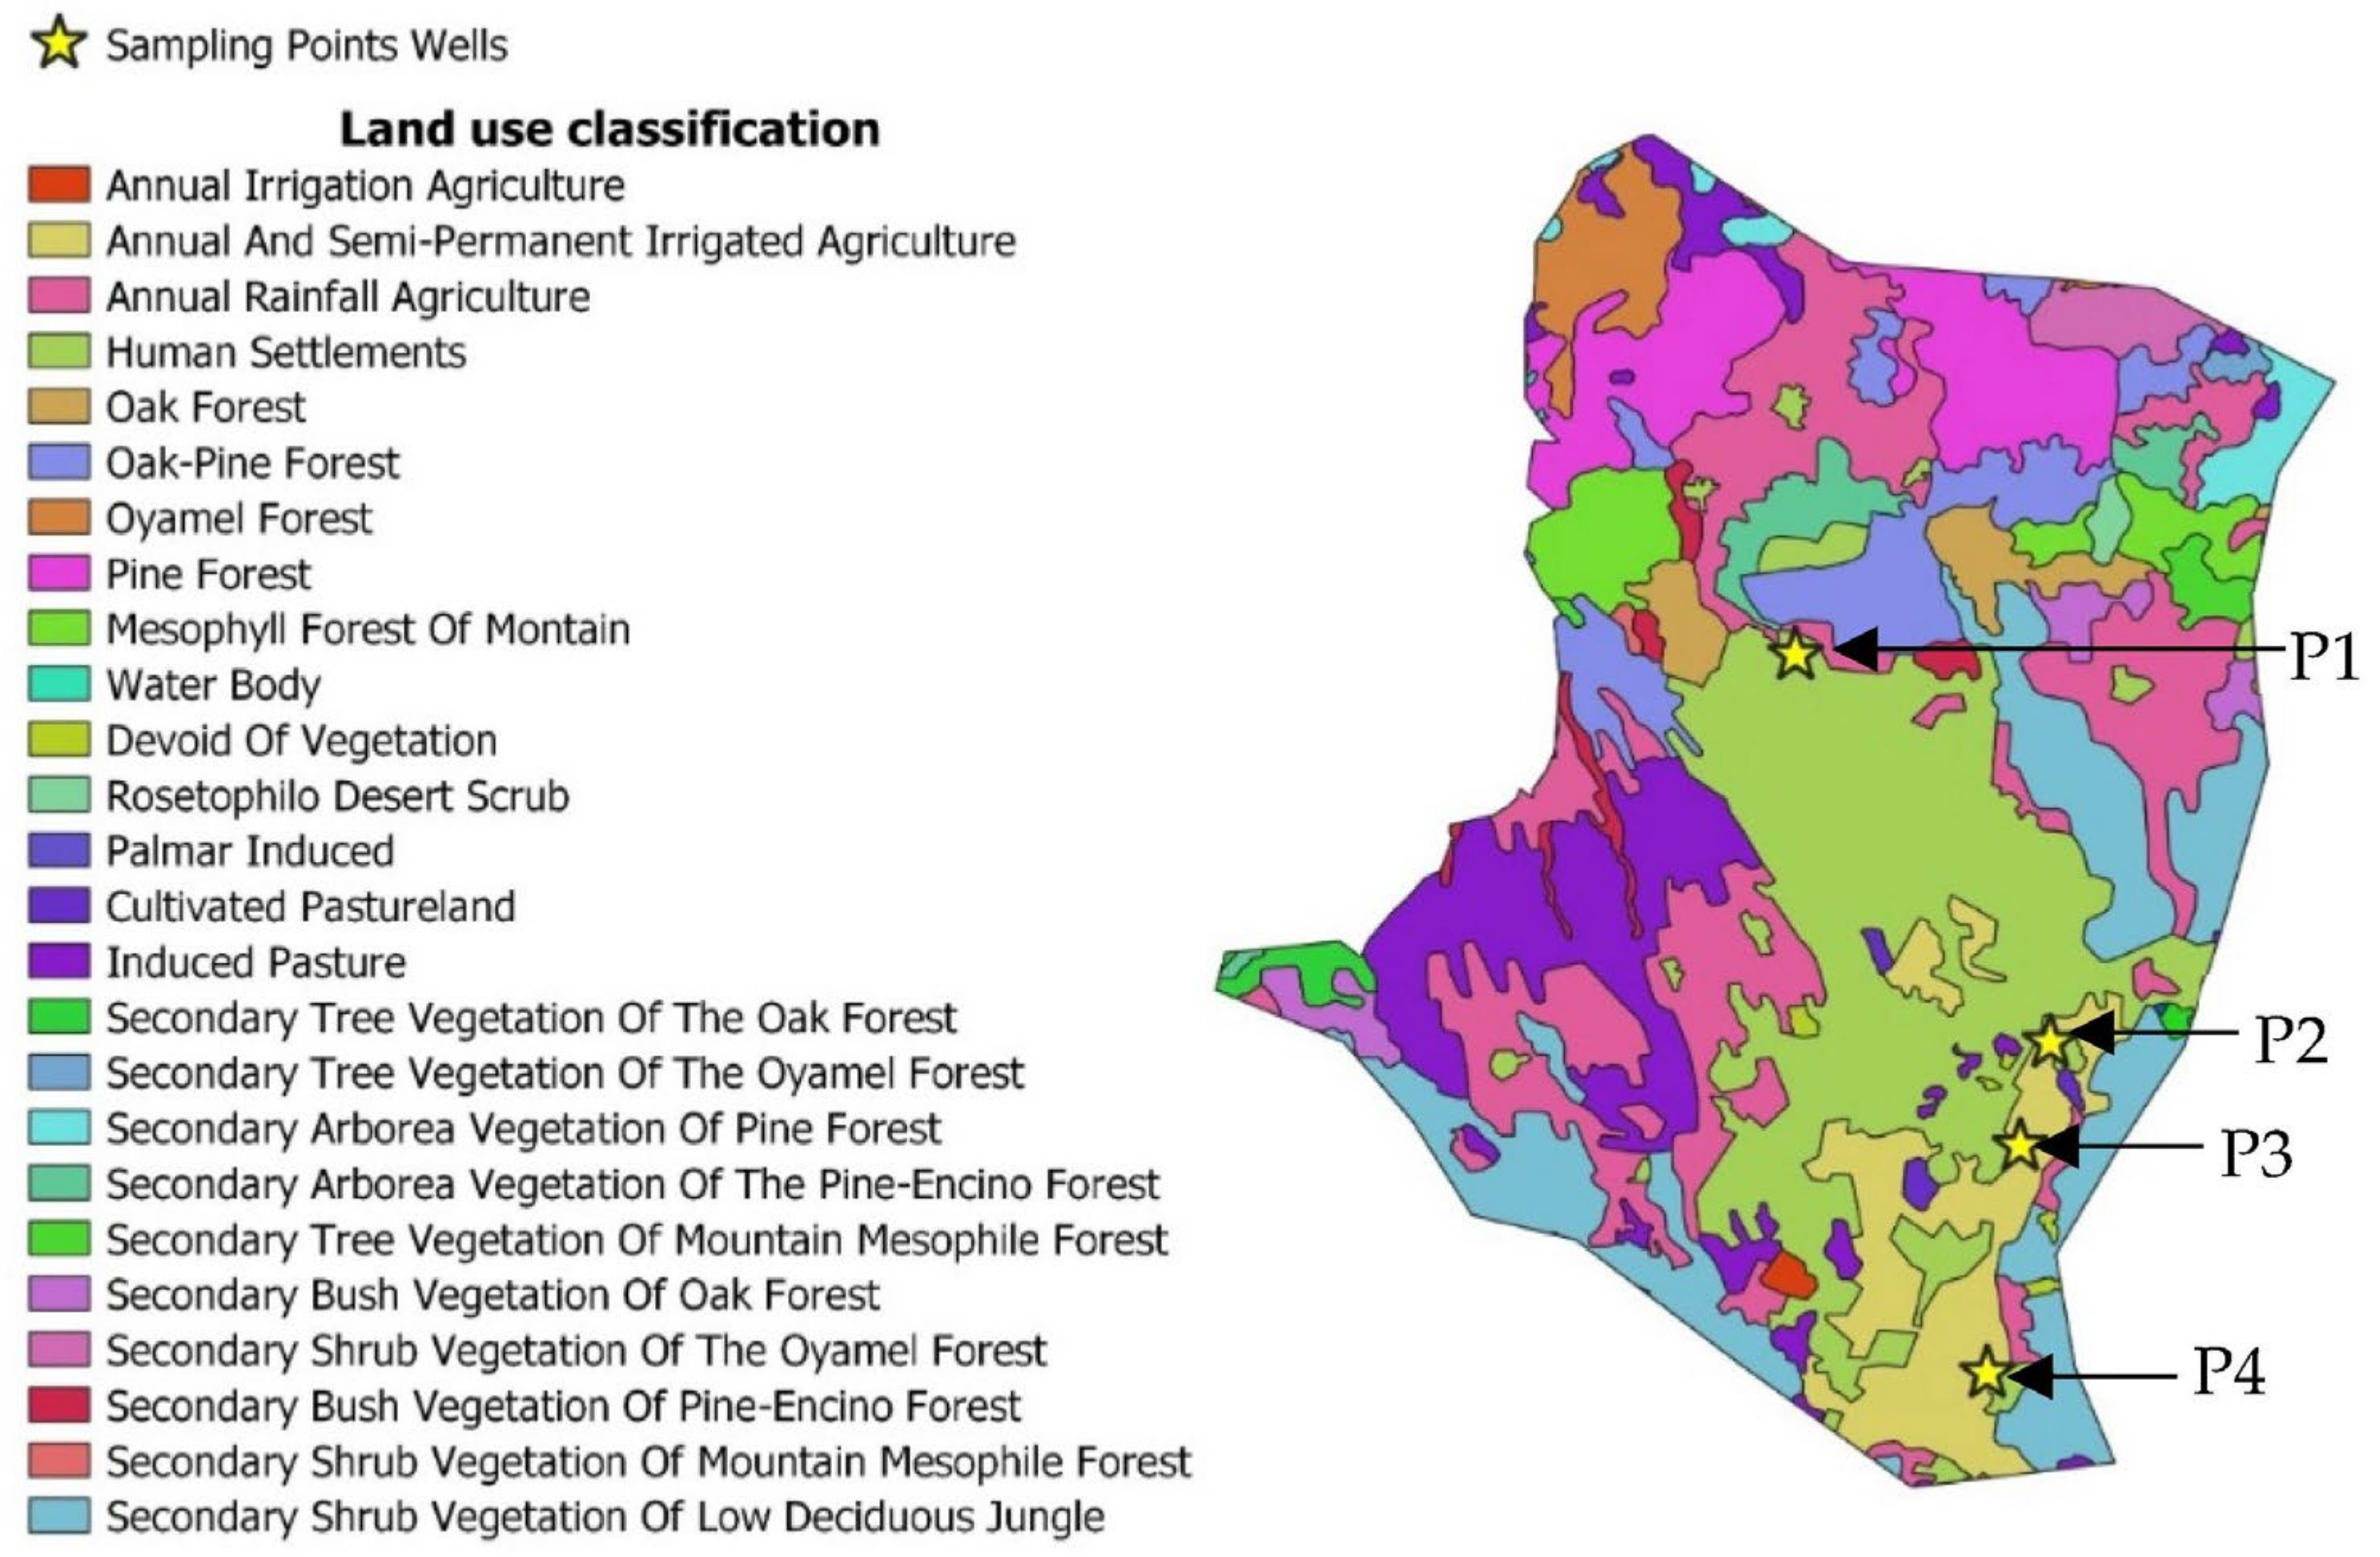
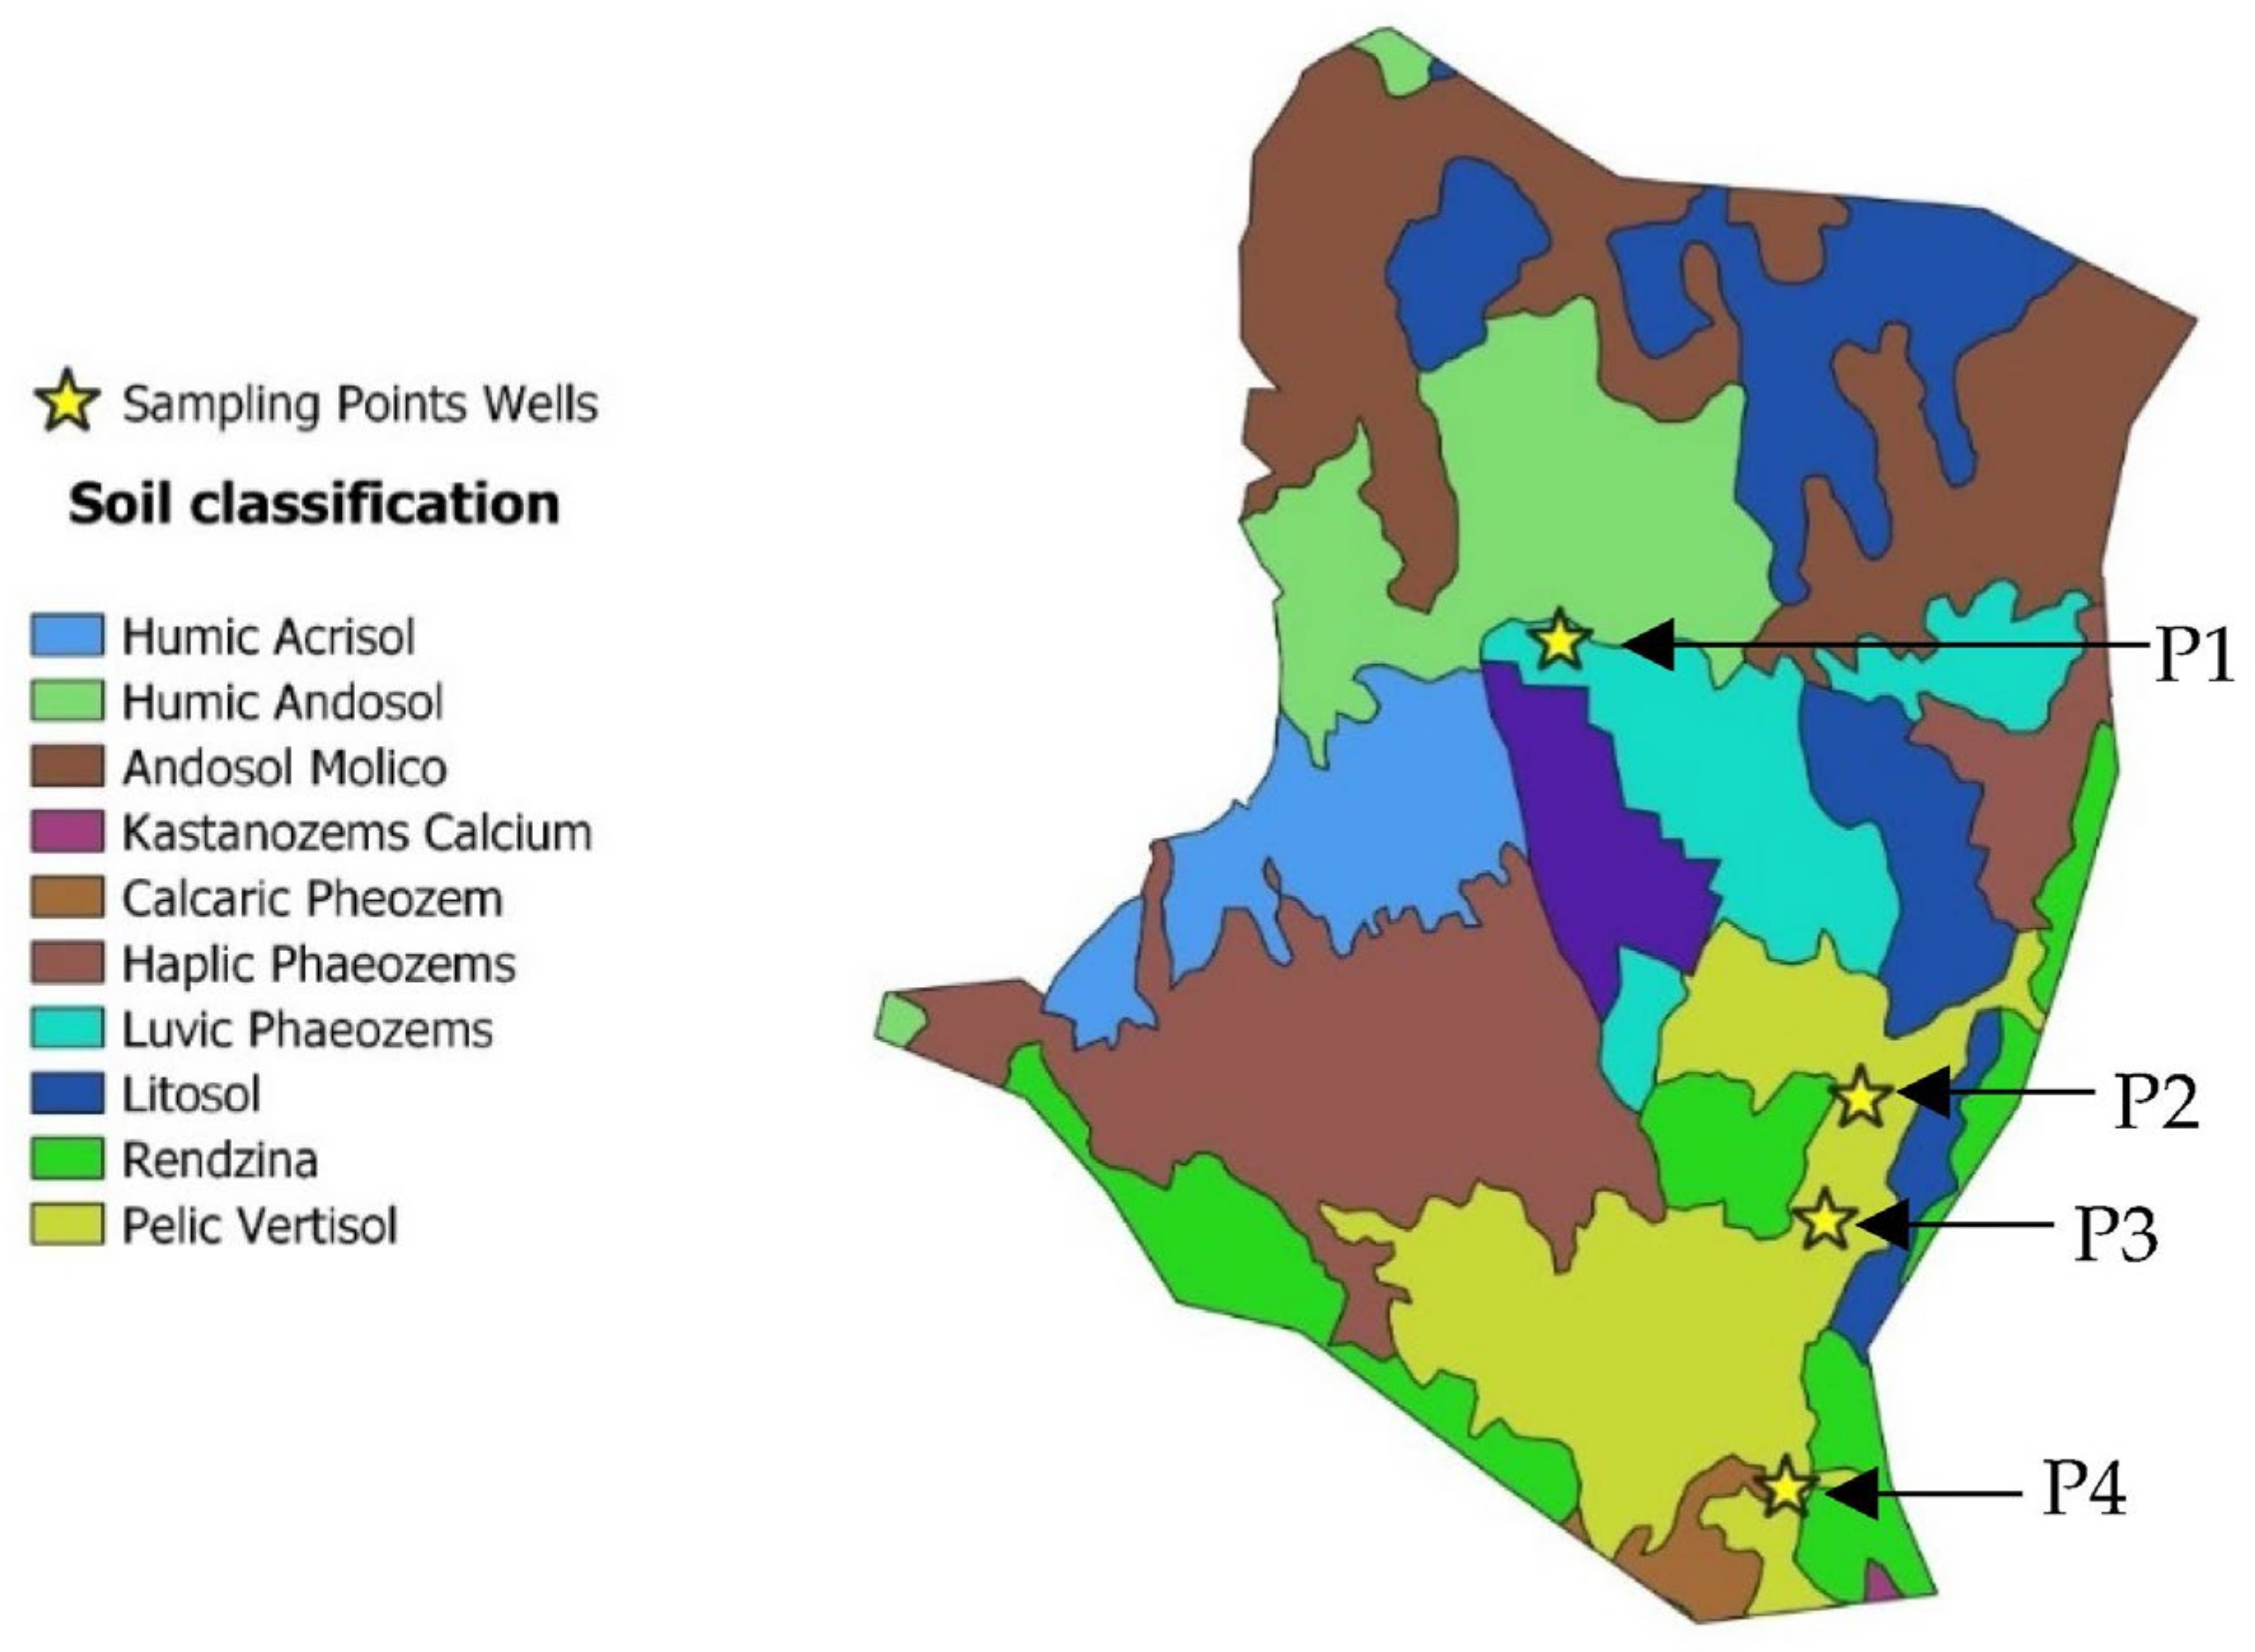
2.1. Study Area

The study area is in the state of Morelos, Mexico with an approximate area of 820 km2 (Figure 1). Mean annual precipitation, evapotranspiration, and air temperature are 1278 mm, 874.7 mm, and 19.4 °C, respectively. The highest rainfall values are observed from July to September, which corresponds to the summer season, and less significant precipitations are registered in winter from October to January mainly caused by cold fronts. The Cuernavaca aquifer is a free, heterogeneous, and anisotropic aquifer with surface geology that is represented by lithological units mainly of sedimentary and volcanic origin [20] and does not show any significant structural complications. The static water level of this aquifer varies from 20 to 100 m.

2.2. Data Collection

In Mexico, the National Water Commission (CONAGUA) is a federal agency responsible for monitoring, surveillance, and management of aquifers [21]. The analysis of the groundwater samples was carried out by an accredited laboratory [22] which applied a methodology based on the standard methods (APHA) [23]. The data used in this study were obtained by this federal agency. For economic and strategic reasons, four sampling wells were monitored, which were in sites with intense anthropogenic activity. These wells are used for water consumption. The extraction of groundwater for consumption purposes is carried out using pumping systems.
The hydrochemical and water quality parameters considered in this study were: bicarbonates (HCO3−), fecal coliforms (FC), total organic carbon (TOC), ammonium (NH3), nitrites (NO2−), nitrates (NO3−), organic nitrogen (ON), total nitrogen (TN), total phosphorus (TP), total dissolved solids (TDS), electrical conductivity (EC), pH, chlorides (Cl), fluorides (F), silicon oxides (SiO2), potassium (K+), manganese (Mn), sodium (Na+), sulfates (SO42−), calcium (Ca2+), magnesium (Mg2+), total hardness (TH), water temperature (WT).
Quality control (QC) and quality assurance (QA). The sampling wells were monitored by CONAGUA. An accredited laboratory carried out the analysis of 23 parameters sampled every six months in the 2012–2019 period. The water sampling was carried out according to Mexican regulations. Based on these regulations, chemical products of analytical grade were required for the preparation of the standard solutions and reagents. In addition, replicates were performed to ensure the reliability of the results and comply with quality control required by the General Directorate of Standards and the Federal Law on Metrology and Normalization.

2.3. Spatial and Temporal Assessment of Groundwater Quality

The spatial evaluation of the groundwater quality of the Cuernavaca aquifer was carried out through interpolation of the measured parameters as suggested by other studies [24,25]. The inverse distance weighting (IDW) interpolation method was used to describe the spatial distribution of the groundwater quality values through the study area by using the QGIS 3.18 software. The weights used in the IDW method were calculated according to the weighting strategy proposed by Bartier [25]. These weight values are determined based on the distance between the sampling points according to Equation (1).
z x , y = i = 1 n z i d x , y , i β i = 1 n d x , y , i β
where z x ,   y is the water quality parameter to be estimated; z i represent the measured value for the sampling point; d x ,   y ,   i is the distance between z x ,   y   and z i ; and β is a user-defined coefficient (the software default value of 2 was used for the β coefficient).
Temporal evaluation of groundwater quality was performed using time series analysis to determine possible groundwater quality temporal trends using biannual sampling data from 2012 to 2019. A temporal analysis was carried out by describing the groundwater quality variations over time. Finally, groundwater quality data were compared to World Health Organization (WHO) and local guidelines.

2.4. Water Quality Assessment

2.4.1. Drinking Water Quality Index

The drinking water quality index (DWQI) is frequently used to determine the suitability of groundwaters. In this study, the determination of DWQI was performed according to Equations (2)–(5) [14,26,27].
W i = w i i n w i
Q i = e i v i b i v i 100
S I = W i Q i
D W Q I = i = 1 n S I
where Wi is the relative weight; wi is the weight assigned to each parameter according to its relative importance for drinking water (the maximum weight of “5” has been assigned for the highest importance and the minimum weight of “2” for the lowest importance); “n” is the number of groundwater parameters; Qi: is the rating according to the distribution of the “ith” parameter. ei: is the concentration of each parameter; vi: is the optimum value of the parameter (“0” is considered as optimum value for all parameters, except pH which is “7”); bi is the guideline value [28] for each parameter; SI: is the sub-index of “ith” parameter. According to some researchers [14,29,30], the optimum values and weights for the parameters of the DWQI are: pH (bi = 8.5, wi = 4, Wi = 0.13), TDS (mg/L, bi = 500, wi = 4, Wi = 0.13), total hardness (mg/L, bi = 300, wi = 3, Wi = 0.10), calcium (mg/L, bi = 75, wi = 3, Wi = 0.10), magnesium (mg/L, bi = 30, wi = 3, Wi = 0.10), nitrates (mg/L, bi = 45, wi = 4, Wi = 0.13), chlorides (mg/L, bi = 250, wi = 2, Wi = 0.06), sulfates (mg/L, bi = 200, wi = 2, Wi = 0.06), fluorides (mg/L, bi = 1, wi = 4, Wi = 0.13), and total alkalinity (mg/L, bi = 200, wi = 2, Wi = 0.06). Based on the results of Equation (4), the aquifer water was then classified into different categories: DWQI < 50 (excellent), DWQI = 50–100 (good), DWQI = 100–150 (moderate), DWQI = 150–200 (poor) and DWQI ≥ 200 (extremely poor).

2.4.2. Hydrochemical Characteristics

The chemical composition of groundwater is highly variable. Hence, the hydrochemical classification and groundwater chemical composition evolution were determined by using the Gibb, Piper, and Schoeller plots [15,31]. Then, the suitability of the groundwater for irrigation was evaluated by using the groundwater indices shown in Table 1.

2.4.3. Multivariate Statistical Analysis

Multivariate statistical techniques such as Pearson correlation and hierarchical cluster analysis (HCA) were used to figure out the relationship between the water quality variables. This multivariate statistical analysis was used to identify the factors and possible sources that could explain the behavior of the groundwater quality of the aquifer [32,33,34,35]. In addition, a dendrogram was performed using the ward conglomeration method with a Euclidean distance metric [7,15].

3. Results and Discussion

3.1. Descriptive Analysis of Groundwater Quality Parameters

The total dissolved solids reflect the behavior of the salt concentration of the aquifer. These solids were found in a range of 75–688 mg/L and a mean value of 316 mg/L was registered. This value is low compared to that reported by Tefera et al. [31], who found concentrations up to 2777.6 mg/L. According to WHO [28], groundwaters with TDS values higher than 500 mg/L could be considered unsuitable for drinking water supply. The total hardness was found in a range of 24.6–456.8 mg/L. However, the mean value (179.2 mg/L) is below the concentration of 300 mg/L suggested by WHO [28] for drinking water. This value is also below the total hardness found by Kumar et al. [8], who presented concentrations greater than 292 mg/L in an unconfined aquifer located in the Central Ganga Basin, India.
The electrical conductivity of the Cuernavaca aquifer was between 90 and 991 µS/cm with a mean conductivity of 409.8 µS/cm. A high variation of electrical conductivity was observed in this aquifer, where the lowest conductivity values were found in sampling well one. Anthropogenic activities, such as agriculture, and rainwater filtration could be the reason for this variation. Jama et al. [38] presented concentrations up to 11,950 µS/cm in the unconfined Doukkala Aquifer located in a large agricultural region in Morocco. The groundwater of the Cuernavaca aquifer is slightly alkaline since its pH is in the range of 6.2–8.4 (the water is considered alkaline when pH > 8 and acidic when pH < 6). This pH range is within the drinking water standards of the WHO (6.5–8.5).
Nitrogen and phosphorus were below the permissible limits proposed by local standards. The TN and TP concentrations found were between 0.012–7.02 and 0.001–0.39 mg/L, respectively. Nitrogen concentrations are not usually frequent in natural soils, they occur due to the contact of the soil cover with nitrated fertilizers, animal waste, domestic effluents, and septic tanks [14]. The total organic carbon was found in a range of 0.07–2.57 mg/L. The presence of organic matter in the Cuernavaca aquifer could be related to the infiltration of the organic matter produced naturally by plants and animals due to excretion and decomposition. This situation is corroborated since fecal coliforms were found in the aquifer, with a mean value of 276.6 CFU/100 mL. The presence of fecal coliforms in groundwater could indicate pollution from anthropogenic sources since the sampling wells are in an urban area with a large population. Table 2 presents the mean values of the water quality parameters measured in the Cuernavaca aquifer from 2012 to 2019.
The concentrations of some mineral compounds such as calcium and magnesium cause the precipitation of these salts. In the Cuernavaca aquifer, calcium was found in concentrations from 3.88 to 121.1 mg/L and a mean value of 41.9 mg/L, while magnesium was found from 3.8 to 50.5 mg/L with a mean value of 19.2 mg/L. The presence of concentrations of these salts (Mg2+ and Ca2+) is due to the geological features of the aquifer. Sodium and potassium were found in a range of 1.92–37.5 and 1.3–6.6 respectively. The mean values for all major cations were within the maximum permissible limit [28].
Bicarbonates were within a range of 48.4–295 mg/L and a mean value of 145.1 mg/L was calculated. It is noteworthy that carbonates were not found in the samples. Sulfates in the Cuernavaca aquifer are between 0.8 and 136 mg/L, which are below the SO42− concentrations reported in other studies [39] and the guidelines recommended by the WHO [28]. Moreover, the chlorides presented a concentration between 8.4 and 78.2 mg/L, while nitrates showed a maximum concentration up to 6.2 mg/L, with a mean value of 3.2 mg/L. Both anions’ mean values were also below the WHO maximum allowable values. Adimalla and Qian [14] suggest that nitrates could be found in groundwaters due to anthropogenic activity. They reported NO3 concentrations up to 198.17 mg/L in groundwater under the influence of agriculture activities in Nanganur, India. In this study, a high variation in NO3 concentrations was found between sampling sites, where the highest concentration was found in sampling site 2. Cadmium, chromium, mercury, lead, zinc, and arsenic were also analyzed in this study; however, the concentrations found could be negligible because low concentrations were observed (cadmium < 0.0002 mg/L; chromium < 0.00088 mg/L; mercury < 0.00009 mg/L, lead < 0.00154 mg/L, zinc < 0.002 mg/L and arsenic < 0.00139 mg/L). According to these results, the influence of geogenic sources was evidenced, where leaching and weathering of rocks and the use of pesticides and fertilizers could be recognized as the main driving factors for the hydrochemical and water quality of the aquifer.

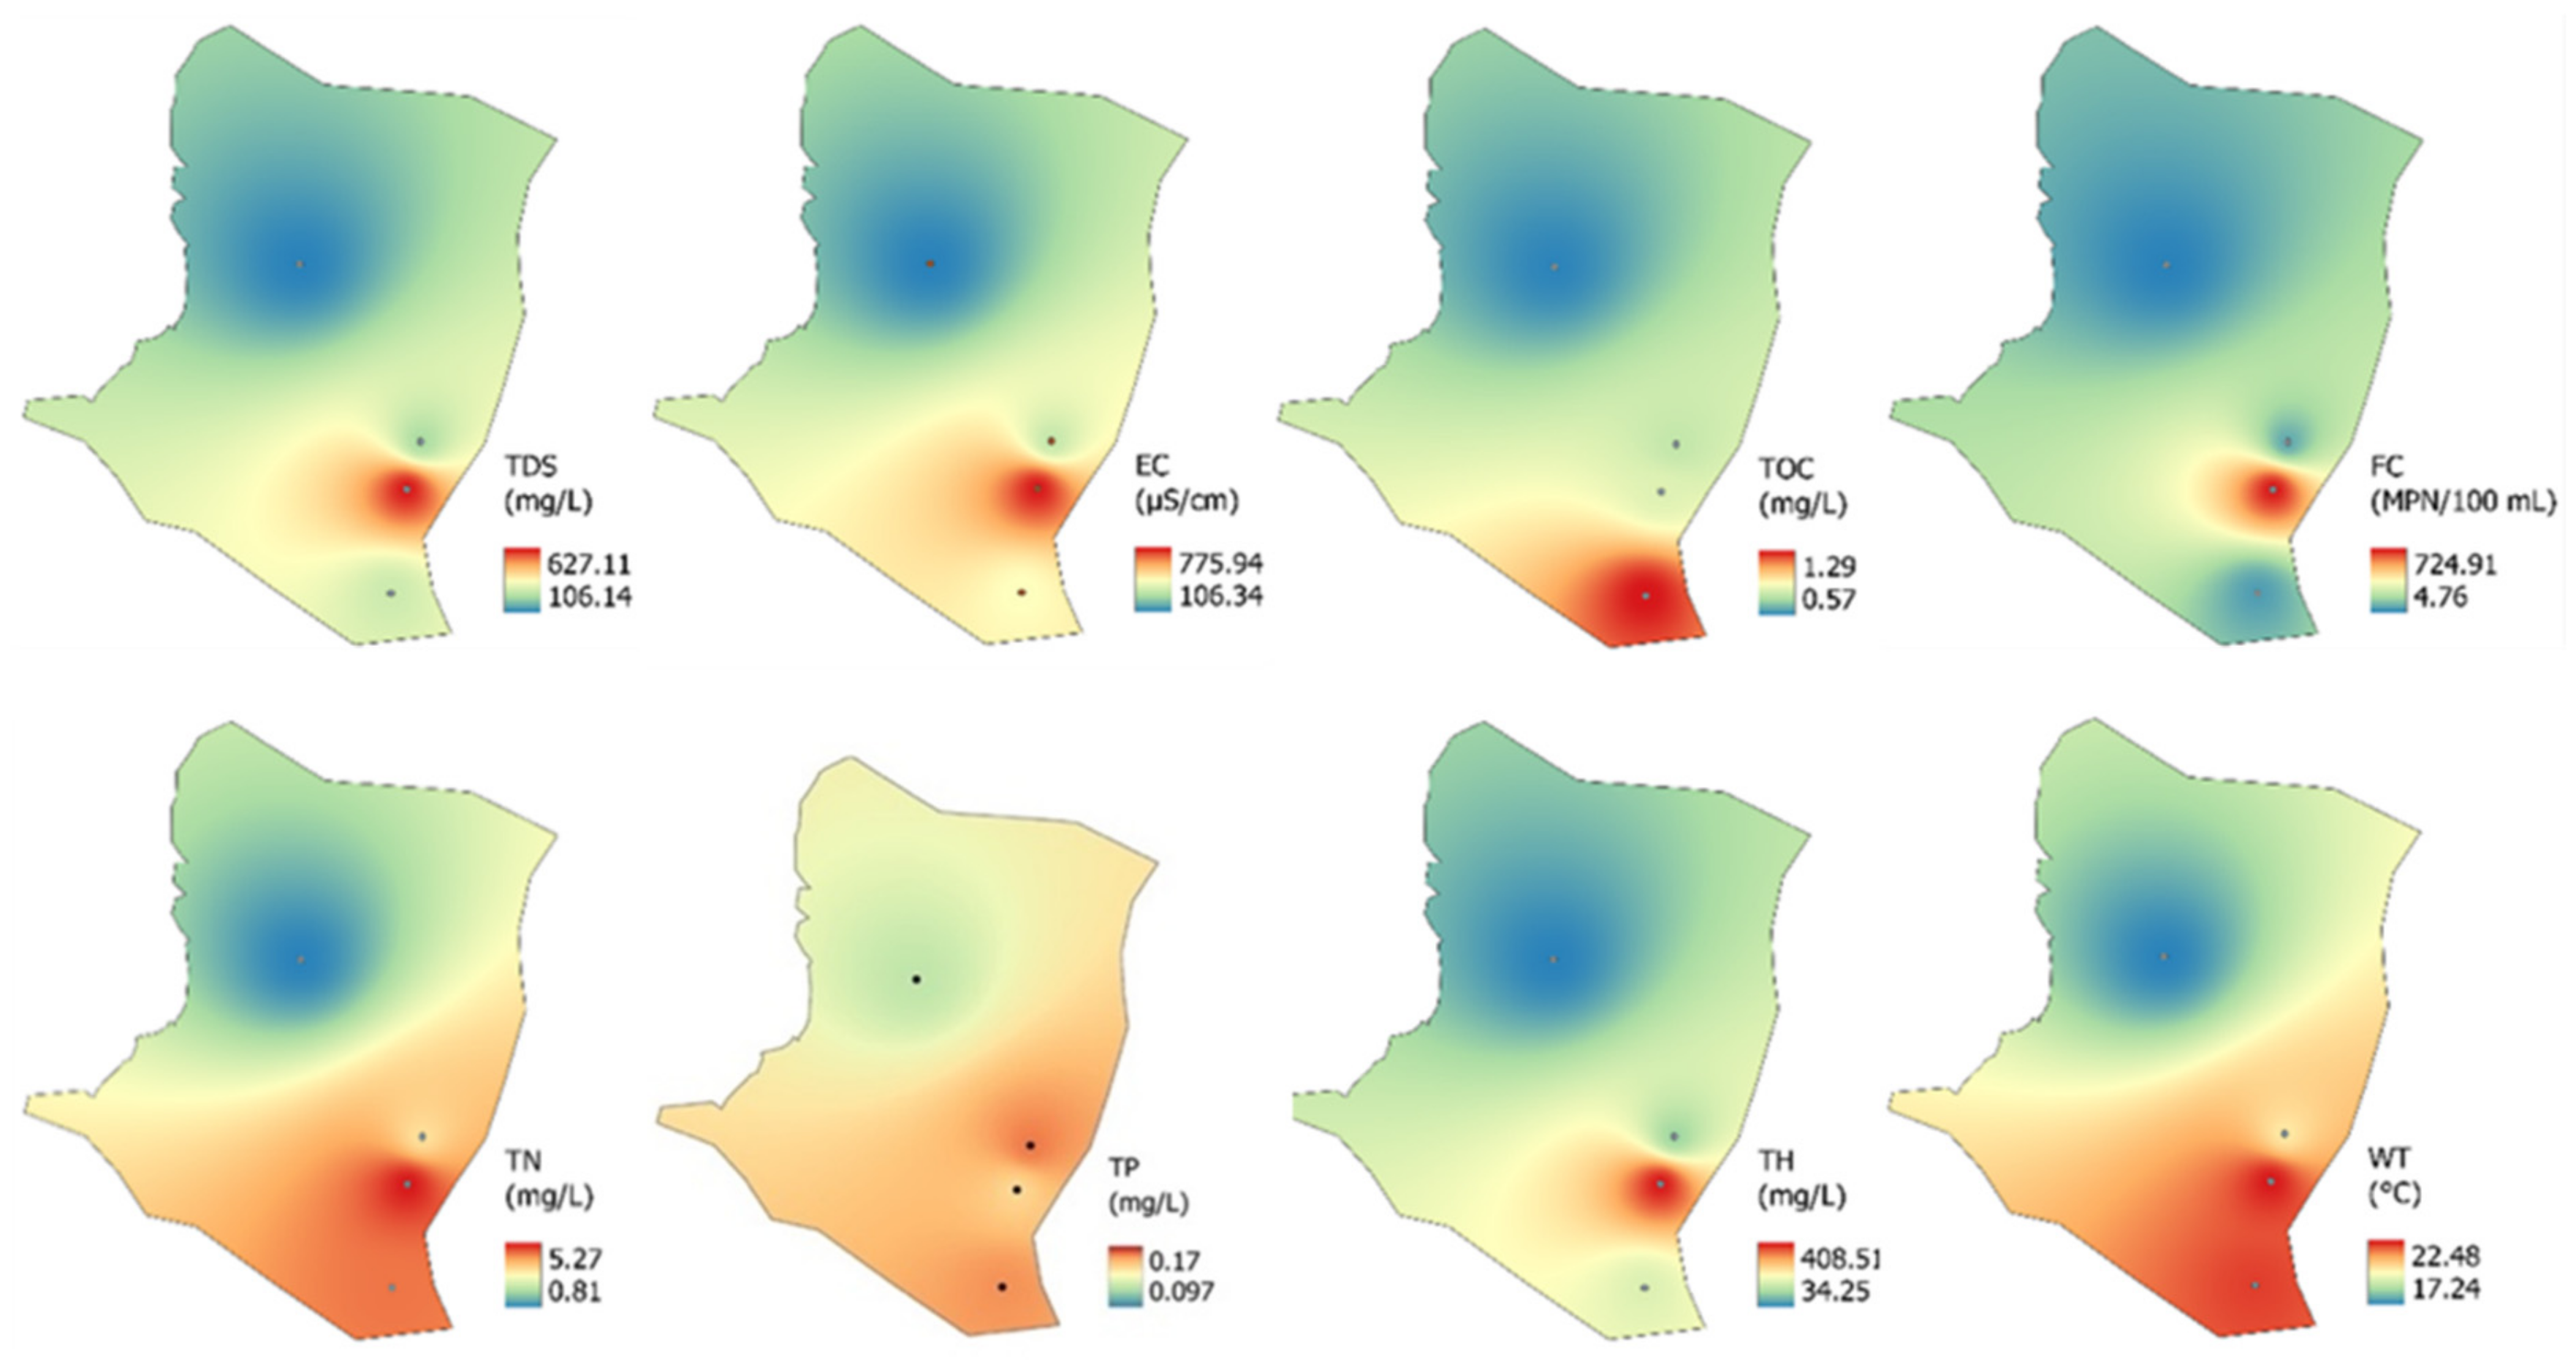
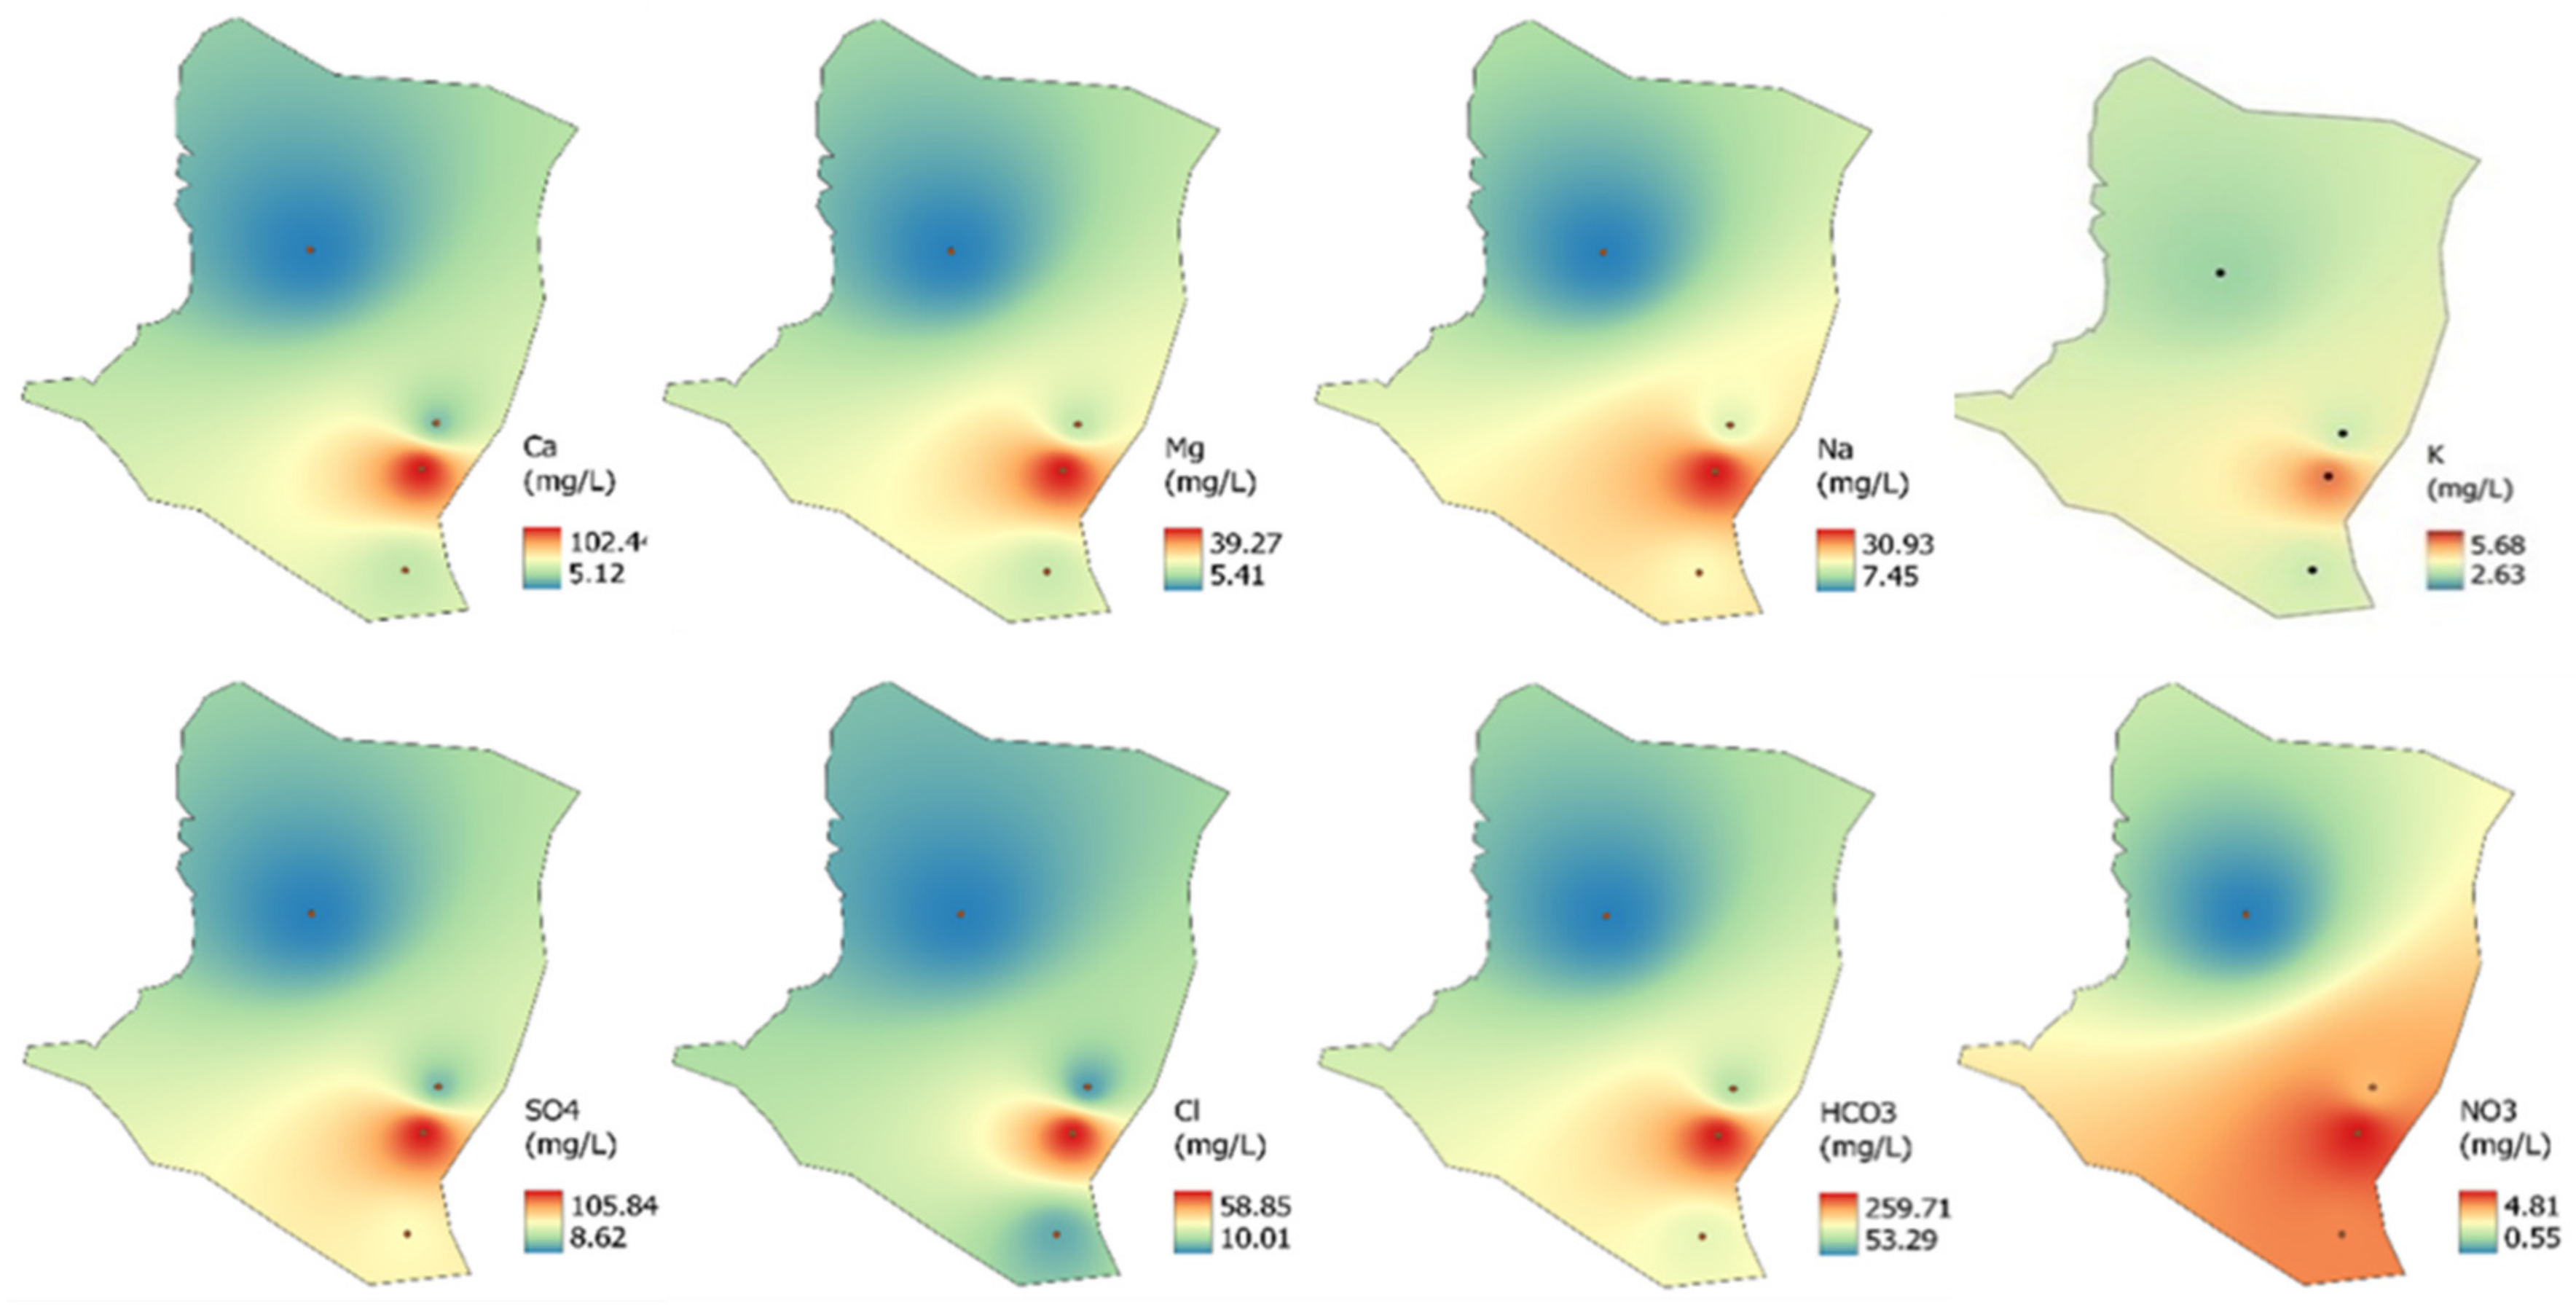
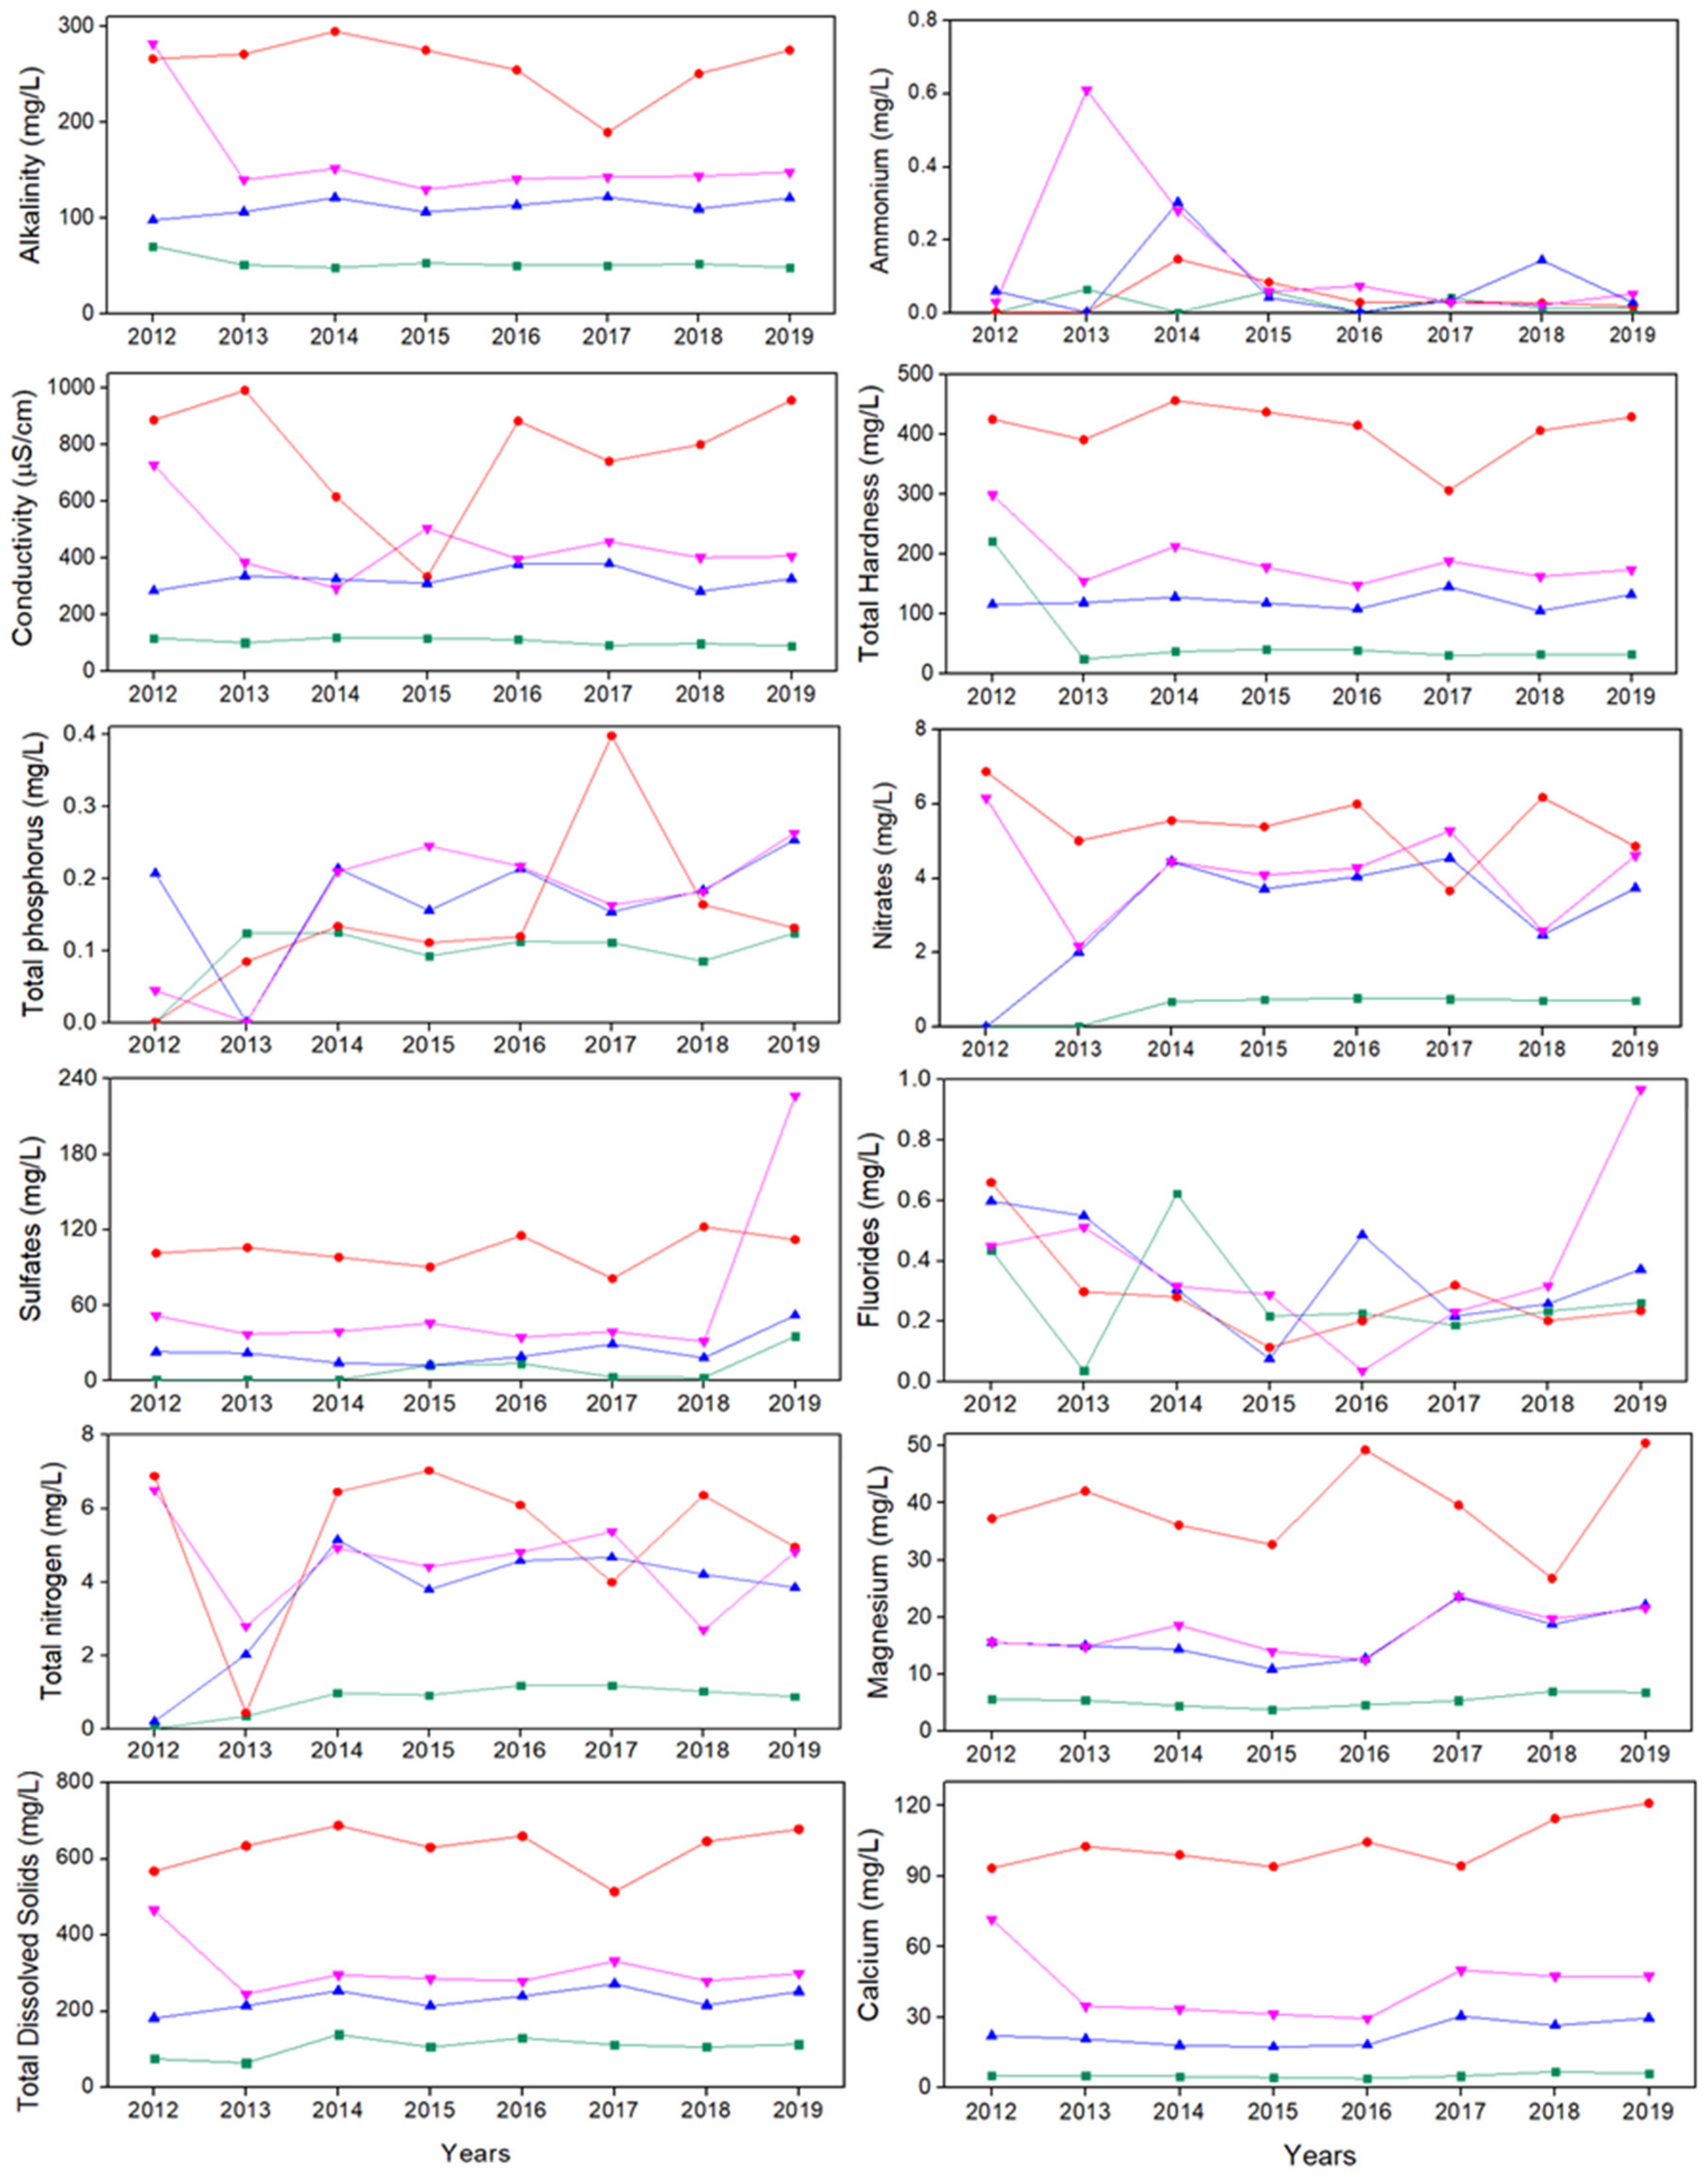
3.2. Spatial and Temporal Variations of Measuring Indicators

A total of 23 water quality parameters were analyzed at four sampling wells. These sampling wells are located within the urban area of the city of Cuernavaca, which has different elevations as shown in Figure 2.
The land use and soil classifications in the study area are shown in Figure 3 and Figure 4, respectively. These figures demonstrate that P1 is in a wooded area with little human settlement, close to the annual rainfed agricultural area. The dominant soil type in this area is Luvic phaeozem which is characterized by organic matter and scarce carbonates. This sample site is next to an oak-pine forest land-use zone. Sample sites P2, P3, and P4 have similar characteristics because they are in irrigated agricultural areas close to the urban area. These sites are in a Pelic vertisol soil characterized by high mineral content.
Figure 5 presents the spatial interpolation of the water quality parameters in the Cuernavaca aquifer. The highest values for all the parameters analyzed were observed in sampling point two (P2), while sampling point one (P1) presented the lowest values. This situation could be related to the soil type in the area. Since the highest elevation is observed in P1, the rest of the sample points located in lower elevation areas could be influenced by the erosion, transport, and deposition of contaminants.
Figure 6 presents the spatial behavior of the major ions. The presence of ions in the sampling wells is due to interactions with the geological material of the aquifer, natural processes of rock dissolution, and ion leaching. This figure shows that higher concentrations of ions were found at the P2. At this site, groundwater is not suitable for domestic use according to WHO [28] guidelines. The spatial distribution of these chemical elements highlights the vulnerability of the aquifer, especially at P2. Since the concentrations of ions at P1, P3, and P4 sites are similar, they could be considered reference values for the major ions in the Cuernavaca aquifer. It is noteworthy that the concentration of ions in all the groundwater samples was found to be within the WHO desirable limits for agricultural irrigation [6,28].
Figure 7 presents the temporal variation of the water quality parameters from 2012 to 2019. No trends, seasonal or cyclic patterns were found in the groundwater quality data. The time series also demonstrated that P2 showed higher values in almost all parameters. Lower concentrations of the physicochemical and major ions are observed at P1 since this site is at a higher elevation where the runoff of anthropogenic contaminants is significantly low. Similar values are presented by Adimalla et al. [14], who evaluated the groundwater of Nanganur county in India. Based on these results, they consider that groundwater quality does not represent health risks for drinking water use and only recommend groundwater defluoridation.
Table 3 presents the ANOVA statistical analysis of the groundwater quality parameters. This table showed that 15 parameters had a statistically significant variation from a spatial point of view. However, only 4 groundwater quality parameters showed a temporal significant variation.

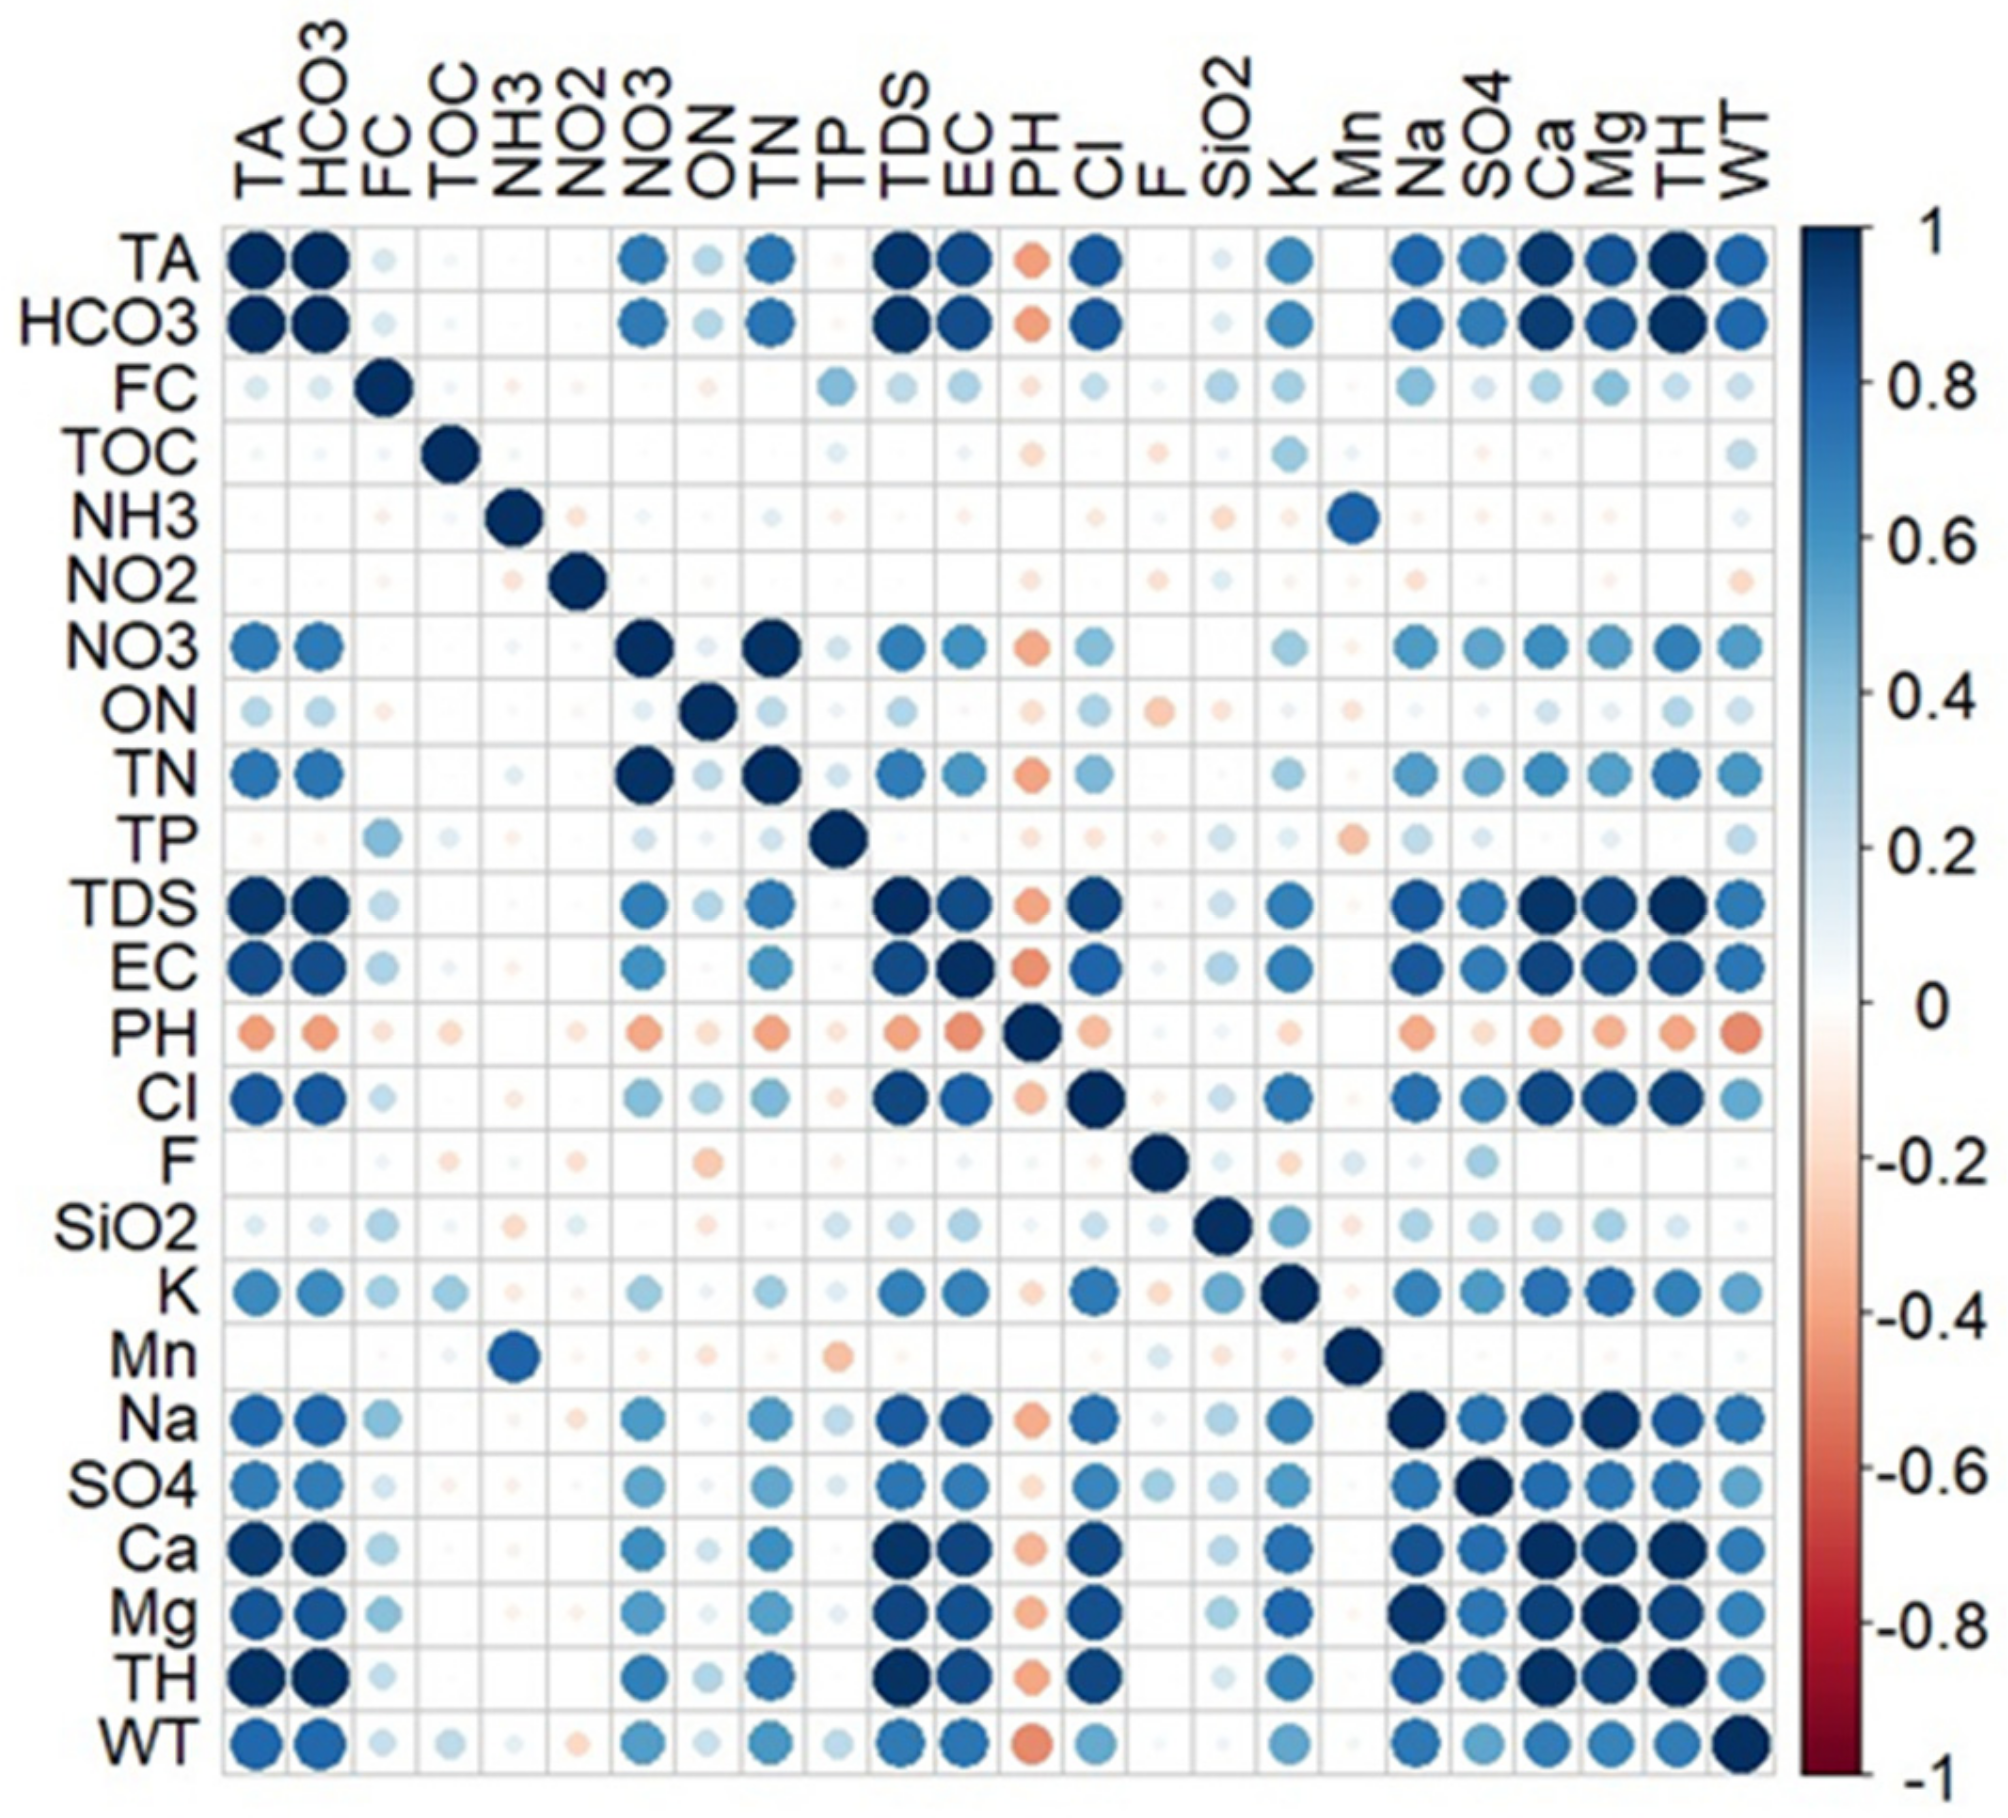
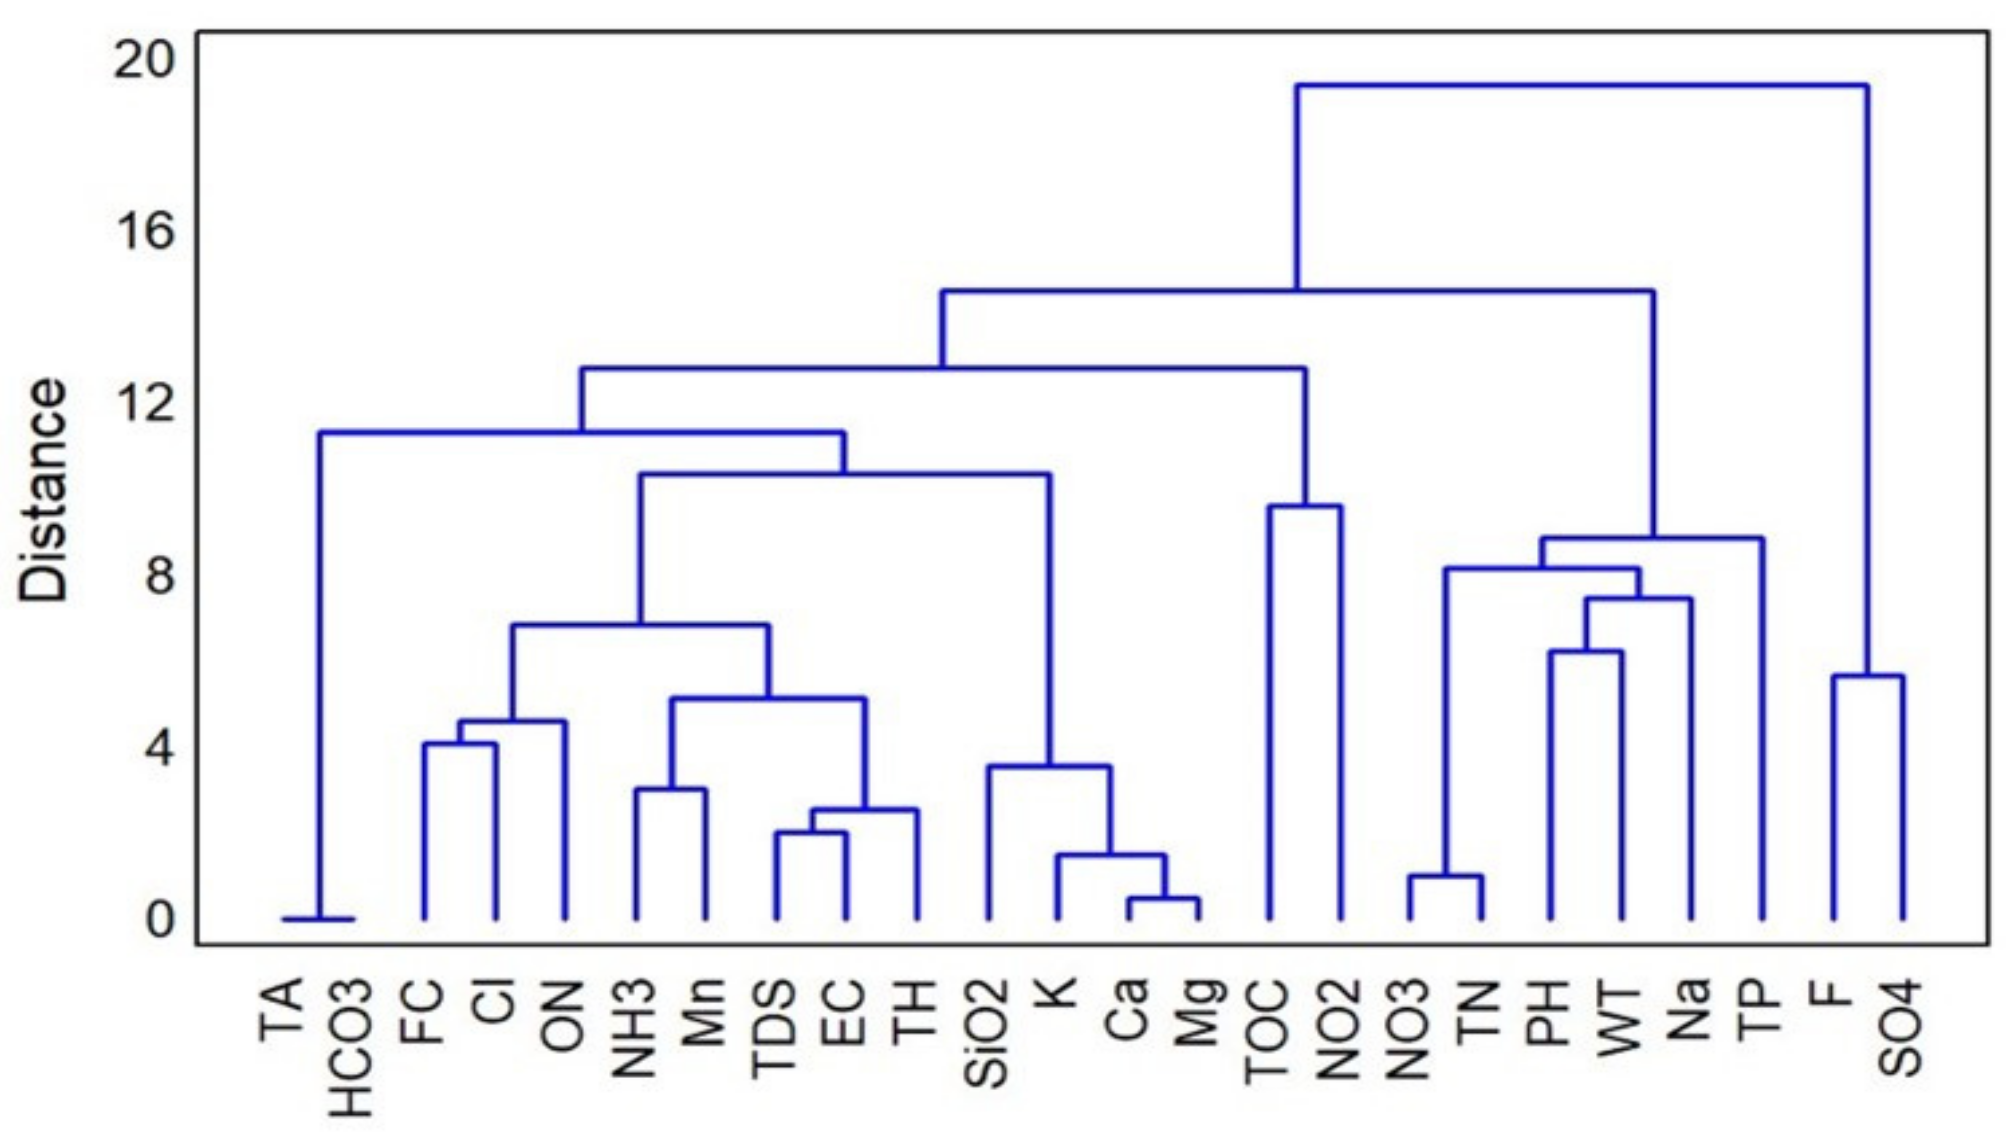
3.3. Multivariate Statistical Analysis

Figure 8 shows the Pearson correlations between the groundwater quality parameters. Pearson correlation coefficient (r) ranges from −1 to +1 and measures the strength of the linear relationship between parameters [9]. A high negative correlation is found when r is close to −1 but r values close to +1 indicate a high positive correlation. A Pearson correlation (r) close to 0 indicates that there is no linear relationship between the two variables.
Nitrates presented the highest number of correlations with other parameters. This parameter is correlated with TN, TDS, EC, PH, Cl, K+, Na+, SO4, Ca2+, Mg2+, TH, and WT. TA is related to HCO3, NO3, TN, TDS, EC, Cl, Na+, Ca2+, Mg2+, TH, and WT. Bicarbonates showed a high correlation with NO3, TN, TDS, EC, Cl, Na+, Ca2+, Mg2+, TH, and WT. Total nitrogen is associated with TDS, EC, Na+, SO42−, Ca2+, Mg2+, TH, and WT. Total dissolved solids are highly related to ions, TH, EC, and WT. The electrical conductivity attributes a higher correlation with Cl, K+, Na+, SO42−, Ca2+, Mg2+, TH, and WT. Chlorides are significantly related to K+, Na+, SO42−, Ca2+, Mg2+, and TH. Potassium is related to other ions such as Na+, SO4, Ca2+, Mg2+, and TH. In turn, sodium is related to SO42−, Ca2+, Mg2+, and TH). Sulfates are related to Ca2+, Mg2+, and TH, and calcium shows a correlation with Mg and TH. This method has been used for the evaluation of groundwater quality. Strong correlations between major ions are also reported by Miao et al. [40]. This situation evidenced that the groundwater quality of a coastal city in China was affected by various factors, such as dissolution and water evaporation.
Since a high amount of groundwater quality parameters were correlated with each other, a hierarchical cluster analysis was carried out (Figure 9). Hierarchical cluster analysis was used to further unearth the main chemical processes controlling groundwater chemistry in the aquifer [15,34]. This analysis included the 23 analyzed parameters and 34 water samples at different times of the year. The dendrogram formed the main cluster which in turn formed two groups. The first group includes only fluorides and sulfates. The second main group is composed of the rest of the water quality analyzed parameters. Several subgroups are evidenced, such as those formed by TDS, EC, and TH, TA, and HCO3, and SiO2, K, Ca2+, and Mg2+. These results corroborated the relationship between the observed parameters in the Pearson correlations. The relationship between the groundwater parameters indicated a common source. Due to the nature of these subgroups, groundwater quality is derived from geogenic sources, mainly carbonate mineral solutions [32]. Abdelaziz et al. [34] also noted that the dendrogram can be used to classify the groundwater quality parameters and found great similarities with the grouping carried out by the principal components analysis.

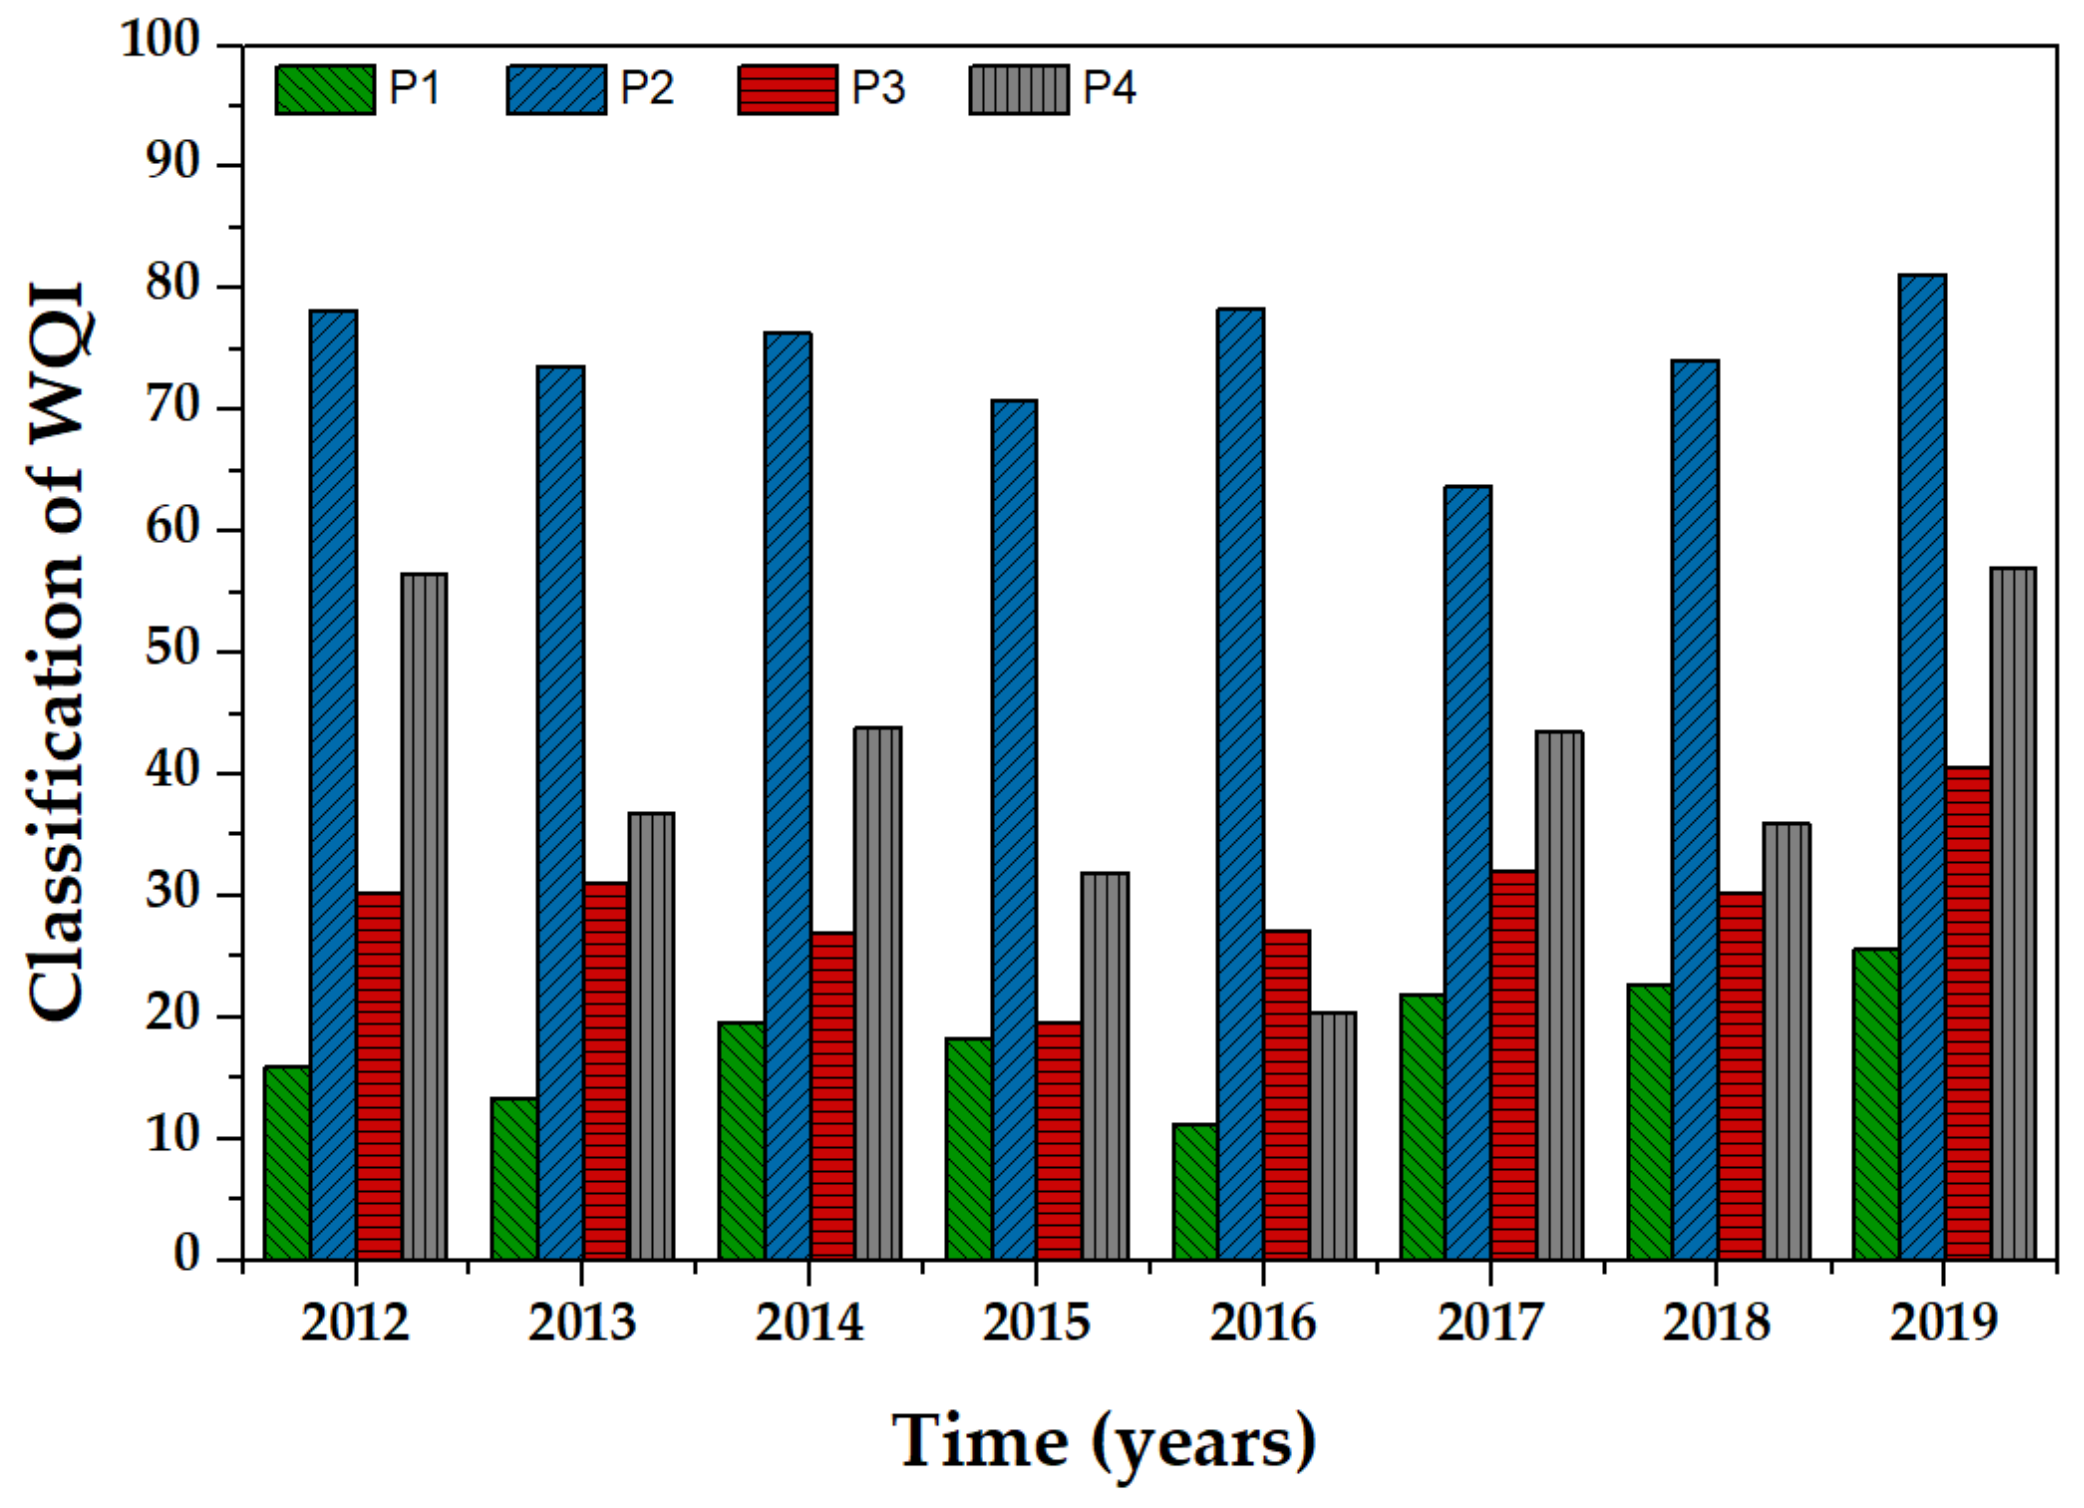
3.4. Drinking Water Quality Index

Table 4 shows the DWQI obtained in the four sampling sites of the Cuernavaca aquifer. DWQI range from 11.2 to 78.2 were obtained from 2012 to 2019, where 70% of the samples showed an excellent groundwater quality, mainly in the P1, P3, and P4 sampling sites, as shown in Figure 10. P1 showed the best water quality, possibly because this sampling site is at the highest elevation and close to a protected green area. In contrast, P2 showed a high variation of groundwater quality because it is in a highly-populated area. Similar DWQI results are reported by Ahmed et al. [41], who mentioned that the DWQI ranged from 1.86 to 82.25 for water samples from different sampling sites of an aquifer in India.

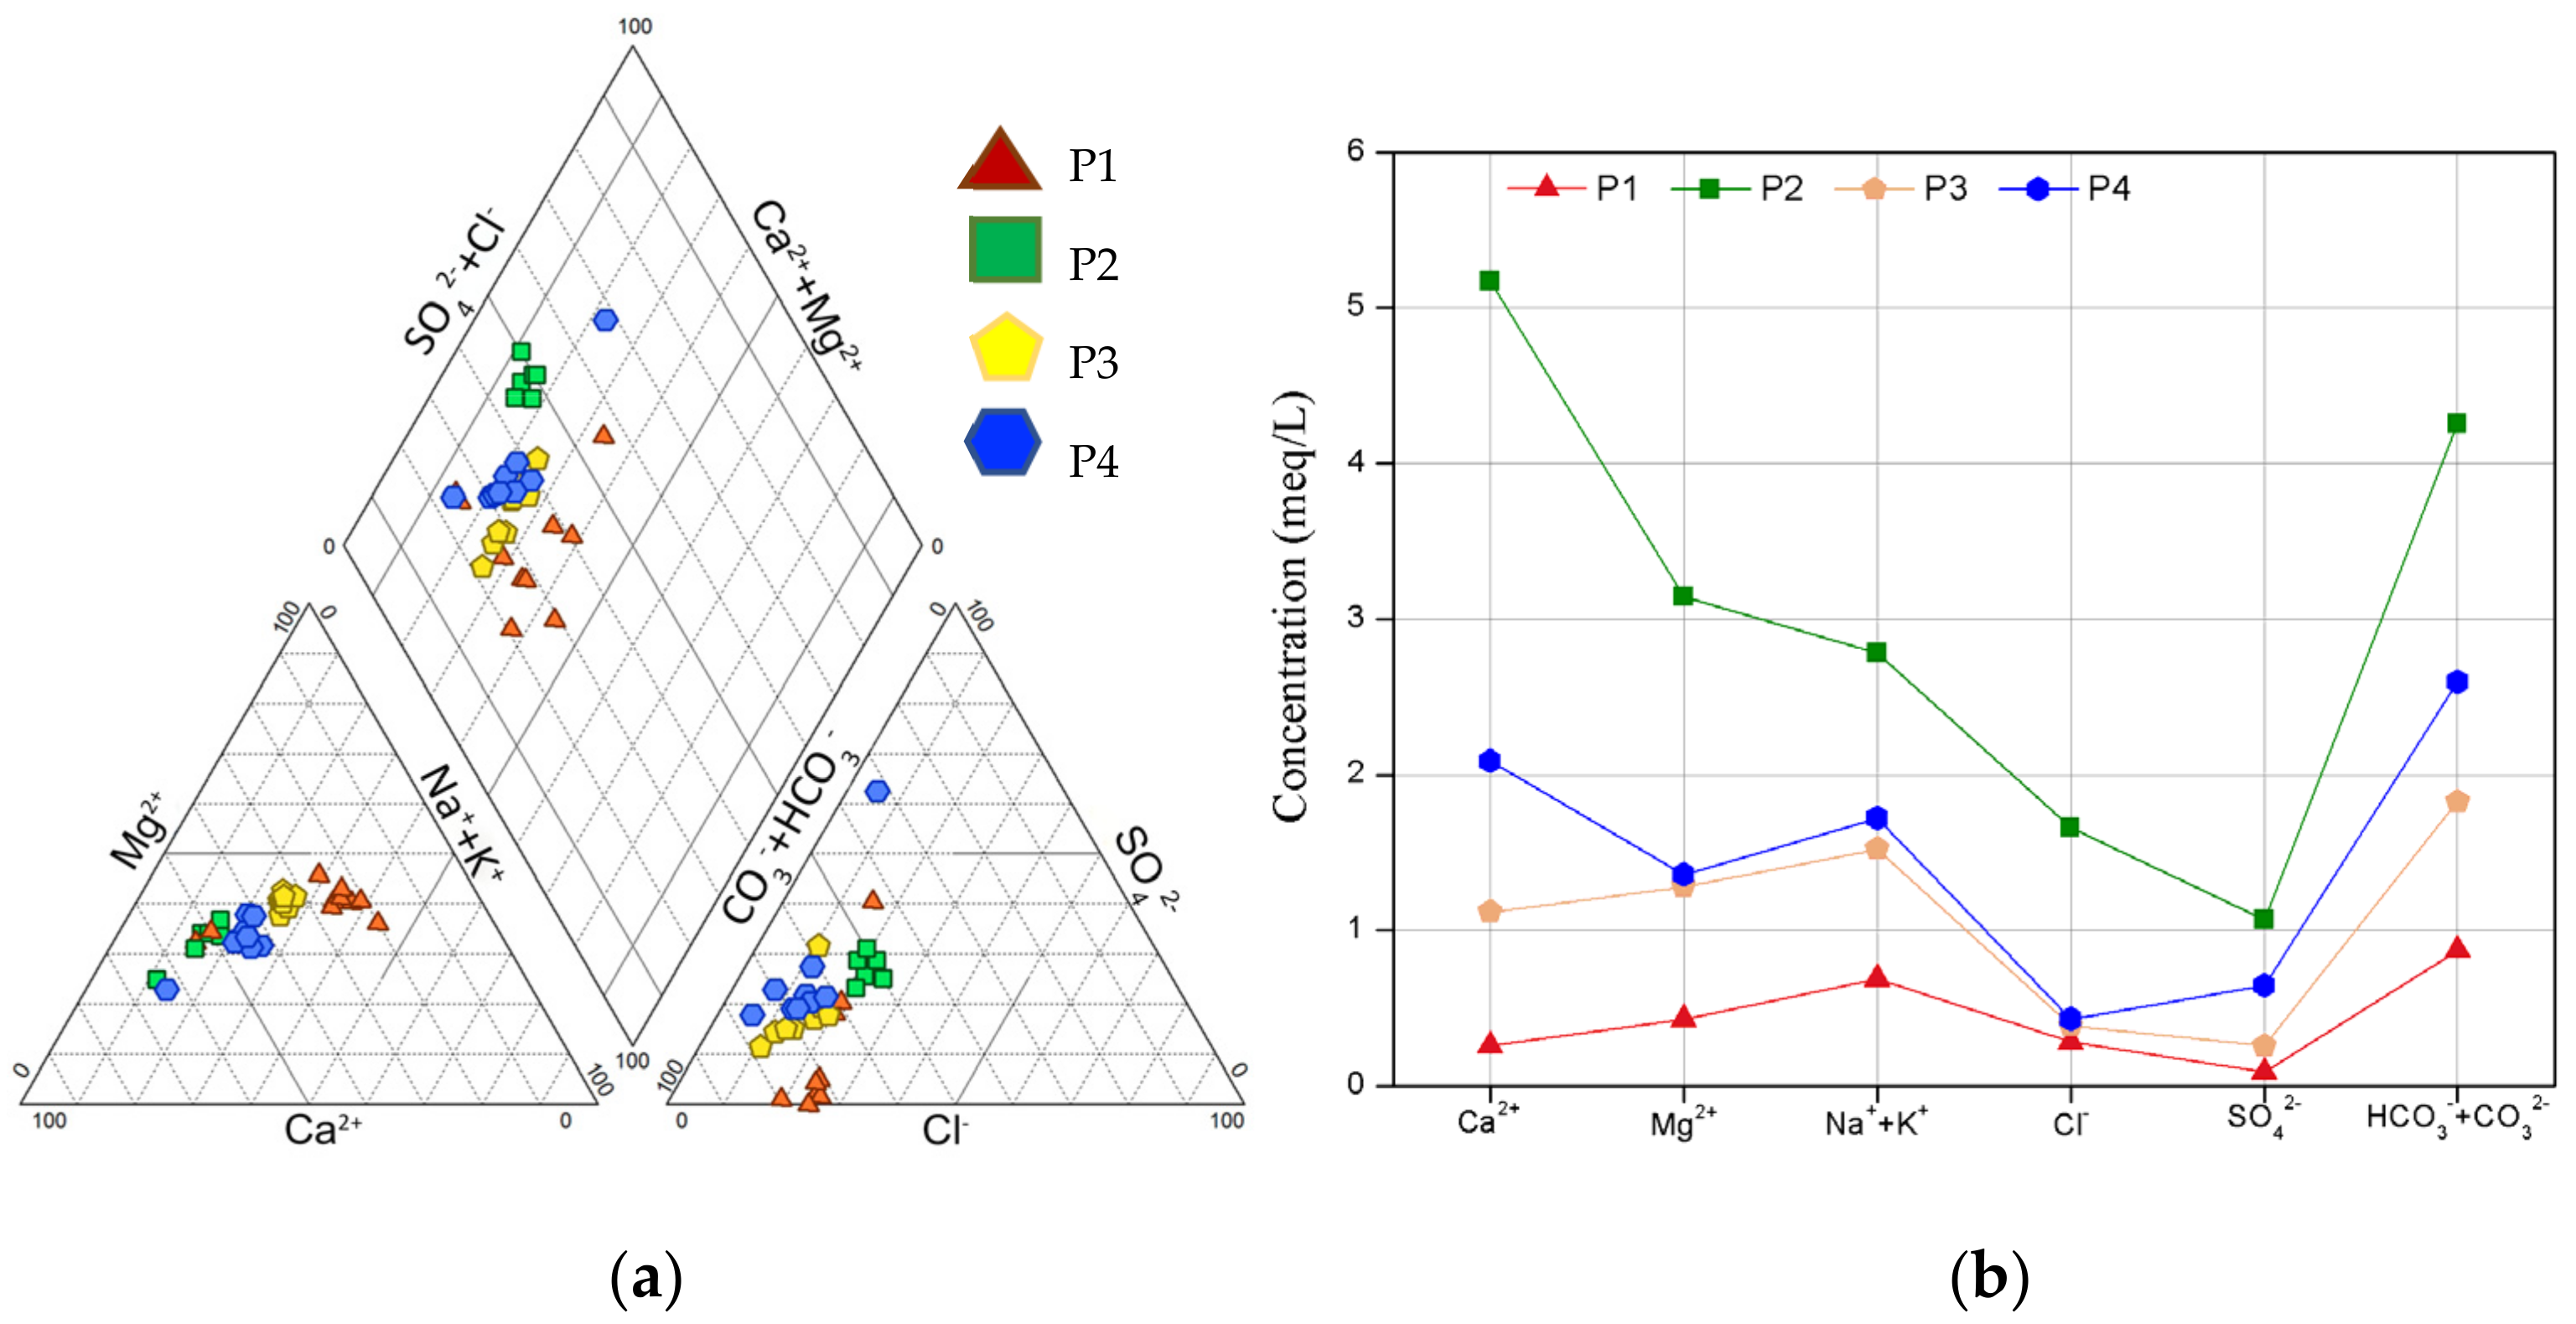
3.5. Hydrochemical Characteristics

Hydrochemical analysis was carried out to characterize the Cuernavaca aquifer’s groundwater. A high content of salts in groundwater could lead to the salinization of the soils and crop yield losses due to dehydration of plants [38,42]. The concentrations of salts in the Cuernavaca aquifer showed the following behavior:
HCO3 > Ca2+ > Na+ > Mg2+ > Cl > SO42− > K+ > NO3
Figure 11a shows the Piper triangular diagram. In this figure, the mean values of 34 samples at each sampling point were used. This diagram is a graphical representation of groundwater chemistry, where the relative concentrations of cations and anions are shown by separate ternary plots. In the lower-left ternary plot (cation diagram), a dominance of Mg2+ and Na+ + K+ is observed. This dominance could be related to progressive evaporation and ion exchange processes [43]. The lower-right ternary plot (anion diagram) indicated that the groundwater chemistry of the Cuernavaca aquifer is highly influenced by Calcium-bicarbonate type and Bicarbonate type [44]. These results are consistent with the results suggested by other researchers [45]. Figure 11b shows the Schoeller diagram which exhibits a similar behavior of cations and anions in the multiple samples from different wells. This diagram demonstrated that the highest equivalent concentrations of the ions were present in sampling site P2, where Ca2+ and HCO3 showed the highest equivalent concentrations of cations and anions, respectively. Similar results were presented by Tefera et al. [31] in Tana basin in Ethiopia. However, Abotalib et al. [46] obtained opposite results to those presented in this study for an aquifer located in hyperarid deserts in central Egypt.
El Osta et al. [19] suggest that the groundwater chemistry of an aquifer is the result of evaporation, weathering, and rock-water interaction. In this study, the Gibbs diagram (Figure 12) showed that the cations and anions in the aquifer are primarily controlled by rock–water interaction. The dissolution of the rock in the aquifer is evidenced since a high content of chlorides and sulfates is observed. Therefore, this process regulates groundwater chemistry and quality. Likewise, this diagram suggests that the P2 site could be controlled by evaporation. This process produces dissolved solutes in groundwater and soil in areas with little depth [15,19,47,48].

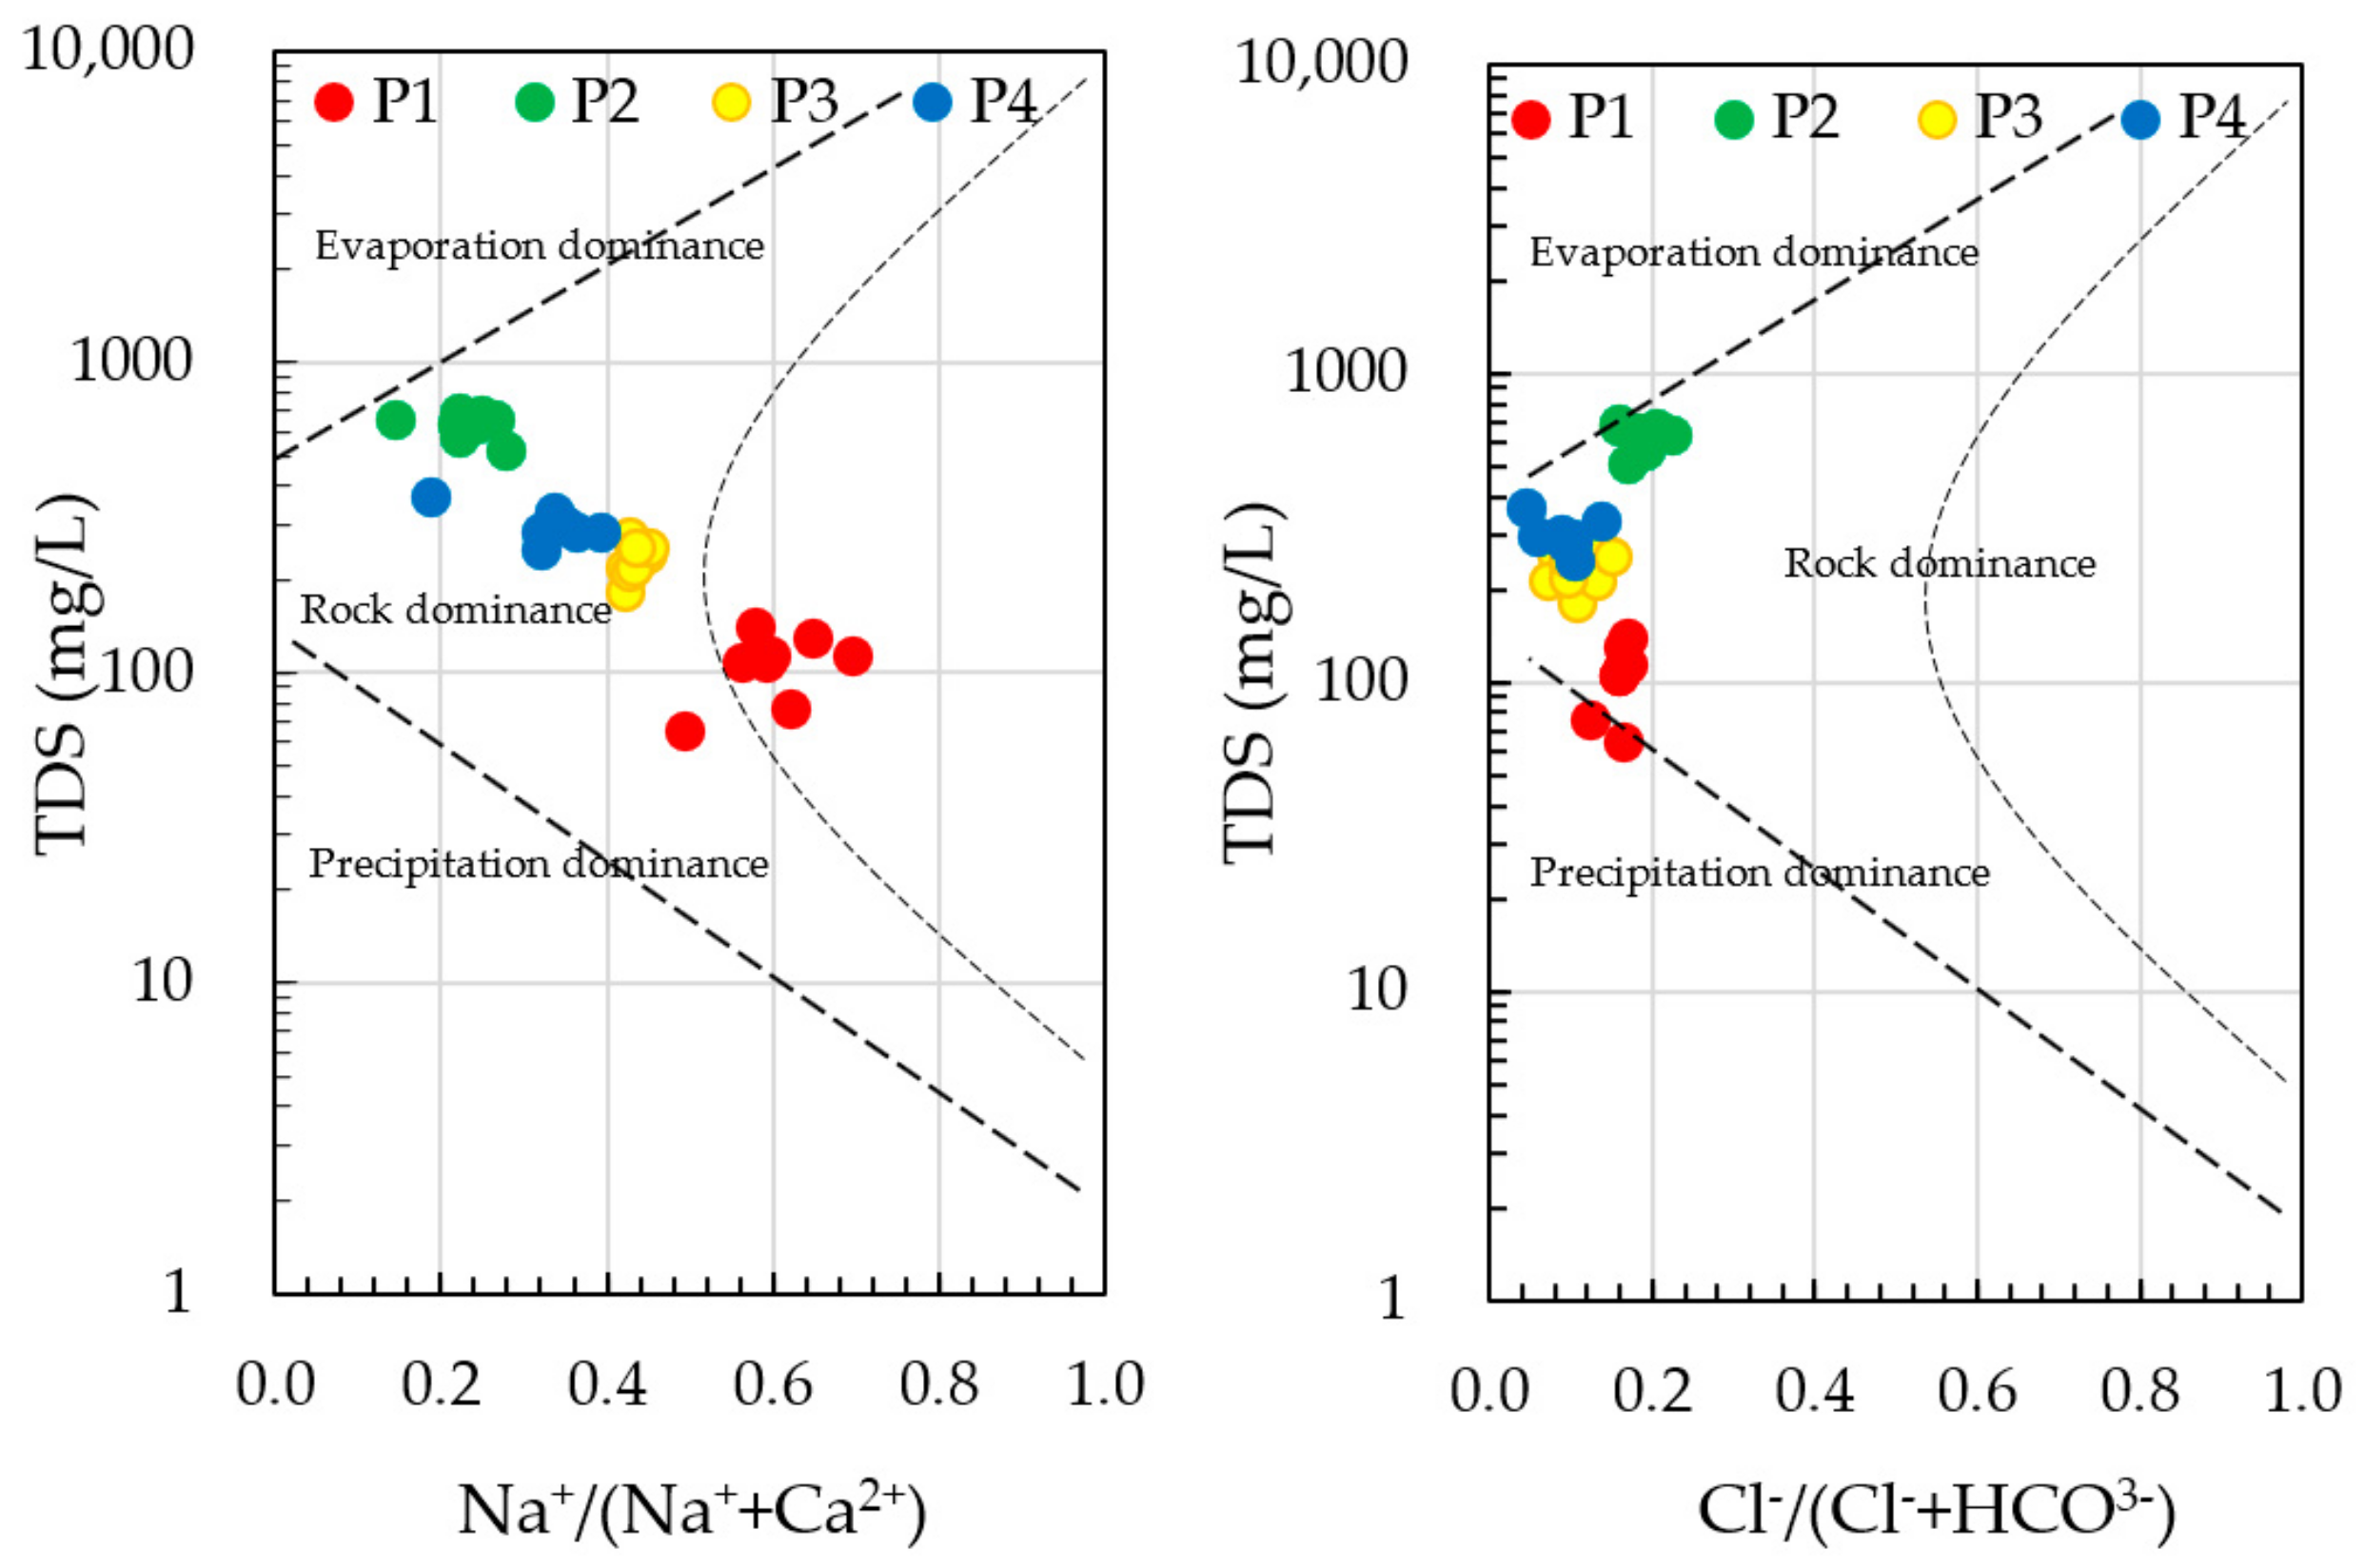
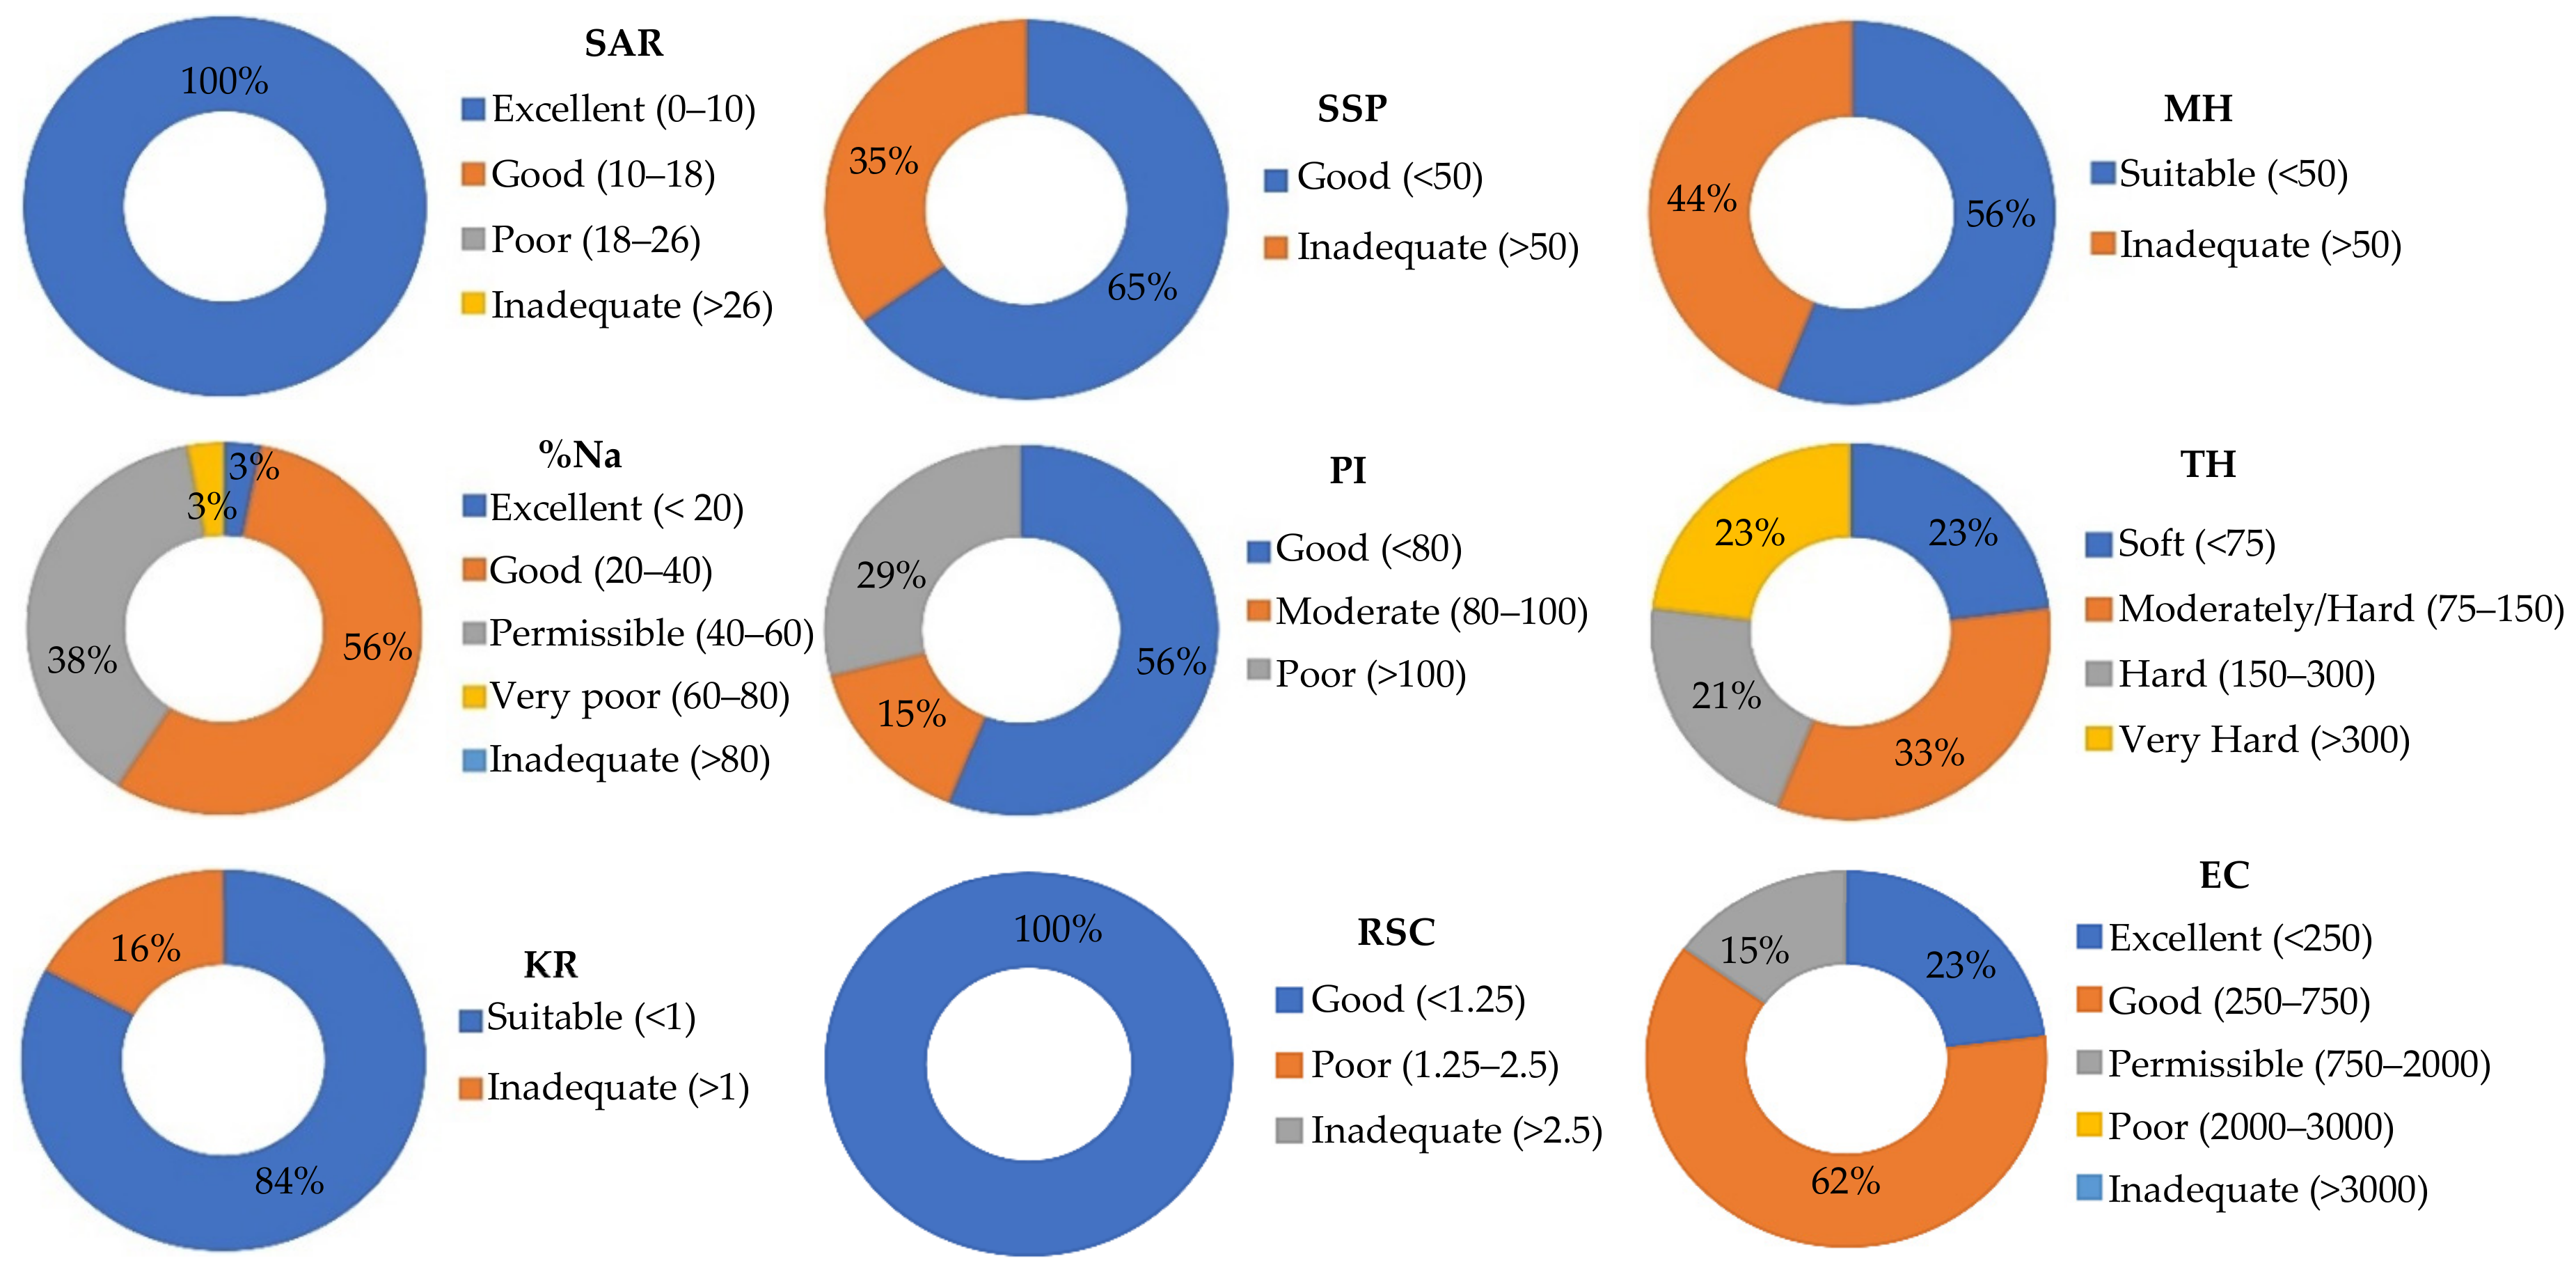
3.6. Groundwater Indices Based on Hydrochemical Features

Figure 13 presents the classification of water quality for irrigation purposes. Some groundwater indices obtained in this study suggest that the Cuernavaca aquifer has a good quality for irrigation purposes. For example, the SAR index classified the groundwater as excellent, which indicates that there is no risk of sodium for irrigation. The RSC index also showed that all samples presented a good quality of water for irrigation. Based on the KR index, the groundwater of the Cuernavaca aquifer was adequate in most of the samples (84%).
However, other groundwater indices suggest that groundwater quality is inadequate for irrigation. The SSP index showed that 65% of the samples have good water quality, mainly at P2 and P4. However, most of the samples at P1 and P3 showed an inadequate quality. Tefera et al. [31] reported that 53.3% of samples analyzed in alluvial aquifers in the Upper Blue Nile Basin, Ethiopia, could be considered good quality but 46.7% of the samples could be considered unsuitable. The MH index demonstrated that 56% of the samples have adequate quality at P2 and P4, but inadequate at P1 and P3. The high sodium levels found at these sampling sites could be related to weathering of Na-containing basaltic rocks. However, the content of calcium (41.93 mg/L) and magnesium (19.25 mg/L) in the groundwater of the aquifer maintains an equilibrium state. The groundwater of the Cuernavaca aquifer could be considered good quality according to the %Na. Most of the samples (56%) are within 20–40% Na. However, high sodium percentages were recorded in 38% of the samples, mainly at P1. The presence of high levels of sodium could reduce soil permeability. Similar results were obtained when using the PI index. Good water quality was observed in 56% of the samples, but it is noteworthy that 29% of the samples were within the poor-quality range (PI > 100). This groundwater quality index is related to the texture and structure of the soil. Since a high content of ions such as sodium, magnesium, calcium, and bicarbonates were found in the aquifer, the PI index also suggests that the use of groundwater for irrigation could affect the soil permeability [19]. Moreover, the high levels of bicarbonates over calcium and magnesium make groundwater unsuitable for irrigation uses.
The hardness of groundwater varied from soft to very hard. This variation is related to urbanization since soft groundwater was found at P1, characterized by the presence of agricultural areas, with low population density and small settlements, while very hard groundwater was located at P2 which is characterized by a mineralized subsoil. Hardness levels found in this study could be considered normal according to that suggested by Udeshani [49], who reports similar TH values in the groundwater of Sri Lanka.
The electrical conductivity in the Cuernavaca aquifer was found between 90 and 991 µS/cm. Despite this high variation, most of the samples were in a good quality range according to Tutmez’s [50] classification (EC level between 0 and 750 mS/cm). The levels of electrical conductivity have been increasing during the last years. This increase could be also related to the loss of vegetation cover due to urbanization [51]. However, electrical conductivity in groundwater showed a satisfactory quality classification because the presence of ions (Ca2+, Mg2+, Na+, K+, Cl, HCO3−, SO42+, and NO3−) is within the permissible limits according to the standards of the World Health Organization (WHO). Determining groundwater suitability is important to understand the potential negative impacts of the high content of ions on crop production and mitigate groundwater contamination problems to improve healthy crop production [31].

4. Conclusions

  • The hydrological and hydrochemical conditions of the Cuernavaca aquifer were evaluated through the application of water quality indices and statistical techniques. This study provides an approach to the spatial and temporal behavior of an urbanized aquifer and assesses its vulnerability due to population growth.
  • This study identified spatial variations between the sampling sites and evidenced the influence of urbanization on groundwater chemistry and quality in the Cuernavaca aquifer. The spatial variation of the chemical elements highlights the vulnerability of the aquifer, especially at P2.
  • The time series analysis demonstrated no trend, seasonal, or cyclic patterns in the groundwater quality data. The multivariate statistical analysis showed a high number of correlations between the groundwater parameters. These parameters were grouped based on hierarchical cluster analysis which revealed the main chemical processes controlling groundwater chemistry in the aquifer.
  • Most of the parameters (physicochemical and ions) measured in the Cuernavaca aquifer were within the standards allowed by the WHO for irrigation purposes. This situation was confirmed by the water quality indexes since the groundwater of the aquifer was classified as good quality. However, the presence of fecal coliforms, organic matter, and the high content of ions such as Ca2+, Mg2+, and HCO3 is an important situation that must be addressed to reduce the vulnerability of the aquifer.
  • This study provides an approach to describe the behavior of the hydrochemical features and water quality of the Cuernavaca aquifer and points out the main driving factors for the deterioration of groundwater quality in an aquifer located in an urban area.

Author Contributions

Conceptualization, J.G.L.; formal analysis, S.A.M.-A.; investigation, R.E.-V. and Y.B.-T.; methodology, J.G.L. and V.B.-T.; project administration, V.B.-T.; supervision, Y.B.-T.; validation, J.G.R.-P.; visualization, S.A.M.-A. and A.Q.-C.; writing—original draft, J.G.L. and Y.B.-T.; writing—review and editing, J.G.R.-P. All authors have read and agreed to the published version of the manuscript.

Funding

This research received no external funding.

Institutional Review Board Statement

Not applicable.

Informed Consent Statement

Not applicable.

Data Availability Statement

The data that support the findings of this study are available on request from the corresponding author.

Acknowledgments

The authors kindly acknowledge the National Water Commission for providing data and the Polytechnic University of Morelos for their support.

Conflicts of Interest

The authors declare no conflict of interest.

References

  1. El-Bindary, M.A.; El-Desouky, M.G.; El-Bindary, A.A. Adsorption of industrial dye from aqueous solutions onto thermally treated green adsorbent: A complete batch system evaluation. J. Mol. Liq. 2021, 346, 117082. [Google Scholar] [CrossRef]
  2. Tapia-Villaseñor, E.M.; Shamir, E.; Cruz-Ayala, M.-B.; Megdal, S.B. Assessing Groundwater Withdrawal Sustainability in the Mexican Portion of the Transboundary Santa Cruz River Aquifer. Water 2022, 14, 233. [Google Scholar] [CrossRef]
  3. Loaiza, J.G.; Rangel-Peraza, J.G.; Sanhouse-García, A.J.; Monjardín-Armenta, S.A.; Mora-Félix, Z.D.; Bustos-Terrones, Y.A. Assessment of Water Quality in A Tropical Reservoir in Mexico: Seasonal, Spatial and Multivariable Analysis. Int. J. Environ. Res. Public Health 2021, 18, 7456. [Google Scholar] [CrossRef] [PubMed]
  4. Elumalai, V.; Nethononda, V.G.; Manivannan, V.; Rajmohan, N.; Li, P.; Elango, L. Groundwater quality assessment and ap-plication of multivariate statistical analysis in Luvuvhu catchment, Limpopo, South Africa. J. Afr. Earth Sci. 2020, 171, 103967. [Google Scholar] [CrossRef]
  5. Mora, A.; Torres-Martínez, J.A.; Moreau, C.; Bertrand, G.; Mahlknecht, J. Mapping salinization and trace element abundance (including As and other metalloids) in the groundwater of north-central Mexico using a double-clustering approach. Water Res. 2021, 205, 117709. [Google Scholar] [CrossRef]
  6. Bannenberg, M.; Ntona, M.M.; Busico, G.; Kalaitzidou, K.; Mitrakas, M.; Vargemezis, G.; Fikos, I.; Kazakis, N.; Voudouris, K. Hydrogeological and Hydrochemical Regime Evaluation in Flamouria Basin in Edessa (Northern Greece). Environments 2020, 7, 105. [Google Scholar] [CrossRef]
  7. Ha, K.; Lee, E.; An, H.; Kim, S.; Park, C.; Kim, G.-B.; Ko, K.-S. Evaluation of Seasonal Groundwater Quality Changes Associated with Groundwater Pumping and Level Fluctuations in an Agricultural Area, Korea. Water 2020, 13, 51. [Google Scholar] [CrossRef]
  8. Kumar, S.; Kumar, M.; Chandola, V.K.; Kumar, V.; Saini, R.K.; Pant, N.; Kumari, N.; Srivastava, A.; Singh, S.; Singh, R.; et al. Groundwater Quality Issues and Challenges for Drinking and Irrigation Uses in Central Ganga Basin Dominated with Rice-Wheat Cropping System. Water 2021, 13, 2344. [Google Scholar] [CrossRef]
  9. Goyal, V.; Singh, O.; Singh, R.; Chhoden, K.; Kumar, J.; Yadav, S.; Singh, N.; Shrivastava, N.; Carvalho, L. Ecological health and water quality of village ponds in the subtropics limiting their use for water supply and groundwater recharge. J. Environ. Manag. 2020, 277, 111450. [Google Scholar] [CrossRef]
  10. Tuqan, N.; Haie, N.; Ahmad, M.T. Assessment of the Agricultural Water Use in Jericho Governorate Using Sefficiency. Sustainability 2020, 12, 3634. [Google Scholar] [CrossRef]
  11. Haque, C.N.; Haque, M.; Jana, H.; Basu, D.; Karak, S. Socio Economic Factors Responsible for Groundwater Consumption in Purba Bardhaman District of West Bengal. Int. J. Environ. Clim. Chang. 2021, 11, 187–194. [Google Scholar] [CrossRef]
  12. Šperac, M.; Zima, J. Assessment of the Impact of Climate Extremes on the Groundwater of Eastern Croatia. Water 2022, 14, 254. [Google Scholar] [CrossRef]
  13. Liu, L.; Qi, S.; Wang, W. Groundwater Quality in Agricultural Lands Near a Rapidly Urbanized Area, South China. Int. J. Environ. Res. Public Health 2021, 18, 1783. [Google Scholar] [CrossRef]
  14. Adimalla, N.; Qian, H. Groundwater quality evaluation using water quality index (WQI) for drinking purposes and human health risk (HHR) assessment in an agricultural region of Nanganur, south India. Ecotoxicol. Environ. Saf. 2019, 176, 153–161. [Google Scholar] [CrossRef]
  15. Loh, Y.S.A.; Akurugu, B.A.; Manu, E.; Aliou, A.S. Assessment of groundwater quality and the main controls on its hydro-chemistry in some Voltaian and basement aquifers, northern Ghana. Groundw. Sustain. Dev. 2020, 10, 100296. [Google Scholar] [CrossRef]
  16. Zakaria, N.; Anornu, G.; Adomako, D.; Owusu-Nimo, F.; Gibrilla, A. Evolution of groundwater hydrogeochemistry and assessment of groundwater quality in the Anayari catchment. Groundw. Sustain. Dev. 2020, 12, 100489. [Google Scholar] [CrossRef]
  17. Wisitthammasri, W.; Chotpantarat, S.; Thitimakorn, T. Multivariate statistical analysis of the hydrochemical characteristics of a volcano sedimentary aquifer in Saraburi Province, Thailand. J. Hydrol. Reg. Stud. 2020, 32, 100745. [Google Scholar] [CrossRef]
  18. Badeenezhad, A.; Tabatabaee, H.R.; Nikbakht, H.-A.; Radfard, M.; Abbasnia, A.; Baghapour, M.A.; Alhamd, M. Estimation of the groundwater quality index and investigation of the affecting factors their changes in Shiraz drinking groundwater, Iran. Groundw. Sustain. Dev. 2020, 11, 100435. [Google Scholar] [CrossRef]
  19. El Osta, M.; Masoud, M.; Alqarawy, A.; Elsayed, S.; Gad, M. Groundwater Suitability for Drinking and Irrigation Using Water Quality Indices and Multivariate Modeling in Makkah Al-Mukarramah Province, Saudi Arabia. Water 2022, 14, 483. [Google Scholar] [CrossRef]
  20. Comisión Nacional del Agua (CONAGUA). 2020. Available online: https://sigagis.conagua.gob.mx/gas1/Edos_Acuiferos_18/morelos/DR_1701.pdf (accessed on 18 December 2021).
  21. Comisión Nacional del Agua (CONAGUA). Estadísticas del Agua en México 2018. Available online: https://sina.conagua.gob.mx/publicaciones/EAM_2018.pdf (accessed on 4 December 2021).
  22. Comisión Nacional del Agua (CONAGUA). Calidad del Agua en México. Available online: https://www.gob.mx/conagua/articulos/calidad-del-agua (accessed on 8 December 2021).
  23. APHA. Standard Methods for the Examination of Water and Wastewater, 22nd ed.; American Public Health Association: Washington, DC, USA, 2012. [Google Scholar]
  24. Chen, X.; Zhang, K.; Chao, L.; Liu, Z.; Du, Y.; Xu, Q. Quantifying natural recharge characteristics of shallow aquifers in groundwater overexploitation zone of North China. Water Sci. Eng. 2021, 14, 184–192. [Google Scholar] [CrossRef]
  25. Bartier, P.M.; Keller, C. Multivariate interpolation to incorporate thematic surface data using inverse distance weighting (IDW). Comput. Geosci. 1996, 22, 795–799. [Google Scholar] [CrossRef]
  26. El Baba, M.; Kayastha, P.; Huysmans, M.; De Smedt, F. Evaluation of the Groundwater Quality Using the Water Quality Index and Geostatistical Analysis in the Dier al-Balah Governorate, Gaza Strip, Palestine. Water 2020, 12, 262. [Google Scholar] [CrossRef] [Green Version]
  27. Acharya, S.; Sharma, S.; Khandegar, V. Assessment of groundwater quality by water quality indices for irrigation and drinking in South West Delhi, India. Data Brief 2018, 18, 2019–2028. [Google Scholar] [CrossRef]
  28. WHO. Guidelines for Drinking Water Quality, 4th ed.; World Health Organization: Geneva, Switzerland, 2011. [Google Scholar]
  29. Gabr, M.E.; Soussa, H.; Fattouh, E. Groundwater quality evaluation for drinking and irrigation uses in Dayrout city Upper Egypt. Ain Shams Eng. J. 2020, 12, 327–340. [Google Scholar] [CrossRef]
  30. Saikrishna, K.; Purushotham, D.; Sunitha, V.; Reddy, Y.S.; Linga, D.; Kumar, B.K. Data for the evaluation of groundwater quality using water quality index and regression analysis in parts of Nalgonda district, Telangana, Southern India. Data Brief 2020, 32, 106235. [Google Scholar] [CrossRef]
  31. Tefera, A.K.; Wassie, A.B.; Sinshaw, B.G.; Defersha, D.T.; Takele, T.A.; Atanaw, S.B.; Tesfaye, A.T.; Getu, E.; Fenta, H.M.; Atinkut, H.B.; et al. Groundwater quality evaluation of the alluvial aquifers using GIS and water quality indices in the Upper Blue Nile Basin, Ethiopia. Groundw. Sustain. Dev. 2021, 14, 100636. [Google Scholar] [CrossRef]
  32. Hasan, M.N.; Siddique, M.A.B.; Reza, A.S.; Khan, R.; Akbor, M.A.; Elius, I.B.; Hasan, M. Vulnerability assessment of seawater intrusion in coastal aquifers of southern Bangladesh: Water quality appraisals. Environ. Nanotechnol. Monit. Manag. 2021, 16, 100498. [Google Scholar] [CrossRef]
  33. Doza, B.; Islam, A.T.; Ahmed, F.; Das, S.; Saha, N.; Rahman, M.S. Characterization of groundwater quality using water evaluation indices, multivariate statistics and geostatistics in central Bangladesh. Water Sci. 2016, 30, 19–40. [Google Scholar] [CrossRef] [Green Version]
  34. Abdelaziz, S.; Gad, M.I.; El Tahan, A.H.M. Groundwater quality index based on PCA: Wadi El-Natrun, Egypt. J. Afr. Earth Sci. 2020, 172, 103964. [Google Scholar] [CrossRef]
  35. Gaikwad, S.K.; Kadam, A.K.; Ramgir, R.R.; Kashikar, A.S.; Wagh, V.; Kandekar, A.M.; Gaikwad, S.P.; Madale, R.B.; Pawar, N.J.; Kamble, K.D. Assessment of the groundwater geochemistry from a part of west coast of India using statistical methods and water quality index. HydroResearch 2020, 3, 48–60. [Google Scholar] [CrossRef]
  36. Abbasnia, A.; Yousefi, N.; Mahvi, A.H.; Nabizadeh, R.; Radfard, M.; Yousefi, M.; Alimohammadi, M. Evaluation of ground-water quality using water quality index and its suitability for assessing water for drinking and irrigation purposes: Case study of Sistan and Baluchistan province (Iran). Hum. Ecol. Risk Assess. 2019, 25, 988–1005. [Google Scholar] [CrossRef]
  37. Hossain, M.; Patra, P.K.; Begum, S.N.; Rahaman, C.H. Spatial and sensitivity analysis of integrated groundwater quality index towards irrigational suitability investigation. Appl. Geochem. 2020, 123, 104782. [Google Scholar] [CrossRef]
  38. Jamaa, H.; El Achheb, A.; Namr, K.I. Spatial variation of groundwater quality and assessment of water table fluctuations in Plio-Quaternary aquifer formations in Doukkala Plain, Morocco. Groundw. Sustain. Dev. 2020, 11, 100398. [Google Scholar] [CrossRef]
  39. Trigui, M.R.; Trabelsi, R.; Zouari, K.; Agoun, A. Implication of hydrogeological and hydrodynamic setting on water quality of the Complex Terminal Aquifer in Kebili (southern Tunisia): The use of geochemical indicators and modelling. J. Afr. Earth Sci. 2021, 176, 104121. [Google Scholar] [CrossRef]
  40. Miao, Q.; Li, X.; Xu, Y.; Liu, C.; Xie, R.; Lv, Z. Chemical characteristics of groundwater and source identification in a coastal city. PLoS ONE 2021, 16, e0256360. [Google Scholar] [CrossRef]
  41. Ahmed, S.; Khurshid, S.; Madan, R.; Abu Amarah, B.A.; Naushad, M. Water quality assessment of shallow aquifer based on Canadian Council of Ministers of the environment index and its impact on irrigation of Mathura District, Uttar Pradesh. J. King Saud Univ. Sci. 2019, 32, 1218–1225. [Google Scholar] [CrossRef]
  42. Pradhan, R.M.; Behera, A.K.; Kumar, S.; Kumar, P.; Biswal, T.K. Recharge and Geochemical Evolution of Groundwater in Fractured Basement Aquifers (NW India): Insights from Environmental Isotopes (δ18O, δ2H, and 3H) and Hydrogeochemical Studies. Water 2022, 14, 315. [Google Scholar] [CrossRef]
  43. Dorjderem, B.; Torres-Martínez, J.; Mahlknecht, J. Intensive long-term pumping in the Principal-Lagunera Region aquifer (Mexico) causing heavy impact on groundwater quality. Energy Rep. 2020, 6, 862–867. [Google Scholar] [CrossRef]
  44. Badmus, G.O.; Akinyemi, O.D.; Gbadebo, A.M.; Oyedepo, J.A. Hydrochemical analysis of groundwater quality along the coastal aquifers in part of Ogun Waterside, Ogun State, southwestern Nigeria. Heliyon 2020, 6, e05661. [Google Scholar] [CrossRef]
  45. Dragon, K. Identification of groundwater conditions in the recharge zone of regionally extended aquifer system with use of water chemistry and isotopes (Lwowek region, Poland). J. Hydrol. Reg. Stud. 2021, 34, 100787. [Google Scholar] [CrossRef]
  46. Abotalib, A.Z.; Heggy, E.; El Bastawesy, M.; Ismail, E.; Gad, A.; Attwa, M. Groundwater mounding: A diagnostic feature for mapping aquifer connectivity in hyper-arid deserts. Sci. Total Environ. 2021, 801, 149760. [Google Scholar] [CrossRef]
  47. Adimalla, N.; Qian, H.; Li, P. Entropy water quality index and probabilistic health risk assessment from geochemistry of groundwaters in hard rock terrain of Nanganur County, South India. Geochemistry 2019, 80, 125544. [Google Scholar] [CrossRef]
  48. Gad, M.; Elsayed, S.; Moghanm, F.; Almarshadi, M.; Alshammari, A.; Khedher, K.; Eid, E.; Hussein, H. Combining Water Quality Indices and Multivariate Modeling to Assess Surface Water Quality in the Northern Nile Delta, Egypt. Water 2020, 12, 2142. [Google Scholar] [CrossRef]
  49. Udeshani, W.; Dissanayake, H.; Gunatilake, S.; Chandrajith, R. Assessment of groundwater quality using water quality index (WQI): A case study of a hard rock terrain in Sri Lanka. Groundw. Sustain. Dev. 2020, 11, 100421. [Google Scholar] [CrossRef]
  50. Tutmez, B.; Hatipoglu, Z.; Kaymak, U. Modelling electrical conductivity of groundwater using an adaptive neuro-fuzzy inference system. Comput. Geosci. 2006, 32, 421–433. [Google Scholar] [CrossRef] [Green Version]
  51. Lü, X.; Han, Z.; Li, H.; Zheng, Y.; Liu, J. Influence of Urbanization on Groundwater Chemistry at Lanzhou Valley Basin in China. Minerals 2022, 12, 385. [Google Scholar] [CrossRef]
Figure 1. Location of the Cuernavaca aquifer and location of sampling wells.
Applsci 12 06879 g001
Figure 2. Elevations of the Cuernavaca aquifer.
Applsci 12 06879 g002
Figure 3. Land use classification of the Cuernavaca aquifer.
Applsci 12 06879 g003
Figure 4. Soil classification of the Cuernavaca aquifer.
Applsci 12 06879 g004
Figure 5. Spatial behavior of physicochemical parameters in the Cuernavaca aquifer.
Applsci 12 06879 g005
Figure 6. Spatial behavior of major ions in the Cuernavaca aquifer.
Applsci 12 06879 g006
Figure 7. Variation of water quality parameters over time (2012–2019) at P1 (-■-), P2 (-●-), P3 (-▲-) y P4 (-▼-).
Applsci 12 06879 g007
Figure 8. Pearson correlation coefficients of the water quality parameters of the Cuernavaca aquifer.
Applsci 12 06879 g008
Figure 9. Hierarchical cluster analysis for groundwater quality parameters monitored in the Cuernavaca aquifer from 2012 to 2019.
Applsci 12 06879 g009
Figure 10. Variation of the water quality index in the sampling wells of the Cuernavaca aquifer.
Applsci 12 06879 g010
Figure 11. Piper (a), and Schoeller (b) diagrams for groundwater chemistry composition at P1 (Applsci 12 06879 i001), P2 (Applsci 12 06879 i002), P3 (Applsci 12 06879 i003) y P4 (Applsci 12 06879 i004).
Applsci 12 06879 g011
Figure 12. Gibbs diagram showing the source of cations and anions in the Cuernavaca aquifer at P1 (-●-), P2 (-●-), P3 (-●-) y P4 (-●-) sites.
Applsci 12 06879 g012
Figure 13. Classification of water samples for irrigation purposes in the Cuernavaca aquifer.
Applsci 12 06879 g013
Table 1. Groundwater indices based on hydrochemical features.
IndicesAcronymEquationReferences
Sodium adsorption ratioSAR SAR = Na + Ca 2 + + Mg 2 + 2 Abdelaziz et al. [34]
Soluble sodium percentageSSP SSP = Na + Ca 2 + + Mg 2 + + K + 100 Tefera et al. [31]
Sodium percentage%Na % Na = Na + + K Ca 2 + + Mg 2 + Na + + K + 100 Abbasnia et al. [36]
Residual Sodium CarbonateRSC RSC = HCO 3 Ca 2 + + Mg 2 + Zakaria et al. [16]
Magnesium HazardMH MH = Mg 2 + Mg 2 + + Ca 2 + 100 Hossain et al. [37]
Permeability indexPI PI = Na + + K + + HCO 3 Ca 2 + + Mg 2 + + Na + + K + 100 Kumar et al. [8]
Kelly RatioKR KR = Na + Mg 2 + + Ca 2 + Acharia et al. [27]
Total HardnessTHTH = (Ca + Mg) ∗ 50Tefera et al. [31]
Table 2. Range, standard deviation and mean values for water quality parameters in the Cuernavaca aquifer from 2012 to 2019.
ParametersAbbreviationMinimumMaximumMeanStandard Deviation
Bicarbonates (mg/L)HCO3−48.40294.90145.1279.75
Fecal coliforms (MPN/100 mL)FC1.002909.00276.62719.15
Total organic carbon (mg/L)TOC0.082.870.920.72
Ammonium (mg/L)NH30.000.610.070.12
Nitrites (mg/L)NO2−0.000.040.010.01
Nitrates (mg/L)NO3−0.006.873.242.13
Organic Nitrogen (mg/L)ON0.001.550.240.29
Total nitrogen (mg/L)TN0.017.033.562.20
Total phosphorus (mg/L)TP0.000.400.150.09
Total dissolved solids (mg/L)TDS64.64688.00316.01195.16
Electrical conductivity (µS/cm)EC90.00991.00409.79266.25
pHPH6.208.407.290.45
Chlorides (mg/L)Cl8.4478.2523.8920.62
Fluorides (mg/L)F0.040.970.320.19
Silicon oxides (mg/L)SiO230.4291.2967.1013.56
Potassium (mg/L)K+1.327.723.681.60
Manganese (mg/L)Mn0.000.480.010.08
Sodium (mg/L)Na+1.9240.0118.599.43
Sulfates (mg/L)SO42−0.82226.3848.4149.98
Calcium (mg/L)Ca2+3.87121.1041.9337.57
Magnesium (mg/L)Mg2+3.8250.4719.2513.07
Total hardness (mg/L)TH24.60456.80184.46141.14
Water temperature (°C)WT17.2522.4920.2421.68
Table 3. Spatial and temporal statistical analysis (ANOVA) of the water quality parameters measured in the Cuernavaca aquifer.
ParameterSite (Spatial)Year (Temporal)
p-Valuep-Value
Bicarbonates (mg/L)0.0000 *0.7058
Fecal coliforms NMP/100 mL0.22290.8342
Total organic carbon (mg/L)0.30440.1937
Ammonium (mg/L)0.32190.4469
Nitrites (mg/L)0.70010.4622
Nitrates (mg/L)0.0000 *0.0911
Organic Nitrogen (mg/L)0.11920.1272
Total nitrogen (mg/L)0.0000 *0.1061
Total phosphorus (mg/L)0.25400.0283
Total dissolved solids (mg/L)0.0000 *0.5686
Electrical conductivity µS/cm0.0000 *0.4360
pH0.0002 *0.0034
Chlorides (mg/L)0.0000 *0.4176
Fluorides (mg/L)0.39920.0844
Silicon oxides (mg/L)0.0315 *0.0001 *
Potassium (mg/L)0.0001 *0.2912
Manganese (mg/L)0.57200.8024
Sodium (mg/L)0.0000 *0.0143 *
Sulfates (mg/L)0.0000 *0.0134 *
Calcium (mg/L)0.0000 *0.2466
Magnesium (mg/L)0.0000 *0.0058 *
Total hardness (mg/L)0.0000 *0.3337
Water temperature °C0.0000 *0.8973
* p-value ≤ 0.05) is statistically significant.
Table 4. Classification of the water quality index and percentage of the values of the Cuernavaca aquifer samples.
DWQIClassification of WaterSamples% of Samples
<50Excellent water2470.5
50–100Good water1029.5
100–200Poor water00
200–300Very poor water00
>300Unsuitable for drinking00
Publisher’s Note: MDPI stays neutral with regard to jurisdictional claims in published maps and institutional affiliations.

