
Attenuation of Lightning-Induced Effects on Overhead Distribution Systems in Urban Areas


Naval, ICT and Electrical Engineering Department (DITEN), University of Genoa, 16165 Genoa, Italy
*
Author to whom correspondence should be addressed.
Appl. Sci. 2022, 12(15), 7632; https://0-doi-org.brum.beds.ac.uk/10.3390/app12157632
Submission received: 1 July 2022
/
Revised: 25 July 2022
/
Accepted: 27 July 2022
/
Published: 28 July 2022
(This article belongs to the Special Issue Physics Principles, Measurements and Characteristics of Lightning)
Abstract
:Overhead distribution systems can be strongly affected and damaged by indirect lightning. The induced voltages are usually computed neglecting the surrounding geometry and the presence of buildings in urban areas. Buildings can strongly change the behavior of the measured lighting-induced electromagnetic (EM) fields in the proximity of the point of impact. As a consequence, induced voltages can deviate from what would be measured in the absence of buildings. This work proposes an analysis of the main variables, which affect the deviation of the EM fields and of the consequent induced voltages along an overhead distribution line due to the presence of a building. Different distances between the line and the building and different building heights are considered.
1. Introduction
The continuous growth of overhead distribution systems requires a constant improvement in terms of power quality and system reliability. One of the most critical events causing a fault on an overhead distribution line is undoubtedly represented by lightning events [1,2].
On overhead distribution systems, lightning damage can be caused by two main categories: direct events and indirect events. While the first one is typical of lightning directly striking the electrical infrastructure and is extremely dangerous, the second one represents lightning discharges striking in the proximity of the overhead line and causing line overvoltage due to the coupling with the electromagnetic fields. The events belonging to this latter category, even if less dangerous, have a higher frequency of occurrence and can lead to a high number of flashovers if the line insulation level is low [1].
The analysis of lightning-induced voltages on distribution systems has been deeply researched, focusing on the effects caused by the soil parameters [3,4,5] and on the possible mitigation measures, such as the installation of shield wires and surge arresters [3,6,7].
Distribution lines in urban areas are usually installed in cable. However, in some countries, they are installed as overhead lines located close to buildings. In those particular cases, buildings play a non-negligible role in the interactions between lightning strike and overhead line in cases of direct and indirect events. Concerning direct events, the presence of a building reduces the probability that the lightning directly hits the power line, playing the same role as a shield wire, which protects the distribution lines from direct events according to the well-known electrogeometrical criterion [5].
On the other hand, the role of buildings close to overhead lines during indirect events has been less analyzed. The interactions of buildings with lightning events was examined by [8,9], which analyzed the electromagnetic fields induced inside the buildings directly struck by lightning. Other works, based on experimental tests, focused their efforts on the evaluation of how the presence of buildings modified the behavior of the electromagnetic fields irradiated by the lightning discharge [10].
In principle, the most rigorous and precise approach for the evaluation of this particular case should be based on a full-wave approach, where the complete geometry including the channel, the building, the overhead line, and the ground is modeled as proposed in [11]. The most valuable works in this field have been proposed by the authors of [12], who presented the attenuation of the electromagnetic fields produced by lightning discharges due to the presence of buildings by means of specific functions applied to the closed-form expressions of the electromagnetic fields valid for open terrain Validation of this approach was given by comparison with a Finite Element Method (FEM)-based field calculation (used as a benchmark).
The functions obtained in [12] enabled calculation of the induced voltage on a specific overhead distribution line starting from the electromagnetic fields’ expressions valid for open terrain, which are usually implemented in the well-known Finite Difference Time Domain (FDTD) numerical codes, such as LIOV [13] and LIGHT-PESTO [14]. However, application of the same functions obtained and validated in some specific cases seems unjustified for different cases, since cases can be different in terms of striking point, channel-base parameters, lightning channel parameters, and line characteristics.
This paper proposes an analysis of the lightning-induced voltages on distribution systems with the presence of nearby buildings. The analysis was performed computing the EM fields by means of the FEM software COMSOL [15] and using them as input to the field-to-line coupling code with LIGHT-PESTO [14]. The analysis aims at providing an estimation of the attenuation due to the buildings, which can be useful in the design of Lightning Protection Systems (LPS). The study considers different distances between the buildings and the line to be protected as well as different building heights, ranging from typical values representing rural buildings to urban ones.
The paper is divided as follows: Section 2 describes the implemented model, and Section 3 provides the results in terms of the attenuation of the EM fields and the attenuation of the maximum induced voltage. In this section, approximate expressions for the attenuation of the voltage as a function of some relevant geometrical parameters are proposed by means of a numerical fitting. Finally, some conclusions are drawn in Section 4.
2. Lightning Details, FEM Model, and LIGHT-PESTO Code
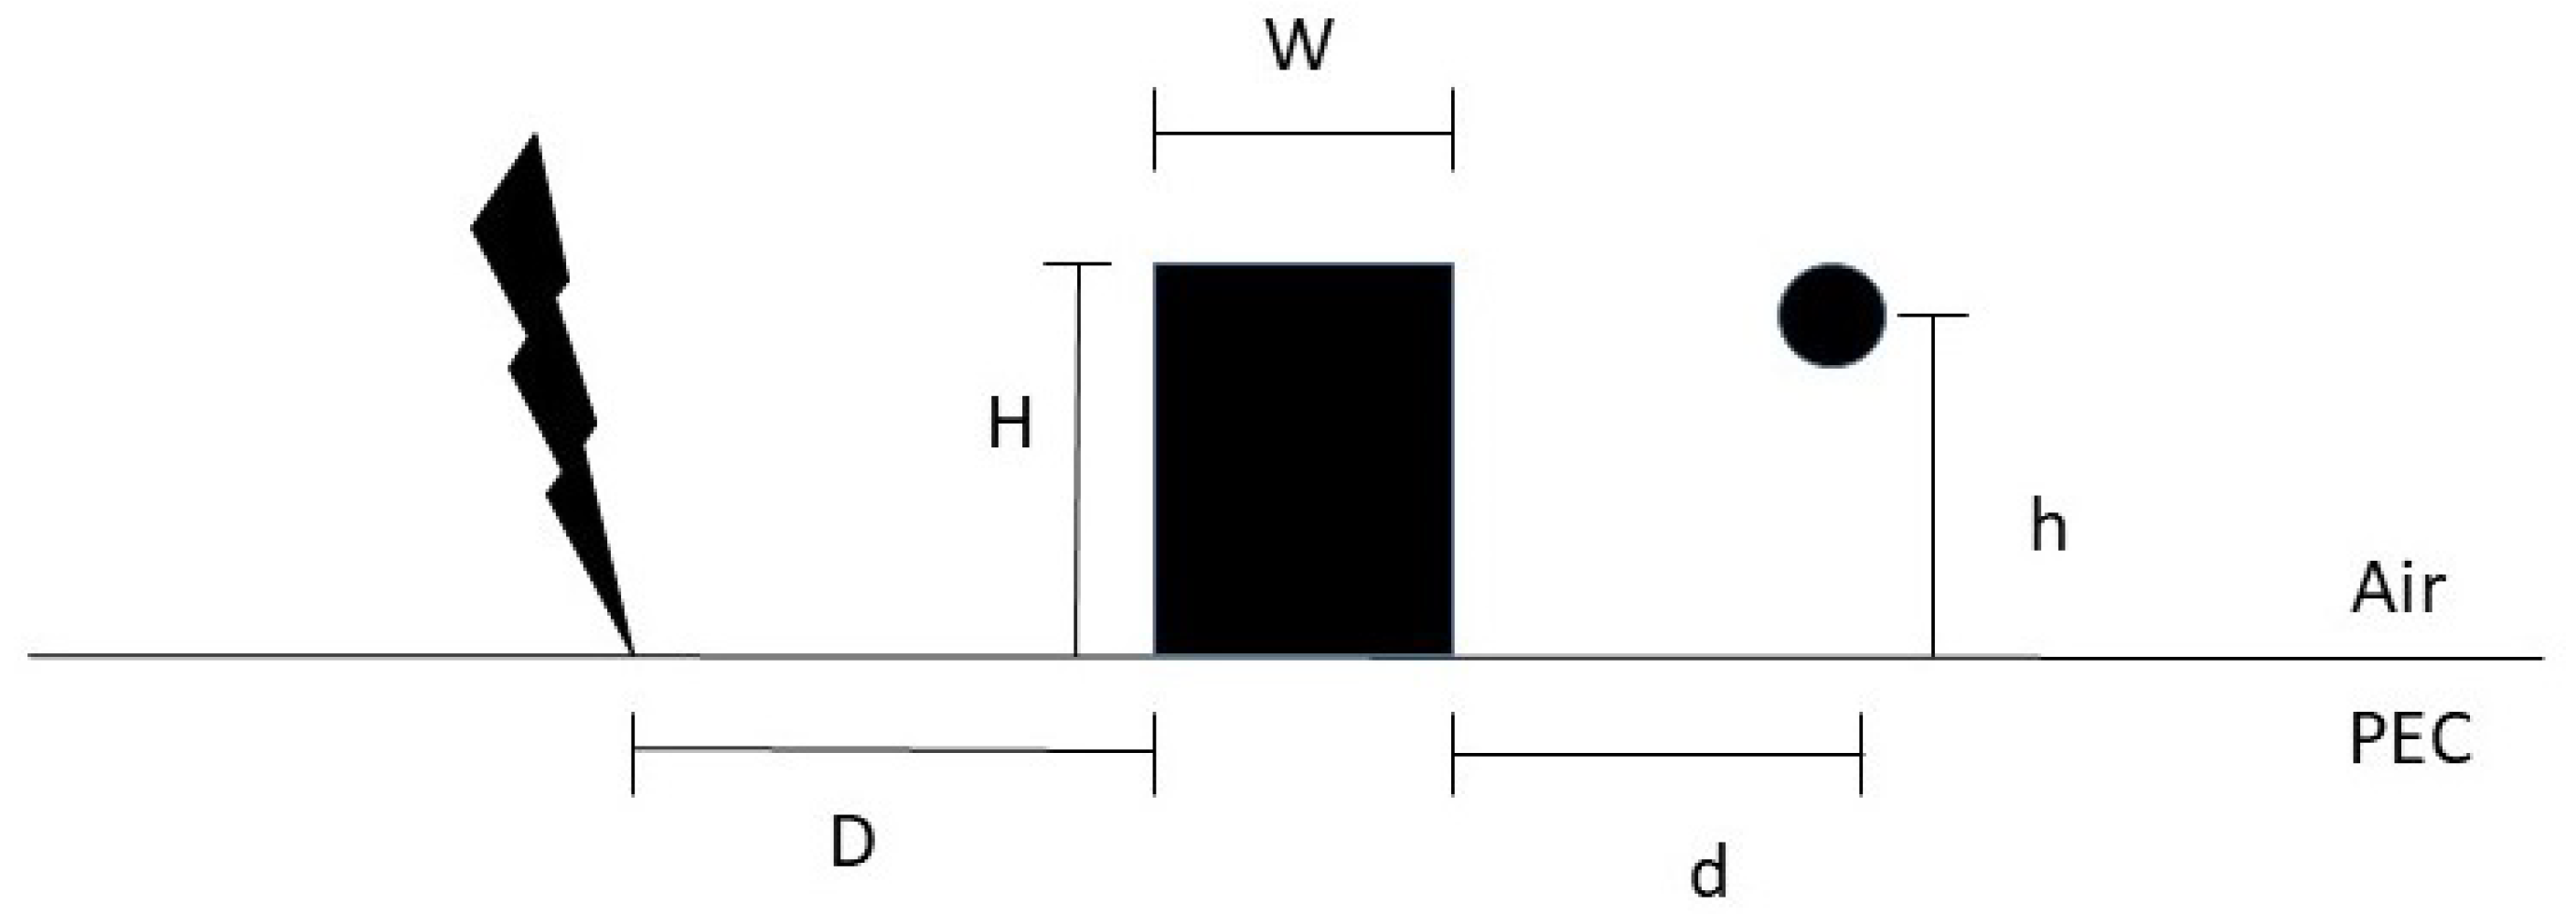
The frontal view of the considered geometry is shown in Figure 1.
The computation of the EM fields and the induced voltages on the line in the presence of buildings can be performed according to the following three steps:
- Lightning current evaluation
- EM fields’ computation
- Induced voltages’ computation.
2.1. Lightning Details
In the following, a typical first return stroke, whose time domain channel-base current () is described by the well-known Heidler’s function [16] is implemented. According to the so-called engineering models, the propagation of the current along the channel is given by:
where
- v is the return stroke speed (assumed to be the half of the light speed)
- is the attenuation function (assumed to be exponential, as dictated by the Modified Transmission Line Exponential (MTLE) model [17],
- u is the Heaviside function.
2.2. EM Fields’ Computation
The EM fields’ computation was implemented in a commercial FEM software (COMSOL Multiphysics). For a correct evaluation of the EM fields, it was decided to use the RadioFrequency (RF) module, which enables solving the Maxwell’s equations in the time domain for a given geometry.
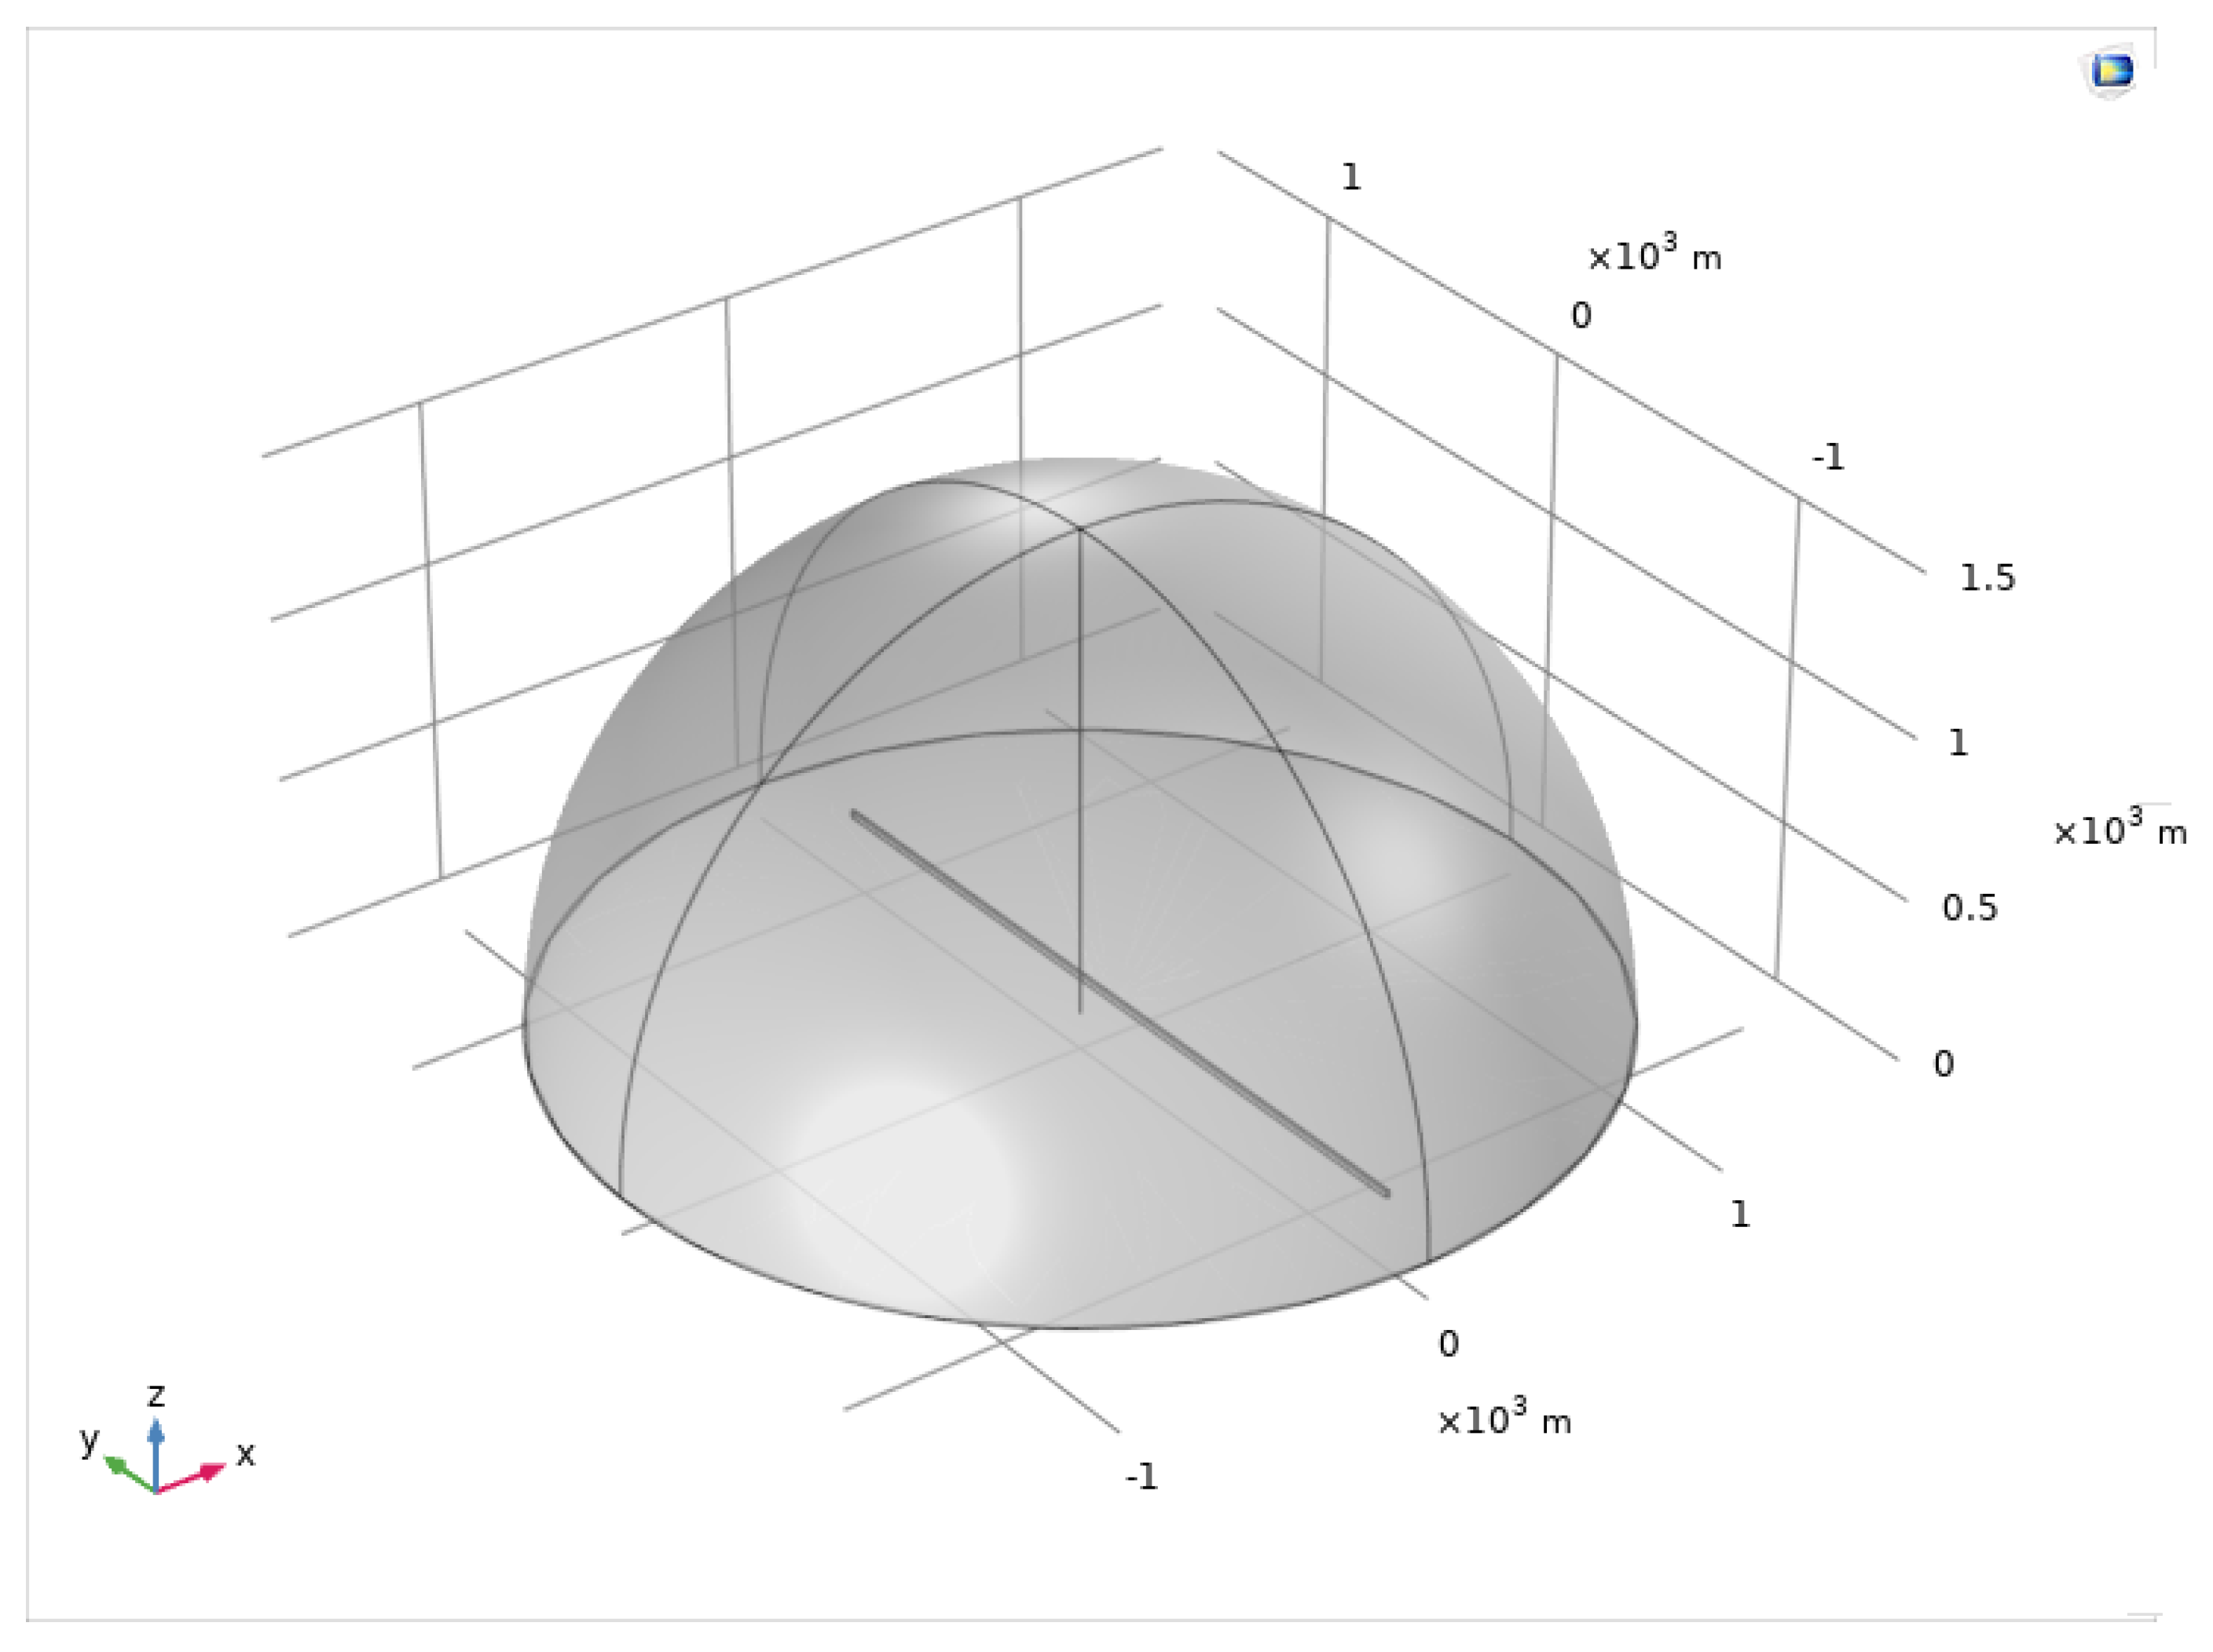
The considered geometry, shown in Figure 2, involves the lightning channel, the building, and the surrounding environment. The electrical infrastructure (i.e., the line conductors) was neglected, since it is commonly assumed that EM fields are computed in absence of the line.
The lightning channel was a cylinder characterized by a radius of 0.1 m and a height of 1500 m, whose base was located at the center of the geometry. The lightning current distribution (1) was implemented by means of a Lumped Port applied to the surface of the cylinder. Note that the height of 1500 m was lower than a typical assumed value of 8 km, since the traveling wave did not reach the top of the channel in the considered time window.
The building was a parallelepiped located symmetrically to the lightning channel. The building length was 2400 m in order to simulate an aggregate of houses representing a typical urban area. The height of the building was variable in order to provide a sensitivity analysis on the variation of this parameter. In accordance with [11], the building can be described as a Perfect Electric Conductor (PEC); thus the values of conductivity, permittivity, and permeability inside the building are useless.
The ground was assumed to be a PEC; thus, in order to reduce the mesh discretization, a hemisphere, characterized by a radius of 1500 was implemented. The surrounding environment was assumed to be air, characterized by , , and .
2.3. Induced Voltage Computation
The EM fields represented the input for the field-to-line coupling. The induced voltage computation was obtained by means of the LIGHT-PESTO code [14], which implements a discretized version of Agrawal’s model by means of a Finite Difference Time Domain (FDTD) code interfaced with Simulink-Simscape Power Systems. In addition to the data provided for the EM fields’ computation, the LIGHT-PESTO code needs the knowledge of the line geometry in terms of the conductor height, radius, and location, as well as the electrical connections of the lines at the beginning, at each pole, and at the end of the line.
3. Results
In order to provide a sensitivity analysis on the variables that mainly affect the attenuation due to the presence of buildings, with reference to Figure 1, it was decided to:
- Set m
- Set m
- Set m
- Consider a single-conductor line
- Terminate the conductor with its matching impedances.
- Set the line length = 2000 m
- Vary H from 5 m to 50 m
- Vary d from 5 to 200 m.
Three different sets of simulations are provided, in order to analyze separately the effect of the building’s height and the effect of the line’s distance from the building. In the first set of simulations (A), m, and d varied from 5 to 200 m. In the second set (B), m, and d varied from 5 to 200 m. In the third one (C), m, and H varied from 5 to 50 m.
3.1. EM Fields
For each set of simulations, the effect of the presence of the buildings was analyzed calculating the following quantities:
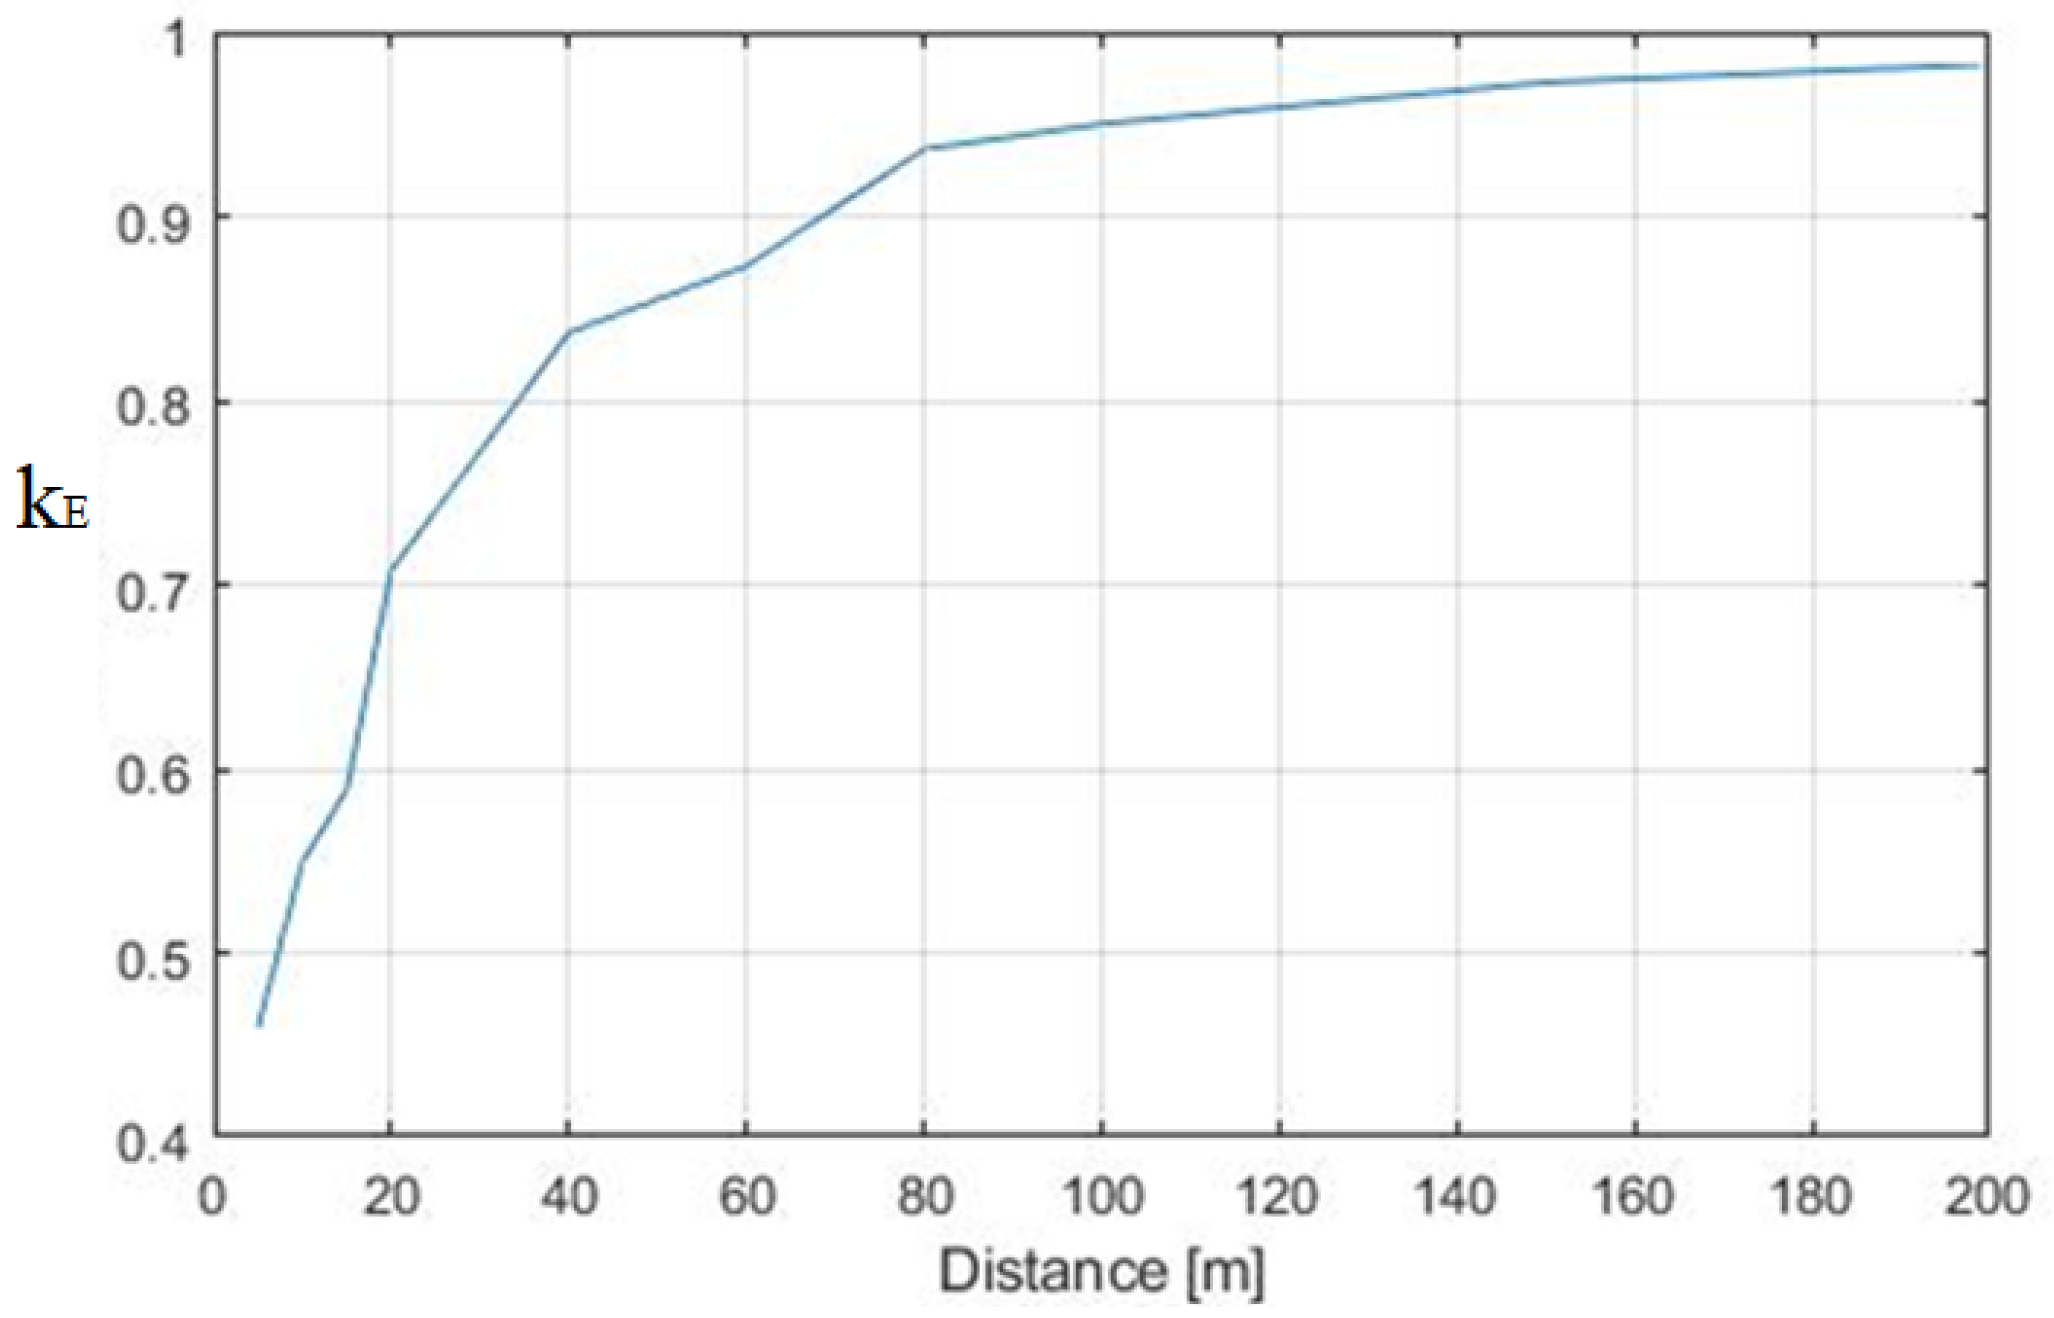
Figure 3 shows that the presence of buildings became almost negligible (the difference was less than 5%) when the distance between the line and the building was more than 100 m. For lower values, the effect was consistent and led to an attenuation of 50% when the line was 10 m from the building.
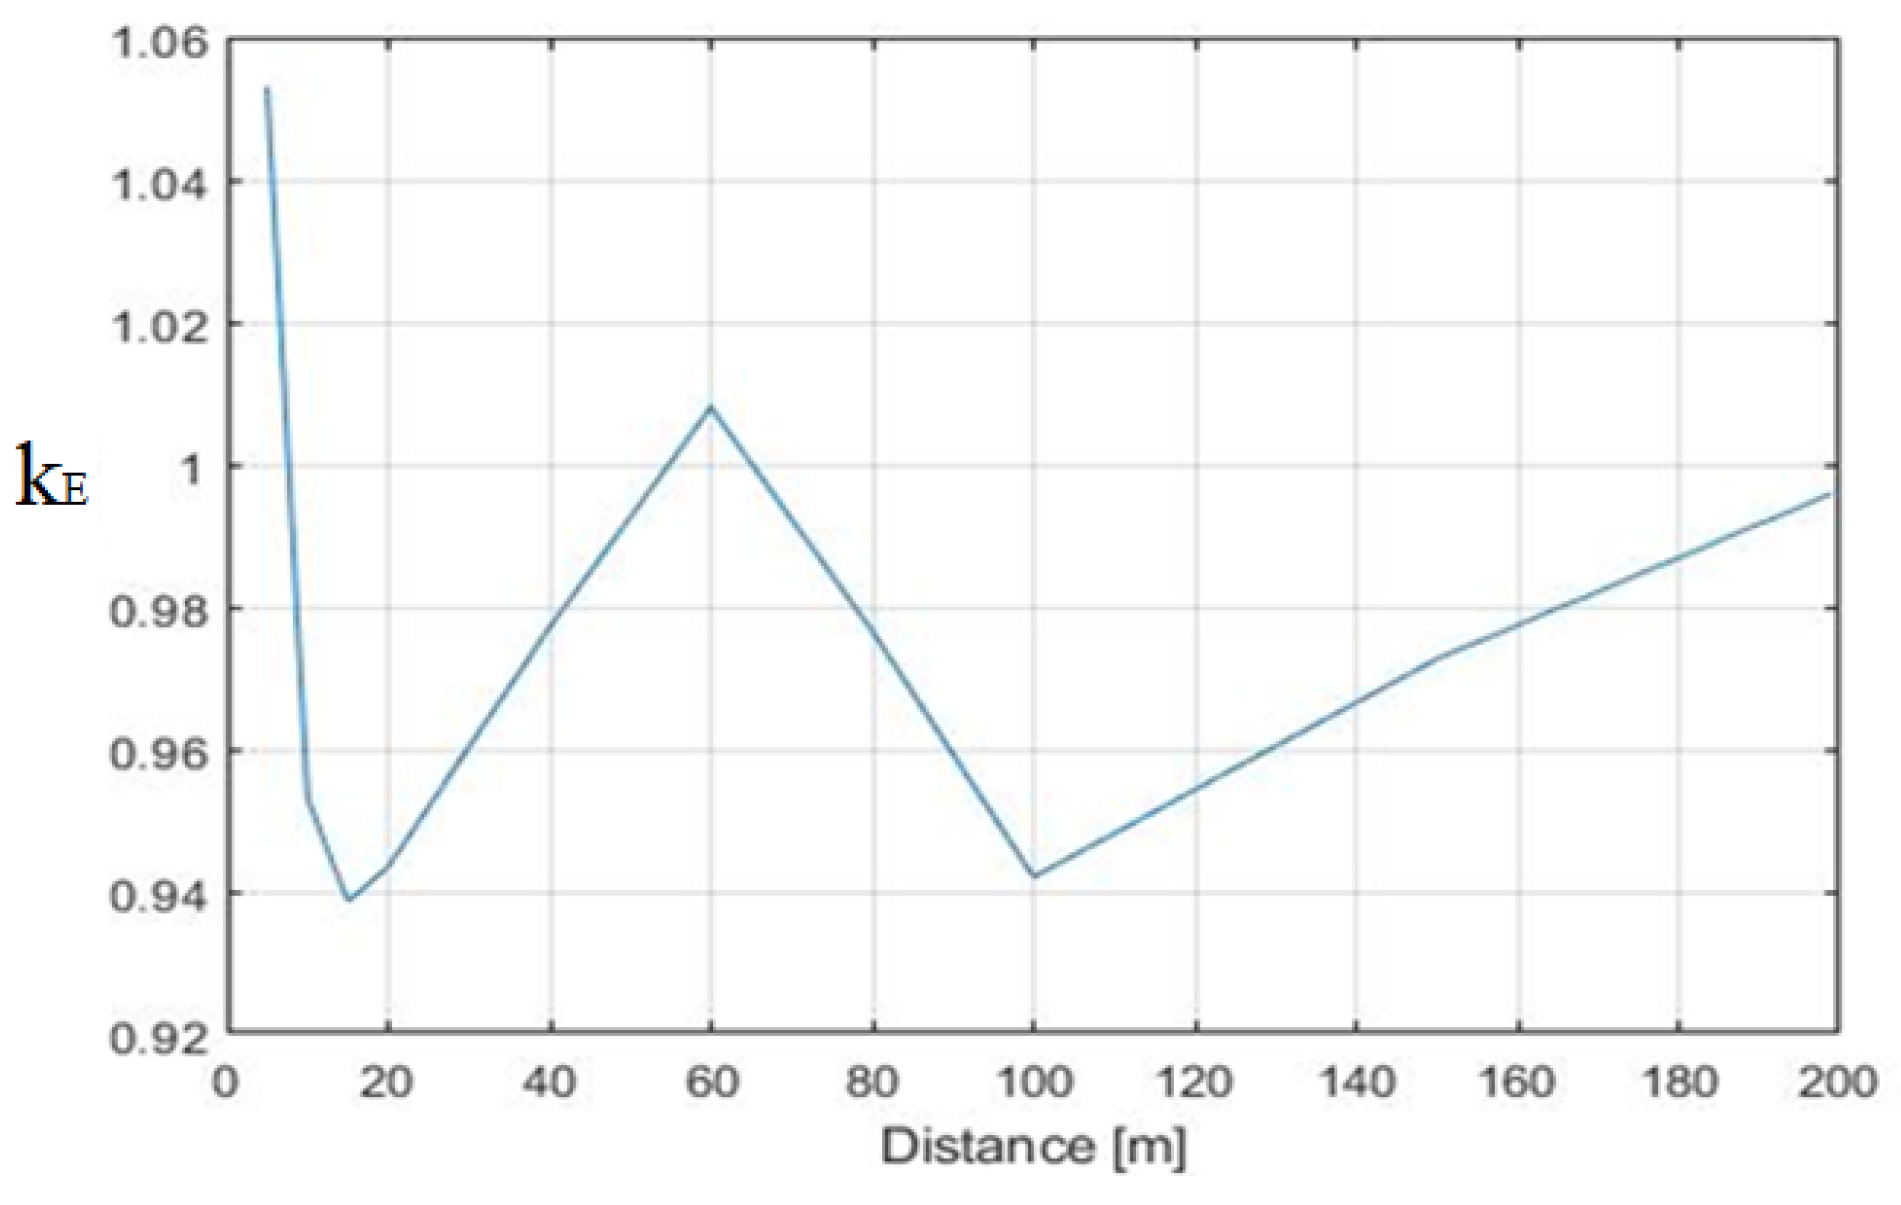
On the other hand, when we dealt with a building that was lower than the line (i.e., H = 5 m), the attenuation was substantially negligible, as can be observed in Figure 4. In this case, it is important to notice an attenuation greater than one () when the line was extremely close to the building, which means an enhancement of the maximum electric field due to the presence of the building.
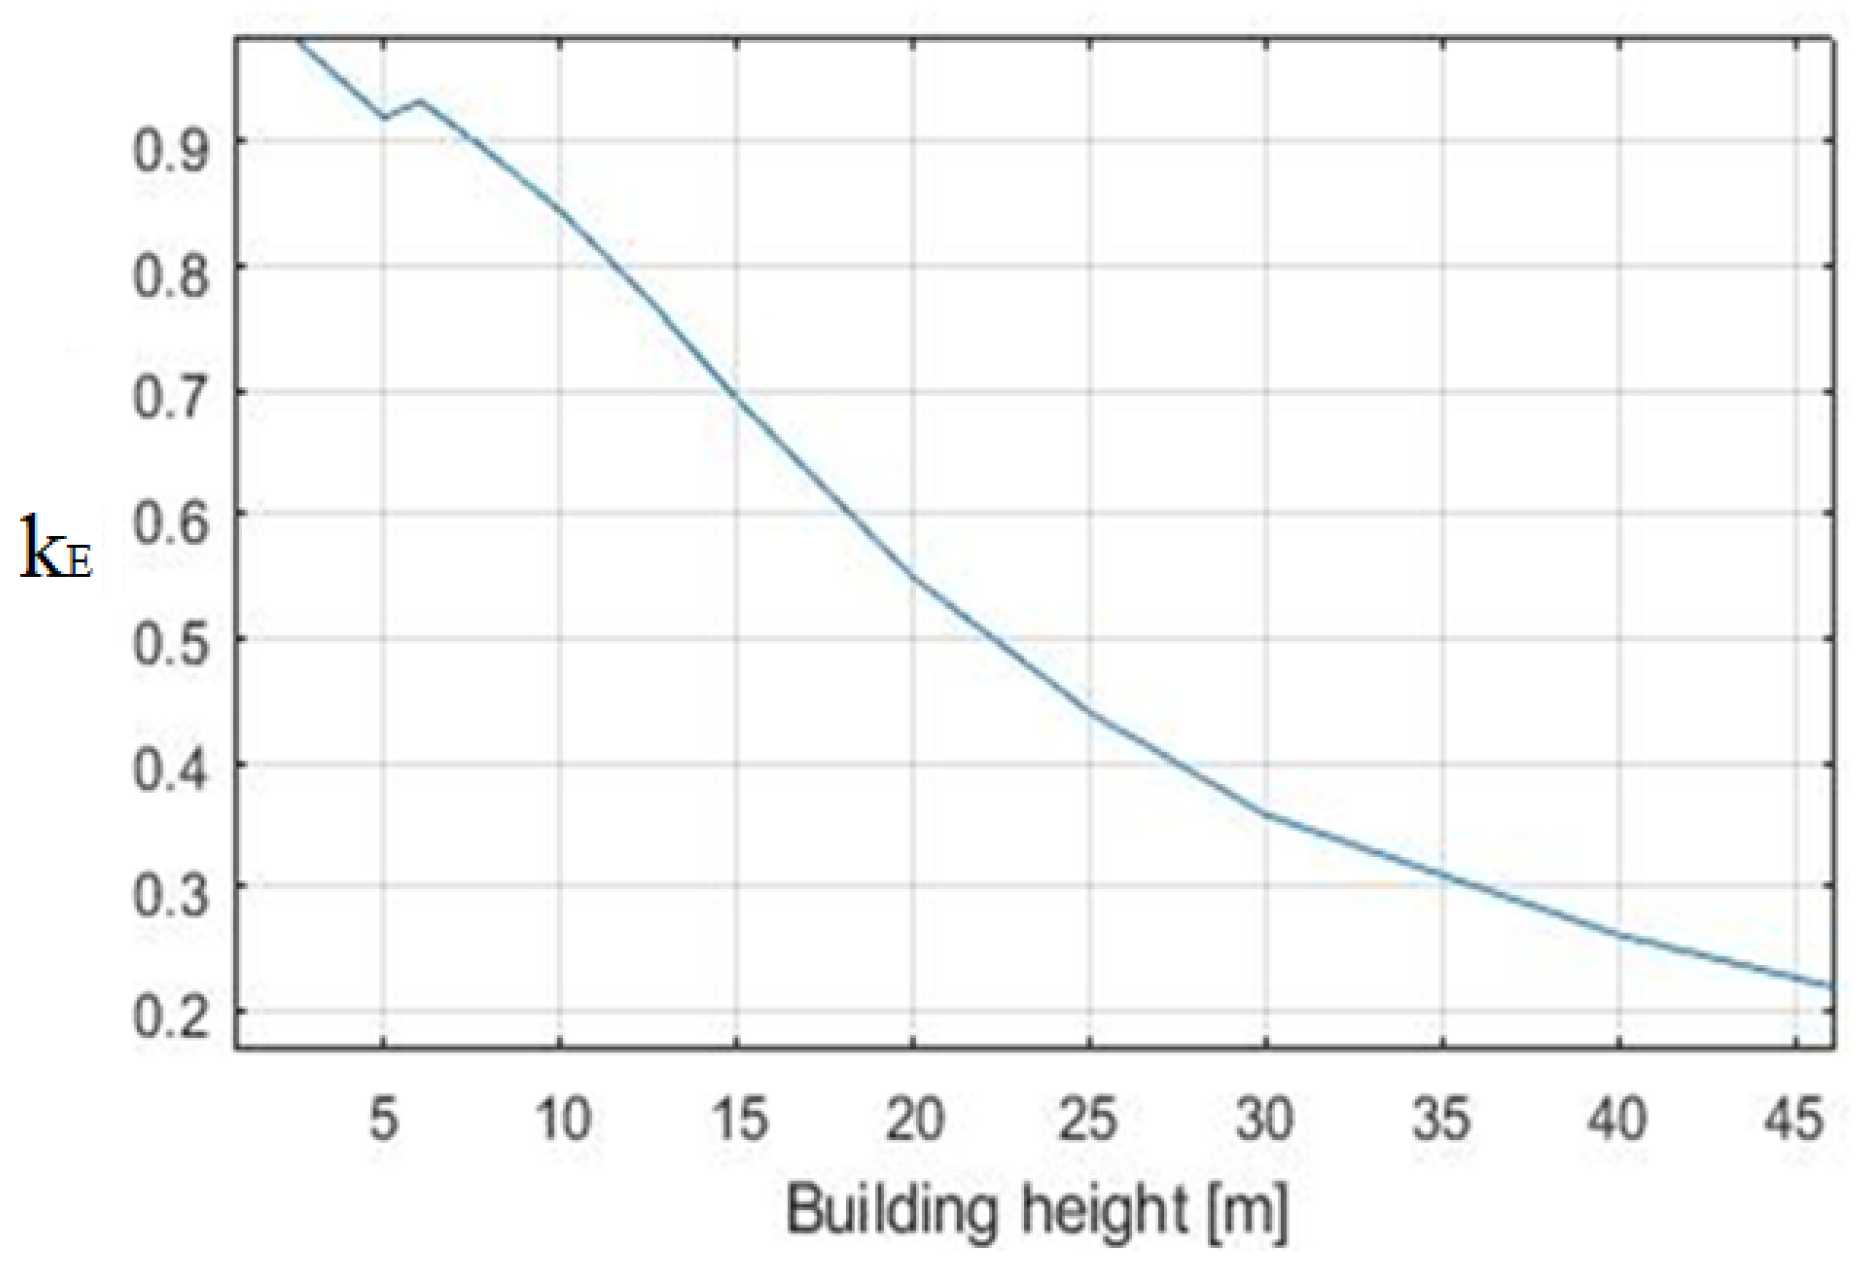
Figure 5 shows how the height of the building influences the attenuation of the electric field on the conductor and confirmed that the higher the building the higher the , leading to ratios between the maximum electric field with and without the building up to 0.2 when the height was more than 40 m.
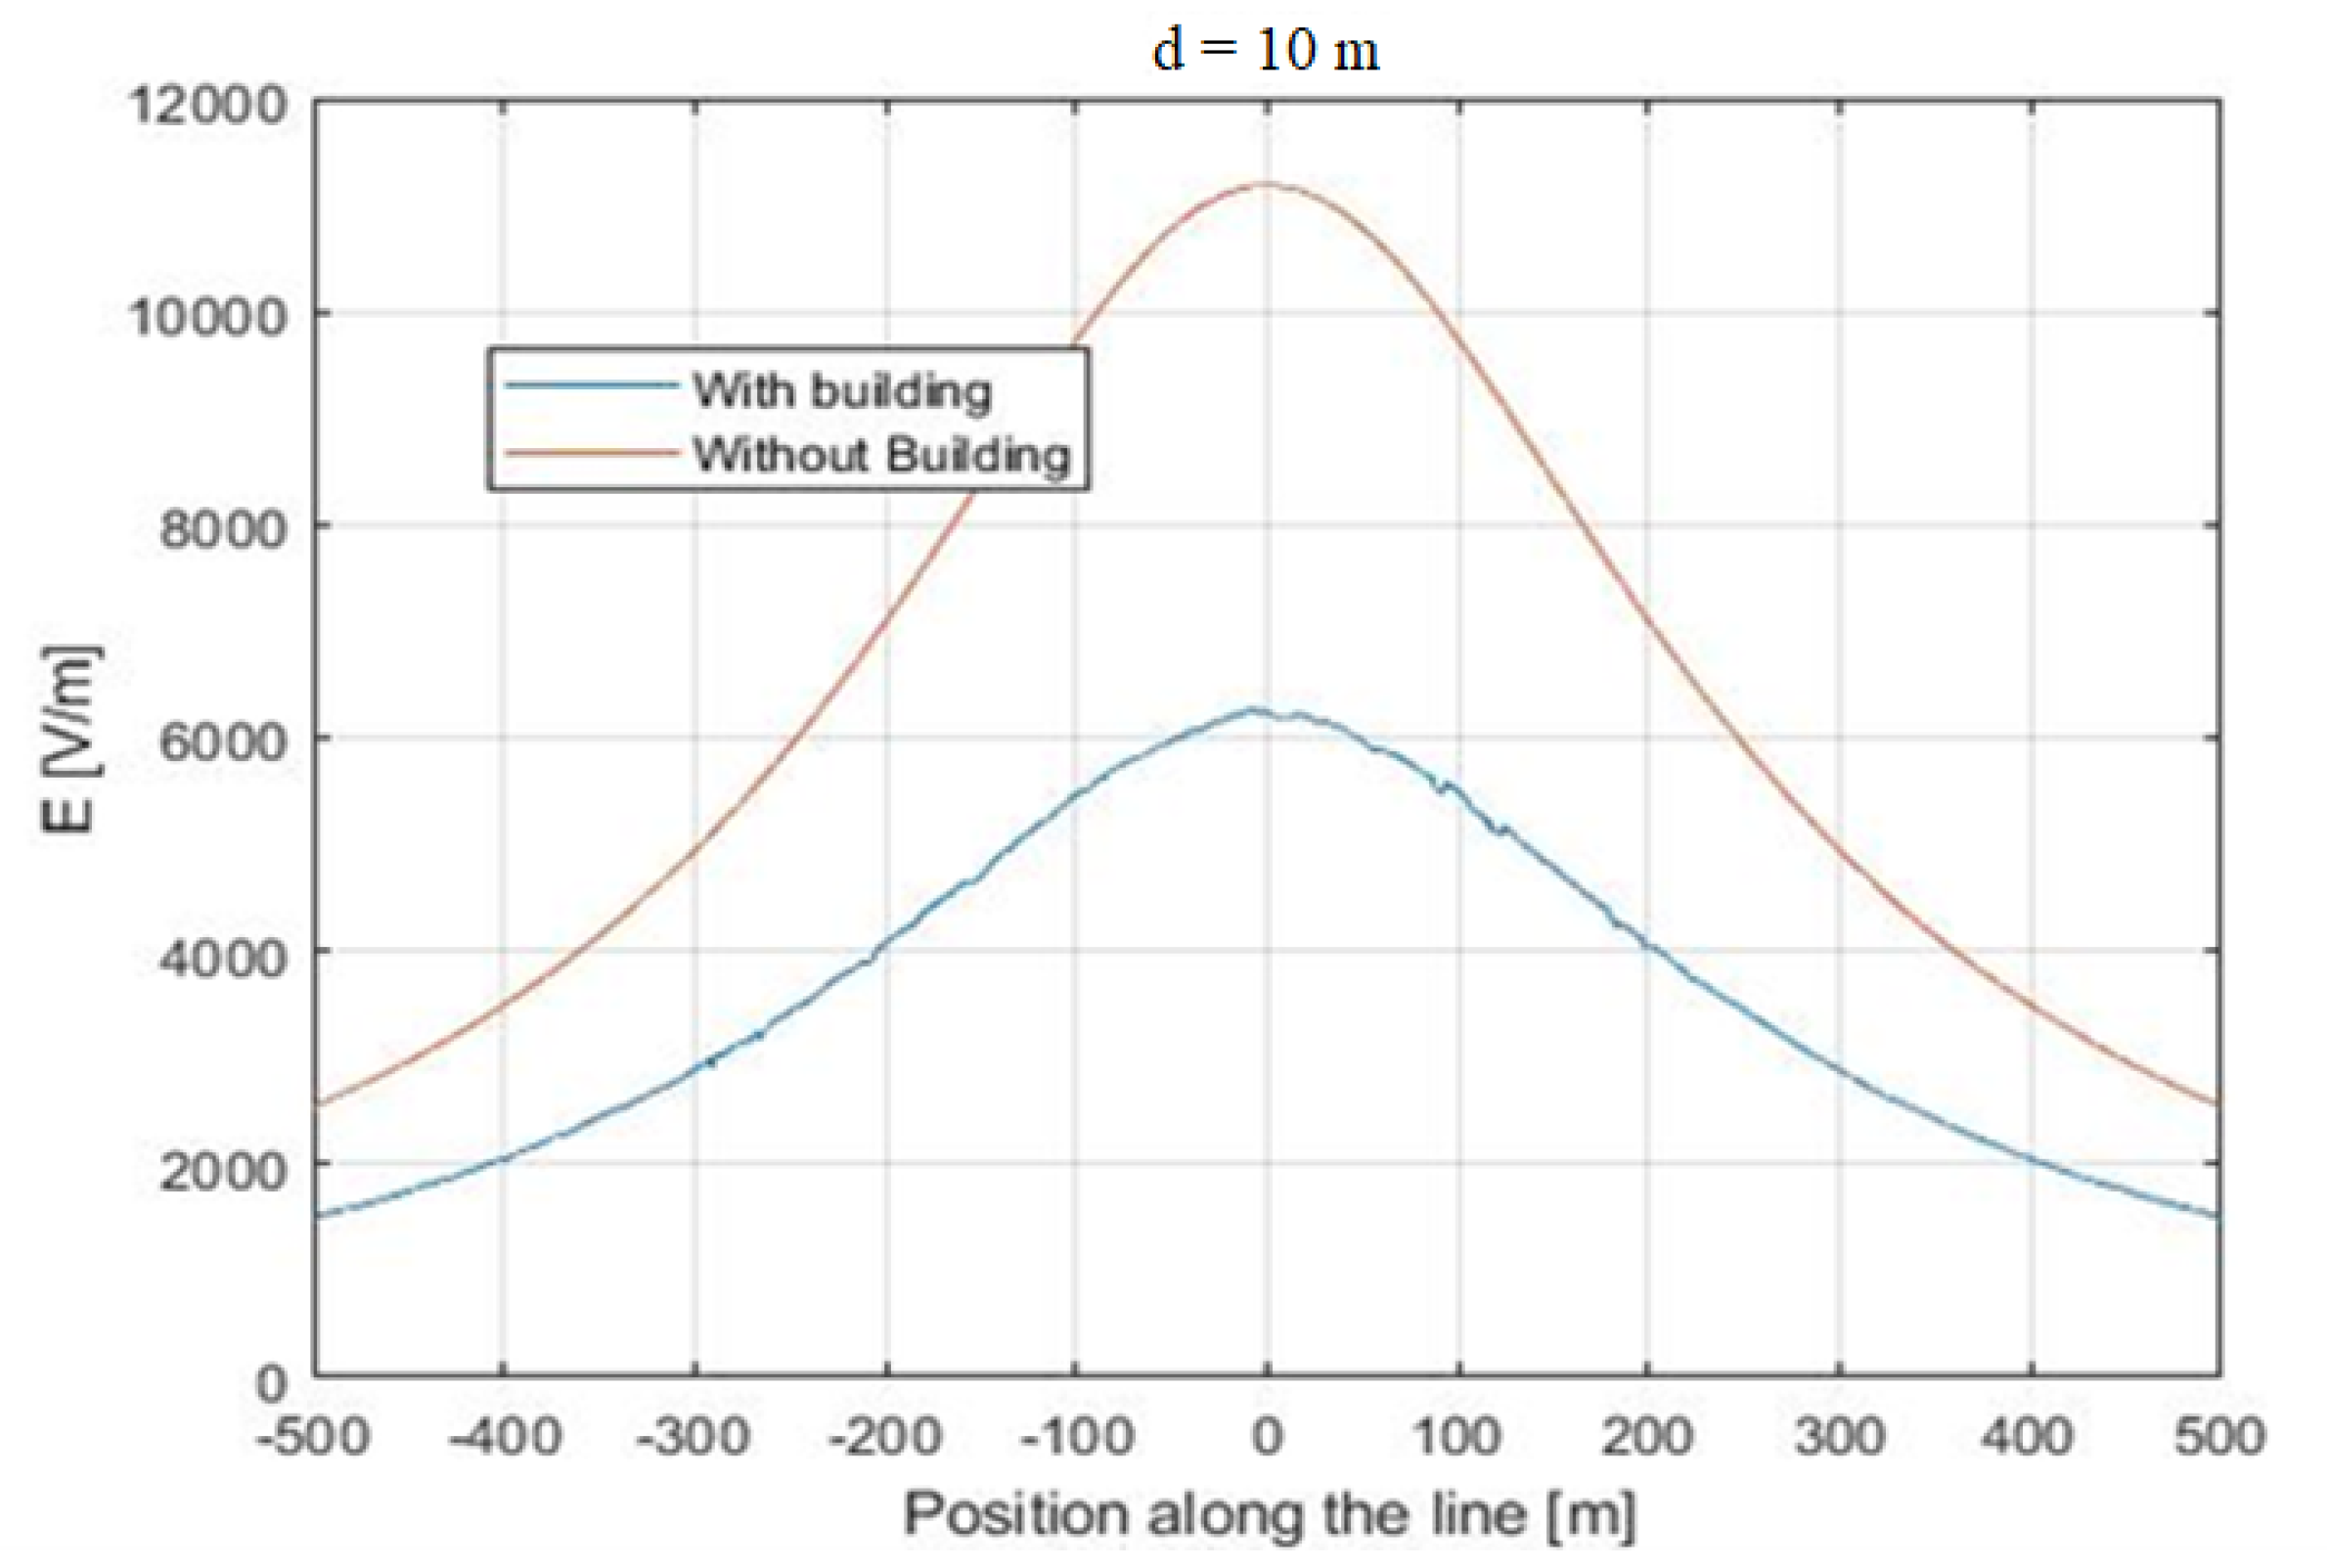
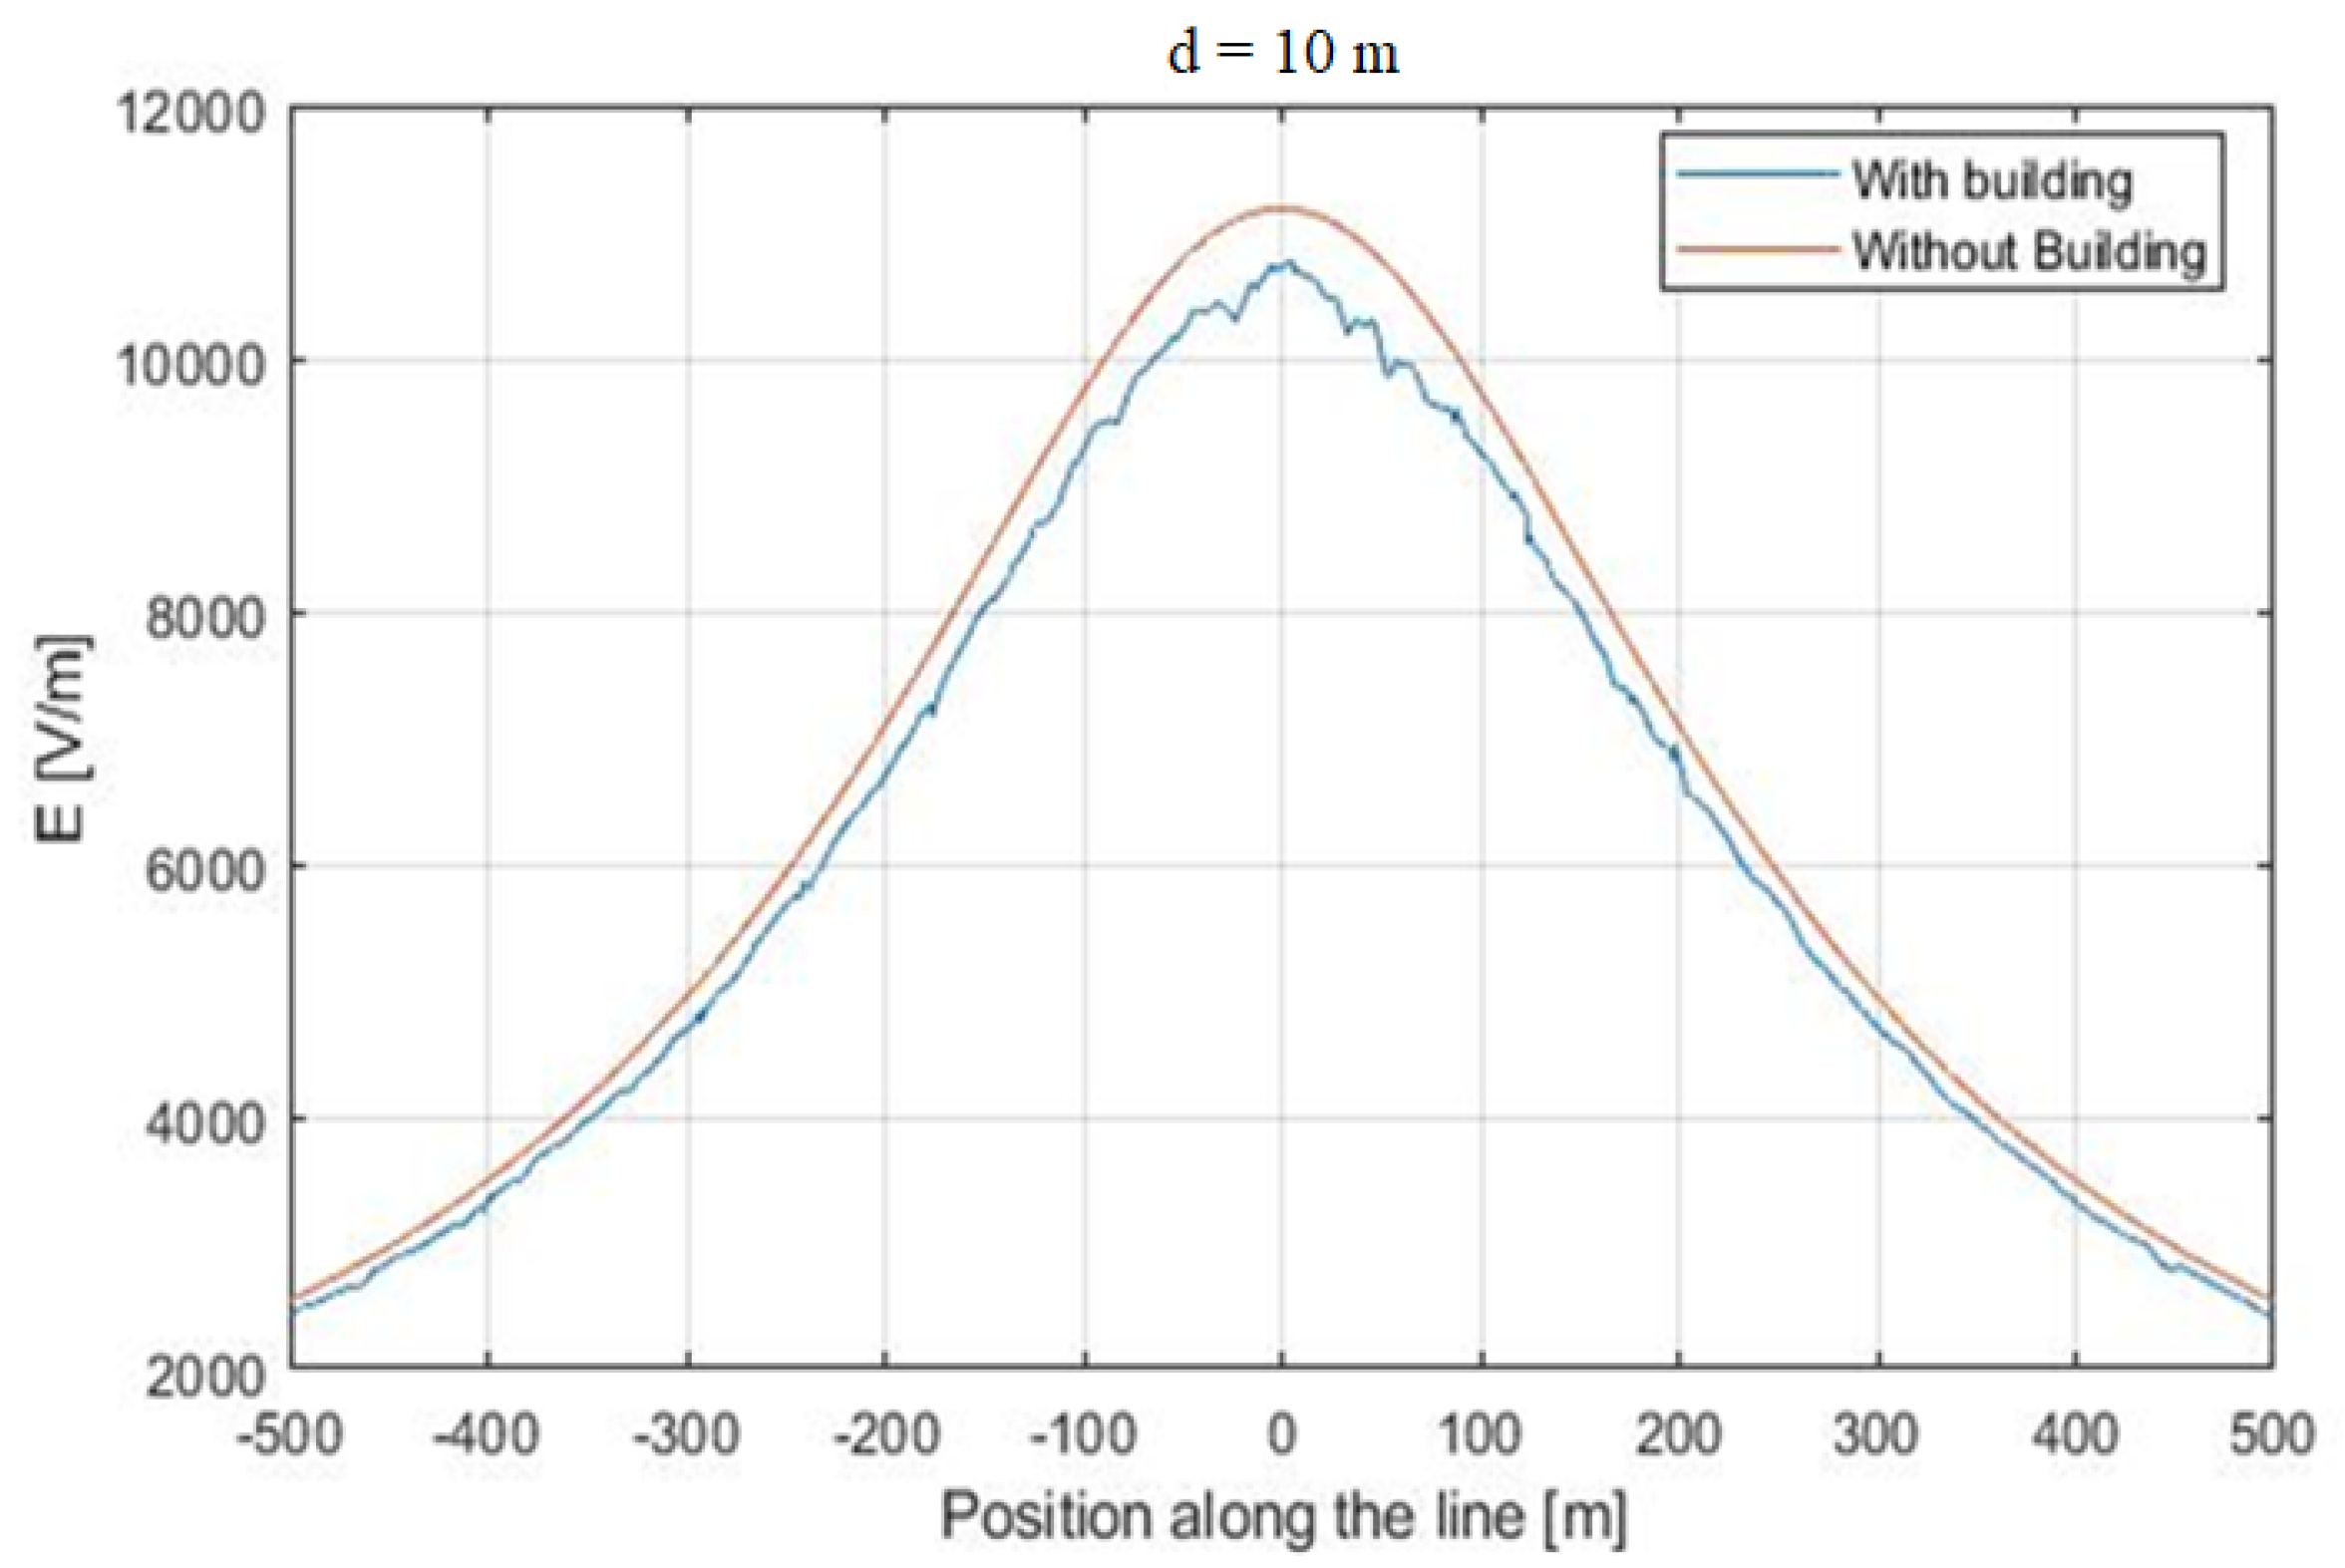
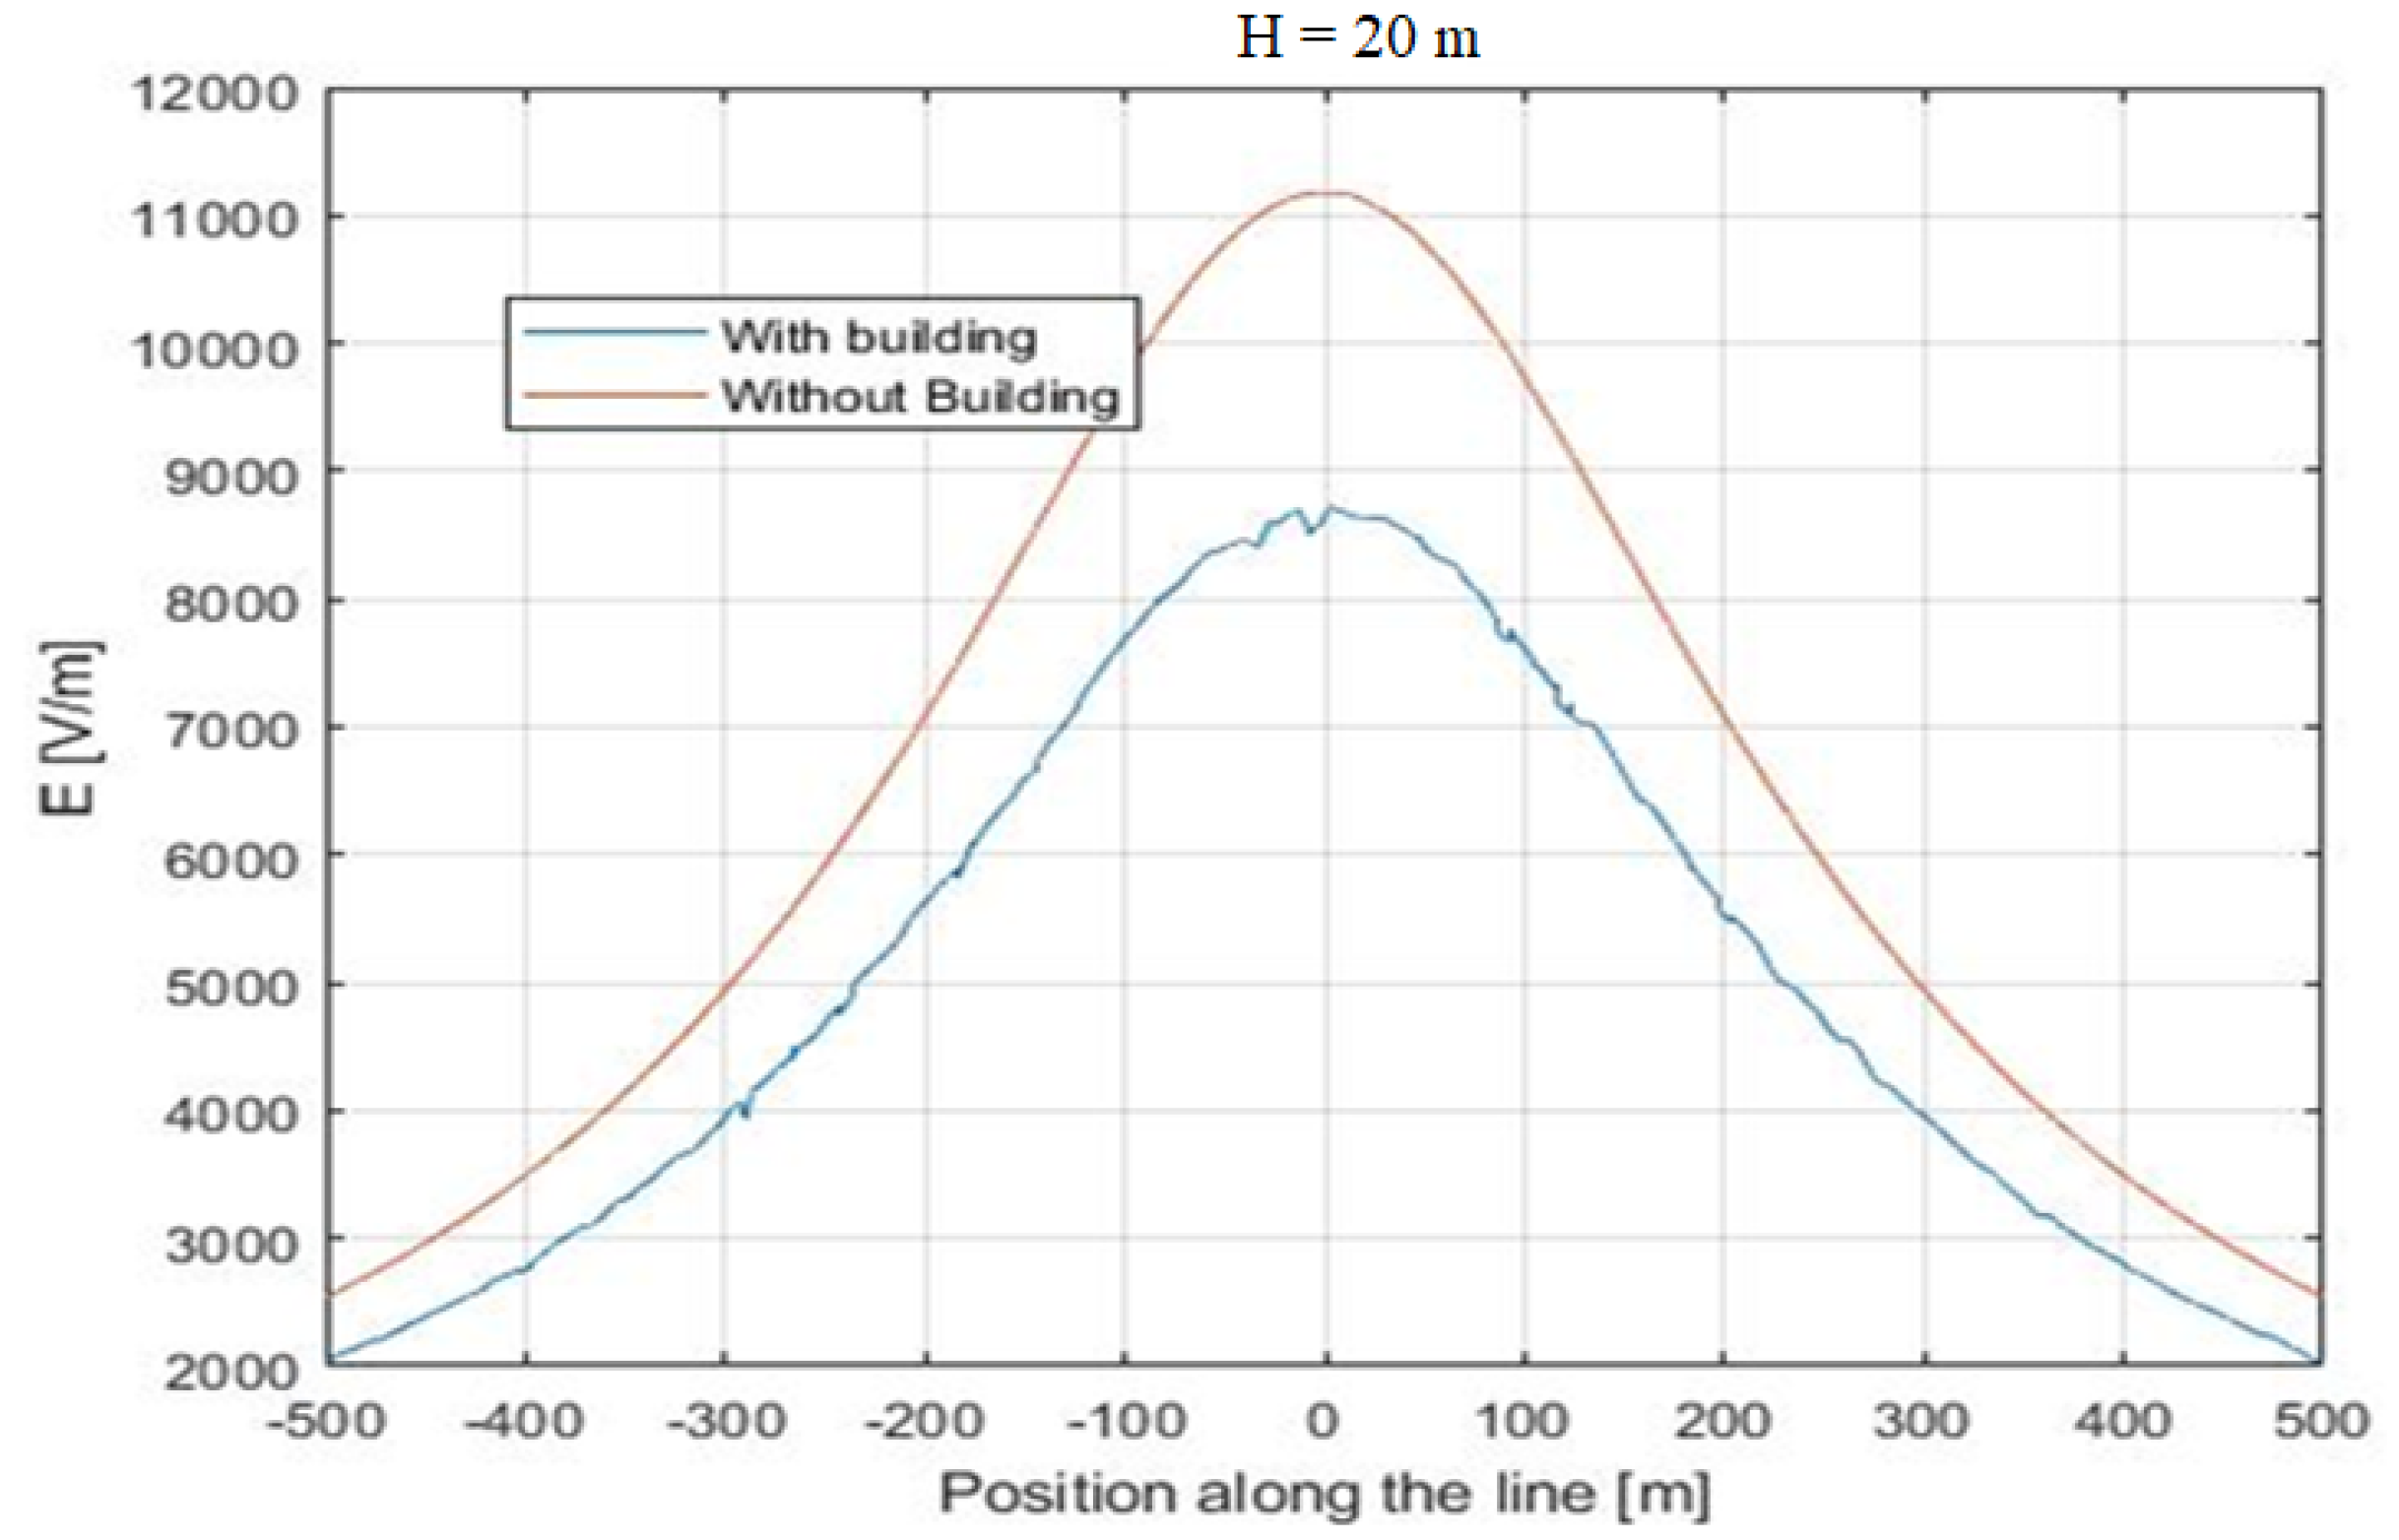
Analyzing the electric field measured at , it can be observed that the behavior along the whole line was similar to the behavior at the central point. In other words, changing the observation point along the line, the attenuation was kept almost constant. Figure 6 and Figure 7 are plotted assuming m, while Figure 8 is relevant to the case of m. The analysis of Figure 6 shows that the presence of buildings also reduced the electric field at the line terminations from 2.5 kV/m to 1.7 kV/m. The reduction cannot be considered constant along the whole line, as at the central point, it varied from 11.2 kV/m to 6.1 kV/m, which was a more consistent percentage reduction. The same analysis can be performed for Figure 8.
3.2. Induced Voltages
In this subsection, the ratio () between the maximum value of the induced voltage on the line with () and without () the building is analyzed for all three sets of simulations (A, B, and C). The line diameter was 1 cm.
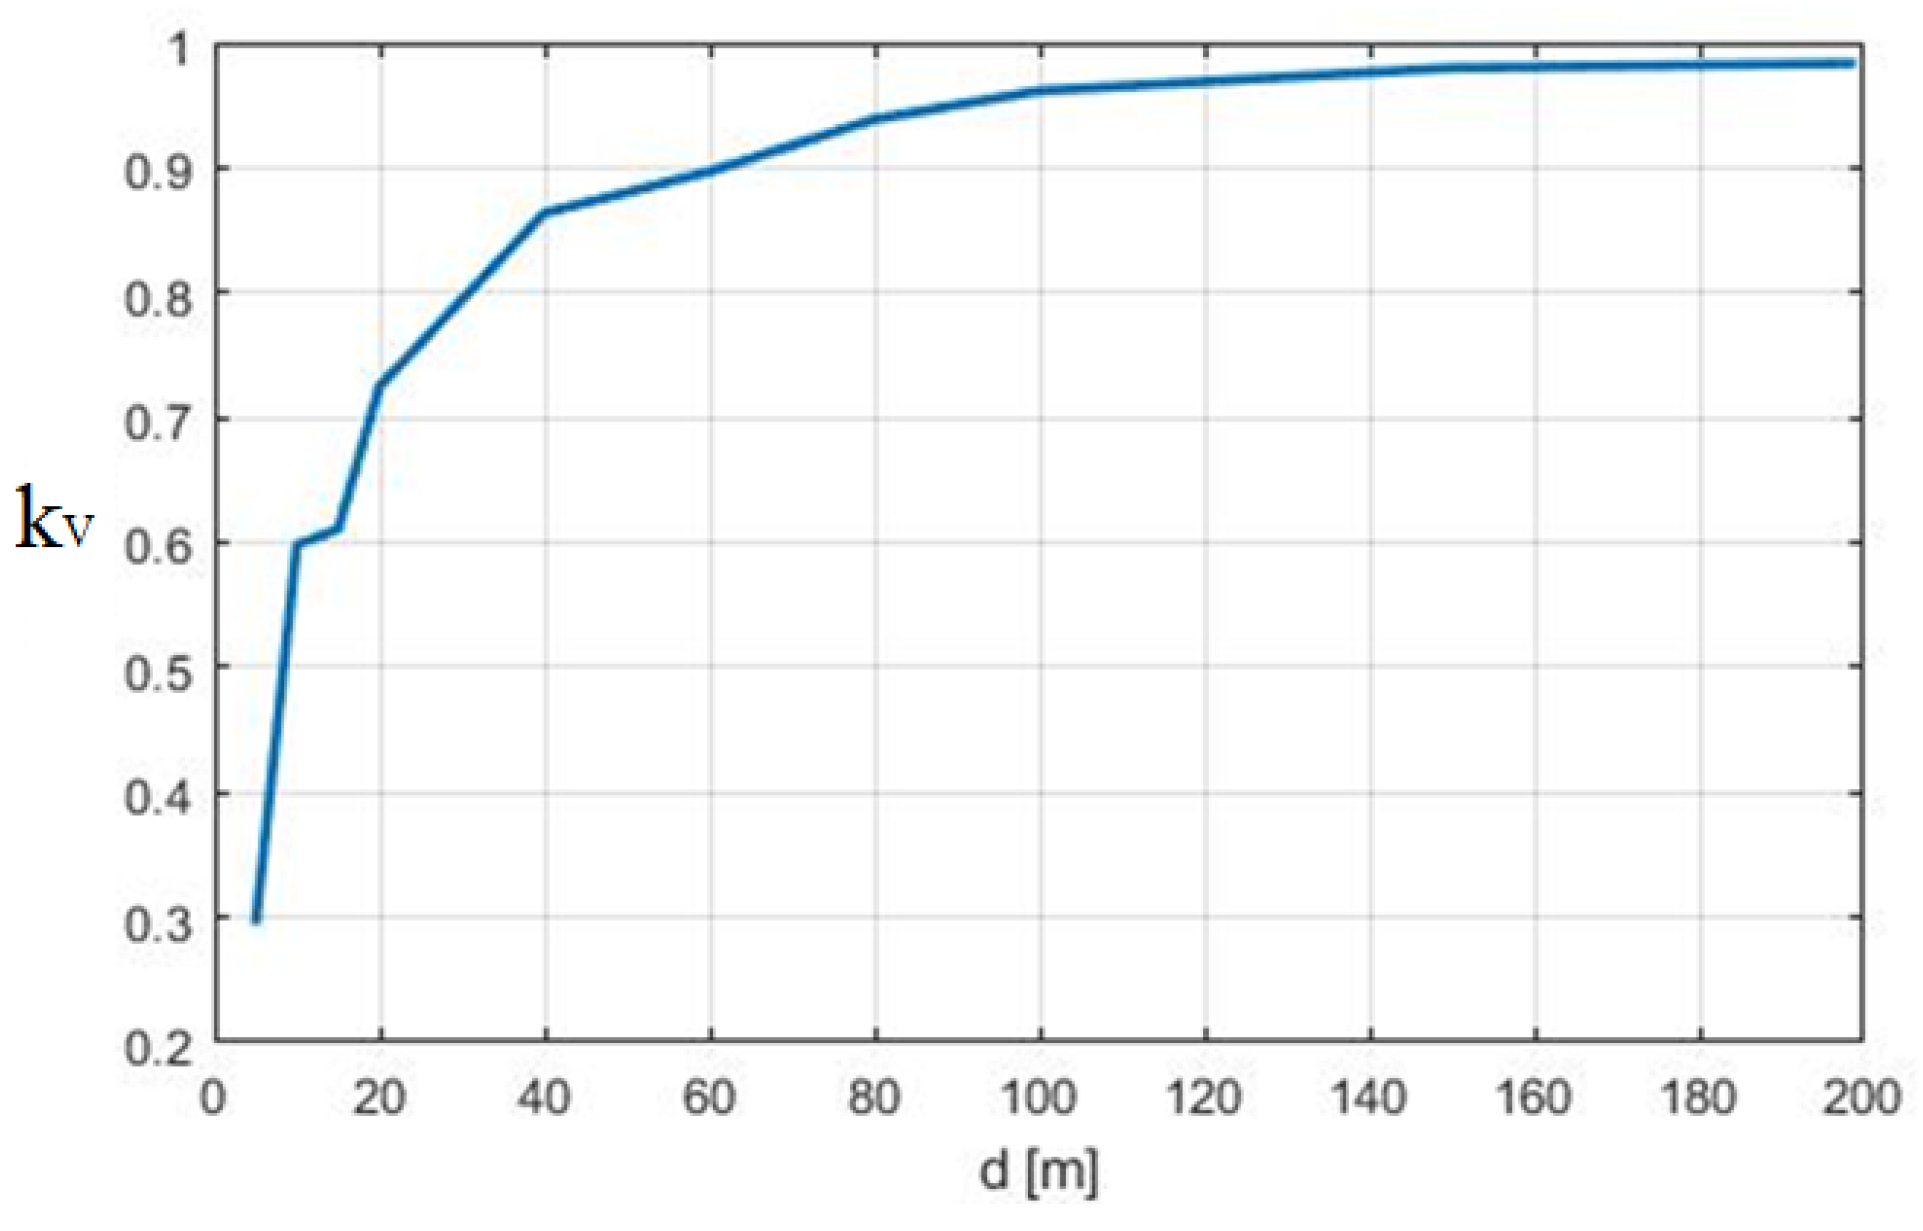
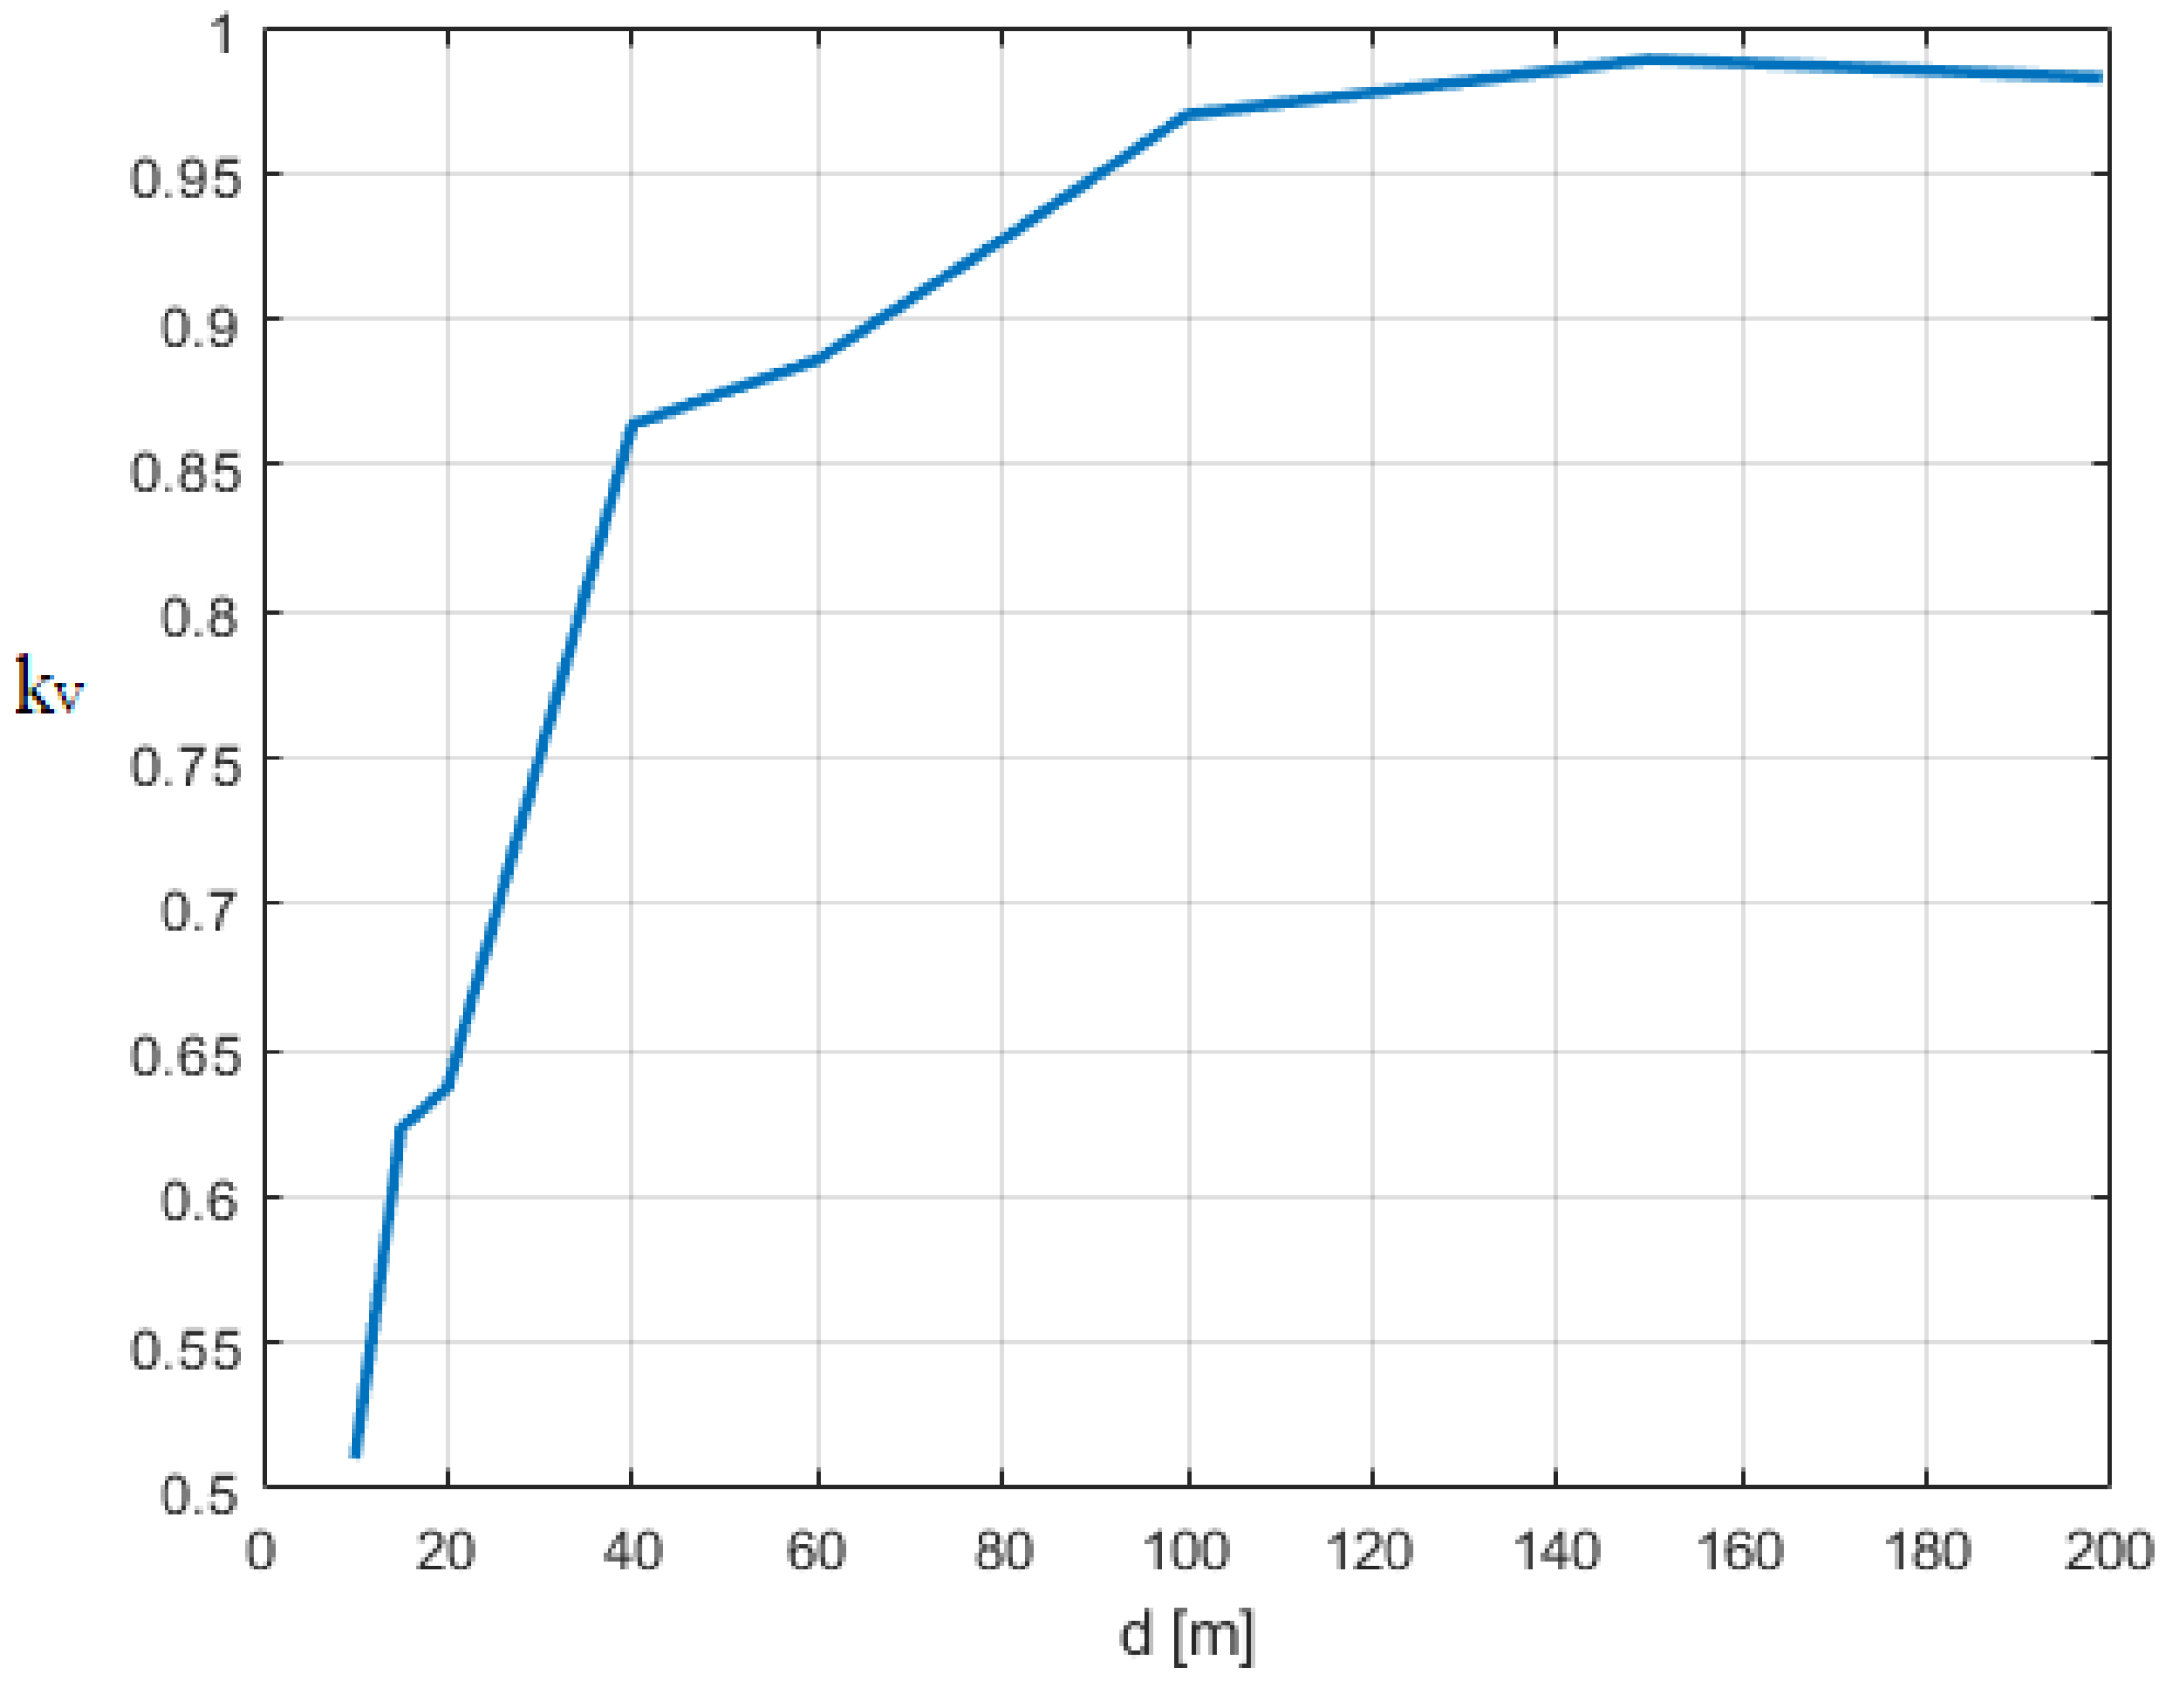
As for the EM fields’ comparison, when the building was higher than the line (Figure 9), the attenuation became negligible (i.e., ) when the distance was more than 100 m (less than 5% deviation was observed). As a consequence, when dealing with buildings more than 100 m from the overhead line, their contribute is negligible and the analysis can be performed considering only the presence of the line.
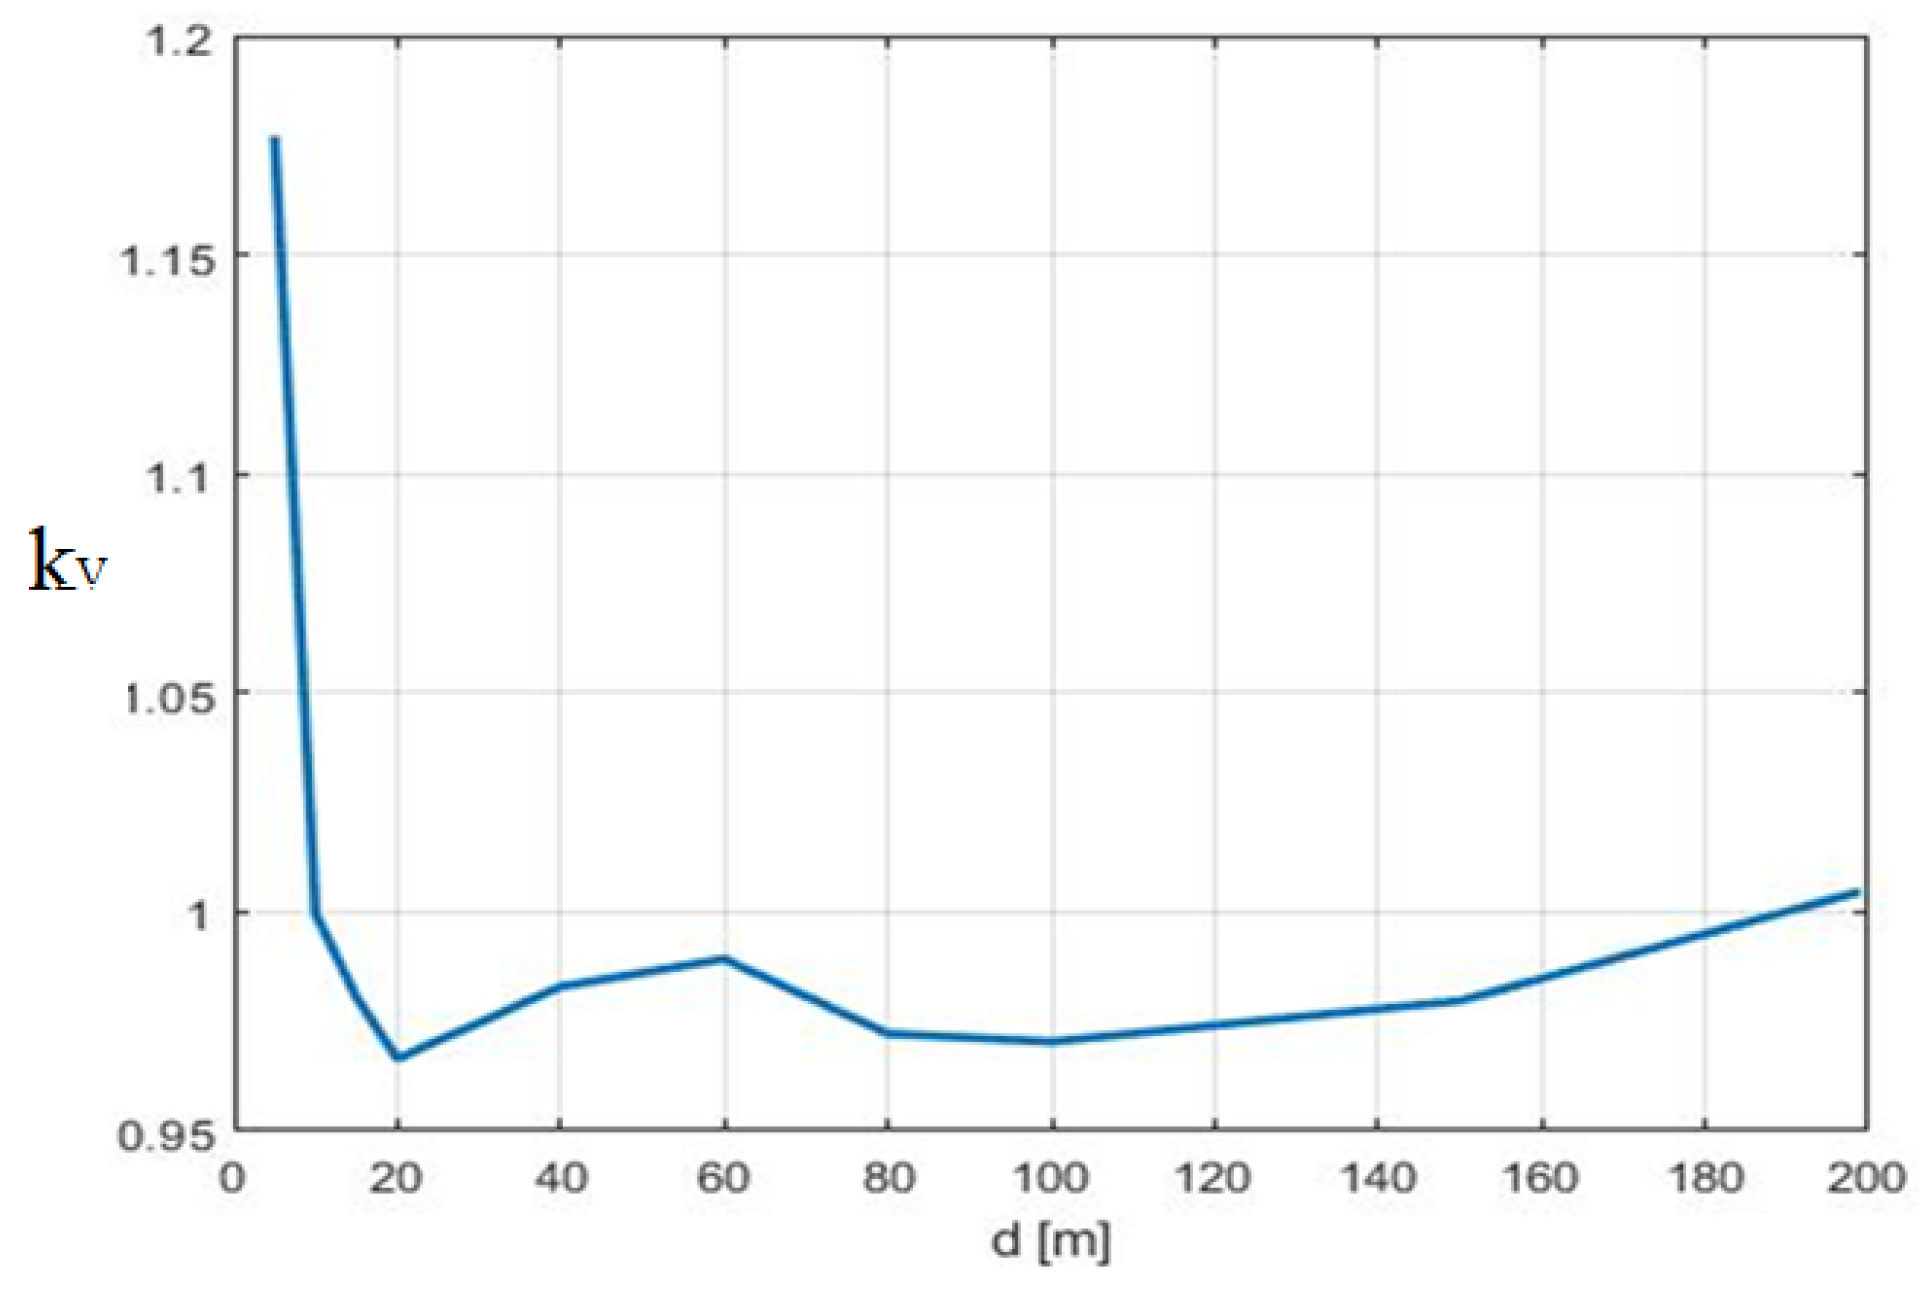
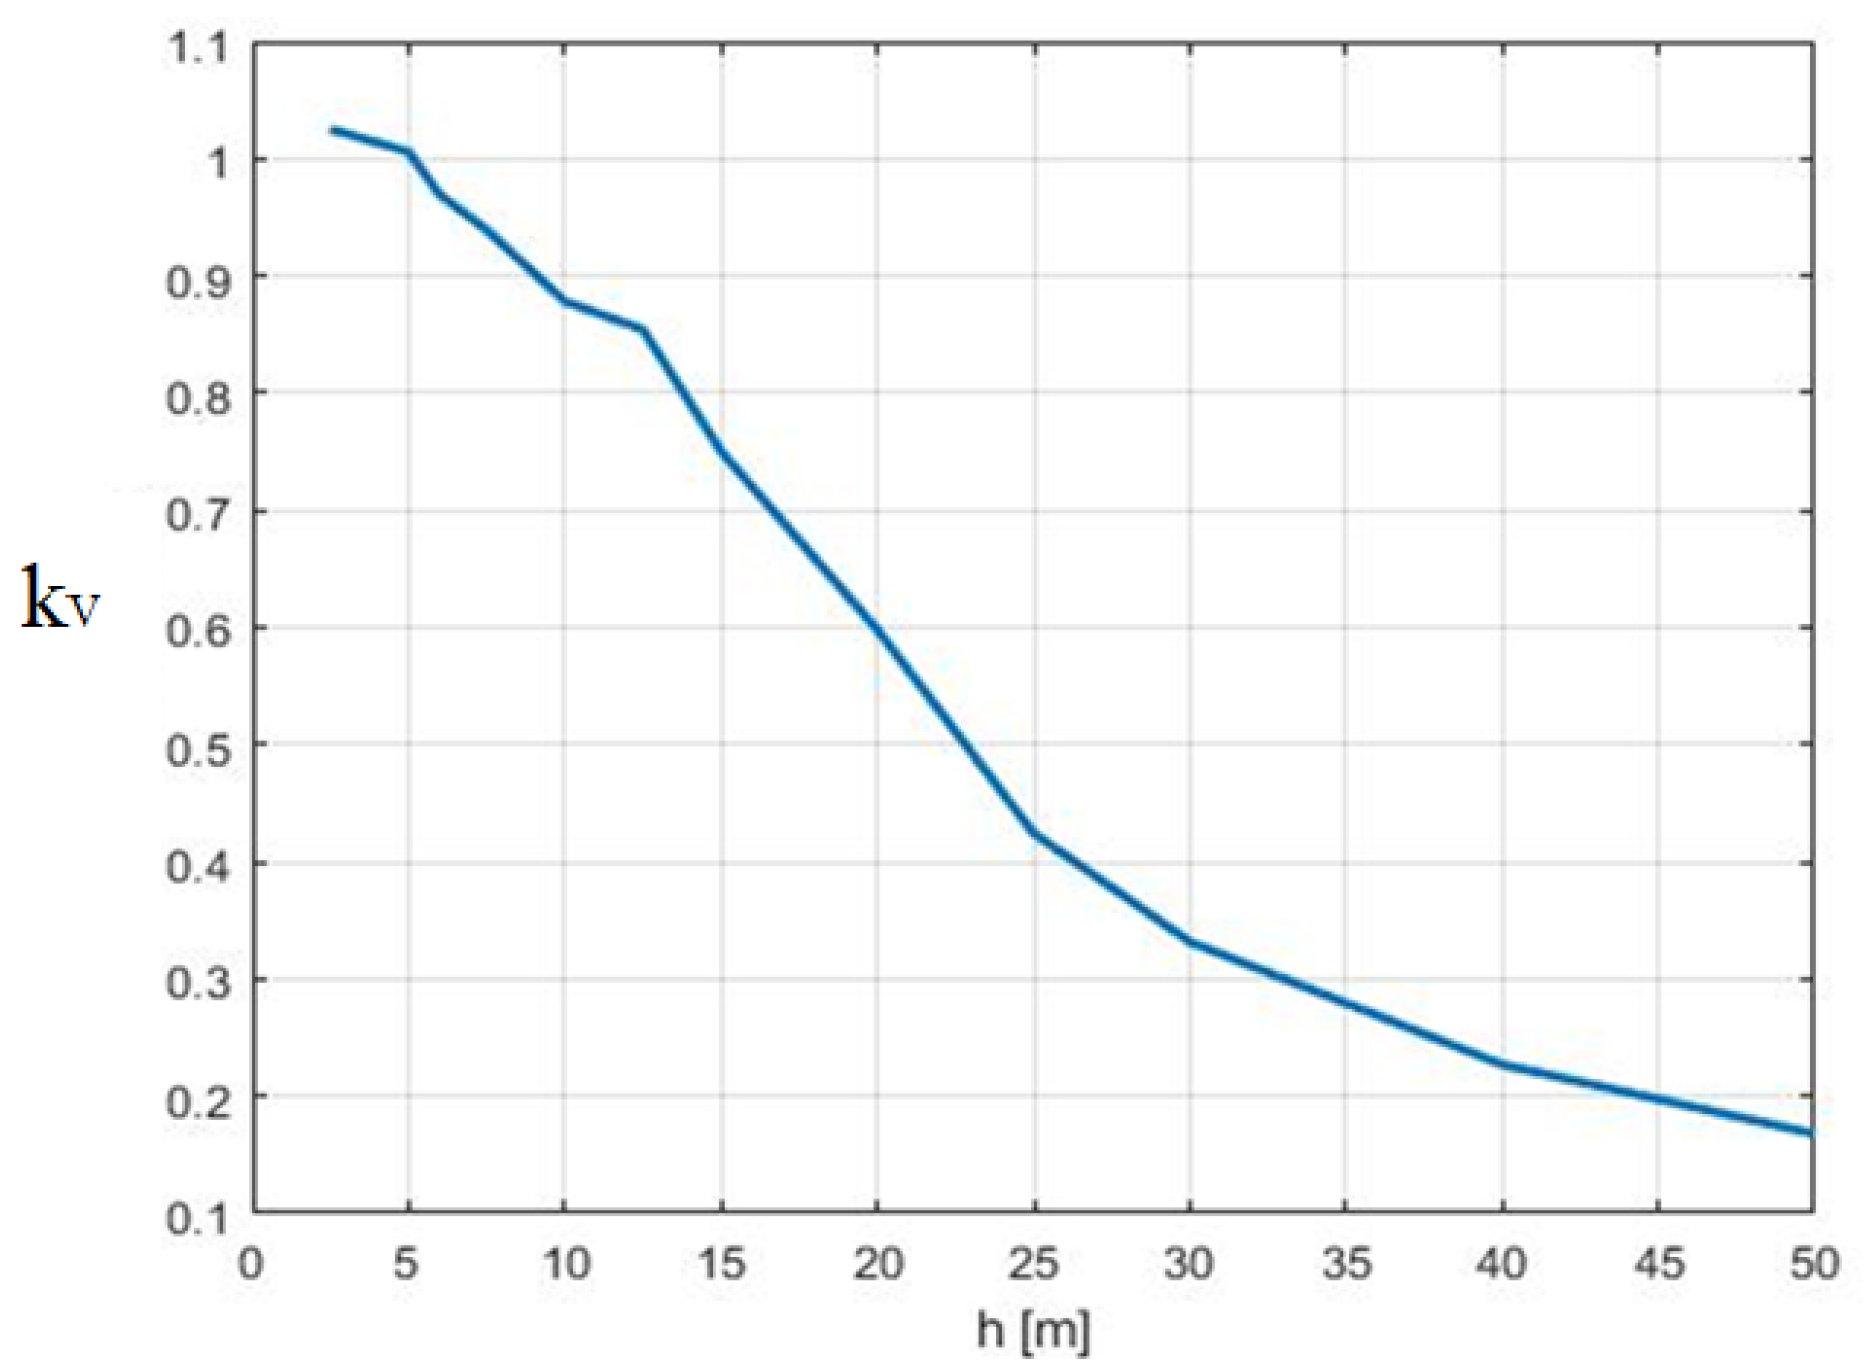
On the other hand, when the building was lower than the line (i.e., Figure 10), the attenuation coefficient was almost one for each line that was at least 10 m from the building. If the distance was less, an enhancement of the induced voltage () was noticed. The enhancement in terms of the maximum induced voltage on the line was higher than the one observed in terms of the EM fields. If the distance between the line and the building was kept constant to 10 m (i.e., Figure 11), and the line height varied, it is possible to observe that, as with the EM fields’ behavior, the maximum induced voltage became smaller than 20% of the no building case, if the height of the building was more than 40 m.
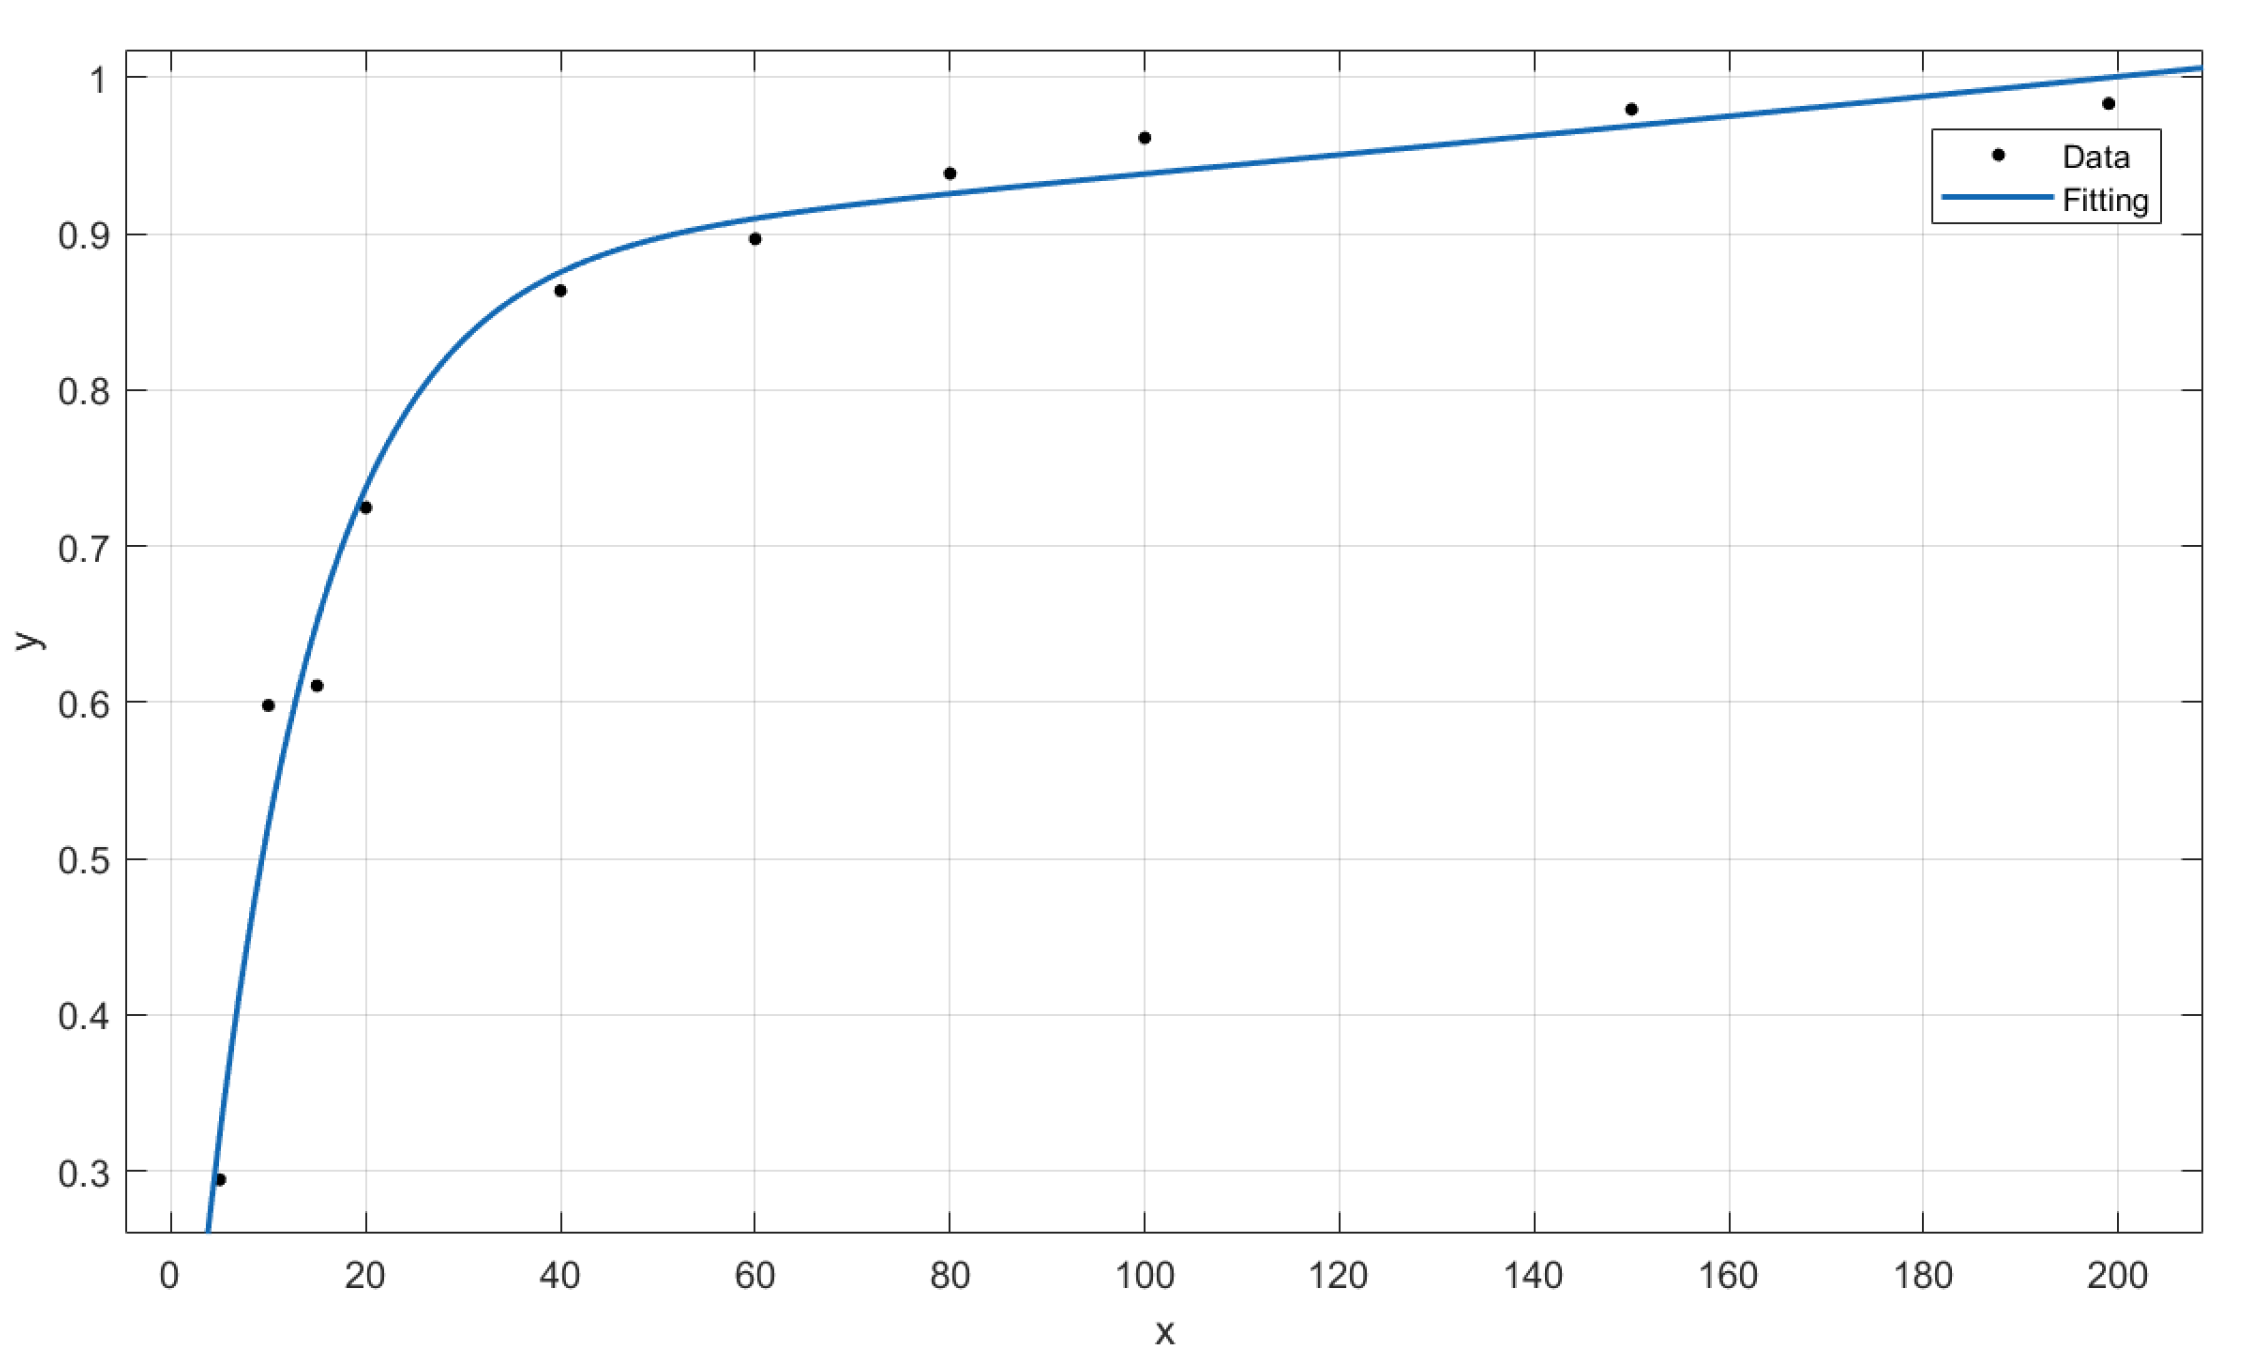
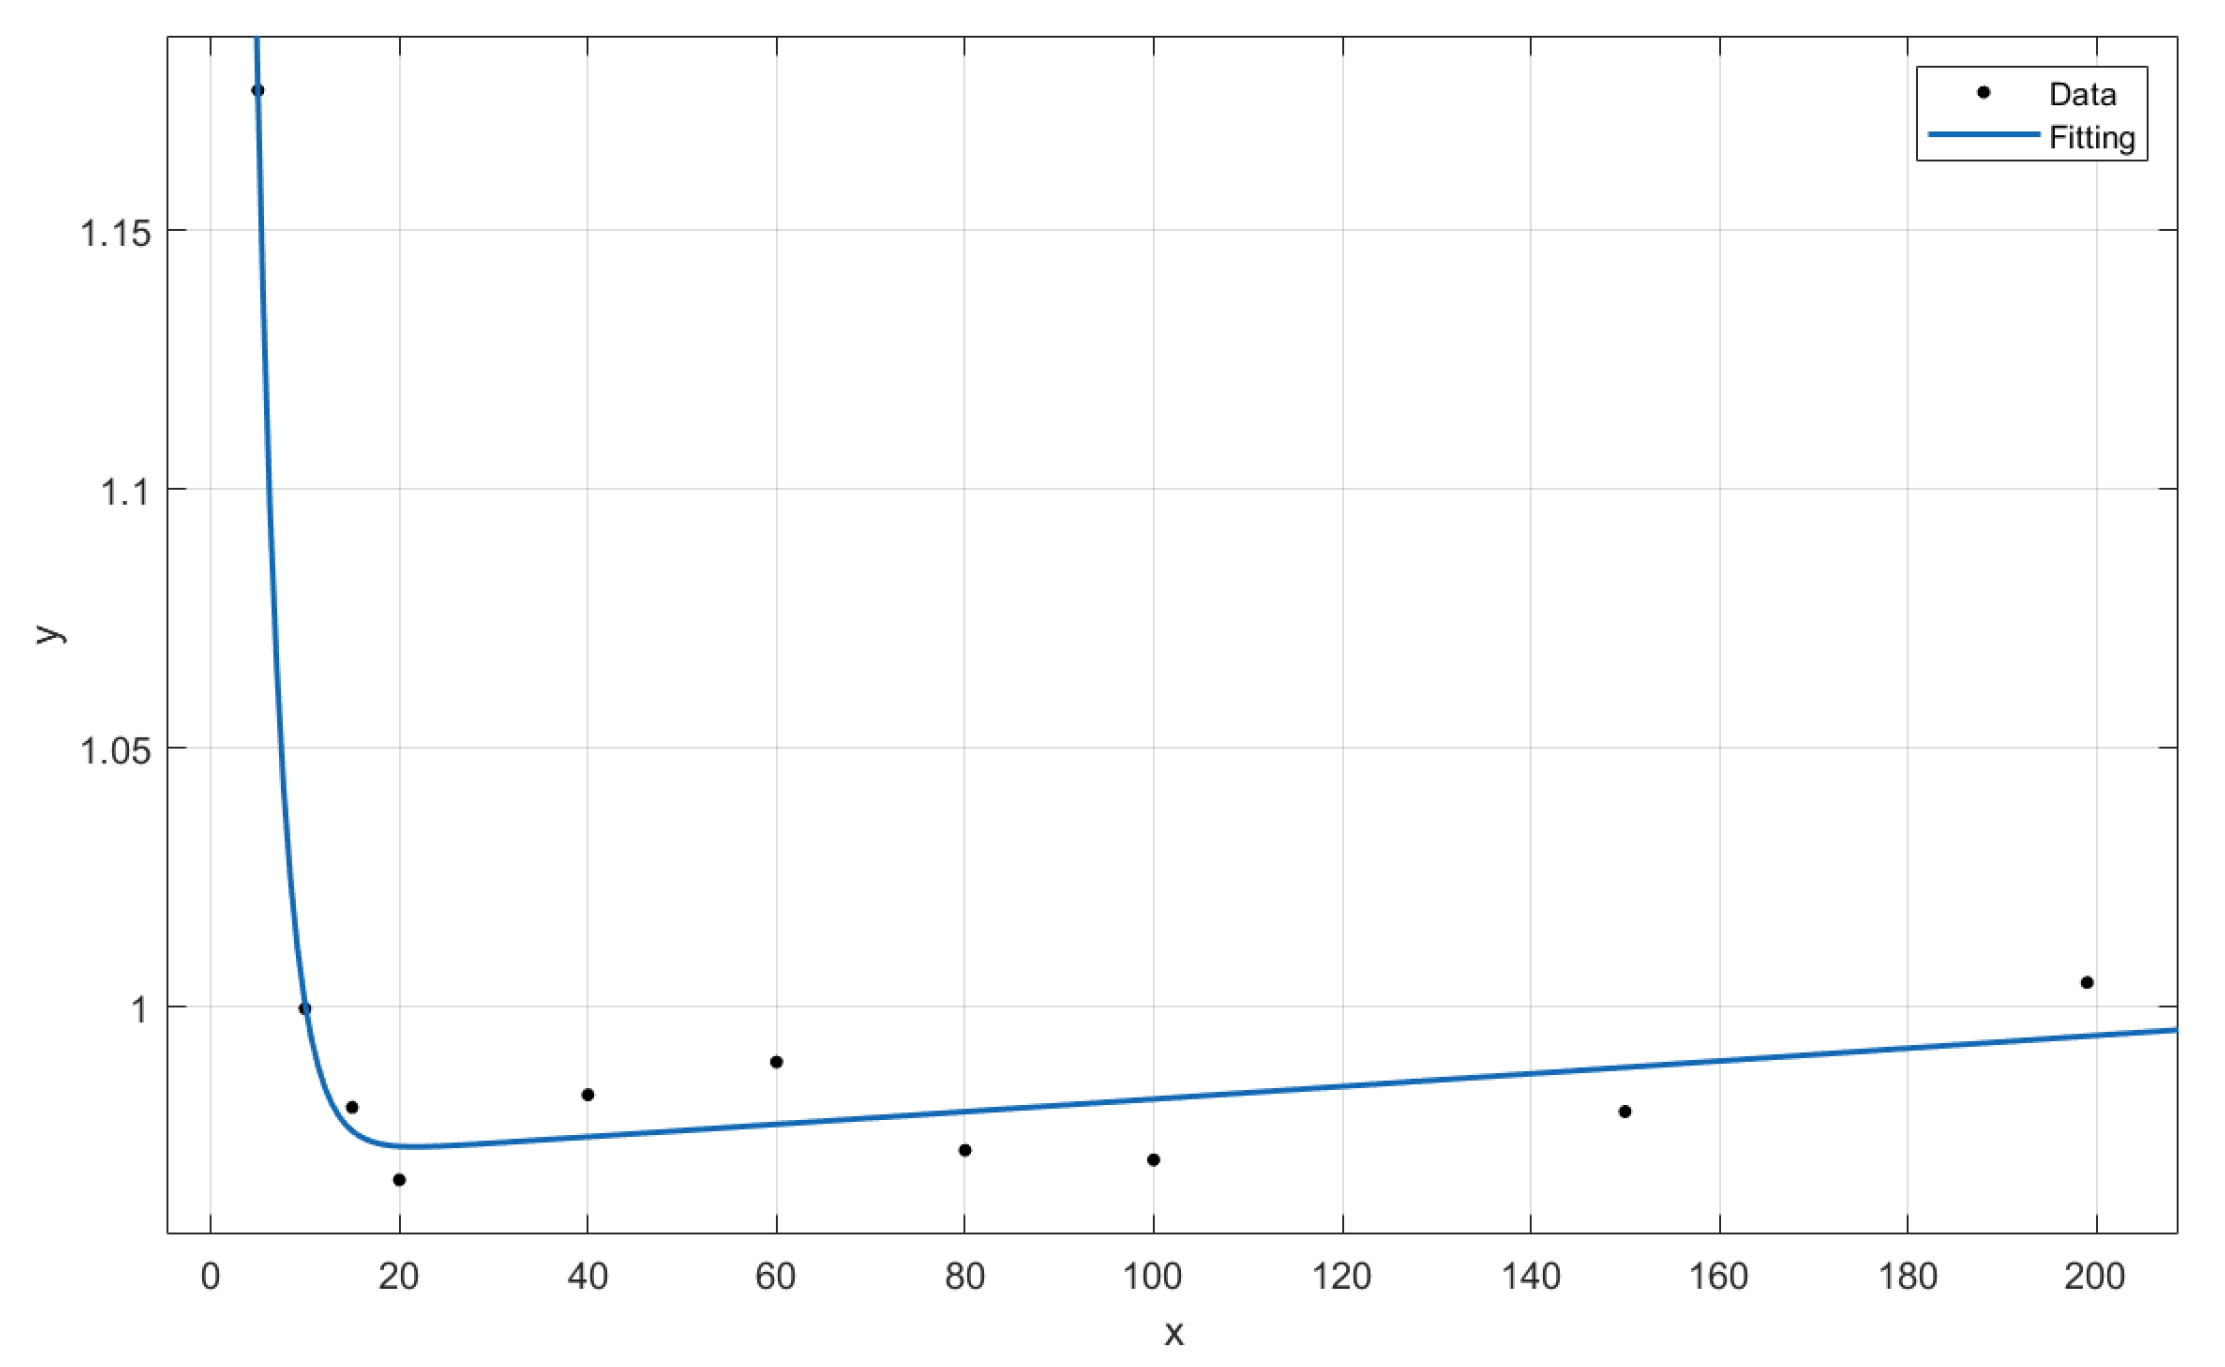
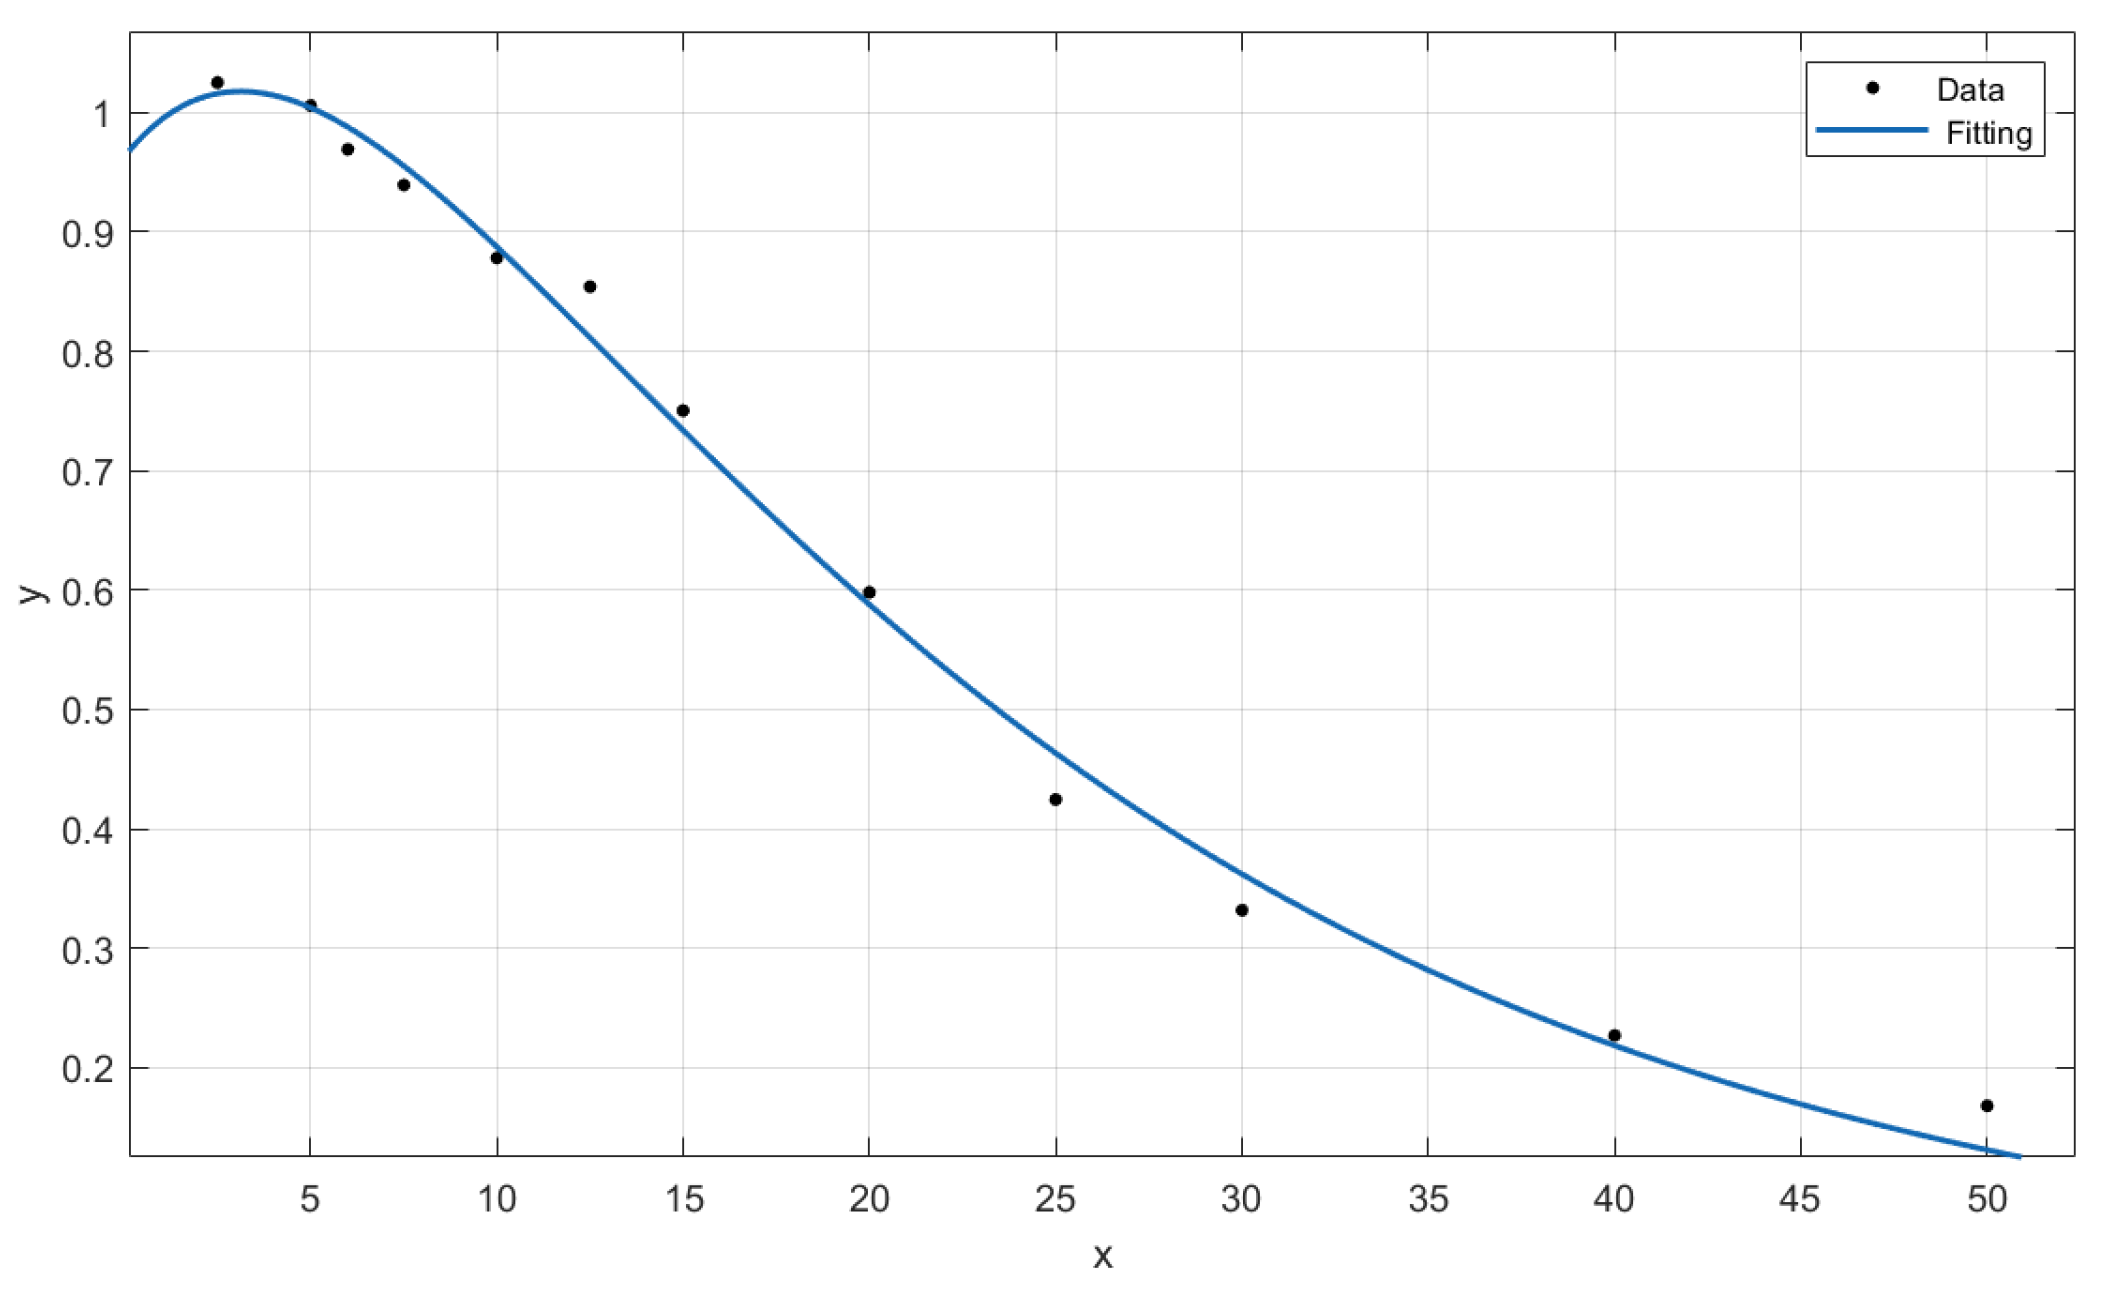
An analytical expression for is provided in what follows fitting the numerical outcomes of the previous section with the following double exponential function:
The values of , and are shown in Table 1, and x is the independent variable (d for cases A and B and H for case C).
The fitted curves are proposed in Figure 12, Figure 13 and Figure 14 for the sake of completeness and show a good agreement between the proposed expressions and the data obtained by means of the described simulations.
For the sake of completeness, in the final part of this section we analyze scenario A considering two different situations:
- An overhead line characterized by three conductors placed at 10 m, 1 m from each other
- A finite ground conductivity of 1 mS/m instead of a PEC ground.
4. Conclusions
The EM fields and the voltage induced on an overhead distribution line due to a lightning strike were analyzed considering the presence of nearby buildings. The EM fields were computed by means of an FEM simulation, while the induced voltage was obtained by means of an FDTD code (LIGHT-PESTO). Different configurations were analyzed, varying the distance between the line and the buildings and their height. The results showed that when considering buildings higher than the line, the EM fields and the voltage were substantially affected by the presence of buildings, if the distance between the line and the building was less than 100 m. On the other hand, if the building was lower than the line, its effect was almost negligible apart from an enhancement of the electric field and of the induced voltage for very close distances. The building’s height plays an important role in the attenuation of the considered quantities, since buildings characterized by a height of 40 m can reduce the electric field and the induced voltage up to 20% of what would be measured in their absence. The proposed analysis can be used as an estimator of the attenuation due to the presence of buildings; the attenuation can be taken into account by means of approximate formulas, which can be implemented in analytical methods providing the maximum voltage observed on an overhead line due to an indirect stroke.
Author Contributions
Data curation, F.M.; Investigation, F.M.; Supervision, R.P.; Writing—original draft, D.M.; Writing—review & editing, M.B. All authors have read and agreed to the published version of the manuscript.
Funding
This research received no external funding.
Conflicts of Interest
The authors declare no conflict of interest.
References
- IEEE Std 1410-2010 (Revision of IEEE Std 1410-2004); IEEE Guide for Improving the Lightning Performance of Electric Power Overhead Distribution Lines. IEEE: Piscataway, NJ, USA, 2011; pp. 1–73. [CrossRef]
- IEEE Std 1243-1997; IEEE Guide for Improving the Lightning Performance of Transmission Lines. IEEE: Piscataway, NJ, USA, 1997; pp. 1–44. [CrossRef]
- Borghetti, A.; Nucci, C.A.; Paolone, M. An Improved Procedure for the Assessment of Overhead Line Indirect Lightning Performance and Its Comparison with the IEEE Std. 1410 Method. IEEE Trans. Power Deliv. 2007, 22, 684–692. [Google Scholar] [CrossRef]
- Mestriner, D.; Ribeiro de Moura, R.; Procopio, R.; de Oliveira Schroeder, M. Evaluation of the Impact of Grounding Modeling on Lightning-Induced in Distribution Lines. Light. Model. Eff. Electr. Infrastruct. 2021, 11, 33. [Google Scholar] [CrossRef]
- Nucci, C.A. A survey on Cigré and IEEE procedures for the estimation of the lightning performance of overhead transmission and distribution lines. In Proceedings of the 2010 Asia-Pacific International Symposium on Electromagnetic Compatibility, Beijing, China, 12–16 April 2010; pp. 1124–1133. [Google Scholar] [CrossRef]
- Paolone, M.; Nucci, C.A.; Petrache, E.; Rachidi, F. Mitigation of lightning-induced overvoltages in medium voltage distribution lines by means of periodical grounding of shielding wires and of surge arresters: Modeling and experimental validation. IEEE Trans. Power Deliv. 2004, 19, 423–431. [Google Scholar] [CrossRef]
- Brignone, M.; Mestriner, D.; Procopio, R.; Piantini, A.; Rachidi, F. Evaluation of the mitigation effect of the shield wires on lightning induced overvoltages in MV distribution systems using statistical analysis. IEEE Trans. Electromagn. Compat. 2017, 60, 1400–1408. [Google Scholar] [CrossRef]
- Orlandi, A.; Mazzetti, C.; Flisowski, Z.; Yarmarkin, M. Systematic approach for the analysis of the electromagnetic environment inside a building during lightning strike. IEEE Trans. Electromagn. Compat. 1998, 40, 521–535. [Google Scholar] [CrossRef]
- Metwally, I.A.; Heidler, F.H. Reduction of lightning-induced magnetic fields and voltages inside struck double-layer grid-like shields. IEEE Trans. Electromagn. Compat. 2008, 50, 905–912. [Google Scholar] [CrossRef]
- Zhang, A.M.; Dong, D.P.; He, F.R.; Chen, M.R.; Zeng, P.Z. Effect of nearby buildings on electromagnetic fields from lightning. J. Light. Res. 2009, 1, 52–60. [Google Scholar]
- Borghetti, A.; Napolitano, F.; Nucci, C.A.; Paolone, M. Effects of nearby buildings on lightning induced voltages on overhead power distribution lines. Electr. Power Syst. Res. 2013, 94, 38–45. [Google Scholar] [CrossRef]
- Tossani, F.; Borghetti, A.; Napolitano, F.; Piantini, A.; Nucci, C.A. Lightning performance of overhead power distribution lines in urban areas. IEEE Trans. Power Deliv. 2017, 33, 581–588. [Google Scholar] [CrossRef]
- Nucci, C. The lightning induced over-voltage (LIOV) code. In Proceedings of the 2000 IEEE Power Engineering Society Winter Meeting. Conference Proceedings (Cat. No. 00CH37077), Singapore, 23–27 January 2000; Volume 4, pp. 2417–2418. [Google Scholar]
- Farina, L.; Mestriner, D.; Procopio, R.; Brignone, M.; Delfino, F. The Lightning Power Electromagnetic Simulator for Transient Overvoltages (LIGHT-PESTO) Code: A User-Friendly Interface With the MATLAB-Simulink Environment. IEEE Lett. Electromagn. Compat. Pract. Appl. 2020, 2, 119–123. [Google Scholar] [CrossRef]
- Multiphysics, C. Introduction to COMSOL; COMSOL: Burlington, MA, USA, 1998; Volume 9, p. 2018. [Google Scholar]
- Heidler, H. Analytische blitzstromfunktion zur LEMP-berechnung. In Proceedings of the 18th International Conference on Lightning Protection, Munich, Germany, 16–20 September 1985. [Google Scholar]
- Nucci, C.A. On lightning return stroke models for LEMP calculations. In Proceedings of the 19th International Conference on Lightning Protection, Graz, Austria, 25–29 April 1988. [Google Scholar]
Figure 1.
Considered geometry in the presence of buildings.

Figure 2.
3D FEM Model.

Figure 3.
Ratio between the maximum value of the electric field with and without the building. (A) H = 20 m, and d varies from 5 to 200 m.
Figure 3.
Ratio between the maximum value of the electric field with and without the building. (A) H = 20 m, and d varies from 5 to 200 m.

Figure 4.
Ratio between the maximum value of the electric field with and without the building. (B) H = 5 m, and d varies from 5 to 200 m.
Figure 4.
Ratio between the maximum value of the electric field with and without the building. (B) H = 5 m, and d varies from 5 to 200 m.

Figure 5.
Ratio between the maximum value of the electric field with and without the building. (C) d = 10 m, and H varies from 5 to 50 m.
Figure 5.
Ratio between the maximum value of the electric field with and without the building. (C) d = 10 m, and H varies from 5 to 50 m.

Figure 6.
Comparison between the electric field measured along the whole line. (A) H = 20 m, and d varies from 5 to 200 m.
Figure 6.
Comparison between the electric field measured along the whole line. (A) H = 20 m, and d varies from 5 to 200 m.

Figure 7.
Comparison between the electric field measured along the whole line. (B) H = 5 m, and d varies from 5 to 200 m.
Figure 7.
Comparison between the electric field measured along the whole line. (B) H = 5 m, and d varies from 5 to 200 m.

Figure 8.
Comparison between the electric field measured along the whole line. (C) d = 10 m, and H varies from 5 to 50 m.
Figure 8.
Comparison between the electric field measured along the whole line. (C) d = 10 m, and H varies from 5 to 50 m.

Figure 9.
Ratio between the maximum voltage induced on the line considering or not considering the presence of a building. (A) H = 20 m, and d varies from 5 to 200 m.
Figure 9.
Ratio between the maximum voltage induced on the line considering or not considering the presence of a building. (A) H = 20 m, and d varies from 5 to 200 m.

Figure 10.
Ratio between the maximum voltage induced on the line considering or not considering the presence of a building. (B) H = 5 m, and d varies from 5 to 200 m.
Figure 10.
Ratio between the maximum voltage induced on the line considering or not considering the presence of a building. (B) H = 5 m, and d varies from 5 to 200 m.

Figure 11.
Ratio between the maximum voltage induced on the line considering or not considering the presence of a building. (C) d = 10 m, and H varies from 5 to 50 m.
Figure 11.
Ratio between the maximum voltage induced on the line considering or not considering the presence of a building. (C) d = 10 m, and H varies from 5 to 50 m.

Figure 12.
Fitted curve of the attenuation coefficient of the maximum induced voltage—Case A.

Figure 13.
Fitted curve of the attenuation coefficient of the maximum induced voltage—Case B.

Figure 14.
Fitted curve of the attenuation coefficient of the maximum induced voltage—Case C.

Figure 15.
Ratio between the maximum voltage induced on the line considering or not considering the presence of a building. (A) H = 20 m, and d varies from 5 to 200 m. A multiconductor line is considered.
Figure 15.
Ratio between the maximum voltage induced on the line considering or not considering the presence of a building. (A) H = 20 m, and d varies from 5 to 200 m. A multiconductor line is considered.

Figure 16.
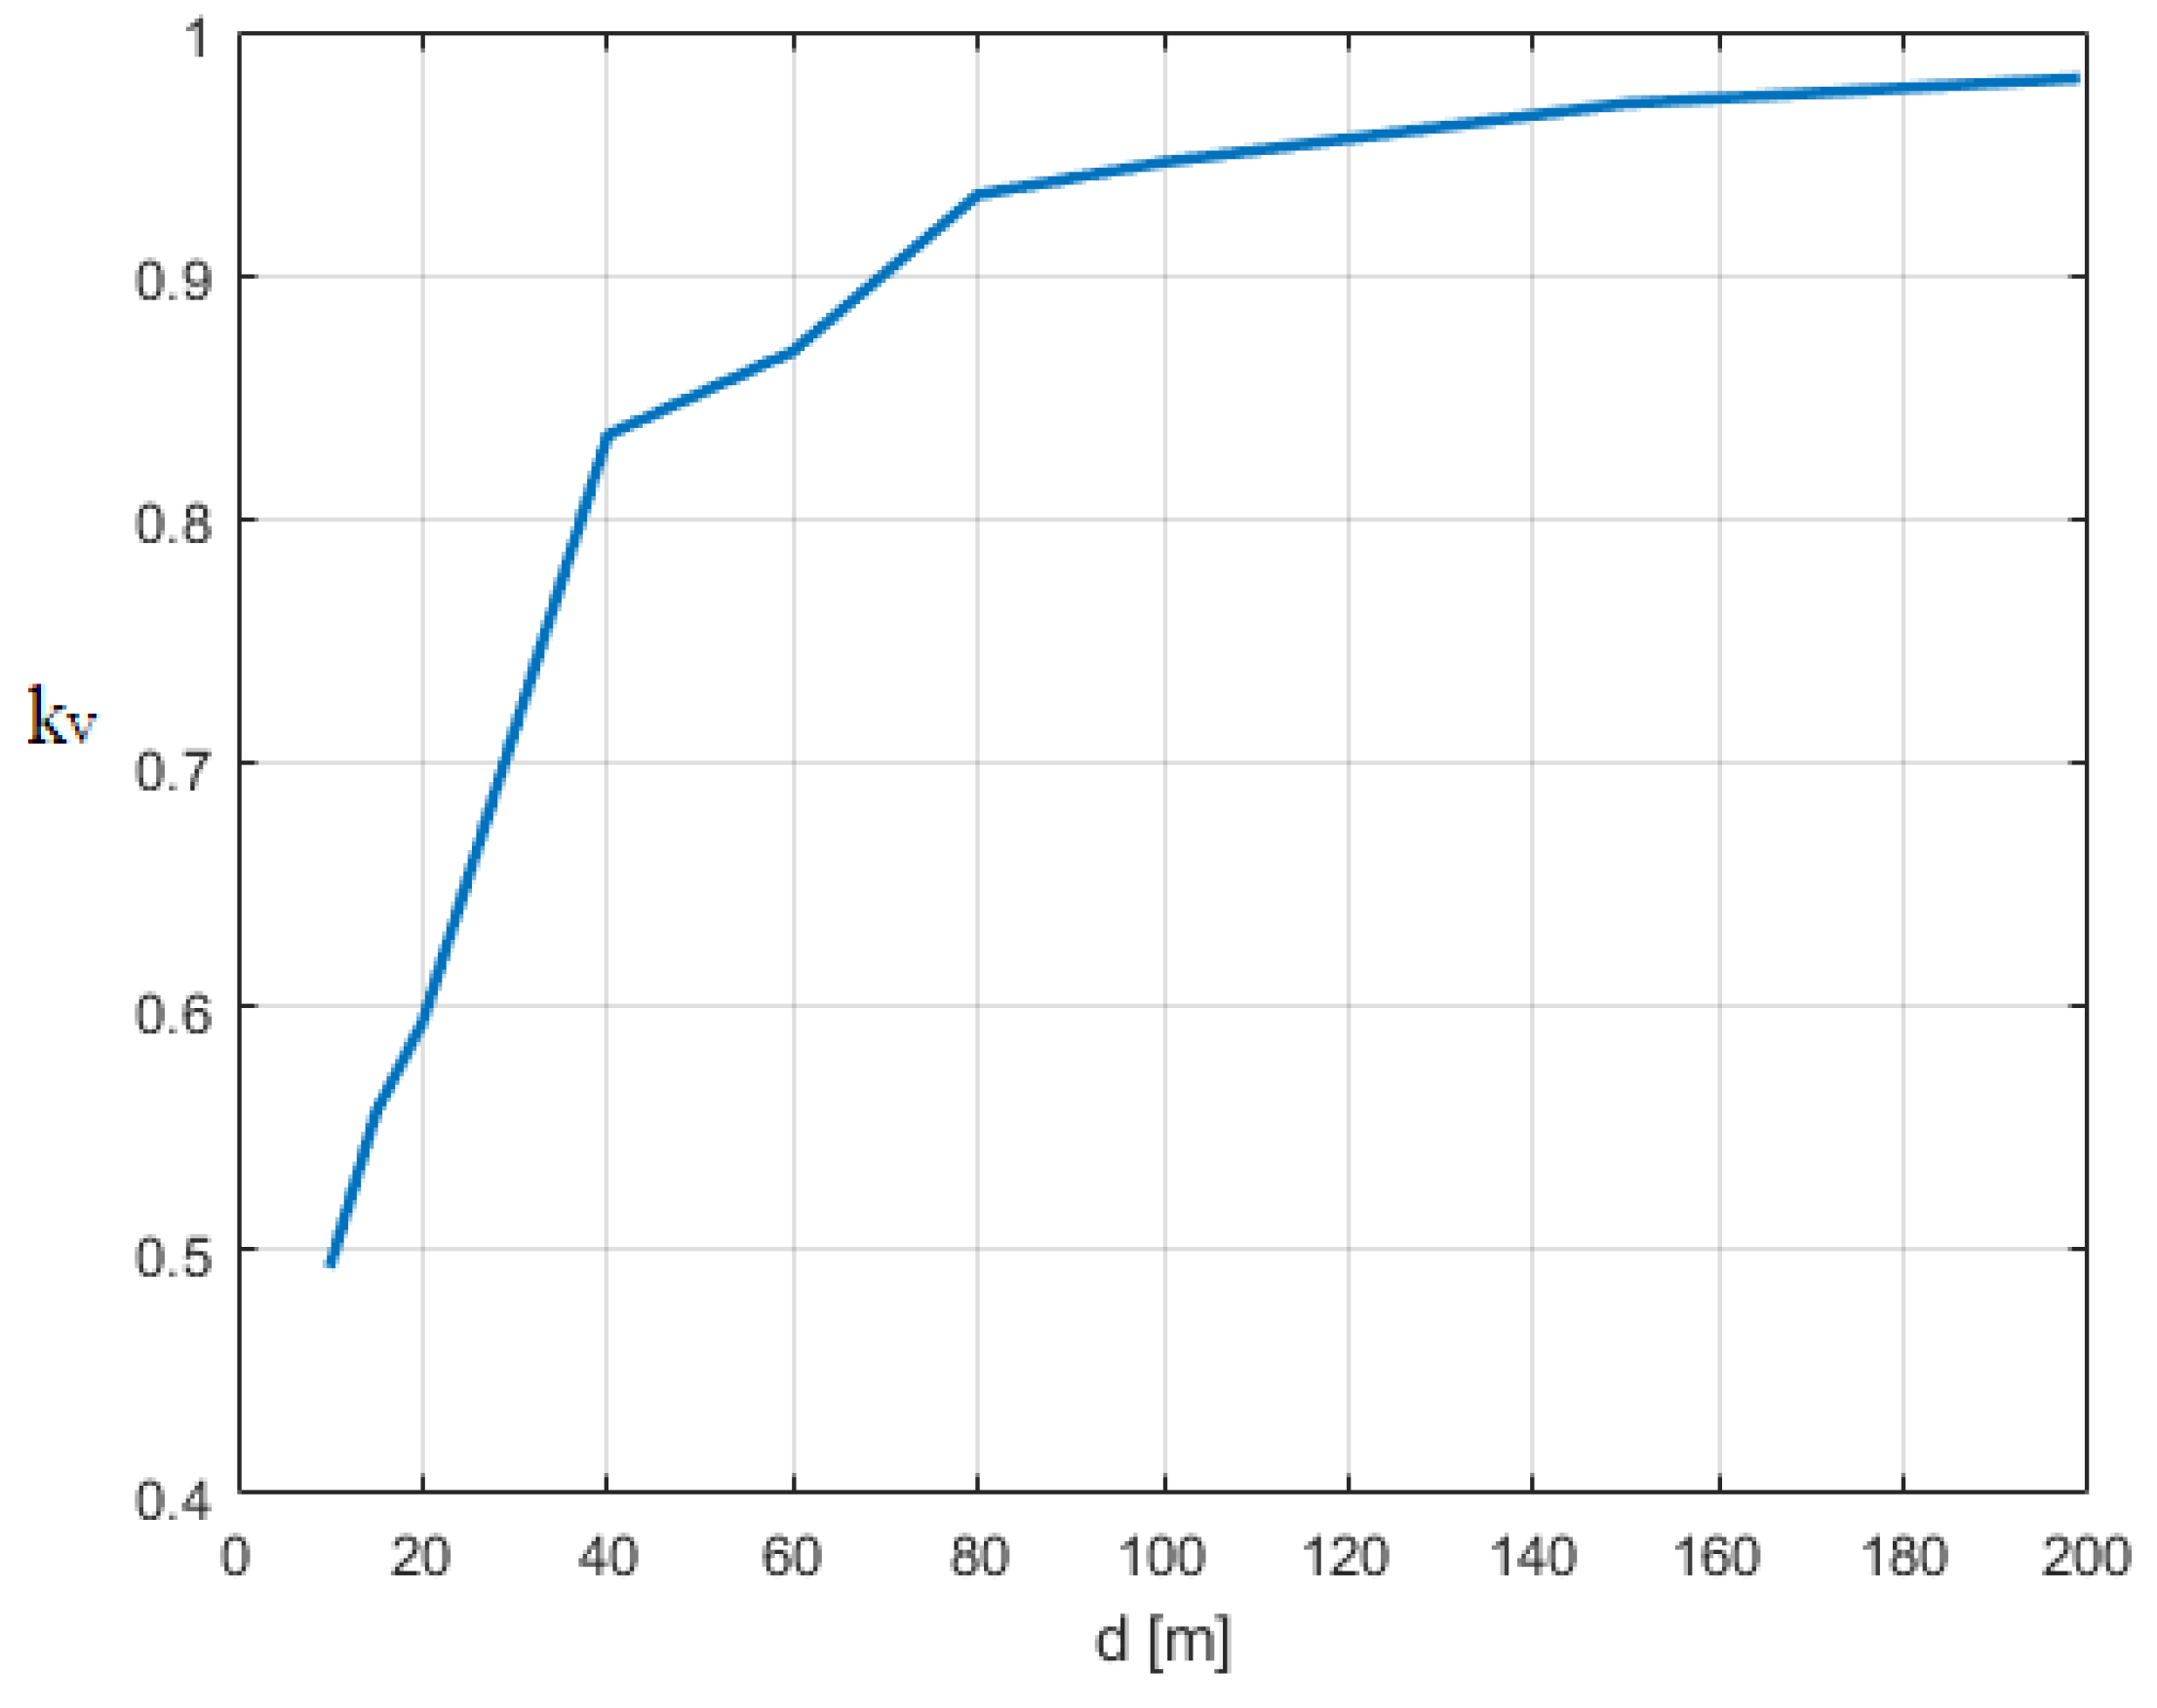
Ratio between the maximum voltage induced on the line considering or not considering the presence of a building. (A) H = 20 m, and d varies from 5 to 200 m. A finite ground conductivity of 1 mS/m is considered.
Figure 16.
Ratio between the maximum voltage induced on the line considering or not considering the presence of a building. (A) H = 20 m, and d varies from 5 to 200 m. A finite ground conductivity of 1 mS/m is considered.


Publisher’s Note: MDPI stays neutral with regard to jurisdictional claims in published maps and institutional affiliations. |
© 2022 by the authors. Licensee MDPI, Basel, Switzerland. This article is an open access article distributed under the terms and conditions of the Creative Commons Attribution (CC BY) license (https://creativecommons.org/licenses/by/4.0/).
Share and Cite
MDPI and ACS Style
Mestriner, D.; Marchesoni, F.; Procopio, R.; Brignone, M. Attenuation of Lightning-Induced Effects on Overhead Distribution Systems in Urban Areas. Appl. Sci. 2022, 12, 7632. https://0-doi-org.brum.beds.ac.uk/10.3390/app12157632
AMA Style
Mestriner D, Marchesoni F, Procopio R, Brignone M. Attenuation of Lightning-Induced Effects on Overhead Distribution Systems in Urban Areas. Applied Sciences. 2022; 12(15):7632. https://0-doi-org.brum.beds.ac.uk/10.3390/app12157632
Chicago/Turabian StyleMestriner, Daniele, Flavia Marchesoni, Renato Procopio, and Massimo Brignone. 2022. "Attenuation of Lightning-Induced Effects on Overhead Distribution Systems in Urban Areas" Applied Sciences 12, no. 15: 7632. https://0-doi-org.brum.beds.ac.uk/10.3390/app12157632
Note that from the first issue of 2016, this journal uses article numbers instead of page numbers. See further details here.