Article

Enhancement of Medical Images through an Iterative McCann Retinex Algorithm: A Case of Detecting Brain Tumor and Retinal Vessel Segmentation

by
Yassir Edrees Almalki
1,
Nisar Ahmed Jandan
2,
Toufique Ahmed Soomro
3,*,
Ahmed Ali
4,
Pardeep Kumar
5,
Muhammad Irfan
6,
Muhammad Usman Keerio
7,
Saifur Rahman
6,
Ali Alqahtani
8,
Samar M. Alqhtani
9,
Mohammed Awaji M. Hakami
10,
Alqahtani Saeed S
11,
Waleed A. Aldhabaan
12 and
Abdulrahman Samir Khairallah
12
1
Division of Radiology, Department of Internal Medicine, Medical College, Najran University, Najran 61441, Saudi Arabia
2
Ophthalmology Department, Peoples University of Medical Furthermore, Health Sciences for Women (PUMHSW), Nawabshah Shaheed Benazirabad, Nawabshah 67480, Pakistan
3
Department of Electronic Engineering, Quaid-e-Awam University of Engineering, Science and Technology, Larkana 77150, Pakistan
4
Department of Electrical Engineering, Sukkur IBA University, Sukkur 65200, Pakistan
5
Department of Software Engineering, Quaid-e-Awam University of Engineering, Science and Technology, Nawabshah 67450, Pakistan
6
Electrical Engineering Department, College of Engineering, Najran University Saudi Arabia, Najran 61441, Saudi Arabia
7
Department of Electrical Engineering, Quaid-e-Awam University of Engineering, Science and Technology, Nawabshah 67450, Pakistan
8
Networks and Communication Engineering Department, College of Computer Science and Information Systems, Najran University, Najran 61441, Saudi Arabia
9
Department of Information Systems, College of Computer Science and Information Systems, Najran University, Najran 61441, Saudi Arabia
10
Radiology Department, Armed Forces Hospital, Jazan 156-84224, Saudi Arabia
11
Department of Surgery, Faculty of Medicine, Najran University, Najran 61441, Saudi Arabia
12
Department of Ophthalmology, King Khalid University College of Medicine, P.O. Box 641, Abha 61421, Saudi Arabia
*
Author to whom correspondence should be addressed.
Submission received: 10 June 2022 / Revised: 11 August 2022 / Accepted: 12 August 2022 / Published: 17 August 2022

Abstract

:
Analyzing medical images has always been a challenging task because these images are used to observe complex internal structures of the human body. This research work is based on the study of the retinal fundus and magnetic resonance images (MRI) for the analysis of ocular and cerebral abnormalities. Typically, clinical quality images of the eyes and brain have low-varying contrast, making it challenge to diagnose a specific disease. These issues can be overcome, and preprocessing or an image enhancement technique is required to properly enhance images to facilitate postprocessing. In this paper, we propose an iterative algorithm based on the McCann Retinex algorithm for retinal and brain MRI. The foveal avascular zone (FAZ) region of retinal images and the coronal, axial, and sagittal brain images are enhanced during the preprocessing step. The High-Resolution Fundus (HRF) and MR brain Oasis images databases are used, and image contrast and peak signal-to-noise ratio (PSNR) are used to assess the enhancement step parameters. The average PSNR enhancement on images from the Oasis brain MRI database was about 3 dB with an average contrast of 57.4. The average PSNR enhancement of the HRF database images was approximately 2.5 dB with a contrast average of 40 over the database. The proposed method was also validated in the postprocessing steps to observe its impact. A well-segmented image was obtained with an accuracy of 0.953 and 0.0949 on the DRIVE and STARE databases. Brain tumors were detected from the Oasis brain MRI database with an accuracy of 0.97. This method can play an important role in helping medical experts diagnose eye diseases and brain tumors from retinal images and Oasis brain images.

1. Introduction

Medical image analysis is one of the most rapidly growing fields of study. It combines image recognition with clinical analysis methods to process digital images [1,2,3]. Recent advances in medical image analysis research have contributed to developing a digital system-based solution to reduce the use of invasive approaches [4,5,6]. Color fundus retinal images and brain magnetic resonance images (MRI) images are analyzed to diagnose diseases such as eye- and brain-related abnormalities. Eye diseases such as Diabetic Retinopathy (DR) are diagnosed by carefully analyzing retinal color fundus images [7]; the analysis of retinal images for DR is based on the condition of the vessels, and damage to the vessel network results in loss of vision [8,9]. DR occurs when retinal changes have progressed to the point where treatment is complicated, and the risk of vision loss has increased manifold [10,11]. The prevalence of eye diseases such as DR is rising [12], lowering people’s quality of life. On the other hand, MRI brain images are used to detect abnormalities and tumors in the brain.
According to economic reports, people who are 40 years old and above have vision loss, particularly in developed countries [11,13]. The Australian Eye Study discovered that one in every three people has DR, indicating that DR is still one of the top five causes of irreversible blindness in adults in developed countries [11]. According to a recent study conducted in 33 countries, one out of every three diabetics and one out of every twenty people has an eye disease [14,15]. Furthermore, diabetes is one of the world’s major health problems, with 50 to 350 million diabetic cases expected over the next 25 years [11,16,17].
Fundus images have been researched in recent years. It has been discovered that the retinal vasculature is critical for diagnosing DR [13], along with observation of the loss of retinal capillaries in the network of retinal vessels called the foveal avascular zone (FAZ). Enlargement of the FAZ indicates disease progression. The specific area of FAZ is shown by color fundus images and FFA images [18]. Previous research on fundus image analysis by [19] found that the size of the FAZ increases with the severity of the DR. Traditional retinal photography is known as fundus fluorescein angiography (FFA). The FFA works by rapidly injecting fluorescein dye into the arterial system. FFA is made up of three significant steps. The first step is how the dye circulates in the retinal blood vessels, how it reaches the retina and choroid, and how it stays in circulation [20,21]. The second step is to record any details of the pigment epithelium and retinal circulation that are not visible. The third step is how to obtain a clear view of the retinal vessels. Most of the research published thus far has focused on determining FAZ from FFA images.
There is a need to analyze the FAZ area from color retinal images for a proper noninvasive diagnosis of eye disease [22,23] because the FAZ area is devoid of blood vessels. The widening of the vessels in the FAZ area indicates disease progression, so the proper segmentation of retinal blood vessels is critical. The brain MRI, another imaging modality used in this study, is one of the advanced medical imaging modalities validated as an effective tool for studying the human brain [17,24]. A brain MRI provides information on soft tissue anatomy, which has significantly improved the visual quality of the brain image. Images obtained from brain MRI scans typically require computerized methods such as image processing techniques for classification to detect brain abnormalities or tumors [25]. The objective of this research work is to address the issue of improving medical images such as retinal images and brain MRIs by validating the McCann Retinex algorithm. These types of images suffer from low-varying contrast and noise. This enhancement technique is used as preprocessing for further segmentation to diagnose disease. The preprocessing step improves the PSNR and contrast enhancement. There are three main objectives for implementing this improvement process:
  • To analyze brain MRI and retinal images for early disease diagnosis.
  • To validate the proposed McCann Retinex algorithm to handle low-varying contrast and noise issues, as well as to observe the impact of the technique on postprocessing.
  • The noise factor always impacts the quality of image processing and machine learning methods, and the main objective is to analyze the impact of noise on the retinal color fundus images and brain MRI.
A plethora of algorithms for brain tumor classification have been developed for this purpose [26]. These algorithms and many other algorithms [27,28], however, have limitations in that the appropriate abnormal region of the tumor is not classified due to the low-varying contrast [22], and this challenging issue can be solved by implementing the image enhancement technique as a preprocessing step for segmentation (postprocessing) for disease analysis.
In this research work, we deal with the image enhancement technique to analyze the FAZ region and MR brain images, because most of the small vessels are dropped, it is difficult to analyze the small vessels of the FAZ region; further, some of the brain MRIs contain low contrast, and it is difficult to detect a very small brain tumor. This step is known as preprocessing. We implement postprocessing to analyze the effect of the preprocessing on retinal blood vessel extraction and brain tumor detection.
The paper is organized as follows. The related work is discussed in Section 2. The proposed method is explained in detail in Section 3. The database information and measurement parameters are explained in Section 4. Section 5 contains the results and discussion. Finally, Section 6 provides the conclusion and future research directions.

2. Related Work

Various image enhancement methods have been implemented to improve image detail, especially the quality of medical images such as retinal fundus images, MRI brain images, and other types of medical images [5,29]. The more traditional image enhancement methods such as histogram equalization [30] were used primarily for medical images, and they worked very well and improved medical images with their excellent performance. Histogram equalization is divided into two types, global histogram equalization (GHE) and local histogram equalization (LHE). These techniques perform well on normal medical images, but they do not perform well on abnormal cases of medical images due to low-varying contrast, noise, and many abnormalities. There are many other contrast enhancement methods such as fuzzy contrast enhancement methods and local contrast normalization methods [31,32].
All these methods depend on the spatial filter, which provided the high frequency components in the original images, which can lose the details of the images. These methods are mainly based on the concepts of locally normalized pixels of medical images with zero mean and unit variance to maintain varying and low contrast as well as improving the overall image contrast. Due to the high frequency (high pass filters), these noise techniques resulted in enhanced images. Contrast adjusted filters were introduced by researchers [33,34,35], but these filters are not successful in medical images; these filters only work in small-sized images and take more time to compute.
Later, wavelet transform was introduced for medical images for denoising, as well as to improve contrast. The main parameters of wavelet transform are the selection of appropriate wavelet transform parameters based on the properties of the image. A fast discrete wavelet transform method was proposed by Mallat [36], and this method is used for many applications. Algorithms [37,38] were proposed to improve mammographic images based on wavelet transform, and Fu et al. [39,40] implemented the method to improve mammographic images based on the equalization of a wavelet-based histogram. Almost all wavelet transform methods are based on the concepts of multiscale analysis, which decomposes the image into high and low frequency components of different resolutions. For proper enhancement, the details of the image enhancement with wavelet coefficients are required using multiple values based on the adaptive gain, and an enhanced image is obtained by reconstructing the image from the d wavelets. However, it is difficult to obtain an optimal coefficient depending on the nature of the medical images. There is a need for a technique that works on iterative methods to provide a well contrasted image. After analyzing the limitations of all these enhancement methods, many researchers have used histogram equalization (HE), contrast-limited adaptive histogram equalization (CLAHE), and brightness preserving bi-histogram equalization (BBHE). These techniques worked well on a few images, but they obtained over-enhanced images on many medical images, which made it difficult to analyze the details of the images. We have selected these traditional techniques as a comparative analysis for our proposed enhancement technique.
Qingtao et al. [41] proposed a retinex-based method for contrast enhancement of natural images. They used multiscale retinex to remove the impact of lighting on the image and obtained a nicely detailed image, and they adjusted the lighting using a gamma correction with a weighted distribution. Shouxin et al. [42] implemented a fast retinex-based algorithm (RBFA) to achieve a low-illuminated image that could restore the low-illuminance image (reflectance image). Their method was also based on the adaptive gamma correction to obtain a detailed image, and they also used the natural images to obtain a better enhanced image. Xinxin et al. [43] addressed the problem of low-illumination retinex images because dark regions were not properly enhanced, and these regions became overexposed. They used a retinex-based method to enhance the illumination map by using a brightness enhancement function (BEF) to estimate the illumination map by multiscale fusion. Their method worked well on natural images with varying contrast. In our research, the retinex method is used for medical images, and these are iterative methods. Medical images are different from natural images, because they have many problems such as low-varying contrast, center light reflex, and inconsistency of image details, as well as noise. The iterative retinex is tested for medical images, and it provides a better enhanced image and impacts segmentation performance, as explained in the results and discussion section.
In this work, we analyze an algorithm to solve the low-varying contrast problem. We used publicly available medical image databases such as retinal image databases and MRI brain image databases. We worked on the McCann Retinex algorithm, an iterative machine learning algorithm, to estimate the best-illuminated image or normalize the contrast. The study is based on a detailed analysis of the McCann Retinex algorithm on MRI brain images and retinal fundus images. The main contribution of this research is that it implements the iteration-based McCann Retinex algorithm to handle the challenge of uneven illumination, low-varying contrast, and noise in MRI brain images and fundus retinal color images. The other main contribution of this research work is the validation of the impact of the image enhancement technique on the segmentation of retinal vessels and detection of brain tumors. The McCann Retinex algorithm was modified based on the iterative process, and the iterative process followed the ratio-product-reset-average operation. The most complicated parameter in the retinex algorithm is the adjustment of the optimal iterations, because each iteration impacts the details of the image. We analyzed the effect of each iteration of the McCann Retinex algorithm on the retinal fundus images from the HRF database and the Oasis brain MRI database. Section 3 contains the proposed method.

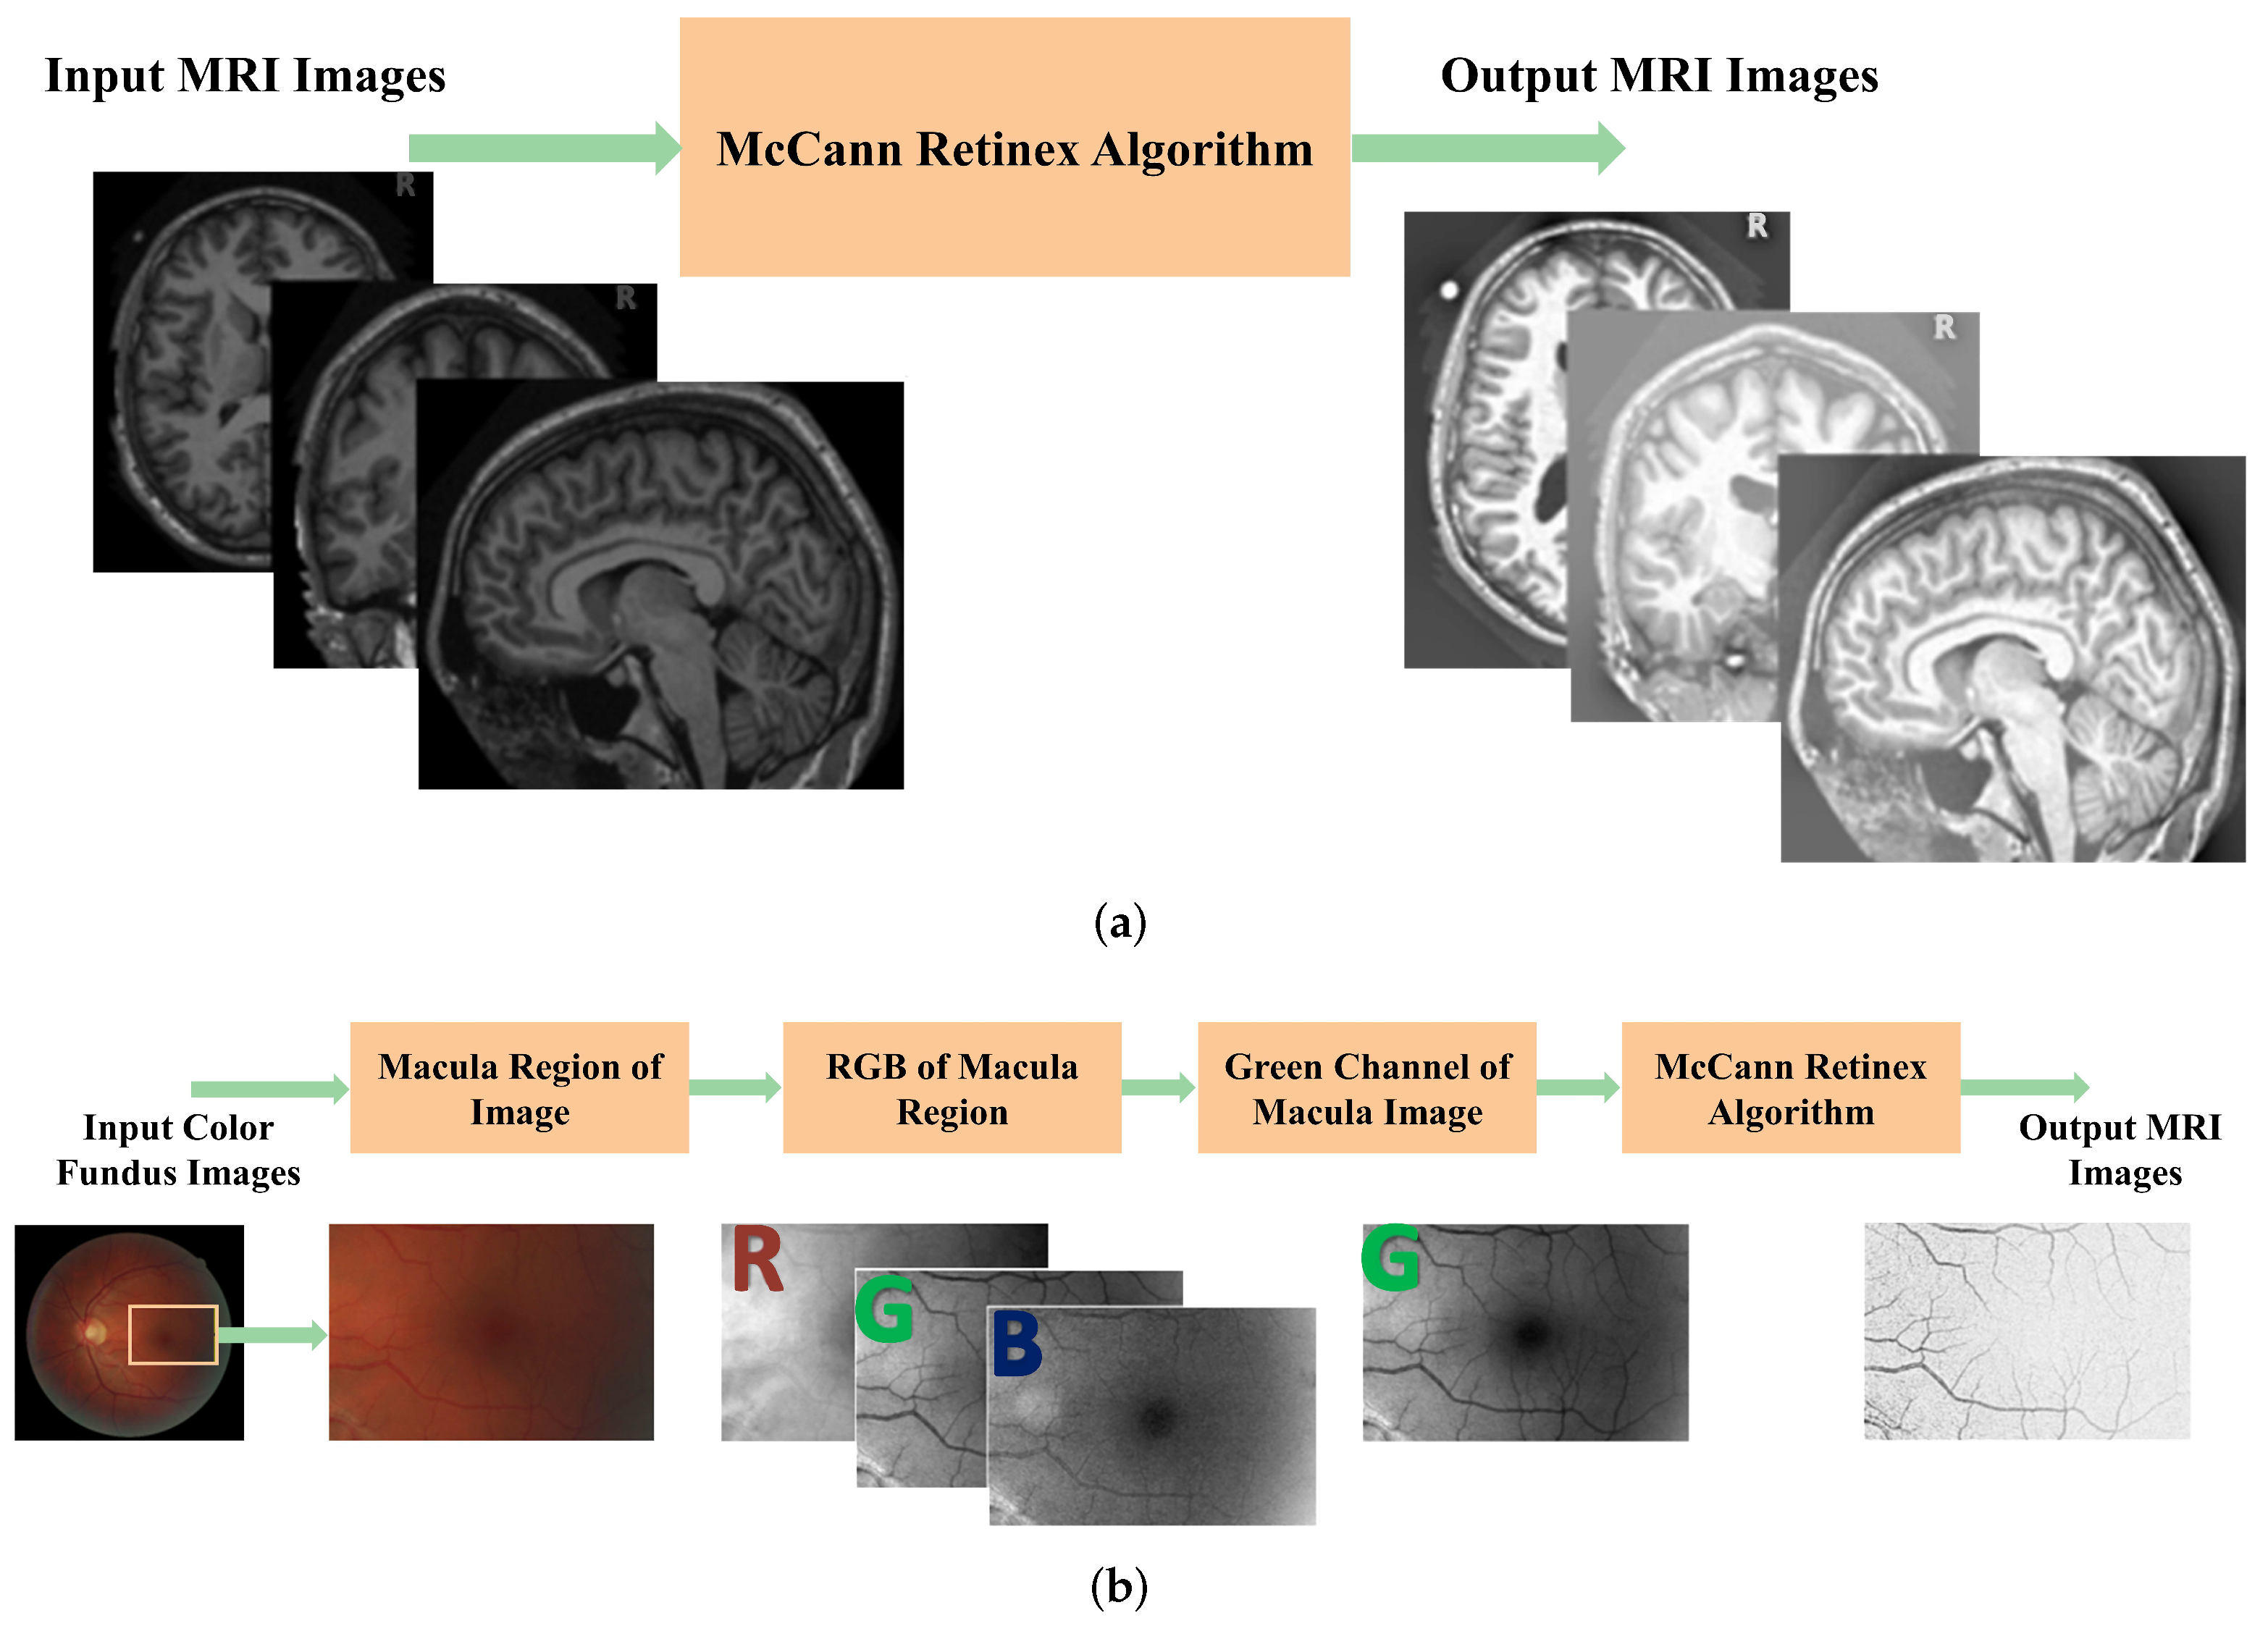
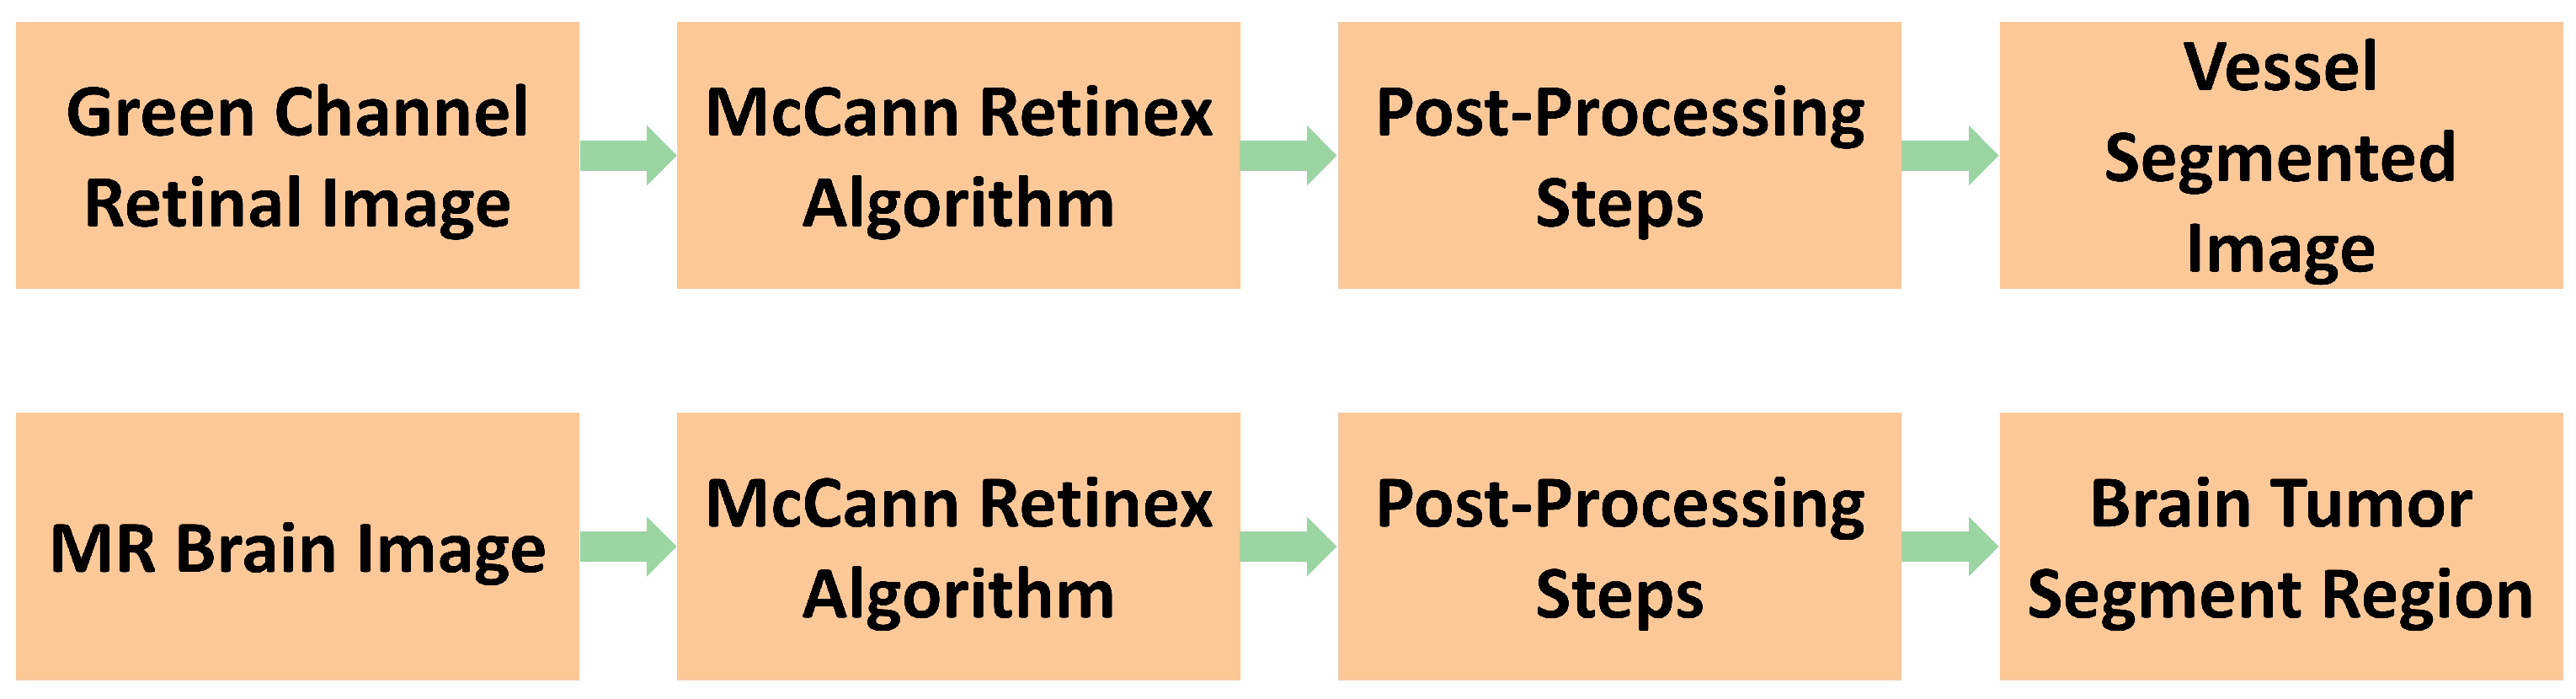
3. The Proposed Method

Figure 1 illustrates the proposed image contrast enhancement technique or preprocessing steps for the brain MRI and retinal color fundus images. The technique is based on the McCann Retinex algorithm and observes the low-varying contrast from iteration 1 to 20. The contrast in brain MRIs including the axial plane, sagittal plane, and coronal plane is analyzed.
The McCann Retinex algorithm improves the contrast in the specified region of a brain MRI to diagnose different pathologies [18]. In retinal fundus images, we examined the macula, a region within the FAZ. The FAZ is the dark zone without capillaries, and its enlargement causes disease progression, with segmentation vessels in this zone being the primary indicator of disease progression. The macula region was converted to red–green–blue (RGB) channels, and the green channel of the RGB retinal image was chosen because it provided better contrast than the red and blue channels. Next, we studied the effect of the McCann Retinex algorithm iteration on MRI brain images and tested iterations ranging from 1 to 20. The McCann Retinex algorithm is described in Section 3.1.

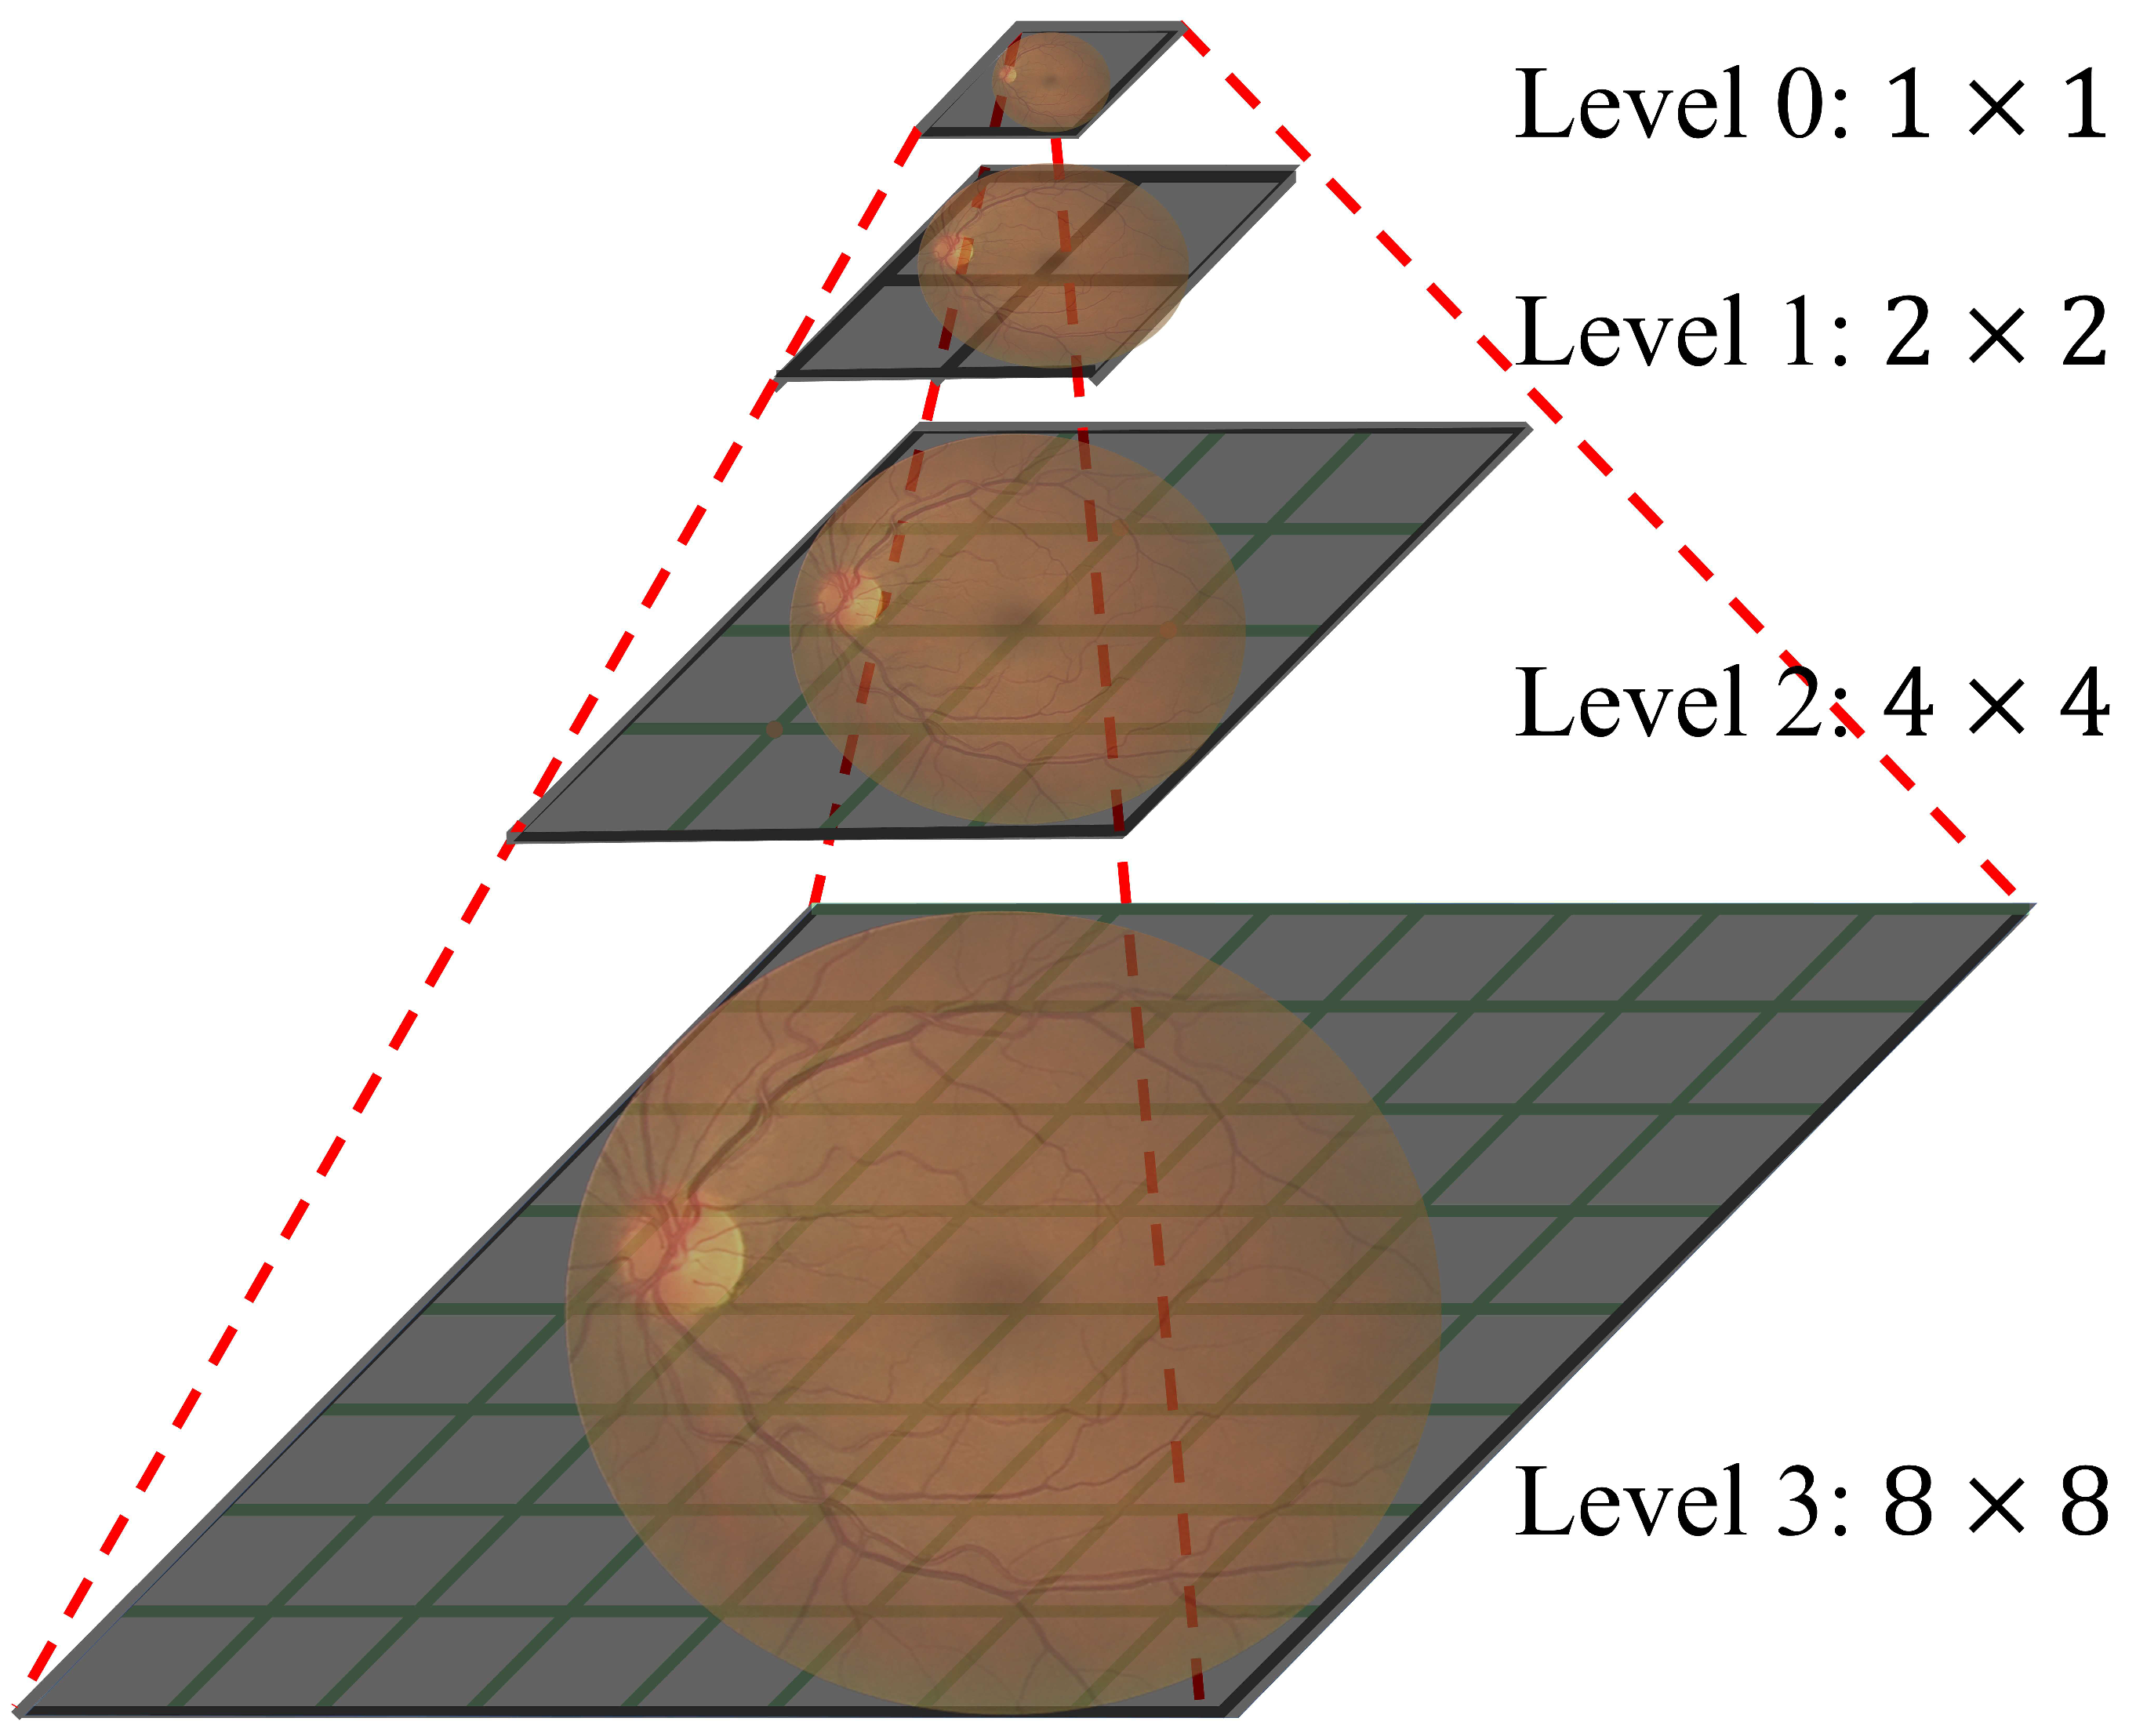
3.1. McCann Retinex Algorithm

The McCann Retinex algorithm is a contrast enhancement algorithm; however, it has not been validated on medical images, because it is an iterative algorithm. Each iteration changes the details of the medical image. McCann [19] improved the retinex random walk algorithm by implementing the one-dimensional into a multilevel retinex algorithm. Retinex and McCann proposed the retinex iterative algorithm based on a multiresolution image pyramid. The multiresolution image pyramid is based on four operations called ratio-product-reset-average operations. As represented in Figure 2, the iterative retinex algorithm generates a multiresolution image pyramid from the input image and produces an average output image by forming pyramid data layers based on the image. The mathematical representation of the process is explained below.
McCann’s algorithm is based on image transformation operations from linear to logarithmic form to streamline the process from multiplication to addition and from division to subtraction. The whole retinex iterative algorithm is based on the ratio-product-reset and average arithmetic operation. The main purpose of the ratio and product is to estimate the initial reflectance of the image; then, the average operation updates the estimated reflectance of the image. The main purpose of applying the arithmetic operation is to calculate the ratio between the I image and its shifted version updated with some shift distance, as represented in Equation (1).
logS x , y * = Reset log M x , y logN xs , ys + log S xs , ys + log S x , y 2 ,
where log M x , y logN xs , ys is the ratio, and log M x , y logN xs , ys + log S xs , ys shows the product in the form of the log domain. The next step is the reset operation, which updates the maximum intensity level with respect to the given iteration. The l o g S x , y is an average of l o g S x , y and l o g S x , y as the updated output obtained at each iteration, used as input for the next iteration, until the final reflectance at the last iteration obtains the final output image.
The retinex algorithm calculates brightness and its impact on the image, which compares pixels values to correct pixels in the image. The pixel comparison of a multiresolution image begins with three operations (ratio-product-reset). The average process is performed from the top level of the pyramid to the final iteration to produce the final output image. As a result of the calculation, the pixels illuminate the image value at a lower resolution (upper level of the image pyramid). The resulting brightness values are propagated downward by pixel replication of the next level of the image pyramid as long as the initial level of brightness is encountered. The retinex process for image pixels based on the multiresolution image pyramid relies on iteration computation. The long distance between variation pixels in each iteration is the calculation process of the iteration, and each iteration has variation at the initial phase; then, it moves a short distance between each pixel per iteration. Pixel spacing is calculated at each step of the modified retinex algorithm, and it gradually decreases by one pixel offset per distance. The operation of the pixel process is based on clockwise steps, and at each step the pixels are compared to the estimated reflectance of the image based on their operations [21], which are calculated iteratively. These changes are observed several times during the iteration process of the retinex algorithm, and it is one of the main parameters used to estimate the effect of the modified retinex algorithm on the image details [22]. The impact of the retinex algorithm analysis on the contrast and noise reduction of MRI brain images and retinal fundus also played an important role in improving the segmentation process, as analyzed in Section 5.

4. Databases and Evaluation Parameters

4.1. Database

The High-Resolution Fundus (HRF) Image Database [25] of retinal fundus images and the Oasis brain MRI database [44] of brain MRI were used for validation of the experimental results for the preprocessing steps or proposed image enhancement techniques.There were 18 image pairs of high and low quality images from the HRF database.The Oasis database contained three sets of 38 patients, and each set of patient images contained three planes, comprising a group of 38 images in the axial plane, 38 images in the coronal plane, and 38 images in the sagittal plane. As postprocessing steps and to obtain retinal vessels, we used the Digital Retinal Images for Vessel Extraction (DRIVE) [2] and Structured Analysis of the Retina (STARE) [29] databases for algorithm validations. The DRIVE database contained 40 images, while the STARE database contained 20 images. The main advantage of using these databases is that they have ground truth images for validations, as many researchers have used these databases. These databases allowed us to compare our retinal segmentation methods with existing methods. For the brain MRI, we used the same Oasis database to analyze the postprocessing steps. The output of the postprocessing steps showed the impact of the preprocessing steps on it, and we explain the impact of the preprocessing steps on the postprocessing in Section 5.

4.2. Evaluation Parameters

Two parameters were used to analyze the improvement of the McCann Retinex algorithm: peak signal-to-noise ratio (PSNR) and contrast. For the segmentation process, sensitivity, specificity, accuracy, and area under the curve (AUC) were used. These parameters are discussed in more detail below.

4.2.1. Peak Signal-to-Noise Ratio (PSNR)

The peak signal-to-noise ratio (PSNR) is a signal value or image-level ratio of the signal or noisy image [23]. Equation (2) demonstrates this scientifically:
P S N R = 20 l o g 10 R σ .
In Equation (2), the σ is the variance in the intensities of the image, and R is the maximum value of the image. It can be between 0 and 255, which is the peak of intensity of a digital image. We analyzed the improvement in PSNR named “PSNR improvement”. The PSNR improvement is the analysis of the difference in the PSNR between the original PSNR image and the PSNR of the output image at each iteration.

4.2.2. Contrast Determination

There are many methods for calculating the contrast in images, and the measurement of contrast is a critical parameter in the analysis of biomedical images [29]. The absolute mean intensity difference between the white foreground and the black background of the image is used to calculate the contrast in retinal fundus images and MR brain images. Figure 3 shows the contrast determination of the retinal fundus images and the brain MRI. The left hand image in Figure 3 shows the contrast between the blood vessel and its background on the retinal fundus image. The right hand image in Figure 3 shows the contrast between the white foreground and the black background on the brain MRI.
In Figure 3, the blue dots represent the blood vessel pixel value from the retinal fundus images, and the red represent the background pixel values. The blue dots in Figure 3 represent the pixel value in the foreground white planes of the brain MRI, and the red dots in Figure 3 represent the black plane of the brain MRI. The mathematical representation of the contrast is shown in Equation (3).
C fn bn = 1 n ( i = 1 n I fni i = 1 n I bni .
The contrast of the brain MRI is measured between the foreground (colored white, and it is also called foreground white) and the background (colored black, and it is also called background black). The retinal image contrast is measured between the retinal blood vessels (in the foreground) against the background of the retinal vessels. The contrast in the two images (retinal and brain) is represented by C fn bn . The intensities of the retinal blood vessels or the white foreground of the MR brain image and the intensities of the background against the blood vessels or intensities of the black background of MR brain images are represented as I fni and I bni , respectively. The variable n indicates the number of pixels, where n = 200. The pixel locations for measuring the contrast were chosen at random.

4.2.3. Segmentation Measuring Parameters

The McCann Retinex algorithm validation is based on the retinal blood vessel segmentation and the abnormal region segmentation of the brain MRI. We used retinal imaging databases and brain image databases, and our main objective was to test the extraction capacity of the retinal vessels and the brain tumor region detection. We used four parameters, namely sensitivity, specificity, accuracy, and area under curve (AUC). These parameters are represented mathematically below.
Sensitivity ( Sen ) = TP TP + FN .
Specificity ( Sp ) = TN TN + FP .
Accuracy ( AC ) = TP + TN TP + TN + FP + FN .
AUC = Sensitivity + Specificity 2 .
where TP, TN, FP, and FN represent True Positive (TP) pixels, True Negative (TN) pixels, False Positive (FP) pixels, and False Negative (FN) pixels, respectively. True Positive Pixels, True Negative Pixels, False Positive Pixels, and False Negative Pixels are validated measurements used to verify the quality of a segmented image. They are used in the scenario where we want to compare the segment image with the ground truth image, taking the ground truth image as the basis for comparison. The foreground is “white or vessels or MR brain image tumor region” pixels, and the background is “black or non-vessels or MR brain image normal region” pixels in the ground truth. TP stands for correctly segmented pixels in the foreground, FP stands for falsely detected pixels in the foreground, TN stands for correctly segmented pixels in the background, and FN stands for falsely detected pixels in the background.

5. Results and Discussion

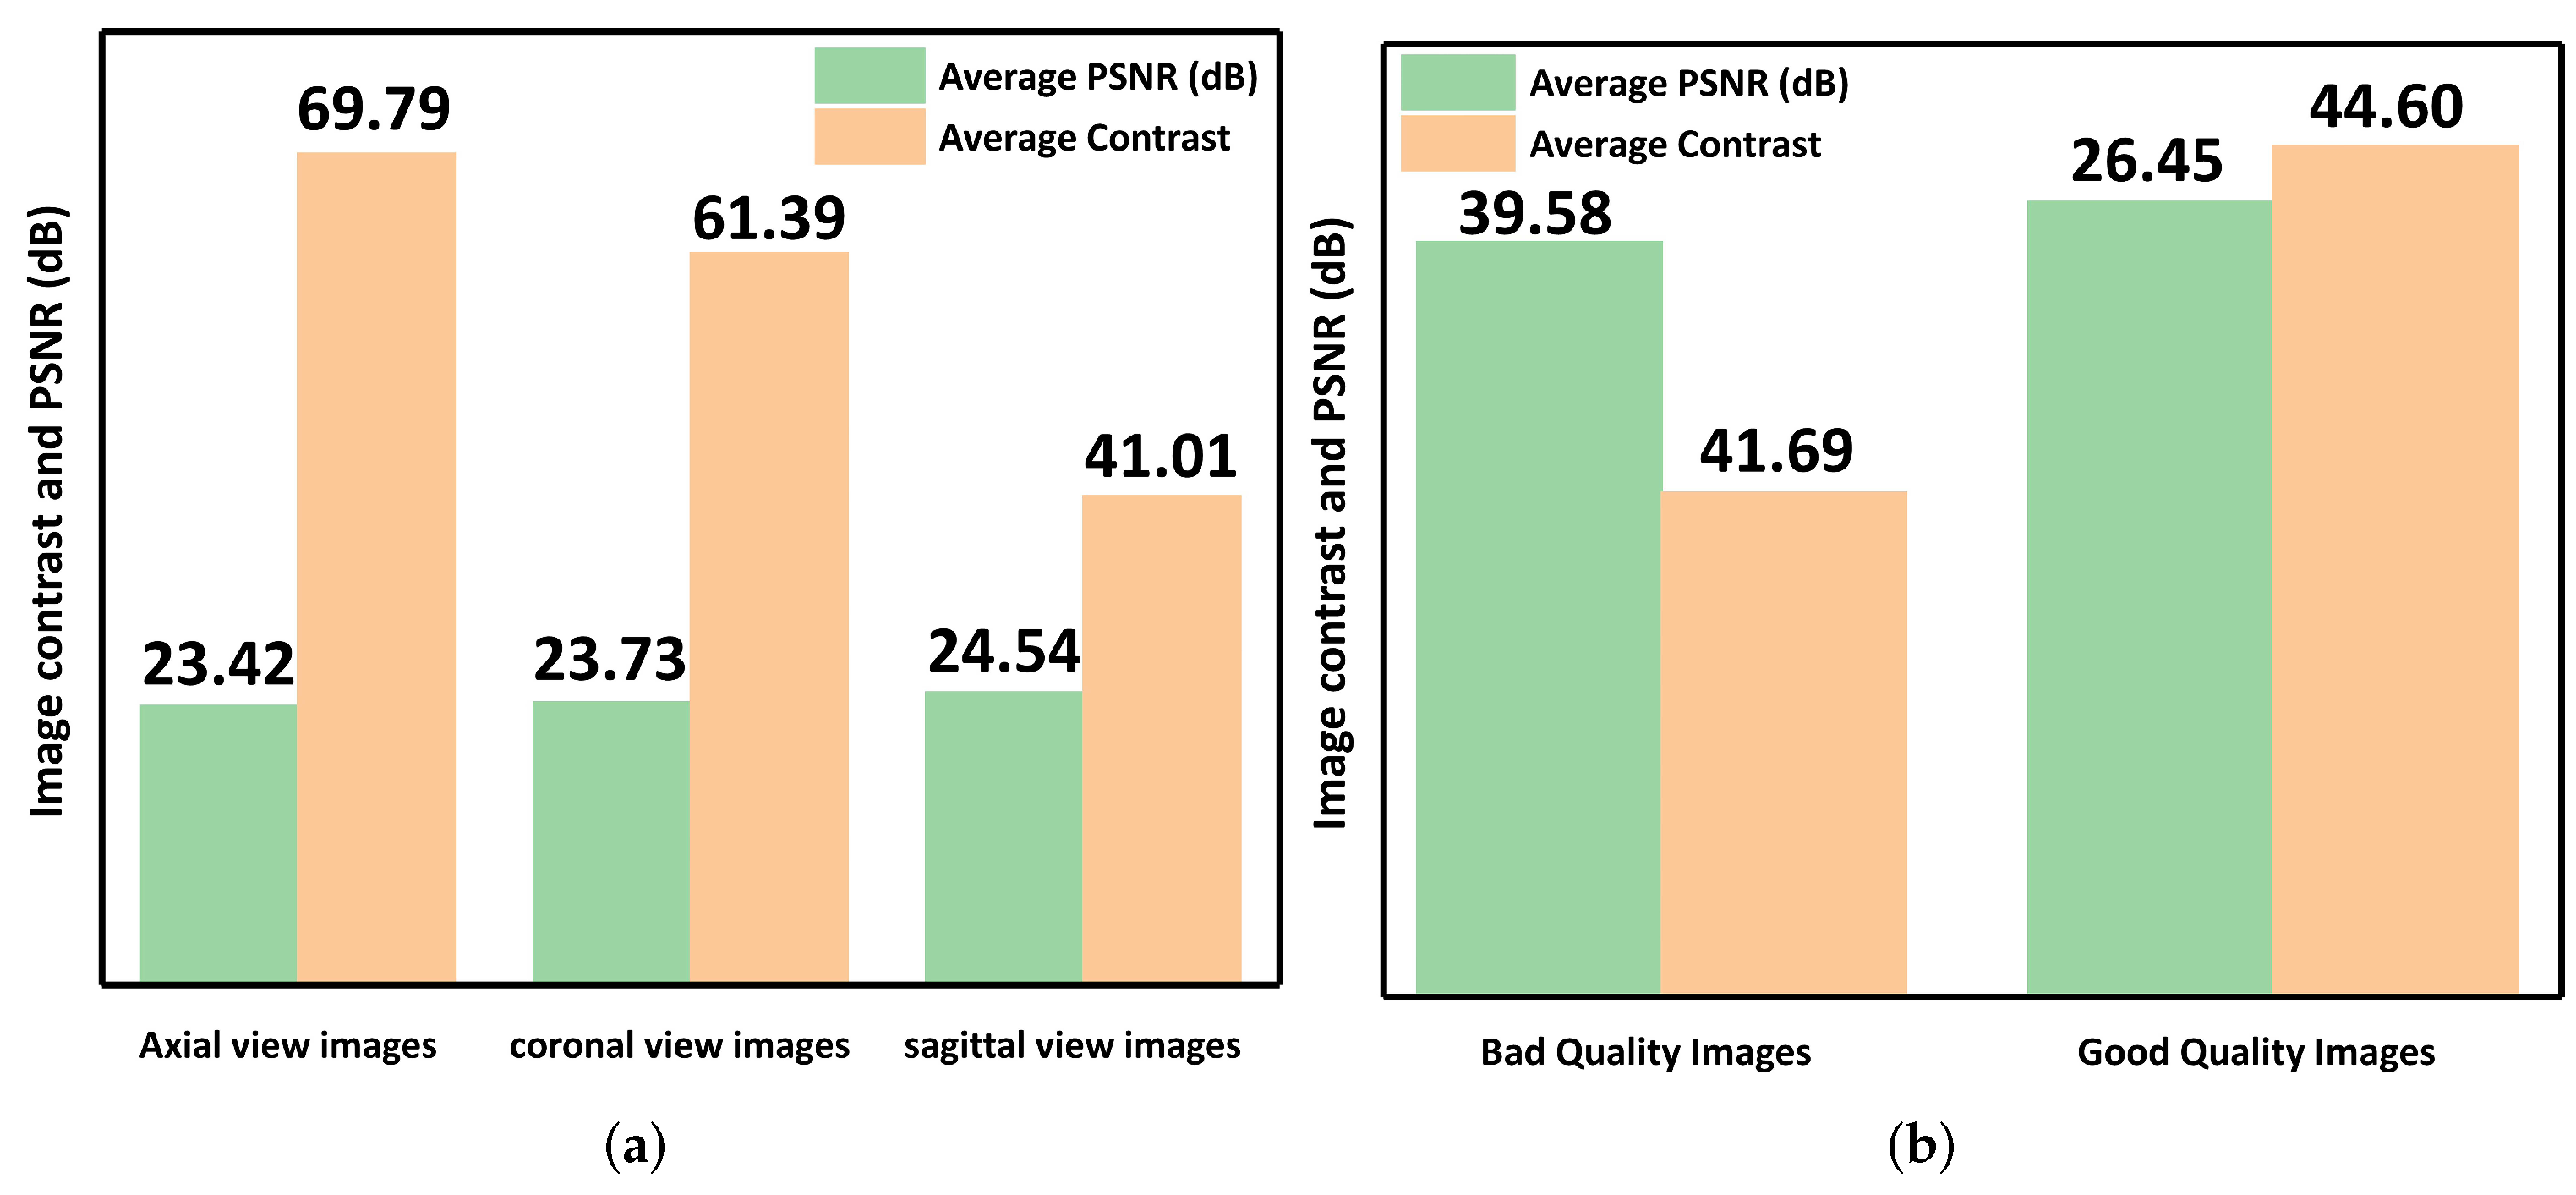
5.1. Analysis of the Enhancement Technique

This section includes PSNR and contrast analysis from the High-Resolution Fundus Images (HRF) Retinal Image Database [25,45] and the Oasis Database of brain MRI [44]. The HRF image database contains 36 images of two pairs (18 images of low quality images and 18 images of high quality). The Oasis brain MRI database contained three groups of 38 patients, each with its own set of 38 images: 38 axial plane images, 38 coronal plane images, and 38 sagittal plane images.

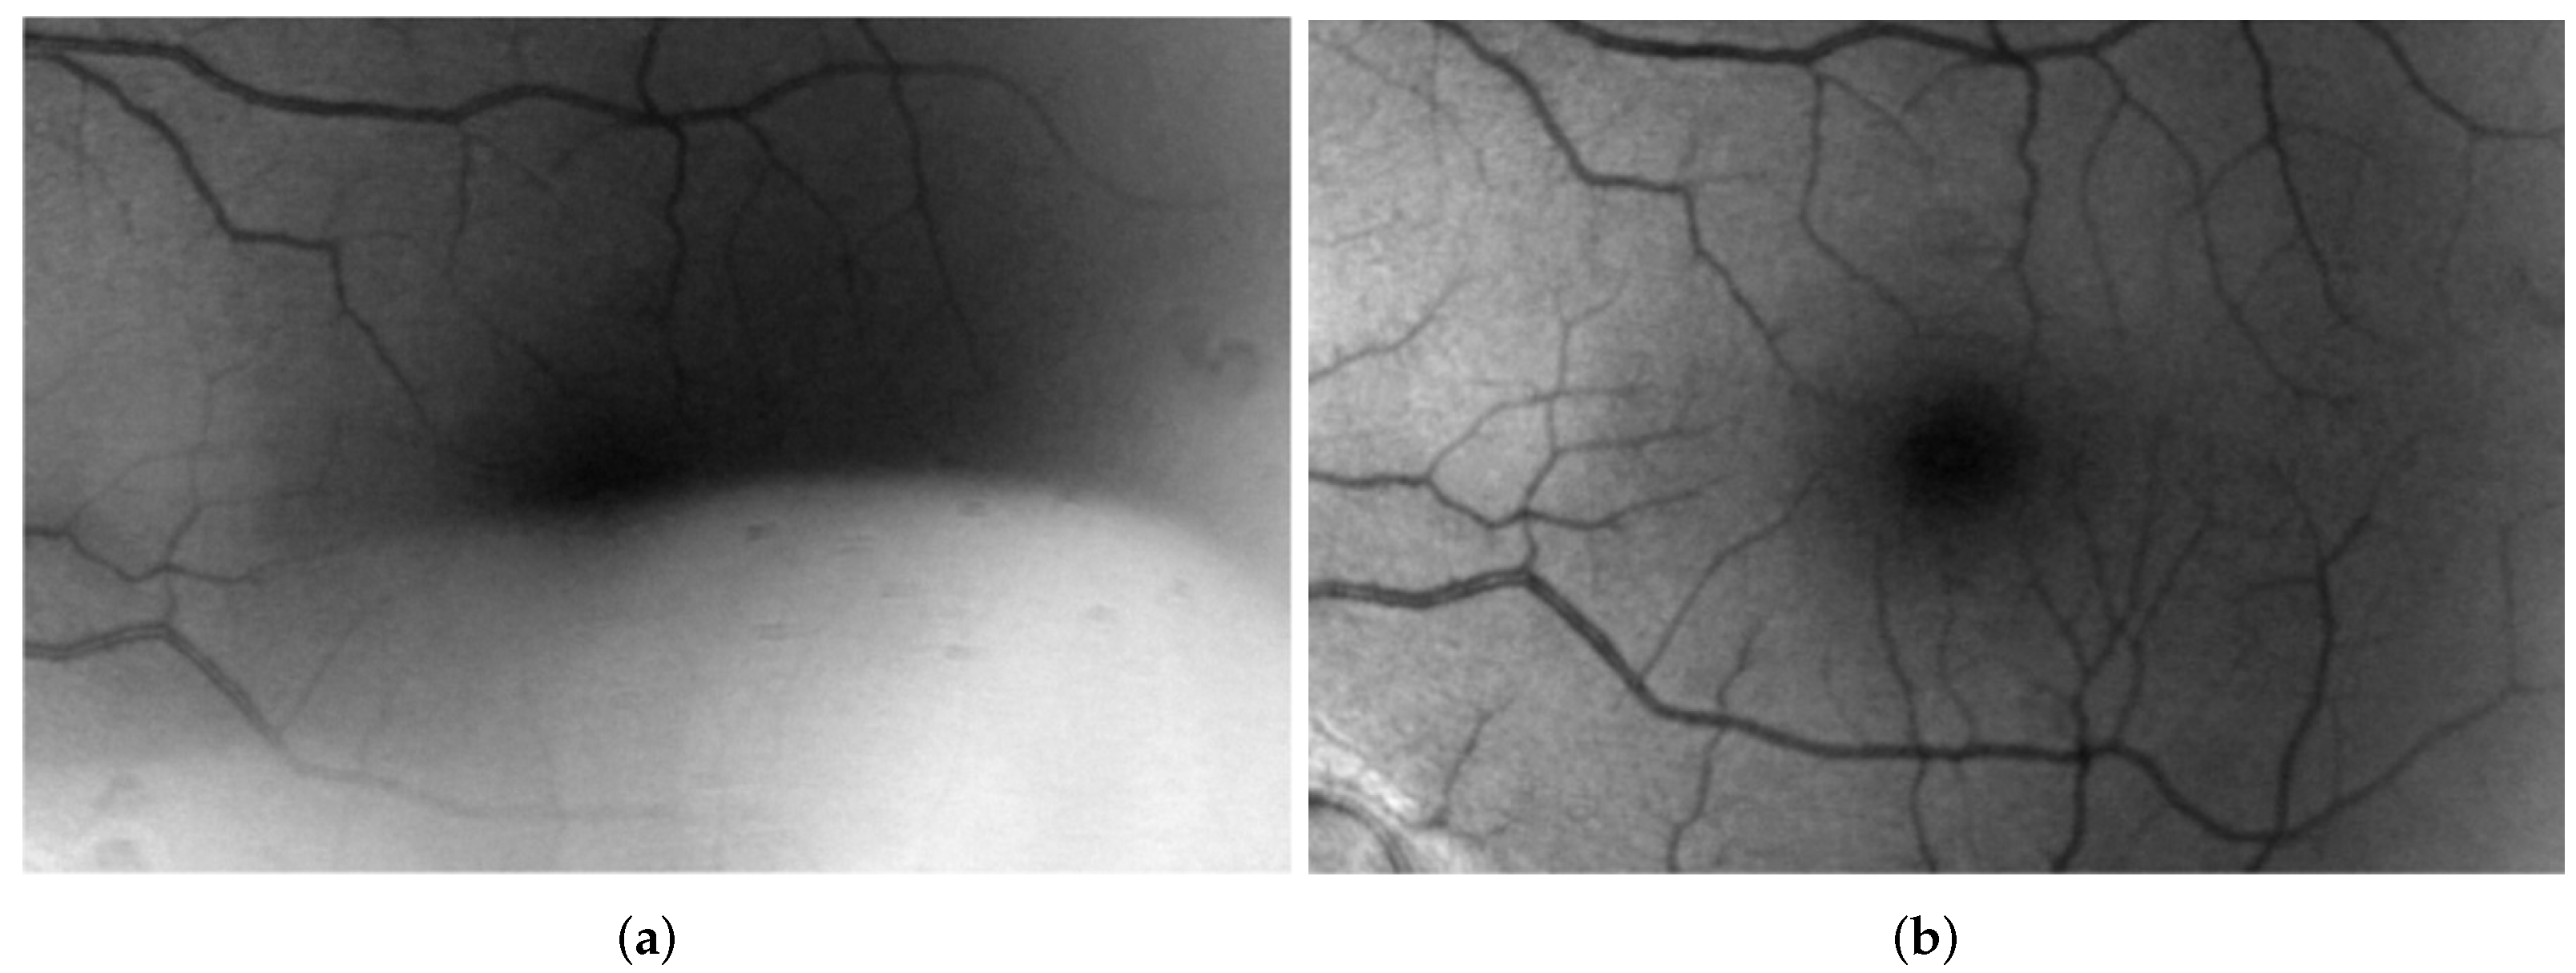
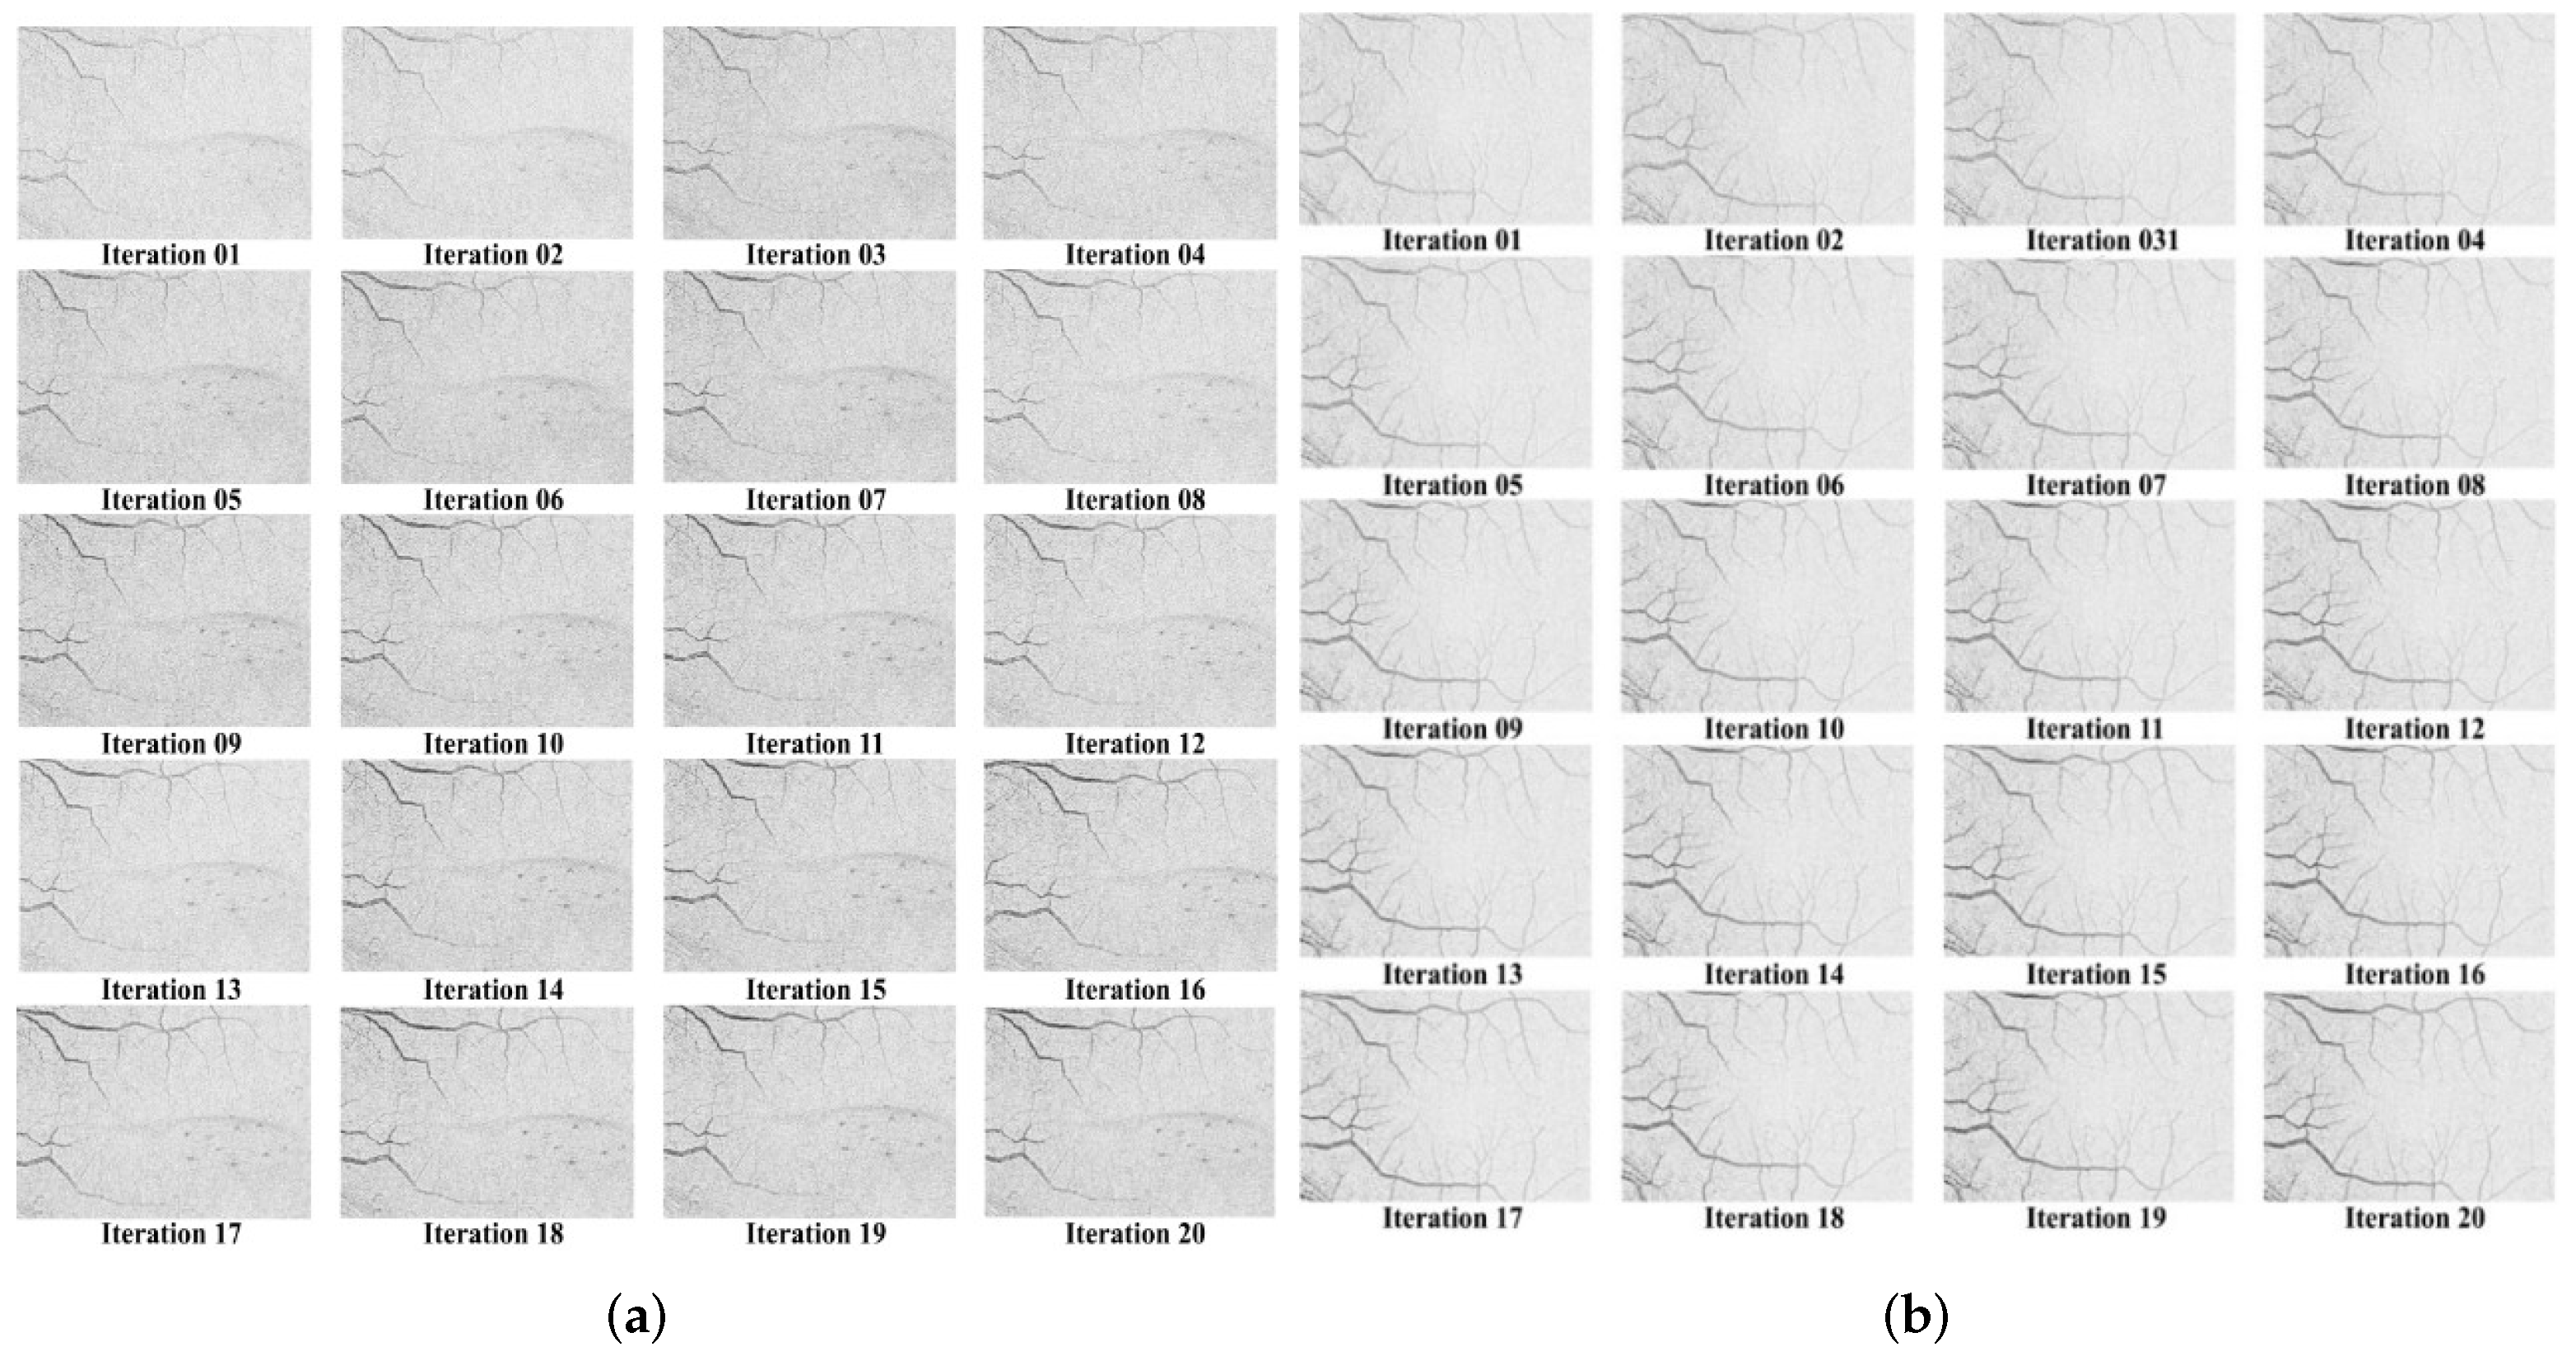
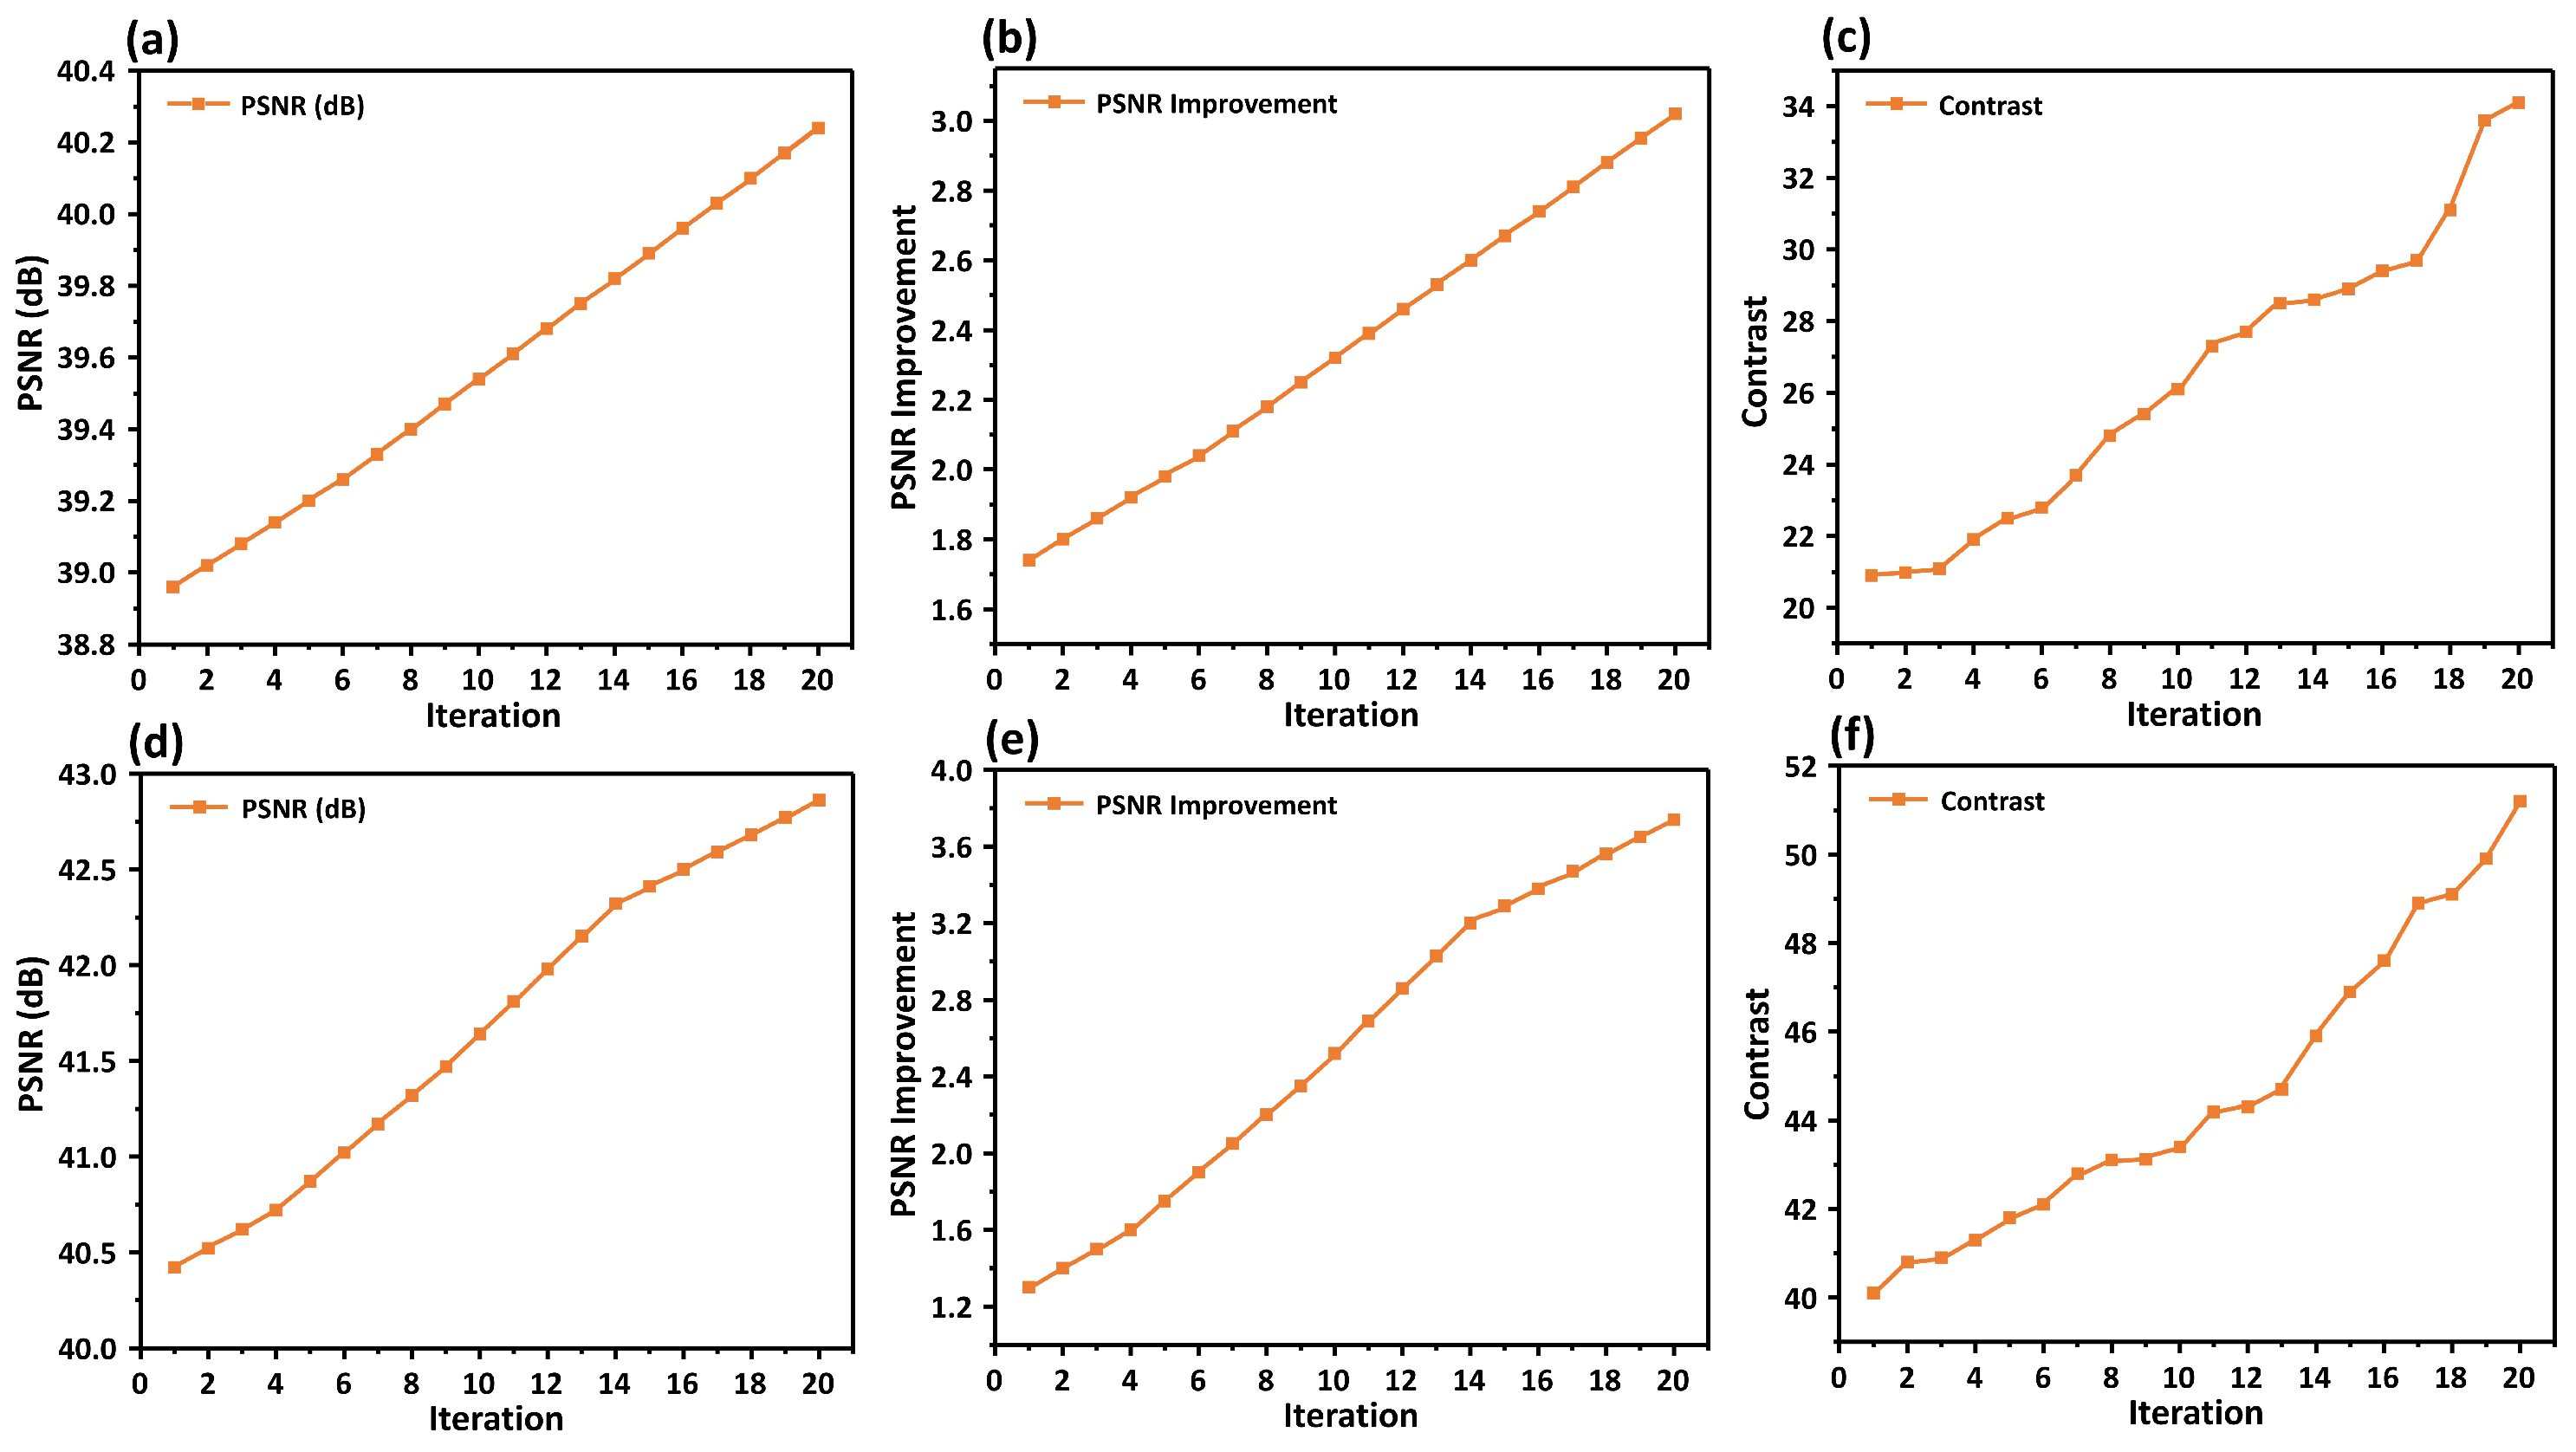
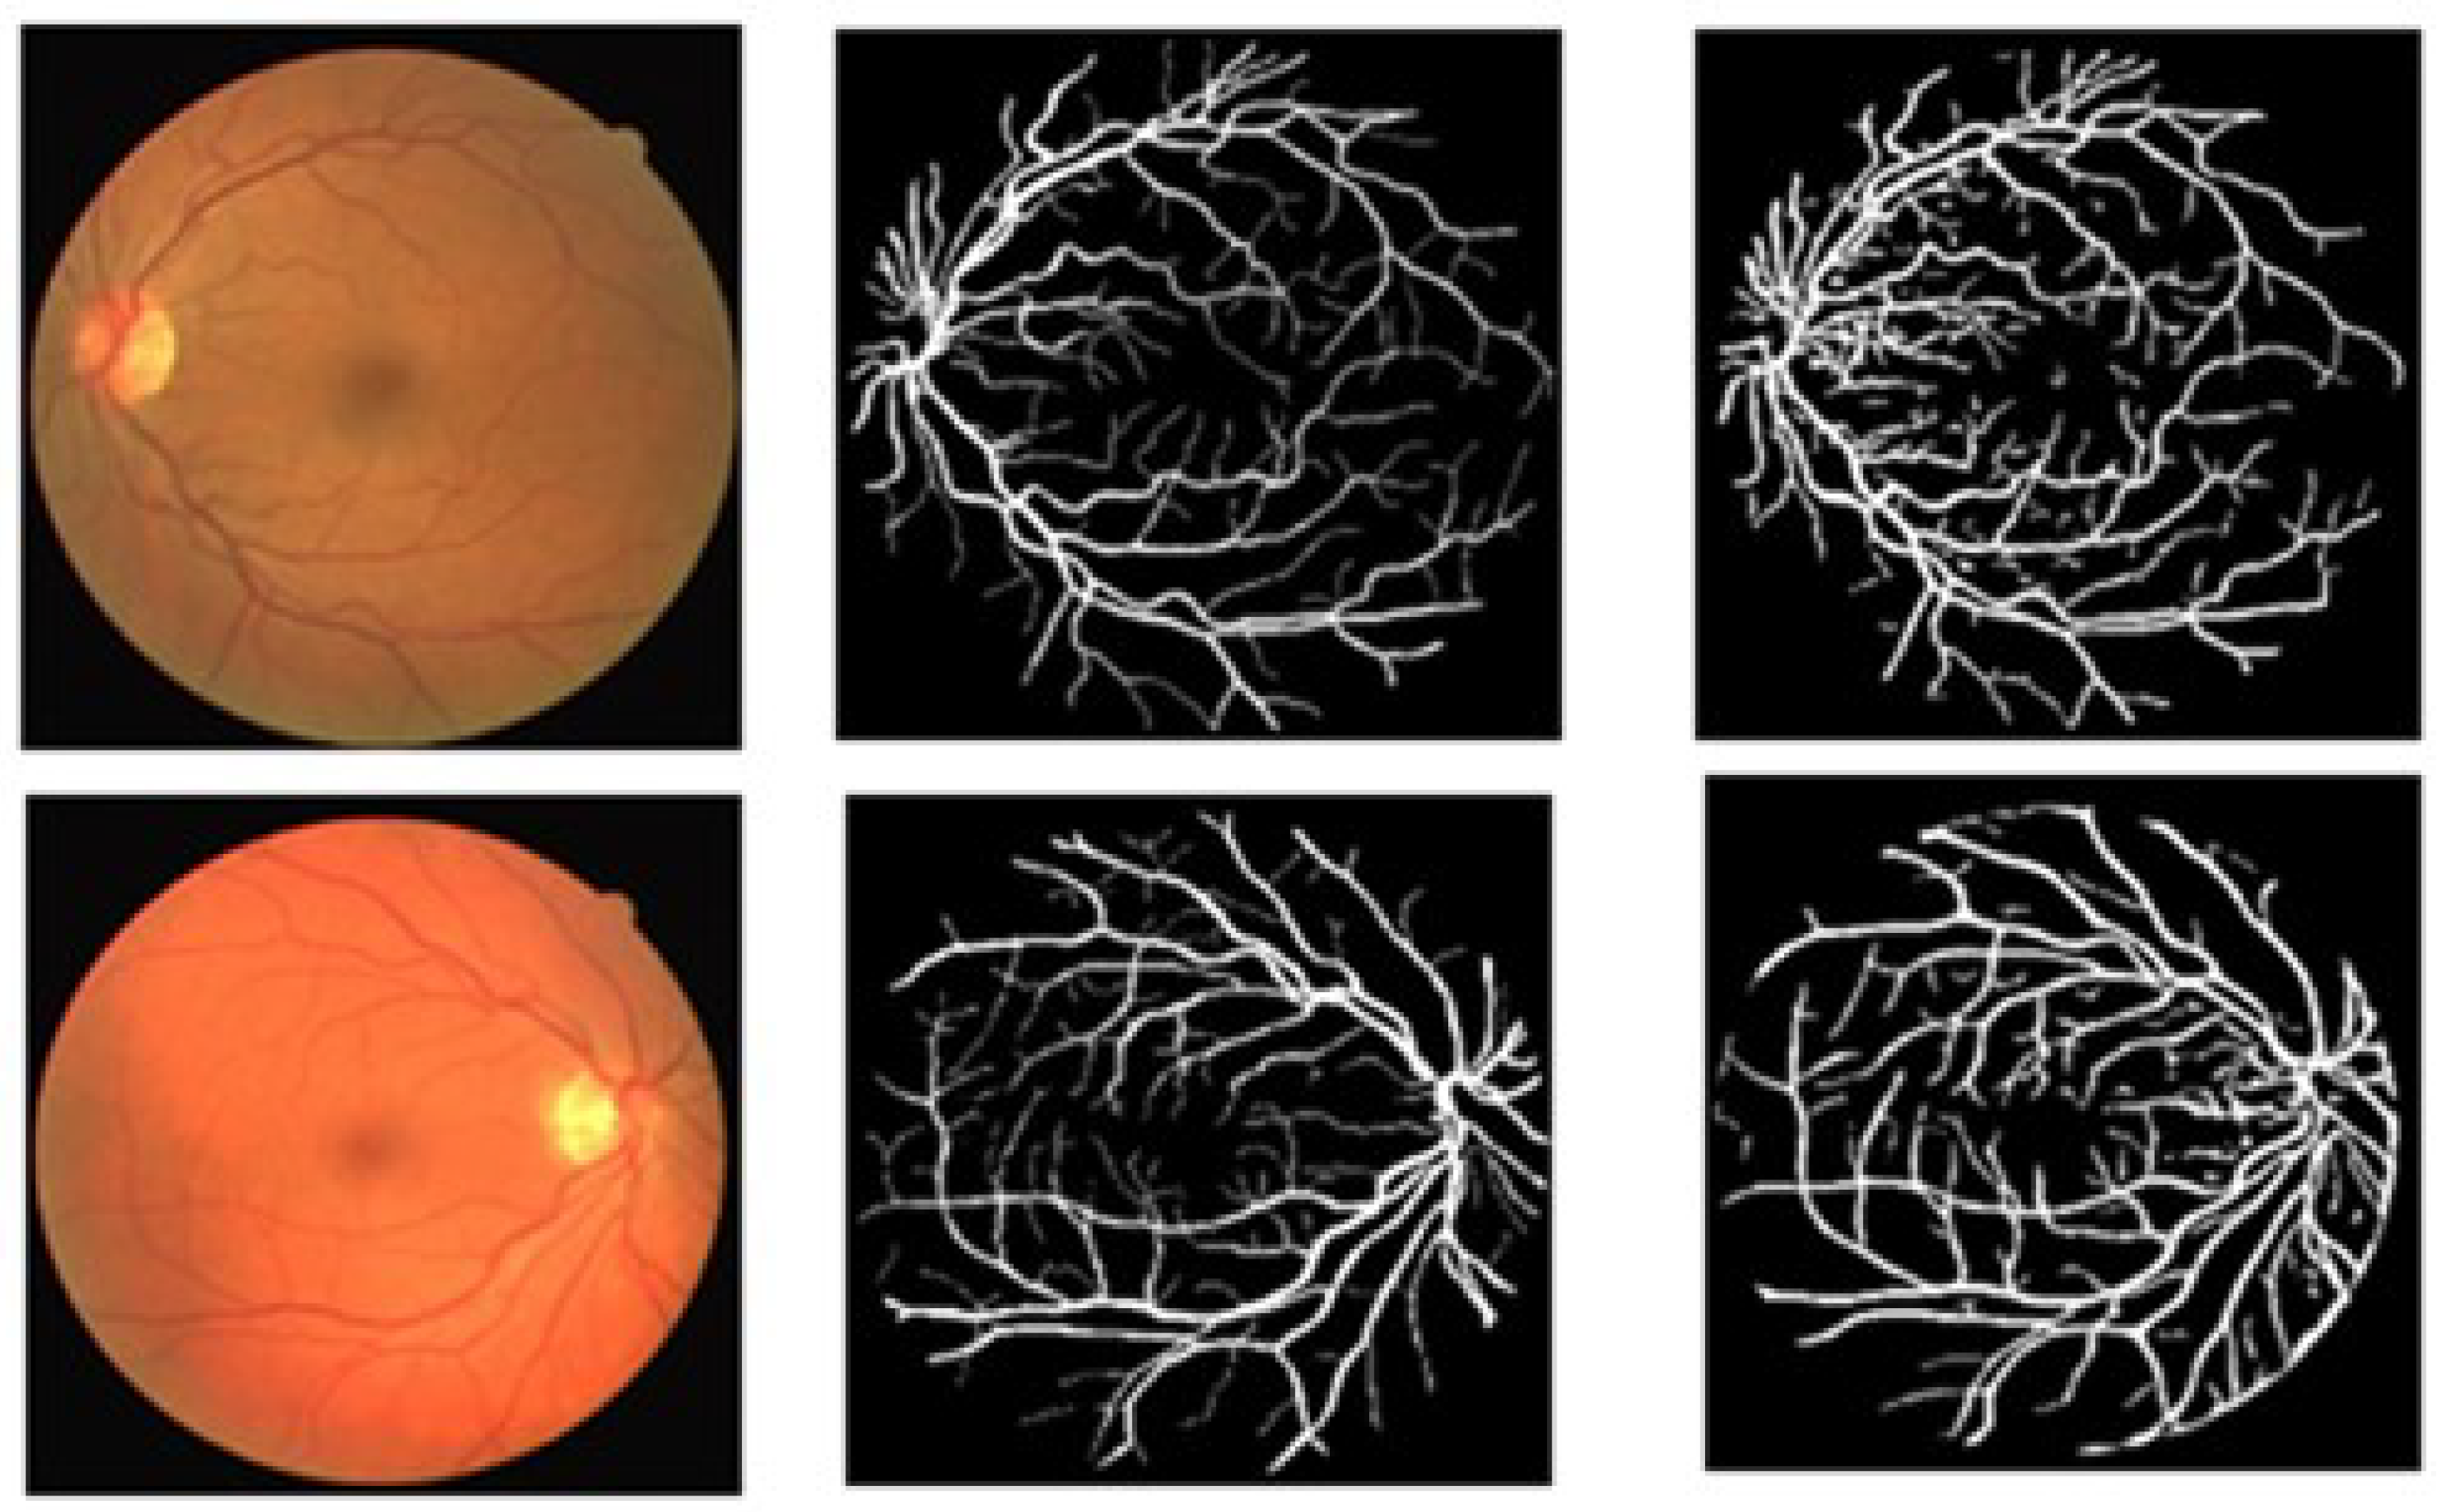
5.1.1. Analysis of Retinal Fundus Images

The McCann Retinex algorithm was used to normalize the contrast of the retinal fundus images and brain MRI. The effect of each iteration was observed, and the evaluation was based on the measurements of the PSNR and contrast. Figure 4 illustrates the effect of the iterative process of the McCann Retinex. On the left side (Figure 4a), the low quality image is observed. On the right (Figure 4b) is a high quality image from the HRF retinal image database. Figure 5 shows the output of the low (Figure 5a) and high quality images (Figure 5b) from the HRF retinal image database at each iteration from 1 to 20.
Figure 4a shows a low quality retinal image from the HRF database that suffered from nonuniform contrast that affected the visualization of blood vessel detail. The iterative McCann Retinex algorithm was used, and each iteration affected the image quality and obtained more details of the image. After each iteration, the PSNR and PSNR improvement and contrast were measured. The low quality green band image from the HRF database had a PSNR of 37.22 dB, and it improved up to 3 dB from iteration 1 to 20 (Figure 6a,b); similarly, the contrast increased from 20.9 at iteration 1 to 34.12 at iteration 20 (Figure 6c. The high quality green band image from the HRF database had a PSNR of 39.12 dB, and it improved up to 3.74 dB from iteration 1 to 20 (Figure 6d,e); similarly, the contrast increased from 40.1 at iteration 1 to 51.1 at iteration 20 (Figure 6f). This improvement on high quality HRF images allows better observation of the retinal vessels and retinal abnormalities and also impacts the performance of the segmentation process.

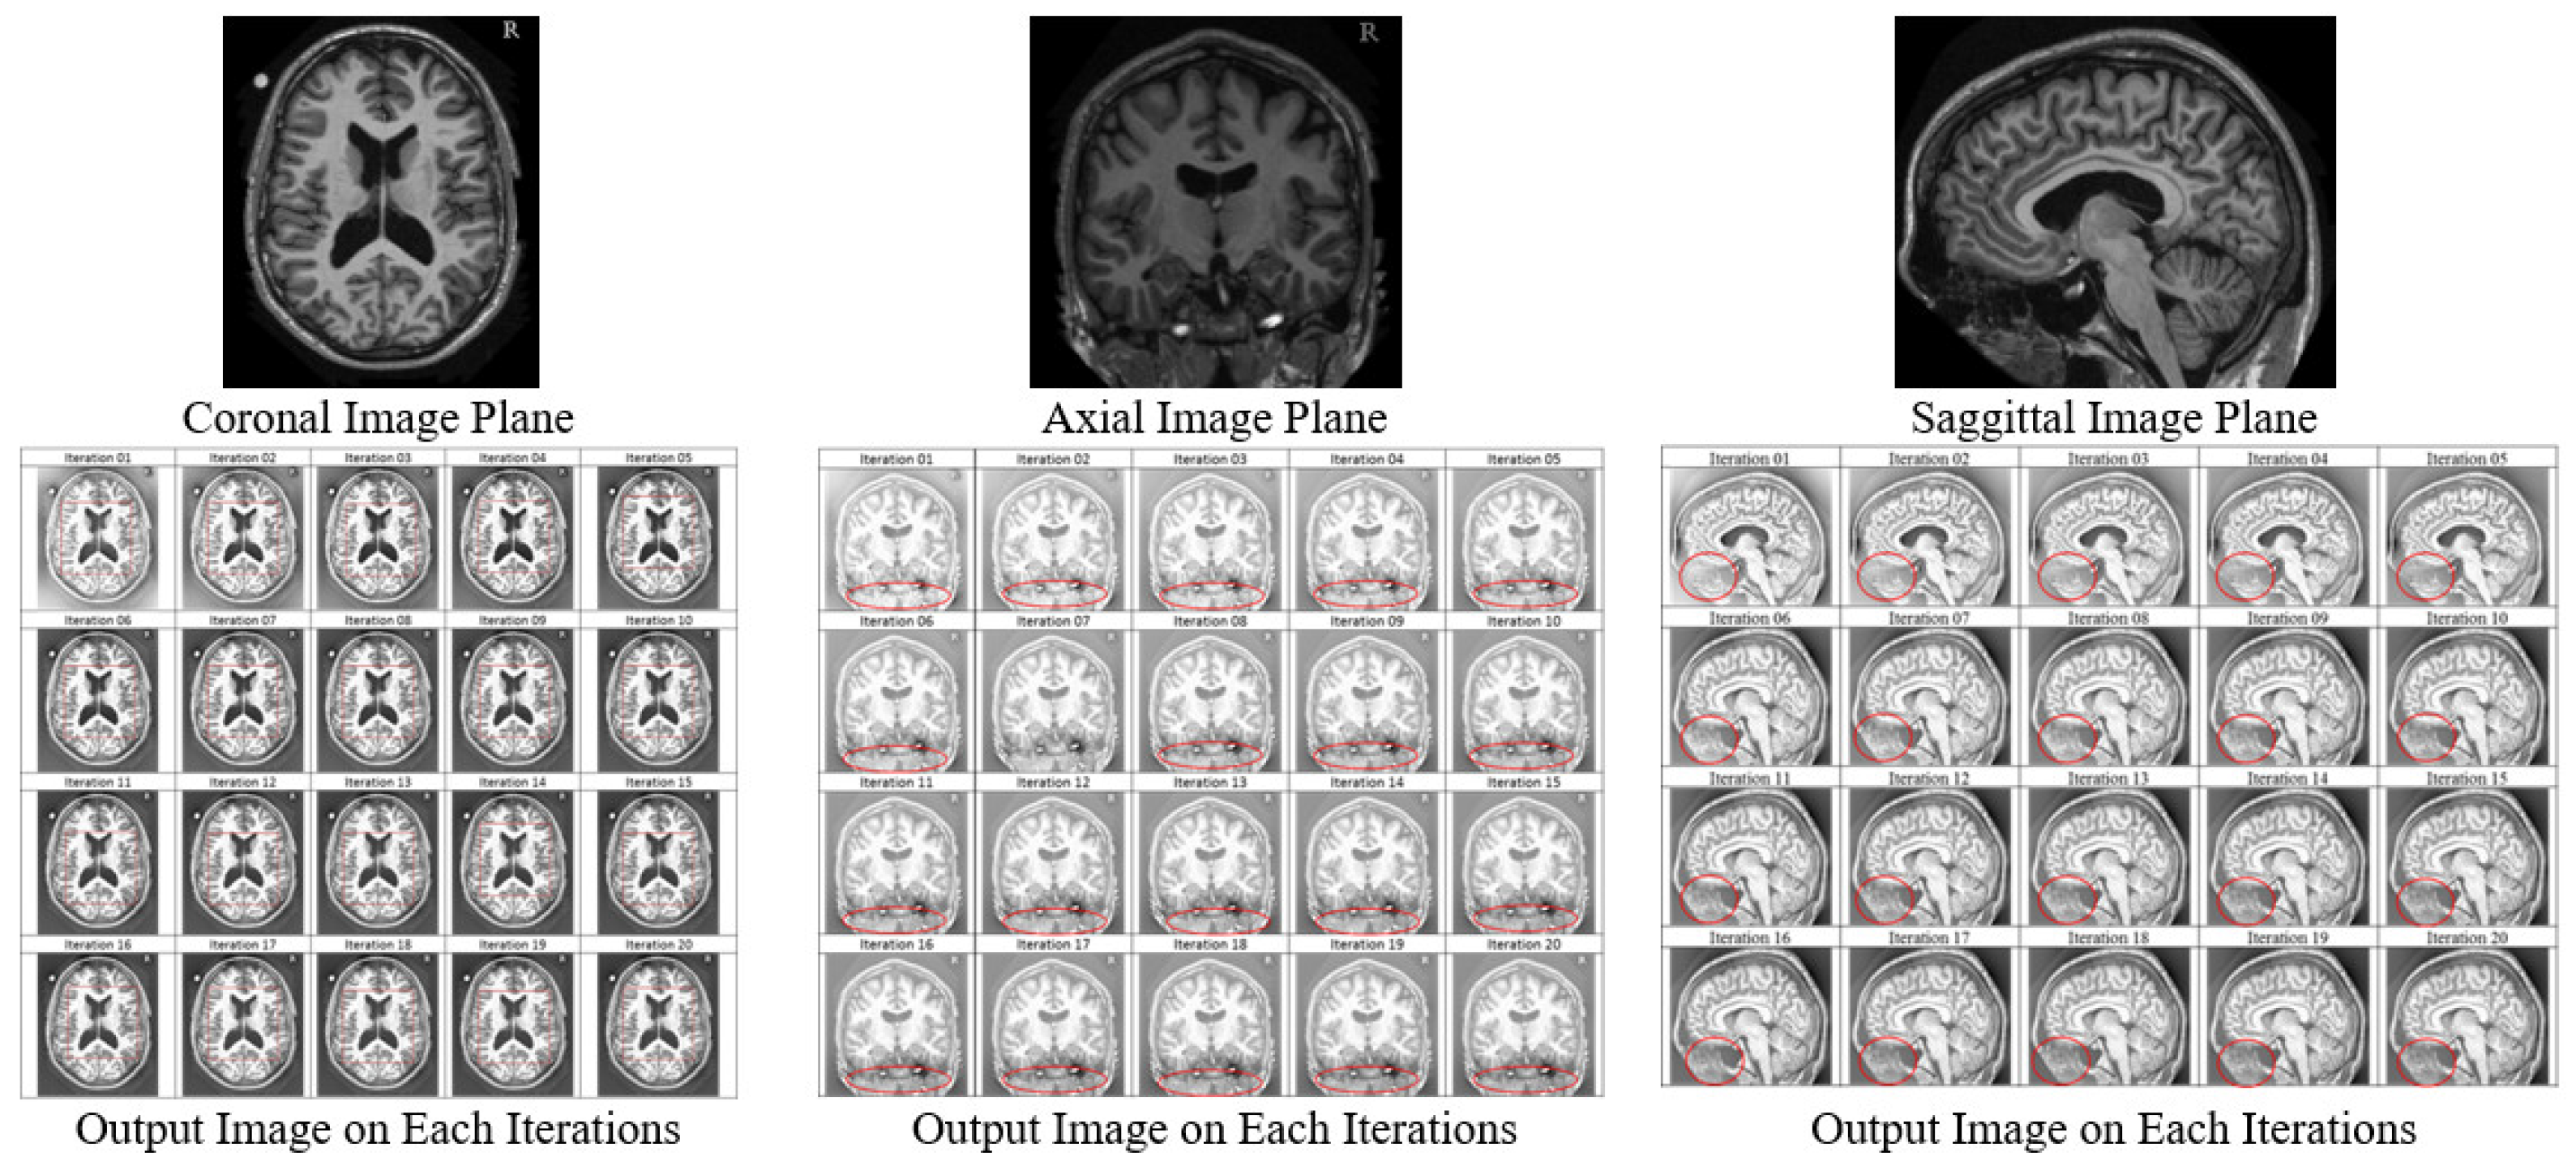
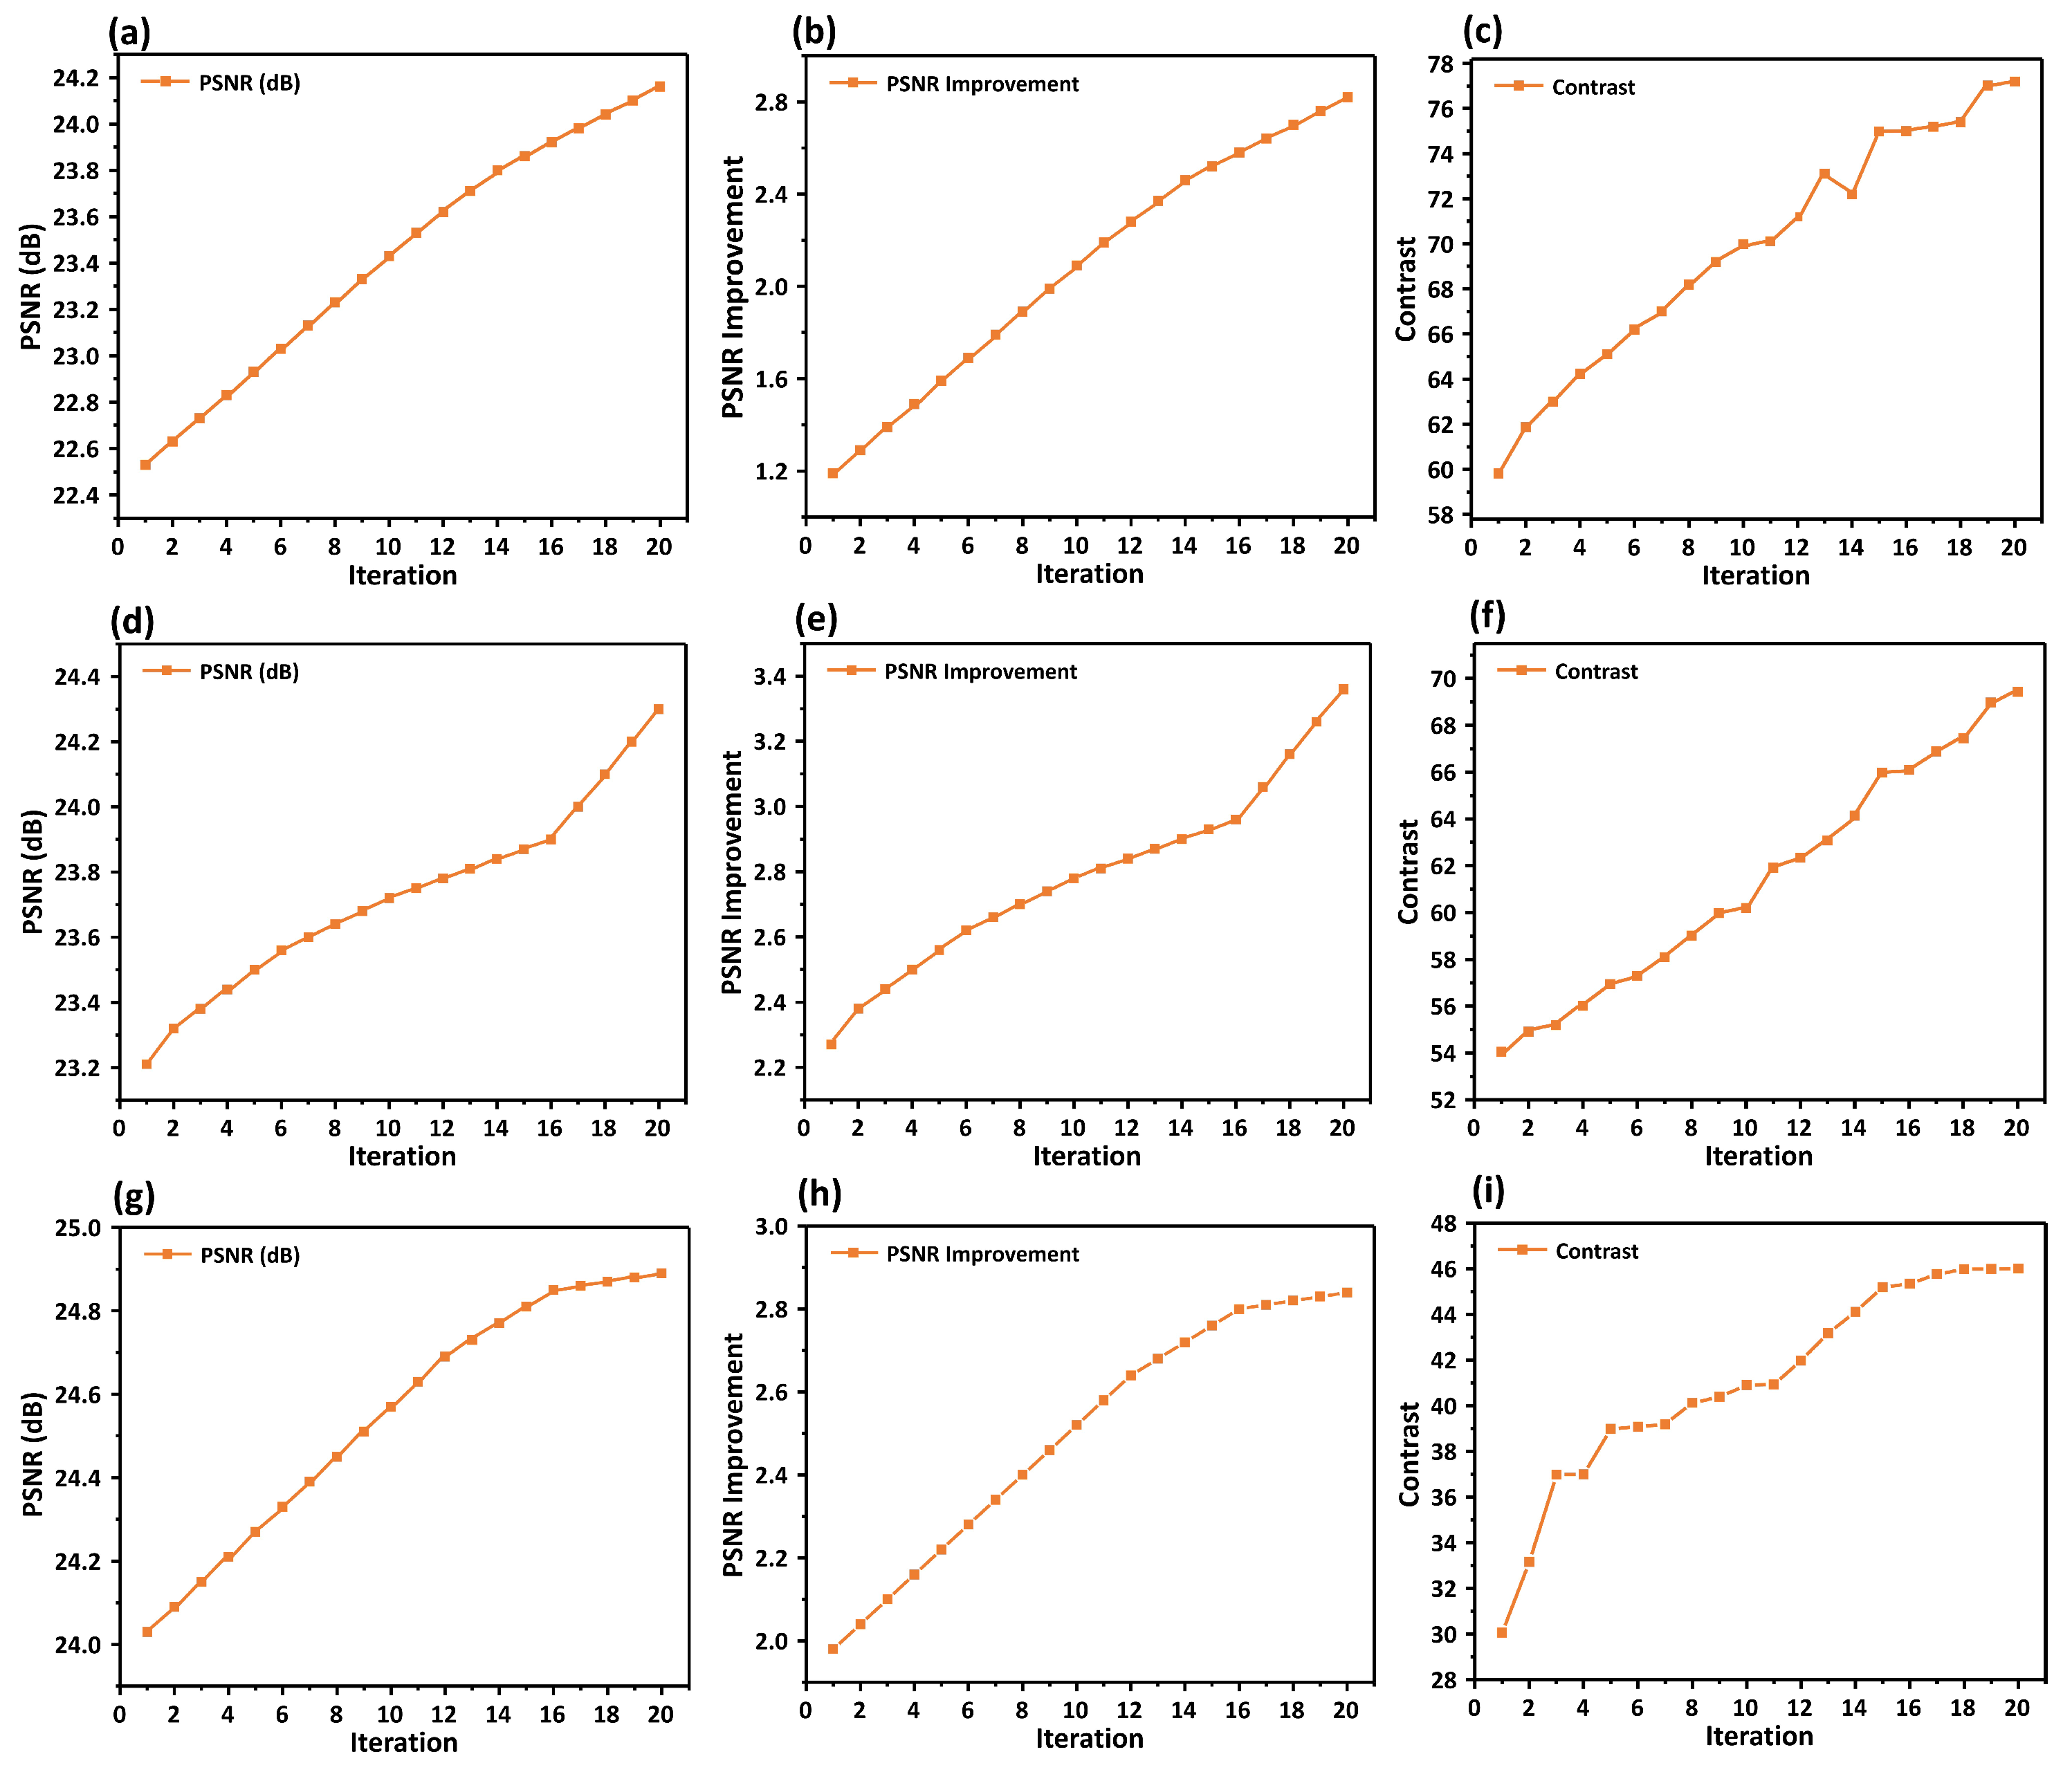
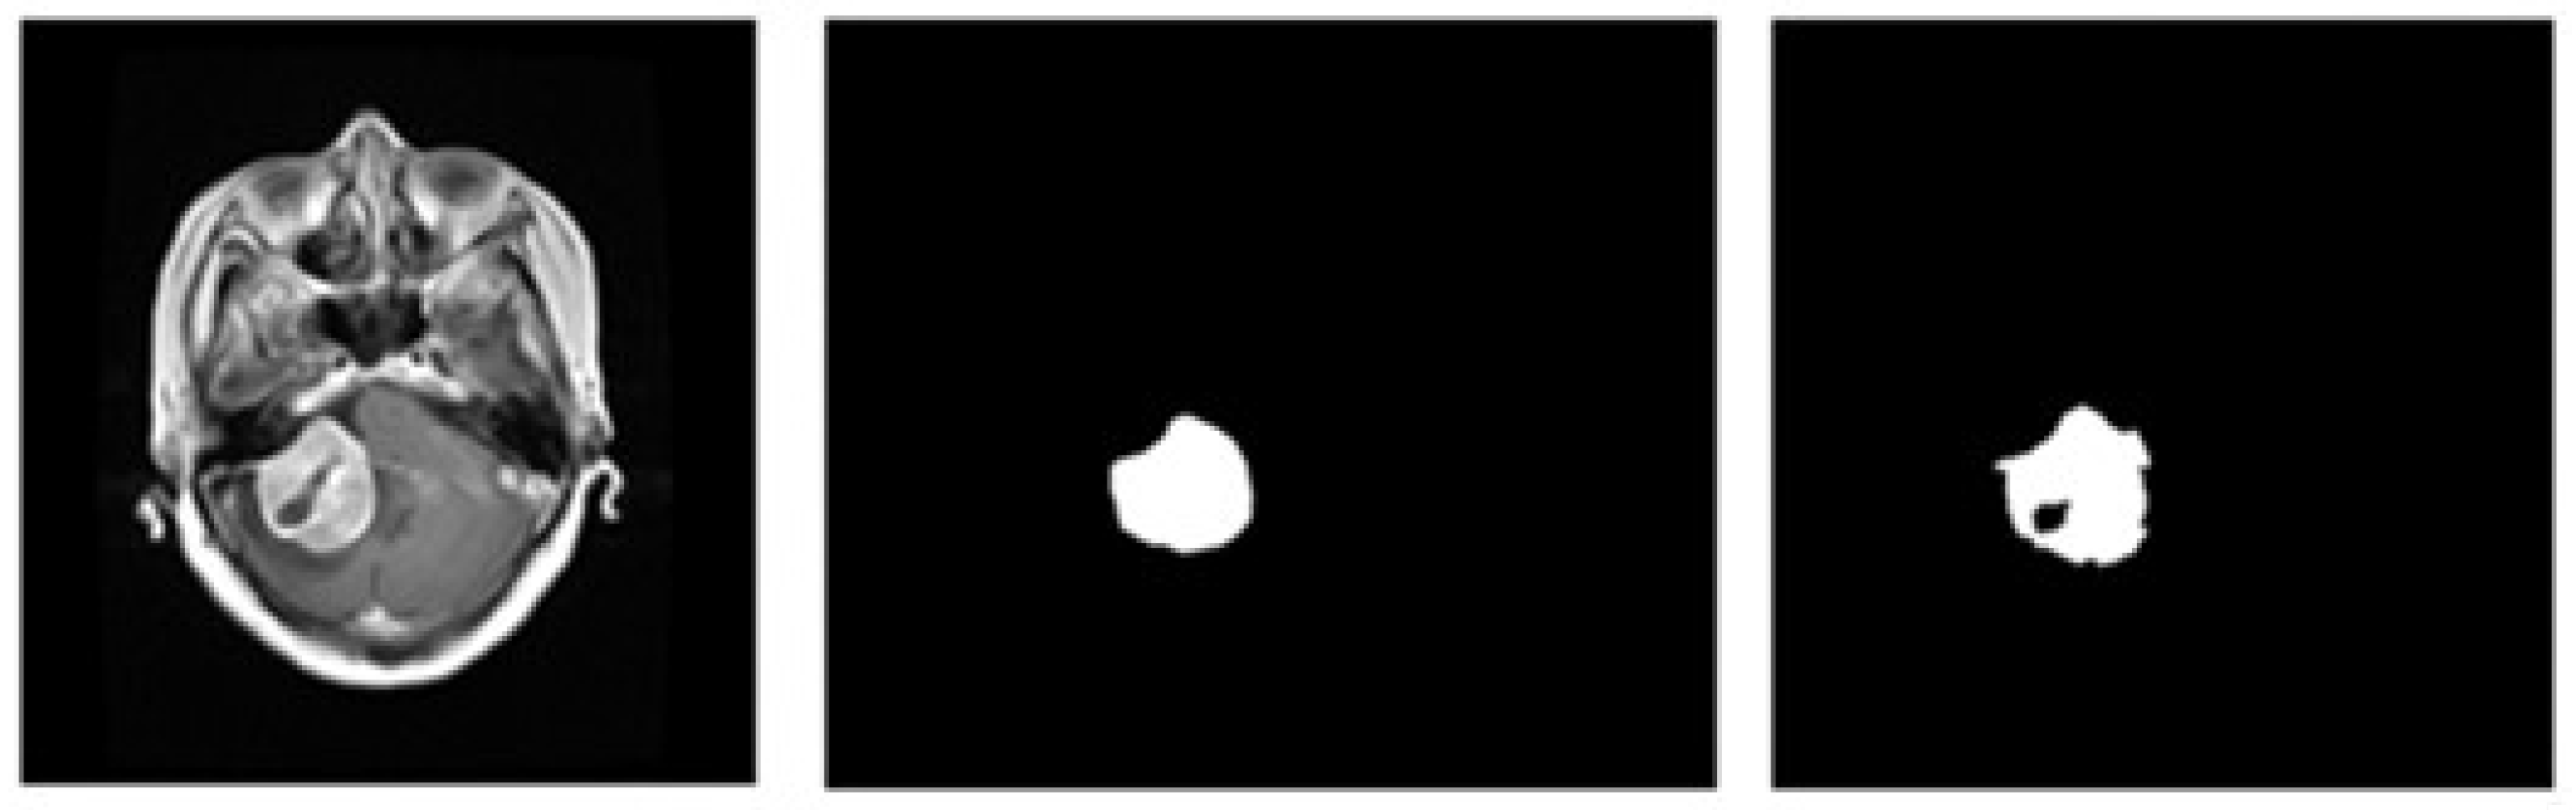
5.1.2. Analysis of MR Brain Images

The results showed a similar impact of the McCann Retinex algorithm on the brain MRI; the output of the axial plane images, coronal plane images, and sagittal plane images at each iteration from 1 to 20 are shown in Figure 7.
The contrast and PSNR at each iteration increased in all three sets of the oasis brain image database as shown in Figure 8. The PSNR in the axial plane images increased from 22.53 dB at iteration 1 to 24.16 dB at iteration 20 (Figure 8a), with an improvement in the PSNR of approximately 1.19 dB at iteration 1 to 2.82 dB at iteration 20 (see Figure 8b), along with an increase in the contrast from 59.81 at iteration 1 to 77.19 at iteration 20 (Figure 8c). The PSNR in the coronal plane images increased from 23.21 dB at iteration 1 to 24.3 dB at iteration 20 (Figure 8d), with an improvement in the PSNR of approximately 2.27 dB at iteration 1 to 3.36 dB at iteration 20 (Figure 8e), along with an increase in contrast from 54.04 at iteration 1 to 69.43 at iteration 20 (Figure 8f). The PSNR in the sagittal plane images increased from 24.03 dB at iteration 1 to 24.89 dB at iteration 20 (Figure 8g), with an improvement in the PSNR of approximately 1.98 dB at iteration 1 to 2.84 dB at iteration 20 (Figure 8h), along with an increase in contrast from 30.06 at iteration 1 to 46.01 at iteration 20 (Figure 8i).

5.2. Overall Analysis of McCann Retinex Algorithm

Figure 9 illustrates the overall performance of the McCann Retinex algorithm at iteration 20 on the HRF and Oasis brain MRI databases. Regarding the PSNR and contrast enhancement, the McCann Retinex algorithm obtained good contrast and PSNR enhancement on both databases. Figure 9a shows that the average PSNR on the axial plane images was 23.46 dB with an average contrast of 69.79, the average PSNR on the coronal plane images was 23.73 dB with an average contrast of 63.39, and the average PSNR on the sagittal plane images was 24.55 dB with an average contrast of 41.02. Figure 9b shows that the average PSNR on low quality images from the HRF database was 39.58 dB, with an average contrast of 26.46, and the average PSNR on high quality images from the HRF database was of 41.69 dB, with an average contrast of 44.61. The McCann Retinex algorithm performed much better on the Oasis brain MRI database than on the HRF images database. The contrast enhancement played an important role in improving the performance of the segmentation process, and the validation is described Section 5.4.

5.3. Comparative Analysis of Image Enhancement with Existing Image Enhancement Techniques

We performed a comparative analysis of the proposed image enhancement method against existing techniques. We compared the performance of our proposed method with histogram equalization (HE), contrast-limited adaptive histogram equalization (CLAHE), and brightness preserving bi-histogram equalization (BBHE). The proposed method yielded more enhanced images with outstanding PSNR performance and contrast enhancement. Table 1 shows the comparative analysis of our proposed method against the techniques of HE, CLAHE, and BBHE. As shown in Table 1, the proposed method obtained an improved PSNR and contrast in the HRF and Oasis brain MRI databases. The PSNR improved around 3dB in the images of both databases, the contrast improved from 6 to 25 in the HRF database, and it improved from 13 to 27 in the brain image database. This shows the capability of the technique for the analysis of medical images such as retinal fundus images from the HRF database and the Oasis brain MRI for brain abnormalities.

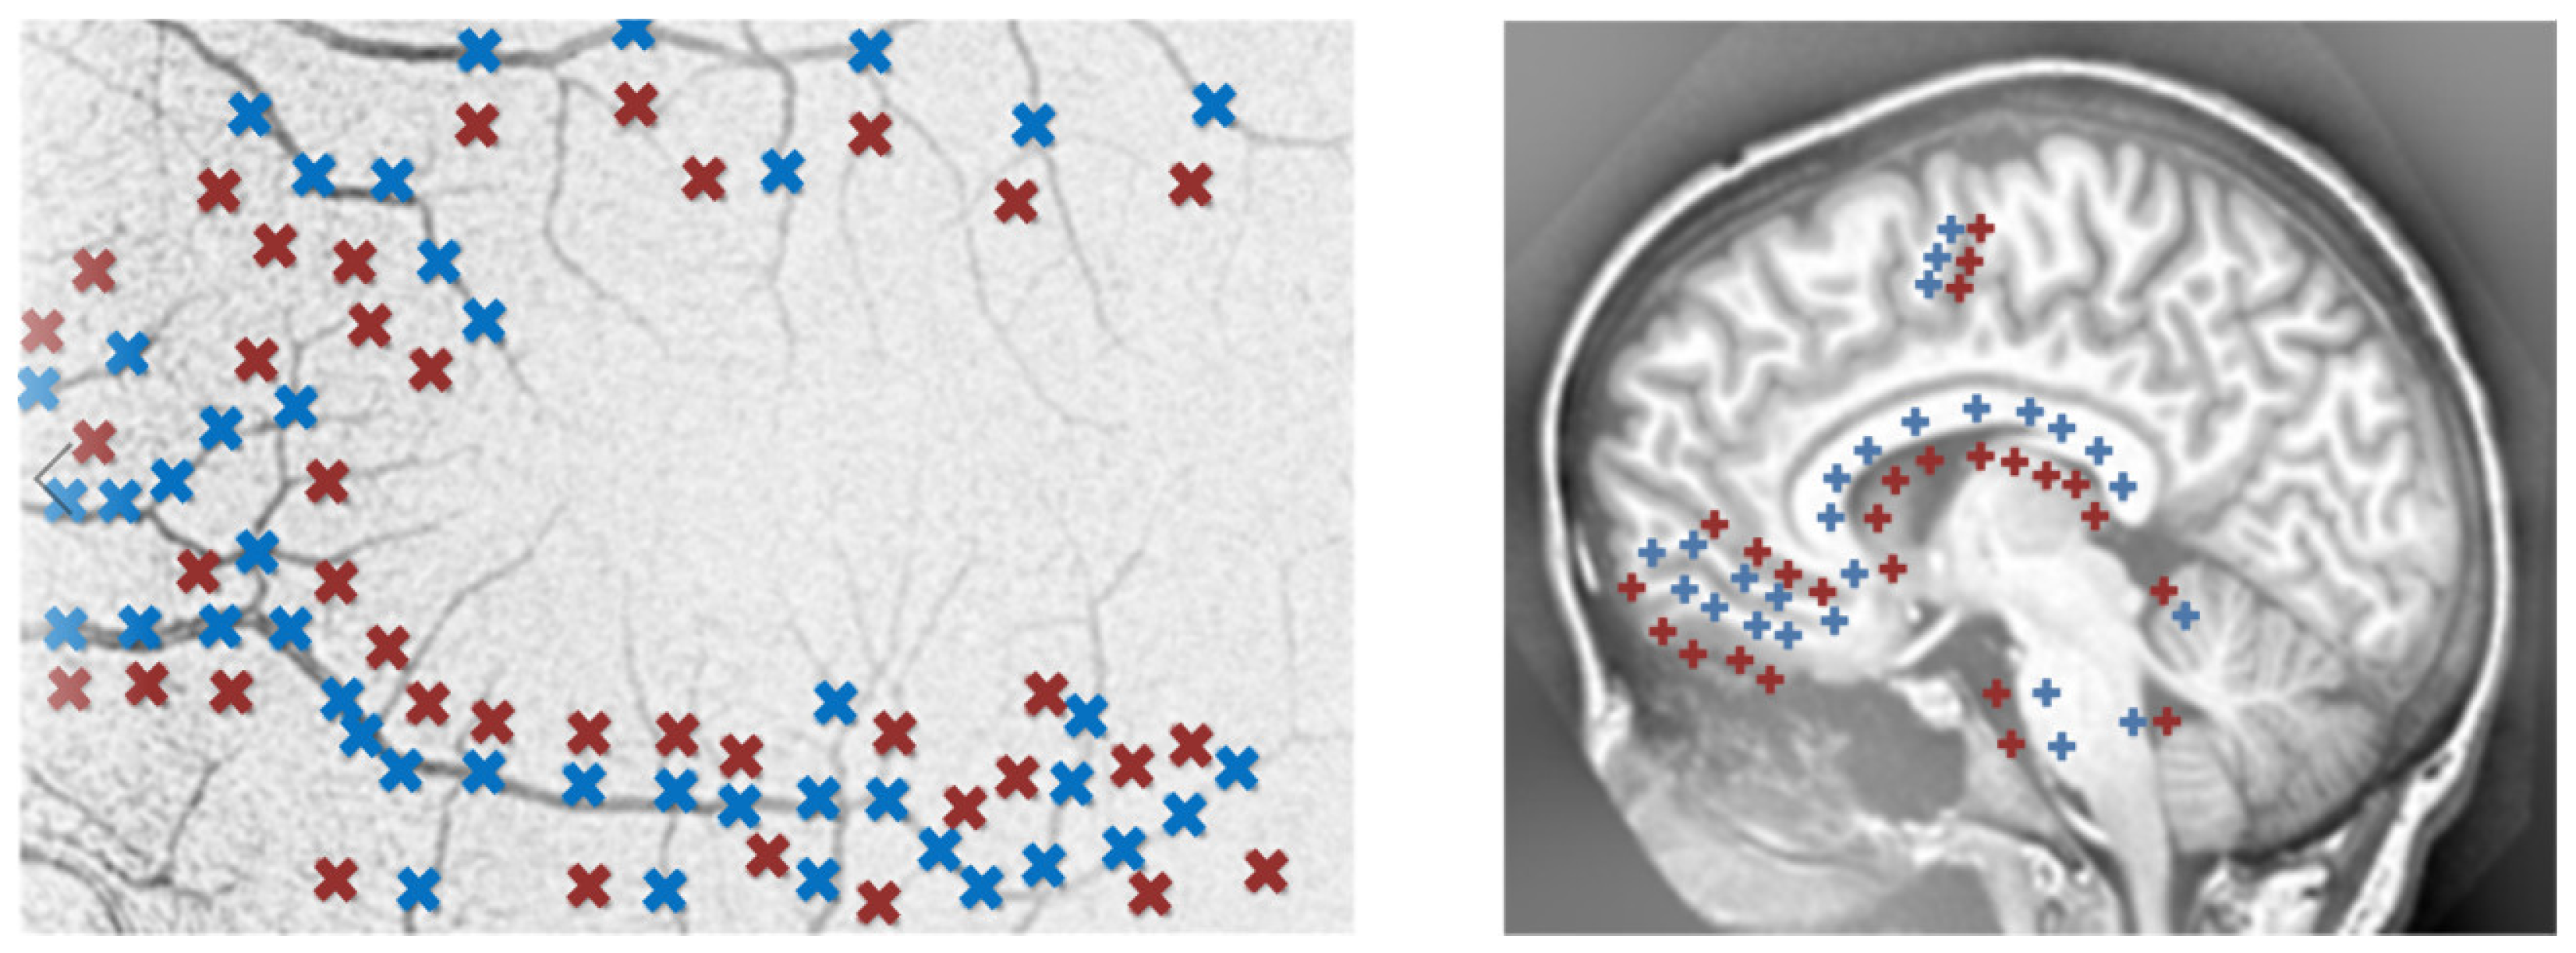
5.4. Impact of the Proposed Enhancement Method on the Segmentation Process

Figure 10 depicts the validation of the McCann Retinex algorithm in the context of retinal blood vessel segmentation and brain tumor region segmentation. We used the DRIVE [46] and STARE [34] databases for retinal blood vessel segmentation and the Oasis brain MRI database for brain tumor segmentation.
We obtained segmented vessels and a segmented tumor region using our proposed postprocessing steps [16]. The measurement parameter section defined the sensitivity, specificity, accuracy, and AUC used to evaluate the performance. We obtained a sensitivity of 0.801 and 0.782, a specificity of 0.953 and 0.951, an accuracy of 0.953 and 0.0949, and an AUC of 0.841 and 0.836 on the DRIVE and STARE databases’ segmented images of retinal vessels, as shown in Figure 11.
We achieved a sensitivity of 0.83, a specificity of 0.95, and an accuracy of 0.97 on the Oasis database of the brain MRI and the segmented brain tumor region; as shown in Figure 12, the tumor was detected. This performance demonstrates the capability of the enhancement techniques. They can be used in many medical imaging applications to diagnose eye diseases and allow early image details.
The computation time was based on the size of the database, because some databases contain large images, particularly in medical imaging. Some images are large in size and require significant processing time. In our proposed algorithm, the image enhancement technique on the HRF image database took 6.15 s, and on MR brain images, it took 4.23 s. With the postprocessing module, it took 7.91 s on the HRF database and 5.65 s on the MRI brain images.

6. Conclusions

This research work provides a solution to the problems of using medical images such as retinal fundus color images and brain MRI for disease diagnosis. These images suffer from noise and low-varying contrast that impact the segmentation process for retinal blood vessel and brain tumor extraction. The first step required implementing the preprocessing or image enhancement step. Many traditional techniques have been used to resolve noise and the low-varying contrast problem; however, there remained a requirement for a novel method based on the nature of the image. In this work, the McCann Retinex algorithm was used to solve the low-varying contrast of these two types of images. The iterative McCann Retinex algorithm was used as an improvement technique to speed up the postprocessing steps.
In this research work, the impact of the iterative McCann Retinex algorithm was analyzed on the FAZ of retinal fundus images and MRI brain images. The optimal iteration was chosen according to the improvement in the PSNR and the contrast of the image. There were 20 iterations to analyze the performance on the HRF retinal image database and the Oasis brain MRI database. The main contribution of this research was the analysis of the low-varying-contrast enhancement on the two databases. It is observed that the brain MRI exhibited higher contrast and less noise, whereas the retinal fundus images exhibited noise issues as well as varying to low contrast; however, our challenge was to implement the algorithm for both databases for disease diagnosis.
The proposed method improved the noise reduction and contrast in both databases, and it resulted in better image quality. This improvement provides another motivation to reduce the invasive method of FFA, because temporary injection-based FFAs improve contrast but impact patient health. However, this proposed method overcomes the problem of low-varying contrast, is safer, and facilitates the postprocessing steps to obtain a well-segmented image. This study used the High-Resolution Fundus (HRF) and Oasis databases. With our technique, the average PSNR enhancement on the Oasis database images was about 3 dB with an average contrast of 57.4. The average PSNR enhancement over the HRF database images was approximately 2.5 dB with a contrast average of 40 over the database. Such enhancement of contrast and noise level may be a better option for imaging well-segmented retinal blood vessels and accurate detection of brain tumors, as validated with comparable performance against existing methods.
The proposed method was also validated in the postprocessing steps to observe its impact. The well-segmented image was obtained with an accuracy of 0.953 and 0.0949 on the DRIVE and STARE databases. The brain MRI was of good quality; however, due to the poor position of the patient, the image suffered from a lack of contrast between the white and gray matter of the MRI cerebral images, and it would be expensive to redo an MRI. The brain tumor was detected from the Oasis brain MRI database with an accuracy of 0.97. Preprocessing techniques are needed to overcome this problem and establish an accurate diagnosis of a brain tumor. Our image enhancement technique, along with the postprocessing steps, successfully segmented an accurate brain tumor. There is still room for improvement in this work, as this image enhancement technique can apply to other medical images such as breast cancer databases and ultrasound databases. We can use this image enhancement technique with some adjustment to process the grayscale image of the signal and obtain well-segmented images.

Author Contributions

Conceptualization, Y.E.A., T.A.S., A.A. (Ahmed Ali), M.I., S.R., A.A. (Ali Alqahtani), S.M.A., M.A.M.H., W.A.A., A.S.K. and A.S.S.; methodology, T.A.S., N.A.J., A.A. (Ahmed Ali), P.K. and M.U.K.; software, T.A.S., N.A.J., A.A. (Ali Alqahtani), P.K., M.U.K. and A.S.S.; validation, T.A.S., N.A.J., A.A. (Ali Alqahtani), P.K., M.I., S.R., M.U.K. and A.S.S.; formal analysis, Y.E.A., T.A.S., A.A. (Ahmed Ali), M.I., S.R., A.S.K., W.A.A., A.A. (Ali Alqahtani), S.M.A., M.A.M.H. and A.S.S.; investigation, T.A.S., N.A.J., A.A. (Ali Alqahtani), P.K., M.U.K., A.S.K. and W.A.A.; resources, S.R., T.A.S., A.A. (Ahmed Ali), M.I., A.A. (Ali Alqahtani), and S.M.A.; data curation, T.A.S., N.A.J., A.A. (Ali Alqahtani), P.K., M.U.K. and A.S.S.; writing—original draft preparation, T.A.S.; writing—review and editing, A.S.K., W.A.A., Y.E.A., T.A.S., A.A. (Ahmed Ali), M.I., S.R., A.A. (Ali Alqahtani), S.M.A. and M.A.M.H.; visualization, A.S.K., W.A.A., Y.E.A., T.A.S., A.A. (Ahmed Ali), M.I., A.A. (Ali Alqahtani), S.M.A., M.A.M.H. and A.S.S.; supervision, Y.E.A., T.A.S., A.A. (Ahmed Ali), M.I., S.R., A.A. (Ali Alqahtani), S.M.A., M.A.M.H., A.S.K., W.A.A. and A.S.S.; project administration, Y.E.A., T.A.S., A.A. (Ahmed Ali), M.I., S.R., A.A. (Ali Alqahtani), S.M.A. and M.A.M.H.; funding acquisition, Y.E.A., T.A.S., A.A. (Ahmed Ali), M.I., S.R., A.A. (Ali Alqahtani), S.M.A., A.S.K., W.A.A. and M.A.M.H. All authors have read and agreed to the published version of the manuscript.

Funding

The authors acknowledge the support from the Deanship of Scientific Research, Najran University. Kingdom of Saudi Arabia, for funding this work under the Research Groups funding program grant code number (NU/RG/SERC/11/3).

Institutional Review Board Statement

Not Applicable.

Informed Consent Statement

Not Applicable.

Data Availability Statement

The data is available and could be shared upon request.

Acknowledgments

The authors acknowledge the support from the Deanship of Scientific Research, Najran University. Kingdom of Saudi Arabia, for funding this work under the Research Groups funding program grant code number (NU/RG/SERC/11/3).

Conflicts of Interest

The authors declare no conflict of interest.

References

  1. Niemeijer, M.; Van Ginneken, B.; Cree, M.J.; Mizutani, A.; Quellec, G.; Sánchez, C.I.; Zhang, B.; Hornero, R.; Lamard, M.; Muramatsu, C. Retinopathy online challenge: Automatic detection of microaneurysms in digital color fundus photographs. IEEE Trans. Med. Imaging 2009, 29, 185–195. [Google Scholar] [CrossRef]
  2. Soomro, T.A.; Afifi, A.J.; Zheng, L.; Soomro, S.; Gao, J.; Hellwich, O.; Paul, M. Deep learning models for retinal blood vessels segmentation: A review. IEEE Access 2019, 7, 71696–71717. [Google Scholar] [CrossRef]
  3. Soomro, T.A.; Zheng, L.; Afifi, A.J.; Ali, A.; Yin, M.; Gao, J. Artificial intelligence (AI) for medical imaging to combat coronavirus disease (COVID-19): A detailed review with direction for future research. Artif. Intell. Rev. 2022, 55, 1409–1439. [Google Scholar] [CrossRef]
  4. Almalki, Y.E.; Soomro, T.A.; Irfan, M.; Alduraibi, S.K.; Ali, A. Computerized Analysis of Mammogram Images for Early Detection of Breast Cancer. Healthcare 2022, 10, 801. [Google Scholar] [CrossRef]
  5. Almalki, Y.E.; Soomro, T.A.; Irfan, M.; Alduraibi, S.K.; Ali, A. Impact of Image Enhancement Module for Analysis of Mammogram Images for Diagnostics of Breast Cancer. Sensors 2022, 22, 1868. [Google Scholar] [CrossRef]
  6. Bhutto, J.A.; Tian, L.; Du, Q.; Sun, Z.; Yu, L.; Soomro, T.A. An Improved Infrared and Visible Image Fusion Using an Adaptive Contrast Enhancement Method and Deep Learning Network with Transfer Learning. Remote Sens. 2022, 14, 939. [Google Scholar] [CrossRef]
  7. Faust, O.; Acharya, R.; Ng, E.Y.-K.; Ng, K.-H.; Suri, J.S. Algorithms for the automated detection of diabetic retinopathy using digital fundus images: A review. J. Med. Syst. 2012, 36, 145–157. [Google Scholar] [CrossRef]
  8. Soomro, T.A.; Ali, A.; Jandan, N.A.; Afifi, A.J.; Irfan, M.; Alqhtani, S.; Glowacz, A.; Alqahtani, A.; Tadeusieeicz, R.; Kantoch, E.; et al. Impact of Novel Image Preprocessing Techniques on Retinal Vessel Segmentation. Electronics 2021, 10, 2297. [Google Scholar] [CrossRef]
  9. Khan, M.A.; Soomro, T.A.; Khan, T.M.; Bailey, D.G.; Gao, J.; Mir, N. Automatic retinal vessel extraction algorithm based on contrast-sensitive schemes. In Proceedings of the 2016 International conference on image and vision computing New Zealand (IVCNZ), Palmerston North, New Zealand, 21–22 November 2016; pp. 1–5. [Google Scholar]
  10. Malaysia, P.D. Clinical Practice Guidelines (CPG) Management of Type 2 Diabetes Mellitus; Ministry of Health Malaysia, Malaysian Endocrine and Metabolic Society, Academy of Medicine: Kuala Lumpur, Malaysia, 2009; p. 1. [Google Scholar]
  11. Biswal, B.; Pooja, T.; Subrahmanyam, N.B. Robust retinal blood vessel segmentation using line detectors with multiple masks. IET Image Process. 2018, 12, 389–399. [Google Scholar] [CrossRef]
  12. Ruta, L.; Magliano, D.; Lemesurier, R.; Taylor, H.; Zimmet, P.; Shaw, J. Prevalence of diabetic retinopathy in Type 2 diabetes in developing and developed countries. Diabetic Med. 2013, 30, 387–398. [Google Scholar] [CrossRef]
  13. Soomro, T.A.; Khan, M.A.; Gao, J.; Khan, T.M.; Paul, M. Contrast normalization steps for increased sensitivity of a retinal image segmentation method. Signal Image Video Process. 2017, 11, 1509–1517. [Google Scholar] [CrossRef]
  14. Soomro, T.A.; Afifi, A.J.; Gao, J.; Hellwich, O.; Zheng, L.; Paul, M. Strided fully convolutional neural network for boosting the sensitivity of retinal blood vessels segmentation. Exp. Syst. Appl. 2019, 134, 36–52. [Google Scholar] [CrossRef]
  15. Khan, M.A.; Khan, T.M.; Soomro, T.A.; Mir, N.; Gao, J. Boosting sensitivity of a retinal vessel segmentation algorithm. Pattern Anal. App. 2019, 22, 583–599. [Google Scholar] [CrossRef]
  16. Soomro, T.A.; Afifi, A.J.; Shah, A.A.; Soomro, S.; Baloch, G.A.; Zheng, L.; Yin, M.; Gao, J. Impact of image enhancement technique on CNN model for retinal blood vessels segmentation. IEEE Access 2019, 7, 158183–158197. [Google Scholar] [CrossRef]
  17. Soomro, T.A.; Gao, J.; Khan, T.; Hani, A.F.M.; Khan, M.A.; Paul, M. Computerised approaches for the detection of diabetic retinopathy using retinal fundus images: A survey. Pattern Anal. App. 2017, 20, 927–961. [Google Scholar] [CrossRef]
  18. Westbrook, C. MRI at a Glance; John Wiley & Sons: Hoboken, NJ, USA, 2016. [Google Scholar]
  19. Land, E.H.; McCann, J.J. Lightness and retinex theory. Josa 1971, 61, 1–11. [Google Scholar] [CrossRef]
  20. Frankle, J.A.; McCann, J.J. Method and Apparatus for Lightness Imaging. U.S. Patent No. 4,384,336, 17 May 1983. [Google Scholar]
  21. Sobol, R. Improving the Retinex algorithm for rendering wide dynamic range photographs. J. Electron. Imaging 2004, 13, 65–74. [Google Scholar] [CrossRef]
  22. Hani, A.F.M.; Soomro, T.A.; Nugroho, H.; Nugroho, H.A. Enhancement of colour fundus image and FFA image using RETICA. In Proceedings of the 2012 IEEE—EMBS Conference on Biomedical Engineering and Sciences, Langkawi, Malaysia, 17–19 December 2012; pp. 831–836. [Google Scholar]
  23. Lee, J.-S. Digital image enhancement and noise filtering by use of local statistics. IEEE Trans. Pattern Anal. Mach. Int. 1980, 2, 165–168. [Google Scholar] [CrossRef]
  24. Soomro, T.A.; Zheng, L.; Afifi, A.J.; Ali, A.; Soomro, S.; Yin, M.; Gao, J. Image Segmentation for MR Brain Tumor Detection Using Machine Learning: A Review. IEEE Rev. Biomed. Eng. 2022, 1–21. [Google Scholar] [CrossRef]
  25. Odstrcilik, J.; Kolar, R.; Budai, A.; Hornegger, J.; Jan, J.; Gazarek, J.; Kubena, T.; Cernosek, P.; Svoboda, O.; Angelopoulou, E. Retinal vessel segmentation by improved matched filtering: Evaluation on a new high-resolution fundus image database. IET Image Process. 1980, 7, 373–383. [Google Scholar] [CrossRef]
  26. Marcus, D.S.; Wang, T.H.; Parker, J.; Csernansky, J.G.; Morris, J.C.; Buckner, R.L. Open Access Series of Imaging Studies (OASIS): Cross-sectional MRI data in young, middle aged, nondemented, and demented older adults. J. Cogn. Neurosci. 2007, 19, 1498–1507. [Google Scholar] [CrossRef]
  27. Pfitzner, B.; Steckhan, N.; Arnrich, B. Federated Learning in a Medical Context: A Systematic Literature Review. ACM Trans. Internet Technol. (TOIT) 2021, 21, 1–31. [Google Scholar] [CrossRef]
  28. Lu, J.; Gong, P.; Ye, J.; Zhang, C. Learning from very few samples: A survey. arXiv 2020, arXiv:2009.02653. [Google Scholar]
  29. Soomro, T.A.; Gao, J.; Khan, M.A.U.; Khan, T.M.; Paul, M. Role of Image Contrast Enhancement Technique for Ophthalmologist as Diagnostic Tool for Diabetic Retinopathy. In Proceedings of the International Conference on Digital Image Computing: Techniques and Applications (DICTA), Gold Coast, Australia, 30 November–2 December 2016; Volume 2016, pp. 1–8. [Google Scholar]
  30. Atta, R.; Ghanbar, M. Low-contrast satellite image enhancement using discrete cosine transform pyramid and singular value decomposition. IET Image Process. 2013, 1, 1–12. [Google Scholar] [CrossRef]
  31. Polesel, A.; Ramponi, G.; Mathews, V.J. Adaptive unsharp masking for contrast enhancement. IEEE Int. Proc. Image Process 1997, 1, 267–270. [Google Scholar]
  32. Yang, Y.B.; Shang, H.B.; Jia, G.C.; Huang, L.Q. Adaptive unsharp masking method based on region segmentation. Opt. Precis. Eng. 2003, 11, 188–192. [Google Scholar]
  33. Chaudhuri, S.; Chatterjee, S.; Katz, N.; Nelson, M.; Goldbaum, M. Detection of blood vessels in retinal images using two-dimensional matched filters. IEEE Trans. Med. Imaging 1989, 8, 263–269. [Google Scholar] [CrossRef]
  34. Hoover, A.D.; Kouznetsova, V.; Goldbaum, M. Locating blood vessels in retinal images by piecewise threshold probing of a matched filter response. IEEE Trans. Med. Imaging 2000, 19, 203–210. [Google Scholar] [CrossRef]
  35. Jiang, X.; Mojon, D. Adaptive local thresholding by verification-based multithreshold probing with application to vessel detection in retinal images. IEEE Trans. Pattern Anal. Mach. Intell. 2003, 25, 131–137. [Google Scholar] [CrossRef]
  36. Mallat, S. A theory for multi-resolution signal decomposition: The wavelet representation. IEEE Trans. Pattern Anal. Mach. Intell. 1989, 11, 674–689. [Google Scholar] [CrossRef]
  37. Laine, A.F.; Song, S. Multiscale wavelet representations for mammographic feature analysis. In Proceedings of the SPIE Conference on Mathematical Methods in Medical Image, San Diego, CA, USA, 23–24 July 1992; Volume 1768, pp. 306–316. [Google Scholar]
  38. Laine, A.F.; Schuler, S.; Fan, J.; Huda, W. Mammographic feature enhancement by multiscale analysis. IEEE Trans. Med. Imaging 1994, 13, 725–740. [Google Scholar] [CrossRef] [PubMed]
  39. Fu, J.C.; Chai, J.W.; Wong, S.T. Wavelet-based enhancement for detection of left ventricular myocardial boundaries in magnetic resonance images. Magn. Reson. Imaging 2000, 18, 1135–1141. [Google Scholar] [CrossRef]
  40. Fu, J.C.; Lien, H.; Wong, S.T.C. Wavelet-based histogram equalization enhancement of gastric sonogram images. Comput. Med. Imaging Graph. 2000, 24, 59–68. [Google Scholar] [CrossRef]
  41. Fu, Q.; Jung, C.; Xu, K. Retinex-Based Perceptual Contrast Enhancement in Images Using Luminance Adaptation. IEEE Access 2018, 6, 61277–61286. [Google Scholar] [CrossRef]
  42. Liu, S.; Long, W.; He, L.; Li, Y.; Ding, W. Retinex-Based Fast Algorithm for Low-Light Image Enhancement. Entropy 2021, 23, 746. [Google Scholar] [CrossRef]
  43. Pan, X.; Li, C.; Pan, Z.; Yan, J.; Tang, S.; Yin, X. Low-Light Image Enhancement Method Based on Retinex Theory by Improving Illumination Map. Appl. Sci. 2022, 12, 5257. [Google Scholar] [CrossRef]
  44. LaMontagne, P.J.; Benzinger, T.L.; Morris, J.C.; Keefe, S.; Hornbeck, R.; Xiong, C.; Grant, E.; Hassenstab, J.; Moulder, K.; Vlassenko, A.G.; et al. OASIS-3: Longitudinal Neuroimaging, Clinical, and Cognitive Dataset for Normal Aging and Alzheimer Disease. medRxiv 2019. [Google Scholar] [CrossRef]
  45. Budai, A.; Hornegger, J.; Michelson, G. Multiscale Approach for Blood Vessel Segmentation on Retinal Fundus Images. Investig. Ophthalmol. Vis. Sci. 2009, 50, 325. [Google Scholar]
  46. Staal, J.; Abràmoff, M.D.; Niemeijer, M.; Viergever, M.A.; Van Ginneken, B. Ridge based vessel segmentation in color images of the retina. IEEE Trans. Med. Imaging 2004, 23, 501–509. [Google Scholar] [CrossRef]
Figure 1. Proposed Approach for Brain MRI and Retinal Fundus Images. (a) shows the proposed approach for the brain MRI. (b) shows the proposed approach for the retinal fundus images.
Applsci 12 08243 g001
Figure 2. The Multiresolution Image Pyramid Process.
Applsci 12 08243 g002
Figure 3. Contrast Determination of Retinal Fundus Images and MRI Brain Images. The left hand image shows the retinal fundus image contrast calculation, and the right hand image represents the MR brain image contrast calculation.
Applsci 12 08243 g003
Figure 4. (a) Low Quality Green Band Image from the HRF Retinal Image Database. (b) High Quality Green Band Image from the HRF Retinal Image Database.
Applsci 12 08243 g004
Figure 5. (a) Output of McCann Retinex Algorithm of each Iteration from 1 to 20 on Low Quality Images. (b) Output of McCann Retinex Algorithm of each Iteration from 1 to 20 on High Quality Images.
Applsci 12 08243 g005
Figure 6. Performance Analysis of Low and High Quality Images from the HRF Image Database from Iteration 1 to 20. (a) PSNR of low quality retinal images. (b) PSNR improvement of low quality retinal images. (c) Contrast of low quality retinal images. (d) PSNR of high quality retinal images. (e) PSNR improvement of low quality retinal images. (f) Contrast of low quality retinal images.
Applsci 12 08243 g006
Figure 7. Output of Oasis Database Images from Iteration 1 to 20.
Applsci 12 08243 g007
Figure 8. Performance Analysis of the Oasis Brain MRI Database from Iteration 1 to 20. (a) PSNR of axial plane images. (b) PSNR Improvement of axial view images. (c) Contrast of axial plane images. (d) PSNR of coronal plane images. (e) PSNR Improvement of coronal plane images. (f) Contrast of coronal plane images. (g) PSNR of sagittal plane images. (h) PSNR Improvement of sagittal plane images. (i) Contrast of sagittal plane images.
Applsci 12 08243 g008
Figure 9. Overall Performance Analysis. (a) Overall performance analysis of Oasis image database. (b) Overall performance analysis of HRF retinal image database.
Applsci 12 08243 g009
Figure 10. Impact of the Proposed Enhancement Method on the Segmentation Process: Application of Retinal Blood Vessels and Brain Tumor Segmentation.
Applsci 12 08243 g010
Figure 11. Impact of the Proposed Enhancement Method on the Segmentation of Retinal Blood Vessels. The first column represents the color retinal fundus images, the second column represents the ground truth images, and the third column represents the segmented tumor image.
Applsci 12 08243 g011
Figure 12. Impact of the Proposed Enhancement Method on Brain Tumor Segmentation. The first column represents the MR brain image, the second column represents the ground truth image, and the third column represents the segmented tumor image.
Applsci 12 08243 g012
Table 1. Performance of the Proposed Method on the Databases Based on Category.
HECLAHEBBHEProposed Method
Database: Images TypesPSNRContrastPSNRContrastPSNRContrastPSNRContrast
HRF Database: Low Quality Images30.1218.1732.7621.3429.8917.8339.5826.46
HRF Database: High Quality Images32.8321.5634.1224.5631.0720.9841.6944.61
Oasis Database: Coronal Plane Images19.1239.3021.2240.9820.0138.1223.7363.39
Oasis Database: Sagittal Plane Images20.3427.2120.9729.0119.9428.9824.5541.02
Oasis Database: Axial Plane Images18.9541.0122.0142.9721.0542.0223.4669.79
Publisher’s Note: MDPI stays neutral with regard to jurisdictional claims in published maps and institutional affiliations.

