
Contact Fatigue State Identification of Specimen Based on Heterogeneous Data and Evidence Theory
College of Mechanical Engineering, Chongqing University of Technology, Chongqing 400054, China
*
Author to whom correspondence should be addressed.
Appl. Sci. 2022, 12(17), 8509; https://0-doi-org.brum.beds.ac.uk/10.3390/app12178509
Submission received: 8 July 2022
/
Revised: 15 August 2022
/
Accepted: 23 August 2022
/
Published: 25 August 2022
(This article belongs to the Special Issue Intelligent Renewable Energy System: A Focus on Hydrogen Fuel Cells and Battery Storage with AI)
Abstract
:In order to accurately realize the contact fatigue state identification of specimen, a new method based on vibration and image heterogeneous data, as well as on D-S evidence theory, is proposed. Firstly, combined with the bearing public data set from CWRU, the vibration signal imaging methods such as SDP, GAF and GRI, as well as neural network models such as VGG16, ResNet and S-T, were compared and analyzed. It is determined that the SDP method is used to visualize the vibration signal, and the two state identification evidence bodies based on the vibration information source are obtained through the VGG16 and ResNet models. Secondly, combined with image monitoring signals, the fatigue defect identification method based on automatic weighting threshold and the detection error dynamic compensation method based on fatigue defect edge features are used to quantify the fatigue damage area and obtain the state identification evidence body based on the image information source. On this basis, a state identification network model based on vibration and image spatiotemporal heterogeneous data is constructed, and the D-S evidence theory is used to realize the contact fatigue state identification of the specimen. The results show that fusion of vibration and image data can achieve information complementarity and may identify the contact fatigue state of the specimen more accurately. The accuracy of state identification after fusion is 98.67%, which is at least 3% higher than that of a single information source. This research is of great significance for the accurate acquisition of material contact fatigue properties and has certain reference value for the heterogeneous data fusion from different sources.
1. Introduction
Contact fatigue is mainly due to damage caused by cyclic loading below the contact surface, until it extends to the surface to form pitting or spalling. The failure process is essentially the initiation and propagation of cracks [1,2]. A large number of engineering practices have proved that contact fatigue is the main reason for the failure of basic components such as bearings and gears [3]. At present, the main way to obtain the contact fatigue properties of materials is through rolling contact fatigue tests. Therefore, it is very important to accurately evaluate the contact fatigue state of the specimen during the test for the accurate acquisition of the material contact fatigue properties.
At present, there are two methods to realize the online state identification of the specimen contact fatigue state. (1) It can be directly identified according to the damage area of the specimen. For example, L. Solazzi et al. [4] applied machine vision technology to the rolling contact fatigue test bench for the first time. Although the study used a line scan camera to obtain the surface image of the specimen and observed the evolution of fatigue damage, it was still only based on the traditional vibration analysis to determine the fatigue failure. I. Bodini et al. [5] used an area scan camera to obtain surface images of rolling contact fatigue specimen and compared the surface roughness of the specimen under different rotational speeds to determine whether they failed. However, the image stitching effect is not ideal, which directly affects the observation of the surface morphology of the specimen. Moreover, only the experiments under dry friction conditions were carried out, and the influence of lubricating medium on image acquisition under actual operating conditions was not considered. Until now, most of the existing testing machines cannot obtain online images of the contact surface of the specimen, let alone quantify the damaged area and track the damage evolution process. Therefore, our team independently developed a rolling contact fatigue test equipment based on machine vision technology, which solved this problem [6]. However, during the test, it was found that the change of the test environment had a great influence on the acquisition of fatigue damage images, especially in the later stage of the test. The oil blocking effect of the oil blocking device is poor, or the lens is splashed with oil stains, which will cause the image to become black, thus affecting the accurate acquisition of the fatigue damage area. It can be indirectly identified according to the vibration signal, which is the most widely used method now. For example, Manoj et al. [7] designed a three-roll rolling contact fatigue testing machine, which realizes fault diagnosis through the vibration and sound signals generated by the contact of the rolls. The time-domain characteristics of the vibration signal reflect the overall fatigue characteristics of the specimen, while the frequency analysis identifies the contact fatigue state of the specimen through Fast Fourier Transform (FFT). However, the superposition complexity of multiple high peaks in the vibration signal makes it difficult to identify the critical features of the specimen under different fatigue states. Solazzi et al. [4] proposed a hybrid vibration signal analysis method, which uses FFT, Power Spectral Density (PSD) and waterfall methods to analyze vibration signals and evaluates the fatigue state of the specimen through windowed root mean square of digital weighting filters. However, the vibration signal features extracted by the windowed root mean square method are not sufficient, and may even lose important features, which requires the combination of time-frequency analysis methods [8,9]. On the other hand, the segmentation of vibration signal levels lacks robustness to occasional noise impulses and non-stationary random disturbances.
In recent years, the development of artificial intelligence technology has provided a new way for state recognition, which can be realized through multi-source information fusion. According to the different fusion levels, information fusion technology can be divided into data-level fusion, feature-level fusion and decision-level fusion. Su et al. [10] achieved bearing fault diagnosis by correlating multiple acoustic emission sensor signals and then performing data-level fusion. Duan et al. [11] used Variational Mode Decomposition (VMD) and Hilbert Transform (HT) methods to process the vibration signal into a time-frequency image, and through data-level fusion with the infrared image of the same dimension, the accurate diagnosis of the rotor system failure is realized. Liu et al. [12] constructed a deep learning model for dynamic feature-level fusion of speech and facial images, and realized the recognition of depression tendency with an accuracy rate of 71%. Ma et al. [13] used a combination of feature-level and decision-level fusion to realize the diagnosis of bearing fault types, where the cross-diagnosis of various eigenvectors was performed at the feature level, and the evidence theory method was used for fusion diagnosis at the decision level. Kächele et al. [14] achieved the classification of depression by performing decision-level fusion of models trained from speech features and video features. Yang [15] realized depression recognition through decision-level fusion of speech, facial images and text with an accuracy rate of 86.73%.
In view of the shortcomings of the existing method in contact fatigue state identification of the specimen, such as the problems of unstable image quality and influenced by the test environment in visual detection, as well as the difficulties of identifying critical features and poor robustness in vibration detection, combined with the powerful advantages of artificial intelligence technology in pattern recognition, it is proposed to integrate two heterogeneous data, vibration and image, to realize the contact fatigue state identification of the specimen. Relying on the vibration signals and monitoring images obtained by the rolling contact fatigue test equipment independently developed by the team, and comprehensively using theories and methods such as multi-source information fusion, pattern recognition and deep learning, a state recognition network model based on vibration and image spatiotemporal heterogeneous data is constructed to realize the contact fatigue state identification of the specimen accurately.
2. Methodology
2.1. Vibration Signal Visualization Method
At present, the methods of converting vibration signals into images mainly include the Symmetry Dot Pattern (SDP) method, Gramian Angular Field (GAF) method and Grayscale image (GRI) method [16,17,18,19]. The following uses the bearing public data set from Case Western Reserve University (CWRU) to verify the validity of the above three vibration signal imaging methods applied to state recognition, and to determine the method used in this paper.
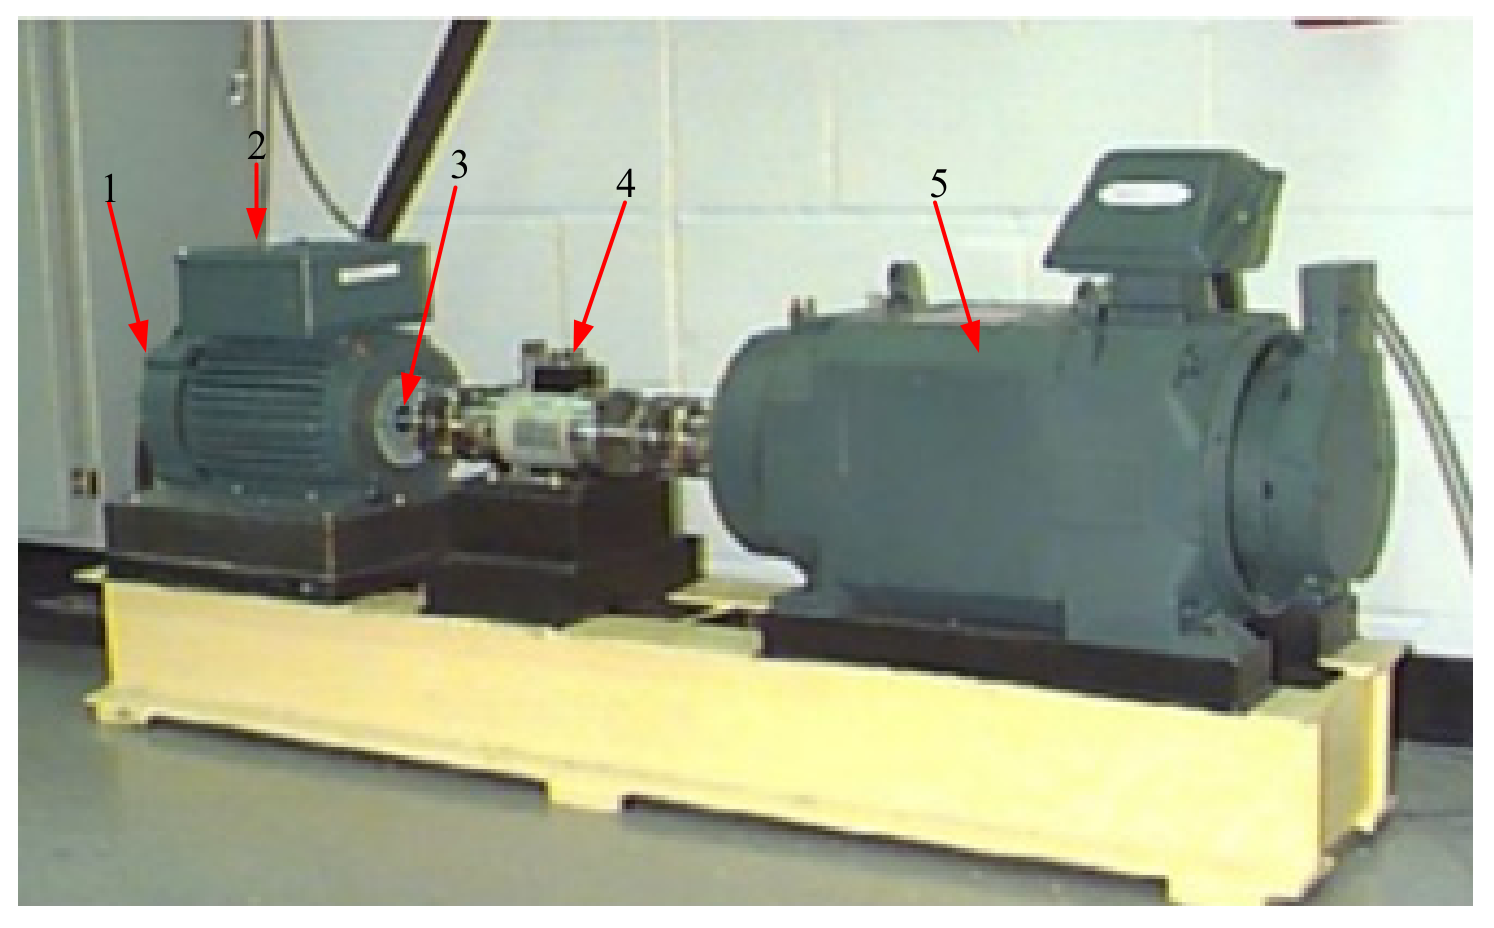
The rolling bearing test bench of CWRU is shown in Figure 1, which is mainly composed of motor, torque sensor, power tester and electronic controller. During the test, the motor speed is 1720 r/min~1797 r/min, and the test bearing is SKF bearing with single-point damage by Electrical Discharge Machining (EDM) [20]. The data set includes four categories, namely, normal state, inner ring damage, outer ring damage and rolling element damage. The diameters of each type of damage are 0.007″ (0.1778 mm), 0.014″ (0.3556 mm) and 0.021″ (0.5334 mm) [20]. The acceleration sensor is used to collect vibration signals, and the sampling frequency is 12 kHz. In this paper, three types data of drive end rollers with a rotating speed of 1730 r/min, normal and damaged diameters of 0.3556 mm and 0.5334 mm are selected to verify the effectiveness of the vibration signal visualization method in state identification, as shown in Table 1. In each type of state data, 1024 data points are a group, and each type of state data has 1500 groups.
In order to visually compare the image transformation effects of SDP method, GAF method and GRI method, the transformed images of vibration signals in different time periods for the same type of damage in the CWRU bearing public data set are shown in Table 2. It should be noted that, in this paper, a set of sample data corresponds to generate an SDP image. The specific steps are as follows: ① Preprocess the vibration data and convert it to the range of 0–255; ② Set the conversion parameters to convert the vibration signal to 224 × 224 SDP image. The initial angle = 120°, time interval parameter l = 5 and the magnification factor = 30° were chosen [22], while the deflection angle was set to 120° in order to form a trilateral centrosymmetric pattern and to avoid interference phenomena in the information between adjacent images.
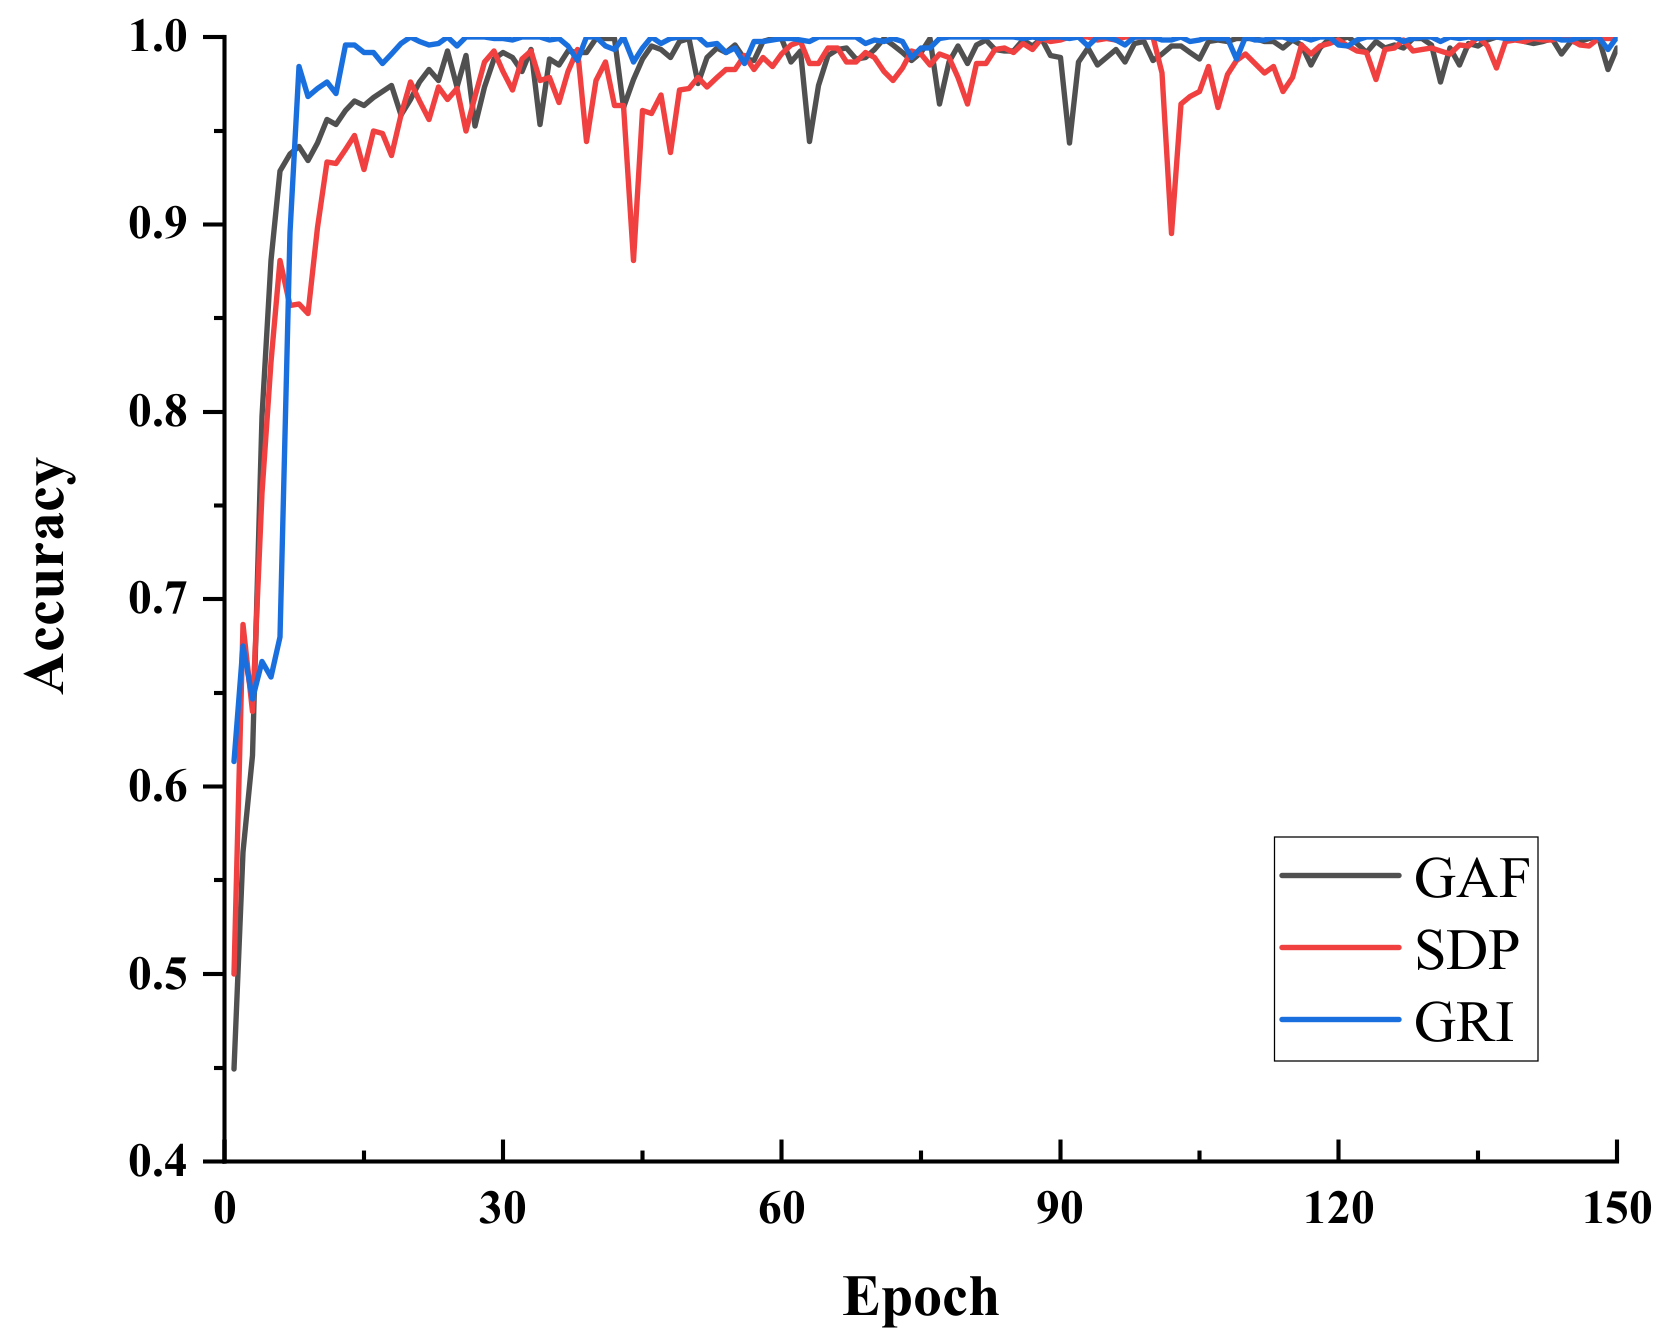
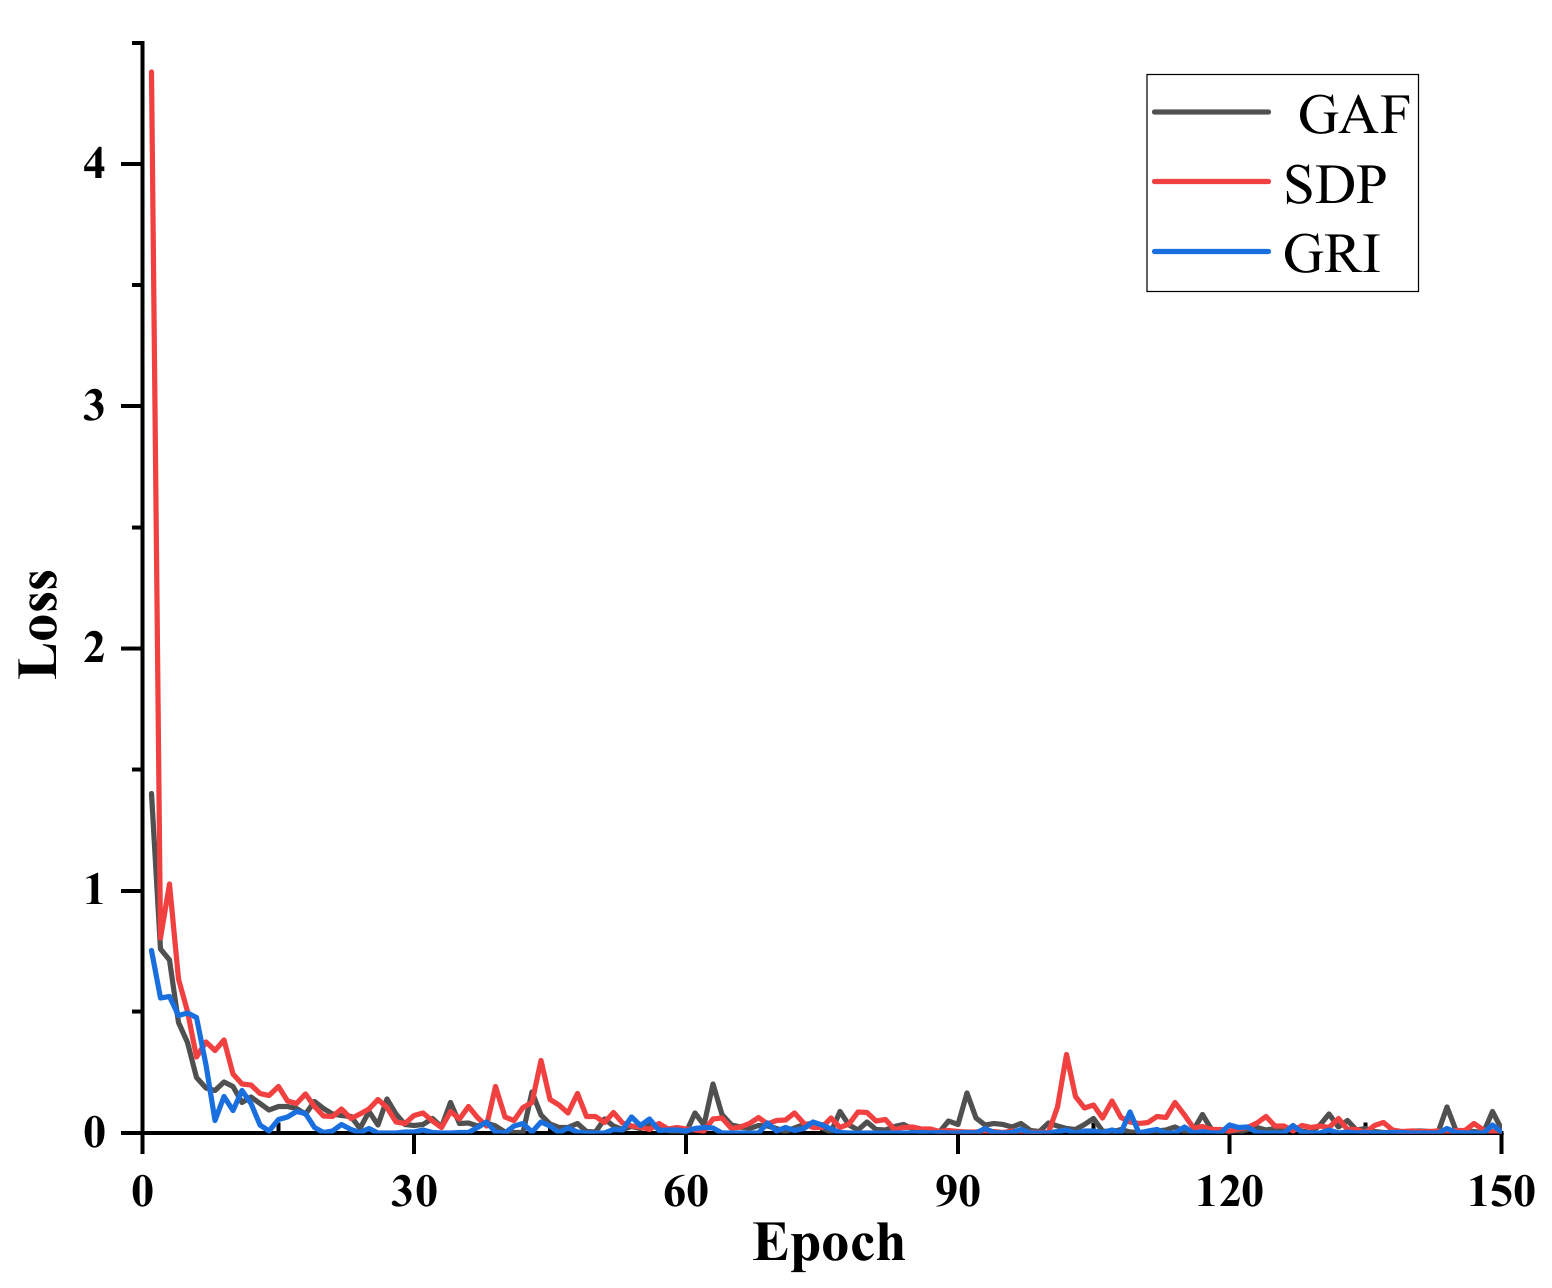
In order to get the verification results quickly and conveniently, this paper uses the VGG16 model. The bearing data set is randomly divided into training set and test set according to the ratio of 4:1, and the VGG16 model is trained by using the vibration images of the training set, where the training parameter settings are shown in Table 3. After 150 epochs of training, the accuracy and loss of the training set model are shown in Figure 2 and Figure 3, respectively, from which it can be determined that the model training has converged.
The test set data of the three states are input into the respective trained VGG16 evaluation models for bearing state identification. The obtained bearing state identification results are shown in Table 4. It can be seen that the accuracy rates of three vibration image conversion methods applied to bearing state identification are all above 99%, which shows that the method proposed in this paper to convert the vibration signal into an image and apply it to the state identification is effective. There is no significant difference between the three methods in terms of the bearing public datasets targeted.
Qualitatively analyzed, the SDP method converts one-dimensional signal data into a two-dimensional polar coordinate system, and intuitively represents the characteristics of the signal in the form of images, showing a perceptual ability to associate local information with the global [23]. At the same time, in terms of image features, SDP transformed images are simpler and more prominent than GAF images and grayscale images, which is beneficial for subsequent neural network-based state recognition. In addition, in terms of the feature fluctuation in the same state, by analyzing a large number of transformed images in Table 2, it is found that the GAF image has the largest fluctuation, followed by the grayscale image, while the SDP transformed image has the smallest fluctuation. This indicates the state feature of the SDP transformed image is the most stable. Therefore, subsequent state recognition converts the vibration signal into an SDP image.
2.2. Neural Network Model
Neural network models mainly include Convolutional Neural Network (CNN), Recurrent Neural Network (RNN), Auto-Encoder (AE), Generative Adversarial Network (GAN), Graph Neural Network (GNN), Transformer, etc. [24]. The CNN model has the advantages of simple structure, easy reproduction and good effect in the field of target classification, while the Transformer model has powerful global modeling capabilities, breaking through the limitations of the RNN model that cannot be parallelized, and self-attention can produce a more interpretable model. Therefore, the initial consideration is to choose the CNN model and the Transformer model.
Commonly used CNN models mainly include VGGNet, ResNet and AlexNet [25]. In comparison, the input image of VGG16 model [26] passes through successively stacked convolutional layers and pooling layers to obtain the main feature information in the image and compress it, and finally pass the fully connected layer and the output layer to the learned image. The information is integrated and classified, which has outstanding characteristics such as parameter unification and simple model. The ResNet model [27] activates the input of the unit directly with the output of the unit, so that the features can be directly propagated from any shallow layer to the deep layer, so as to realize the identity mapping. That is to say, ResNet model realizes the skip layer connection by introducing the residual block, and the original input is directly connected with the output through the skip connection, which can largely avoid the loss of information and reduce the difficulty of learning. Hence, this paper chooses the VGG16 model and the ResNet model.
Combined with the SDP images transformed from the aforementioned CWRU bearing public data set, the effects of different neural network models applied to state recognition are compared, and the model used in this paper is determined.
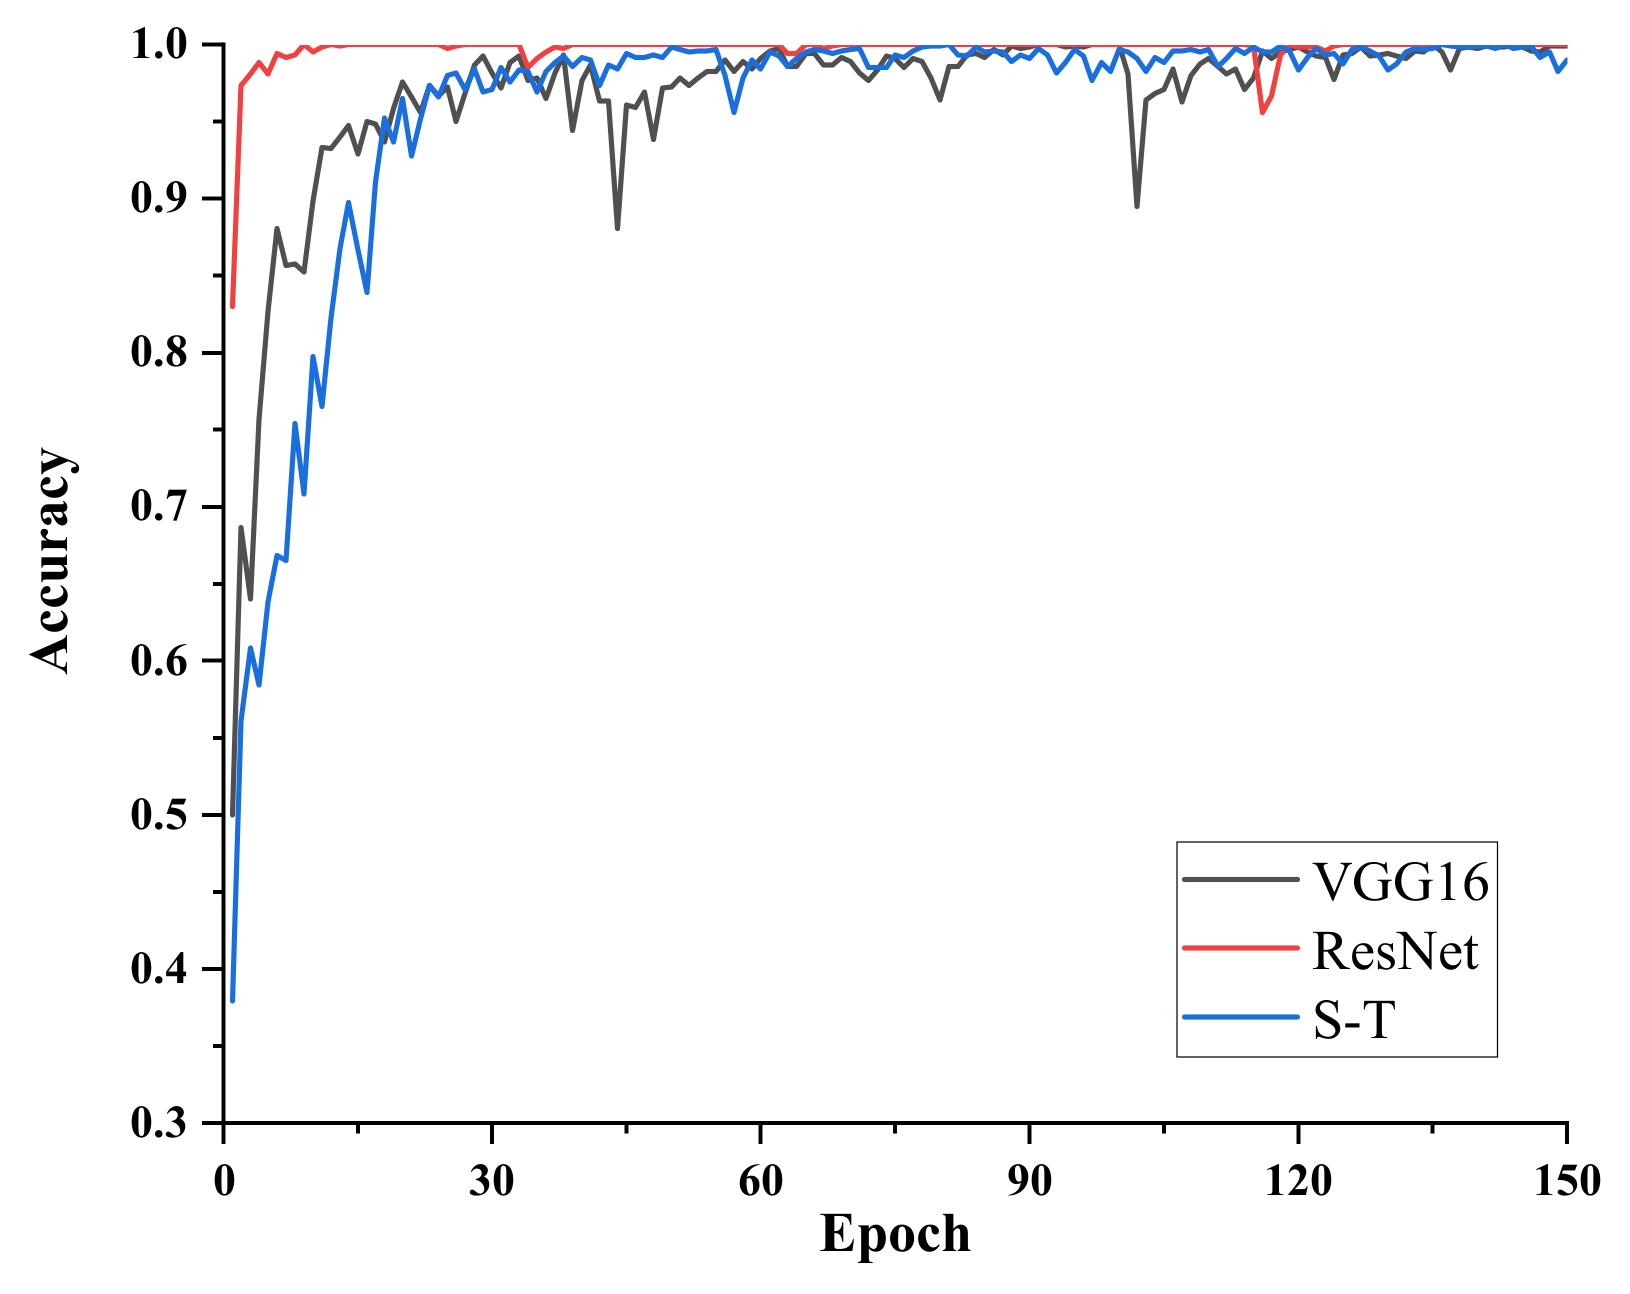
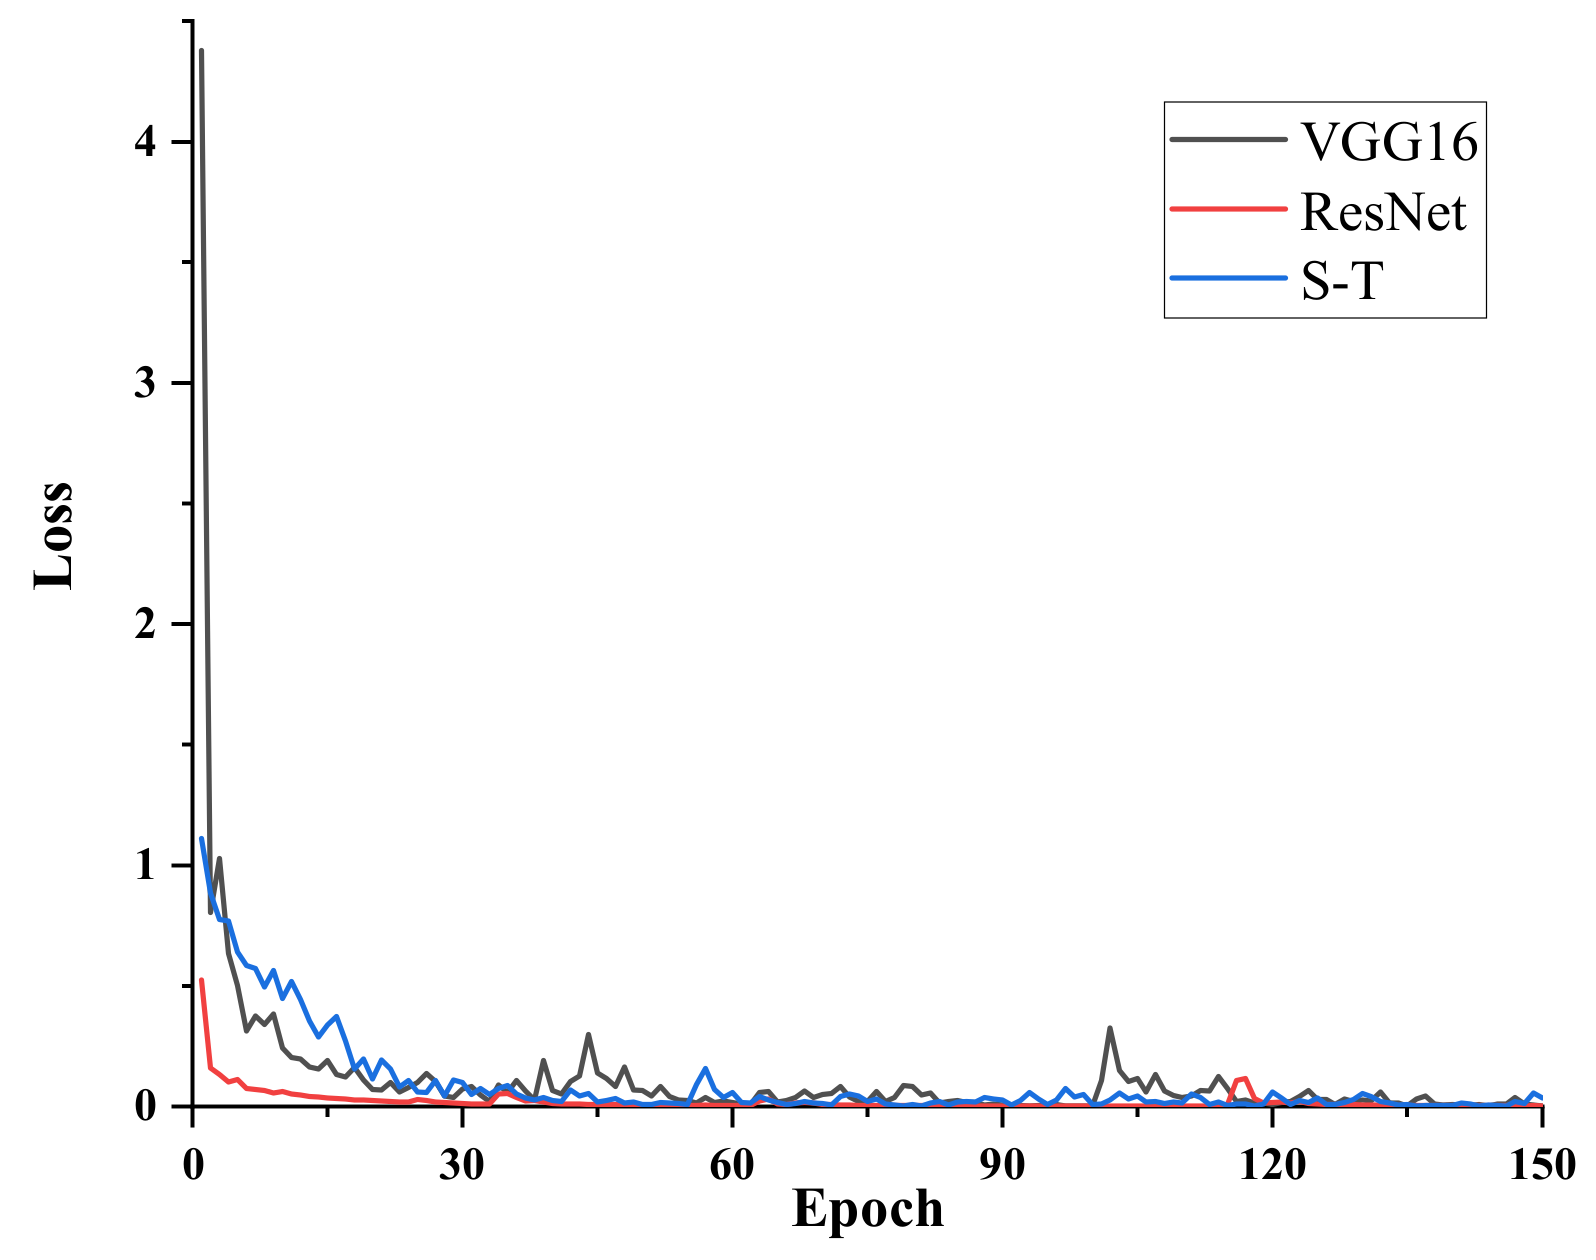
Similarly, the bearing data set is randomly divided into training set and test set according to the ratio of 4:1, and three models of VGG16, ResNet and S-T are trained respectively by using the vibration images of the training set. The training parameter settings are shown in Table 5. After 150 epochs of training, the accuracy and loss of the training set model are shown in Figure 4 and Figure 5, respectively, from which it can be determined that the model training converges.
The test set SDP images of three states are input into the respective trained models for bearing state recognition. The obtained bearing state recognition results are shown in Table 6. It can be seen that the accuracy rates of three models of VGG16, ResNet and S-T are all 100% in bearing state identification based on the SDP transformed image dataset, and there is no difference.
According to Figure 4 and Figure 5, in the process of bearing state identification, ResNet model has the fastest convergence and the most stable convergence process, while S-T model and VGG16 model have little difference in the convergence process. However, the S-T model has a more complex structure and is more sensitive to network parameter settings. For example, in the case of a common learning rate of 0.001, the S-T model fails to converge, and the learning rate needs to be set to 0.0003. Therefore, the subsequent state recognition selects VGG16 model and ResNet model.
2.3. D-S Evidence Theory
At present, the fusion theories mainly include D-S evidence theory, Bayesian theory, fuzzy set theory, rough set, etc. In comparison, D-S evidence theory can deal with the uncertainty caused by ignorance and can well characterize the uncertainty information [28]. Therefore, this paper chooses D-S evidence theory to perform decision-level fusion of state identification results from a single information source of vibration or image.
The basic principle of D-S evidence theory is as follows [29]. Let represent a complete set of possible values of object to be recognized, and all elements of are incompatible with each other, then is called the recognition frame of .The function is said to be basic probability assignment of to when the following condition (1) is satisfied.
Assuming that is the k evidence bodies on the same identification frame, and is assigned to its corresponding basic probability, then Dempster composition rules are as follows:
The joint basis probability assignment for any subset , is defined as:
where K is the conflict factor, which reflects the degree of evidence conflict.
3. Contact Fatigue State Identification
3.1. Introduction of Rolling Contact Fatigue Test Equipment
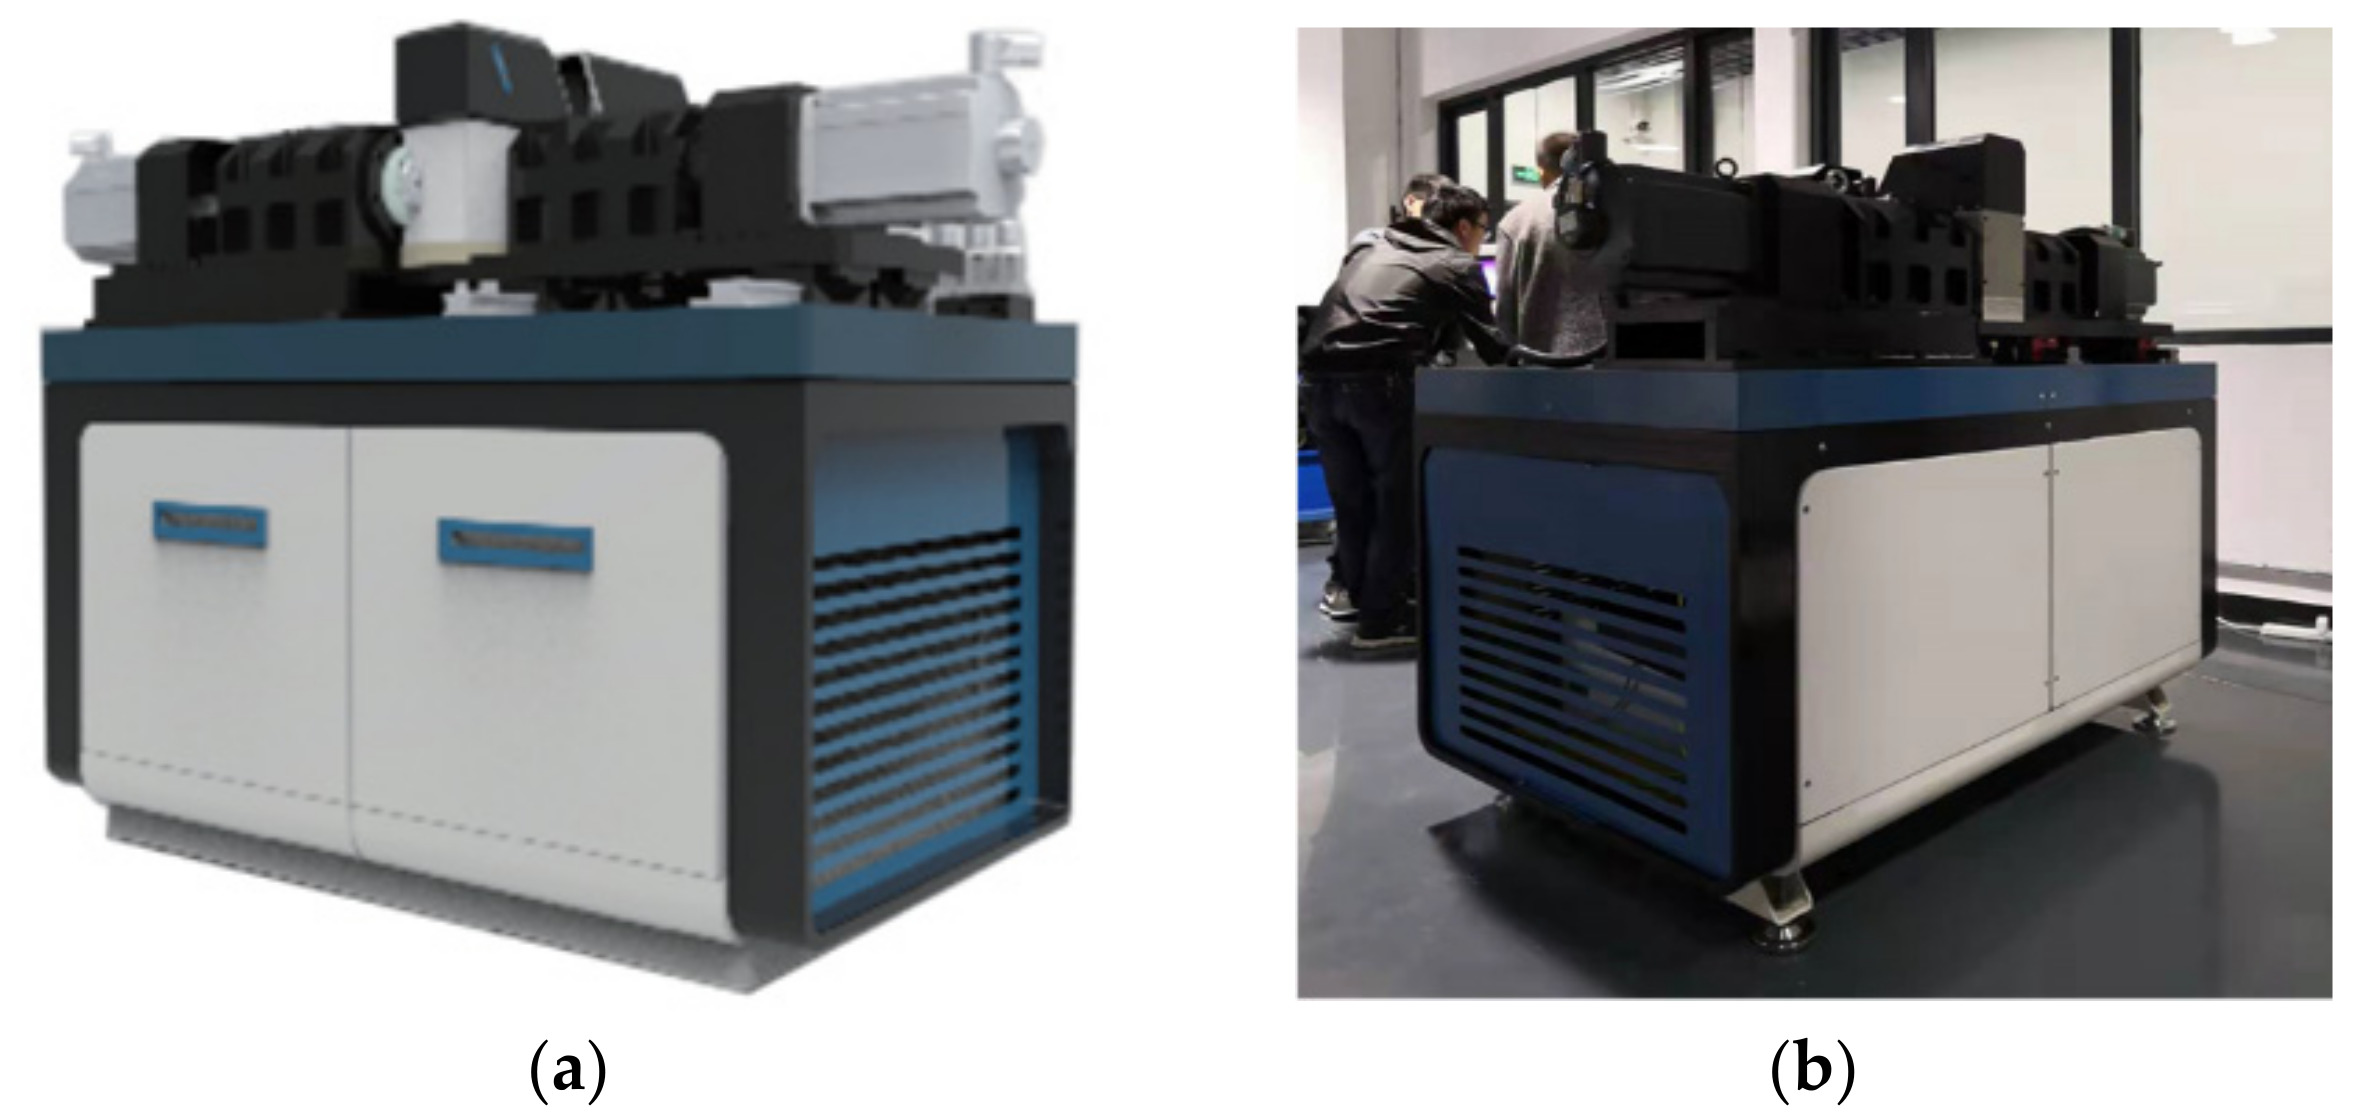
According to “Rolling Contact Fatigue Test Method for Metal Materials” (YB/T 5345.2014) [30], the contact fatigue properties of materials are obtained by testing on a rolling contact fatigue testing machine. Our team successfully developed a rolling contact fatigue testing machine, as shown in Figure 6, which is mainly composed of the mechanical system, electrical system, vision system, measurement and control software system and lubrication system. It can monitor the running state of the specimen in real time and solved the problems of similar test technologies, such as discontinuous data collection, untraceable damage evolution and difficulty in accurately obtaining fatigue strength.
During the test, various sensors were installed to realize the measurement and control of key parameters such as vibration, load, oil temperature, rotational speed and torque. At the same time, an image acquisition system with independent intellectual property rights has been developed, which realizes real-time acquisition and quantitative analysis of damage images.
3.2. Rolling Contact Fatigue Test
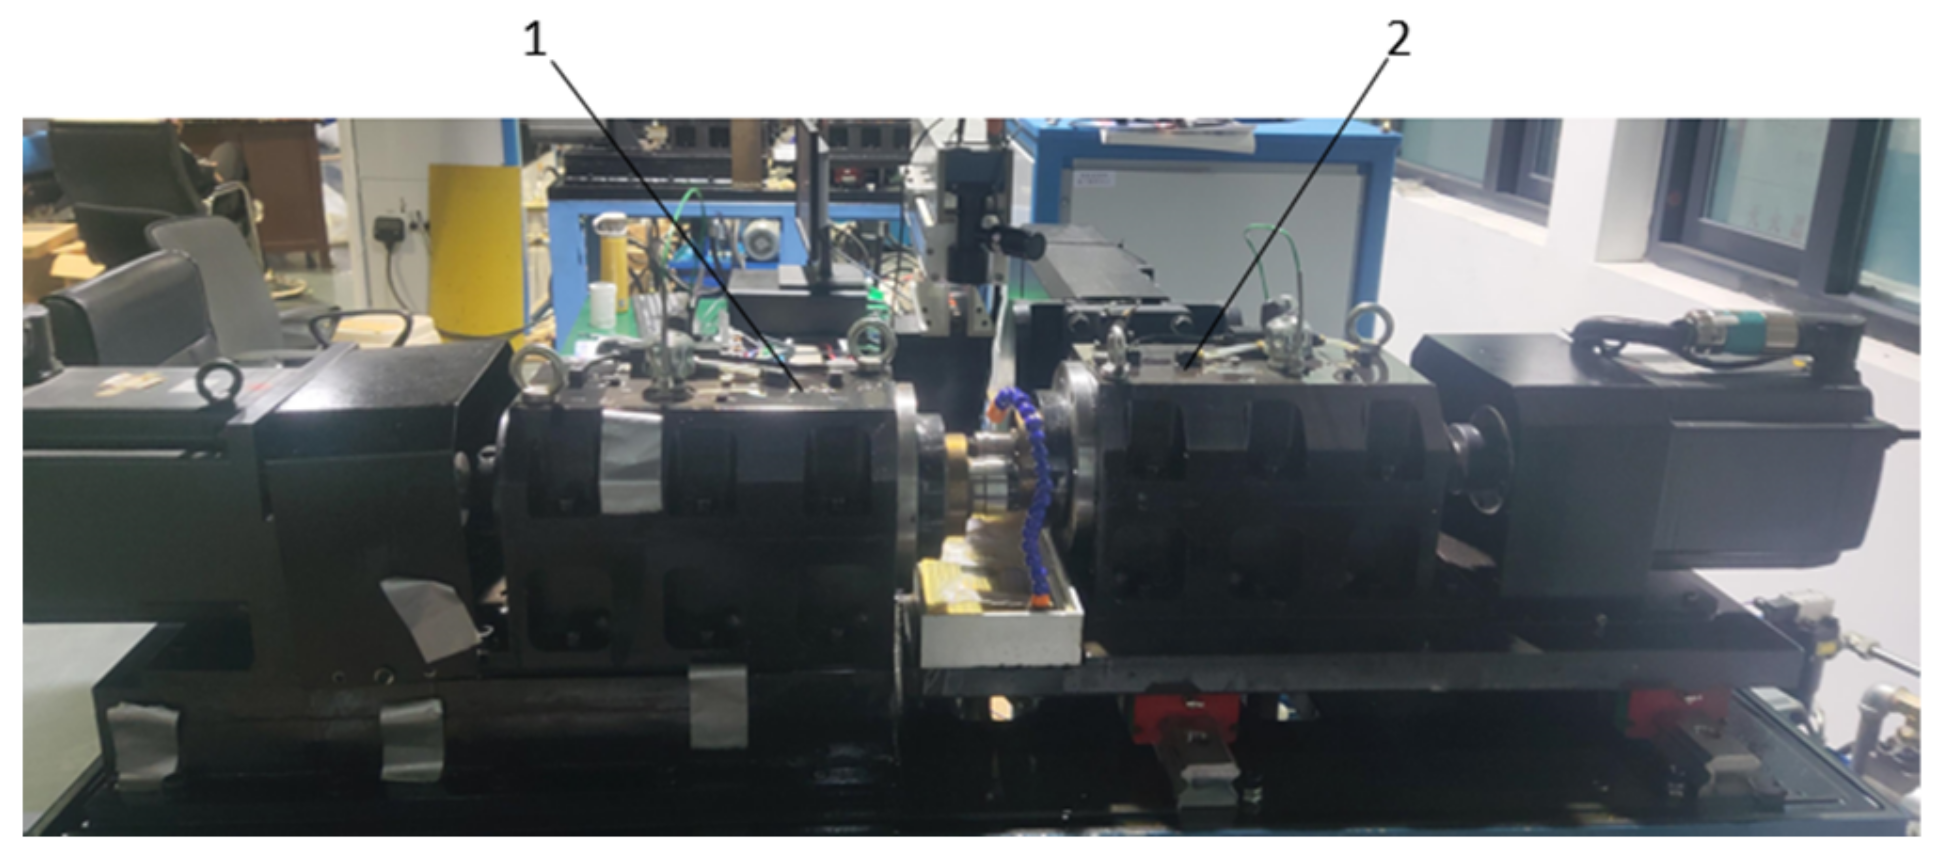
The test was carried out on the RCF-A type testing machine, as shown in Figure 7. The specimen and the accompanying specimen are processed according to the YB/T 5345.2014 test standard, the material is 40Cr, and the quenching and tempering process is used. During the test, set the rotational speed of the main shaft (specimen) to 1000 r/min, the rotational speed of the accompanying shaft (accompanying specimen) to 1100 r/min, the slip rate to be 10%, and the radial load to be 2071 N. The 1A307E accelerometer is installed on the headstock box by magnetic attraction, and the EM9118B-6/ICP data acquisition card is used to collect vibration signals. The image acquisition system selected LINEA series line scan cameras from Canada DALSA company and MLM-3XMP lens from Japan COMPUTAR company to acquire the contact surface image of the specimen.
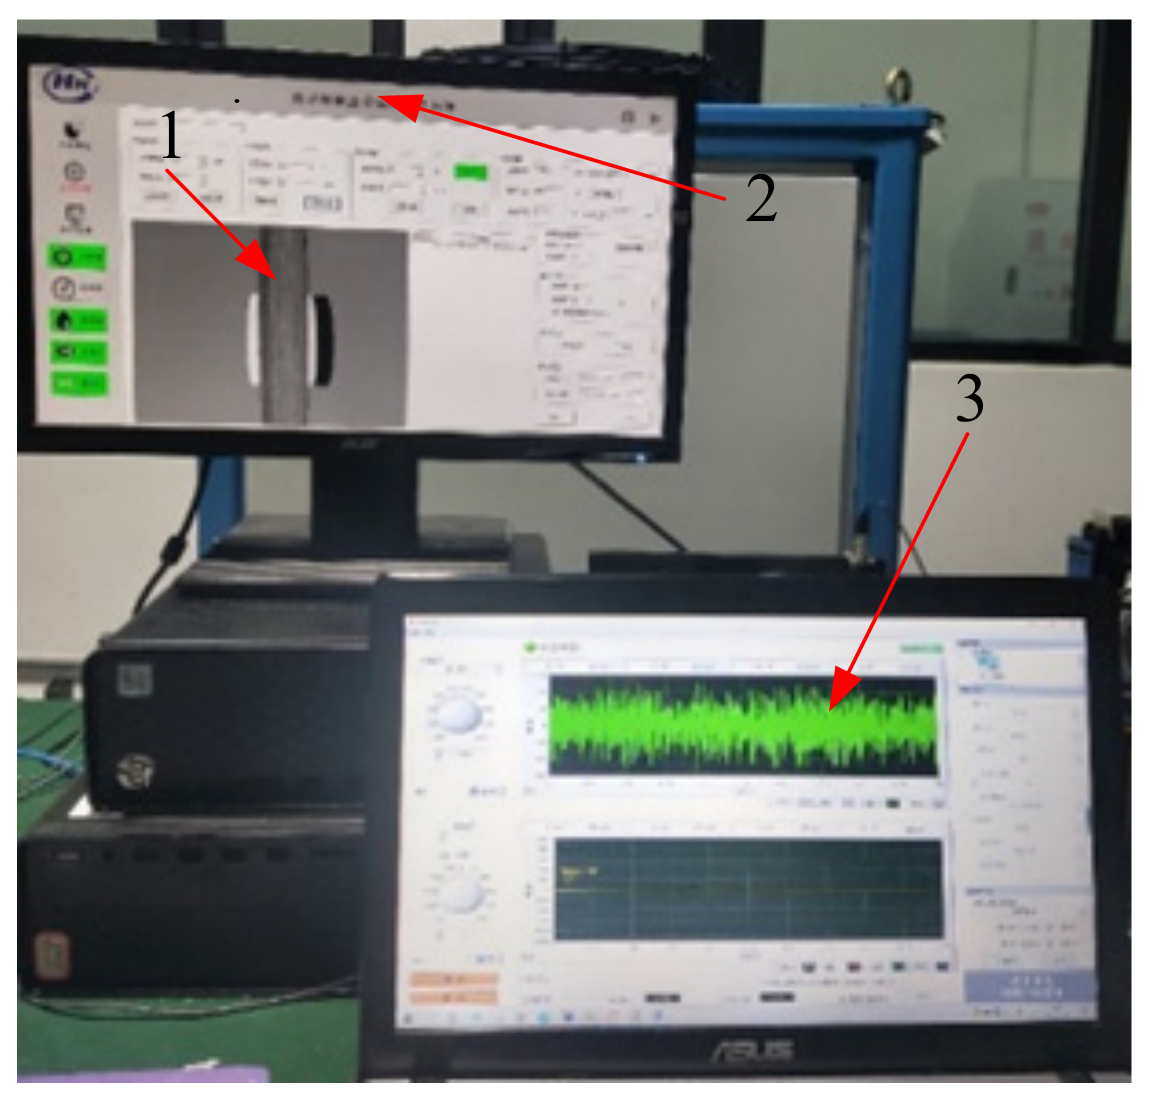
The performance degradation of the specimen is a gradual process, and the period of rolling contact fatigue test is relatively long. In order to avoid too much repetitive information in the data, the vibration signal is collected by interval sampling during the test. The signal acquisition parameter settings are shown in Table 7, and the control interface of the testing machine is shown in Figure 8.
3.3. Contact Fatigue State Identification Method
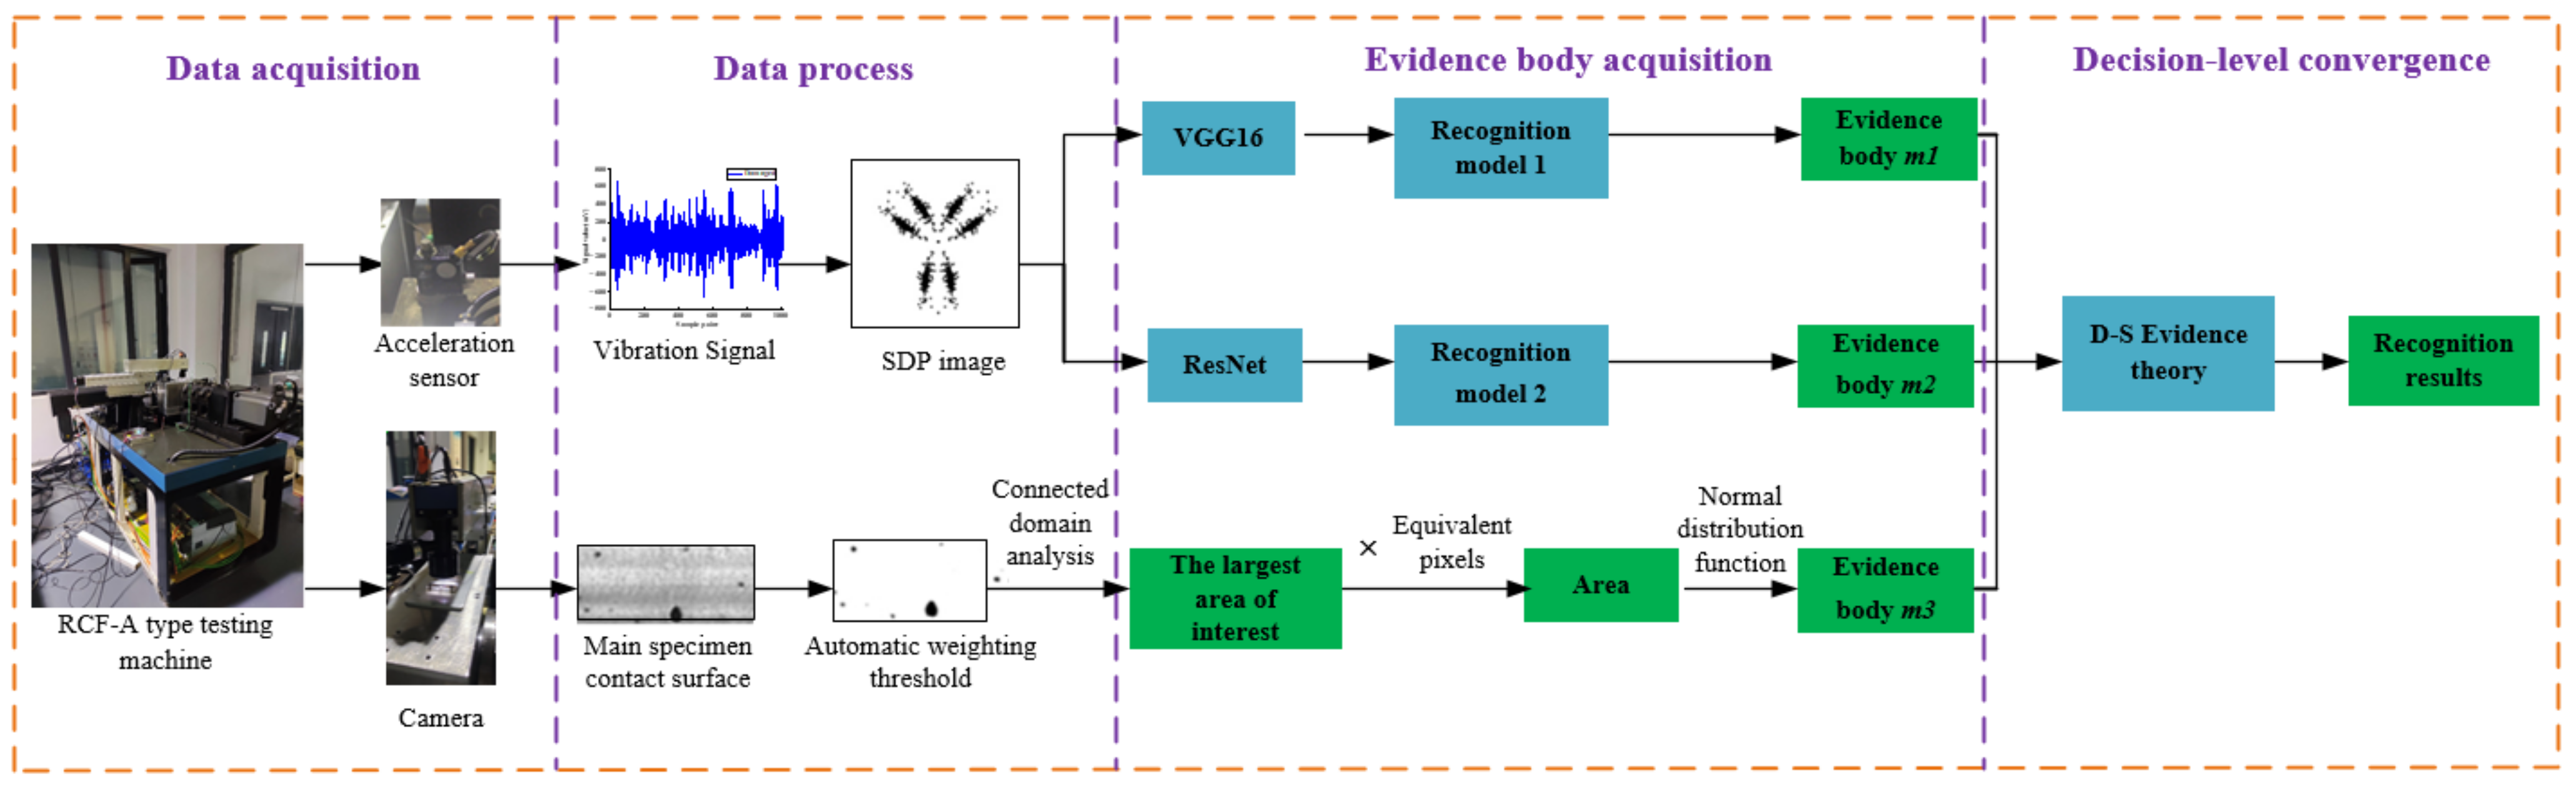
Contact fatigue failure is a gradual process. The multi-source information, such as vibration signal and image signal, reflect the contact fatigue state of the specimen from different aspects. In this paper, vibration monitoring and damage evolution are combined, and different models are used to realize contact fatigue state identification based on vibration signal/damage evolution. On this basis, the decision-level fusion of the state identification results from different information and different models is carried out, and finally the contact fatigue state identification of the specimen with the fusion of vibration and image heterogeneous data is realized.
The contact fatigue state identification process of the specimen is shown in Figure 9.
The steps are as follows:
- (1)
- The vibration signals collected in the test under the same working conditions are randomly divided into training set, test set and verification set according to a certain proportion.
- (2)
- The SDP method is used to convert the vibration signals into images.
- (3)
- For the transformed training set and test set SDP images, we train the VGG16 model and the ResNet model respectively.
- (4)
- For the vibration signal of the verification set, we use the trained VGG16 model and the ResNet model to identify the state, respectively, and obtain two state identification evidence bodies m1 and m2 based on the vibration information source.
- (5)
- For the image signal, we first perform the denoising processing, and then combine the fatigue defect identification method based on automatic weighted threshold and the dynamic compensation method for detection error, based on fatigue defect edge features proposed by the research group [6]. We then calculate the fatigue damage area and obtain evidence body m3 based on image information source.
- (6)
- On this basis, we fuse the evidence bodies m1, m2 and m3, and make a decision to obtain the contact fatigue state identification result of the specimen.
3.4. Contact Fatigue State Identification of Specimen
3.4.1. Vibration Signal Processing
According to “YB/T 5345-2014 Rolling Contact Fatigue Test Method for Metallic Materials”, the criteria for judging rolling contact fatigue failure are as follows [30]: ① The deep peeling area is greater than or equal to 3 mm2; ② When the pitting is peeled off (concentrated area), the damage with a pitting rate of 15% occurs within a 10 mm2 area. In this paper, aiming at the first criteria, the fatigue state of the sample is divided into three states: normal, medium and failure, which are represented by (0, 1, 2), respectively, as shown in Table 8, where 0.01 mm2 is the visual method for the smallest damage area that can be detected [31].
For three different states of the specimen, each state contains 1200 sets of sample data, and each set contains 1024 vibration data points. According to the ratio of 9:2:1, the training set, test set and validation set are randomly divided, and each state contains 900 sets of training samples, 200 sets of test samples and 100 sets of validation samples, as shown in Table 9.
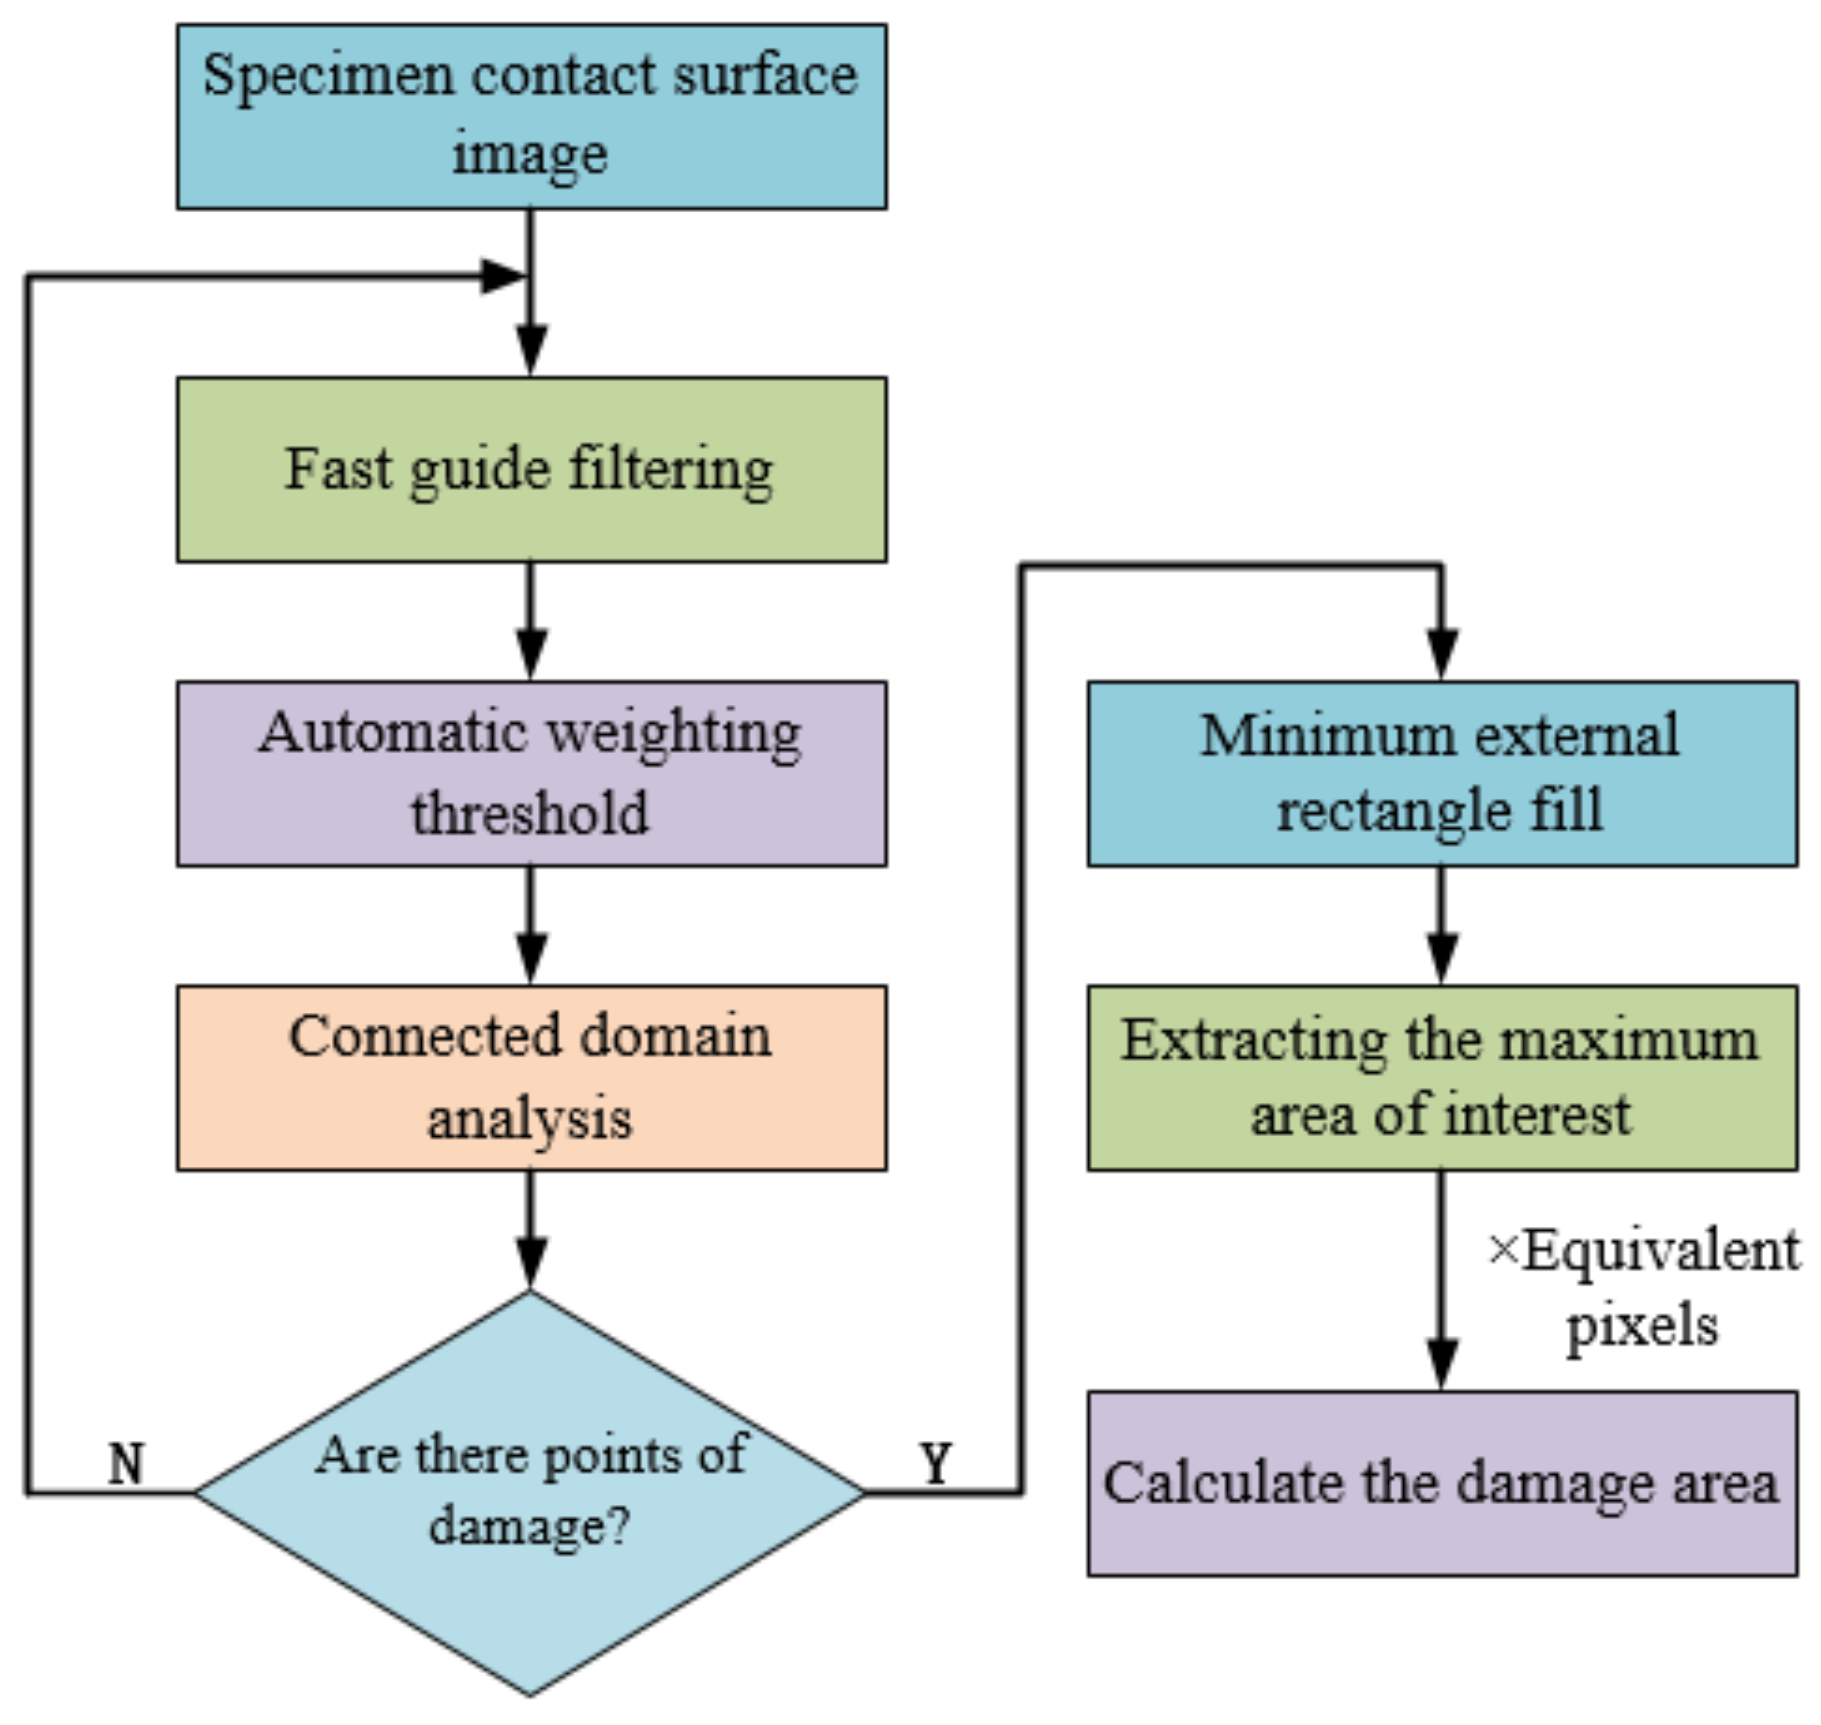
3.4.2. Image Signal Processing
Figure 10 shows the defect area calculation process of specimen based on machine vision [31,32]. Firstly, the image is denoised by fast guided filtering. Secondly, the automatic weighted threshold method is used to perform threshold segmentation on the image. Thirdly, the connected domain analysis is carried out and the segmented maximum interesting area is located. Finally, the maximum interest area is obtained by filling the minimum circumscribed rectangle, and then multiplied by the corresponding equivalent pixel [31] to obtain the corresponding damage area.
Table 10 shows a group of the vibration signal and the corresponding SDP image, image signal and the corresponding maximum damage area under three states of the specimen in normal, medium and failure.
3.4.3. State Identification Results and Analysis
The vibration signals and the contact surface images of the specimen collected by the testing machine are divided into three states of A (normal), B (medium) and C (failure). Thus, the identification framework of D-S evidence theory is set as {A, B, C}. In the following, a group of vibration and image data collected during the same failure period is taken as an example to illustrate the contact fatigue state identification process of the specimen, as shown in Table 11.
① The evidence bodies m1 and m2 obtained by the SDP image of the vibration signal through the VGG16 and ResNet neural network models are respectively as follows:
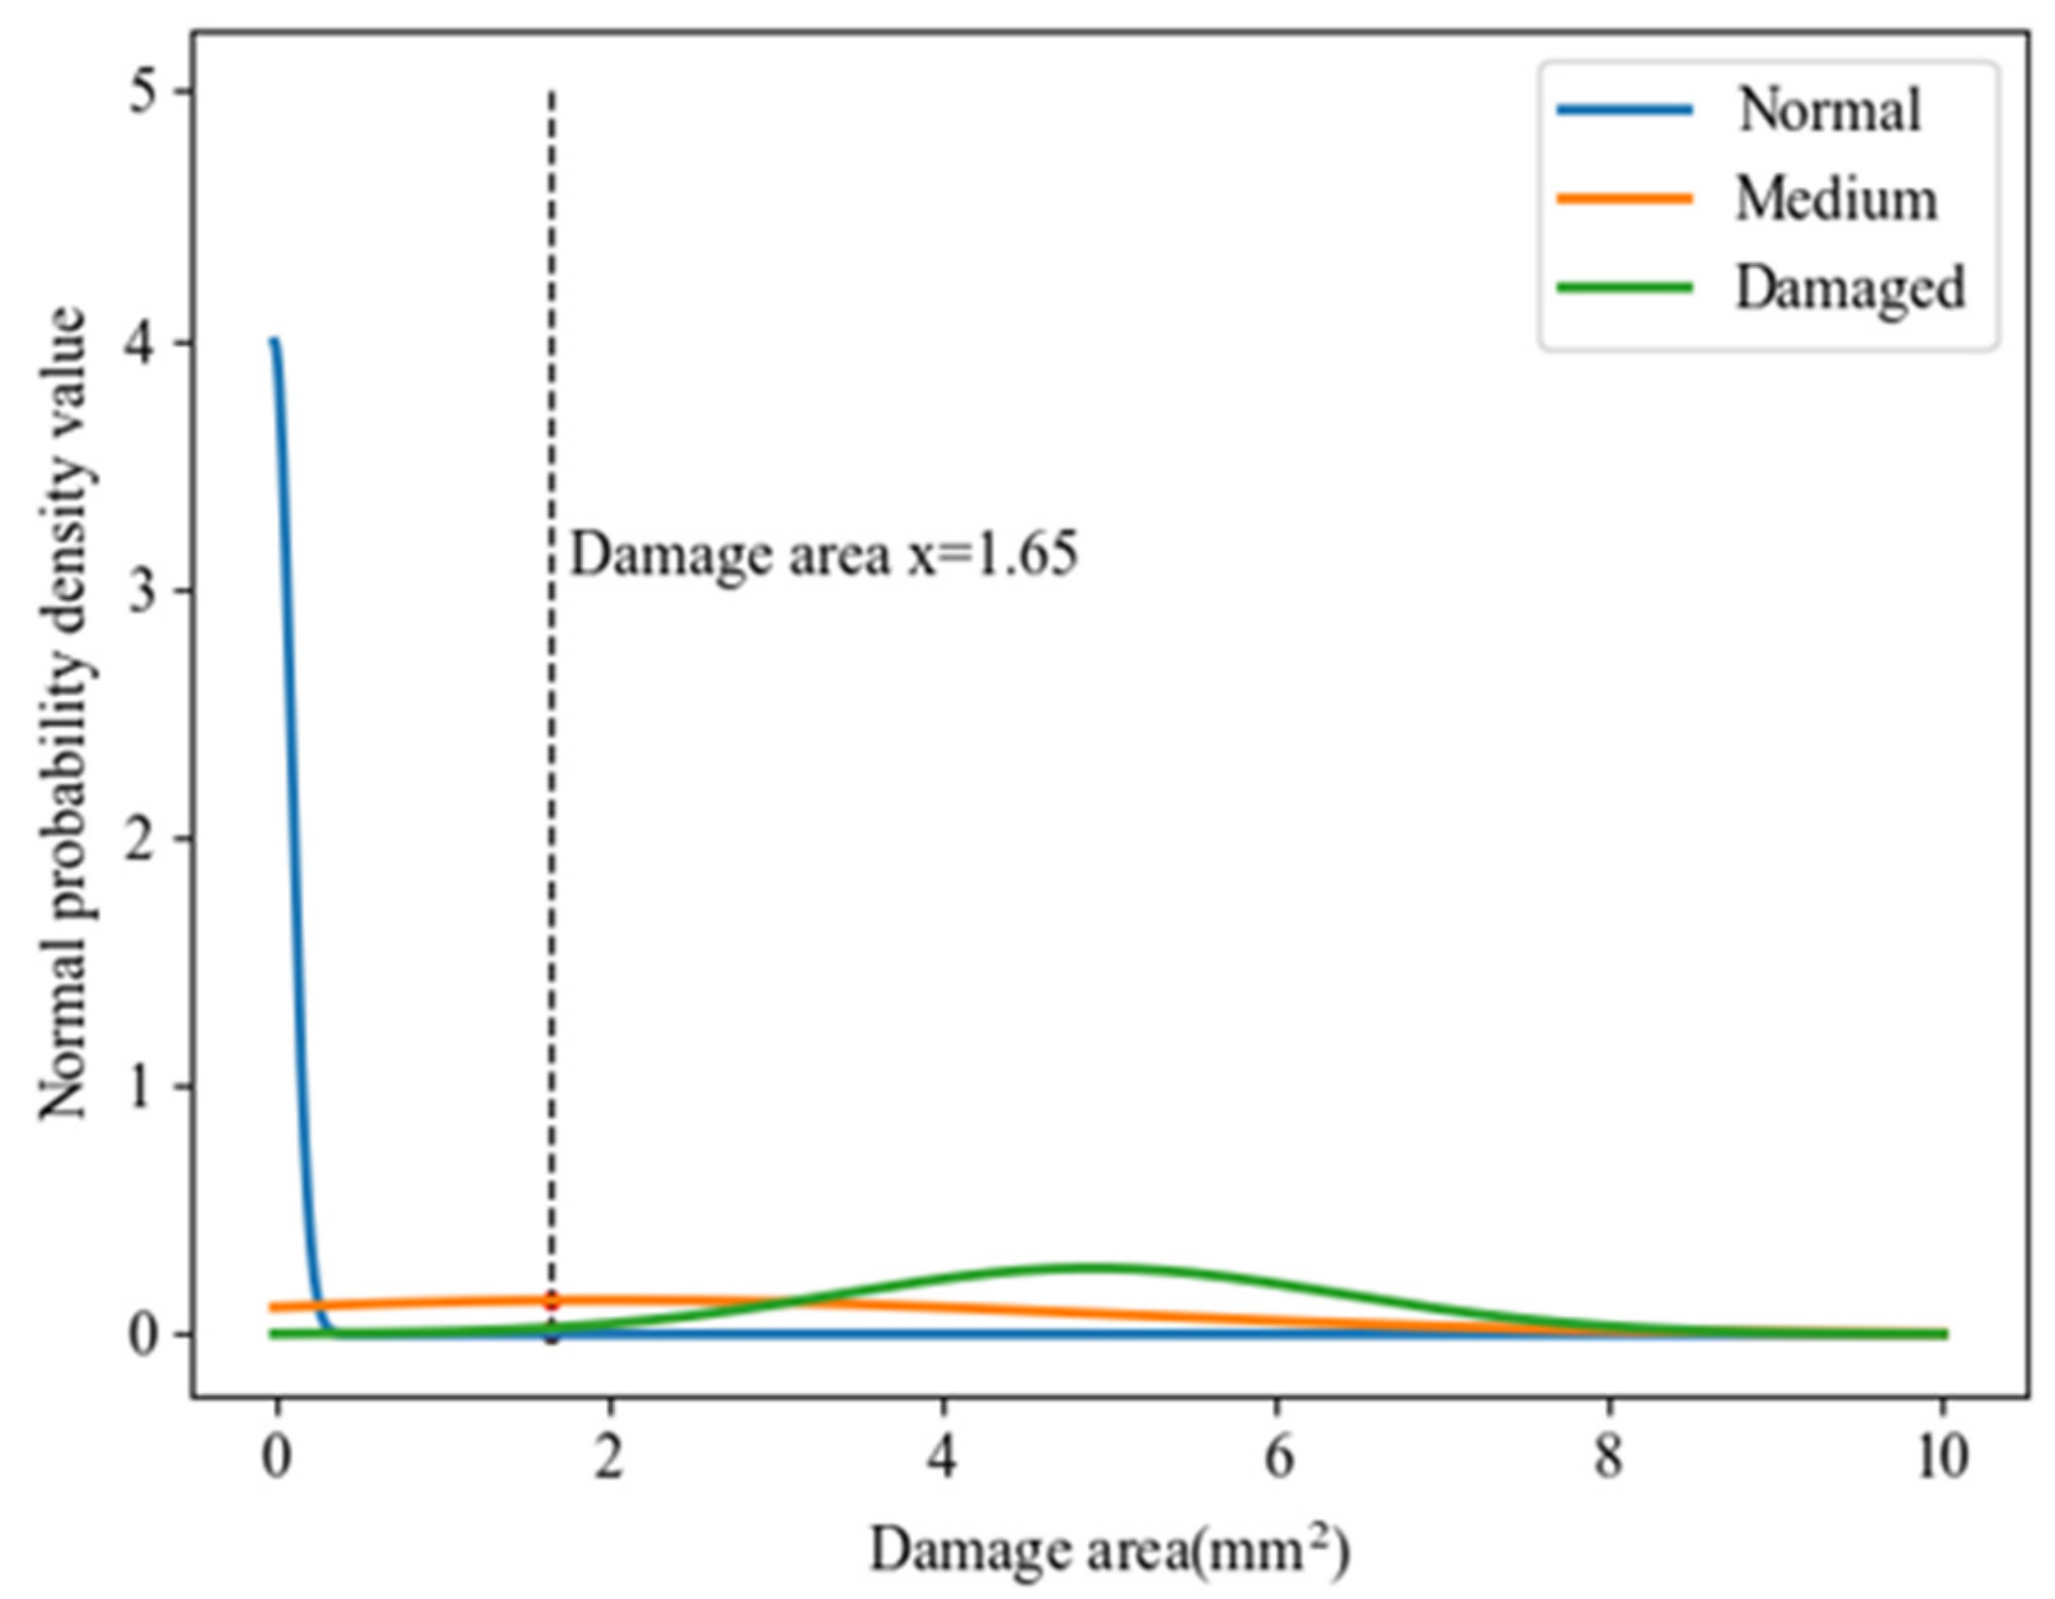
② The maximum damage area of the contact surface image obtained by image processing is misidentified as 1.65 mm2.
The damage area data of the specimen obtained in the previous test are shown in Table 12. It can be seen that the damage area identified by machine vision technology in the normal, medium and failure state fluctuates in [0, 0.1511 mm2], [0.334932 mm2, 2.38746 mm2] and [3.59476 mm2, 8.29375 mm2], respectively. On this basis, the normal distribution functions of the three states A, B and C in the identification framework constructed by comprehensively considering the median damage area and the coverage rate of all damage areas are:
The respective function distributions are shown in Figure 11.
Therefore, the normal probability density values corresponding to the three states when the damage area in the identification frame is 1.65 mm2 are:
The basic probability assignments corresponding to various states in the recognition framework are:
where x is the damage area; is the normal probability density value corresponding to the i-th state in the identification frame; n is the number of states in the identification frame.
Therefore, the evidence bodies m3 is:
③ Using the Dempster combination rule of the D-S evidence theory, the decision-level fusion of the evidence bodies m1, m2 and m3 can be obtained:
Therefore, it is determined that the state identification result of the specimen corresponding to this set of data is “failure”.
According to the above method, the contact fatigue state identification of the specimen is carried out for three states of normal, medium and failure with 100 validation set data respectively. The results are shown in Table 13.
From an individual case analysis, it can be seen that: ① When the real state of the specimen is “0”, although the samples numbered 98, 99 and 100 are wrong to identify the state of the specimen based on the image signal, the state can be correctly identified by the vibration and image information fusion method in this paper. ② When the real state of the sample is “1”, although the state identification of the specimen based on the vibration signal of the sample numbered 3 is wrong, and based on the vibration signal VGG16 model of the sample numbered 98 is also wrong, the state can still be correctly identified by the vibration and image information fusion method in this paper. ③ When the real state of the sample is “2”, although the state identification of the specimen based on the vibration signal ResNet model of the sample numbered 99 is wrong, the state can also be correctly identified by the vibration and image information fusion method in this paper. It is clear that the fusion of vibration and image data can achieve information complementation and can more accurately identify the contact fatigue state of the specimen.
From the overall analysis, it can be seen that: ① For the state identification of the specimen based on vibration signal, the accuracy of VGG16 model is 95.33%, while the accuracy of ResNet model is 91.00%; ② The state identification of the specimen based on the image signal has an accuracy rate of 93.33%; ③ Based on the multi-source information fusion method proposed in this paper, the accuracy of state identification reaches 98.67%, which is 3.34%, 7.67% and 5.34% higher than that of VGG16 model, ResNet model and image signal identification, respectively.
Therefore, in terms of the contact fatigue state identification of the specimen, whether from an individual case or an overall analysis, the method in this paper can more accurately identify the state of the specimen than the method based on a single vibration or image information source.
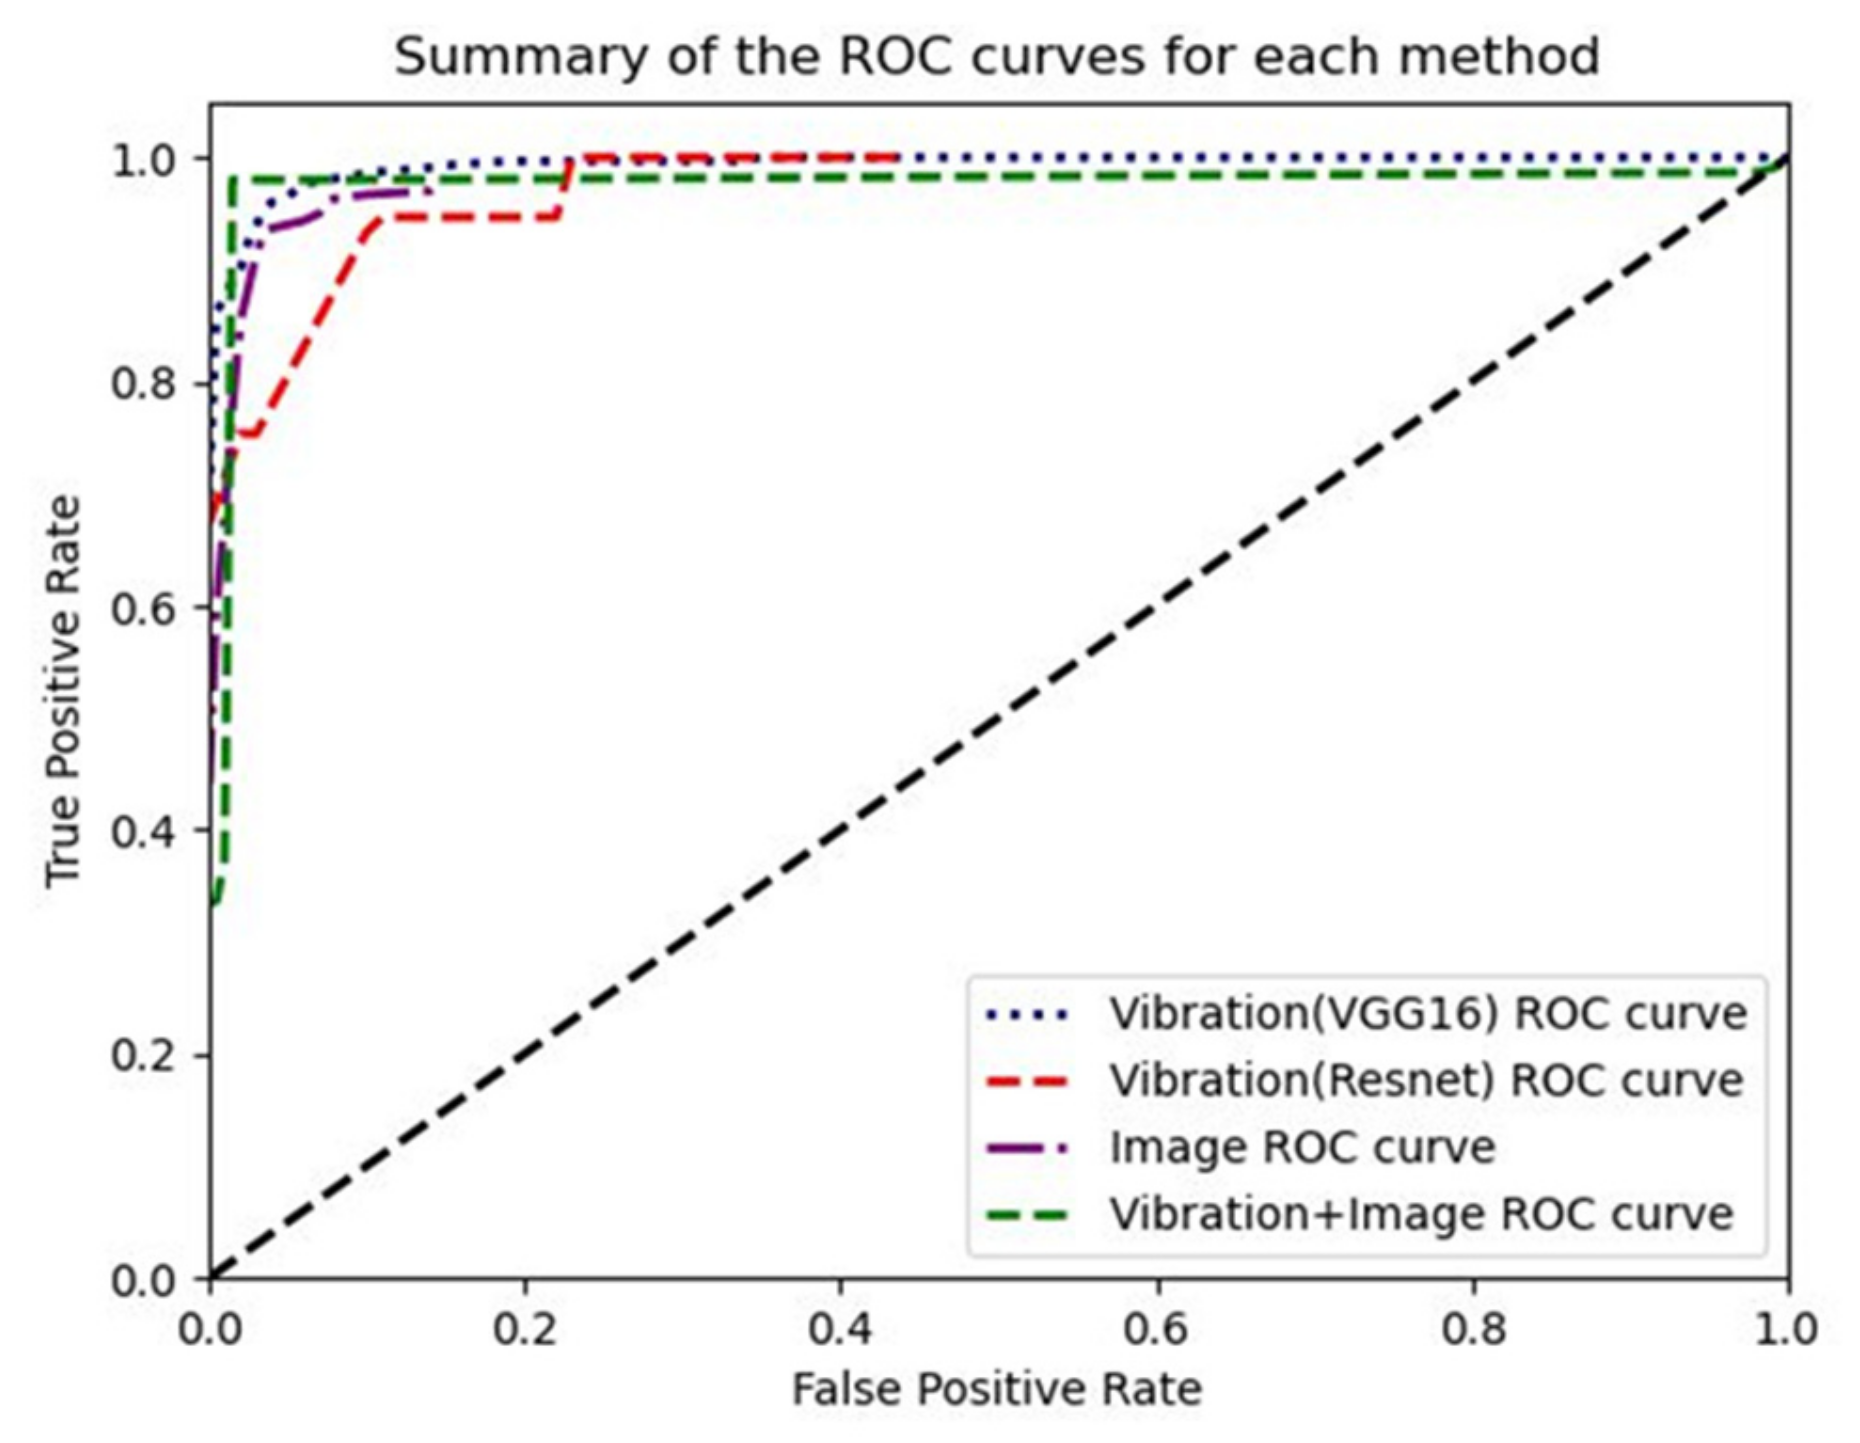
The validity of the method proposed in this paper is further verified by the ROC curve (Receiver Operating Characteristic Curve). The ROC curve takes each detection result as a possible recognition threshold, calculates the corresponding True Positive Rate (TPR) and False Positive Rate (FPR) as follows, and the curve drawn with FPR as the abscissa and TPR as the ordinate [33]. The ideal state should be TPR = 1, FPR = 0, that is, the (0,1) point in the figure. Therefore, the ROC curve should be as close as possible to the (0,1) point and deviate from the 45-degree diagonal.
where TP is the number of correct judgments in True, TN is the number of correct judgments in False; FP is the number of incorrect judgments in True, and FN is the number of incorrect judgments in False.
The contact fatigue state identification of the specimen is carried out for three states of normal, medium and failure with 100 validation set data, respectively. The ROC curves are shown in Figure 12. It is clear that the ROC curve of the method proposed in this paper is close to the (0,1) point and deviates from the 45-degree diagonal.
Therefore, it is feasible and effective to use D-S evidence theory to perform decision-level fusion of state identification results from a single information source of vibration and image, which improve the accuracy of contact fatigue state identification of the specimen.
4. Conclusions
Most of the state recognition of contact fatigue is based on a single information source of vibration signal or image signal. However, it is well known that vibration detection has shortcomings such as poor robustness and difficulty in identifying critical features, while visual detection has shortcomings such as unstable image quality and being affected by the test environment. In this paper, a fusion recognition model is proposed, which innovatively combines the essential information of two different structural types of vibration and image signals, and realizes the information complementation between vibration and image signals, so as to improve the accuracy of contact fatigue pattern recognition. Relying on the monitoring data of the self-developed rolling contact fatigue test equipment, and comprehensively using multi-source information fusion, pattern recognition, deep learning as well as other theories and methods, a state recognition network model based on vibration and image spatiotemporal heterogeneous data is constructed. The contact fatigue state identification of the specimen is realized. The results show that fusion of vibration and image data can achieve information complementarity and may identify the contact fatigue state of specimen more accurately. The accuracy of state identification after fusion is 98.67%, which is at least 3% higher than that of a single information source. This research is of great significance for the accurate acquisition of material contact fatigue properties and has certain reference value for the fusion of heterogeneous data from different sources.
Author Contributions
Y.L. conceived this research; X.C. and Y.F. built various neural network model and made various charts; X.C. and Q.G. did experiments and data processing; X.C. wrote the original draft preparation; Y.L. and Y.Y. completed the editing and review of this article; Y.Y. was responsible for overseeing the progress and visualization of the article. All authors have read and agreed to the published version of the manuscript.
Funding
This research was founded by the National Natural Science Foundation of China (No. 52075062), Chongqing Municipal Education Commission Major Project of China (No. KJZD-M202001101), and Supported by Graduate Student Innovation Program of Chongqing University of Technology (Grant No. gzlcx20223183).
Conflicts of Interest
The authors declare no conflict of interest. The funders had no role in the design of the study; in the collection, analyses, or interpretation of data; in the writing of the manuscript, or in the decision to publish the results.
References
- Jia, L.; Yang, Y.; Zhang, H. Rolling contact fatigue test of superhard coated bearings. Bearing 2010, 36–38. [Google Scholar] [CrossRef]
- Yin, Y.; Zhu, Y.; Wang, X.; Jie, T. Analysis and study of fatigue failure process of rolling bearings. Lubr. Seal. 1997, 22–23, 27. Available online: http://www.cnki.com.cn/Article/CJFDTotal-RHMF199705007.htm (accessed on 6 July 2022).
- Schneider, S.; Herrmann, R.; Marx, S. Development of a resonant fatigue testing facility for large-scale beams in bending. Int. J. Fatigue 2018, 113, 171–183. [Google Scholar] [CrossRef]
- Solazzi, L.; Petrogalli, C.; Lancini, M. Vibration based diagnostics on rolling contact fatigue test bench. Procedia Eng. 2011, 10, 3465–3470. [Google Scholar] [CrossRef]
- Bodini, I.; Petrogalli, C.; Mazzù, A.; Faccoli, M.; Lancini, M.; Pasinetti, S.; Sansoni, G.; Docchio, F. On-Line 2D Monitoring of Rolling Contact Fatigue/Wear Phenomena in Dry Tests. J. Phys. Conf. Ser. 2017, 882, 012012. [Google Scholar] [CrossRef]
- Yang, C.; Huang, L.; Feng, K.; Liu, C. Online detection of rolling contact fatigue failure based on machine vision. Instrum. Technol. Sens. 2019, 65–69, 74. Available online: https://scfw.cqut.edu.cn/rwt/22/https/NNYHGLUDN3WXTLUPMW4A/kcms/detail/detail.aspx?dbcode=CJFD&dbname=CJFDLAST2019&filename=YBJS201904016&uniplatform=NZKPT&v=EO2oa8ynbIUT8WJVXhbFsiTLvTPLkh620RlBQaGWdv8Xhh4Nw2er0D4ezHIB38wn (accessed on 6 July 2022).
- Manoj, V.; Shenoy, K.; Gopinath, K. Developmental studies on rolling contact fatigue test rig. Wear 2008, 264, 708–718. [Google Scholar] [CrossRef]
- Shun, L.; Wen, J. A model-based fault detection and diagnostic methodology based on PCA method and wavelet transform. Energe Build. 2014, 68, 63–71. [Google Scholar] [CrossRef]
- Han, Z.; Zhu, X.; Li, W. A false component identification method of EMD based on Kullback-leibler divergence. Proc. Csee 2012, 32, 112–117. Available online: http://en.cnki.com.cn/Article_en/CJFDTOTAL-ZGDC201211017.htm (accessed on 6 July 2022).
- Su, X. Research on Non-Contact Multi-Sensor Acoustic Emission Signal Fusion and Diagnosis Technology for Rolling Bearing Failure. Doctoral Dissertation, Northeast Petroleum University, Daqin, China, 2012. [Google Scholar]
- Duan, L.; Li, T.; Tang, Y.; Yang, J.; Liu, W. Mechanical fault diagnosis method based on multi-source heterogeneous information fusion. Pet. Mach. 2021, 49, 60–67, 80. [Google Scholar] [CrossRef]
- Liu, J.; Huang, Y.; Huang, X.; Xia, X.; Chen, Y.W. Dynamic Facial Features in Positive-Emotional Speech for Identification of Depressive Tendencies. In Innovation in Medicine and Healthcare; Springer: Singapore, 2020; pp. 127–134. [Google Scholar] [CrossRef]
- Ma, W.; Lv, J.; Wu, H.; Huang, T. Application of multi-sensor information fusion in rolling bearing fault diagnosis. Sens. Microsyst. 2013, 32, 132–135. [Google Scholar] [CrossRef]
- Kächele, M.; Glodek, M.; Zharkov, D.; Meudt, S.; Schwenker, F. Fusion of Audio-Visual Features Using Hierarchical Classifier Systems for the Recognition of Affective States and the State of Depression. In Proceedings of the 3rd International Conference on Pattern Recognition Applications and Methods, ICPRAM 2014, Angers, France, 6–8 March 2014; pp. 671–678. [Google Scholar] [CrossRef]
- Yang, C. Research on Depression Recognition Technology Based on Speech and Facial Features. Southwestern University, 2019. Available online: http://cdmd.cnki.com.cn/Article/CDMD-10635-1019913548.htm (accessed on 6 July 2022).
- Xu, X.; Wang, S.; Liu, H. Real-time detection of centrifugal fan stall based on SDP and image matching. J. Power Eng. 2015, 35, 906–911. [Google Scholar] [CrossRef]
- Lu, G.; Chen, G.; Zeng, S.; Li, S.; Yan, P. Mechanical condition anomaly detection algorithm based on vibration image features. Vibration. Test. Diagn. 2022, 42, 148–153+201. Available online: http://qikan.cqvip.com/Qikan/Article/Detail?id=7106598137 (accessed on 6 July 2022).
- Zheng, W.; Lin, R.; Wang, J.; Li, Z. Power quality disturbance classification based on GAF and convolutional neural network. Power Syst. Prot. Control 2021, 49, 97–104. [Google Scholar] [CrossRef]
- Shibata, K.; Takahashi, A.; Shirai, T. Fault diagnosis of rotating machinery through visualization of sound signals. Mech. Syst. Signal Processing 2000, 14, 229–241. [Google Scholar] [CrossRef]
- Case Western Reserve University. Available online: https://engineering.case.edu/bearingdatacenter/download-data-file (accessed on 6 July 2022).
- Available online: https://www.researchgate.net/figure/The-CWRU-bearing-testing-bench_fig4_337917959 (accessed on 6 July 2022).
- Zhang, C.; Wang, W.; Li, H. Tool wear prediction method based on symmetrized dot pattern and multicovariance Gaussian process regression, 2021. Measurement 2022, 189, 110466. [Google Scholar] [CrossRef]
- Li, H.; Wang, W.; Huang, P.; Li, Q. Fault diagnosis of rolling bearing using symmetrized dot pattern and density-based clustering. Measurement 2020, 152, 107293. [Google Scholar] [CrossRef]
- Wang, W.; Jia, W.Y.; Yin, X.T.; Zhang, L.M.; Bai, Y.M. Development and Prospect of artificial neural networks. Smart City 2021, 7, 12–13. Available online: https://d.wanfangdata.com.cn/periodical/zncs202108007 (accessed on 6 July 2022).
- Zhou, N.; Ou, Y. Convolutional neural network development. J. Liaoning Univ. Sci. Technol. 2021, 44, 349–356. Available online: http://www.cnki.com.cn/Article/CJFDTotal-ASGT202105004.htm (accessed on 6 July 2022).
- Zhang, X.; Zou, J.; He, K.; Jian, S. Accelerating very deep convolutional networks for classification and detection. IEEE Trans. Pattern Anal. Mach. Intell. 2016, 38, 1943–1955. [Google Scholar] [CrossRef]
- He, K.; Zhang, X.; Ren, S.; Sun, J. Deep Residual Learning for Image Recognition. In Proceedings of the 2016 IEEE Conference on Computer Vision and Pattern Recognition, Las Vegas, NV, USA, 27–30 June 2016; pp. 770–778. Available online: https://0-ieeexplore-ieee-org.brum.beds.ac.uk/document/7780459 (accessed on 6 July 2022).
- Liu, Z.; Lin, Y.; Cao, Y.; Hu, H.; Wei, Y.; Zhang, Z.; Lin, S.; Guo, B. Swin Transformer: Hierarchical Vision Transformer using Shifted Windows. In Proceedings of the 2021 IEEE/CVF International Conference on Computer Vision (ICCV), Montreal, QC, Canada, 10–17 October 2021; pp. 9992–10002. [Google Scholar] [CrossRef]
- Guan, X.; Yi, X.; Hu, L.; Liu, H. Conflicting Evidence Reasoning and Fusion; Beijing Electronic Industry Press: Beijing, China, 2020. [Google Scholar]
- YB/T 5345.2006; Test Method for Rolling Contact Fatigue of Metallic Materials, 2006. Available online: https://max.book118.com/html/2019/0528/7004116131002030.shtm (accessed on 6 July 2022).
- Feng, K. Research on Visual Detection Method of Rolling Contact Fatigue Surface Features. Chongqing University of Technology, 2019. Available online: https://xueshu.baidu.com/usercenter/paper/show?paperid=10180g20ng140mh0ts1n0js063270105&site=xueshu_se&hitarticle=1 (accessed on 29 May 2020).
- Xu, H.; Feng, K.; Huang, L.; Xiong, L.; Yang, C. Improved Otsu algorithm for rolling contact fatigue defect detection. J. Comput. Aided Des. Graph. 2019, 31, 1130–1138. [Google Scholar] [CrossRef]
- Song, H. Research and Application of ROC Curve Evaluation. Second Military Medical University, 2006. Available online: https://d.wanfangdata.com.cn/thesis/ChJUaGVzaXNOZXdTMjAyMjA1MjYSB1k4OTczMjgaCGpvcXA5ZDds (accessed on 6 July 2022).
Figure 1.
CWRU rolling bearing test bench [21]. 1. Fan end bearings; 2. Motor; 3. Drive end bearing; 4. Torque sensors and encoders; 5. Dynamometers.
Figure 1.
CWRU rolling bearing test bench [21]. 1. Fan end bearings; 2. Motor; 3. Drive end bearing; 4. Torque sensors and encoders; 5. Dynamometers.

Figure 2.
Accuracy change curve of model training set.

Figure 3.
Loss degree change curve of model training set.

Figure 4.
Accuracy change curve of each model training set.

Figure 5.
Loss degree change curve of each model training set.

Figure 6.
The structure of the self-developed RCF-A test machine. (a) 3D model, (b) Prototype.

Figure 7.
Schematic diagram of the shaft box of the RCF-A test machine. 1. Accompanying axle box; 2. Spindle box.
Figure 7.
Schematic diagram of the shaft box of the RCF-A test machine. 1. Accompanying axle box; 2. Spindle box.

Figure 8.
The control interface of the RCF-A test machine. 1. Visual display module; 2. Fatigue test control module; 3. Vibration signal acquisition module.
Figure 8.
The control interface of the RCF-A test machine. 1. Visual display module; 2. Fatigue test control module; 3. Vibration signal acquisition module.

Figure 9.
The process of contact fatigue state identification of the specimen.

Figure 10.
Calculation process of specimen damage area.

Figure 11.
Distribution diagram of normal function of three states.

Figure 12.
State identification ROC curves for validation set data.


Table 1.
Selected types of rolling bearing damages.
| Damage Diameter (mm) | Motor Load (w) | Motor Speed (r/min) | Bearing Number | Status Number |
|---|---|---|---|---|
| 0 | 3 | 1730 | Ball_0 | 0 |
| 0.3556 | 3 | 1730 | Ball_1 | 1 |
| 0.5334 | 3 | 1730 | Ball_2 | 2 |
Table 2.
Transformation images of bearing vibration signals by SDP, GAF and GRI method.
| Bearing Number | Vibration Acquisition Signal | Transformation Method | ||
|---|---|---|---|---|
| SDP | GAF | GRI | ||
| Ball_0 |  |  |  |  |
 |  |  |  | |
 | | | | |
 |  |  |  | |
| Ball_1 |  |  |  |  |
 |  |  |  | |
| | | | | |
 |  |  |  | |
| Ball_2 |  |  |  |  |
 |  |  |  | |
| | | | | |
 |  |  |  | |
Note: In the acquisition of vibration signals, the horizontal axis represents the sampling point and the vertical axis represents the signal value corresponding to the sampling point.
Table 3.
Training parameters of VGG16 model.
| Image Type and Size | Sample Type | Data Set Size | Epoch | Batch_Size | Learning Rate |
|---|---|---|---|---|---|
| SDP 224 × 224 | Training samples | 1200 | 150 | 32 | 0.001 |
| Test samples | 300 | ||||
| GAF 64 × 64 | Training samples | 1200 | 150 | 32 | 0.001 |
| Test samples | 300 | ||||
| GRI 32 × 32 | Training samples | 1200 | 150 | 32 | 0.001 |
| Test samples | 300 |
Table 4.
The state recognition results of bearing test set for different image transformation methods.
Table 4.
The state recognition results of bearing test set for different image transformation methods.
| Test Sample Number | Transformation Method | Type of Damage | ||
|---|---|---|---|---|
| SDP | GAF | GRI | ||
| 1 | 0 | 0 | 0 | 0 |
| 2 | 0 | 0 | 0 | |
| 3 | 0 | 0 | 0 | |
 | | | | |
| 98 | 0 | 0 | 0 | |
| 99 | 0 | 0 | 0 | |
| 100 | 0 | 0 | 0 | |
| 1 | 1 | 1 | 1 | 1 |
| 2 | 1 | 1 | 1 | |
| 3 | 1 | 1 | 1 | |
| | | | | |
| 98 | 1 | 1 | 1 | |
| 99 | 1 | 1 | 1 | |
| 100 | 1 | 2(×) | 1 | |
| 1 | 2 | 2 | 2 | 2 |
| 2 | 2 | 2 | 2 | |
| 3 | 2 | 2 | 2 | |
| | | | | |
| 98 | 2 | 2 | 2 | |
| 99 | 2 | 2 | 2 | |
| 100 | 2 | 1(×) | 2 | |
| Number of identification errors | 0 | 2 | 0 | / |
| Accuracy | 100% | 99.33% | 100% | / |
Note: “×” represent the recognition state does not match with the actual state.
Table 5.
Training parameters of model.
| Model | Sample Type | Data Set Size | Epoch | Batch Size | Learning Rate |
|---|---|---|---|---|---|
| VGG16 | Training samples | 1200 | 150 | 32 | 0.001 |
| Test samples | 300 | ||||
| ResNet | Training samples | 1200 | 150 | 32 | 0.001 |
| Test samples | 300 | ||||
| S-T | Training samples | 1200 | 150 | 32 | 0.0003 |
| Test samples | 300 |
Table 6.
The state recognition results of bearing test set for different neural networks.
| Test Sample Number | Recognition Model | Type of Damage | ||
|---|---|---|---|---|
| VGG16 | ResNet | S-T | ||
| 1 | 0 | 0 | 0 | 0 |
| 2 | 0 | 0 | 0 | |
| 3 | 0 | 0 | 0 | |
| | | | | |
| 98 | 0 | 0 | 0 | |
| 99 | 0 | 0 | 0 | |
| 100 | 0 | 0 | 0 | |
| 1 | 1 | 1 | 1 | 1 |
| 2 | 1 | 1 | 1 | |
| 3 | 1 | 1 | 1 | |
| | | | | |
| 98 | 1 | 1 | 1 | |
| 99 | 1 | 1 | 1 | |
| 100 | 1 | 1 | 1 | |
| 1 | 2 | 2 | 2 | 2 |
| 2 | 2 | 2 | 2 | |
| 3 | 2 | 2 | 2 | |
| | | | | |
| 98 | 2 | 2 | 2 | |
| 99 | 2 | 2 | 2 | |
| 100 | 2 | 2 | 2 | |
| Number of identification errors | 0 | 0 | 0 | / |
| Accuracy | 100% | 100% | 100% | / |
Table 7.
Signal acquisition parameter settings.
| Signal | Sample Frequency/Hz | Sample Interval/min | Time per Sampling/s |
|---|---|---|---|
| Vibration | 10k | 2 | 1 |
| Image | 1 | 10 | 1 |
Table 8.
The contact fatigue state of the specimen.
| Status Number | Specimen Status | Damage Area S/mm2 |
|---|---|---|
| 0 | Normal | S ≤ 0.01 |
| 1 | Medium | 0.01 < S < 3 |
| 2 | Failure | S ≥ 3 |
Table 9.
SDP image dataset.
| Sample Type | Number of SDP Images | ||
|---|---|---|---|
| Normal | Medium | Failure | |
| Training Samples | 900 | 900 | 900 |
| Test samples | 200 | 200 | 200 |
| Validation samples | 100 | 100 | 100 |
Table 10.
A group of vibration and image signals of the specimen in three states.
| Specimen Status | Vibration Signal | Image Signal | ||
|---|---|---|---|---|
| Original Vibration Signal | SDP Image | Visual Recognition of Maximum Damage Region | Quantification of Area Values/mm2 | |
| Normal |  |  |  | 0.0273 |
| Medium |  |  |  | 0.7754 |
| Damaged |  |  |  | 4.6991 |
Note: In the acquisition of vibration signals, the horizontal axis represents the sampling point and the vertical axis represents the signal value corresponding to the sampling point.
Table 11.
Contact fatigue damage of a specimen and the recognition results.
| Signal types | Vibration Signal | Image Signal | ||
|---|---|---|---|---|
| Original Vibration Signal | SDP Image | Visual Recognition of Maximum Damage Region | Quantification of Area Values/mm2 | |
 |  |  | 1.649 | |
| Recognition status | Damaged | Damaged | Damaged | Medium |
Table 12.
Damage area statistics table.
| Specimen Status | Image Number | Damage Area/mm2 | Median |
|---|---|---|---|
| Normal | 1 | 0 (min) | 0 |
| 2 | 0 | ||
| 3 | 0.1511 (max) | ||
| | | ||
| 148 | 0.0894 | ||
| 149 | 0.0560 | ||
| 150 | 0.0273 | ||
| Medium | 1 | 1.58652 | 1.21317 |
| 2 | 0.361148 (min) | ||
| 3 | 2.1244 | ||
| | | ||
| 148 | 2.38746 (max) | ||
| 149 | 0.334932 | ||
| 150 | 1.57748 | ||
| Failure | 1 | 8.29375 (max) | 4.10303 |
| 2 | 3.59476 (min) | ||
| 3 | 3.96178 | ||
| | | ||
| 6 | 4.327 | ||
| 7 | 3.71363 | ||
| 8 | 4.24428 |
Table 13.
State identification results for validation set data.
| Sample Number | Based on Vibration Signal | Based on Image Signal | Vibration + IMAGE | Real State | |
|---|---|---|---|---|---|
| VGG16 | ResNet | ||||
| 1 | 0 | 0 | 0 | 0 | 0 |
| 2 | 0 | 0 | 0 | 0 | |
| 3 | 0 | 0 | 0 | 0 | |
| | | | | | |
| 98 | 0 | 0 | 1(×) | 0 | |
| 99 | 0 | 0 | 1(×) | 0 | |
| 100 | 0 | 0 | 1(×) | 0 | |
| 1 | 1 | 1 | 1 | 1 | 1 |
| 2 | 0(×) | 0(×) | 1 | 0(×) | |
| 3 | 0(×) | 0(×) | 1 | 1 | |
| | | | | | |
| 98 | 0(×) | 1 | 1 | 1 | |
| 99 | 0(×) | 0(×) | 1 | 0(×) | |
| 100 | 2(×) | 2(×) | 1 | 2(×) | |
| 1 | 2 | 2 | 2 | 2 | 2 |
| 2 | 2 | 2 | 2 | 2 | |
| 3 | 2 | 2 | 2 | 2 | |
| | | | | | |
| 98 | 2 | 2 | 2 | 2 | |
| 99 | 2 | 1(×) | 2 | 2 | |
| 100 | 1(×) | 1(×) | 2 | 1(×) | |
| Number of identification errors | 14 | 27 | 20 | 4 | / |
| Accuracy | 95.33% | 91.00% | 93.33% | 98.67% | / |
Note: “×” represent the recognition state does not match with the actual state.
Publisher’s Note: MDPI stays neutral with regard to jurisdictional claims in published maps and institutional affiliations. |
© 2022 by the authors. Licensee MDPI, Basel, Switzerland. This article is an open access article distributed under the terms and conditions of the Creative Commons Attribution (CC BY) license (https://creativecommons.org/licenses/by/4.0/).
Share and Cite
MDPI and ACS Style
Chen, X.; Liu, Y.; Fu, Y.; Gu, Q.; Yang, Y. Contact Fatigue State Identification of Specimen Based on Heterogeneous Data and Evidence Theory. Appl. Sci. 2022, 12, 8509. https://0-doi-org.brum.beds.ac.uk/10.3390/app12178509
AMA Style
Chen X, Liu Y, Fu Y, Gu Q, Yang Y. Contact Fatigue State Identification of Specimen Based on Heterogeneous Data and Evidence Theory. Applied Sciences. 2022; 12(17):8509. https://0-doi-org.brum.beds.ac.uk/10.3390/app12178509
Chicago/Turabian StyleChen, Xiang, Yu Liu, Yuan Fu, Qiancheng Gu, and Yan Yang. 2022. "Contact Fatigue State Identification of Specimen Based on Heterogeneous Data and Evidence Theory" Applied Sciences 12, no. 17: 8509. https://0-doi-org.brum.beds.ac.uk/10.3390/app12178509
Note that from the first issue of 2016, this journal uses article numbers instead of page numbers. See further details here.